Nelson, IL Map & Demographics
Nelson Map
Nelson Overview
$27,261
PER CAPITA INCOME
$43,750
AVG FAMILY INCOME
$38,750
AVG HOUSEHOLD INCOME
0.41
INEQUALITY / GINI INDEX
136
TOTAL POPULATION
44
MALE POPULATION
92
FEMALE POPULATION
47.83
MALES / 100 FEMALES
209.09
FEMALES / 100 MALES
41.5
MEDIAN AGE
2.6
AVG FAMILY SIZE
2.3
AVG HOUSEHOLD SIZE
58
LABOR FORCE [ PEOPLE ]
46.0%
PERCENT IN LABOR FORCE
3.4%
UNEMPLOYMENT RATE
Income in Nelson
Income Overview in Nelson
Per Capita Income in Nelson is $27,261, while median incomes of families and households are $43,750 and $38,750 respectively.
| Characteristic | Number | Measure |
| Per Capita Income | 136 | $27,261 |
| Median Family Income | 35 | $43,750 |
| Mean Family Income | 35 | $65,089 |
| Median Household Income | 60 | $38,750 |
| Mean Household Income | 60 | $58,005 |
| Income Deficit | 35 | $0 |
| Wage / Income Gap (%) | 136 | 0.00% |
| Wage / Income Gap ($) | 136 | 100.00¢ per $1 |
| Gini / Inequality Index | 136 | 0.41 |
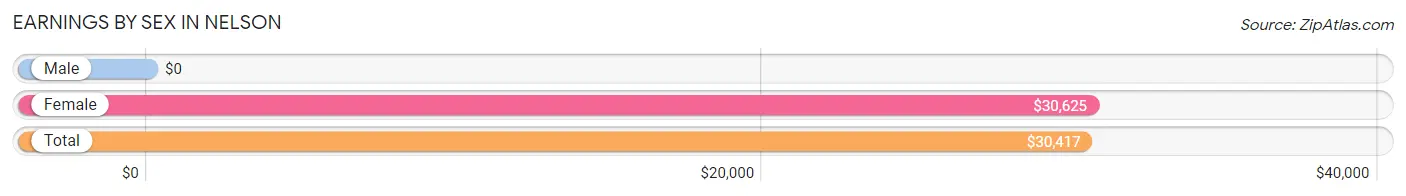
Earnings by Sex in Nelson
| Sex | Number | Average Earnings |
| Male | 27 (38.6%) | $0 |
| Female | 43 (61.4%) | $30,625 |
| Total | 70 (100.0%) | $30,417 |
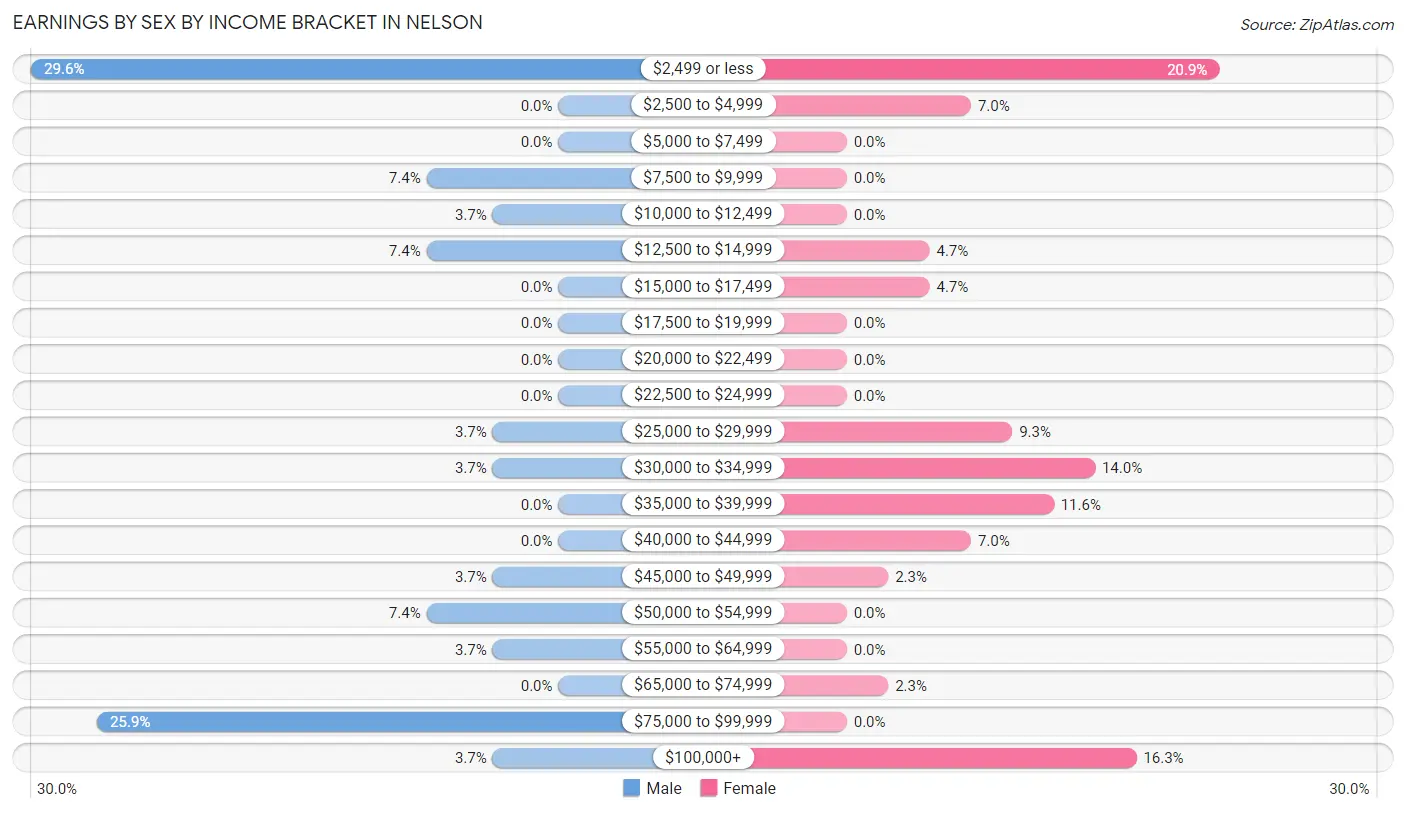
Earnings by Sex by Income Bracket in Nelson
The most common earnings brackets in Nelson are $2,499 or less for men (8 | 29.6%) and $2,499 or less for women (9 | 20.9%).
| Income | Male | Female |
| $2,499 or less | 8 (29.6%) | 9 (20.9%) |
| $2,500 to $4,999 | 0 (0.0%) | 3 (7.0%) |
| $5,000 to $7,499 | 0 (0.0%) | 0 (0.0%) |
| $7,500 to $9,999 | 2 (7.4%) | 0 (0.0%) |
| $10,000 to $12,499 | 1 (3.7%) | 0 (0.0%) |
| $12,500 to $14,999 | 2 (7.4%) | 2 (4.6%) |
| $15,000 to $17,499 | 0 (0.0%) | 2 (4.6%) |
| $17,500 to $19,999 | 0 (0.0%) | 0 (0.0%) |
| $20,000 to $22,499 | 0 (0.0%) | 0 (0.0%) |
| $22,500 to $24,999 | 0 (0.0%) | 0 (0.0%) |
| $25,000 to $29,999 | 1 (3.7%) | 4 (9.3%) |
| $30,000 to $34,999 | 1 (3.7%) | 6 (14.0%) |
| $35,000 to $39,999 | 0 (0.0%) | 5 (11.6%) |
| $40,000 to $44,999 | 0 (0.0%) | 3 (7.0%) |
| $45,000 to $49,999 | 1 (3.7%) | 1 (2.3%) |
| $50,000 to $54,999 | 2 (7.4%) | 0 (0.0%) |
| $55,000 to $64,999 | 1 (3.7%) | 0 (0.0%) |
| $65,000 to $74,999 | 0 (0.0%) | 1 (2.3%) |
| $75,000 to $99,999 | 7 (25.9%) | 0 (0.0%) |
| $100,000+ | 1 (3.7%) | 7 (16.3%) |
| Total | 27 (100.0%) | 43 (100.0%) |
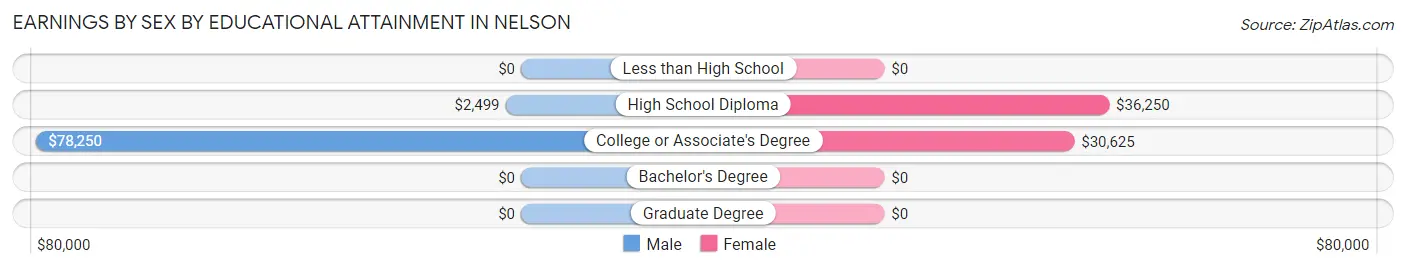
Earnings by Sex by Educational Attainment in Nelson
Average earnings in Nelson are $48,750 for men and $35,250 for women, a difference of 27.7%. Men with an educational attainment of college or associate's degree enjoy the highest average annual earnings of $78,250, while those with high school diploma education earn the least with $2,499. Women with an educational attainment of high school diploma earn the most with the average annual earnings of $36,250, while those with college or associate's degree education have the smallest earnings of $30,625.
| Educational Attainment | Male Income | Female Income |
| Less than High School | - | - |
| High School Diploma | $2,499 | $36,250 |
| College or Associate's Degree | $78,250 | $30,625 |
| Bachelor's Degree | - | - |
| Graduate Degree | - | - |
| Total | $48,750 | $35,250 |
Family Income in Nelson
Family Income Brackets in Nelson
According to the Nelson family income data, there are 11 families falling into the $35,000 to $49,999 income range, which is the most common income bracket and makes up 31.4% of all families.
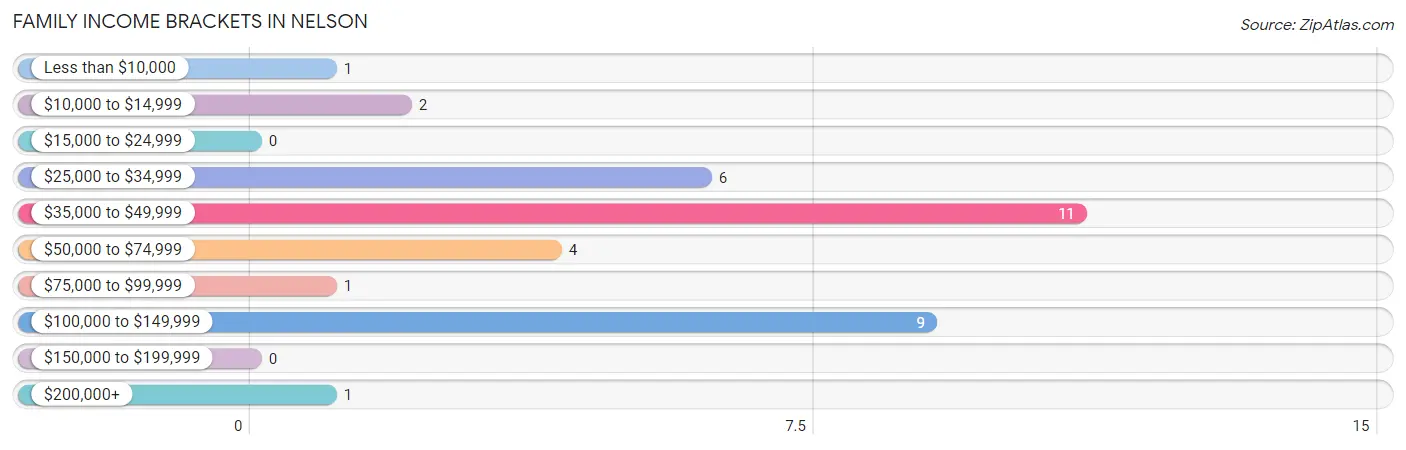
| Income Bracket | # Families | % Families |
| Less than $10,000 | 1 | 2.9% |
| $10,000 to $14,999 | 2 | 5.7% |
| $15,000 to $24,999 | 0 | 0.0% |
| $25,000 to $34,999 | 6 | 17.1% |
| $35,000 to $49,999 | 11 | 31.4% |
| $50,000 to $74,999 | 4 | 11.4% |
| $75,000 to $99,999 | 1 | 2.9% |
| $100,000 to $149,999 | 9 | 25.7% |
| $150,000 to $199,999 | 0 | 0.0% |
| $200,000+ | 1 | 2.9% |
Family Income by Famaliy Size in Nelson
2-person families (25 | 71.4%) account for the highest median family income in Nelson with $48,125 per family, while 2-person families (25 | 71.4%) have the highest median income of $24,062 per family member.
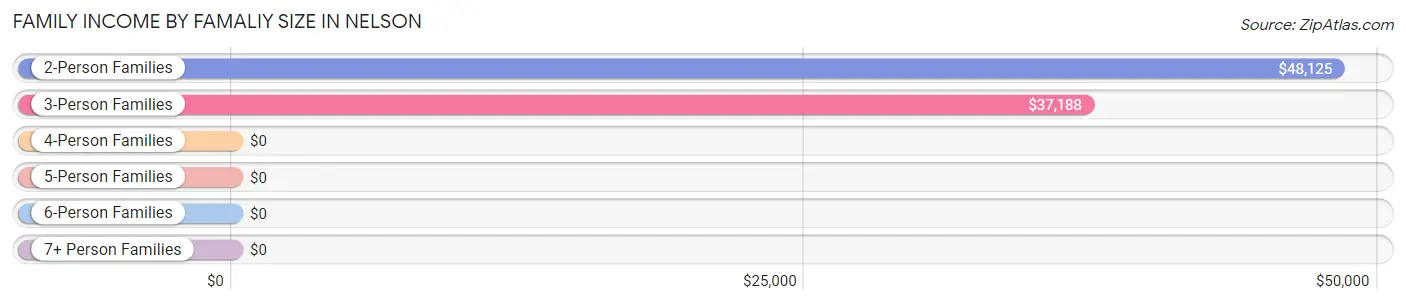
| Income Bracket | # Families | Median Income |
| 2-Person Families | 25 (71.4%) | $48,125 |
| 3-Person Families | 7 (20.0%) | $37,188 |
| 4-Person Families | 3 (8.6%) | $0 |
| 5-Person Families | 0 (0.0%) | $0 |
| 6-Person Families | 0 (0.0%) | $0 |
| 7+ Person Families | 0 (0.0%) | $0 |
| Total | 35 (100.0%) | $43,750 |
Family Income by Number of Earners in Nelson
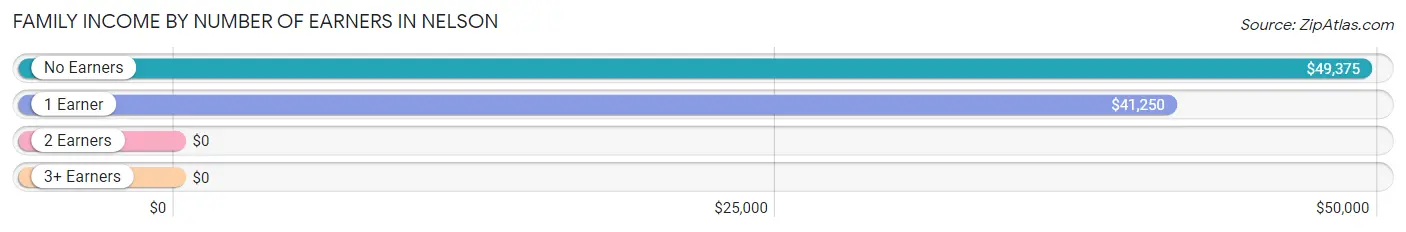
| Number of Earners | # Families | Median Income |
| No Earners | 5 (14.3%) | $49,375 |
| 1 Earner | 16 (45.7%) | $41,250 |
| 2 Earners | 11 (31.4%) | $0 |
| 3+ Earners | 3 (8.6%) | $0 |
| Total | 35 (100.0%) | $43,750 |
Household Income in Nelson
Household Income Brackets in Nelson
With 14 households falling in the category, the $100,000 to $149,999 income range is the most frequent in Nelson, accounting for 23.3% of all households.
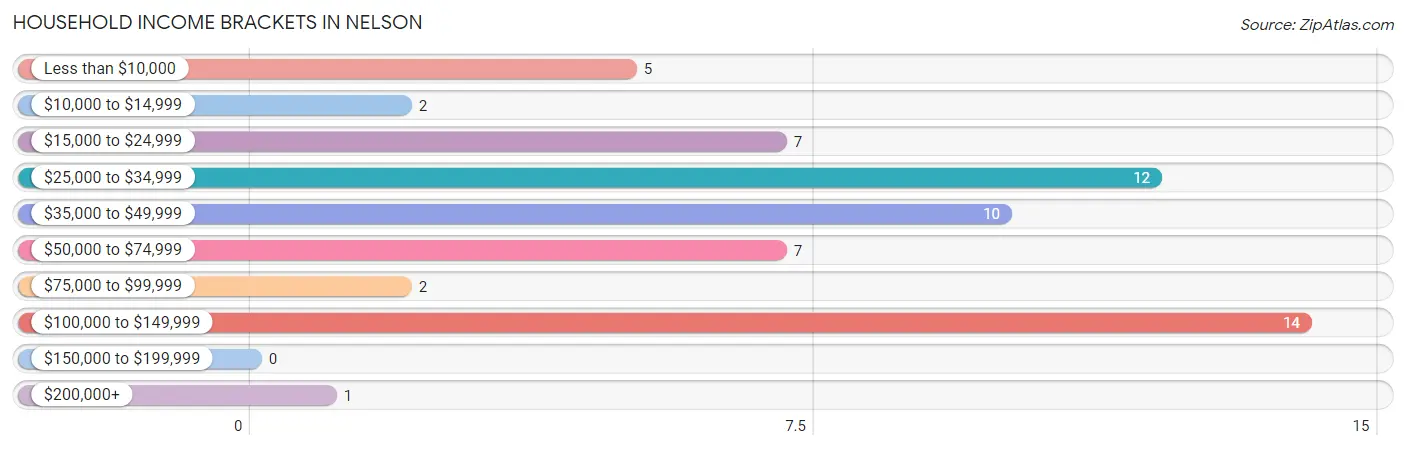
| Income Bracket | # Households | % Households |
| Less than $10,000 | 5 | 8.3% |
| $10,000 to $14,999 | 2 | 3.3% |
| $15,000 to $24,999 | 7 | 11.7% |
| $25,000 to $34,999 | 12 | 20.0% |
| $35,000 to $49,999 | 10 | 16.7% |
| $50,000 to $74,999 | 7 | 11.7% |
| $75,000 to $99,999 | 2 | 3.3% |
| $100,000 to $149,999 | 14 | 23.3% |
| $150,000 to $199,999 | 0 | 0.0% |
| $200,000+ | 1 | 1.7% |
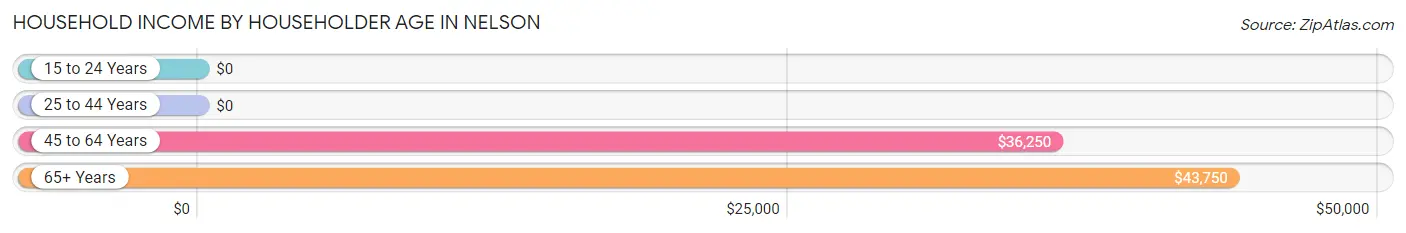
Household Income by Householder Age in Nelson
The median household income in Nelson is $38,750, with the highest median household income of $43,750 found in the 65+ years age bracket for the primary householder. A total of 13 households (21.7%) fall into this category.
| Income Bracket | # Households | Median Income |
| 15 to 24 Years | 0 (0.0%) | $0 |
| 25 to 44 Years | 19 (31.7%) | $0 |
| 45 to 64 Years | 28 (46.7%) | $36,250 |
| 65+ Years | 13 (21.7%) | $43,750 |
| Total | 60 (100.0%) | $38,750 |
Poverty in Nelson
Income Below Poverty by Sex and Age in Nelson
With 4.5% poverty level for males and 27.2% for females among the residents of Nelson, 55 to 64 year old males and under 5 year old females are the most vulnerable to poverty, with 2 males (33.3%) and 1 females (100.0%) in their respective age groups living below the poverty level.
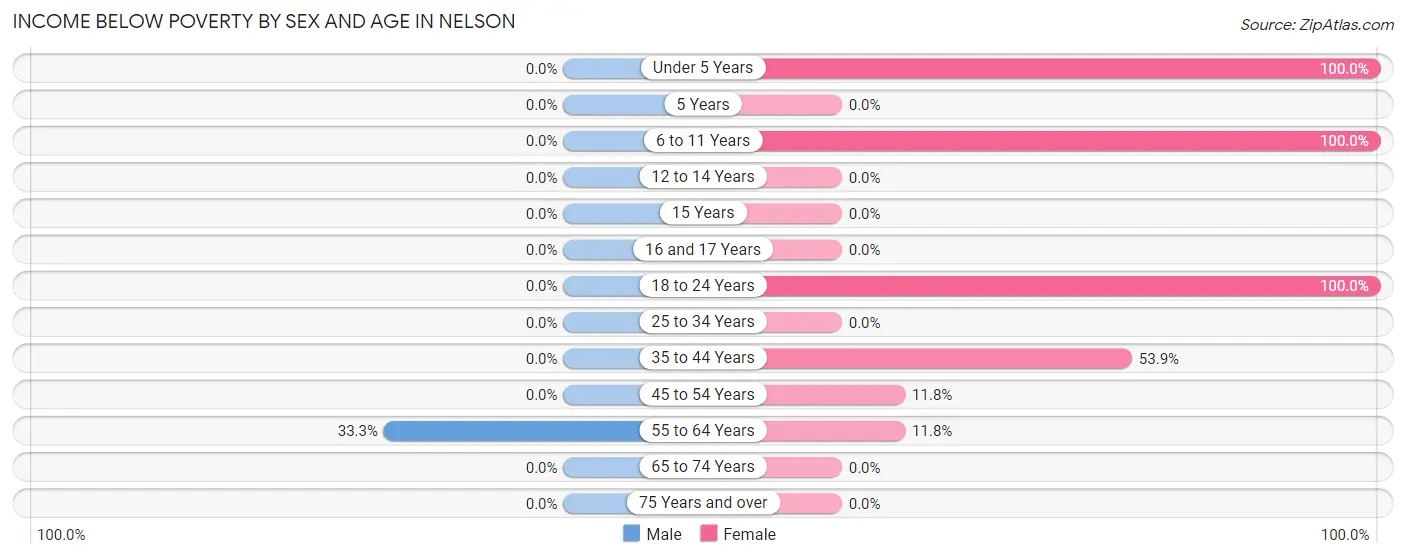
| Age Bracket | Male | Female |
| Under 5 Years | 0 (0.0%) | 1 (100.0%) |
| 5 Years | 0 (0.0%) | 0 (0.0%) |
| 6 to 11 Years | 0 (0.0%) | 4 (100.0%) |
| 12 to 14 Years | 0 (0.0%) | 0 (0.0%) |
| 15 Years | 0 (0.0%) | 0 (0.0%) |
| 16 and 17 Years | 0 (0.0%) | 0 (0.0%) |
| 18 to 24 Years | 0 (0.0%) | 2 (100.0%) |
| 25 to 34 Years | 0 (0.0%) | 0 (0.0%) |
| 35 to 44 Years | 0 (0.0%) | 14 (53.8%) |
| 45 to 54 Years | 0 (0.0%) | 2 (11.8%) |
| 55 to 64 Years | 2 (33.3%) | 2 (11.8%) |
| 65 to 74 Years | 0 (0.0%) | 0 (0.0%) |
| 75 Years and over | 0 (0.0%) | 0 (0.0%) |
| Total | 2 (4.5%) | 25 (27.2%) |
Income Above Poverty by Sex and Age in Nelson
According to the poverty statistics in Nelson, males aged 6 to 11 years and females aged 12 to 14 years are the age groups that are most secure financially, with 100.0% of males and 100.0% of females in these age groups living above the poverty line.
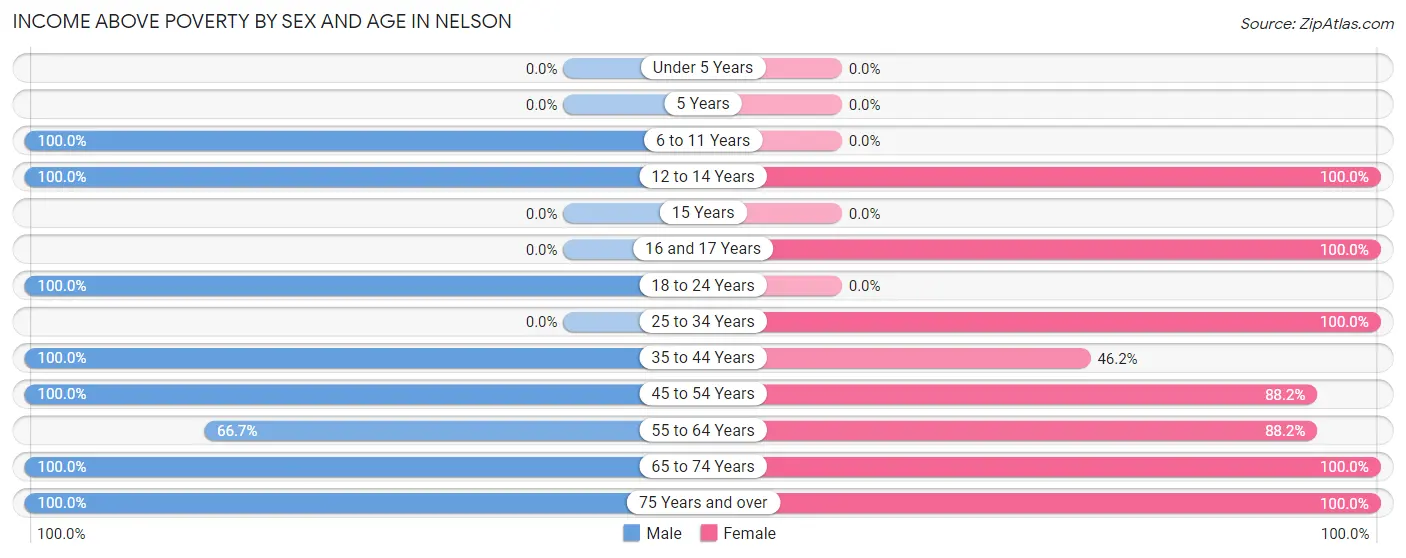
| Age Bracket | Male | Female |
| Under 5 Years | 0 (0.0%) | 0 (0.0%) |
| 5 Years | 0 (0.0%) | 0 (0.0%) |
| 6 to 11 Years | 1 (100.0%) | 0 (0.0%) |
| 12 to 14 Years | 1 (100.0%) | 3 (100.0%) |
| 15 Years | 0 (0.0%) | 0 (0.0%) |
| 16 and 17 Years | 0 (0.0%) | 8 (100.0%) |
| 18 to 24 Years | 5 (100.0%) | 0 (0.0%) |
| 25 to 34 Years | 0 (0.0%) | 1 (100.0%) |
| 35 to 44 Years | 18 (100.0%) | 12 (46.2%) |
| 45 to 54 Years | 5 (100.0%) | 15 (88.2%) |
| 55 to 64 Years | 4 (66.7%) | 15 (88.2%) |
| 65 to 74 Years | 5 (100.0%) | 11 (100.0%) |
| 75 Years and over | 3 (100.0%) | 2 (100.0%) |
| Total | 42 (95.5%) | 67 (72.8%) |
Income Below Poverty Among Married-Couple Families in Nelson
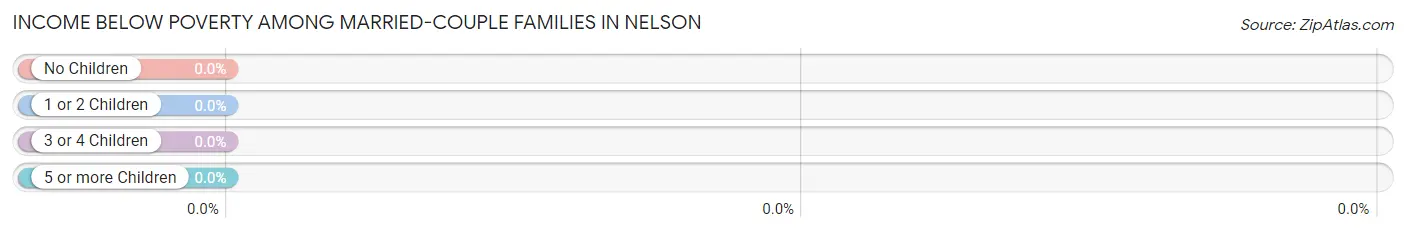
| Children | Above Poverty | Below Poverty |
| No Children | 17 (100.0%) | 0 (0.0%) |
| 1 or 2 Children | 1 (100.0%) | 0 (0.0%) |
| 3 or 4 Children | 0 (0.0%) | 0 (0.0%) |
| 5 or more Children | 0 (0.0%) | 0 (0.0%) |
| Total | 18 (100.0%) | 0 (0.0%) |
Income Below Poverty Among Single-Parent Households in Nelson
According to the poverty data in Nelson, 100.0% or 2 single-father households and 6.7% or 1 single-mother households are living below the poverty line. Among single-father households, those with no children have the highest poverty rate, with 2 households (100.0%) experiencing poverty. Likewise, among single-mother households, those with 3 or 4 children have the highest poverty rate, with 1 households (100.0%) falling below the poverty line.
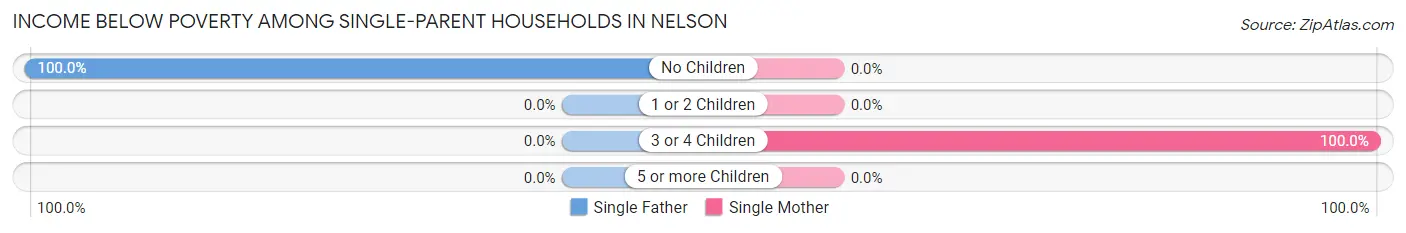
| Children | Single Father | Single Mother |
| No Children | 2 (100.0%) | 0 (0.0%) |
| 1 or 2 Children | 0 (0.0%) | 0 (0.0%) |
| 3 or 4 Children | 0 (0.0%) | 1 (100.0%) |
| 5 or more Children | 0 (0.0%) | 0 (0.0%) |
| Total | 2 (100.0%) | 1 (6.7%) |
Income Below Poverty Among Married-Couple vs Single-Parent Households in Nelson
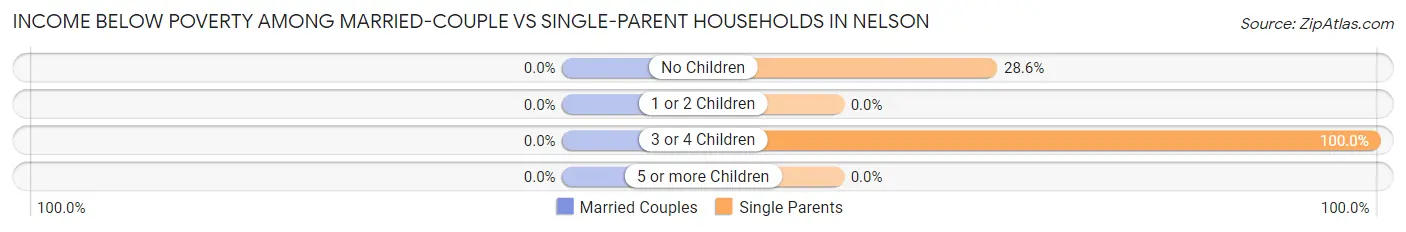
| Children | Married-Couple Families | Single-Parent Households |
| No Children | 0 (0.0%) | 2 (28.6%) |
| 1 or 2 Children | 0 (0.0%) | 0 (0.0%) |
| 3 or 4 Children | 0 (0.0%) | 1 (100.0%) |
| 5 or more Children | 0 (0.0%) | 0 (0.0%) |
| Total | 0 (0.0%) | 3 (17.6%) |
Race in Nelson
The most populous races in Nelson are White / Caucasian (136 | 100.0%), and Hispanic or Latino (4 | 2.9%).
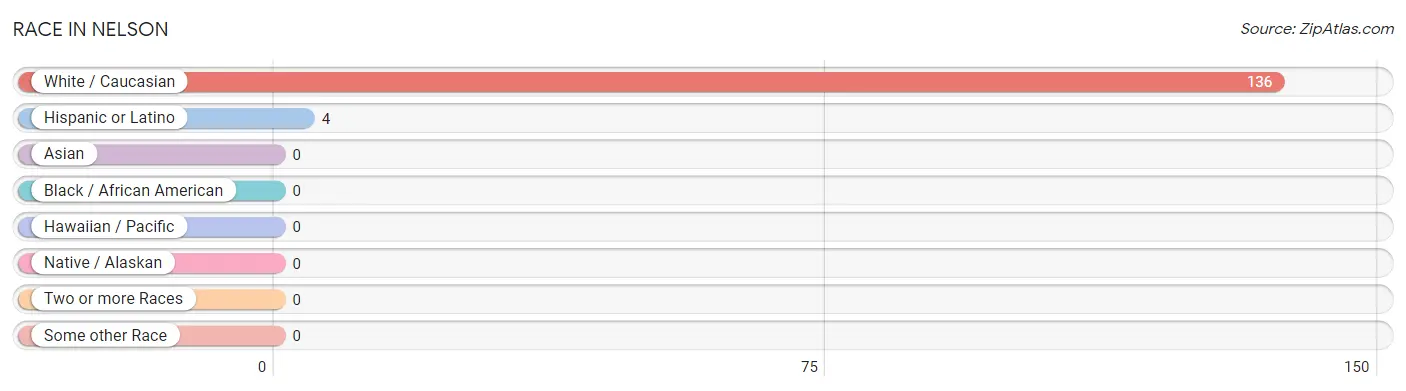
| Race | # Population | % Population |
| Asian | 0 | 0.0% |
| Black / African American | 0 | 0.0% |
| Hawaiian / Pacific | 0 | 0.0% |
| Hispanic or Latino | 4 | 2.9% |
| Native / Alaskan | 0 | 0.0% |
| White / Caucasian | 136 | 100.0% |
| Two or more Races | 0 | 0.0% |
| Some other Race | 0 | 0.0% |
| Total | 136 | 100.0% |
Ancestry in Nelson
The most populous ancestries reported in Nelson are German (48 | 35.3%), Irish (20 | 14.7%), English (10 | 7.3%), French (6 | 4.4%), and American (4 | 2.9%), together accounting for 64.7% of all Nelson residents.
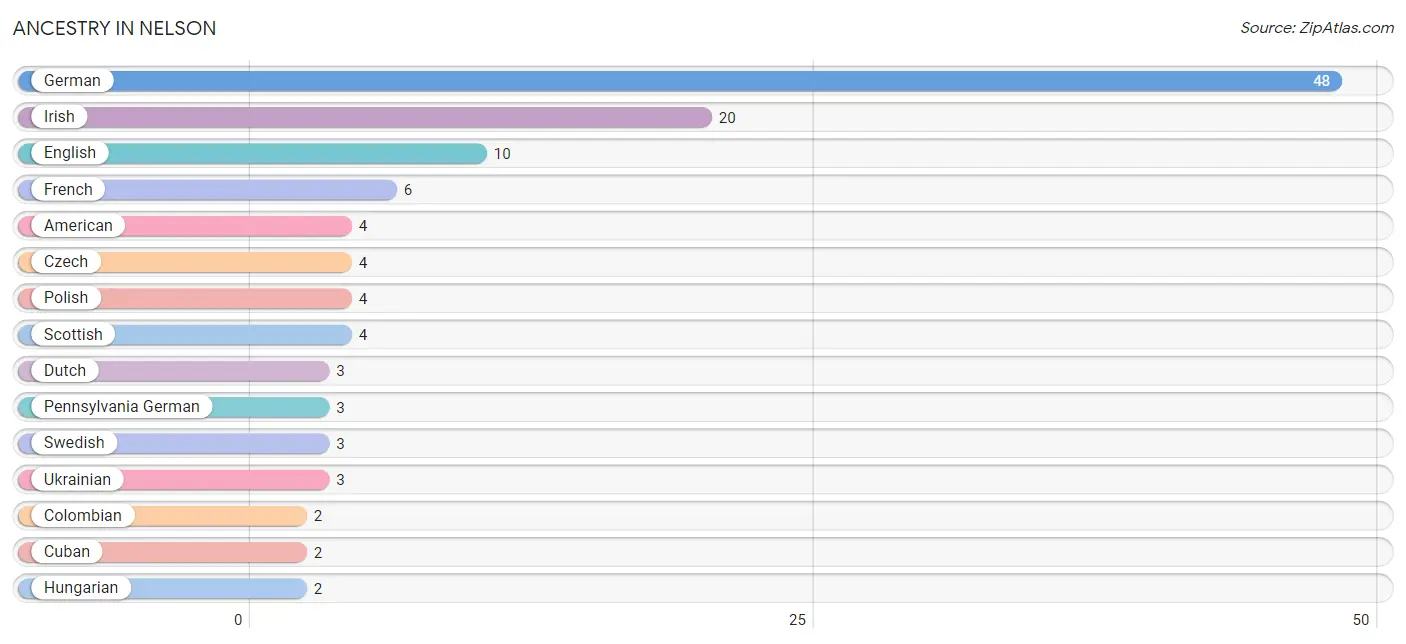
| Ancestry | # Population | % Population |
| American | 4 | 2.9% |
| Belgian | 1 | 0.7% |
| Colombian | 2 | 1.5% |
| Cuban | 2 | 1.5% |
| Czech | 4 | 2.9% |
| Dutch | 3 | 2.2% |
| English | 10 | 7.3% |
| French | 6 | 4.4% |
| German | 48 | 35.3% |
| Hungarian | 2 | 1.5% |
| Irish | 20 | 14.7% |
| Norwegian | 2 | 1.5% |
| Pennsylvania German | 3 | 2.2% |
| Polish | 4 | 2.9% |
| Scottish | 4 | 2.9% |
| South American | 2 | 1.5% |
| Swedish | 3 | 2.2% |
| Ukrainian | 3 | 2.2% | View All 18 Rows |
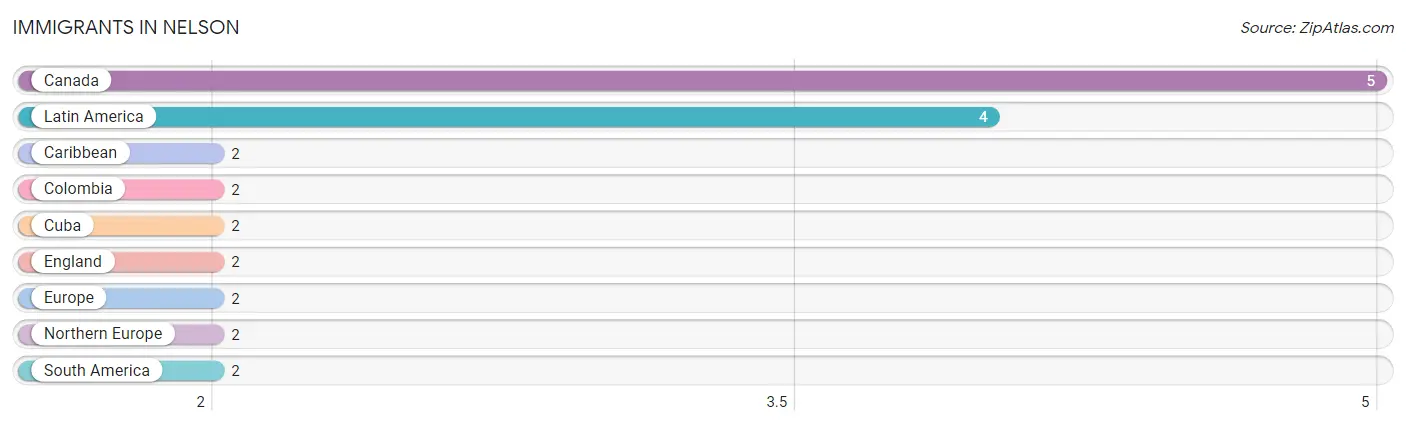
Immigrants in Nelson
The most numerous immigrant groups reported in Nelson came from Canada (5 | 3.7%), Latin America (4 | 2.9%), Caribbean (2 | 1.5%), Colombia (2 | 1.5%), and Cuba (2 | 1.5%), together accounting for 11.0% of all Nelson residents.
| Immigration Origin | # Population | % Population |
| Canada | 5 | 3.7% |
| Caribbean | 2 | 1.5% |
| Colombia | 2 | 1.5% |
| Cuba | 2 | 1.5% |
| England | 2 | 1.5% |
| Europe | 2 | 1.5% |
| Latin America | 4 | 2.9% |
| Northern Europe | 2 | 1.5% |
| South America | 2 | 1.5% | View All 9 Rows |
Sex and Age in Nelson
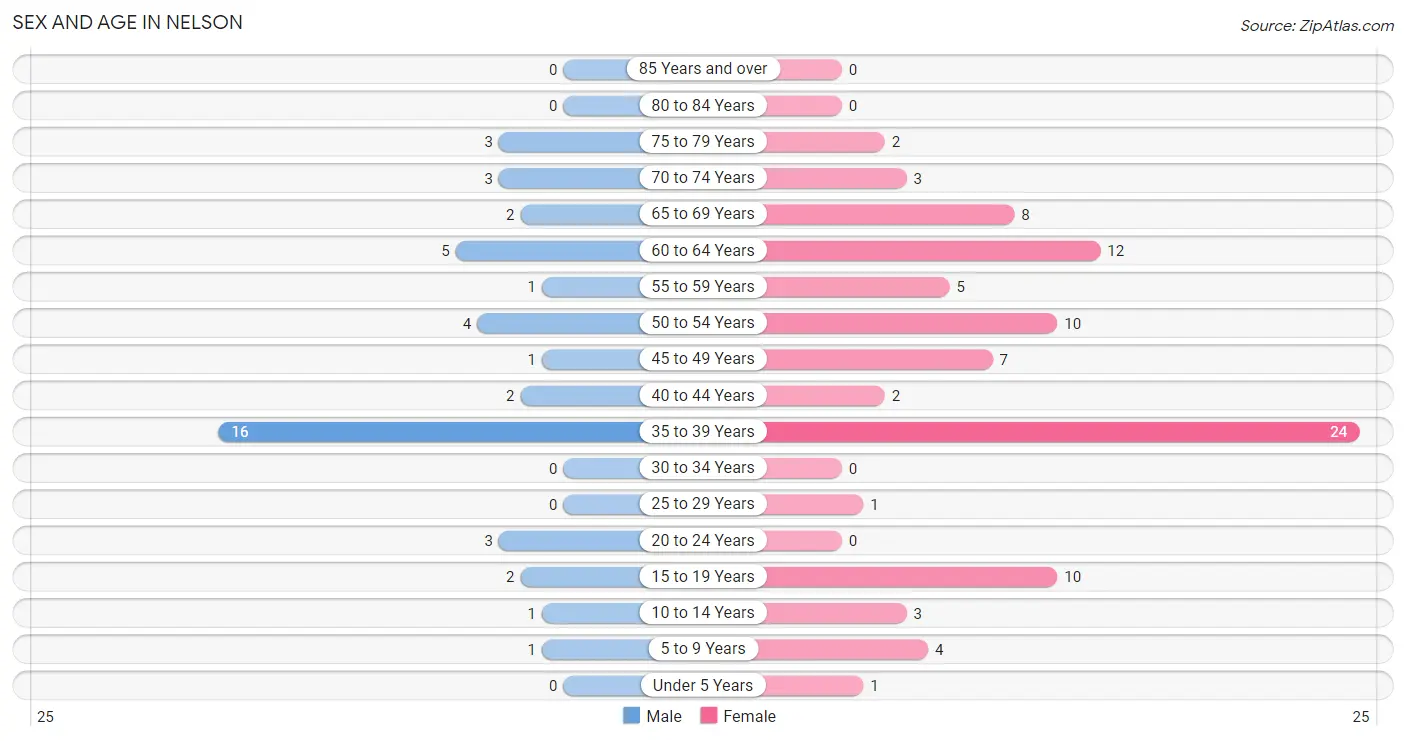
Sex and Age in Nelson
The most populous age groups in Nelson are 35 to 39 Years (16 | 36.4%) for men and 35 to 39 Years (24 | 26.1%) for women.
| Age Bracket | Male | Female |
| Under 5 Years | 0 (0.0%) | 1 (1.1%) |
| 5 to 9 Years | 1 (2.3%) | 4 (4.3%) |
| 10 to 14 Years | 1 (2.3%) | 3 (3.3%) |
| 15 to 19 Years | 2 (4.5%) | 10 (10.9%) |
| 20 to 24 Years | 3 (6.8%) | 0 (0.0%) |
| 25 to 29 Years | 0 (0.0%) | 1 (1.1%) |
| 30 to 34 Years | 0 (0.0%) | 0 (0.0%) |
| 35 to 39 Years | 16 (36.4%) | 24 (26.1%) |
| 40 to 44 Years | 2 (4.5%) | 2 (2.2%) |
| 45 to 49 Years | 1 (2.3%) | 7 (7.6%) |
| 50 to 54 Years | 4 (9.1%) | 10 (10.9%) |
| 55 to 59 Years | 1 (2.3%) | 5 (5.4%) |
| 60 to 64 Years | 5 (11.4%) | 12 (13.0%) |
| 65 to 69 Years | 2 (4.5%) | 8 (8.7%) |
| 70 to 74 Years | 3 (6.8%) | 3 (3.3%) |
| 75 to 79 Years | 3 (6.8%) | 2 (2.2%) |
| 80 to 84 Years | 0 (0.0%) | 0 (0.0%) |
| 85 Years and over | 0 (0.0%) | 0 (0.0%) |
| Total | 44 (100.0%) | 92 (100.0%) |
Families and Households in Nelson
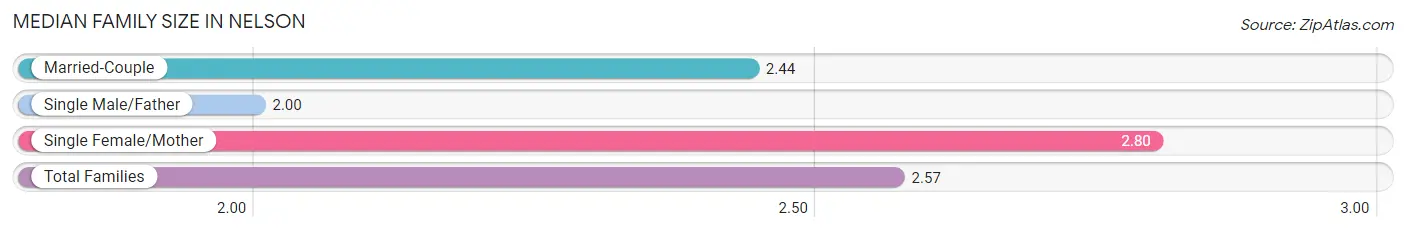
Median Family Size in Nelson
The median family size in Nelson is 2.57 persons per family, with single female/mother families (15 | 42.9%) accounting for the largest median family size of 2.8 persons per family. On the other hand, single male/father families (2 | 5.7%) represent the smallest median family size with 2.00 persons per family.
| Family Type | # Families | Family Size |
| Married-Couple | 18 (51.4%) | 2.44 |
| Single Male/Father | 2 (5.7%) | 2.00 |
| Single Female/Mother | 15 (42.9%) | 2.80 |
| Total Families | 35 (100.0%) | 2.57 |
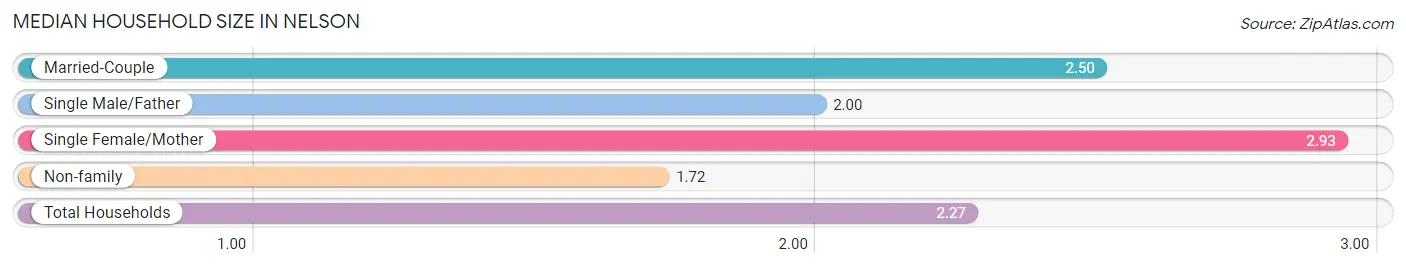
Median Household Size in Nelson
The median household size in Nelson is 2.27 persons per household, with single female/mother households (15 | 25.0%) accounting for the largest median household size of 2.93 persons per household. non-family households (25 | 41.7%) represent the smallest median household size with 1.72 persons per household.
| Household Type | # Households | Household Size |
| Married-Couple | 18 (30.0%) | 2.50 |
| Single Male/Father | 2 (3.3%) | 2.00 |
| Single Female/Mother | 15 (25.0%) | 2.93 |
| Non-family | 25 (41.7%) | 1.72 |
| Total Households | 60 (100.0%) | 2.27 |
Household Size by Marriage Status in Nelson
Out of a total of 60 households in Nelson, 35 (58.3%) are family households, while 25 (41.7%) are nonfamily households. The most numerous type of family households are 2-person households, comprising 24, and the most common type of nonfamily households are 1-person households, comprising 14.
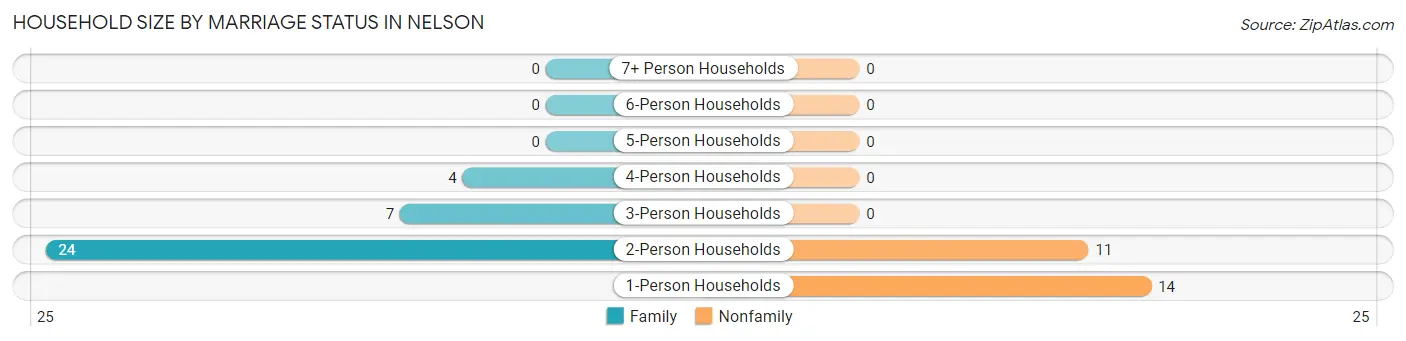
| Household Size | Family Households | Nonfamily Households |
| 1-Person Households | - | 14 (23.3%) |
| 2-Person Households | 24 (40.0%) | 11 (18.3%) |
| 3-Person Households | 7 (11.7%) | 0 (0.0%) |
| 4-Person Households | 4 (6.7%) | 0 (0.0%) |
| 5-Person Households | 0 (0.0%) | 0 (0.0%) |
| 6-Person Households | 0 (0.0%) | 0 (0.0%) |
| 7+ Person Households | 0 (0.0%) | 0 (0.0%) |
| Total | 35 (58.3%) | 25 (41.7%) |
Female Fertility in Nelson
Fertility by Age in Nelson
| Age Bracket | Women with Births | Births / 1,000 Women |
| 15 to 19 years | 0 (0.0%) | 0.0 |
| 20 to 34 years | 0 (0.0%) | 0.0 |
| 35 to 50 years | 0 (0.0%) | 0.0 |
| Total | 0 (0.0%) | 0.0 |
Fertility by Age by Marriage Status in Nelson
| Age Bracket | Married | Unmarried |
| 15 to 19 years | 0 (0.0%) | 0 (0.0%) |
| 20 to 34 years | 0 (0.0%) | 0 (0.0%) |
| 35 to 50 years | 0 (0.0%) | 0 (0.0%) |
| Total | 0 (0.0%) | 0 (0.0%) |
Fertility by Education in Nelson
| Educational Attainment | Women with Births | Births / 1,000 Women |
| Less than High School | 0 (0.0%) | 0.0 |
| High School Diploma | 0 (0.0%) | 0.0 |
| College or Associate's Degree | 0 (0.0%) | 0.0 |
| Bachelor's Degree | 0 (0.0%) | 0.0 |
| Graduate Degree | 0 (0.0%) | 0.0 |
| Total | 0 (0.0%) | 0.0 |
Fertility by Education by Marriage Status in Nelson
| Educational Attainment | Married | Unmarried |
| Less than High School | 0 (0.0%) | 0 (0.0%) |
| High School Diploma | 0 (0.0%) | 0 (0.0%) |
| College or Associate's Degree | 0 (0.0%) | 0 (0.0%) |
| Bachelor's Degree | 0 (0.0%) | 0 (0.0%) |
| Graduate Degree | 0 (0.0%) | 0 (0.0%) |
| Total | 0 (0.0%) | 0 (0.0%) |
Employment Characteristics in Nelson
Employment by Class of Employer in Nelson
Among the 50 employed individuals in Nelson, private company employees (32 | 64.0%), self-employed (not incorporated) (4 | 8.0%), and local government employees (4 | 8.0%) make up the most common classes of employment.
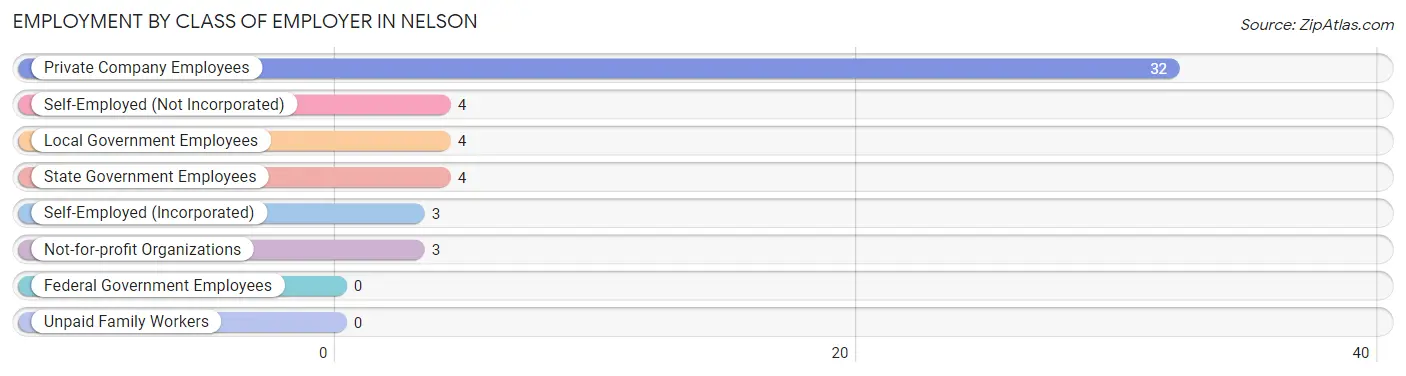
| Employer Class | # Employees | % Employees |
| Private Company Employees | 32 | 64.0% |
| Self-Employed (Incorporated) | 3 | 6.0% |
| Self-Employed (Not Incorporated) | 4 | 8.0% |
| Not-for-profit Organizations | 3 | 6.0% |
| Local Government Employees | 4 | 8.0% |
| State Government Employees | 4 | 8.0% |
| Federal Government Employees | 0 | 0.0% |
| Unpaid Family Workers | 0 | 0.0% |
| Total | 50 | 100.0% |
Employment Status by Age in Nelson
According to the labor force statistics for Nelson, out of the total population over 16 years of age (126), 46.0% or 58 individuals are in the labor force, with 3.4% or 2 of them unemployed. The age group with the highest labor force participation rate is 25 to 29 years, with 100.0% or 1 individuals in the labor force. Within the labor force, the 55 to 59 years age range has the highest percentage of unemployed individuals, with 33.3% or 1 of them being unemployed.
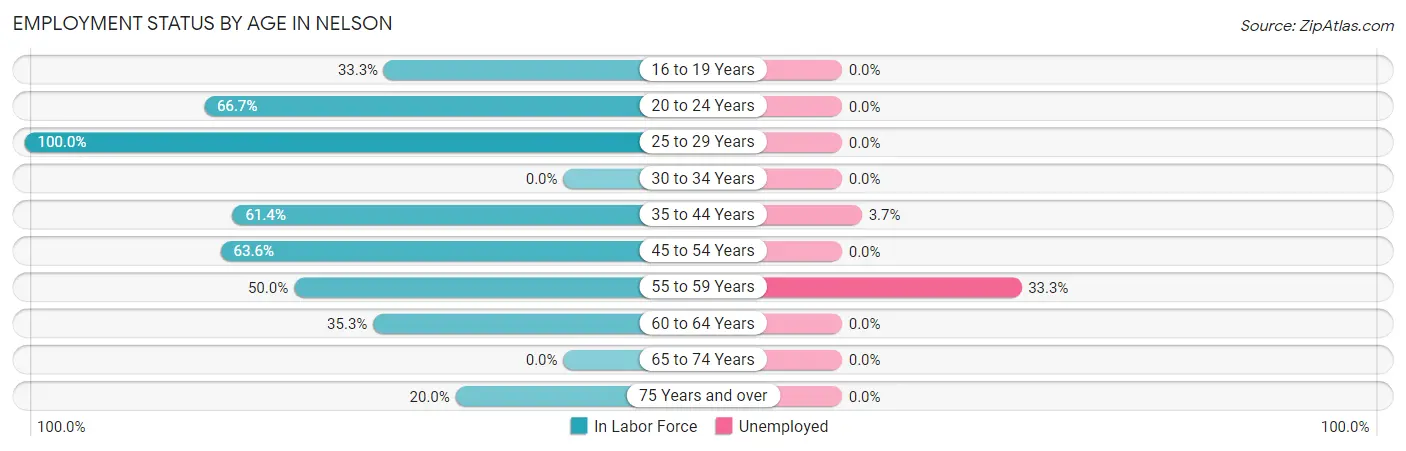
| Age Bracket | In Labor Force | Unemployed |
| 16 to 19 Years | 4 (33.3%) | 0 (0.0%) |
| 20 to 24 Years | 2 (66.7%) | 0 (0.0%) |
| 25 to 29 Years | 1 (100.0%) | 0 (0.0%) |
| 30 to 34 Years | 0 (0.0%) | 0 (0.0%) |
| 35 to 44 Years | 27 (61.4%) | 1 (3.7%) |
| 45 to 54 Years | 14 (63.6%) | 0 (0.0%) |
| 55 to 59 Years | 3 (50.0%) | 1 (33.3%) |
| 60 to 64 Years | 6 (35.3%) | 0 (0.0%) |
| 65 to 74 Years | 0 (0.0%) | 0 (0.0%) |
| 75 Years and over | 1 (20.0%) | 0 (0.0%) |
| Total | 58 (46.0%) | 2 (3.4%) |
Employment Status by Educational Attainment in Nelson
According to labor force statistics for Nelson, 56.7% of individuals (51) out of the total population between 25 and 64 years of age (90) are in the labor force, with 3.9% or 2 of them being unemployed. The group with the highest labor force participation rate are those with the educational attainment of high school diploma, with 81.8% or 18 individuals in the labor force. Within the labor force, individuals with college / associate degree education have the highest percentage of unemployment, with 8.7% or 2 of them being unemployed.
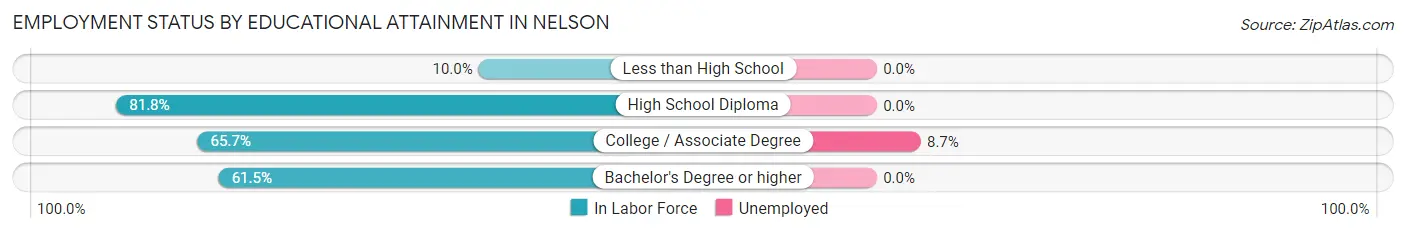
| Educational Attainment | In Labor Force | Unemployed |
| Less than High School | 2 (10.0%) | 0 (0.0%) |
| High School Diploma | 18 (81.8%) | 0 (0.0%) |
| College / Associate Degree | 23 (65.7%) | 3 (8.7%) |
| Bachelor's Degree or higher | 8 (61.5%) | 0 (0.0%) |
| Total | 51 (56.7%) | 4 (3.9%) |
Employment Occupations by Sex in Nelson
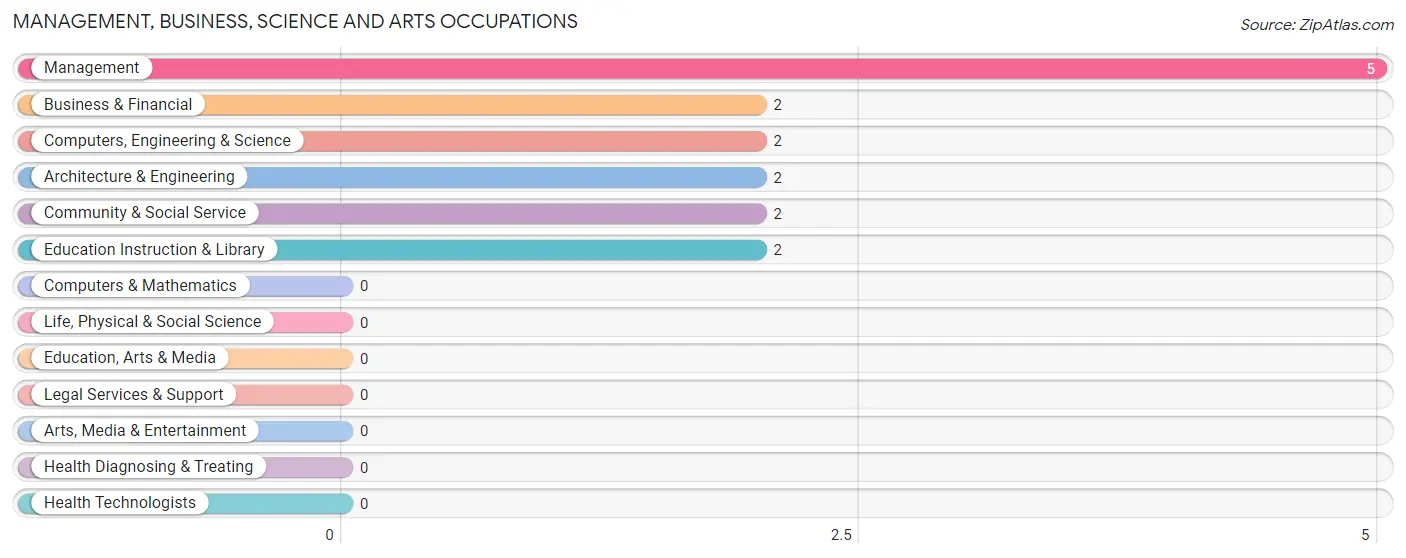
Management, Business, Science and Arts Occupations
The most common Management, Business, Science and Arts occupations in Nelson are Management (5 | 8.9%), Business & Financial (2 | 3.6%), Computers, Engineering & Science (2 | 3.6%), Architecture & Engineering (2 | 3.6%), and Community & Social Service (2 | 3.6%).
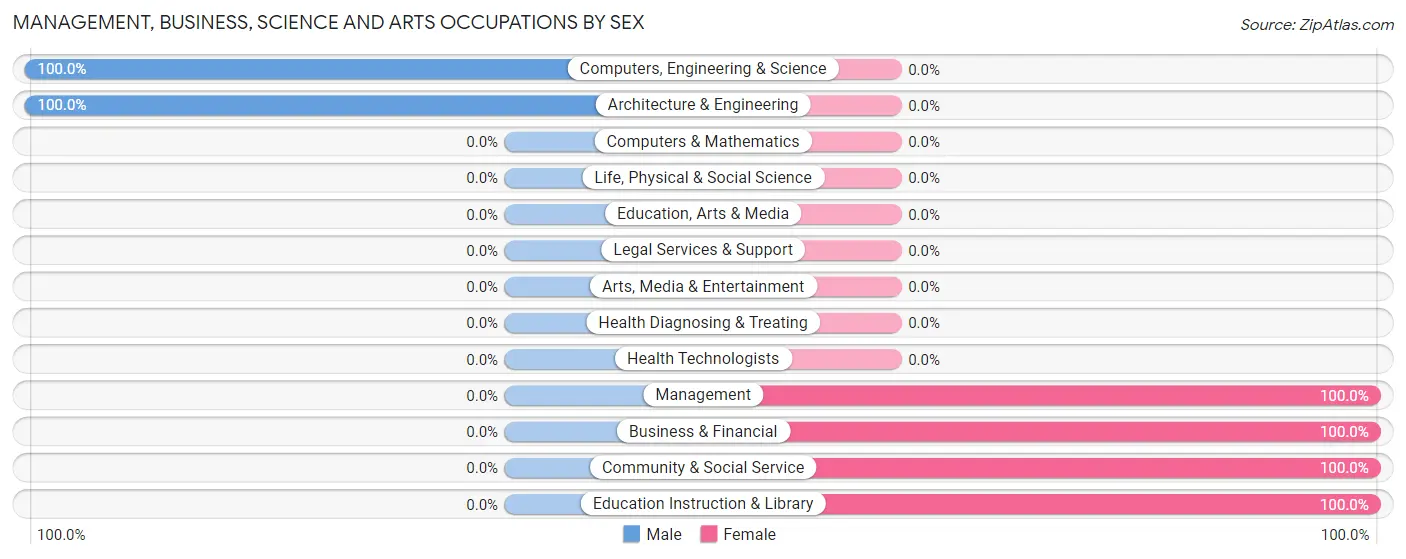
Management, Business, Science and Arts Occupations by Sex
Within the Management, Business, Science and Arts occupations in Nelson, the most male-oriented occupations are Computers, Engineering & Science (100.0%), and Architecture & Engineering (100.0%), while the most female-oriented occupations are Management (100.0%), Business & Financial (100.0%), and Community & Social Service (100.0%).
| Occupation | Male | Female |
| Management | 0 (0.0%) | 5 (100.0%) |
| Business & Financial | 0 (0.0%) | 2 (100.0%) |
| Computers, Engineering & Science | 2 (100.0%) | 0 (0.0%) |
| Computers & Mathematics | 0 (0.0%) | 0 (0.0%) |
| Architecture & Engineering | 2 (100.0%) | 0 (0.0%) |
| Life, Physical & Social Science | 0 (0.0%) | 0 (0.0%) |
| Community & Social Service | 0 (0.0%) | 2 (100.0%) |
| Education, Arts & Media | 0 (0.0%) | 0 (0.0%) |
| Legal Services & Support | 0 (0.0%) | 0 (0.0%) |
| Education Instruction & Library | 0 (0.0%) | 2 (100.0%) |
| Arts, Media & Entertainment | 0 (0.0%) | 0 (0.0%) |
| Health Diagnosing & Treating | 0 (0.0%) | 0 (0.0%) |
| Health Technologists | 0 (0.0%) | 0 (0.0%) |
| Total (Category) | 2 (18.2%) | 9 (81.8%) |
| Total (Overall) | 25 (44.6%) | 31 (55.4%) |
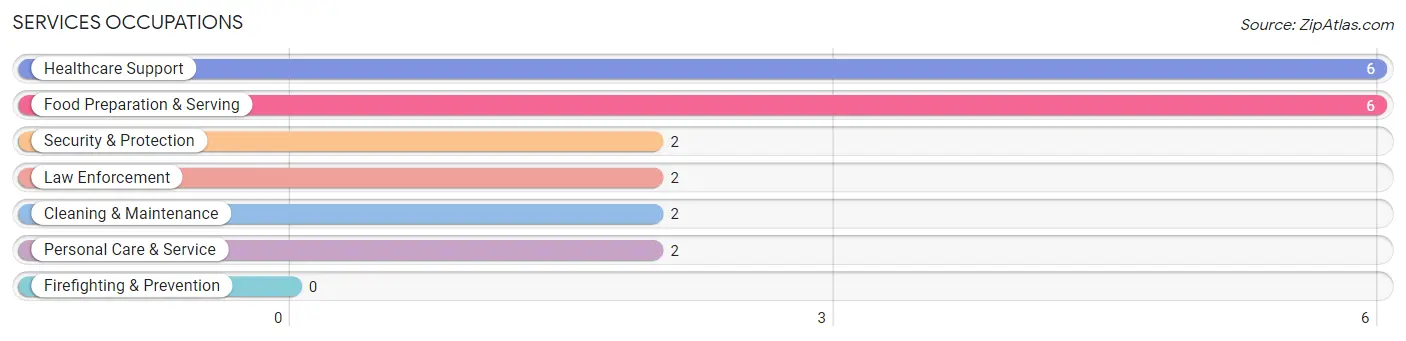
Services Occupations
The most common Services occupations in Nelson are Healthcare Support (6 | 10.7%), Food Preparation & Serving (6 | 10.7%), Security & Protection (2 | 3.6%), Law Enforcement (2 | 3.6%), and Cleaning & Maintenance (2 | 3.6%).
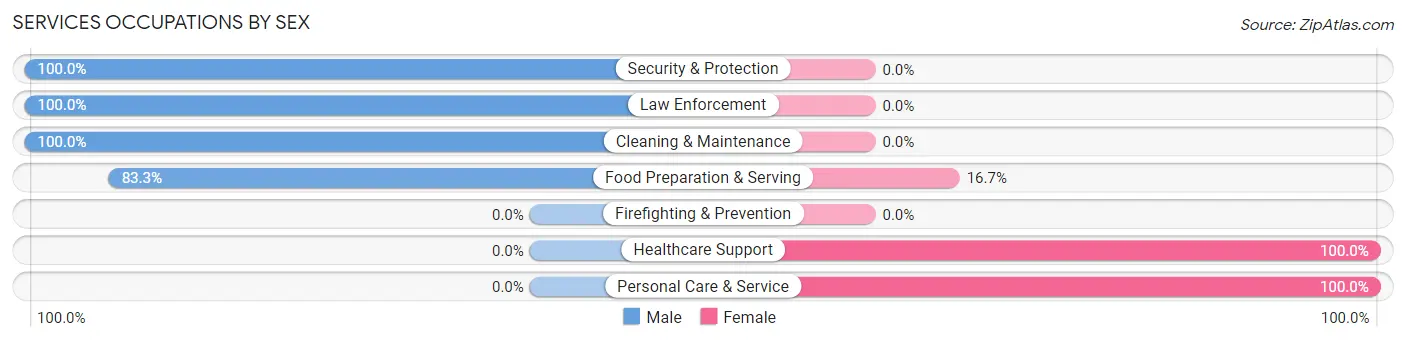
Services Occupations by Sex
Within the Services occupations in Nelson, the most male-oriented occupations are Security & Protection (100.0%), Law Enforcement (100.0%), and Cleaning & Maintenance (100.0%), while the most female-oriented occupations are Healthcare Support (100.0%), Personal Care & Service (100.0%), and Food Preparation & Serving (16.7%).
| Occupation | Male | Female |
| Healthcare Support | 0 (0.0%) | 6 (100.0%) |
| Security & Protection | 2 (100.0%) | 0 (0.0%) |
| Firefighting & Prevention | 0 (0.0%) | 0 (0.0%) |
| Law Enforcement | 2 (100.0%) | 0 (0.0%) |
| Food Preparation & Serving | 5 (83.3%) | 1 (16.7%) |
| Cleaning & Maintenance | 2 (100.0%) | 0 (0.0%) |
| Personal Care & Service | 0 (0.0%) | 2 (100.0%) |
| Total (Category) | 9 (50.0%) | 9 (50.0%) |
| Total (Overall) | 25 (44.6%) | 31 (55.4%) |
Sales and Office Occupations
The most common Sales and Office occupations in Nelson are Sales & Related (7 | 12.5%), and Office & Administration (1 | 1.8%).
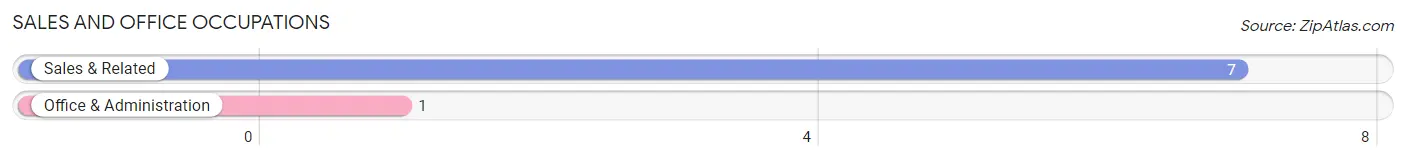
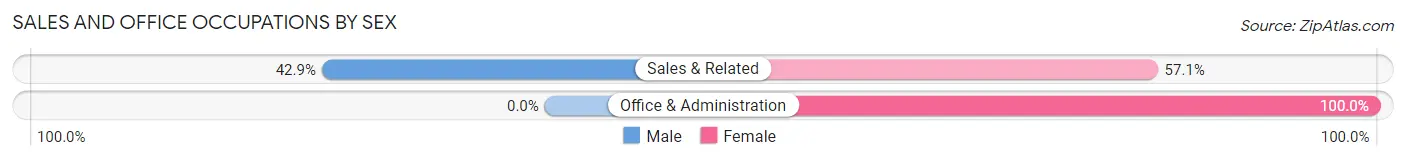
Sales and Office Occupations by Sex
| Occupation | Male | Female |
| Sales & Related | 3 (42.9%) | 4 (57.1%) |
| Office & Administration | 0 (0.0%) | 1 (100.0%) |
| Total (Category) | 3 (37.5%) | 5 (62.5%) |
| Total (Overall) | 25 (44.6%) | 31 (55.4%) |
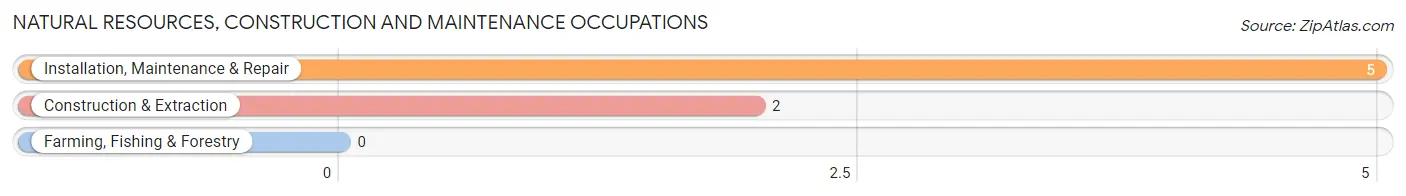
Natural Resources, Construction and Maintenance Occupations
The most common Natural Resources, Construction and Maintenance occupations in Nelson are Installation, Maintenance & Repair (5 | 8.9%), and Construction & Extraction (2 | 3.6%).
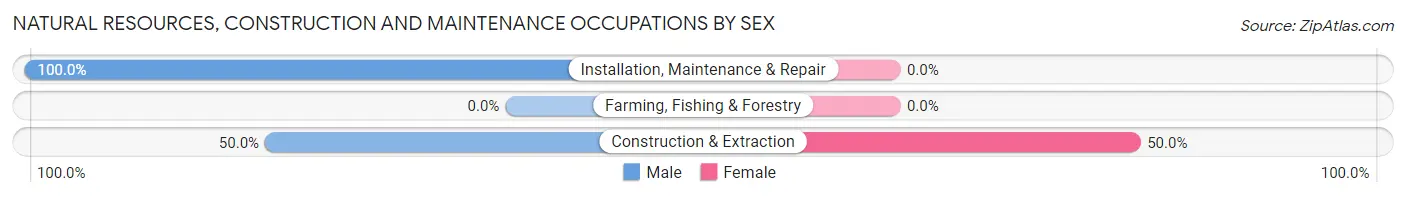
Natural Resources, Construction and Maintenance Occupations by Sex
| Occupation | Male | Female |
| Farming, Fishing & Forestry | 0 (0.0%) | 0 (0.0%) |
| Construction & Extraction | 1 (50.0%) | 1 (50.0%) |
| Installation, Maintenance & Repair | 5 (100.0%) | 0 (0.0%) |
| Total (Category) | 6 (85.7%) | 1 (14.3%) |
| Total (Overall) | 25 (44.6%) | 31 (55.4%) |
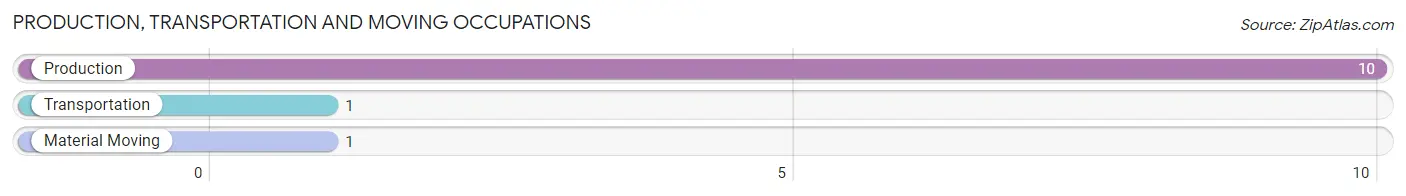
Production, Transportation and Moving Occupations
The most common Production, Transportation and Moving occupations in Nelson are Production (10 | 17.9%), Transportation (1 | 1.8%), and Material Moving (1 | 1.8%).
Production, Transportation and Moving Occupations by Sex
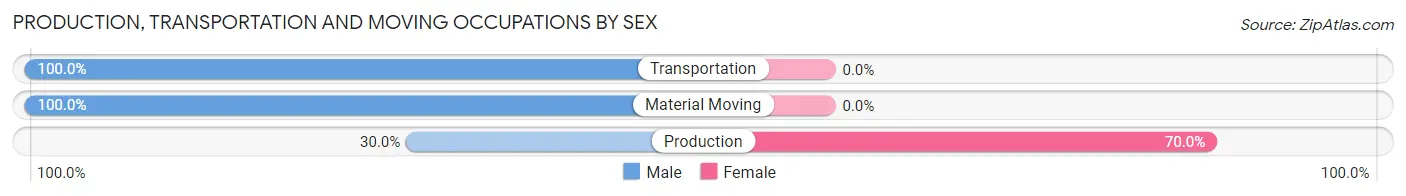
| Occupation | Male | Female |
| Production | 3 (30.0%) | 7 (70.0%) |
| Transportation | 1 (100.0%) | 0 (0.0%) |
| Material Moving | 1 (100.0%) | 0 (0.0%) |
| Total (Category) | 5 (41.7%) | 7 (58.3%) |
| Total (Overall) | 25 (44.6%) | 31 (55.4%) |
Employment Industries by Sex in Nelson
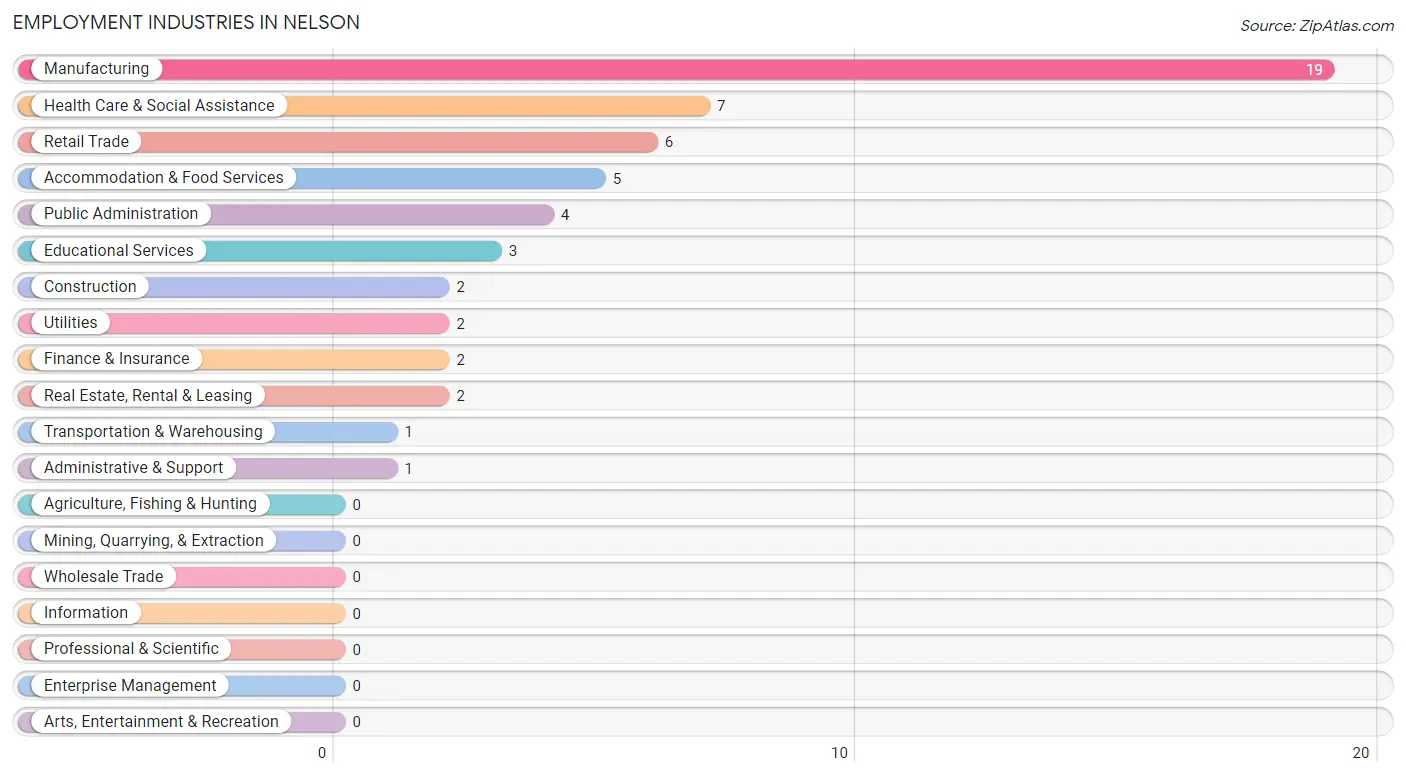
Employment Industries in Nelson
The major employment industries in Nelson include Manufacturing (19 | 33.9%), Health Care & Social Assistance (7 | 12.5%), Retail Trade (6 | 10.7%), Accommodation & Food Services (5 | 8.9%), and Public Administration (4 | 7.1%).
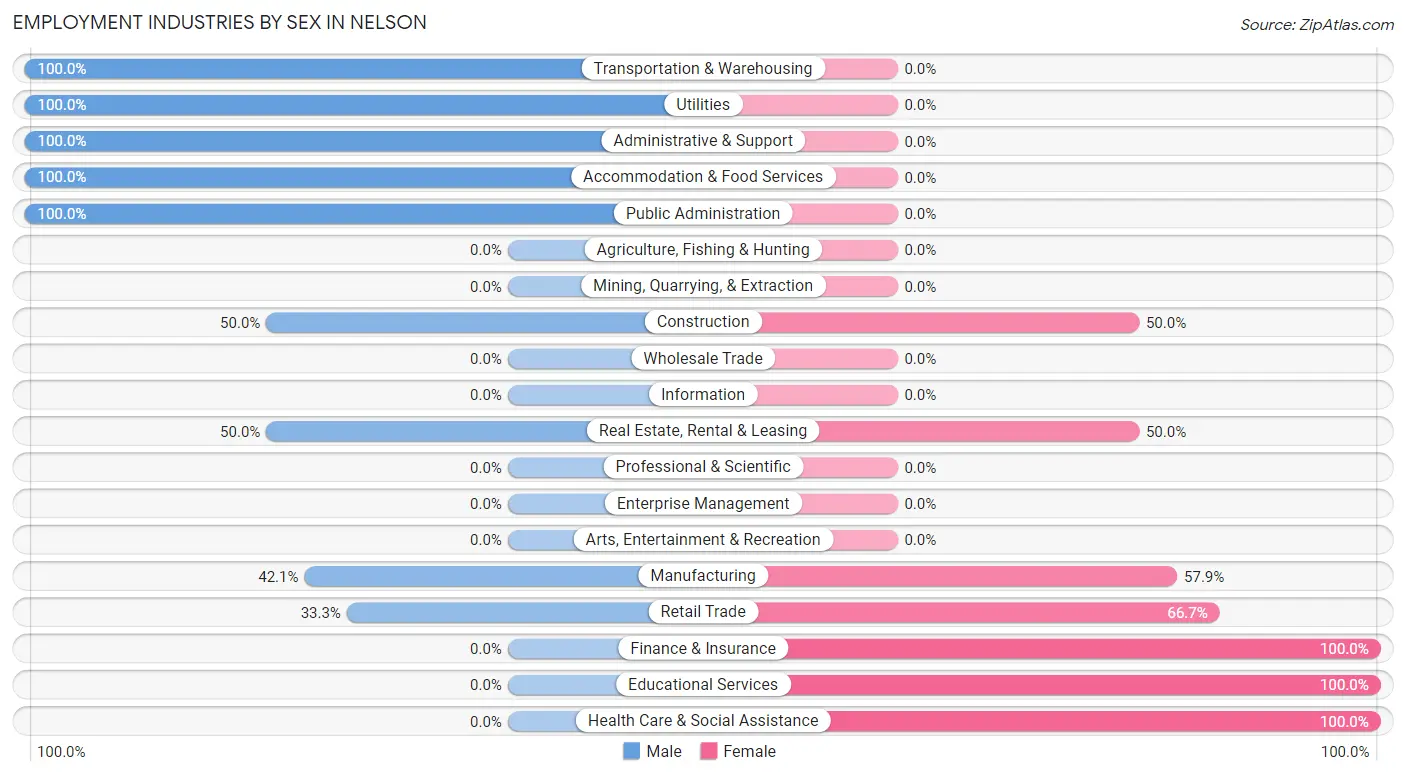
Employment Industries by Sex in Nelson
The Nelson industries that see more men than women are Transportation & Warehousing (100.0%), Utilities (100.0%), and Administrative & Support (100.0%), whereas the industries that tend to have a higher number of women are Finance & Insurance (100.0%), Educational Services (100.0%), and Health Care & Social Assistance (100.0%).
| Industry | Male | Female |
| Agriculture, Fishing & Hunting | 0 (0.0%) | 0 (0.0%) |
| Mining, Quarrying, & Extraction | 0 (0.0%) | 0 (0.0%) |
| Construction | 1 (50.0%) | 1 (50.0%) |
| Manufacturing | 8 (42.1%) | 11 (57.9%) |
| Wholesale Trade | 0 (0.0%) | 0 (0.0%) |
| Retail Trade | 2 (33.3%) | 4 (66.7%) |
| Transportation & Warehousing | 1 (100.0%) | 0 (0.0%) |
| Utilities | 2 (100.0%) | 0 (0.0%) |
| Information | 0 (0.0%) | 0 (0.0%) |
| Finance & Insurance | 0 (0.0%) | 2 (100.0%) |
| Real Estate, Rental & Leasing | 1 (50.0%) | 1 (50.0%) |
| Professional & Scientific | 0 (0.0%) | 0 (0.0%) |
| Enterprise Management | 0 (0.0%) | 0 (0.0%) |
| Administrative & Support | 1 (100.0%) | 0 (0.0%) |
| Educational Services | 0 (0.0%) | 3 (100.0%) |
| Health Care & Social Assistance | 0 (0.0%) | 7 (100.0%) |
| Arts, Entertainment & Recreation | 0 (0.0%) | 0 (0.0%) |
| Accommodation & Food Services | 5 (100.0%) | 0 (0.0%) |
| Public Administration | 4 (100.0%) | 0 (0.0%) |
| Total | 25 (44.6%) | 31 (55.4%) |
Education in Nelson
School Enrollment in Nelson
The most common levels of schooling among the 23 students in Nelson are high school (11 | 47.8%), elementary school (5 | 21.7%), and middle school (4 | 17.4%).
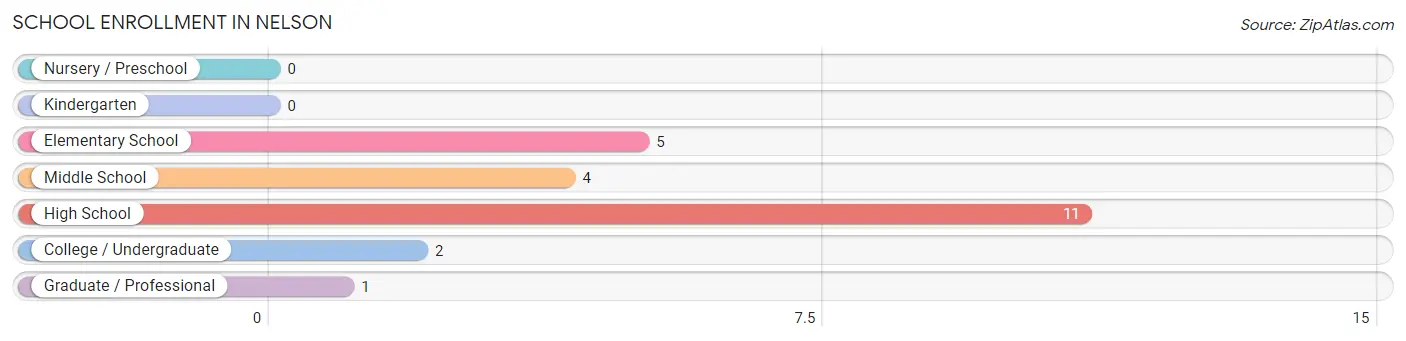
| School Level | # Students | % Students |
| Nursery / Preschool | 0 | 0.0% |
| Kindergarten | 0 | 0.0% |
| Elementary School | 5 | 21.7% |
| Middle School | 4 | 17.4% |
| High School | 11 | 47.8% |
| College / Undergraduate | 2 | 8.7% |
| Graduate / Professional | 1 | 4.3% |
| Total | 23 | 100.0% |
School Enrollment by Age by Funding Source in Nelson
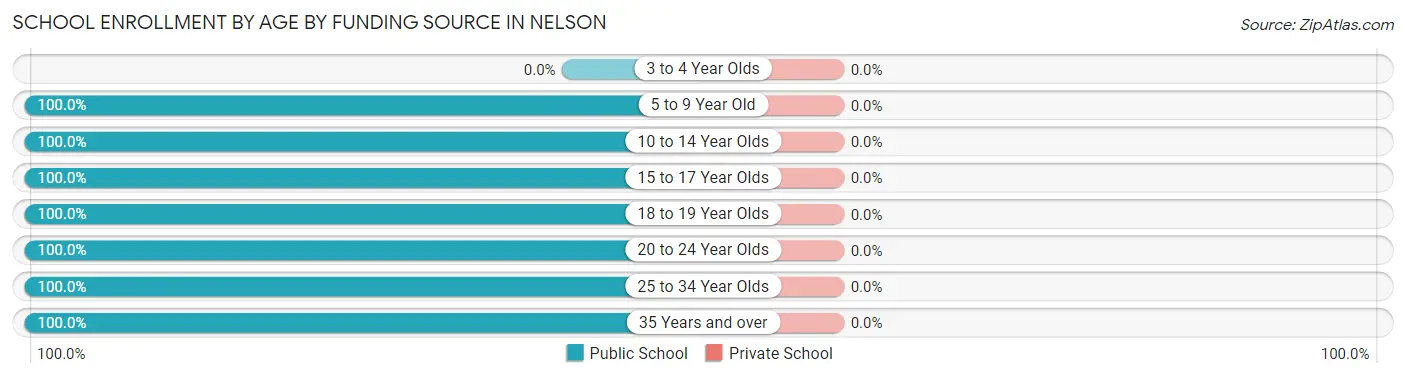
| Age Bracket | Public School | Private School |
| 3 to 4 Year Olds | 0 (0.0%) | 0 (0.0%) |
| 5 to 9 Year Old | 5 (100.0%) | 0 (0.0%) |
| 10 to 14 Year Olds | 4 (100.0%) | 0 (0.0%) |
| 15 to 17 Year Olds | 8 (100.0%) | 0 (0.0%) |
| 18 to 19 Year Olds | 2 (100.0%) | 0 (0.0%) |
| 20 to 24 Year Olds | 1 (100.0%) | 0 (0.0%) |
| 25 to 34 Year Olds | 1 (100.0%) | 0 (0.0%) |
| 35 Years and over | 2 (100.0%) | 0 (0.0%) |
| Total | 23 (100.0%) | 0 (0.0%) |
Educational Attainment by Field of Study in Nelson
Business (9 | 64.3%), physical & health sciences (2 | 14.3%), social sciences (2 | 14.3%), and psychology (1 | 7.1%) are the most common fields of study among 14 individuals in Nelson who have obtained a bachelor's degree or higher.
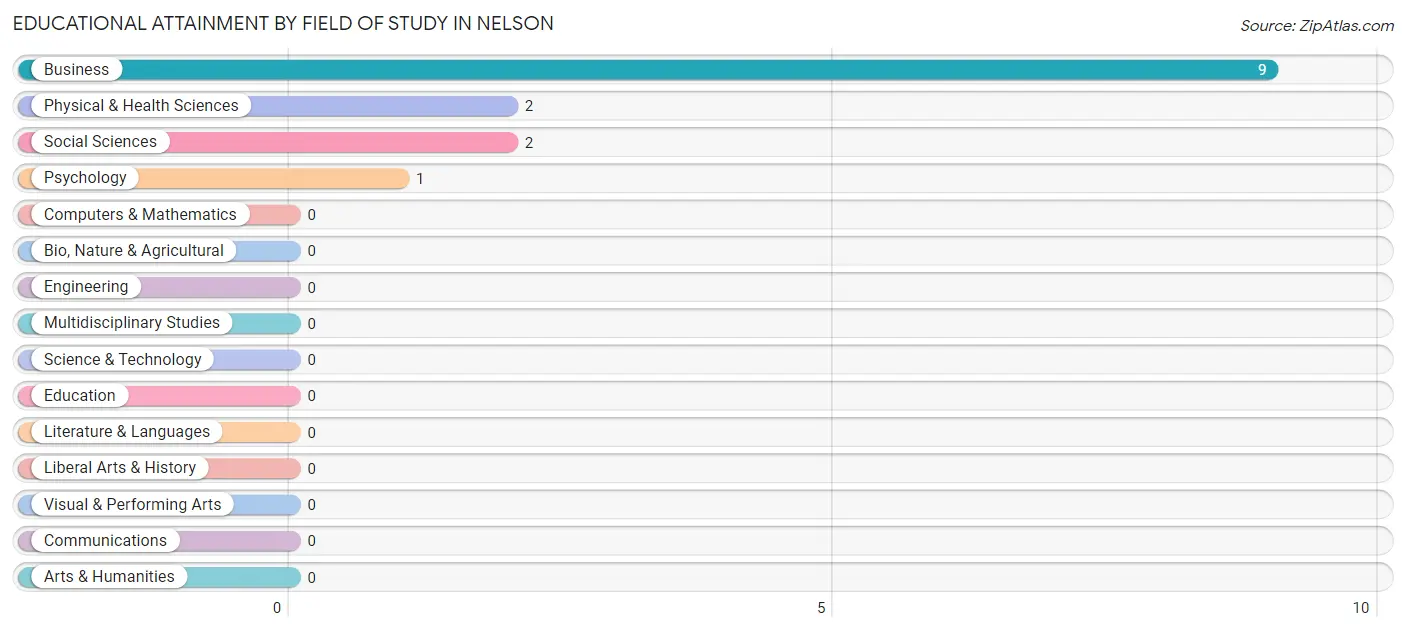
| Field of Study | # Graduates | % Graduates |
| Computers & Mathematics | 0 | 0.0% |
| Bio, Nature & Agricultural | 0 | 0.0% |
| Physical & Health Sciences | 2 | 14.3% |
| Psychology | 1 | 7.1% |
| Social Sciences | 2 | 14.3% |
| Engineering | 0 | 0.0% |
| Multidisciplinary Studies | 0 | 0.0% |
| Science & Technology | 0 | 0.0% |
| Business | 9 | 64.3% |
| Education | 0 | 0.0% |
| Literature & Languages | 0 | 0.0% |
| Liberal Arts & History | 0 | 0.0% |
| Visual & Performing Arts | 0 | 0.0% |
| Communications | 0 | 0.0% |
| Arts & Humanities | 0 | 0.0% |
| Total | 14 | 100.0% |
Transportation & Commute in Nelson
Vehicle Availability by Sex in Nelson
The most prevalent vehicle ownership categories in Nelson are males with 2 vehicles (7, accounting for 35.0%) and females with 2 vehicles (19, making up 23.3%).
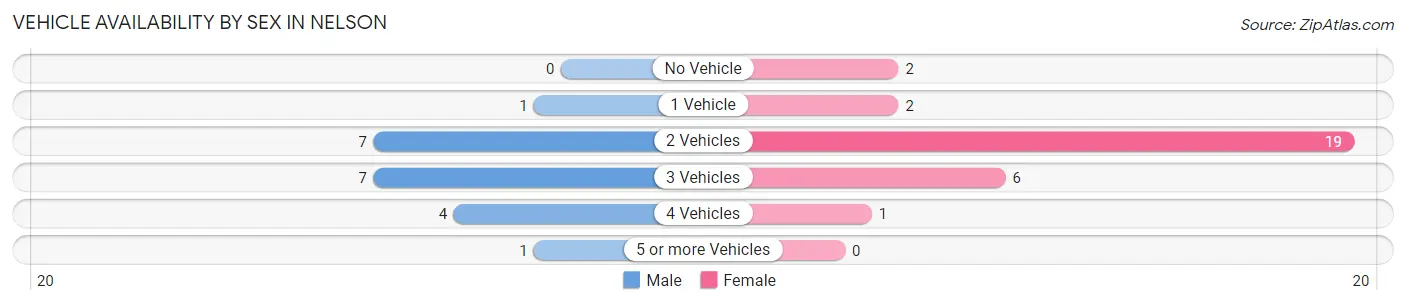
| Vehicles Available | Male | Female |
| No Vehicle | 0 (0.0%) | 2 (6.7%) |
| 1 Vehicle | 1 (5.0%) | 2 (6.7%) |
| 2 Vehicles | 7 (35.0%) | 19 (63.3%) |
| 3 Vehicles | 7 (35.0%) | 6 (20.0%) |
| 4 Vehicles | 4 (20.0%) | 1 (3.3%) |
| 5 or more Vehicles | 1 (5.0%) | 0 (0.0%) |
| Total | 20 (100.0%) | 30 (100.0%) |
Commute Time in Nelson
The most frequently occuring commute durations in Nelson are 15 to 19 minutes (21 commuters, 42.0%), 20 to 24 minutes (10 commuters, 20.0%), and 10 to 14 minutes (7 commuters, 14.0%).
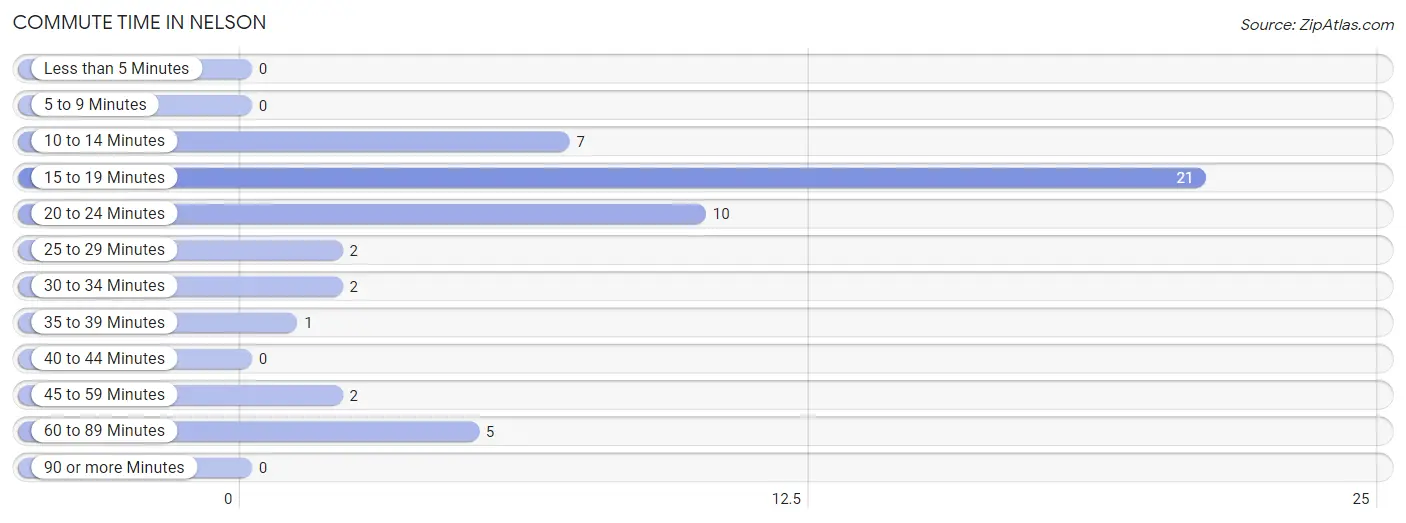
| Commute Time | # Commuters | % Commuters |
| Less than 5 Minutes | 0 | 0.0% |
| 5 to 9 Minutes | 0 | 0.0% |
| 10 to 14 Minutes | 7 | 14.0% |
| 15 to 19 Minutes | 21 | 42.0% |
| 20 to 24 Minutes | 10 | 20.0% |
| 25 to 29 Minutes | 2 | 4.0% |
| 30 to 34 Minutes | 2 | 4.0% |
| 35 to 39 Minutes | 1 | 2.0% |
| 40 to 44 Minutes | 0 | 0.0% |
| 45 to 59 Minutes | 2 | 4.0% |
| 60 to 89 Minutes | 5 | 10.0% |
| 90 or more Minutes | 0 | 0.0% |
Commute Time by Sex in Nelson
The most common commute times in Nelson are 20 to 24 minutes (8 commuters, 40.0%) for males and 15 to 19 minutes (19 commuters, 63.3%) for females.
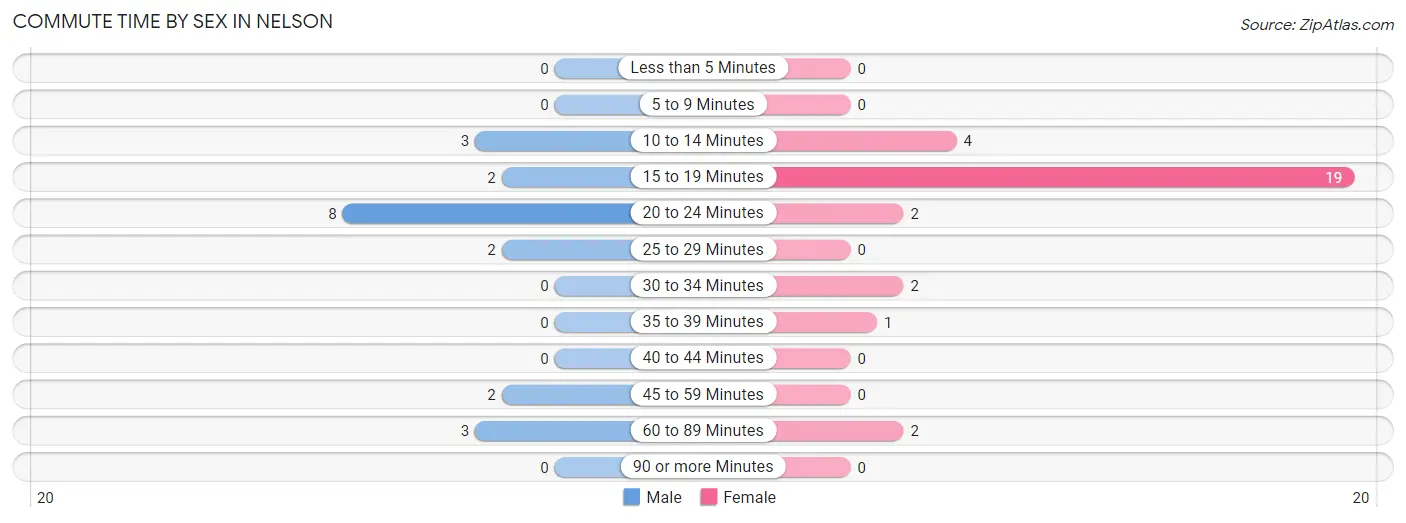
| Commute Time | Male | Female |
| Less than 5 Minutes | 0 (0.0%) | 0 (0.0%) |
| 5 to 9 Minutes | 0 (0.0%) | 0 (0.0%) |
| 10 to 14 Minutes | 3 (15.0%) | 4 (13.3%) |
| 15 to 19 Minutes | 2 (10.0%) | 19 (63.3%) |
| 20 to 24 Minutes | 8 (40.0%) | 2 (6.7%) |
| 25 to 29 Minutes | 2 (10.0%) | 0 (0.0%) |
| 30 to 34 Minutes | 0 (0.0%) | 2 (6.7%) |
| 35 to 39 Minutes | 0 (0.0%) | 1 (3.3%) |
| 40 to 44 Minutes | 0 (0.0%) | 0 (0.0%) |
| 45 to 59 Minutes | 2 (10.0%) | 0 (0.0%) |
| 60 to 89 Minutes | 3 (15.0%) | 2 (6.7%) |
| 90 or more Minutes | 0 (0.0%) | 0 (0.0%) |
Time of Departure to Work by Sex in Nelson
The most frequent times of departure to work in Nelson are 12:00 AM to 4:59 AM (7, 35.0%) for males and 12:00 PM to 3:59 PM (7, 23.3%) for females.
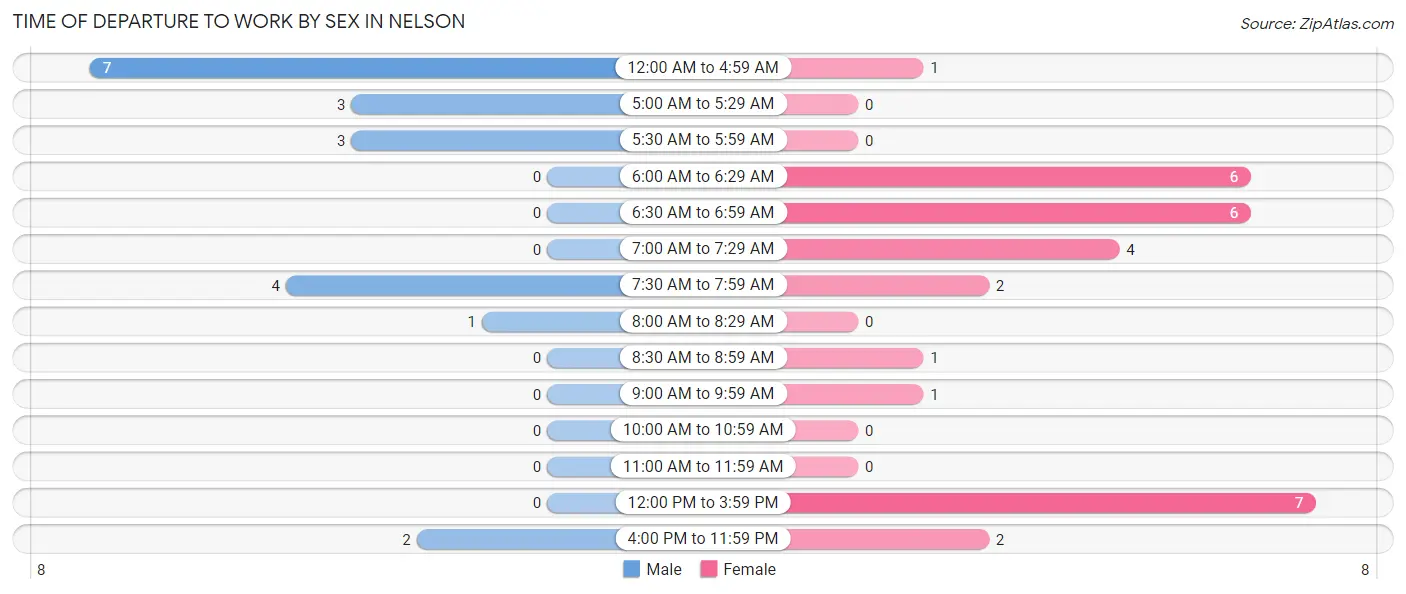
| Time of Departure | Male | Female |
| 12:00 AM to 4:59 AM | 7 (35.0%) | 1 (3.3%) |
| 5:00 AM to 5:29 AM | 3 (15.0%) | 0 (0.0%) |
| 5:30 AM to 5:59 AM | 3 (15.0%) | 0 (0.0%) |
| 6:00 AM to 6:29 AM | 0 (0.0%) | 6 (20.0%) |
| 6:30 AM to 6:59 AM | 0 (0.0%) | 6 (20.0%) |
| 7:00 AM to 7:29 AM | 0 (0.0%) | 4 (13.3%) |
| 7:30 AM to 7:59 AM | 4 (20.0%) | 2 (6.7%) |
| 8:00 AM to 8:29 AM | 1 (5.0%) | 0 (0.0%) |
| 8:30 AM to 8:59 AM | 0 (0.0%) | 1 (3.3%) |
| 9:00 AM to 9:59 AM | 0 (0.0%) | 1 (3.3%) |
| 10:00 AM to 10:59 AM | 0 (0.0%) | 0 (0.0%) |
| 11:00 AM to 11:59 AM | 0 (0.0%) | 0 (0.0%) |
| 12:00 PM to 3:59 PM | 0 (0.0%) | 7 (23.3%) |
| 4:00 PM to 11:59 PM | 2 (10.0%) | 2 (6.7%) |
| Total | 20 (100.0%) | 30 (100.0%) |
Housing Occupancy in Nelson
Occupancy by Ownership in Nelson
Of the total 60 dwellings in Nelson, owner-occupied units account for 43 (71.7%), while renter-occupied units make up 17 (28.3%).
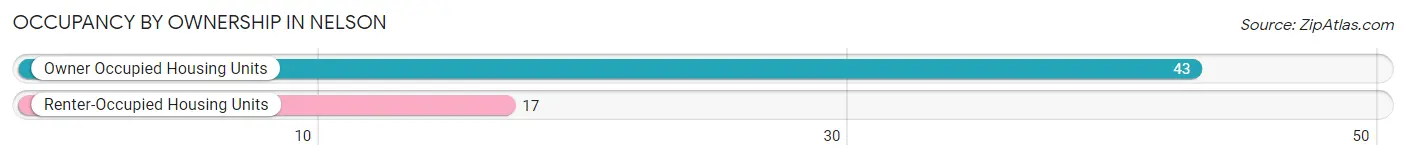
| Occupancy | # Housing Units | % Housing Units |
| Owner Occupied Housing Units | 43 | 71.7% |
| Renter-Occupied Housing Units | 17 | 28.3% |
| Total Occupied Housing Units | 60 | 100.0% |
Occupancy by Household Size in Nelson
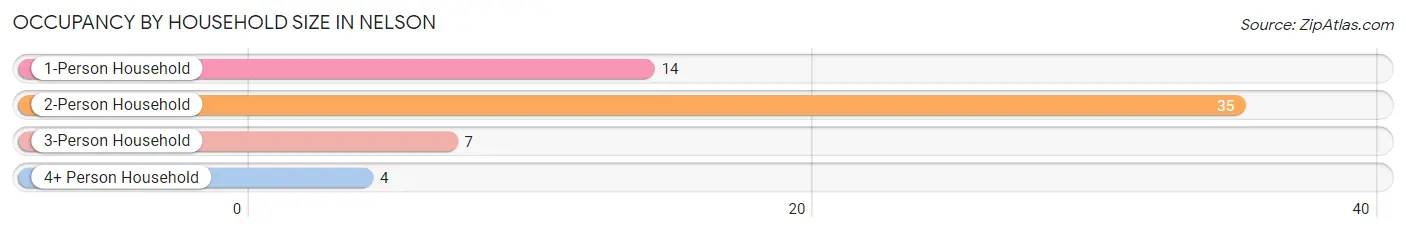
| Household Size | # Housing Units | % Housing Units |
| 1-Person Household | 14 | 23.3% |
| 2-Person Household | 35 | 58.3% |
| 3-Person Household | 7 | 11.7% |
| 4+ Person Household | 4 | 6.7% |
| Total Housing Units | 60 | 100.0% |
Occupancy by Ownership by Household Size in Nelson
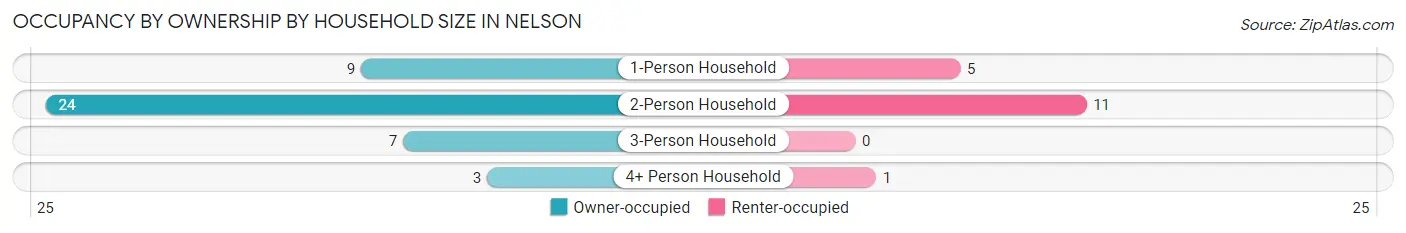
| Household Size | Owner-occupied | Renter-occupied |
| 1-Person Household | 9 (64.3%) | 5 (35.7%) |
| 2-Person Household | 24 (68.6%) | 11 (31.4%) |
| 3-Person Household | 7 (100.0%) | 0 (0.0%) |
| 4+ Person Household | 3 (75.0%) | 1 (25.0%) |
| Total Housing Units | 43 (71.7%) | 17 (28.3%) |
Occupancy by Educational Attainment in Nelson
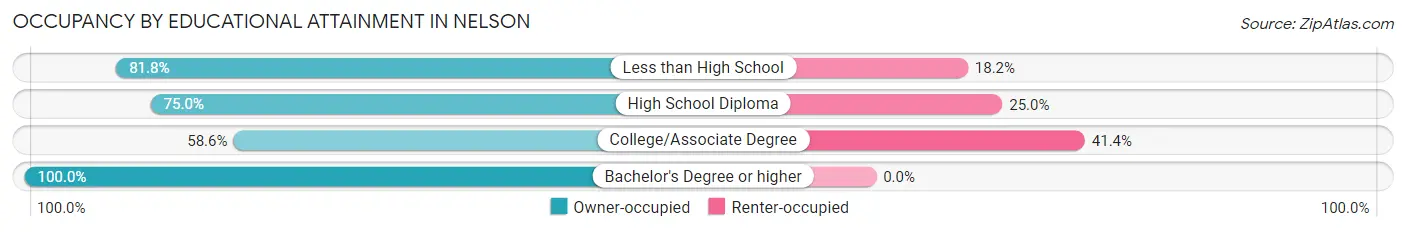
| Household Size | Owner-occupied | Renter-occupied |
| Less than High School | 9 (81.8%) | 2 (18.2%) |
| High School Diploma | 9 (75.0%) | 3 (25.0%) |
| College/Associate Degree | 17 (58.6%) | 12 (41.4%) |
| Bachelor's Degree or higher | 8 (100.0%) | 0 (0.0%) |
Occupancy by Age of Householder in Nelson
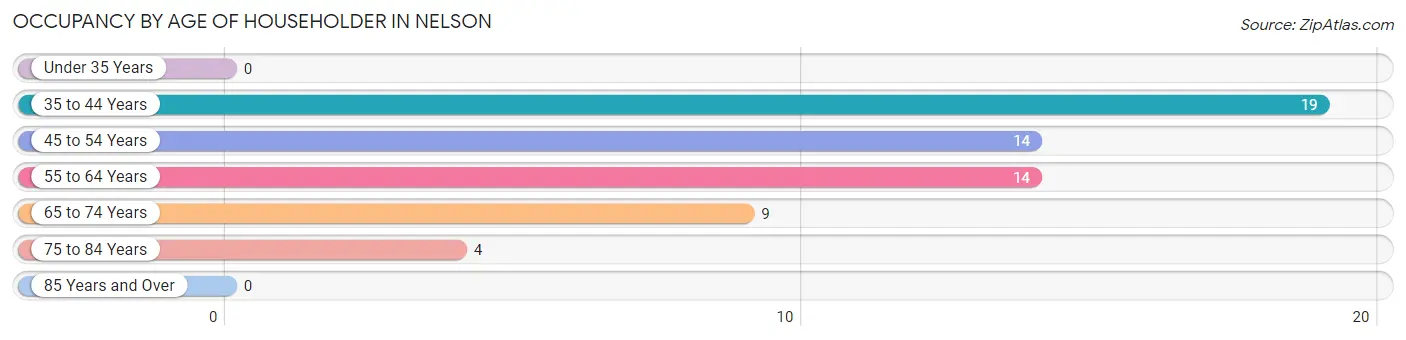
| Age Bracket | # Households | % Households |
| Under 35 Years | 0 | 0.0% |
| 35 to 44 Years | 19 | 31.7% |
| 45 to 54 Years | 14 | 23.3% |
| 55 to 64 Years | 14 | 23.3% |
| 65 to 74 Years | 9 | 15.0% |
| 75 to 84 Years | 4 | 6.7% |
| 85 Years and Over | 0 | 0.0% |
| Total | 60 | 100.0% |
Housing Finances in Nelson
Median Income by Occupancy in Nelson
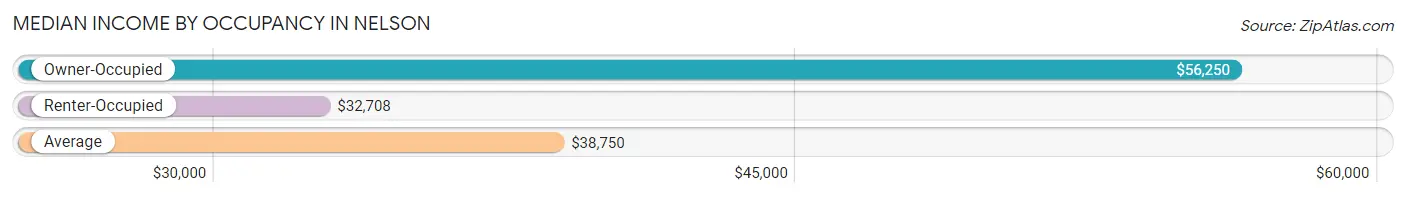
| Occupancy Type | # Households | Median Income |
| Owner-Occupied | 43 (71.7%) | $56,250 |
| Renter-Occupied | 17 (28.3%) | $32,708 |
| Average | 60 (100.0%) | $38,750 |
Occupancy by Householder Income Bracket in Nelson
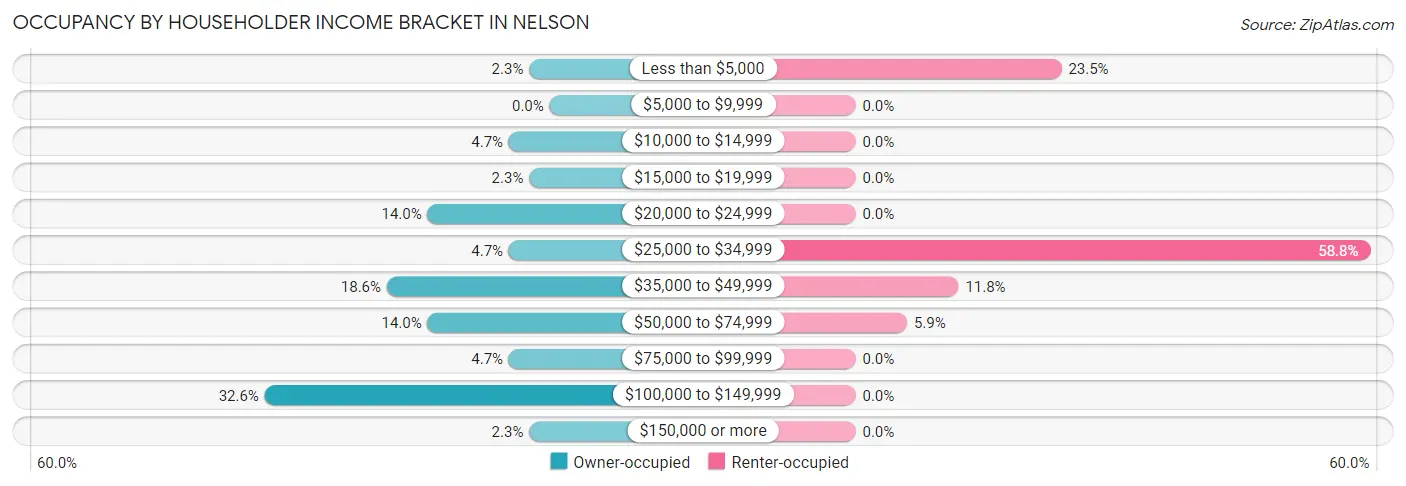
| Income Bracket | Owner-occupied | Renter-occupied |
| Less than $5,000 | 1 (2.3%) | 4 (23.5%) |
| $5,000 to $9,999 | 0 (0.0%) | 0 (0.0%) |
| $10,000 to $14,999 | 2 (4.6%) | 0 (0.0%) |
| $15,000 to $19,999 | 1 (2.3%) | 0 (0.0%) |
| $20,000 to $24,999 | 6 (14.0%) | 0 (0.0%) |
| $25,000 to $34,999 | 2 (4.6%) | 10 (58.8%) |
| $35,000 to $49,999 | 8 (18.6%) | 2 (11.8%) |
| $50,000 to $74,999 | 6 (14.0%) | 1 (5.9%) |
| $75,000 to $99,999 | 2 (4.6%) | 0 (0.0%) |
| $100,000 to $149,999 | 14 (32.6%) | 0 (0.0%) |
| $150,000 or more | 1 (2.3%) | 0 (0.0%) |
| Total | 43 (100.0%) | 17 (100.0%) |
Monthly Housing Cost Tiers in Nelson
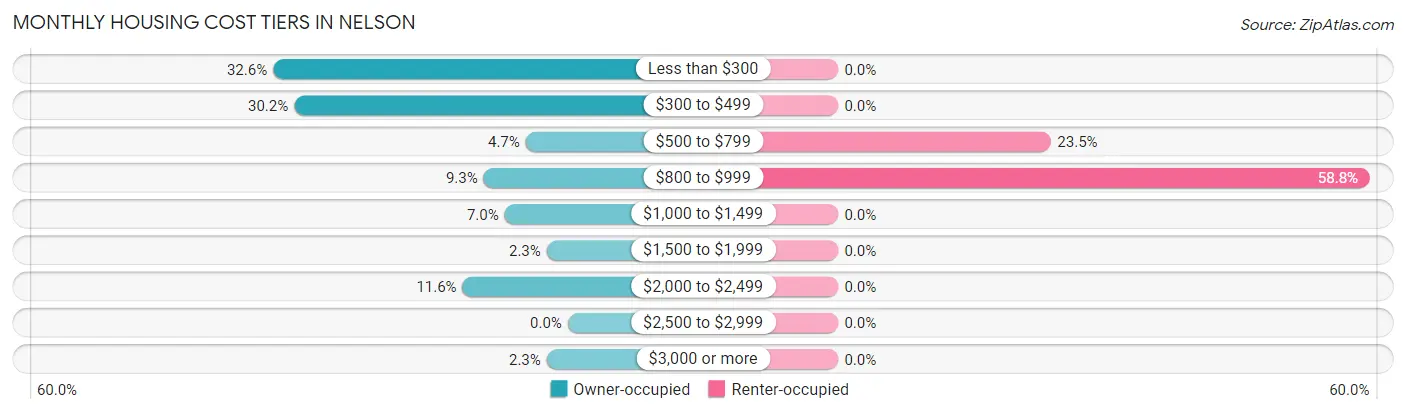
| Monthly Cost | Owner-occupied | Renter-occupied |
| Less than $300 | 14 (32.6%) | 0 (0.0%) |
| $300 to $499 | 13 (30.2%) | 0 (0.0%) |
| $500 to $799 | 2 (4.6%) | 4 (23.5%) |
| $800 to $999 | 4 (9.3%) | 10 (58.8%) |
| $1,000 to $1,499 | 3 (7.0%) | 0 (0.0%) |
| $1,500 to $1,999 | 1 (2.3%) | 0 (0.0%) |
| $2,000 to $2,499 | 5 (11.6%) | 0 (0.0%) |
| $2,500 to $2,999 | 0 (0.0%) | 0 (0.0%) |
| $3,000 or more | 1 (2.3%) | 0 (0.0%) |
| Total | 43 (100.0%) | 17 (100.0%) |
Physical Housing Characteristics in Nelson
Housing Structures in Nelson
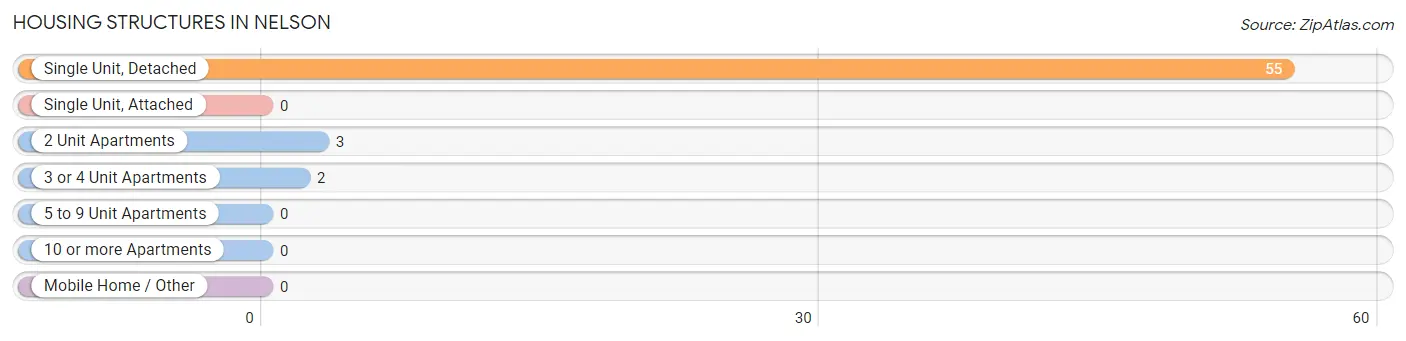
| Structure Type | # Housing Units | % Housing Units |
| Single Unit, Detached | 55 | 91.7% |
| Single Unit, Attached | 0 | 0.0% |
| 2 Unit Apartments | 3 | 5.0% |
| 3 or 4 Unit Apartments | 2 | 3.3% |
| 5 to 9 Unit Apartments | 0 | 0.0% |
| 10 or more Apartments | 0 | 0.0% |
| Mobile Home / Other | 0 | 0.0% |
| Total | 60 | 100.0% |
Housing Structures by Occupancy in Nelson
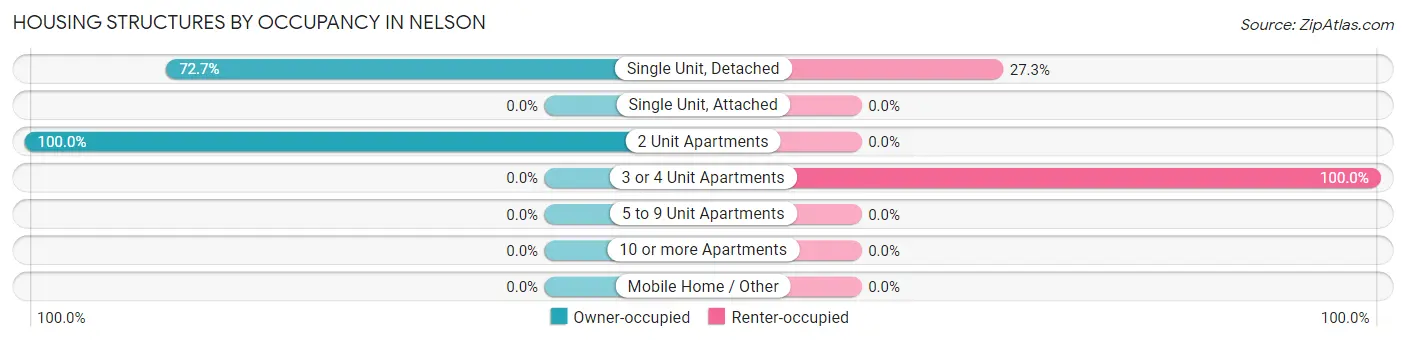
| Structure Type | Owner-occupied | Renter-occupied |
| Single Unit, Detached | 40 (72.7%) | 15 (27.3%) |
| Single Unit, Attached | 0 (0.0%) | 0 (0.0%) |
| 2 Unit Apartments | 3 (100.0%) | 0 (0.0%) |
| 3 or 4 Unit Apartments | 0 (0.0%) | 2 (100.0%) |
| 5 to 9 Unit Apartments | 0 (0.0%) | 0 (0.0%) |
| 10 or more Apartments | 0 (0.0%) | 0 (0.0%) |
| Mobile Home / Other | 0 (0.0%) | 0 (0.0%) |
| Total | 43 (71.7%) | 17 (28.3%) |
Housing Structures by Number of Rooms in Nelson
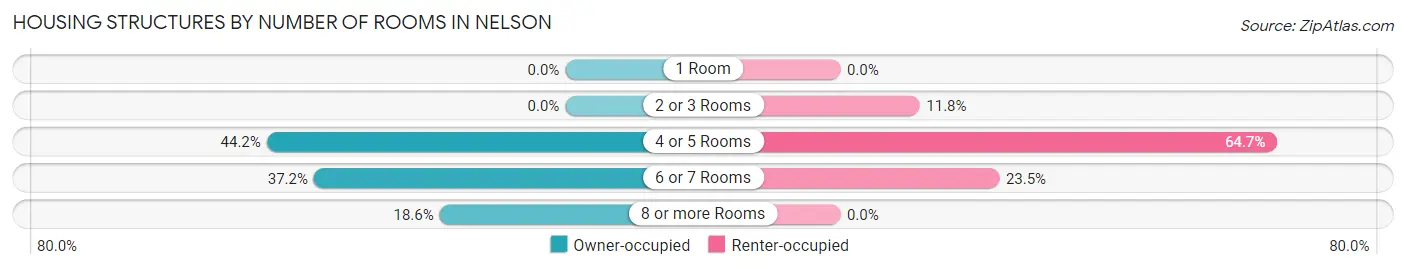
| Number of Rooms | Owner-occupied | Renter-occupied |
| 1 Room | 0 (0.0%) | 0 (0.0%) |
| 2 or 3 Rooms | 0 (0.0%) | 2 (11.8%) |
| 4 or 5 Rooms | 19 (44.2%) | 11 (64.7%) |
| 6 or 7 Rooms | 16 (37.2%) | 4 (23.5%) |
| 8 or more Rooms | 8 (18.6%) | 0 (0.0%) |
| Total | 43 (100.0%) | 17 (100.0%) |
Housing Structure by Heating Type in Nelson
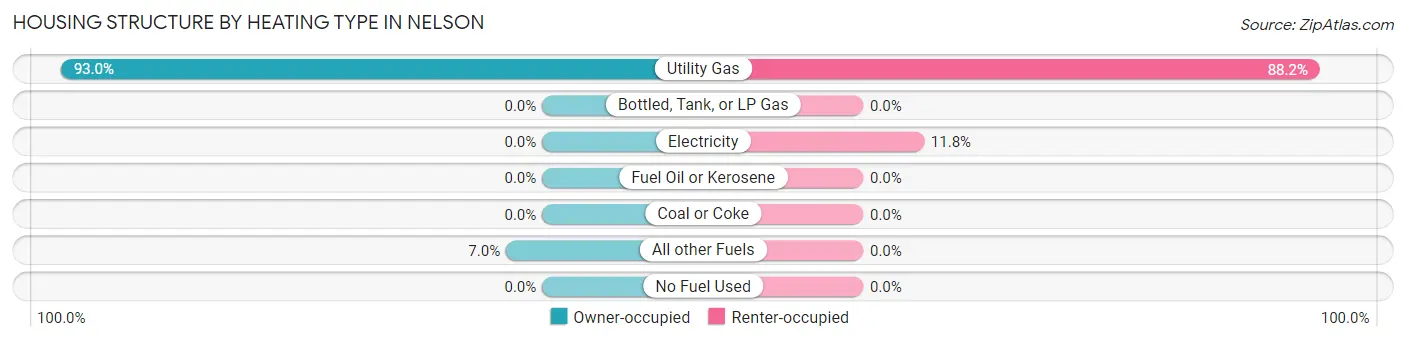
| Heating Type | Owner-occupied | Renter-occupied |
| Utility Gas | 40 (93.0%) | 15 (88.2%) |
| Bottled, Tank, or LP Gas | 0 (0.0%) | 0 (0.0%) |
| Electricity | 0 (0.0%) | 2 (11.8%) |
| Fuel Oil or Kerosene | 0 (0.0%) | 0 (0.0%) |
| Coal or Coke | 0 (0.0%) | 0 (0.0%) |
| All other Fuels | 3 (7.0%) | 0 (0.0%) |
| No Fuel Used | 0 (0.0%) | 0 (0.0%) |
| Total | 43 (100.0%) | 17 (100.0%) |
Household Vehicle Usage in Nelson
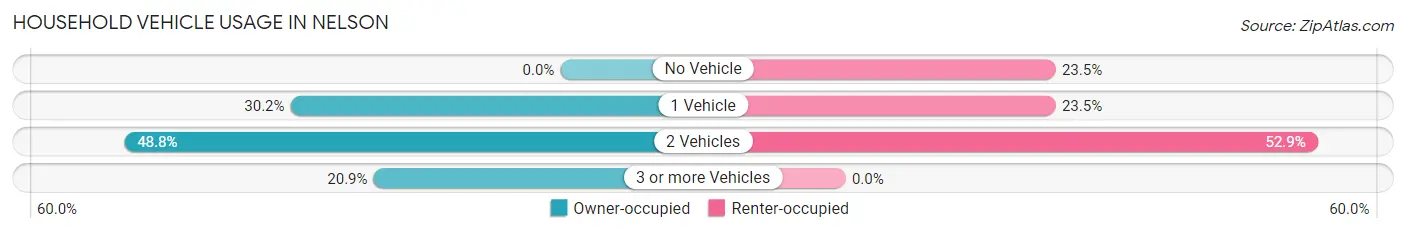
| Vehicles per Household | Owner-occupied | Renter-occupied |
| No Vehicle | 0 (0.0%) | 4 (23.5%) |
| 1 Vehicle | 13 (30.2%) | 4 (23.5%) |
| 2 Vehicles | 21 (48.8%) | 9 (52.9%) |
| 3 or more Vehicles | 9 (20.9%) | 0 (0.0%) |
| Total | 43 (100.0%) | 17 (100.0%) |
Real Estate & Mortgages in Nelson
Real Estate and Mortgage Overview in Nelson
| Characteristic | Without Mortgage | With Mortgage |
| Housing Units | 28 | 15 |
| Median Property Value | $70,000 | $0 |
| Median Household Income | $36,875 | $1 |
| Monthly Housing Costs | $300 | $0 |
| Real Estate Taxes | $1,063 | $0 |
Property Value by Mortgage Status in Nelson
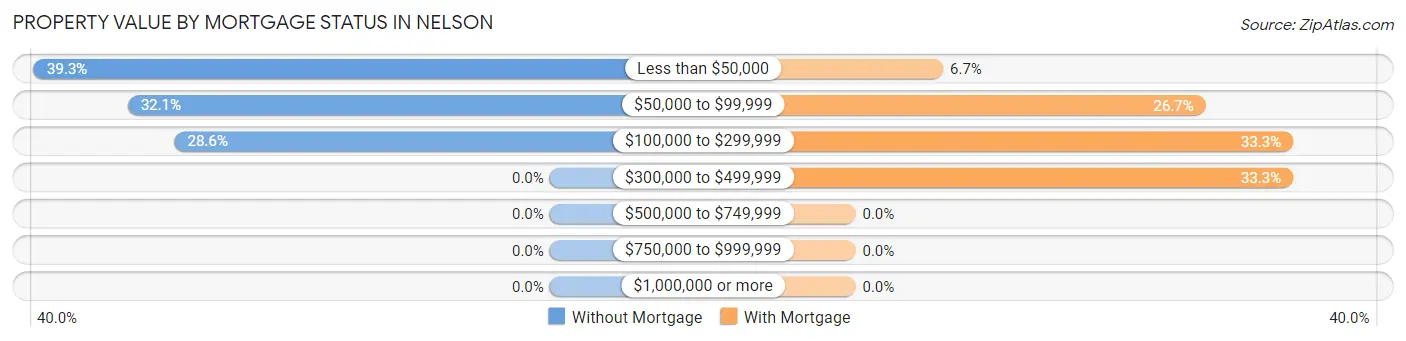
| Property Value | Without Mortgage | With Mortgage |
| Less than $50,000 | 11 (39.3%) | 1 (6.7%) |
| $50,000 to $99,999 | 9 (32.1%) | 4 (26.7%) |
| $100,000 to $299,999 | 8 (28.6%) | 5 (33.3%) |
| $300,000 to $499,999 | 0 (0.0%) | 5 (33.3%) |
| $500,000 to $749,999 | 0 (0.0%) | 0 (0.0%) |
| $750,000 to $999,999 | 0 (0.0%) | 0 (0.0%) |
| $1,000,000 or more | 0 (0.0%) | 0 (0.0%) |
| Total | 28 (100.0%) | 15 (100.0%) |
Household Income by Mortgage Status in Nelson
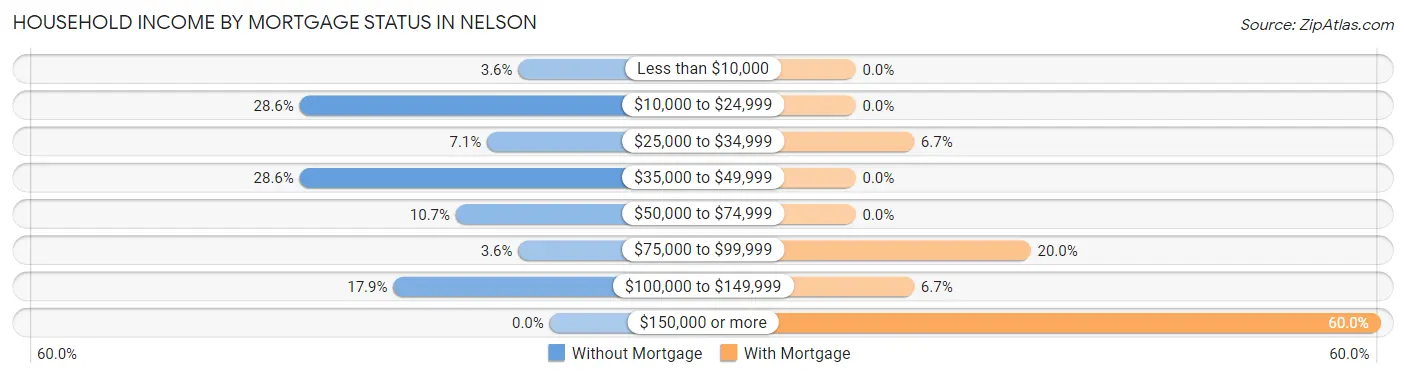
| Household Income | Without Mortgage | With Mortgage |
| Less than $10,000 | 1 (3.6%) | 0 (0.0%) |
| $10,000 to $24,999 | 8 (28.6%) | 0 (0.0%) |
| $25,000 to $34,999 | 2 (7.1%) | 1 (6.7%) |
| $35,000 to $49,999 | 8 (28.6%) | 0 (0.0%) |
| $50,000 to $74,999 | 3 (10.7%) | 0 (0.0%) |
| $75,000 to $99,999 | 1 (3.6%) | 3 (20.0%) |
| $100,000 to $149,999 | 5 (17.9%) | 1 (6.7%) |
| $150,000 or more | 0 (0.0%) | 9 (60.0%) |
| Total | 28 (100.0%) | 15 (100.0%) |
Property Value to Household Income Ratio in Nelson
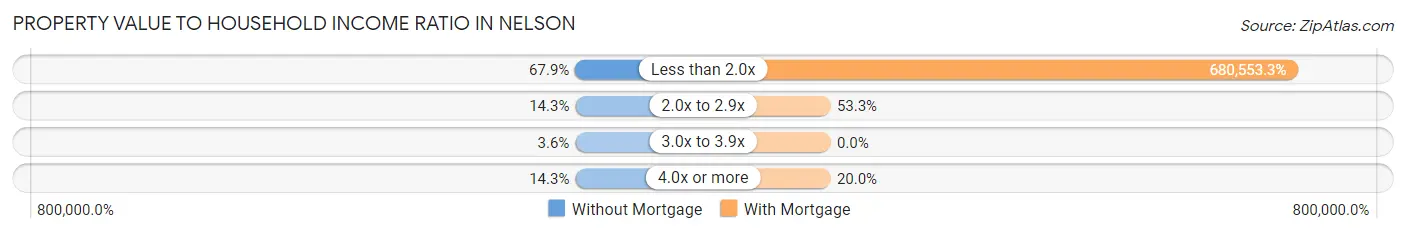
| Value-to-Income Ratio | Without Mortgage | With Mortgage |
| Less than 2.0x | 19 (67.9%) | 102,083 (680,553.3%) |
| 2.0x to 2.9x | 4 (14.3%) | 8 (53.3%) |
| 3.0x to 3.9x | 1 (3.6%) | 0 (0.0%) |
| 4.0x or more | 4 (14.3%) | 3 (20.0%) |
| Total | 28 (100.0%) | 15 (100.0%) |
Real Estate Taxes by Mortgage Status in Nelson
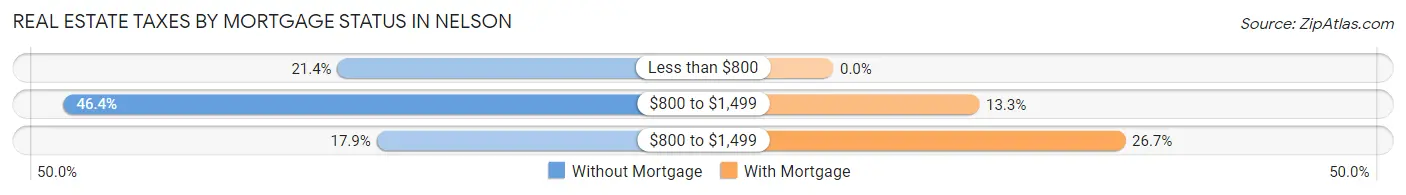
| Property Taxes | Without Mortgage | With Mortgage |
| Less than $800 | 6 (21.4%) | 0 (0.0%) |
| $800 to $1,499 | 13 (46.4%) | 2 (13.3%) |
| $800 to $1,499 | 5 (17.9%) | 4 (26.7%) |
| Total | 28 (100.0%) | 15 (100.0%) |
Health & Disability in Nelson
Health Insurance Coverage by Age in Nelson
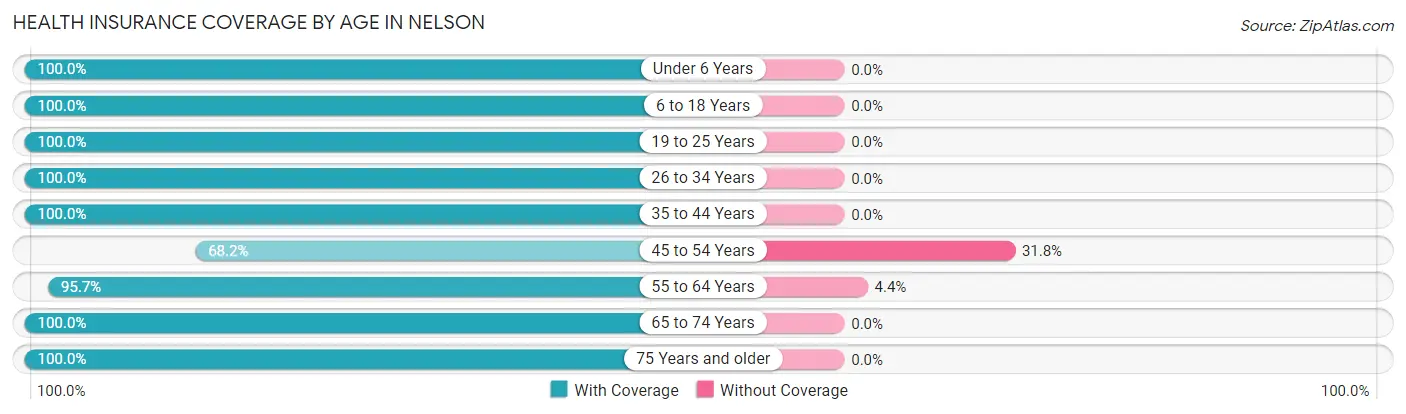
| Age Bracket | With Coverage | Without Coverage |
| Under 6 Years | 1 (100.0%) | 0 (0.0%) |
| 6 to 18 Years | 19 (100.0%) | 0 (0.0%) |
| 19 to 25 Years | 5 (100.0%) | 0 (0.0%) |
| 26 to 34 Years | 1 (100.0%) | 0 (0.0%) |
| 35 to 44 Years | 44 (100.0%) | 0 (0.0%) |
| 45 to 54 Years | 15 (68.2%) | 7 (31.8%) |
| 55 to 64 Years | 22 (95.7%) | 1 (4.3%) |
| 65 to 74 Years | 16 (100.0%) | 0 (0.0%) |
| 75 Years and older | 5 (100.0%) | 0 (0.0%) |
| Total | 128 (94.1%) | 8 (5.9%) |
Health Insurance Coverage by Citizenship Status in Nelson
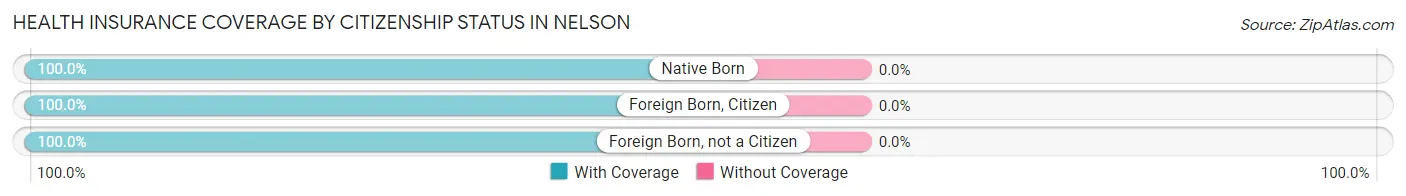
| Citizenship Status | With Coverage | Without Coverage |
| Native Born | 1 (100.0%) | 0 (0.0%) |
| Foreign Born, Citizen | 19 (100.0%) | 0 (0.0%) |
| Foreign Born, not a Citizen | 5 (100.0%) | 0 (0.0%) |
Health Insurance Coverage by Household Income in Nelson
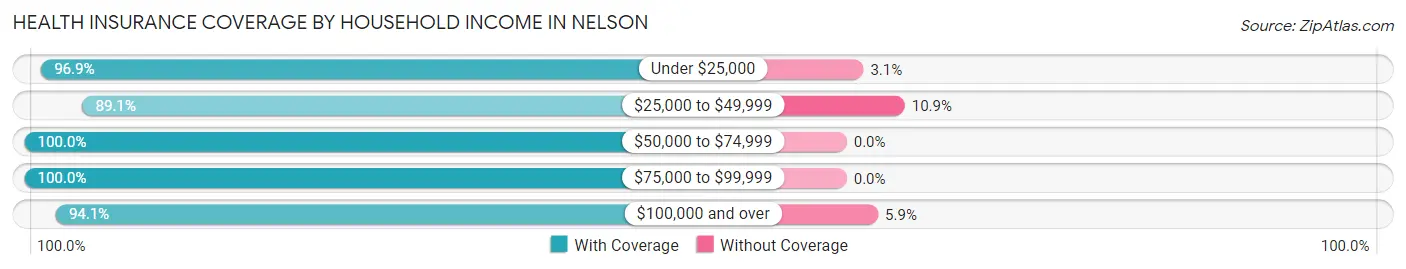
| Household Income | With Coverage | Without Coverage |
| Under $25,000 | 31 (96.9%) | 1 (3.1%) |
| $25,000 to $49,999 | 41 (89.1%) | 5 (10.9%) |
| $50,000 to $74,999 | 18 (100.0%) | 0 (0.0%) |
| $75,000 to $99,999 | 6 (100.0%) | 0 (0.0%) |
| $100,000 and over | 32 (94.1%) | 2 (5.9%) |
Public vs Private Health Insurance Coverage by Age in Nelson
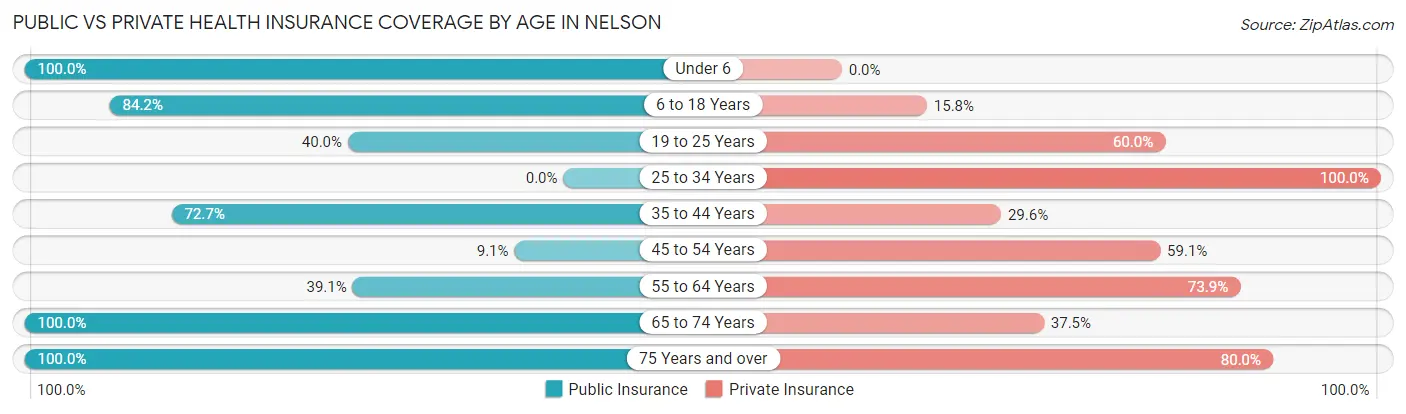
| Age Bracket | Public Insurance | Private Insurance |
| Under 6 | 1 (100.0%) | 0 (0.0%) |
| 6 to 18 Years | 16 (84.2%) | 3 (15.8%) |
| 19 to 25 Years | 2 (40.0%) | 3 (60.0%) |
| 25 to 34 Years | 0 (0.0%) | 1 (100.0%) |
| 35 to 44 Years | 32 (72.7%) | 13 (29.5%) |
| 45 to 54 Years | 2 (9.1%) | 13 (59.1%) |
| 55 to 64 Years | 9 (39.1%) | 17 (73.9%) |
| 65 to 74 Years | 16 (100.0%) | 6 (37.5%) |
| 75 Years and over | 5 (100.0%) | 4 (80.0%) |
| Total | 83 (61.0%) | 60 (44.1%) |
Disability Status by Sex by Age in Nelson
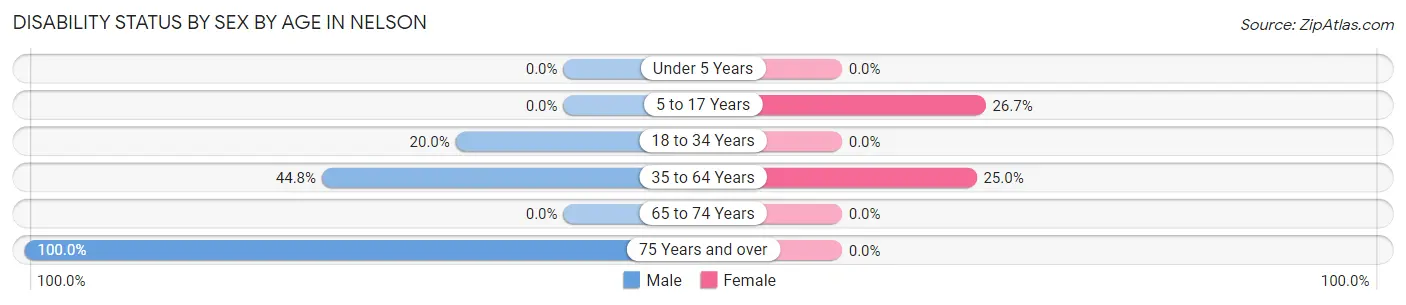
| Age Bracket | Male | Female |
| Under 5 Years | 0 (0.0%) | 0 (0.0%) |
| 5 to 17 Years | 0 (0.0%) | 4 (26.7%) |
| 18 to 34 Years | 1 (20.0%) | 0 (0.0%) |
| 35 to 64 Years | 13 (44.8%) | 15 (25.0%) |
| 65 to 74 Years | 0 (0.0%) | 0 (0.0%) |
| 75 Years and over | 3 (100.0%) | 0 (0.0%) |
Disability Class by Sex by Age in Nelson
Disability Class: Hearing Difficulty
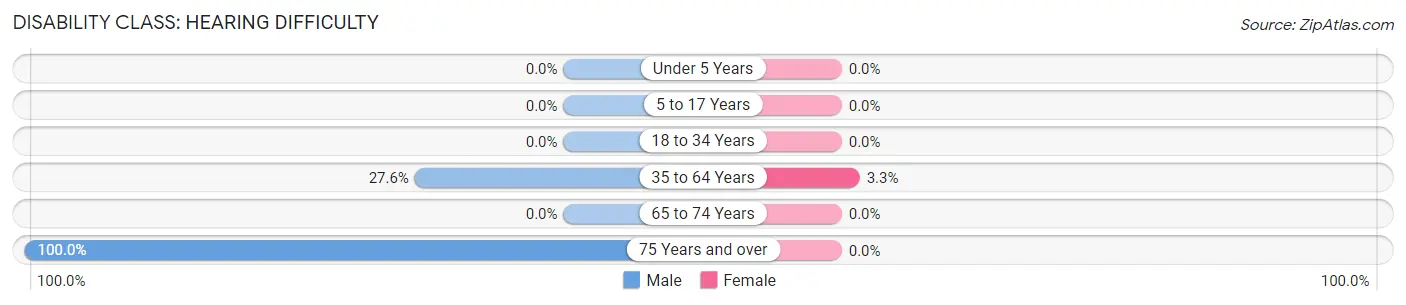
| Age Bracket | Male | Female |
| Under 5 Years | 0 (0.0%) | 0 (0.0%) |
| 5 to 17 Years | 0 (0.0%) | 0 (0.0%) |
| 18 to 34 Years | 0 (0.0%) | 0 (0.0%) |
| 35 to 64 Years | 8 (27.6%) | 2 (3.3%) |
| 65 to 74 Years | 0 (0.0%) | 0 (0.0%) |
| 75 Years and over | 3 (100.0%) | 0 (0.0%) |
Disability Class: Vision Difficulty
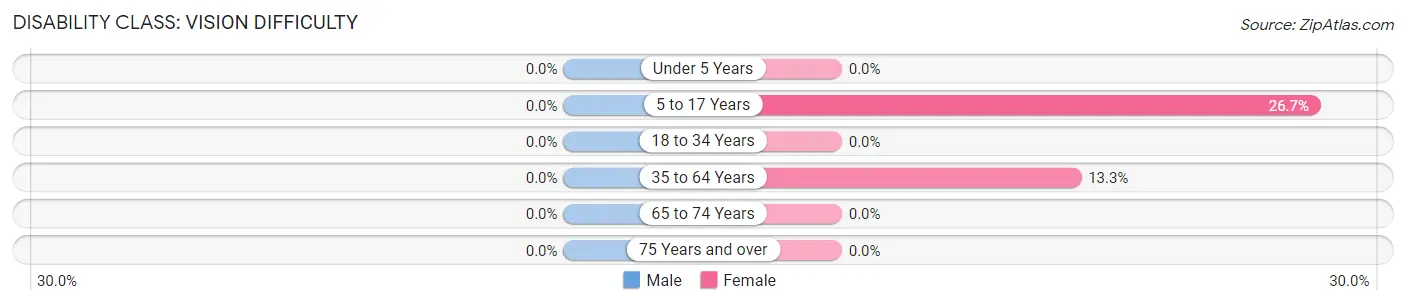
| Age Bracket | Male | Female |
| Under 5 Years | 0 (0.0%) | 0 (0.0%) |
| 5 to 17 Years | 0 (0.0%) | 4 (26.7%) |
| 18 to 34 Years | 0 (0.0%) | 0 (0.0%) |
| 35 to 64 Years | 0 (0.0%) | 8 (13.3%) |
| 65 to 74 Years | 0 (0.0%) | 0 (0.0%) |
| 75 Years and over | 0 (0.0%) | 0 (0.0%) |
Disability Class: Cognitive Difficulty
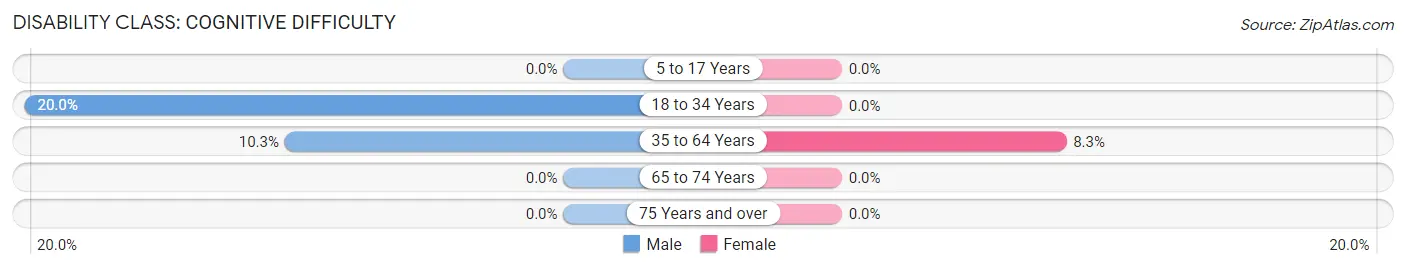
| Age Bracket | Male | Female |
| 5 to 17 Years | 0 (0.0%) | 0 (0.0%) |
| 18 to 34 Years | 1 (20.0%) | 0 (0.0%) |
| 35 to 64 Years | 3 (10.3%) | 5 (8.3%) |
| 65 to 74 Years | 0 (0.0%) | 0 (0.0%) |
| 75 Years and over | 0 (0.0%) | 0 (0.0%) |
Disability Class: Ambulatory Difficulty
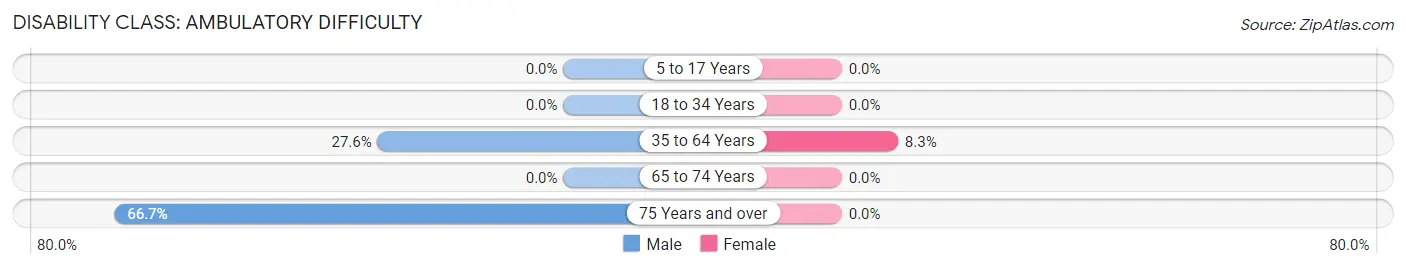
| Age Bracket | Male | Female |
| 5 to 17 Years | 0 (0.0%) | 0 (0.0%) |
| 18 to 34 Years | 0 (0.0%) | 0 (0.0%) |
| 35 to 64 Years | 8 (27.6%) | 5 (8.3%) |
| 65 to 74 Years | 0 (0.0%) | 0 (0.0%) |
| 75 Years and over | 2 (66.7%) | 0 (0.0%) |
Disability Class: Self-Care Difficulty
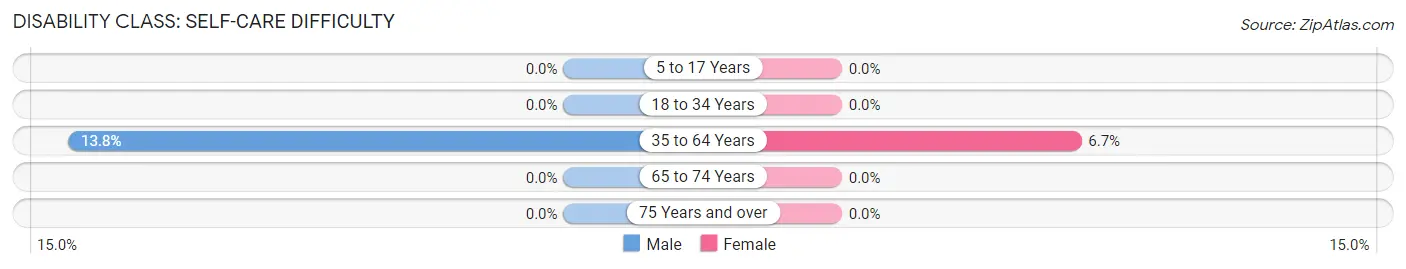
| Age Bracket | Male | Female |
| 5 to 17 Years | 0 (0.0%) | 0 (0.0%) |
| 18 to 34 Years | 0 (0.0%) | 0 (0.0%) |
| 35 to 64 Years | 4 (13.8%) | 4 (6.7%) |
| 65 to 74 Years | 0 (0.0%) | 0 (0.0%) |
| 75 Years and over | 0 (0.0%) | 0 (0.0%) |
Technology Access in Nelson
Computing Device Access in Nelson
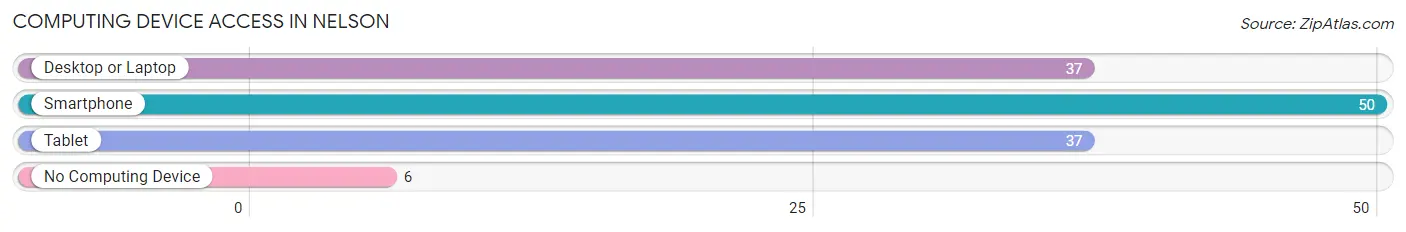
| Device Type | # Households | % Households |
| Desktop or Laptop | 37 | 61.7% |
| Smartphone | 50 | 83.3% |
| Tablet | 37 | 61.7% |
| No Computing Device | 6 | 10.0% |
| Total | 60 | 100.0% |
Internet Access in Nelson
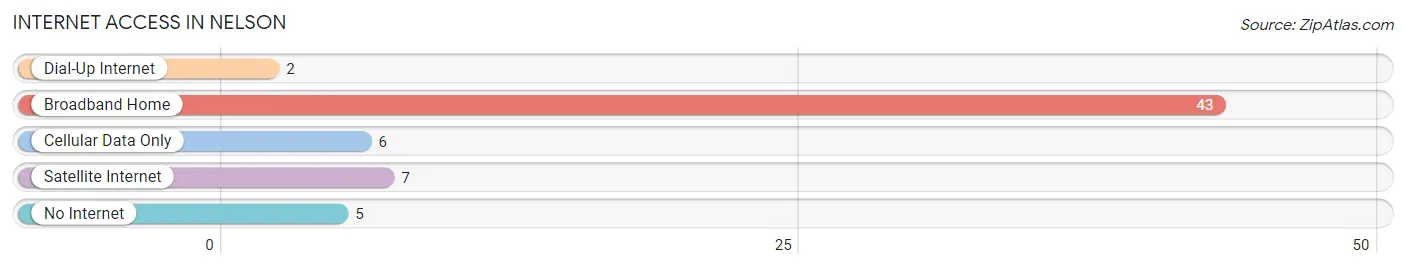
| Internet Type | # Households | % Households |
| Dial-Up Internet | 2 | 3.3% |
| Broadband Home | 43 | 71.7% |
| Cellular Data Only | 6 | 10.0% |
| Satellite Internet | 7 | 11.7% |
| No Internet | 5 | 8.3% |
| Total | 60 | 100.0% |
Nelson Summary
Nelson is a small village located in the state of Illinois, in the United States. It is located in the county of Iroquois, and is part of the Kankakee-Iroquois Regional Planning Commission. The village has a population of approximately 500 people, and is located about 30 miles south of Chicago.
History
Nelson was founded in 1854 by a group of settlers from New York. The village was named after Nelson, New York, the hometown of the settlers. The settlers were attracted to the area due to its fertile soil and abundant natural resources. The village was incorporated in 1858, and the first post office was established in 1859.
In the late 19th century, Nelson was a thriving agricultural community. The village was home to several grain elevators, a flour mill, and a creamery. The village also had a blacksmith shop, a general store, and a hotel.
In the early 20th century, Nelson began to experience a decline in population as many of its residents moved away to larger cities. The village was also affected by the Great Depression, and many of its businesses closed.
Geography
Nelson is located in the eastern part of Iroquois County, in the state of Illinois. The village is situated on the banks of the Iroquois River, and is surrounded by rolling hills and farmland. The village is located about 30 miles south of Chicago, and is accessible via Interstate 57.
The climate in Nelson is typical of the Midwest, with hot summers and cold winters. The average temperature in the summer is around 75 degrees Fahrenheit, and the average temperature in the winter is around 25 degrees Fahrenheit.
Economy
Nelson’s economy is largely based on agriculture. The village is home to several grain elevators, and the surrounding area is used for growing corn, soybeans, and wheat. The village also has a few small businesses, including a general store, a gas station, and a restaurant.
Demographics
As of the 2010 census, the population of Nelson was 498 people. The racial makeup of the village was 97.2% White, 0.2% African American, 0.2% Native American, 0.4% Asian, 0.2% from other races, and 1.9% from two or more races. The median household income in Nelson was $45,000, and the median family income was $50,000. The per capita income in the village was $20,000.
Common Questions
What is Per Capita Income in Nelson?
Per Capita income in Nelson is $27,261.
What is the Median Family Income in Nelson?
Median Family Income in Nelson is $43,750.
What is the Median Household income in Nelson?
Median Household Income in Nelson is $38,750.
What is Inequality or Gini Index in Nelson?
Inequality or Gini Index in Nelson is 0.41.
What is the Total Population of Nelson?
Total Population of Nelson is 136.
What is the Total Male Population of Nelson?
Total Male Population of Nelson is 44.
What is the Total Female Population of Nelson?
Total Female Population of Nelson is 92.
What is the Ratio of Males per 100 Females in Nelson?
There are 47.83 Males per 100 Females in Nelson.
What is the Ratio of Females per 100 Males in Nelson?
There are 209.09 Females per 100 Males in Nelson.
What is the Median Population Age in Nelson?
Median Population Age in Nelson is 41.5 Years.
What is the Average Family Size in Nelson
Average Family Size in Nelson is 2.6 People.
What is the Average Household Size in Nelson
Average Household Size in Nelson is 2.3 People.
How Large is the Labor Force in Nelson?
There are 58 People in the Labor Forcein in Nelson.
What is the Percentage of People in the Labor Force in Nelson?
46.0% of People are in the Labor Force in Nelson.
What is the Unemployment Rate in Nelson?
Unemployment Rate in Nelson is 3.4%.