Zip Codes with the Highest Percentage of Families with Income Above $100,000 in Philadelphia, PA
RELATED REPORTS & OPTIONS
Family Income | $100k+
Philadelphia
Compare Zip Codes
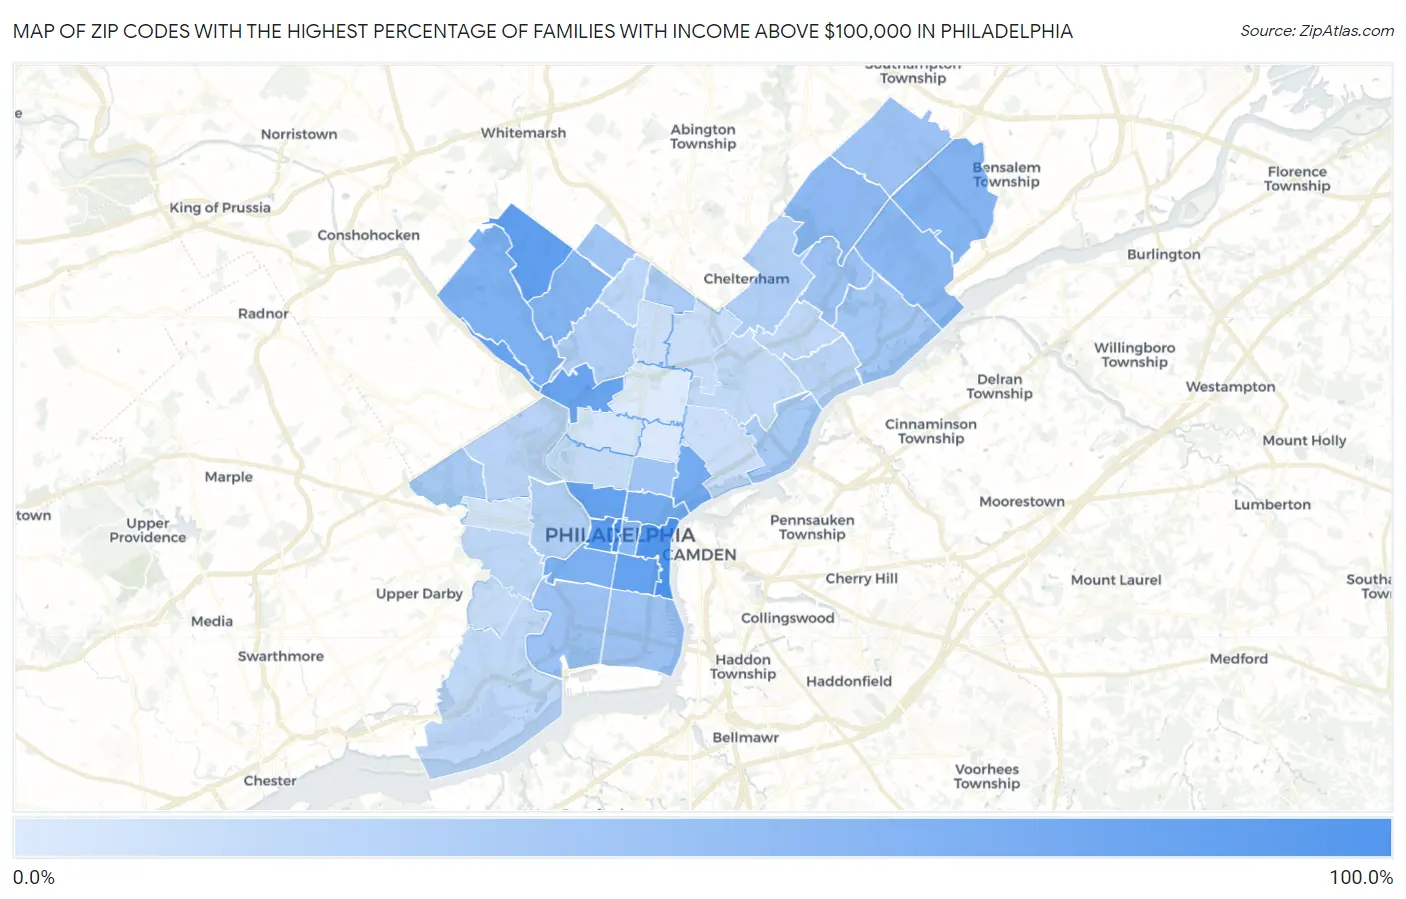
Map of Zip Codes with the Highest Percentage of Families with Income Above $100,000 in Philadelphia
9.1%
89.4%
Zip Codes with the Highest Percentage of Families with Income Above $100,000 in Philadelphia, PA
| Zip Code | Families with Income > $100k | vs State | vs National | |
| 1. | 19102 | 89.4% | 46.6%(+42.8)#28 | 46.1%(+43.3)#381 |
| 2. | 19106 | 81.1% | 46.6%(+34.5)#48 | 46.1%(+35.0)#907 |
| 3. | 19103 | 76.2% | 46.6%(+29.6)#86 | 46.1%(+30.1)#1,524 |
| 4. | 19118 | 72.9% | 46.6%(+26.3)#111 | 46.1%(+26.8)#2,059 |
| 5. | 19130 | 69.9% | 46.6%(+23.3)#138 | 46.1%(+23.8)#2,619 |
| 6. | 19147 | 69.4% | 46.6%(+22.8)#145 | 46.1%(+23.3)#2,734 |
| 7. | 19127 | 68.5% | 46.6%(+21.9)#153 | 46.1%(+22.4)#2,925 |
| 8. | 19129 | 66.1% | 46.6%(+19.5)#177 | 46.1%(+20.0)#3,470 |
| 9. | 19108 | 65.5% | 46.6%(+18.9)#186 | 46.1%(+19.4)#3,624 |
| 10. | 19125 | 60.2% | 46.6%(+13.6)#260 | 46.1%(+14.1)#5,068 |
| 11. | 19123 | 59.7% | 46.6%(+13.1)#268 | 46.1%(+13.6)#5,225 |
| 12. | 19146 | 55.6% | 46.6%(+9.00)#337 | 46.1%(+9.50)#6,585 |
| 13. | 19128 | 54.6% | 46.6%(+8.00)#351 | 46.1%(+8.50)#6,935 |
| 14. | 19119 | 52.1% | 46.6%(+5.50)#405 | 46.1%(+6.00)#7,928 |
| 15. | 19154 | 51.8% | 46.6%(+5.20)#418 | 46.1%(+5.70)#8,054 |
| 16. | 19107 | 48.4% | 46.6%(+1.80)#509 | 46.1%(+2.30)#9,559 |
| 17. | 19114 | 47.9% | 46.6%(+1.30)#526 | 46.1%(+1.80)#9,802 |
| 18. | 19115 | 47.2% | 46.6%(+0.600)#550 | 46.1%(+1.10)#10,183 |
| 19. | 19145 | 39.6% | 46.6%(-7.00)#812 | 46.1%(-6.50)#14,665 |
| 20. | 19116 | 39.6% | 46.6%(-7.00)#813 | 46.1%(-6.50)#14,667 |
| 21. | 19148 | 39.0% | 46.6%(-7.60)#841 | 46.1%(-7.10)#15,060 |
| 22. | 19152 | 38.5% | 46.6%(-8.10)#865 | 46.1%(-7.60)#15,394 |
| 23. | 19150 | 36.4% | 46.6%(-10.2)#954 | 46.1%(-9.70)#16,884 |
| 24. | 19122 | 35.8% | 46.6%(-10.8)#980 | 46.1%(-10.3)#17,339 |
| 25. | 19136 | 34.5% | 46.6%(-12.1)#1,046 | 46.1%(-11.6)#18,232 |
| 26. | 19151 | 32.6% | 46.6%(-14.0)#1,129 | 46.1%(-13.5)#19,586 |
| 27. | 19137 | 32.4% | 46.6%(-14.2)#1,139 | 46.1%(-13.7)#19,747 |
| 28. | 19126 | 31.0% | 46.6%(-15.6)#1,198 | 46.1%(-15.1)#20,718 |
| 29. | 19144 | 29.7% | 46.6%(-16.9)#1,246 | 46.1%(-16.4)#21,617 |
| 30. | 19111 | 29.6% | 46.6%(-17.0)#1,249 | 46.1%(-16.5)#21,696 |
| 31. | 19104 | 28.7% | 46.6%(-17.9)#1,295 | 46.1%(-17.4)#22,300 |
| 32. | 19135 | 25.0% | 46.6%(-21.6)#1,414 | 46.1%(-21.1)#24,698 |
| 33. | 19131 | 24.6% | 46.6%(-22.0)#1,429 | 46.1%(-21.5)#24,932 |
| 34. | 19143 | 22.6% | 46.6%(-24.0)#1,479 | 46.1%(-23.5)#26,003 |
| 35. | 19138 | 22.5% | 46.6%(-24.1)#1,481 | 46.1%(-23.6)#26,051 |
| 36. | 19149 | 22.2% | 46.6%(-24.4)#1,488 | 46.1%(-23.9)#26,182 |
| 37. | 19153 | 21.9% | 46.6%(-24.7)#1,496 | 46.1%(-24.2)#26,348 |
| 38. | 19124 | 21.1% | 46.6%(-25.5)#1,518 | 46.1%(-25.0)#26,749 |
| 39. | 19121 | 18.7% | 46.6%(-27.9)#1,566 | 46.1%(-27.4)#27,817 |
| 40. | 19142 | 18.3% | 46.6%(-28.3)#1,569 | 46.1%(-27.8)#27,959 |
| 41. | 19120 | 17.7% | 46.6%(-28.9)#1,587 | 46.1%(-28.4)#28,183 |
| 42. | 19134 | 17.0% | 46.6%(-29.6)#1,603 | 46.1%(-29.1)#28,429 |
| 43. | 19141 | 15.9% | 46.6%(-30.7)#1,621 | 46.1%(-30.2)#28,802 |
| 44. | 19139 | 13.6% | 46.6%(-33.0)#1,653 | 46.1%(-32.5)#29,495 |
| 45. | 19132 | 12.9% | 46.6%(-33.7)#1,662 | 46.1%(-33.2)#29,724 |
| 46. | 19133 | 10.0% | 46.6%(-36.6)#1,683 | 46.1%(-36.1)#30,318 |
| 47. | 19140 | 9.1% | 46.6%(-37.5)#1,691 | 46.1%(-37.0)#30,469 |
1
Common Questions
What are the Top 10 Zip Codes with the Highest Percentage of Families with Income Above $100,000 in Philadelphia, PA?
Top 10 Zip Codes with the Highest Percentage of Families with Income Above $100,000 in Philadelphia, PA are:
What zip code has the Highest Percentage of Families with Income Above $100,000 in Philadelphia, PA?
19102 has the Highest Percentage of Families with Income Above $100,000 in Philadelphia, PA with 89.4%.
What is the Percentage of Families with Income Above $100,000 in Philadelphia, PA?
Percentage of Families with Income Above $100,000 in Philadelphia is 33.2%.
What is the Percentage of Families with Income Above $100,000 in Pennsylvania?
Percentage of Families with Income Above $100,000 in Pennsylvania is 46.6%.
What is the Percentage of Families with Income Above $100,000 in the United States?
Percentage of Families with Income Above $100,000 in the United States is 46.1%.