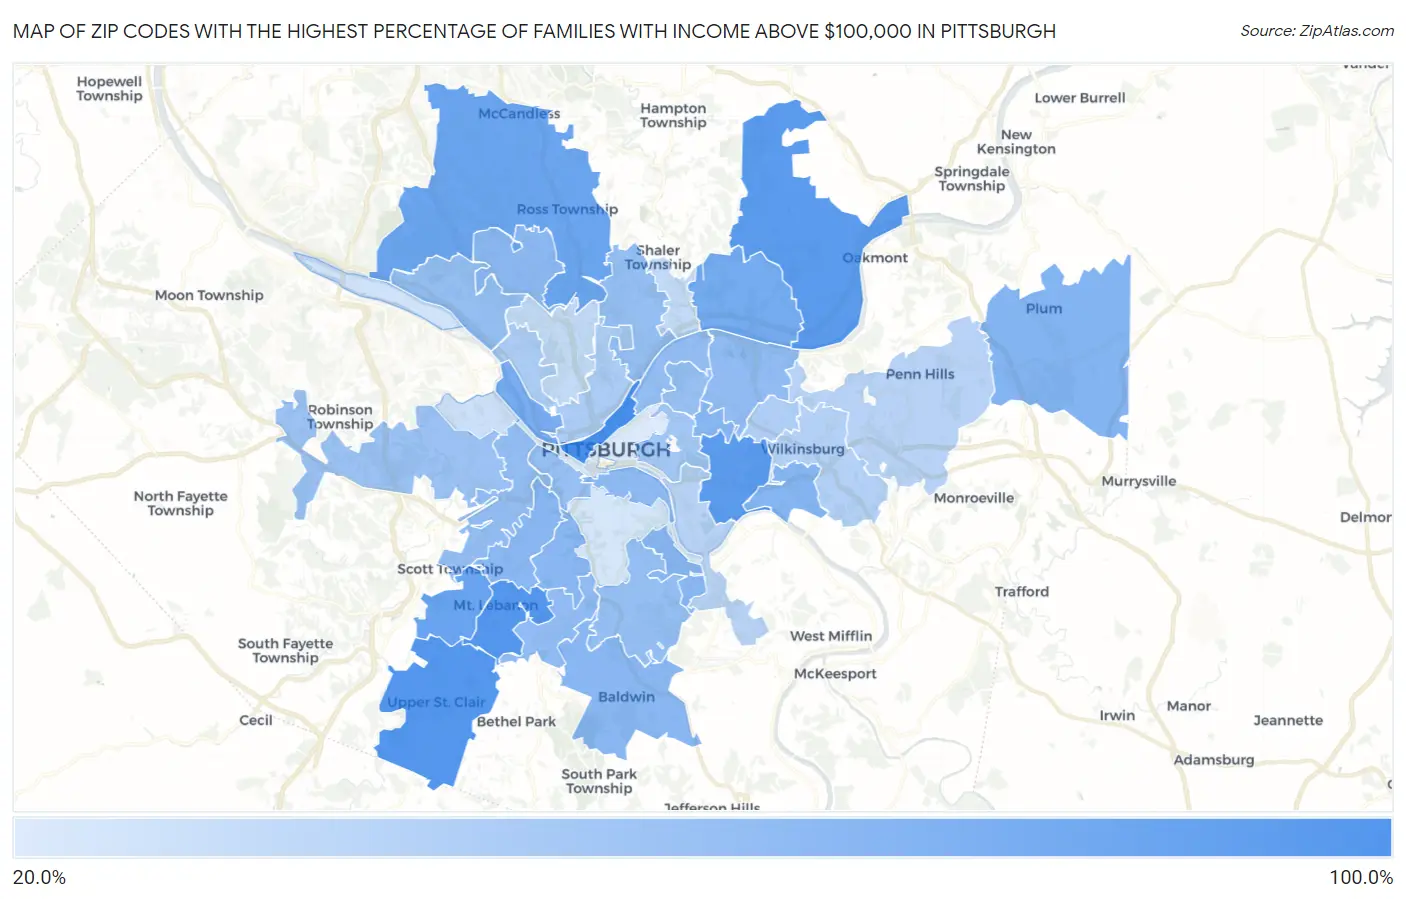
Zip Codes with the Highest Percentage of Families with Income Above $100,000 in Pittsburgh, PA
RELATED REPORTS & OPTIONS
Family Income | $100k+
Pittsburgh
Compare Zip Codes
Map of Zip Codes with the Highest Percentage of Families with Income Above $100,000 in Pittsburgh
20.5%
84.7%
Zip Codes with the Highest Percentage of Families with Income Above $100,000 in Pittsburgh, PA
| Zip Code | Families with Income > $100k | vs State | vs National | |
| 1. | 15222 | 84.7% | 46.6%(+38.1)#39 | 46.1%(+38.6)#612 |
| 2. | 15241 | 77.6% | 46.6%(+31.0)#69 | 46.1%(+31.5)#1,321 |
| 3. | 15228 | 77.1% | 46.6%(+30.5)#78 | 46.1%(+31.0)#1,390 |
| 4. | 15238 | 75.1% | 46.6%(+28.5)#92 | 46.1%(+29.0)#1,690 |
| 5. | 15217 | 74.3% | 46.6%(+27.7)#96 | 46.1%(+28.2)#1,816 |
| 6. | 15243 | 67.2% | 46.6%(+20.6)#161 | 46.1%(+21.1)#3,203 |
| 7. | 15237 | 66.7% | 46.6%(+20.1)#167 | 46.1%(+20.6)#3,293 |
| 8. | 15215 | 62.3% | 46.6%(+15.7)#232 | 46.1%(+16.2)#4,474 |
| 9. | 15233 | 59.9% | 46.6%(+13.3)#265 | 46.1%(+13.8)#5,177 |
| 10. | 15239 | 55.2% | 46.6%(+8.60)#342 | 46.1%(+9.10)#6,723 |
| 11. | 15218 | 54.8% | 46.6%(+8.20)#349 | 46.1%(+8.70)#6,879 |
| 12. | 15232 | 53.2% | 46.6%(+6.60)#376 | 46.1%(+7.10)#7,467 |
| 13. | 15236 | 52.7% | 46.6%(+6.10)#387 | 46.1%(+6.60)#7,652 |
| 14. | 15226 | 52.6% | 46.6%(+6.00)#391 | 46.1%(+6.50)#7,708 |
| 15. | 15216 | 52.4% | 46.6%(+5.80)#400 | 46.1%(+6.30)#7,799 |
| 16. | 15229 | 52.0% | 46.6%(+5.40)#411 | 46.1%(+5.90)#7,987 |
| 17. | 15203 | 51.0% | 46.6%(+4.40)#437 | 46.1%(+4.90)#8,413 |
| 18. | 15206 | 50.1% | 46.6%(+3.50)#454 | 46.1%(+4.00)#8,761 |
| 19. | 15234 | 49.7% | 46.6%(+3.10)#469 | 46.1%(+3.60)#8,981 |
| 20. | 15220 | 49.0% | 46.6%(+2.40)#485 | 46.1%(+2.90)#9,262 |
| 21. | 15201 | 48.7% | 46.6%(+2.10)#496 | 46.1%(+2.60)#9,410 |
| 22. | 15202 | 47.8% | 46.6%(+1.20)#529 | 46.1%(+1.70)#9,853 |
| 23. | 15209 | 47.8% | 46.6%(+1.20)#531 | 46.1%(+1.70)#9,863 |
| 24. | 15227 | 47.3% | 46.6%(+0.700)#548 | 46.1%(+1.20)#10,128 |
| 25. | 15211 | 46.9% | 46.6%(+0.300)#558 | 46.1%(+0.800)#10,349 |
| 26. | 15224 | 46.5% | 46.6%(-0.100)#573 | 46.1%(+0.400)#10,561 |
| 27. | 15205 | 45.1% | 46.6%(-1.50)#614 | 46.1%(-1.00)#11,279 |
| 28. | 15213 | 41.9% | 46.6%(-4.70)#735 | 46.1%(-4.20)#13,158 |
| 29. | 15212 | 38.5% | 46.6%(-8.10)#866 | 46.1%(-7.60)#15,396 |
| 30. | 15208 | 37.8% | 46.6%(-8.80)#894 | 46.1%(-8.30)#15,902 |
| 31. | 15221 | 35.5% | 46.6%(-11.1)#990 | 46.1%(-10.6)#17,533 |
| 32. | 15207 | 33.7% | 46.6%(-12.9)#1,080 | 46.1%(-12.4)#18,785 |
| 33. | 15235 | 33.5% | 46.6%(-13.1)#1,092 | 46.1%(-12.6)#18,911 |
| 34. | 15214 | 29.8% | 46.6%(-16.8)#1,243 | 46.1%(-16.3)#21,555 |
| 35. | 15223 | 29.3% | 46.6%(-17.3)#1,271 | 46.1%(-16.8)#21,917 |
| 36. | 15204 | 26.1% | 46.6%(-20.5)#1,382 | 46.1%(-20.0)#24,025 |
| 37. | 15225 | 24.4% | 46.6%(-22.2)#1,438 | 46.1%(-21.7)#25,097 |
| 38. | 15210 | 23.3% | 46.6%(-23.3)#1,463 | 46.1%(-22.8)#25,650 |
| 39. | 15219 | 20.5% | 46.6%(-26.1)#1,531 | 46.1%(-25.6)#27,013 |
1
Common Questions
What are the Top 10 Zip Codes with the Highest Percentage of Families with Income Above $100,000 in Pittsburgh, PA?
Top 10 Zip Codes with the Highest Percentage of Families with Income Above $100,000 in Pittsburgh, PA are:
What zip code has the Highest Percentage of Families with Income Above $100,000 in Pittsburgh, PA?
15222 has the Highest Percentage of Families with Income Above $100,000 in Pittsburgh, PA with 84.7%.
What is the Percentage of Families with Income Above $100,000 in Pittsburgh, PA?
Percentage of Families with Income Above $100,000 in Pittsburgh is 42.9%.
What is the Percentage of Families with Income Above $100,000 in Pennsylvania?
Percentage of Families with Income Above $100,000 in Pennsylvania is 46.6%.
What is the Percentage of Families with Income Above $100,000 in the United States?
Percentage of Families with Income Above $100,000 in the United States is 46.1%.