Zip Codes with the Highest Percentage of Families with Income Above $100,000 in Hazleton, PA
RELATED REPORTS & OPTIONS
Family Income | $100k+
Hazleton
Compare Zip Codes
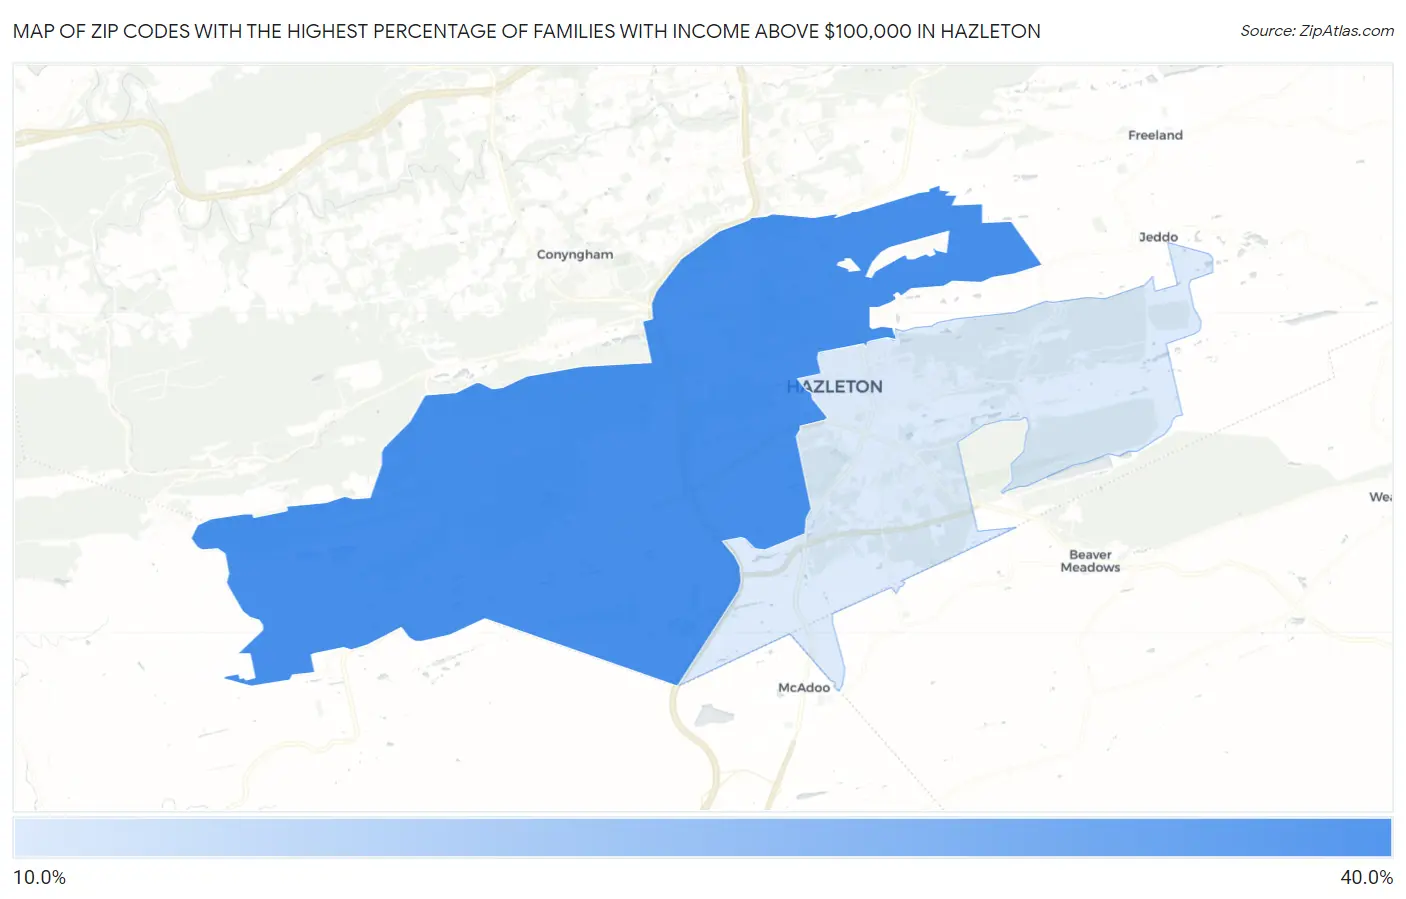
Map of Zip Codes with the Highest Percentage of Families with Income Above $100,000 in Hazleton
17.6%
34.8%
Zip Codes with the Highest Percentage of Families with Income Above $100,000 in Hazleton, PA
| Zip Code | Families with Income > $100k | vs State | vs National | |
| 1. | 18202 | 34.8% | 46.6%(-11.8)#1,028 | 46.1%(-11.3)#18,028 |
| 2. | 18201 | 17.6% | 46.6%(-29.0)#1,593 | 46.1%(-28.5)#28,223 |
1
Common Questions
What are the Top Zip Codes with the Highest Percentage of Families with Income Above $100,000 in Hazleton, PA?
Top Zip Codes with the Highest Percentage of Families with Income Above $100,000 in Hazleton, PA are:
What zip code has the Highest Percentage of Families with Income Above $100,000 in Hazleton, PA?
18202 has the Highest Percentage of Families with Income Above $100,000 in Hazleton, PA with 34.8%.
What is the Percentage of Families with Income Above $100,000 in Hazleton, PA?
Percentage of Families with Income Above $100,000 in Hazleton is 18.0%.
What is the Percentage of Families with Income Above $100,000 in Pennsylvania?
Percentage of Families with Income Above $100,000 in Pennsylvania is 46.6%.
What is the Percentage of Families with Income Above $100,000 in the United States?
Percentage of Families with Income Above $100,000 in the United States is 46.1%.