Yardley borough, PA Map & Demographics
Yardley borough Overview
$64,777
PER CAPITA INCOME
$139,469
AVG FAMILY INCOME
$107,639
AVG HOUSEHOLD INCOME
7.7%
WAGE / INCOME GAP [ % ]
92.3¢/ $1
WAGE / INCOME GAP [ $ ]
0.43
INEQUALITY / GINI INDEX
2,591
TOTAL POPULATION
1,240
MALE POPULATION
1,351
FEMALE POPULATION
91.78
MALES / 100 FEMALES
108.95
FEMALES / 100 MALES
46.1
MEDIAN AGE
2.9
AVG FAMILY SIZE
2.2
AVG HOUSEHOLD SIZE
1,586
LABOR FORCE [ PEOPLE ]
72.0%
PERCENT IN LABOR FORCE
7.4%
UNEMPLOYMENT RATE
Income in Yardley borough
Income Overview in Yardley borough
Per Capita Income in Yardley borough is $64,777, while median incomes of families and households are $139,469 and $107,639 respectively.
| Characteristic | Number | Measure |
| Per Capita Income | 2,591 | $64,777 |
| Median Family Income | 715 | $139,469 |
| Mean Family Income | 715 | $180,878 |
| Median Household Income | 1,153 | $107,639 |
| Mean Household Income | 1,153 | $141,497 |
| Income Deficit | 715 | $0 |
| Wage / Income Gap (%) | 2,591 | 7.74% |
| Wage / Income Gap ($) | 2,591 | 92.26¢ per $1 |
| Gini / Inequality Index | 2,591 | 0.43 |
Earnings by Sex in Yardley borough
Average Earnings in Yardley borough are $68,375, $71,667 for men and $66,118 for women, a difference of 7.7%.
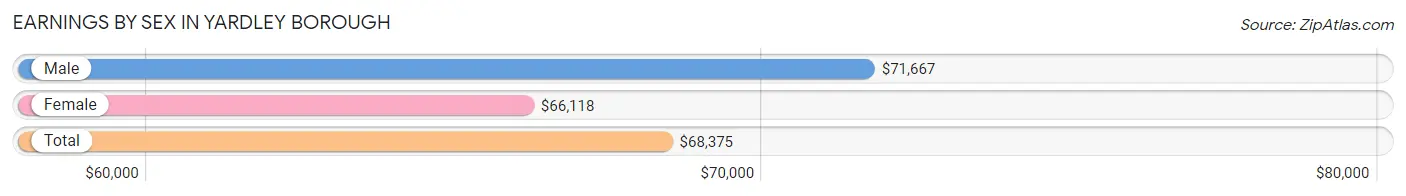
| Sex | Number | Average Earnings |
| Male | 776 (47.8%) | $71,667 |
| Female | 847 (52.2%) | $66,118 |
| Total | 1,623 (100.0%) | $68,375 |
Earnings by Sex by Income Bracket in Yardley borough
The most common earnings brackets in Yardley borough are $100,000+ for men (204 | 26.3%) and $100,000+ for women (188 | 22.2%).
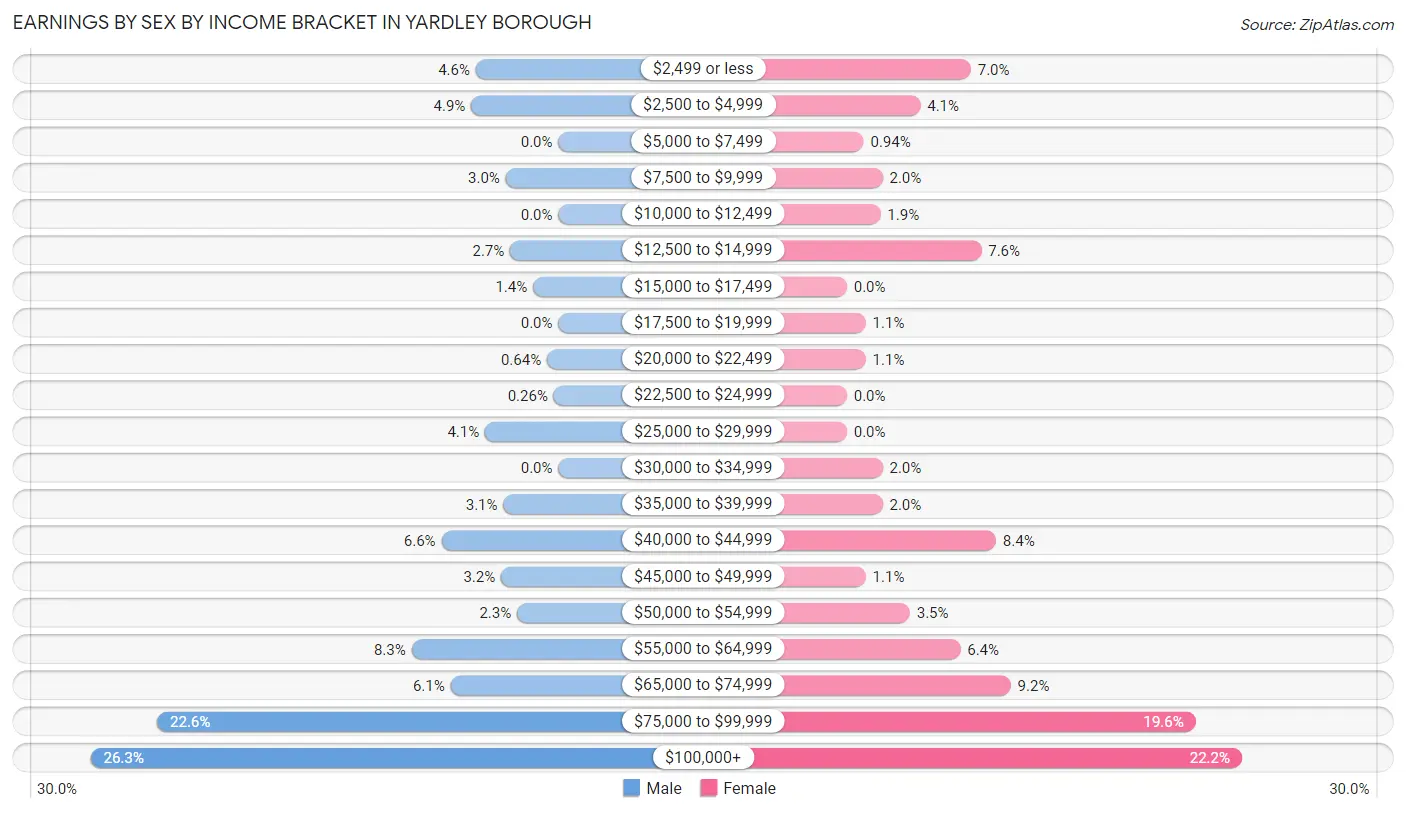
| Income | Male | Female |
| $2,499 or less | 36 (4.6%) | 59 (7.0%) |
| $2,500 to $4,999 | 38 (4.9%) | 35 (4.1%) |
| $5,000 to $7,499 | 0 (0.0%) | 8 (0.9%) |
| $7,500 to $9,999 | 23 (3.0%) | 17 (2.0%) |
| $10,000 to $12,499 | 0 (0.0%) | 16 (1.9%) |
| $12,500 to $14,999 | 21 (2.7%) | 64 (7.6%) |
| $15,000 to $17,499 | 11 (1.4%) | 0 (0.0%) |
| $17,500 to $19,999 | 0 (0.0%) | 9 (1.1%) |
| $20,000 to $22,499 | 5 (0.6%) | 9 (1.1%) |
| $22,500 to $24,999 | 2 (0.3%) | 0 (0.0%) |
| $25,000 to $29,999 | 32 (4.1%) | 0 (0.0%) |
| $30,000 to $34,999 | 0 (0.0%) | 17 (2.0%) |
| $35,000 to $39,999 | 24 (3.1%) | 17 (2.0%) |
| $40,000 to $44,999 | 51 (6.6%) | 71 (8.4%) |
| $45,000 to $49,999 | 25 (3.2%) | 9 (1.1%) |
| $50,000 to $54,999 | 18 (2.3%) | 30 (3.5%) |
| $55,000 to $64,999 | 64 (8.3%) | 54 (6.4%) |
| $65,000 to $74,999 | 47 (6.1%) | 78 (9.2%) |
| $75,000 to $99,999 | 175 (22.6%) | 166 (19.6%) |
| $100,000+ | 204 (26.3%) | 188 (22.2%) |
| Total | 776 (100.0%) | 847 (100.0%) |
Earnings by Sex by Educational Attainment in Yardley borough
Average earnings in Yardley borough are $82,872 for men and $71,774 for women, a difference of 13.4%. Men with an educational attainment of graduate degree enjoy the highest average annual earnings of $126,389, while those with high school diploma education earn the least with $46,838. Women with an educational attainment of bachelor's degree earn the most with the average annual earnings of $85,104, while those with college or associate's degree education have the smallest earnings of $43,914.
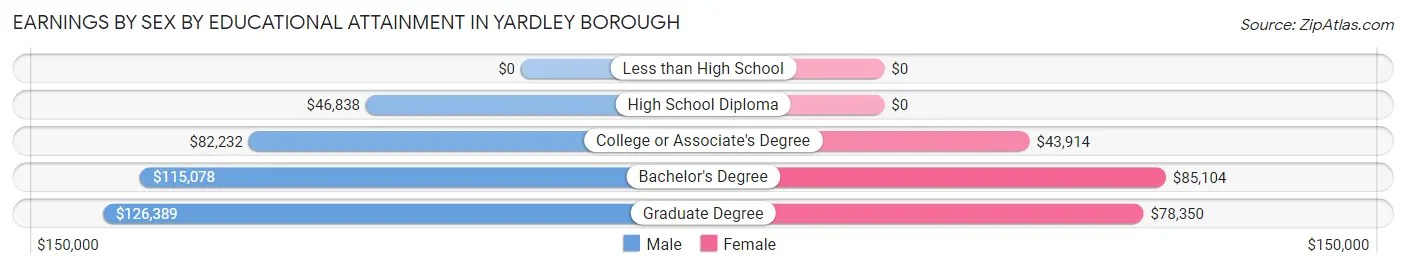
| Educational Attainment | Male Income | Female Income |
| Less than High School | - | - |
| High School Diploma | $46,838 | $0 |
| College or Associate's Degree | $82,232 | $43,914 |
| Bachelor's Degree | $115,078 | $85,104 |
| Graduate Degree | $126,389 | $78,350 |
| Total | $82,872 | $71,774 |
Family Income in Yardley borough
Family Income Brackets in Yardley borough
According to the Yardley borough family income data, there are 208 families falling into the $100,000 to $149,999 income range, which is the most common income bracket and makes up 29.1% of all families.
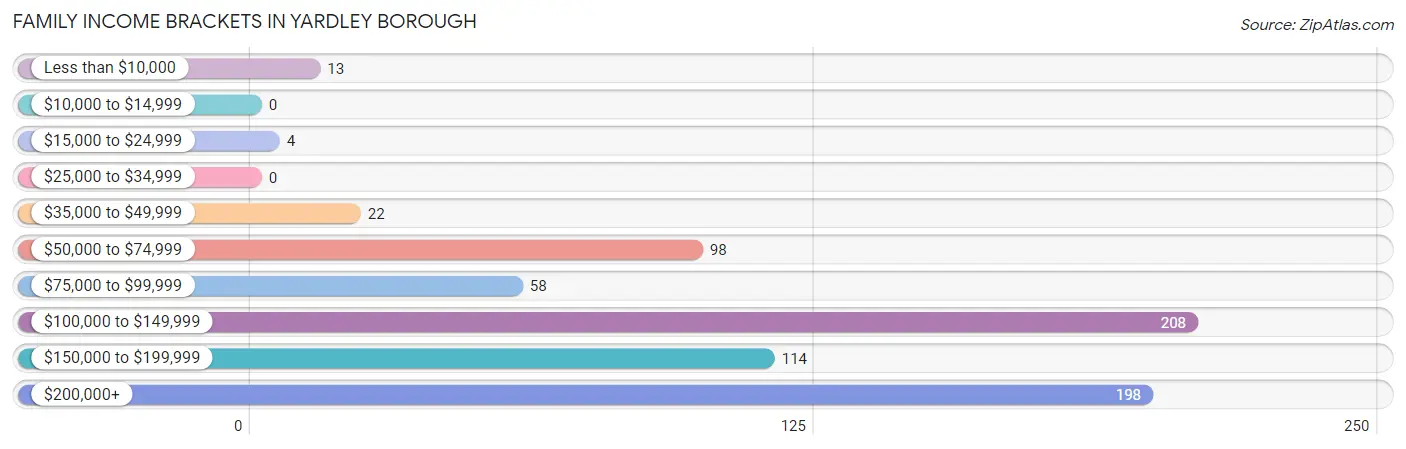
| Income Bracket | # Families | % Families |
| Less than $10,000 | 13 | 1.8% |
| $10,000 to $14,999 | 0 | 0.0% |
| $15,000 to $24,999 | 4 | 0.6% |
| $25,000 to $34,999 | 0 | 0.0% |
| $35,000 to $49,999 | 22 | 3.1% |
| $50,000 to $74,999 | 98 | 13.7% |
| $75,000 to $99,999 | 58 | 8.1% |
| $100,000 to $149,999 | 208 | 29.1% |
| $150,000 to $199,999 | 114 | 15.9% |
| $200,000+ | 198 | 27.7% |
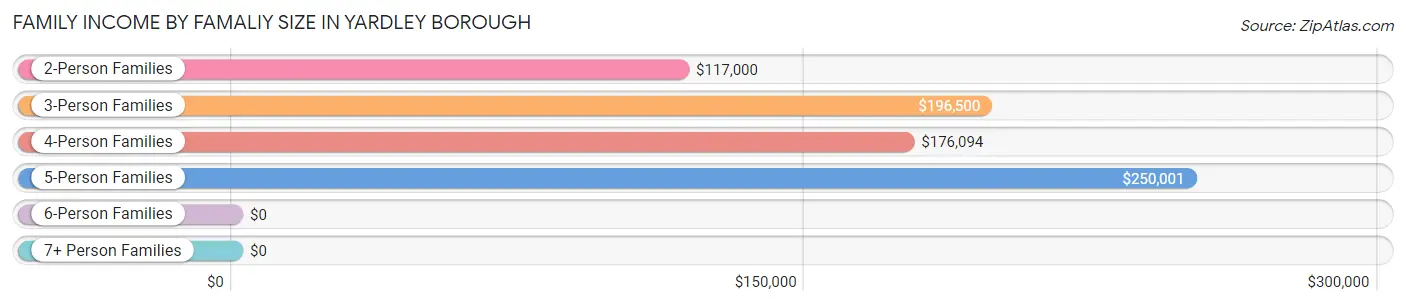
Family Income by Famaliy Size in Yardley borough
5-person families (20 | 2.8%) account for the highest median family income in Yardley borough with $250,001 per family, while 3-person families (94 | 13.2%) have the highest median income of $65,500 per family member.
| Income Bracket | # Families | Median Income |
| 2-Person Families | 458 (64.1%) | $117,000 |
| 3-Person Families | 94 (13.2%) | $196,500 |
| 4-Person Families | 123 (17.2%) | $176,094 |
| 5-Person Families | 20 (2.8%) | $250,001 |
| 6-Person Families | 20 (2.8%) | $0 |
| 7+ Person Families | 0 (0.0%) | $0 |
| Total | 715 (100.0%) | $139,469 |
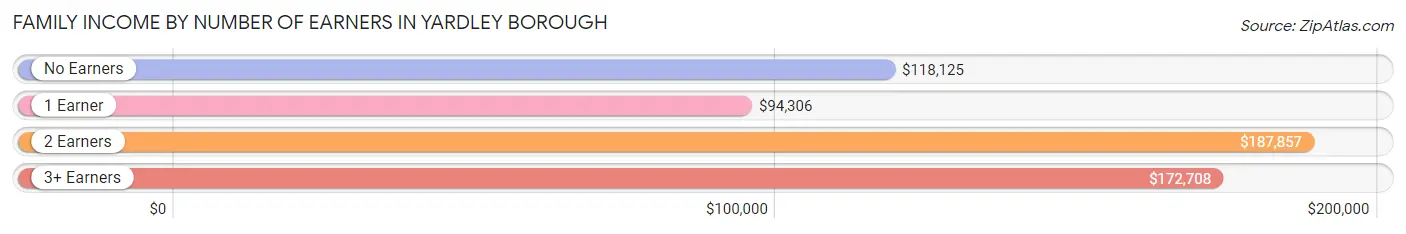
Family Income by Number of Earners in Yardley borough
The median family income in Yardley borough is $139,469, with families comprising 2 earners (320) having the highest median family income of $187,857, while families with 1 earner (253) have the lowest median family income of $94,306, accounting for 44.8% and 35.4% of families, respectively.
| Number of Earners | # Families | Median Income |
| No Earners | 70 (9.8%) | $118,125 |
| 1 Earner | 253 (35.4%) | $94,306 |
| 2 Earners | 320 (44.8%) | $187,857 |
| 3+ Earners | 72 (10.1%) | $172,708 |
| Total | 715 (100.0%) | $139,469 |
Household Income in Yardley borough
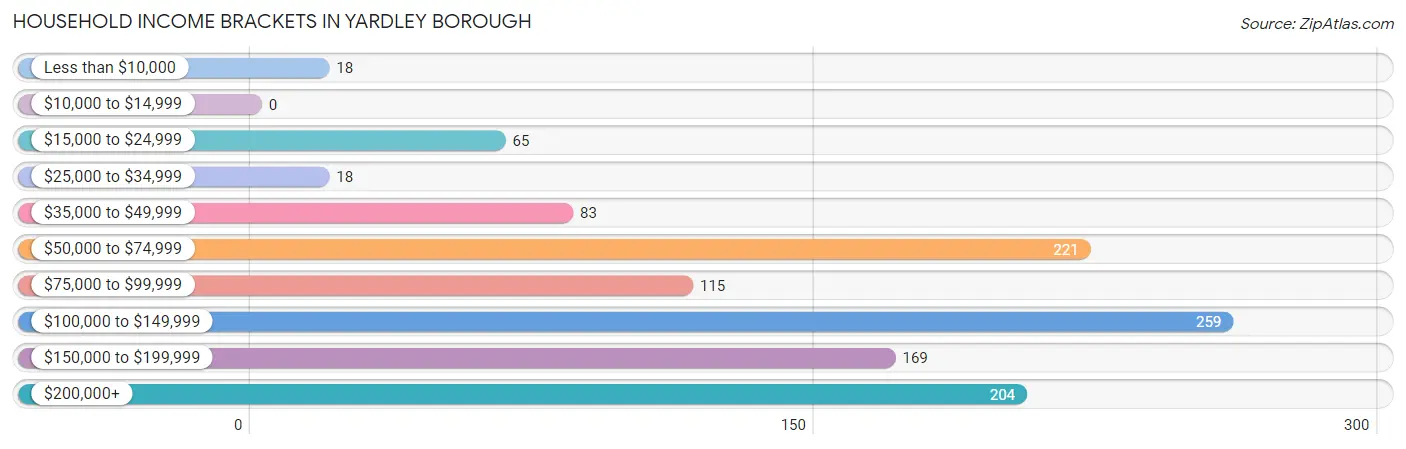
Household Income Brackets in Yardley borough
With 259 households falling in the category, the $100,000 to $149,999 income range is the most frequent in Yardley borough, accounting for 22.5% of all households.
| Income Bracket | # Households | % Households |
| Less than $10,000 | 18 | 1.6% |
| $10,000 to $14,999 | 0 | 0.0% |
| $15,000 to $24,999 | 65 | 5.6% |
| $25,000 to $34,999 | 18 | 1.6% |
| $35,000 to $49,999 | 83 | 7.2% |
| $50,000 to $74,999 | 221 | 19.2% |
| $75,000 to $99,999 | 115 | 10.0% |
| $100,000 to $149,999 | 259 | 22.5% |
| $150,000 to $199,999 | 169 | 14.7% |
| $200,000+ | 204 | 17.7% |
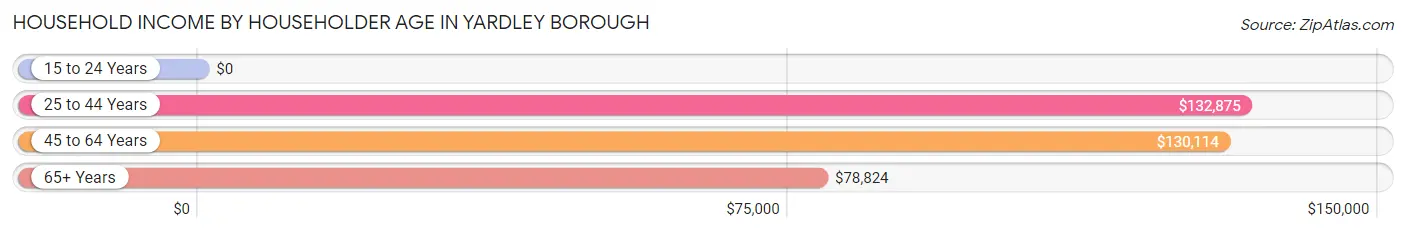
Household Income by Householder Age in Yardley borough
The median household income in Yardley borough is $107,639, with the highest median household income of $132,875 found in the 25 to 44 years age bracket for the primary householder. A total of 304 households (26.4%) fall into this category. Meanwhile, the 15 to 24 years age bracket for the primary householder has the lowest median household income of $0, with 20 households (1.7%) in this group.
| Income Bracket | # Households | Median Income |
| 15 to 24 Years | 20 (1.7%) | $0 |
| 25 to 44 Years | 304 (26.4%) | $132,875 |
| 45 to 64 Years | 487 (42.2%) | $130,114 |
| 65+ Years | 342 (29.7%) | $78,824 |
| Total | 1,153 (100.0%) | $107,639 |
Poverty in Yardley borough
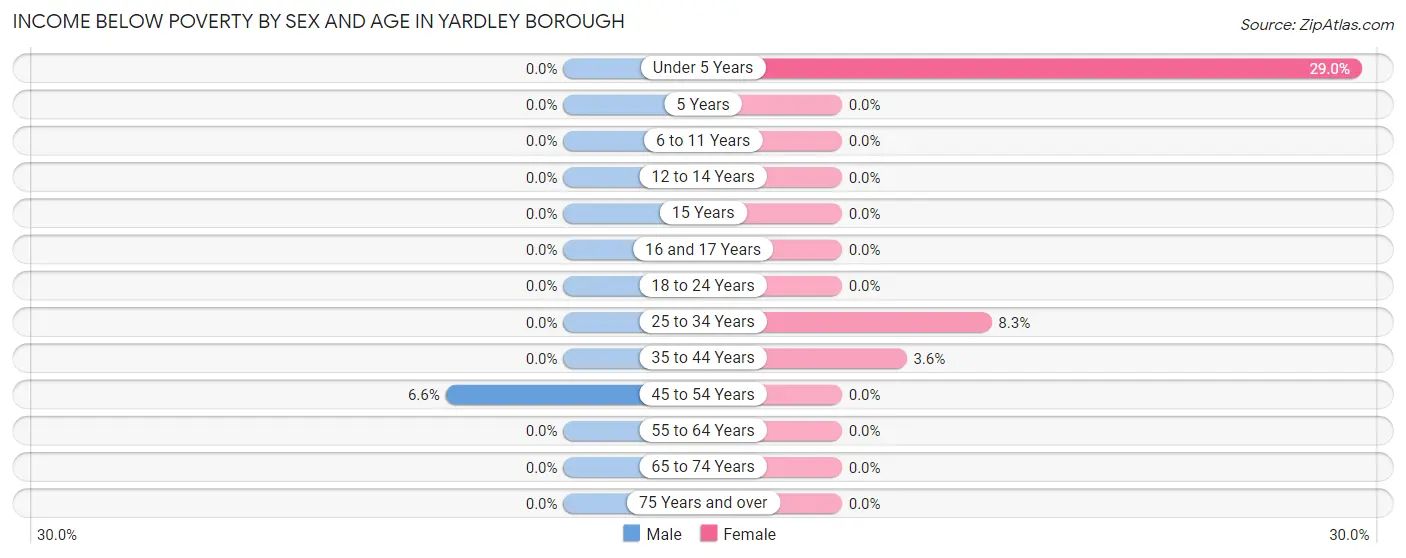
Income Below Poverty by Sex and Age in Yardley borough
With 1.0% poverty level for males and 2.1% for females among the residents of Yardley borough, 45 to 54 year old males and under 5 year old females are the most vulnerable to poverty, with 12 males (6.6%) and 11 females (28.9%) in their respective age groups living below the poverty level.
| Age Bracket | Male | Female |
| Under 5 Years | 0 (0.0%) | 11 (28.9%) |
| 5 Years | 0 (0.0%) | 0 (0.0%) |
| 6 to 11 Years | 0 (0.0%) | 0 (0.0%) |
| 12 to 14 Years | 0 (0.0%) | 0 (0.0%) |
| 15 Years | 0 (0.0%) | 0 (0.0%) |
| 16 and 17 Years | 0 (0.0%) | 0 (0.0%) |
| 18 to 24 Years | 0 (0.0%) | 0 (0.0%) |
| 25 to 34 Years | 0 (0.0%) | 13 (8.3%) |
| 35 to 44 Years | 0 (0.0%) | 5 (3.6%) |
| 45 to 54 Years | 12 (6.6%) | 0 (0.0%) |
| 55 to 64 Years | 0 (0.0%) | 0 (0.0%) |
| 65 to 74 Years | 0 (0.0%) | 0 (0.0%) |
| 75 Years and over | 0 (0.0%) | 0 (0.0%) |
| Total | 12 (1.0%) | 29 (2.1%) |
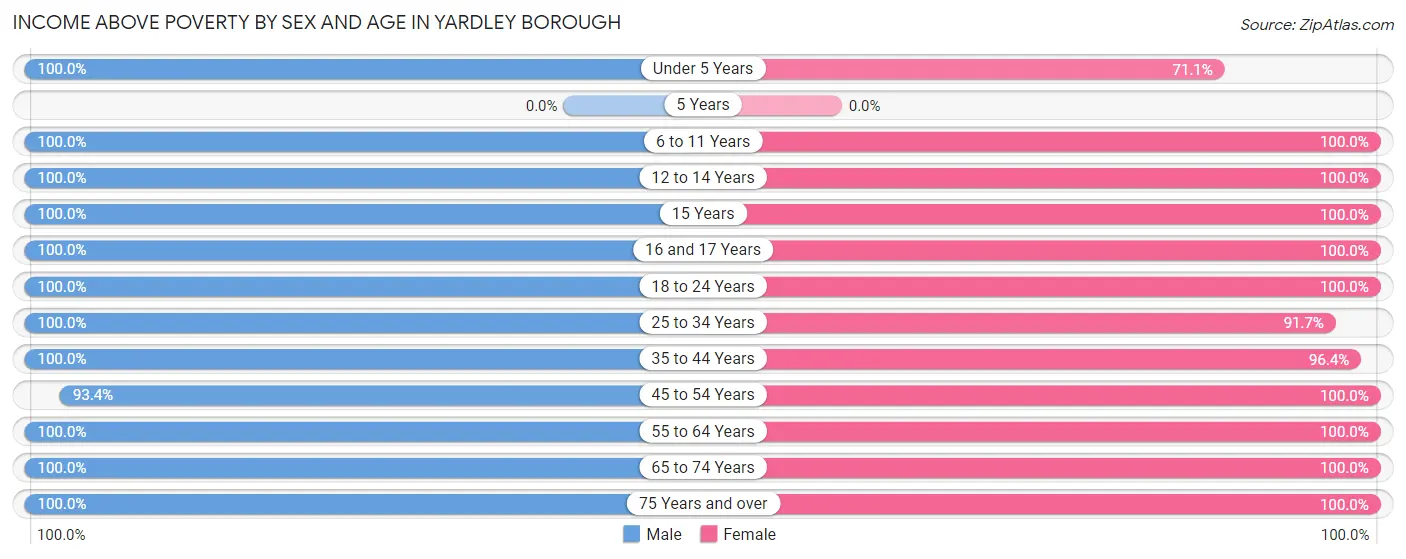
Income Above Poverty by Sex and Age in Yardley borough
According to the poverty statistics in Yardley borough, males aged under 5 years and females aged 6 to 11 years are the age groups that are most secure financially, with 100.0% of males and 100.0% of females in these age groups living above the poverty line.
| Age Bracket | Male | Female |
| Under 5 Years | 56 (100.0%) | 27 (71.1%) |
| 5 Years | 0 (0.0%) | 0 (0.0%) |
| 6 to 11 Years | 16 (100.0%) | 61 (100.0%) |
| 12 to 14 Years | 61 (100.0%) | 62 (100.0%) |
| 15 Years | 65 (100.0%) | 29 (100.0%) |
| 16 and 17 Years | 29 (100.0%) | 32 (100.0%) |
| 18 to 24 Years | 154 (100.0%) | 111 (100.0%) |
| 25 to 34 Years | 156 (100.0%) | 143 (91.7%) |
| 35 to 44 Years | 105 (100.0%) | 134 (96.4%) |
| 45 to 54 Years | 171 (93.4%) | 209 (100.0%) |
| 55 to 64 Years | 183 (100.0%) | 261 (100.0%) |
| 65 to 74 Years | 181 (100.0%) | 162 (100.0%) |
| 75 Years and over | 51 (100.0%) | 91 (100.0%) |
| Total | 1,228 (99.0%) | 1,322 (97.9%) |
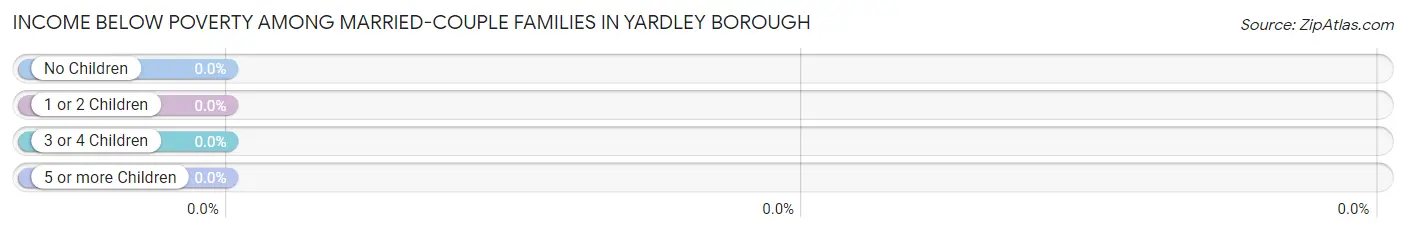
Income Below Poverty Among Married-Couple Families in Yardley borough
| Children | Above Poverty | Below Poverty |
| No Children | 371 (100.0%) | 0 (0.0%) |
| 1 or 2 Children | 131 (100.0%) | 0 (0.0%) |
| 3 or 4 Children | 21 (100.0%) | 0 (0.0%) |
| 5 or more Children | 0 (0.0%) | 0 (0.0%) |
| Total | 523 (100.0%) | 0 (0.0%) |
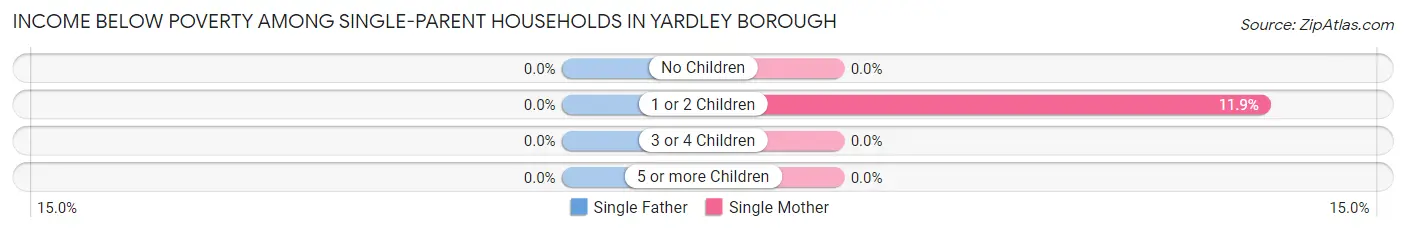
Income Below Poverty Among Single-Parent Households in Yardley borough
| Children | Single Father | Single Mother |
| No Children | 0 (0.0%) | 0 (0.0%) |
| 1 or 2 Children | 0 (0.0%) | 13 (11.9%) |
| 3 or 4 Children | 0 (0.0%) | 0 (0.0%) |
| 5 or more Children | 0 (0.0%) | 0 (0.0%) |
| Total | 0 (0.0%) | 13 (9.1%) |
Income Below Poverty Among Married-Couple vs Single-Parent Households in Yardley borough
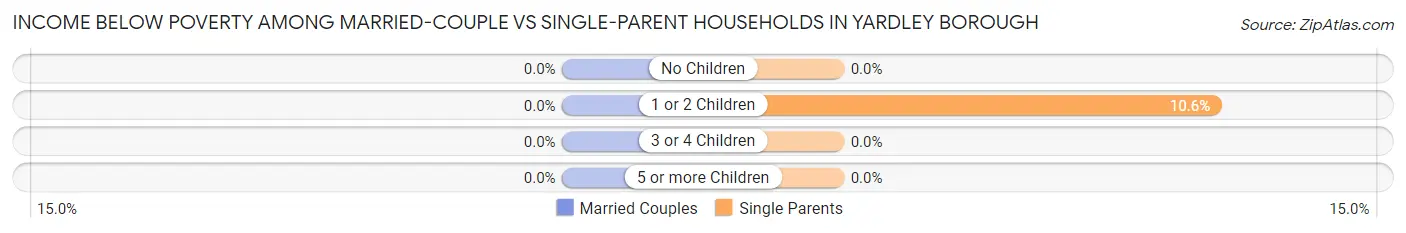
| Children | Married-Couple Families | Single-Parent Households |
| No Children | 0 (0.0%) | 0 (0.0%) |
| 1 or 2 Children | 0 (0.0%) | 13 (10.6%) |
| 3 or 4 Children | 0 (0.0%) | 0 (0.0%) |
| 5 or more Children | 0 (0.0%) | 0 (0.0%) |
| Total | 0 (0.0%) | 13 (6.8%) |
Race in Yardley borough
The most populous races in Yardley borough are White / Caucasian (2,383 | 92.0%), Two or more Races (165 | 6.4%), and Hispanic or Latino (148 | 5.7%).
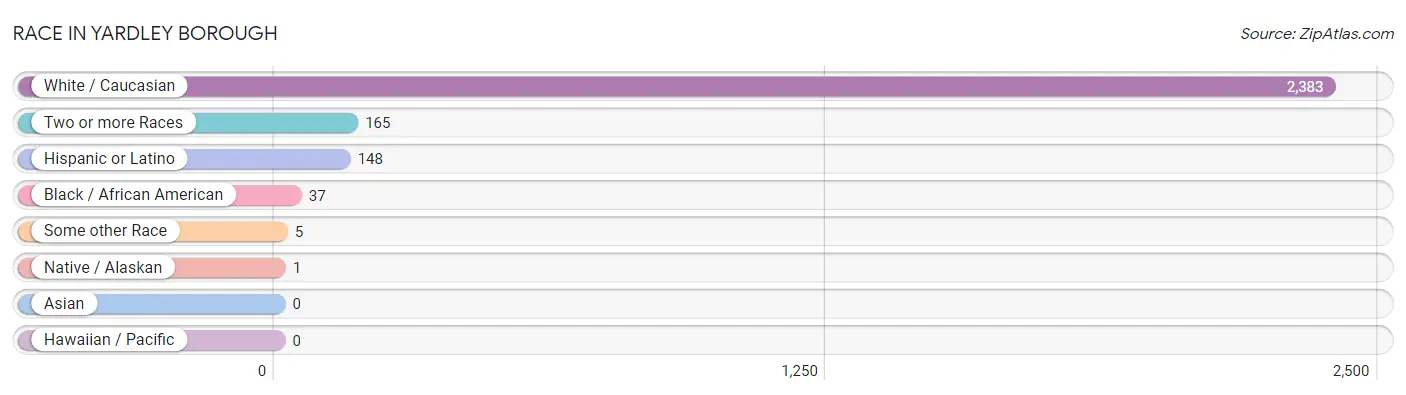
| Race | # Population | % Population |
| Asian | 0 | 0.0% |
| Black / African American | 37 | 1.4% |
| Hawaiian / Pacific | 0 | 0.0% |
| Hispanic or Latino | 148 | 5.7% |
| Native / Alaskan | 1 | 0.0% |
| White / Caucasian | 2,383 | 92.0% |
| Two or more Races | 165 | 6.4% |
| Some other Race | 5 | 0.2% |
| Total | 2,591 | 100.0% |
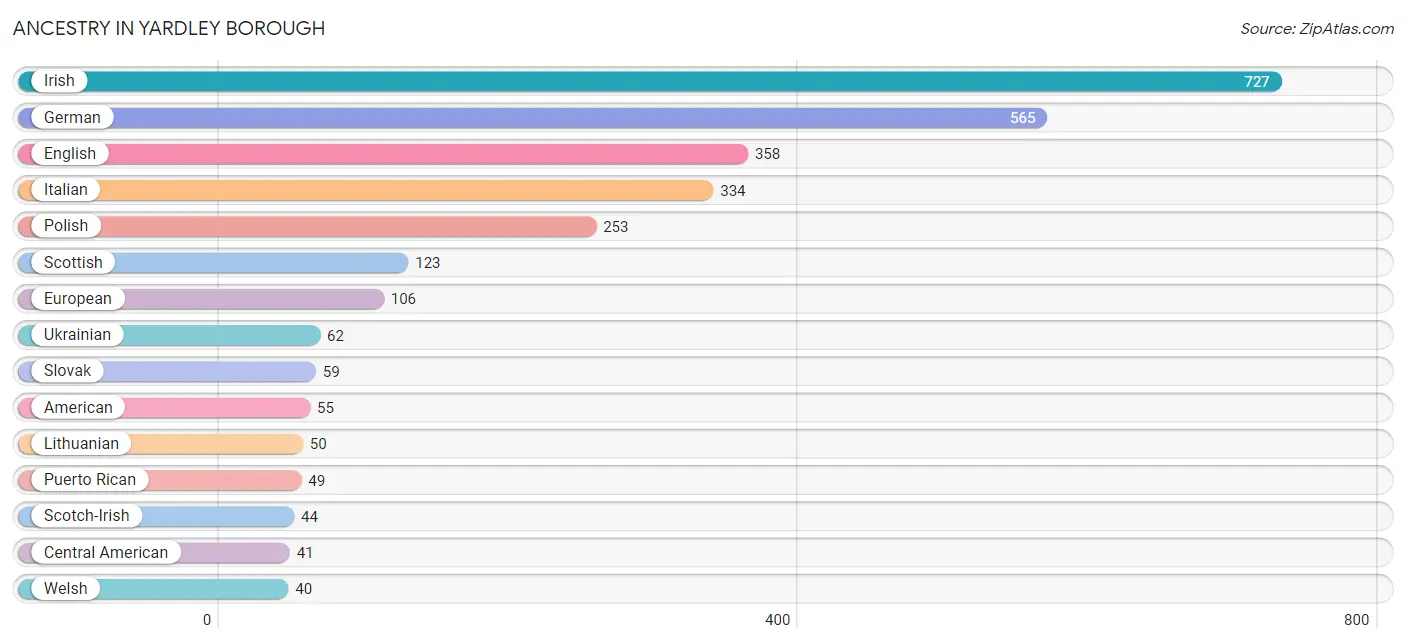
Ancestry in Yardley borough
The most populous ancestries reported in Yardley borough are Irish (727 | 28.1%), German (565 | 21.8%), English (358 | 13.8%), Italian (334 | 12.9%), and Polish (253 | 9.8%), together accounting for 86.3% of all Yardley borough residents.
| Ancestry | # Population | % Population |
| African | 5 | 0.2% |
| American | 55 | 2.1% |
| Austrian | 28 | 1.1% |
| British | 21 | 0.8% |
| Burmese | 5 | 0.2% |
| Central American | 41 | 1.6% |
| Cherokee | 15 | 0.6% |
| Colombian | 30 | 1.2% |
| Czechoslovakian | 11 | 0.4% |
| Dutch | 19 | 0.7% |
| Eastern European | 16 | 0.6% |
| English | 358 | 13.8% |
| European | 106 | 4.1% |
| French | 34 | 1.3% |
| French Canadian | 19 | 0.7% |
| German | 565 | 21.8% |
| Guatemalan | 32 | 1.2% |
| Hungarian | 29 | 1.1% |
| Irish | 727 | 28.1% |
| Italian | 334 | 12.9% |
| Lithuanian | 50 | 1.9% |
| Nicaraguan | 9 | 0.4% |
| Northern European | 28 | 1.1% |
| Norwegian | 7 | 0.3% |
| Polish | 253 | 9.8% |
| Portuguese | 14 | 0.5% |
| Puerto Rican | 49 | 1.9% |
| Russian | 13 | 0.5% |
| Scotch-Irish | 44 | 1.7% |
| Scottish | 123 | 4.8% |
| Slovak | 59 | 2.3% |
| South American | 30 | 1.2% |
| Spaniard | 28 | 1.1% |
| Subsaharan African | 5 | 0.2% |
| Swedish | 11 | 0.4% |
| Swiss | 9 | 0.4% |
| Ukrainian | 62 | 2.4% |
| Welsh | 40 | 1.5% | View All 38 Rows |
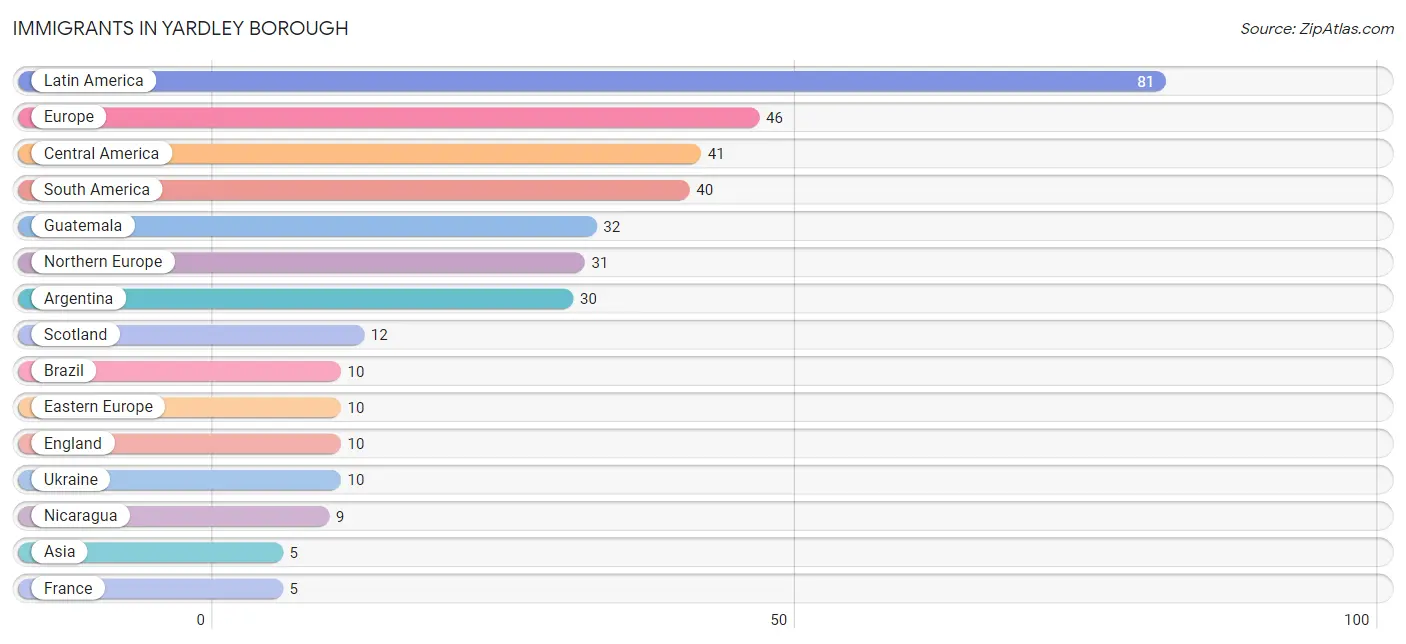
Immigrants in Yardley borough
The most numerous immigrant groups reported in Yardley borough came from Latin America (81 | 3.1%), Europe (46 | 1.8%), Central America (41 | 1.6%), South America (40 | 1.5%), and Guatemala (32 | 1.2%), together accounting for 9.3% of all Yardley borough residents.
| Immigration Origin | # Population | % Population |
| Argentina | 30 | 1.2% |
| Asia | 5 | 0.2% |
| Brazil | 10 | 0.4% |
| Canada | 4 | 0.2% |
| Central America | 41 | 1.6% |
| Eastern Europe | 10 | 0.4% |
| England | 10 | 0.4% |
| Europe | 46 | 1.8% |
| France | 5 | 0.2% |
| Guatemala | 32 | 1.2% |
| Israel | 5 | 0.2% |
| Latin America | 81 | 3.1% |
| Nicaragua | 9 | 0.4% |
| Northern Europe | 31 | 1.2% |
| Scotland | 12 | 0.5% |
| South America | 40 | 1.5% |
| Sweden | 4 | 0.2% |
| Ukraine | 10 | 0.4% |
| Western Asia | 5 | 0.2% |
| Western Europe | 5 | 0.2% | View All 20 Rows |
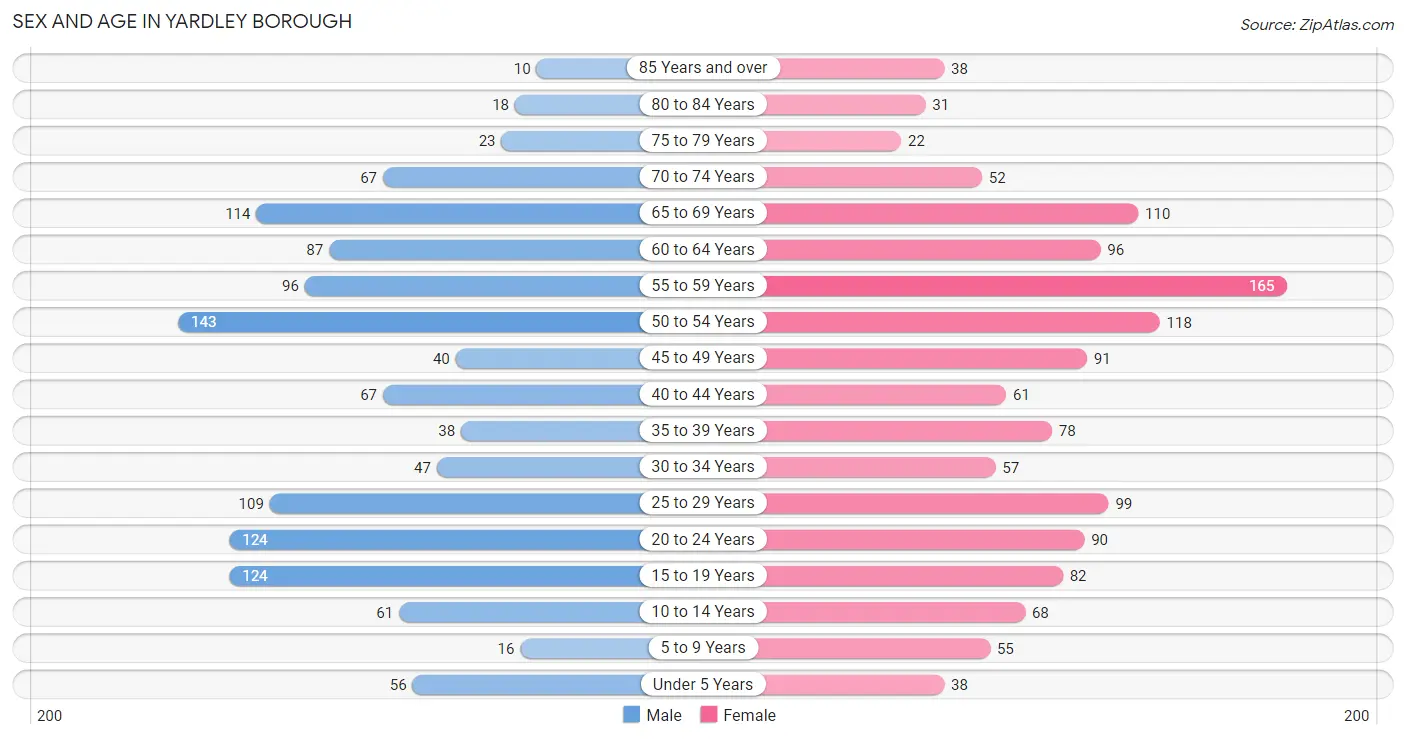
Sex and Age in Yardley borough
Sex and Age in Yardley borough
The most populous age groups in Yardley borough are 50 to 54 Years (143 | 11.5%) for men and 55 to 59 Years (165 | 12.2%) for women.
| Age Bracket | Male | Female |
| Under 5 Years | 56 (4.5%) | 38 (2.8%) |
| 5 to 9 Years | 16 (1.3%) | 55 (4.1%) |
| 10 to 14 Years | 61 (4.9%) | 68 (5.0%) |
| 15 to 19 Years | 124 (10.0%) | 82 (6.1%) |
| 20 to 24 Years | 124 (10.0%) | 90 (6.7%) |
| 25 to 29 Years | 109 (8.8%) | 99 (7.3%) |
| 30 to 34 Years | 47 (3.8%) | 57 (4.2%) |
| 35 to 39 Years | 38 (3.1%) | 78 (5.8%) |
| 40 to 44 Years | 67 (5.4%) | 61 (4.5%) |
| 45 to 49 Years | 40 (3.2%) | 91 (6.7%) |
| 50 to 54 Years | 143 (11.5%) | 118 (8.7%) |
| 55 to 59 Years | 96 (7.7%) | 165 (12.2%) |
| 60 to 64 Years | 87 (7.0%) | 96 (7.1%) |
| 65 to 69 Years | 114 (9.2%) | 110 (8.1%) |
| 70 to 74 Years | 67 (5.4%) | 52 (3.8%) |
| 75 to 79 Years | 23 (1.8%) | 22 (1.6%) |
| 80 to 84 Years | 18 (1.5%) | 31 (2.3%) |
| 85 Years and over | 10 (0.8%) | 38 (2.8%) |
| Total | 1,240 (100.0%) | 1,351 (100.0%) |
Families and Households in Yardley borough
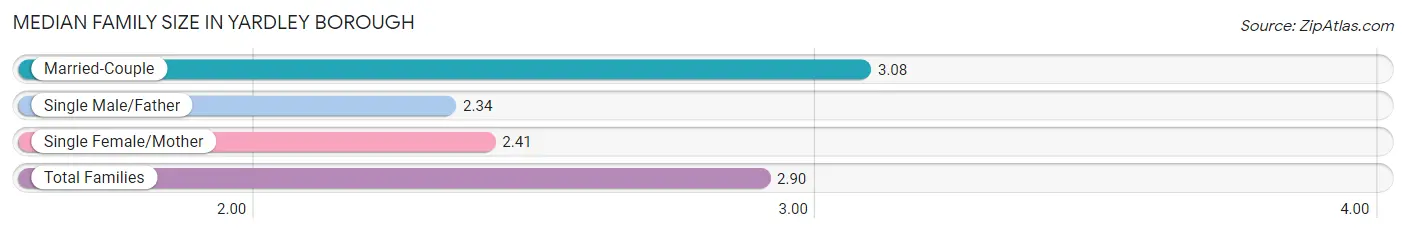
Median Family Size in Yardley borough
The median family size in Yardley borough is 2.90 persons per family, with married-couple families (523 | 73.2%) accounting for the largest median family size of 3.08 persons per family. On the other hand, single male/father families (50 | 7.0%) represent the smallest median family size with 2.34 persons per family.
| Family Type | # Families | Family Size |
| Married-Couple | 523 (73.2%) | 3.08 |
| Single Male/Father | 50 (7.0%) | 2.34 |
| Single Female/Mother | 142 (19.9%) | 2.41 |
| Total Families | 715 (100.0%) | 2.90 |
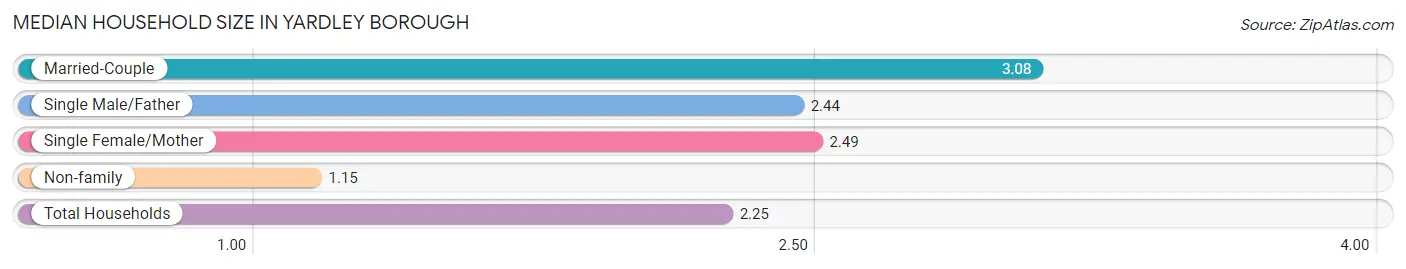
Median Household Size in Yardley borough
The median household size in Yardley borough is 2.25 persons per household, with married-couple households (523 | 45.4%) accounting for the largest median household size of 3.08 persons per household. non-family households (438 | 38.0%) represent the smallest median household size with 1.15 persons per household.
| Household Type | # Households | Household Size |
| Married-Couple | 523 (45.4%) | 3.08 |
| Single Male/Father | 50 (4.3%) | 2.44 |
| Single Female/Mother | 142 (12.3%) | 2.49 |
| Non-family | 438 (38.0%) | 1.15 |
| Total Households | 1,153 (100.0%) | 2.25 |
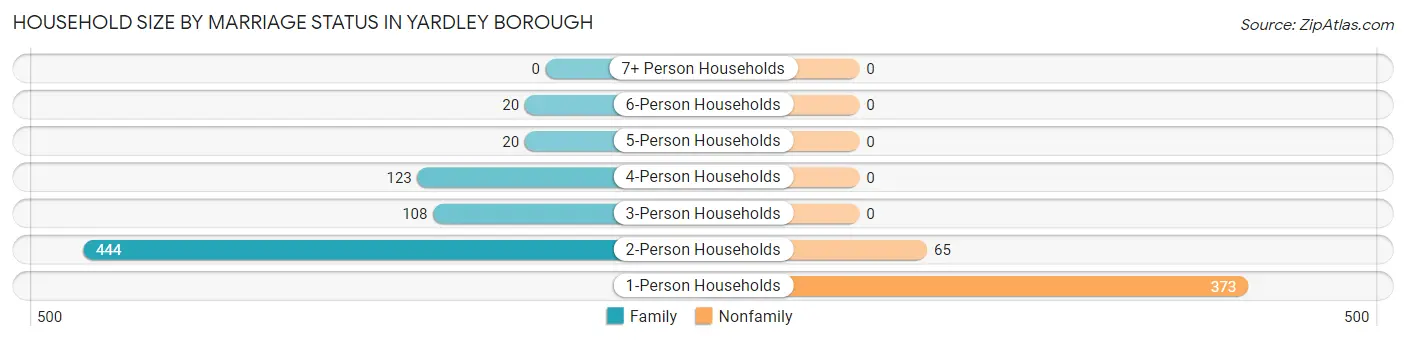
Household Size by Marriage Status in Yardley borough
Out of a total of 1,153 households in Yardley borough, 715 (62.0%) are family households, while 438 (38.0%) are nonfamily households. The most numerous type of family households are 2-person households, comprising 444, and the most common type of nonfamily households are 1-person households, comprising 373.
| Household Size | Family Households | Nonfamily Households |
| 1-Person Households | - | 373 (32.4%) |
| 2-Person Households | 444 (38.5%) | 65 (5.6%) |
| 3-Person Households | 108 (9.4%) | 0 (0.0%) |
| 4-Person Households | 123 (10.7%) | 0 (0.0%) |
| 5-Person Households | 20 (1.7%) | 0 (0.0%) |
| 6-Person Households | 20 (1.7%) | 0 (0.0%) |
| 7+ Person Households | 0 (0.0%) | 0 (0.0%) |
| Total | 715 (62.0%) | 438 (38.0%) |
Female Fertility in Yardley borough
Fertility by Age in Yardley borough
Average fertility rate in Yardley borough is 142.0 births per 1,000 women. Women in the age bracket of 20 to 34 years have the highest fertility rate with 260.0 births per 1,000 women. Women in the age bracket of 20 to 34 years acount for 80.0% of all women with births.
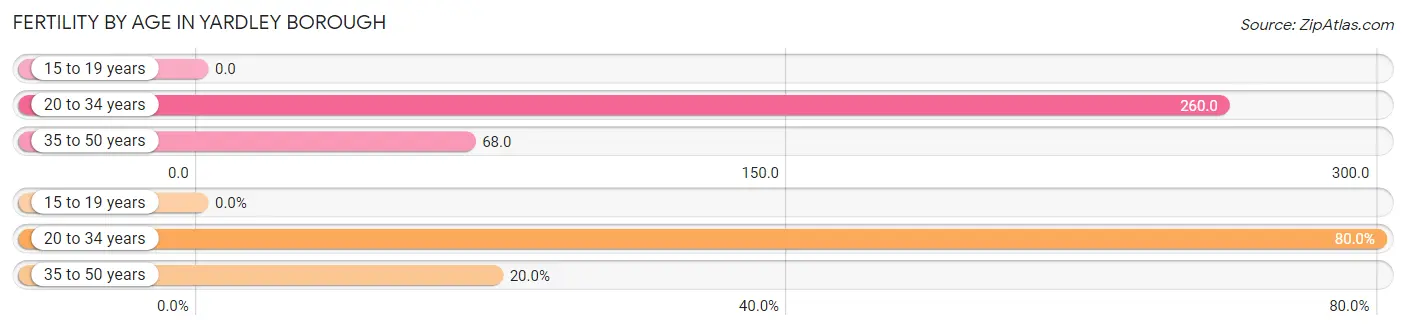
| Age Bracket | Women with Births | Births / 1,000 Women |
| 15 to 19 years | 0 (0.0%) | 0.0 |
| 20 to 34 years | 64 (80.0%) | 260.0 |
| 35 to 50 years | 16 (20.0%) | 68.0 |
| Total | 80 (100.0%) | 142.0 |
Fertility by Age by Marriage Status in Yardley borough
31.2% of women with births (80) in Yardley borough are married. The highest percentage of unmarried women with births falls into 20 to 34 years age bracket with 85.9% of them unmarried at the time of birth, while the lowest percentage of unmarried women with births belong to 35 to 50 years age bracket with 0.0% of them unmarried.
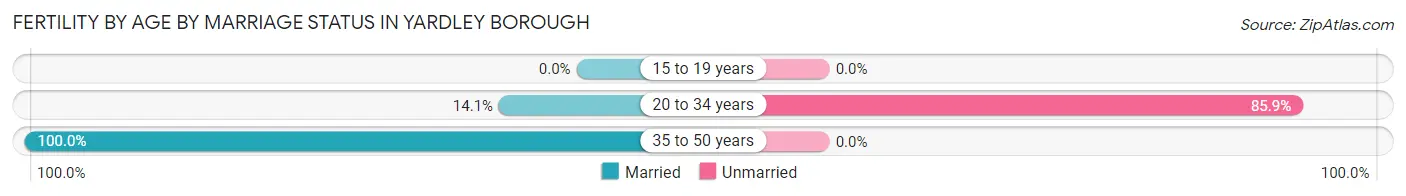
| Age Bracket | Married | Unmarried |
| 15 to 19 years | 0 (0.0%) | 0 (0.0%) |
| 20 to 34 years | 9 (14.1%) | 55 (85.9%) |
| 35 to 50 years | 16 (100.0%) | 0 (0.0%) |
| Total | 25 (31.2%) | 55 (68.8%) |
Fertility by Education in Yardley borough
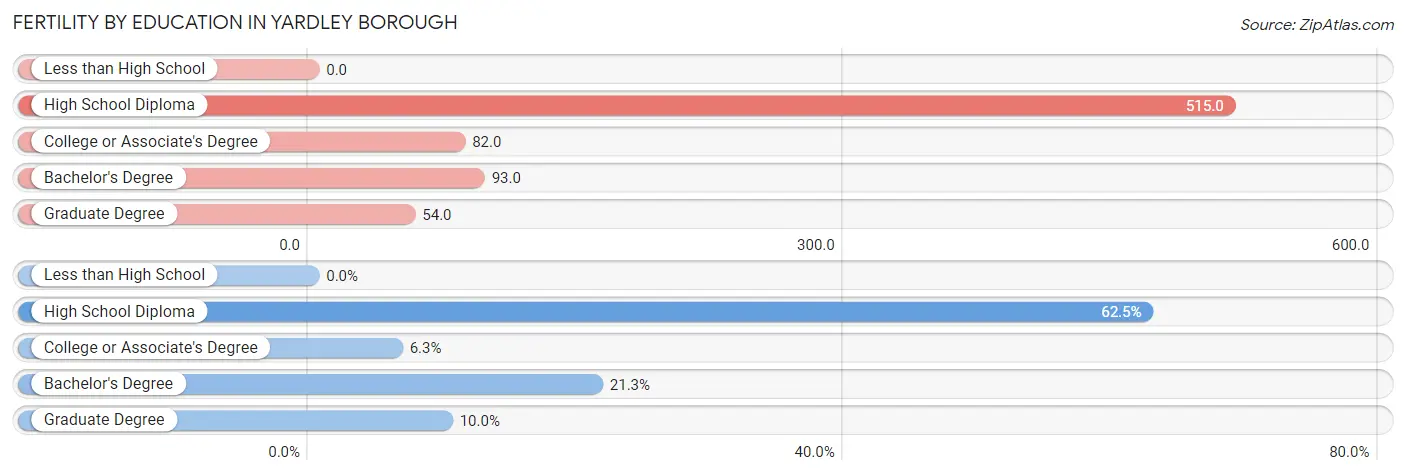
| Educational Attainment | Women with Births | Births / 1,000 Women |
| Less than High School | 0 (0.0%) | 0.0 |
| High School Diploma | 50 (62.5%) | 515.0 |
| College or Associate's Degree | 5 (6.2%) | 82.0 |
| Bachelor's Degree | 17 (21.2%) | 93.0 |
| Graduate Degree | 8 (10.0%) | 54.0 |
| Total | 80 (100.0%) | 142.0 |
Fertility by Education by Marriage Status in Yardley borough
68.8% of women with births in Yardley borough are unmarried. Women with the educational attainment of bachelor's degree are most likely to be married with 100.0% of them married at childbirth, while women with the educational attainment of high school diploma are least likely to be married with 100.0% of them unmarried at childbirth.
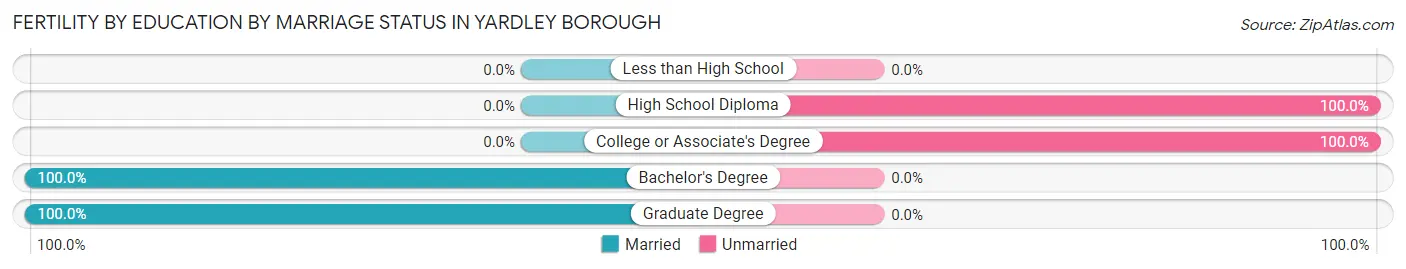
| Educational Attainment | Married | Unmarried |
| Less than High School | 0 (0.0%) | 0 (0.0%) |
| High School Diploma | 0 (0.0%) | 50 (100.0%) |
| College or Associate's Degree | 0 (0.0%) | 5 (100.0%) |
| Bachelor's Degree | 17 (100.0%) | 0 (0.0%) |
| Graduate Degree | 8 (100.0%) | 0 (0.0%) |
| Total | 25 (31.2%) | 55 (68.8%) |
Employment Characteristics in Yardley borough
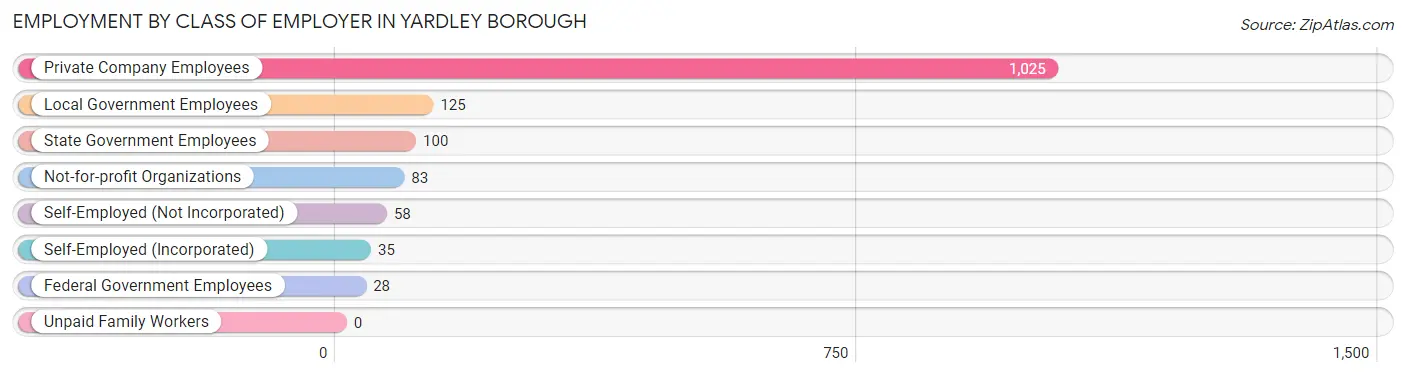
Employment by Class of Employer in Yardley borough
Among the 1,454 employed individuals in Yardley borough, private company employees (1,025 | 70.5%), local government employees (125 | 8.6%), and state government employees (100 | 6.9%) make up the most common classes of employment.
| Employer Class | # Employees | % Employees |
| Private Company Employees | 1,025 | 70.5% |
| Self-Employed (Incorporated) | 35 | 2.4% |
| Self-Employed (Not Incorporated) | 58 | 4.0% |
| Not-for-profit Organizations | 83 | 5.7% |
| Local Government Employees | 125 | 8.6% |
| State Government Employees | 100 | 6.9% |
| Federal Government Employees | 28 | 1.9% |
| Unpaid Family Workers | 0 | 0.0% |
| Total | 1,454 | 100.0% |
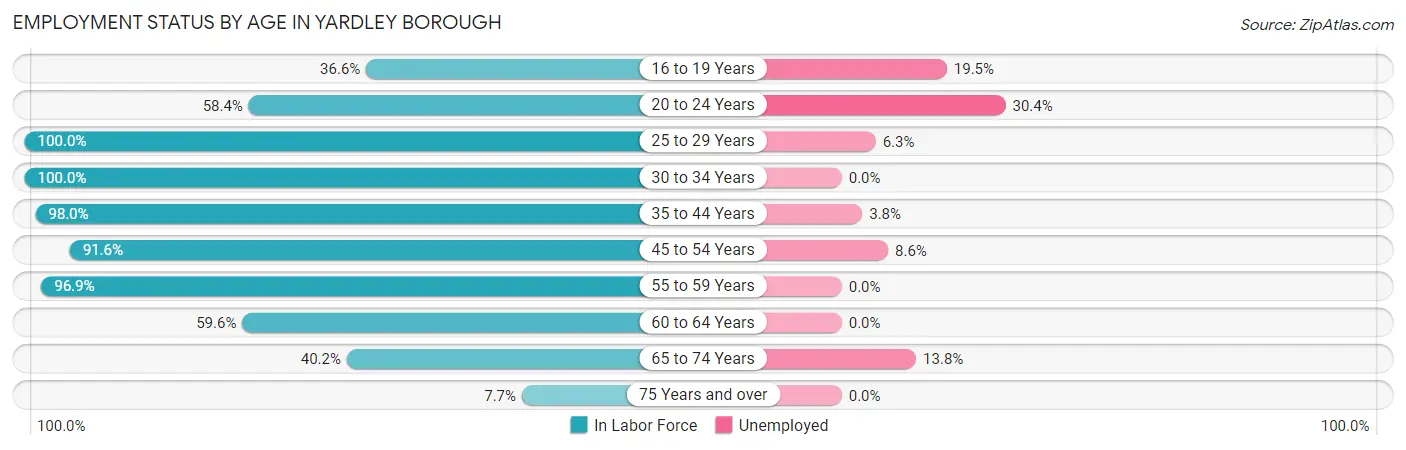
Employment Status by Age in Yardley borough
According to the labor force statistics for Yardley borough, out of the total population over 16 years of age (2,203), 72.0% or 1,586 individuals are in the labor force, with 7.4% or 117 of them unemployed. The age group with the highest labor force participation rate is 25 to 29 years, with 100.0% or 208 individuals in the labor force. Within the labor force, the 20 to 24 years age range has the highest percentage of unemployed individuals, with 30.4% or 38 of them being unemployed.
| Age Bracket | In Labor Force | Unemployed |
| 16 to 19 Years | 41 (36.6%) | 8 (19.5%) |
| 20 to 24 Years | 125 (58.4%) | 38 (30.4%) |
| 25 to 29 Years | 208 (100.0%) | 13 (6.3%) |
| 30 to 34 Years | 104 (100.0%) | 0 (0.0%) |
| 35 to 44 Years | 239 (98.0%) | 9 (3.8%) |
| 45 to 54 Years | 359 (91.6%) | 31 (8.6%) |
| 55 to 59 Years | 253 (96.9%) | 0 (0.0%) |
| 60 to 64 Years | 109 (59.6%) | 0 (0.0%) |
| 65 to 74 Years | 138 (40.2%) | 19 (13.8%) |
| 75 Years and over | 11 (7.7%) | 0 (0.0%) |
| Total | 1,586 (72.0%) | 117 (7.4%) |
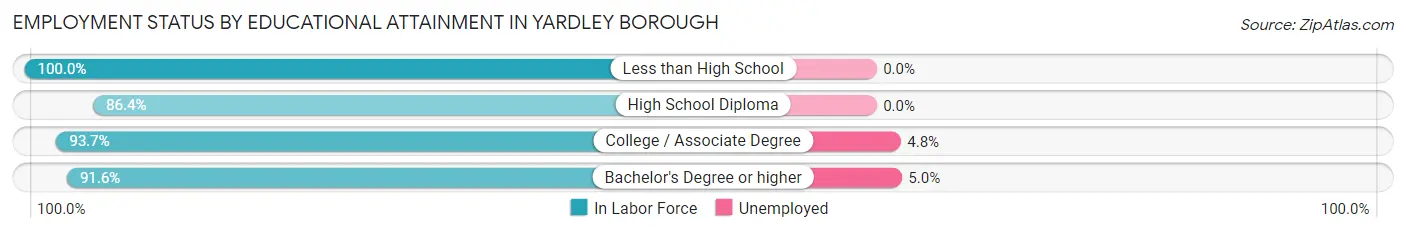
Employment Status by Educational Attainment in Yardley borough
According to labor force statistics for Yardley borough, 91.4% of individuals (1,272) out of the total population between 25 and 64 years of age (1,392) are in the labor force, with 4.2% or 53 of them being unemployed. The group with the highest labor force participation rate are those with the educational attainment of less than high school, with 100.0% or 18 individuals in the labor force. Within the labor force, individuals with bachelor's degree or higher education have the highest percentage of unemployment, with 5.0% or 40 of them being unemployed.
| Educational Attainment | In Labor Force | Unemployed |
| Less than High School | 18 (100.0%) | 0 (0.0%) |
| High School Diploma | 184 (86.4%) | 0 (0.0%) |
| College / Associate Degree | 269 (93.7%) | 14 (4.8%) |
| Bachelor's Degree or higher | 801 (91.6%) | 44 (5.0%) |
| Total | 1,272 (91.4%) | 58 (4.2%) |
Employment Occupations by Sex in Yardley borough
Management, Business, Science and Arts Occupations
The most common Management, Business, Science and Arts occupations in Yardley borough are Management (203 | 13.8%), Community & Social Service (198 | 13.5%), Computers, Engineering & Science (132 | 9.0%), Business & Financial (119 | 8.1%), and Education Instruction & Library (114 | 7.8%).
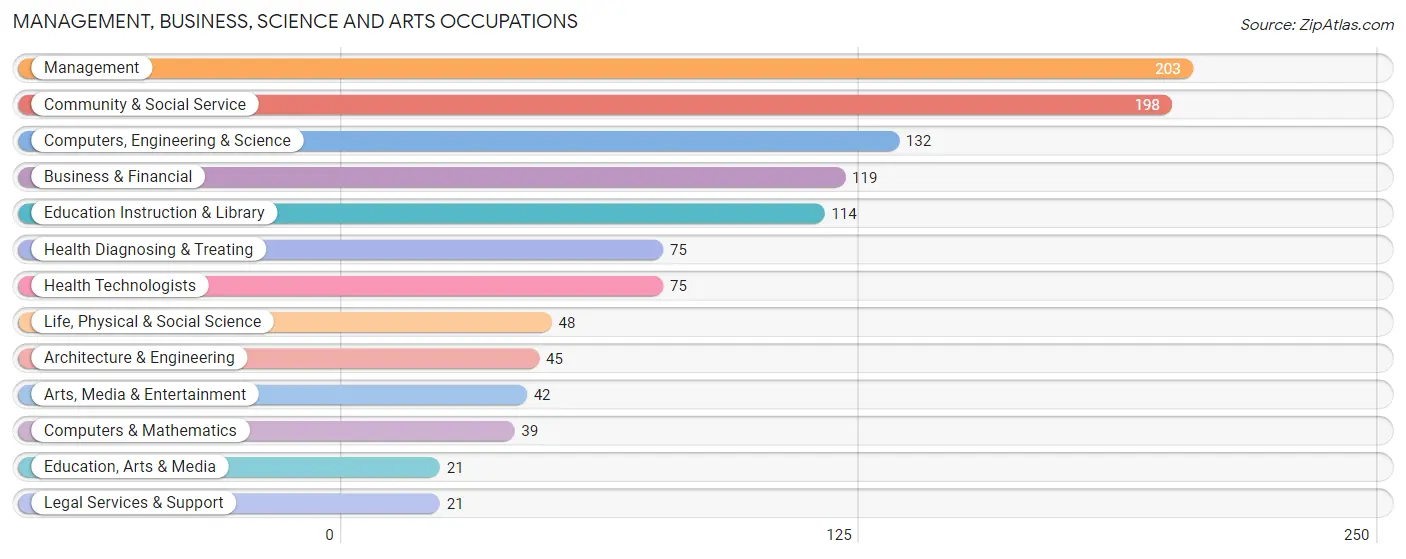
Management, Business, Science and Arts Occupations by Sex
Within the Management, Business, Science and Arts occupations in Yardley borough, the most male-oriented occupations are Legal Services & Support (100.0%), Life, Physical & Social Science (66.7%), and Computers & Mathematics (59.0%), while the most female-oriented occupations are Education, Arts & Media (100.0%), Arts, Media & Entertainment (100.0%), and Health Diagnosing & Treating (86.7%).
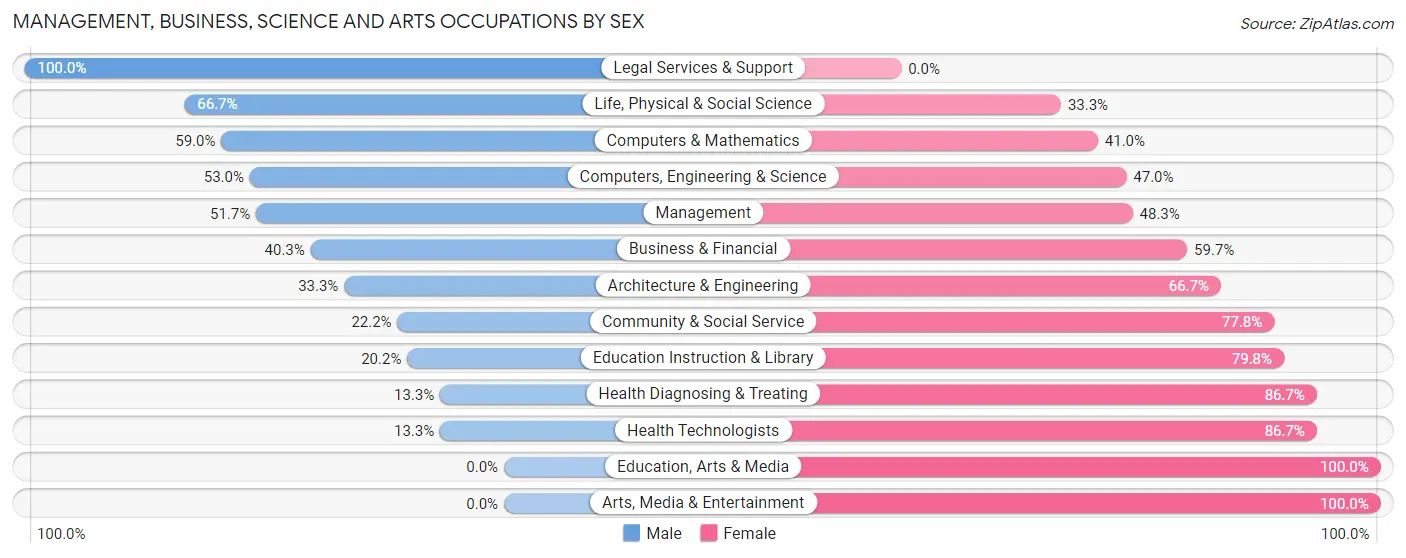
| Occupation | Male | Female |
| Management | 105 (51.7%) | 98 (48.3%) |
| Business & Financial | 48 (40.3%) | 71 (59.7%) |
| Computers, Engineering & Science | 70 (53.0%) | 62 (47.0%) |
| Computers & Mathematics | 23 (59.0%) | 16 (41.0%) |
| Architecture & Engineering | 15 (33.3%) | 30 (66.7%) |
| Life, Physical & Social Science | 32 (66.7%) | 16 (33.3%) |
| Community & Social Service | 44 (22.2%) | 154 (77.8%) |
| Education, Arts & Media | 0 (0.0%) | 21 (100.0%) |
| Legal Services & Support | 21 (100.0%) | 0 (0.0%) |
| Education Instruction & Library | 23 (20.2%) | 91 (79.8%) |
| Arts, Media & Entertainment | 0 (0.0%) | 42 (100.0%) |
| Health Diagnosing & Treating | 10 (13.3%) | 65 (86.7%) |
| Health Technologists | 10 (13.3%) | 65 (86.7%) |
| Total (Category) | 277 (38.1%) | 450 (61.9%) |
| Total (Overall) | 698 (47.5%) | 771 (52.5%) |
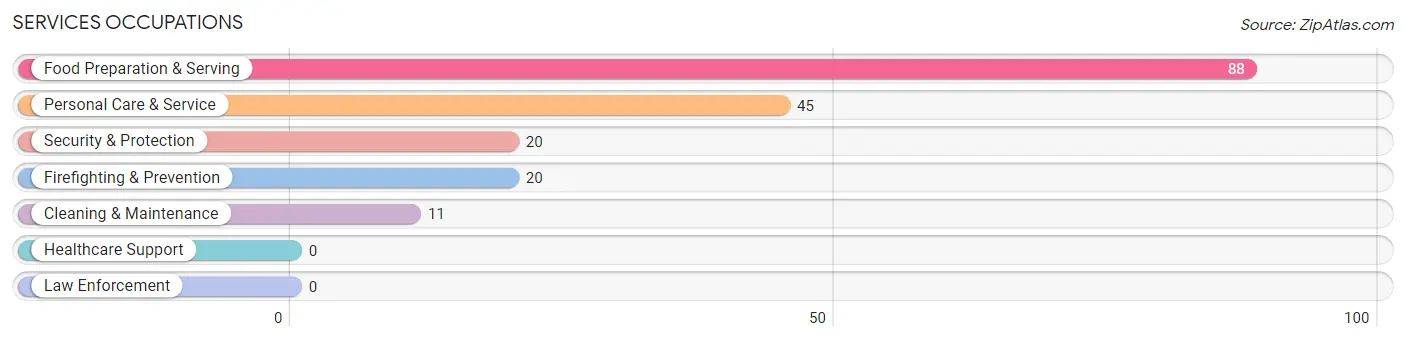
Services Occupations
The most common Services occupations in Yardley borough are Food Preparation & Serving (88 | 6.0%), Personal Care & Service (45 | 3.1%), Security & Protection (20 | 1.4%), Firefighting & Prevention (20 | 1.4%), and Cleaning & Maintenance (11 | 0.7%).
Services Occupations by Sex
Within the Services occupations in Yardley borough, the most male-oriented occupations are Security & Protection (100.0%), Firefighting & Prevention (100.0%), and Cleaning & Maintenance (100.0%), while the most female-oriented occupations are Food Preparation & Serving (92.0%), and Personal Care & Service (80.0%).
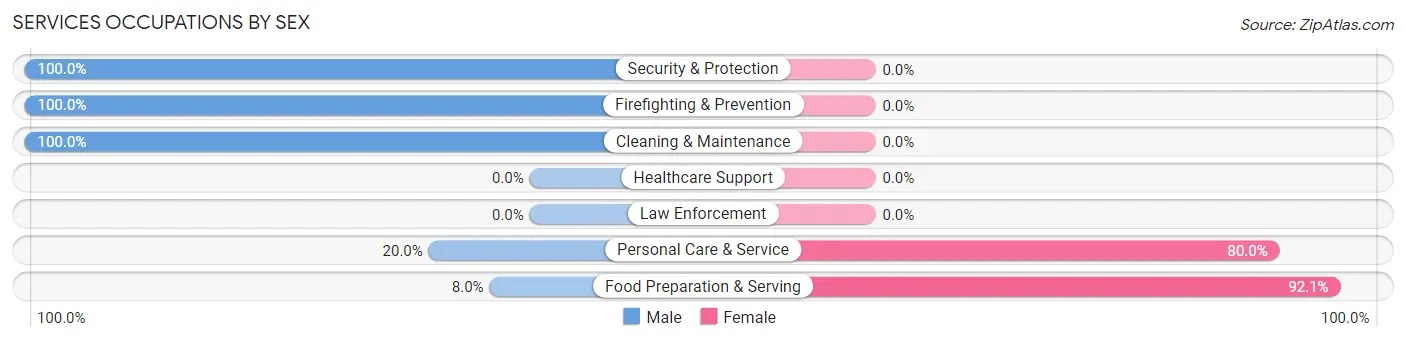
| Occupation | Male | Female |
| Healthcare Support | 0 (0.0%) | 0 (0.0%) |
| Security & Protection | 20 (100.0%) | 0 (0.0%) |
| Firefighting & Prevention | 20 (100.0%) | 0 (0.0%) |
| Law Enforcement | 0 (0.0%) | 0 (0.0%) |
| Food Preparation & Serving | 7 (8.0%) | 81 (92.0%) |
| Cleaning & Maintenance | 11 (100.0%) | 0 (0.0%) |
| Personal Care & Service | 9 (20.0%) | 36 (80.0%) |
| Total (Category) | 47 (28.7%) | 117 (71.3%) |
| Total (Overall) | 698 (47.5%) | 771 (52.5%) |
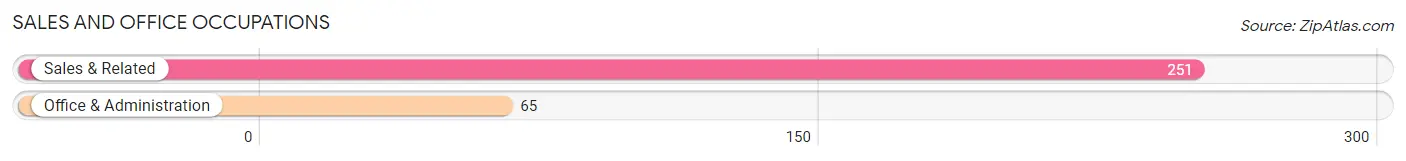
Sales and Office Occupations
The most common Sales and Office occupations in Yardley borough are Sales & Related (251 | 17.1%), and Office & Administration (65 | 4.4%).
Sales and Office Occupations by Sex
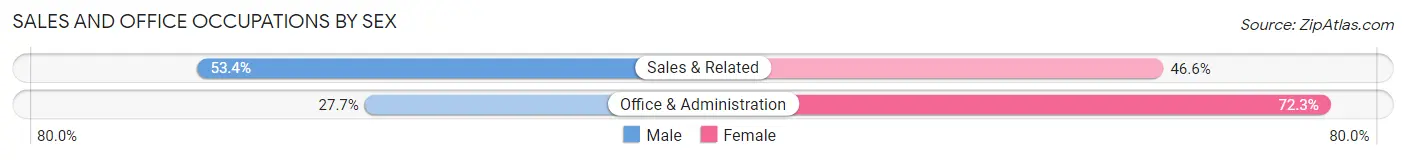
| Occupation | Male | Female |
| Sales & Related | 134 (53.4%) | 117 (46.6%) |
| Office & Administration | 18 (27.7%) | 47 (72.3%) |
| Total (Category) | 152 (48.1%) | 164 (51.9%) |
| Total (Overall) | 698 (47.5%) | 771 (52.5%) |
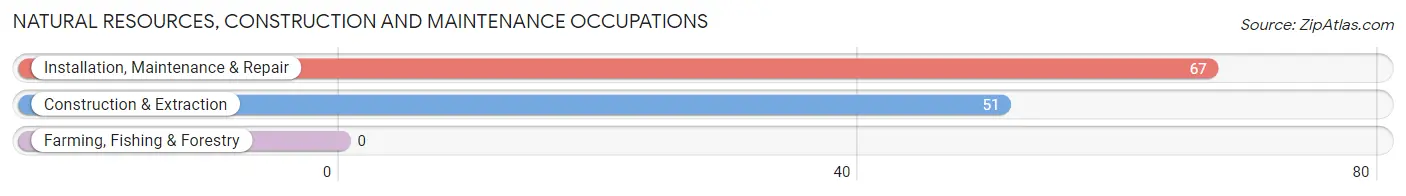
Natural Resources, Construction and Maintenance Occupations
The most common Natural Resources, Construction and Maintenance occupations in Yardley borough are Installation, Maintenance & Repair (67 | 4.6%), and Construction & Extraction (51 | 3.5%).
Natural Resources, Construction and Maintenance Occupations by Sex
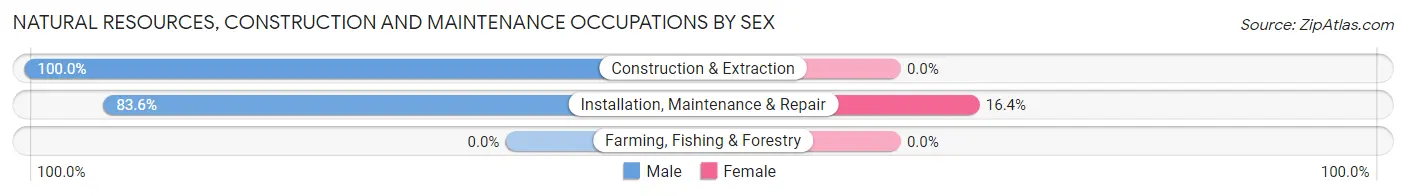
| Occupation | Male | Female |
| Farming, Fishing & Forestry | 0 (0.0%) | 0 (0.0%) |
| Construction & Extraction | 51 (100.0%) | 0 (0.0%) |
| Installation, Maintenance & Repair | 56 (83.6%) | 11 (16.4%) |
| Total (Category) | 107 (90.7%) | 11 (9.3%) |
| Total (Overall) | 698 (47.5%) | 771 (52.5%) |
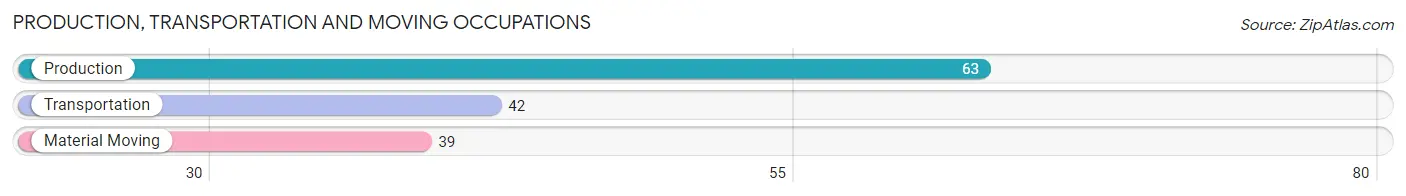
Production, Transportation and Moving Occupations
The most common Production, Transportation and Moving occupations in Yardley borough are Production (63 | 4.3%), Transportation (42 | 2.9%), and Material Moving (39 | 2.6%).
Production, Transportation and Moving Occupations by Sex
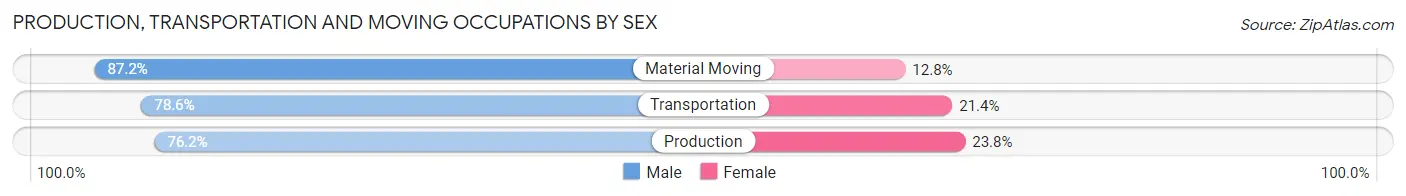
| Occupation | Male | Female |
| Production | 48 (76.2%) | 15 (23.8%) |
| Transportation | 33 (78.6%) | 9 (21.4%) |
| Material Moving | 34 (87.2%) | 5 (12.8%) |
| Total (Category) | 115 (79.9%) | 29 (20.1%) |
| Total (Overall) | 698 (47.5%) | 771 (52.5%) |
Employment Industries by Sex in Yardley borough
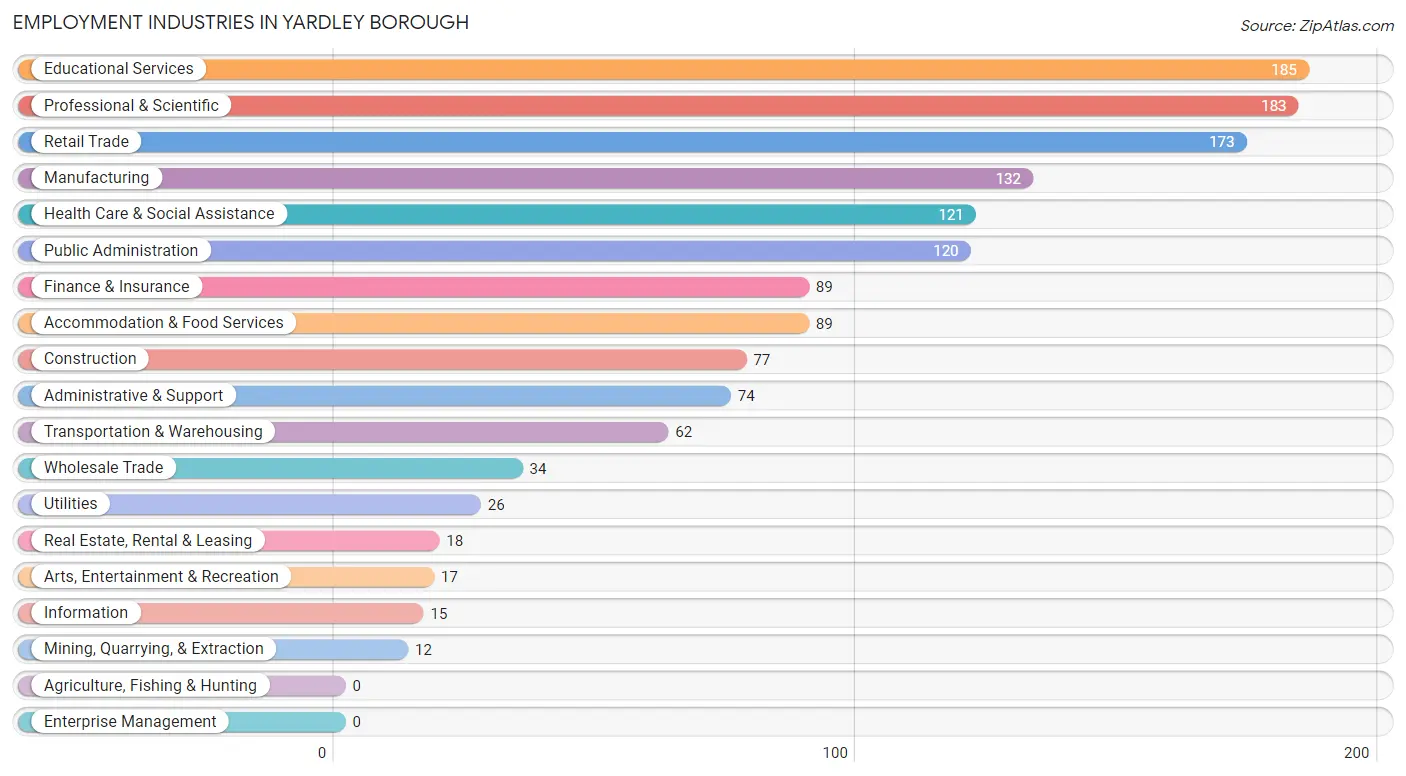
Employment Industries in Yardley borough
The major employment industries in Yardley borough include Educational Services (185 | 12.6%), Professional & Scientific (183 | 12.5%), Retail Trade (173 | 11.8%), Manufacturing (132 | 9.0%), and Health Care & Social Assistance (121 | 8.2%).
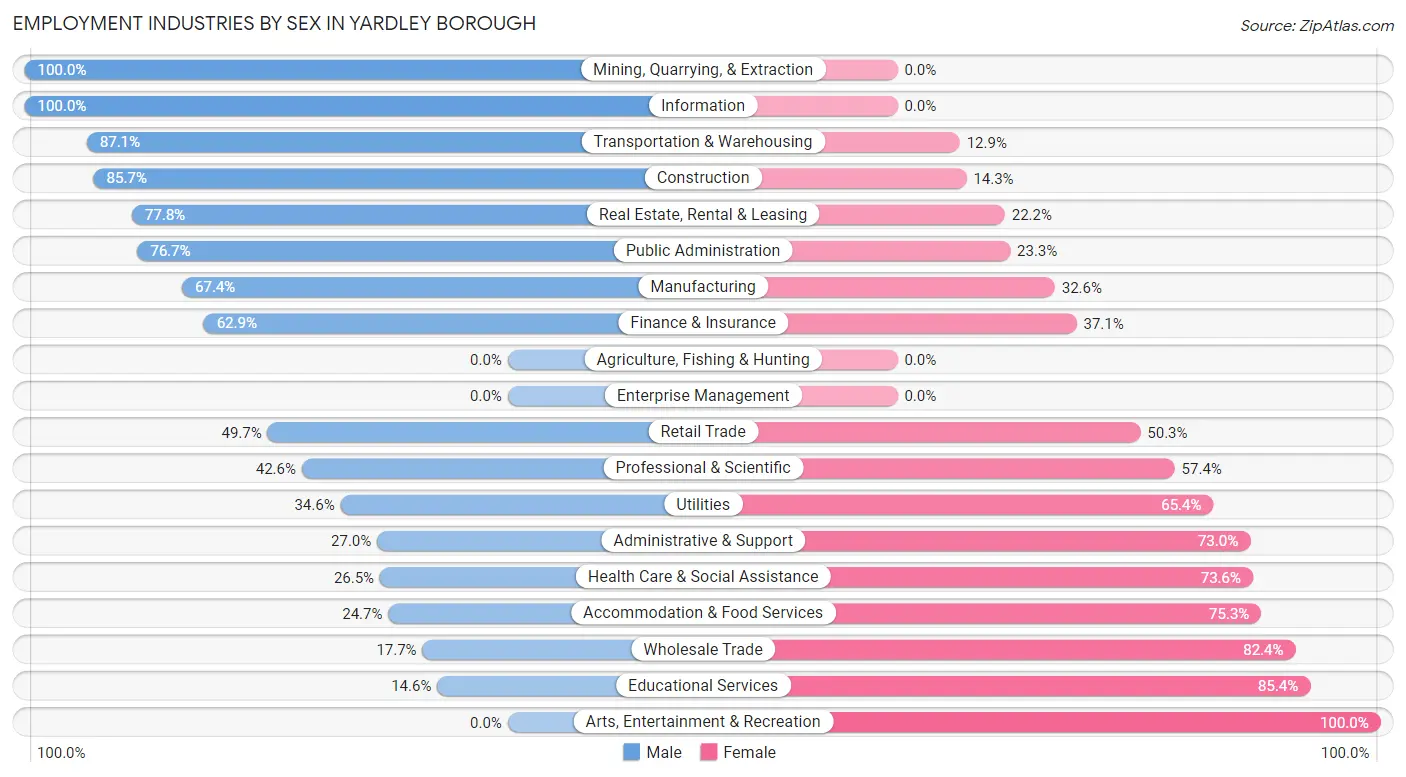
Employment Industries by Sex in Yardley borough
The Yardley borough industries that see more men than women are Mining, Quarrying, & Extraction (100.0%), Information (100.0%), and Transportation & Warehousing (87.1%), whereas the industries that tend to have a higher number of women are Arts, Entertainment & Recreation (100.0%), Educational Services (85.4%), and Wholesale Trade (82.4%).
| Industry | Male | Female |
| Agriculture, Fishing & Hunting | 0 (0.0%) | 0 (0.0%) |
| Mining, Quarrying, & Extraction | 12 (100.0%) | 0 (0.0%) |
| Construction | 66 (85.7%) | 11 (14.3%) |
| Manufacturing | 89 (67.4%) | 43 (32.6%) |
| Wholesale Trade | 6 (17.6%) | 28 (82.4%) |
| Retail Trade | 86 (49.7%) | 87 (50.3%) |
| Transportation & Warehousing | 54 (87.1%) | 8 (12.9%) |
| Utilities | 9 (34.6%) | 17 (65.4%) |
| Information | 15 (100.0%) | 0 (0.0%) |
| Finance & Insurance | 56 (62.9%) | 33 (37.1%) |
| Real Estate, Rental & Leasing | 14 (77.8%) | 4 (22.2%) |
| Professional & Scientific | 78 (42.6%) | 105 (57.4%) |
| Enterprise Management | 0 (0.0%) | 0 (0.0%) |
| Administrative & Support | 20 (27.0%) | 54 (73.0%) |
| Educational Services | 27 (14.6%) | 158 (85.4%) |
| Health Care & Social Assistance | 32 (26.5%) | 89 (73.6%) |
| Arts, Entertainment & Recreation | 0 (0.0%) | 17 (100.0%) |
| Accommodation & Food Services | 22 (24.7%) | 67 (75.3%) |
| Public Administration | 92 (76.7%) | 28 (23.3%) |
| Total | 698 (47.5%) | 771 (52.5%) |
Education in Yardley borough
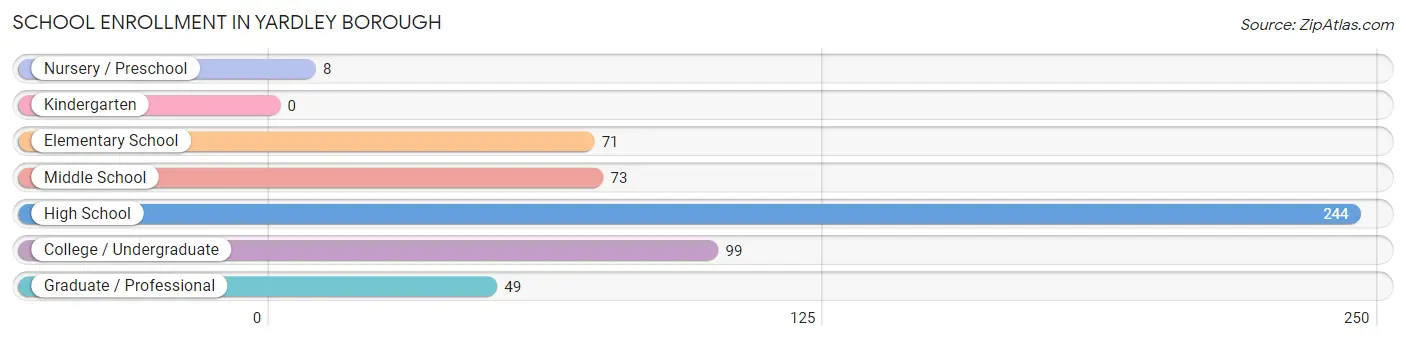
School Enrollment in Yardley borough
The most common levels of schooling among the 544 students in Yardley borough are high school (244 | 44.9%), college / undergraduate (99 | 18.2%), and middle school (73 | 13.4%).
| School Level | # Students | % Students |
| Nursery / Preschool | 8 | 1.5% |
| Kindergarten | 0 | 0.0% |
| Elementary School | 71 | 13.1% |
| Middle School | 73 | 13.4% |
| High School | 244 | 44.9% |
| College / Undergraduate | 99 | 18.2% |
| Graduate / Professional | 49 | 9.0% |
| Total | 544 | 100.0% |
School Enrollment by Age by Funding Source in Yardley borough
Out of a total of 544 students who are enrolled in schools in Yardley borough, 204 (37.5%) attend a private institution, while the remaining 340 (62.5%) are enrolled in public schools. The age group of 3 to 4 year olds has the highest likelihood of being enrolled in private schools, with 8 (100.0% in the age bracket) enrolled. Conversely, the age group of 5 to 9 year old has the lowest likelihood of being enrolled in a private school, with 71 (100.0% in the age bracket) attending a public institution.
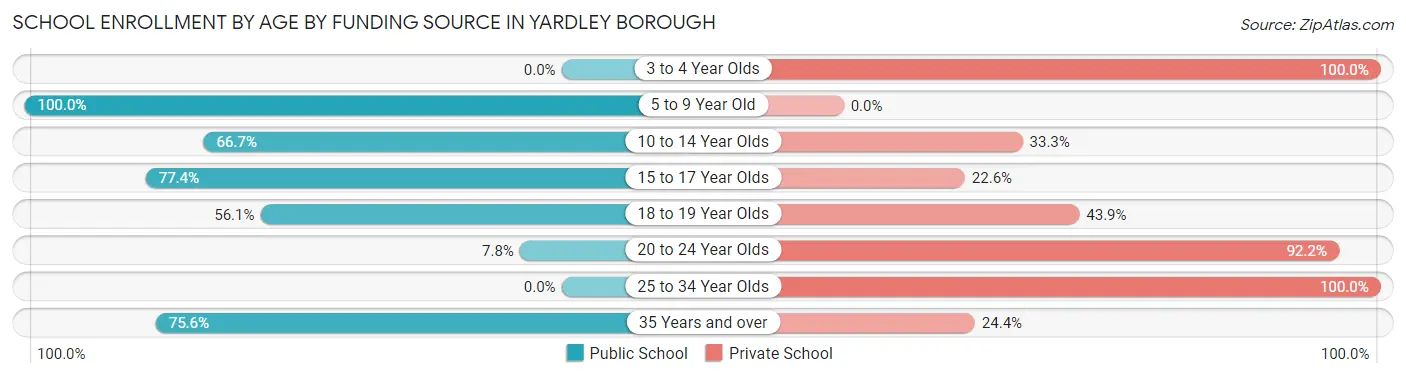
| Age Bracket | Public School | Private School |
| 3 to 4 Year Olds | 0 (0.0%) | 8 (100.0%) |
| 5 to 9 Year Old | 71 (100.0%) | 0 (0.0%) |
| 10 to 14 Year Olds | 86 (66.7%) | 43 (33.3%) |
| 15 to 17 Year Olds | 120 (77.4%) | 35 (22.6%) |
| 18 to 19 Year Olds | 23 (56.1%) | 18 (43.9%) |
| 20 to 24 Year Olds | 6 (7.8%) | 71 (92.2%) |
| 25 to 34 Year Olds | 0 (0.0%) | 18 (100.0%) |
| 35 Years and over | 34 (75.6%) | 11 (24.4%) |
| Total | 340 (62.5%) | 204 (37.5%) |
Educational Attainment by Field of Study in Yardley borough
Business (208 | 17.8%), psychology (147 | 12.6%), liberal arts & history (122 | 10.4%), education (113 | 9.7%), and bio, nature & agricultural (97 | 8.3%) are the most common fields of study among 1,169 individuals in Yardley borough who have obtained a bachelor's degree or higher.
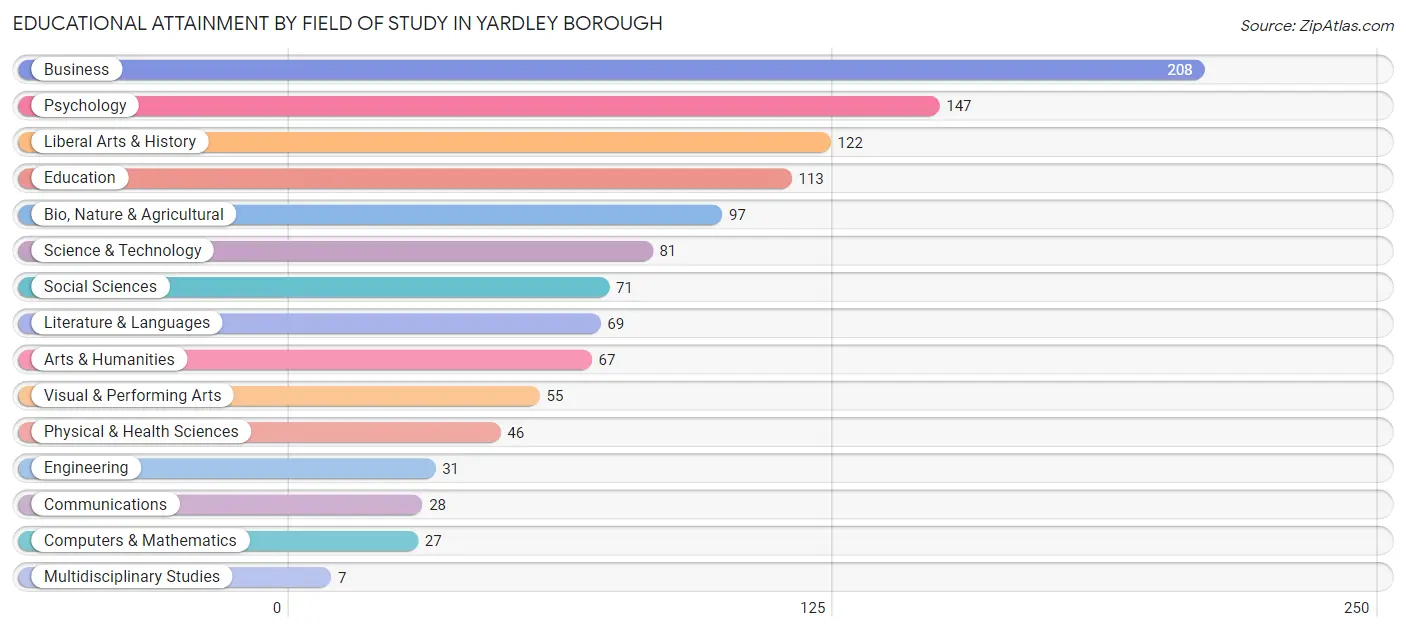
| Field of Study | # Graduates | % Graduates |
| Computers & Mathematics | 27 | 2.3% |
| Bio, Nature & Agricultural | 97 | 8.3% |
| Physical & Health Sciences | 46 | 3.9% |
| Psychology | 147 | 12.6% |
| Social Sciences | 71 | 6.1% |
| Engineering | 31 | 2.6% |
| Multidisciplinary Studies | 7 | 0.6% |
| Science & Technology | 81 | 6.9% |
| Business | 208 | 17.8% |
| Education | 113 | 9.7% |
| Literature & Languages | 69 | 5.9% |
| Liberal Arts & History | 122 | 10.4% |
| Visual & Performing Arts | 55 | 4.7% |
| Communications | 28 | 2.4% |
| Arts & Humanities | 67 | 5.7% |
| Total | 1,169 | 100.0% |
Transportation & Commute in Yardley borough
Vehicle Availability by Sex in Yardley borough
The most prevalent vehicle ownership categories in Yardley borough are males with 2 vehicles (392, accounting for 56.5%) and females with 2 vehicles (390, making up 51.6%).
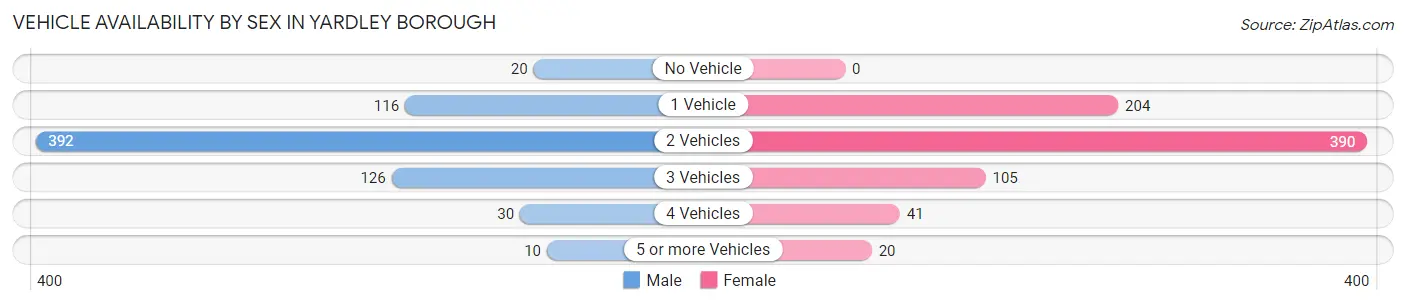
| Vehicles Available | Male | Female |
| No Vehicle | 20 (2.9%) | 0 (0.0%) |
| 1 Vehicle | 116 (16.7%) | 204 (26.8%) |
| 2 Vehicles | 392 (56.5%) | 390 (51.3%) |
| 3 Vehicles | 126 (18.2%) | 105 (13.8%) |
| 4 Vehicles | 30 (4.3%) | 41 (5.4%) |
| 5 or more Vehicles | 10 (1.4%) | 20 (2.6%) |
| Total | 694 (100.0%) | 760 (100.0%) |
Commute Time in Yardley borough
The most frequently occuring commute durations in Yardley borough are 45 to 59 minutes (244 commuters, 20.7%), 15 to 19 minutes (210 commuters, 17.8%), and 5 to 9 minutes (143 commuters, 12.1%).
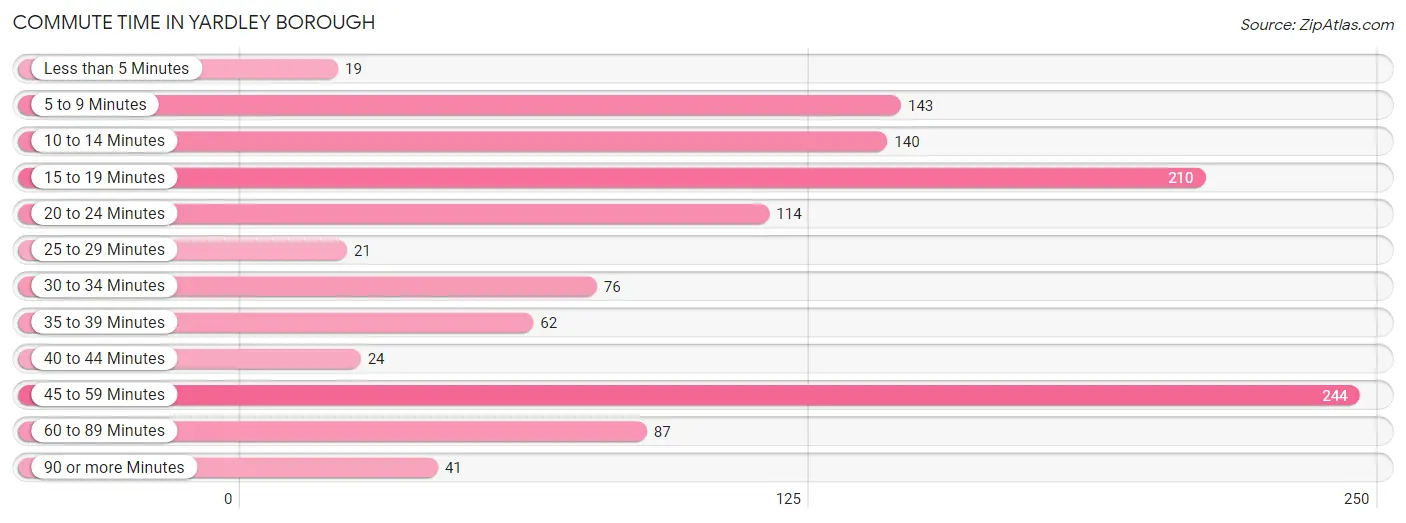
| Commute Time | # Commuters | % Commuters |
| Less than 5 Minutes | 19 | 1.6% |
| 5 to 9 Minutes | 143 | 12.1% |
| 10 to 14 Minutes | 140 | 11.8% |
| 15 to 19 Minutes | 210 | 17.8% |
| 20 to 24 Minutes | 114 | 9.7% |
| 25 to 29 Minutes | 21 | 1.8% |
| 30 to 34 Minutes | 76 | 6.4% |
| 35 to 39 Minutes | 62 | 5.2% |
| 40 to 44 Minutes | 24 | 2.0% |
| 45 to 59 Minutes | 244 | 20.7% |
| 60 to 89 Minutes | 87 | 7.4% |
| 90 or more Minutes | 41 | 3.5% |
Commute Time by Sex in Yardley borough
The most common commute times in Yardley borough are 45 to 59 minutes (147 commuters, 24.4%) for males and 15 to 19 minutes (156 commuters, 27.0%) for females.
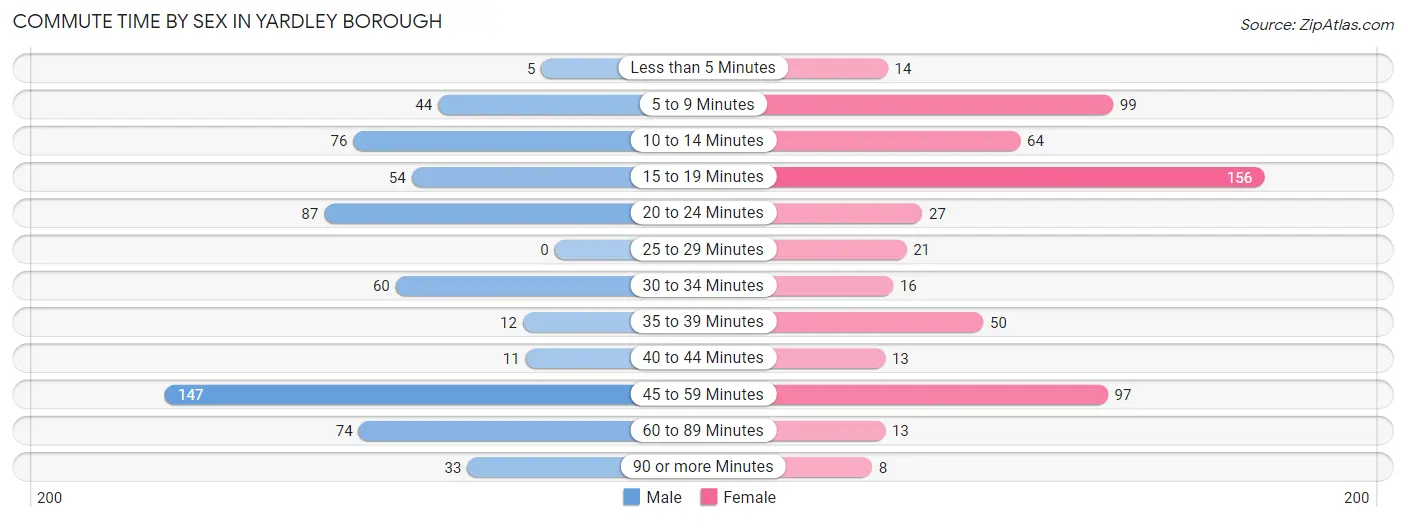
| Commute Time | Male | Female |
| Less than 5 Minutes | 5 (0.8%) | 14 (2.4%) |
| 5 to 9 Minutes | 44 (7.3%) | 99 (17.1%) |
| 10 to 14 Minutes | 76 (12.6%) | 64 (11.1%) |
| 15 to 19 Minutes | 54 (9.0%) | 156 (27.0%) |
| 20 to 24 Minutes | 87 (14.4%) | 27 (4.7%) |
| 25 to 29 Minutes | 0 (0.0%) | 21 (3.6%) |
| 30 to 34 Minutes | 60 (10.0%) | 16 (2.8%) |
| 35 to 39 Minutes | 12 (2.0%) | 50 (8.6%) |
| 40 to 44 Minutes | 11 (1.8%) | 13 (2.2%) |
| 45 to 59 Minutes | 147 (24.4%) | 97 (16.8%) |
| 60 to 89 Minutes | 74 (12.3%) | 13 (2.2%) |
| 90 or more Minutes | 33 (5.5%) | 8 (1.4%) |
Time of Departure to Work by Sex in Yardley borough
The most frequent times of departure to work in Yardley borough are 7:30 AM to 7:59 AM (153, 25.4%) for males and 6:30 AM to 6:59 AM (124, 21.4%) for females.
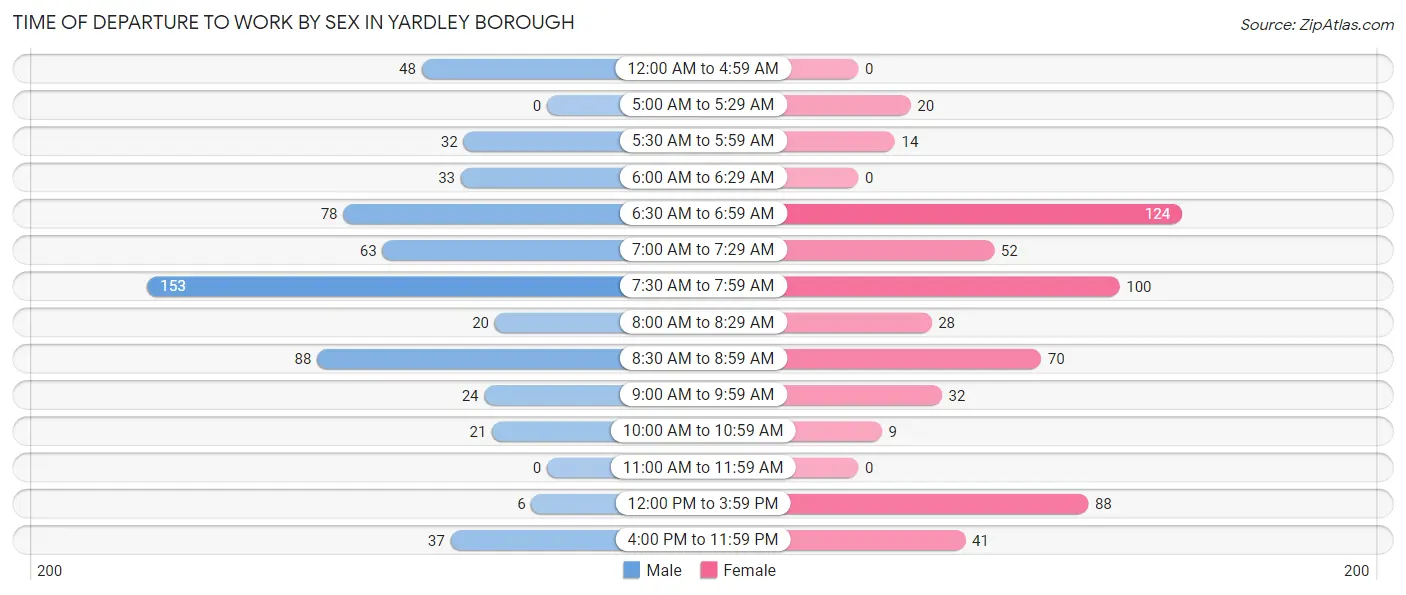
| Time of Departure | Male | Female |
| 12:00 AM to 4:59 AM | 48 (8.0%) | 0 (0.0%) |
| 5:00 AM to 5:29 AM | 0 (0.0%) | 20 (3.5%) |
| 5:30 AM to 5:59 AM | 32 (5.3%) | 14 (2.4%) |
| 6:00 AM to 6:29 AM | 33 (5.5%) | 0 (0.0%) |
| 6:30 AM to 6:59 AM | 78 (12.9%) | 124 (21.4%) |
| 7:00 AM to 7:29 AM | 63 (10.4%) | 52 (9.0%) |
| 7:30 AM to 7:59 AM | 153 (25.4%) | 100 (17.3%) |
| 8:00 AM to 8:29 AM | 20 (3.3%) | 28 (4.8%) |
| 8:30 AM to 8:59 AM | 88 (14.6%) | 70 (12.1%) |
| 9:00 AM to 9:59 AM | 24 (4.0%) | 32 (5.5%) |
| 10:00 AM to 10:59 AM | 21 (3.5%) | 9 (1.6%) |
| 11:00 AM to 11:59 AM | 0 (0.0%) | 0 (0.0%) |
| 12:00 PM to 3:59 PM | 6 (1.0%) | 88 (15.2%) |
| 4:00 PM to 11:59 PM | 37 (6.1%) | 41 (7.1%) |
| Total | 603 (100.0%) | 578 (100.0%) |
Housing Occupancy in Yardley borough
Occupancy by Ownership in Yardley borough
Of the total 1,153 dwellings in Yardley borough, owner-occupied units account for 832 (72.2%), while renter-occupied units make up 321 (27.8%).
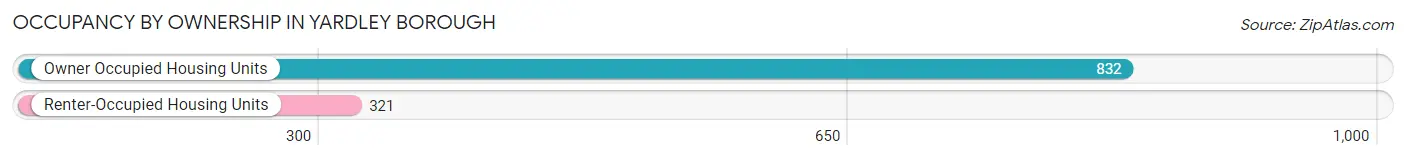
| Occupancy | # Housing Units | % Housing Units |
| Owner Occupied Housing Units | 832 | 72.2% |
| Renter-Occupied Housing Units | 321 | 27.8% |
| Total Occupied Housing Units | 1,153 | 100.0% |
Occupancy by Household Size in Yardley borough
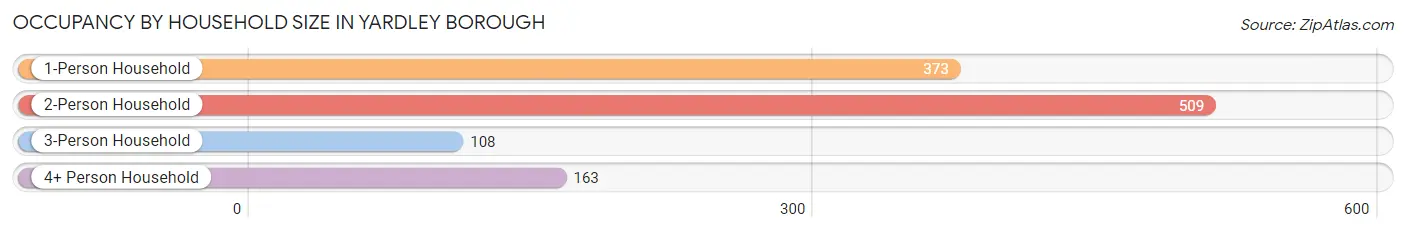
| Household Size | # Housing Units | % Housing Units |
| 1-Person Household | 373 | 32.4% |
| 2-Person Household | 509 | 44.2% |
| 3-Person Household | 108 | 9.4% |
| 4+ Person Household | 163 | 14.1% |
| Total Housing Units | 1,153 | 100.0% |
Occupancy by Ownership by Household Size in Yardley borough
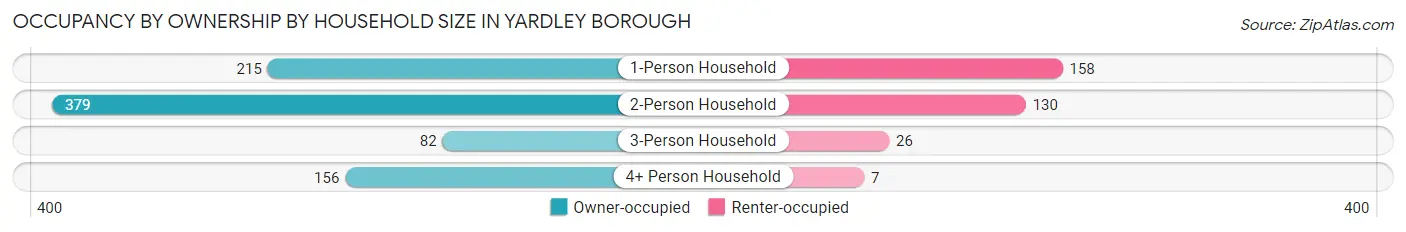
| Household Size | Owner-occupied | Renter-occupied |
| 1-Person Household | 215 (57.6%) | 158 (42.4%) |
| 2-Person Household | 379 (74.5%) | 130 (25.5%) |
| 3-Person Household | 82 (75.9%) | 26 (24.1%) |
| 4+ Person Household | 156 (95.7%) | 7 (4.3%) |
| Total Housing Units | 832 (72.2%) | 321 (27.8%) |
Occupancy by Educational Attainment in Yardley borough
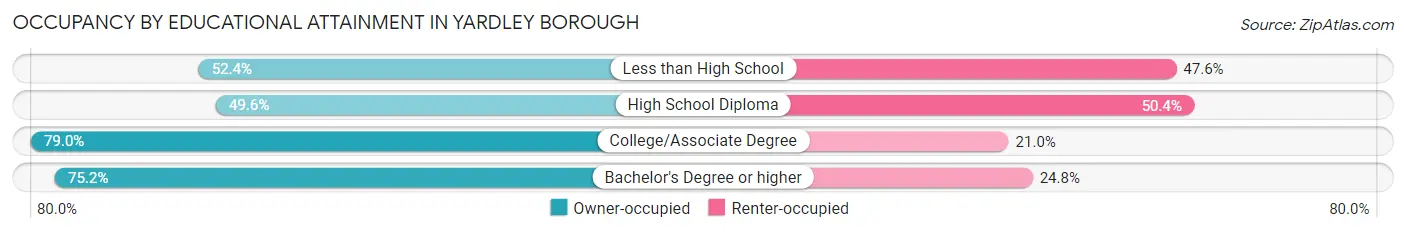
| Household Size | Owner-occupied | Renter-occupied |
| Less than High School | 22 (52.4%) | 20 (47.6%) |
| High School Diploma | 68 (49.6%) | 69 (50.4%) |
| College/Associate Degree | 203 (79.0%) | 54 (21.0%) |
| Bachelor's Degree or higher | 539 (75.2%) | 178 (24.8%) |
Occupancy by Age of Householder in Yardley borough
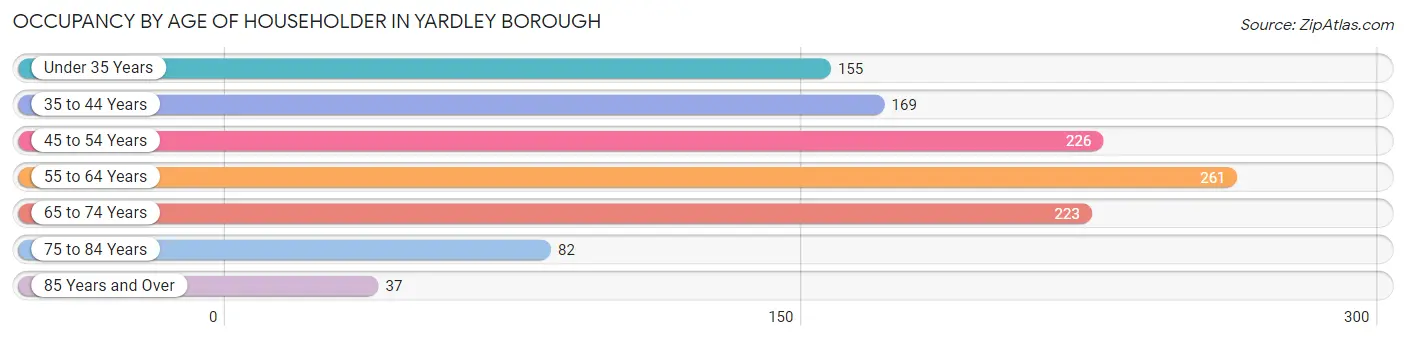
| Age Bracket | # Households | % Households |
| Under 35 Years | 155 | 13.4% |
| 35 to 44 Years | 169 | 14.7% |
| 45 to 54 Years | 226 | 19.6% |
| 55 to 64 Years | 261 | 22.6% |
| 65 to 74 Years | 223 | 19.3% |
| 75 to 84 Years | 82 | 7.1% |
| 85 Years and Over | 37 | 3.2% |
| Total | 1,153 | 100.0% |
Housing Finances in Yardley borough
Median Income by Occupancy in Yardley borough
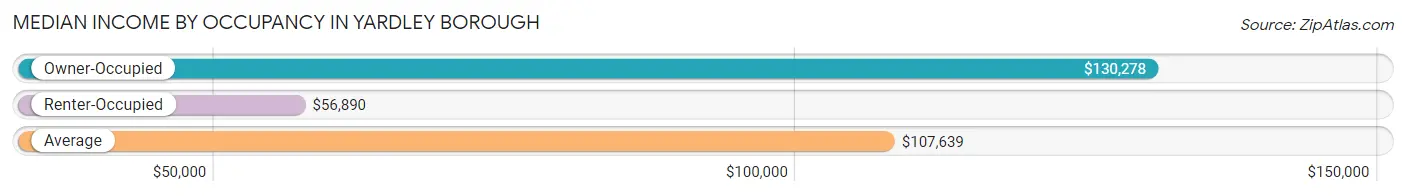
| Occupancy Type | # Households | Median Income |
| Owner-Occupied | 832 (72.2%) | $130,278 |
| Renter-Occupied | 321 (27.8%) | $56,890 |
| Average | 1,153 (100.0%) | $107,639 |
Occupancy by Householder Income Bracket in Yardley borough
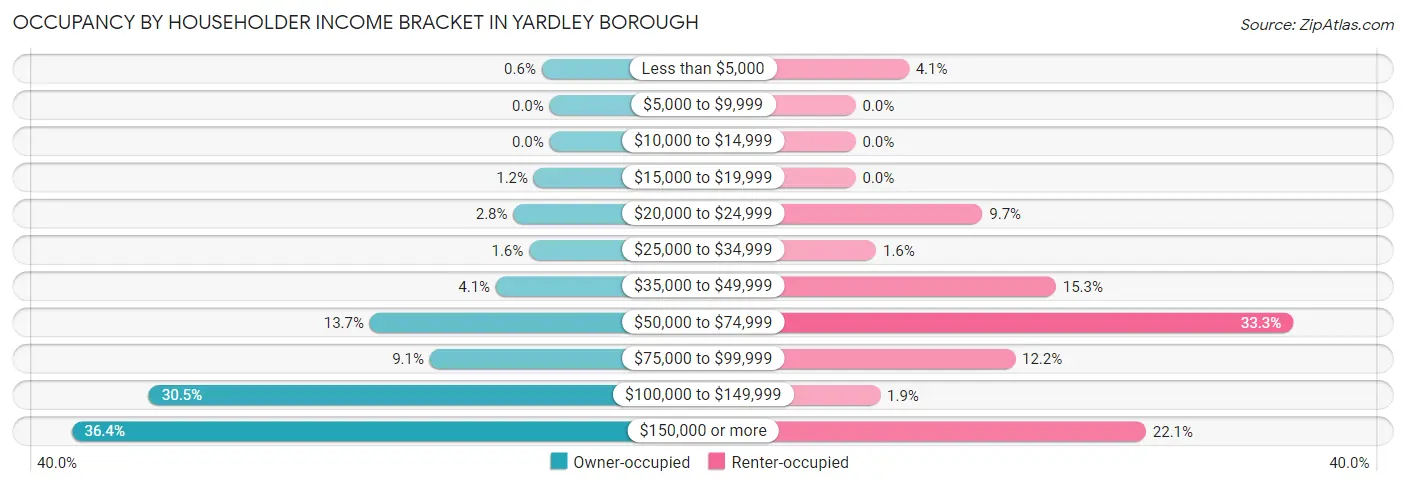
| Income Bracket | Owner-occupied | Renter-occupied |
| Less than $5,000 | 5 (0.6%) | 13 (4.1%) |
| $5,000 to $9,999 | 0 (0.0%) | 0 (0.0%) |
| $10,000 to $14,999 | 0 (0.0%) | 0 (0.0%) |
| $15,000 to $19,999 | 10 (1.2%) | 0 (0.0%) |
| $20,000 to $24,999 | 23 (2.8%) | 31 (9.7%) |
| $25,000 to $34,999 | 13 (1.6%) | 5 (1.6%) |
| $35,000 to $49,999 | 34 (4.1%) | 49 (15.3%) |
| $50,000 to $74,999 | 114 (13.7%) | 107 (33.3%) |
| $75,000 to $99,999 | 76 (9.1%) | 39 (12.1%) |
| $100,000 to $149,999 | 254 (30.5%) | 6 (1.9%) |
| $150,000 or more | 303 (36.4%) | 71 (22.1%) |
| Total | 832 (100.0%) | 321 (100.0%) |
Monthly Housing Cost Tiers in Yardley borough
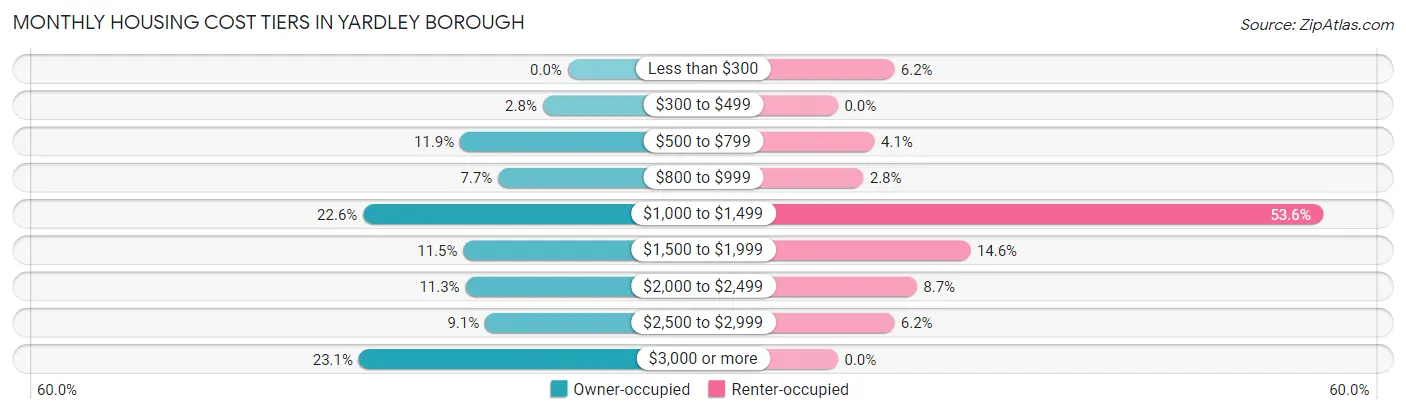
| Monthly Cost | Owner-occupied | Renter-occupied |
| Less than $300 | 0 (0.0%) | 20 (6.2%) |
| $300 to $499 | 23 (2.8%) | 0 (0.0%) |
| $500 to $799 | 99 (11.9%) | 13 (4.1%) |
| $800 to $999 | 64 (7.7%) | 9 (2.8%) |
| $1,000 to $1,499 | 188 (22.6%) | 172 (53.6%) |
| $1,500 to $1,999 | 96 (11.5%) | 47 (14.6%) |
| $2,000 to $2,499 | 94 (11.3%) | 28 (8.7%) |
| $2,500 to $2,999 | 76 (9.1%) | 20 (6.2%) |
| $3,000 or more | 192 (23.1%) | 0 (0.0%) |
| Total | 832 (100.0%) | 321 (100.0%) |
Physical Housing Characteristics in Yardley borough
Housing Structures in Yardley borough
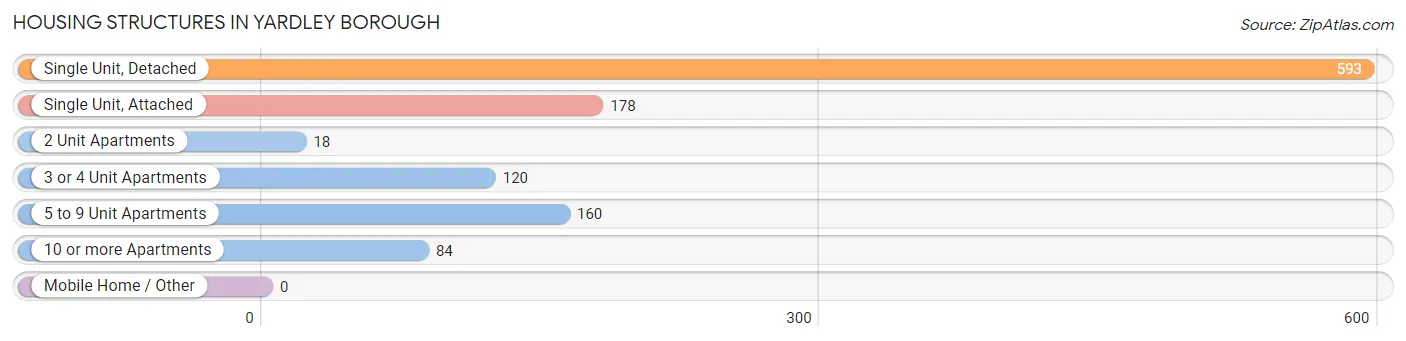
| Structure Type | # Housing Units | % Housing Units |
| Single Unit, Detached | 593 | 51.4% |
| Single Unit, Attached | 178 | 15.4% |
| 2 Unit Apartments | 18 | 1.6% |
| 3 or 4 Unit Apartments | 120 | 10.4% |
| 5 to 9 Unit Apartments | 160 | 13.9% |
| 10 or more Apartments | 84 | 7.3% |
| Mobile Home / Other | 0 | 0.0% |
| Total | 1,153 | 100.0% |
Housing Structures by Occupancy in Yardley borough
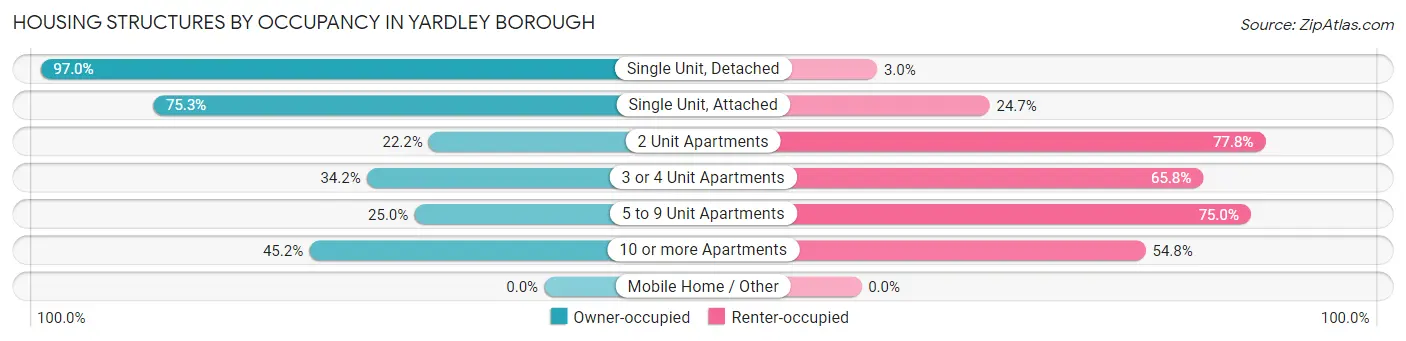
| Structure Type | Owner-occupied | Renter-occupied |
| Single Unit, Detached | 575 (97.0%) | 18 (3.0%) |
| Single Unit, Attached | 134 (75.3%) | 44 (24.7%) |
| 2 Unit Apartments | 4 (22.2%) | 14 (77.8%) |
| 3 or 4 Unit Apartments | 41 (34.2%) | 79 (65.8%) |
| 5 to 9 Unit Apartments | 40 (25.0%) | 120 (75.0%) |
| 10 or more Apartments | 38 (45.2%) | 46 (54.8%) |
| Mobile Home / Other | 0 (0.0%) | 0 (0.0%) |
| Total | 832 (72.2%) | 321 (27.8%) |
Housing Structures by Number of Rooms in Yardley borough
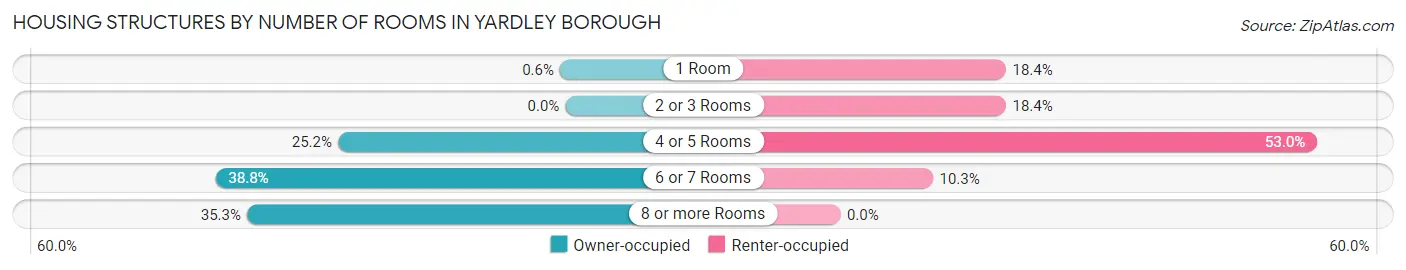
| Number of Rooms | Owner-occupied | Renter-occupied |
| 1 Room | 5 (0.6%) | 59 (18.4%) |
| 2 or 3 Rooms | 0 (0.0%) | 59 (18.4%) |
| 4 or 5 Rooms | 210 (25.2%) | 170 (53.0%) |
| 6 or 7 Rooms | 323 (38.8%) | 33 (10.3%) |
| 8 or more Rooms | 294 (35.3%) | 0 (0.0%) |
| Total | 832 (100.0%) | 321 (100.0%) |
Housing Structure by Heating Type in Yardley borough
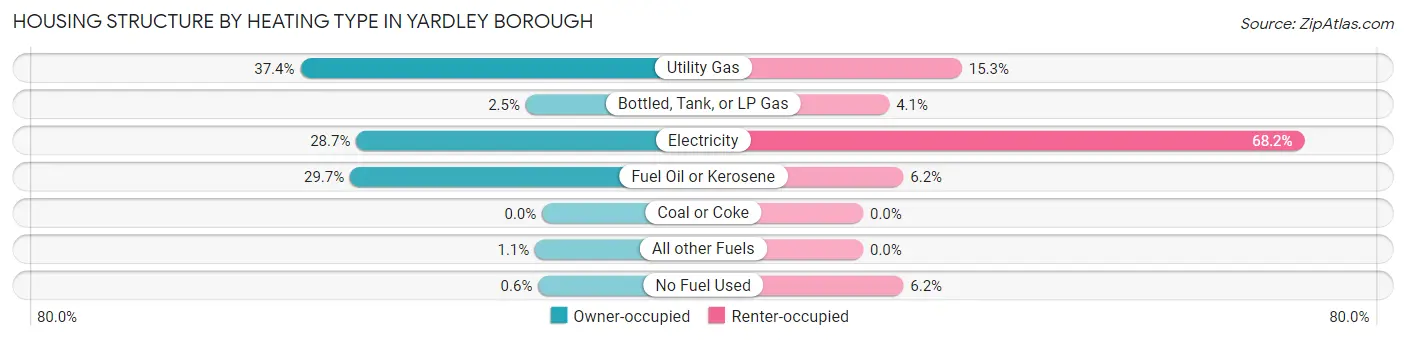
| Heating Type | Owner-occupied | Renter-occupied |
| Utility Gas | 311 (37.4%) | 49 (15.3%) |
| Bottled, Tank, or LP Gas | 21 (2.5%) | 13 (4.1%) |
| Electricity | 239 (28.7%) | 219 (68.2%) |
| Fuel Oil or Kerosene | 247 (29.7%) | 20 (6.2%) |
| Coal or Coke | 0 (0.0%) | 0 (0.0%) |
| All other Fuels | 9 (1.1%) | 0 (0.0%) |
| No Fuel Used | 5 (0.6%) | 20 (6.2%) |
| Total | 832 (100.0%) | 321 (100.0%) |
Household Vehicle Usage in Yardley borough
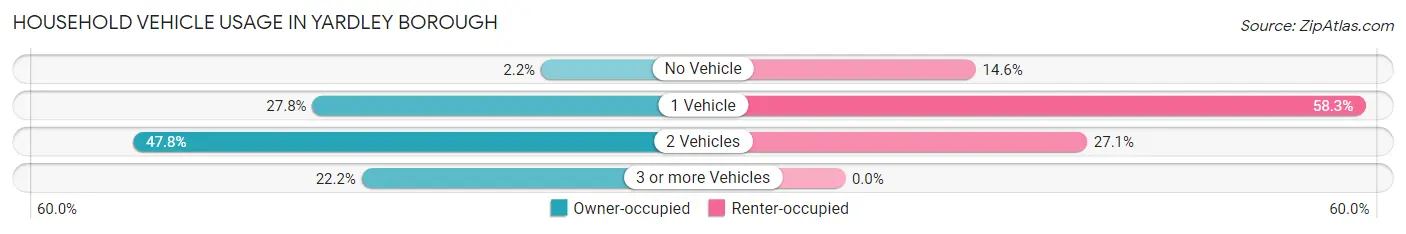
| Vehicles per Household | Owner-occupied | Renter-occupied |
| No Vehicle | 18 (2.2%) | 47 (14.6%) |
| 1 Vehicle | 231 (27.8%) | 187 (58.3%) |
| 2 Vehicles | 398 (47.8%) | 87 (27.1%) |
| 3 or more Vehicles | 185 (22.2%) | 0 (0.0%) |
| Total | 832 (100.0%) | 321 (100.0%) |
Real Estate & Mortgages in Yardley borough
Real Estate and Mortgage Overview in Yardley borough
| Characteristic | Without Mortgage | With Mortgage |
| Housing Units | 332 | 500 |
| Median Property Value | $373,000 | $501,400 |
| Median Household Income | $83,333 | $229 |
| Monthly Housing Costs | $988 | $192 |
| Real Estate Taxes | $4,692 | $0 |
Property Value by Mortgage Status in Yardley borough
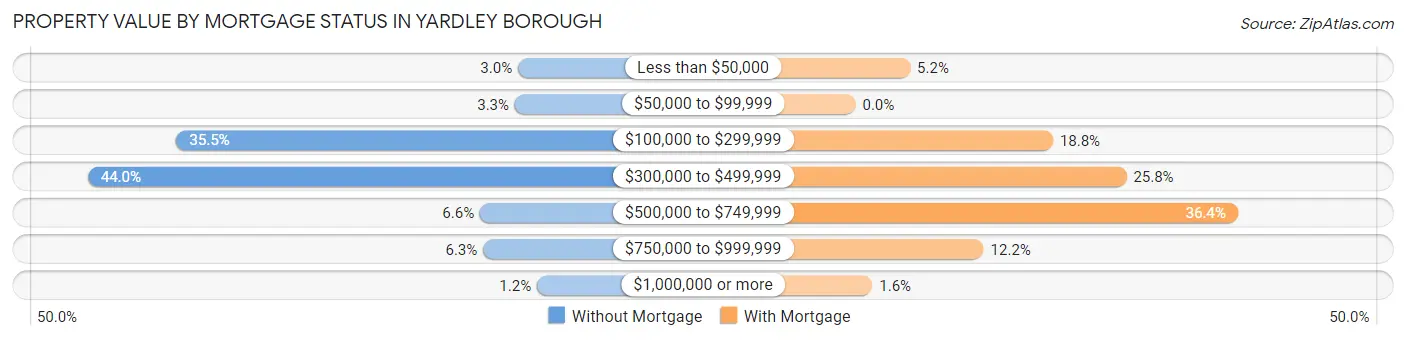
| Property Value | Without Mortgage | With Mortgage |
| Less than $50,000 | 10 (3.0%) | 26 (5.2%) |
| $50,000 to $99,999 | 11 (3.3%) | 0 (0.0%) |
| $100,000 to $299,999 | 118 (35.5%) | 94 (18.8%) |
| $300,000 to $499,999 | 146 (44.0%) | 129 (25.8%) |
| $500,000 to $749,999 | 22 (6.6%) | 182 (36.4%) |
| $750,000 to $999,999 | 21 (6.3%) | 61 (12.2%) |
| $1,000,000 or more | 4 (1.2%) | 8 (1.6%) |
| Total | 332 (100.0%) | 500 (100.0%) |
Household Income by Mortgage Status in Yardley borough
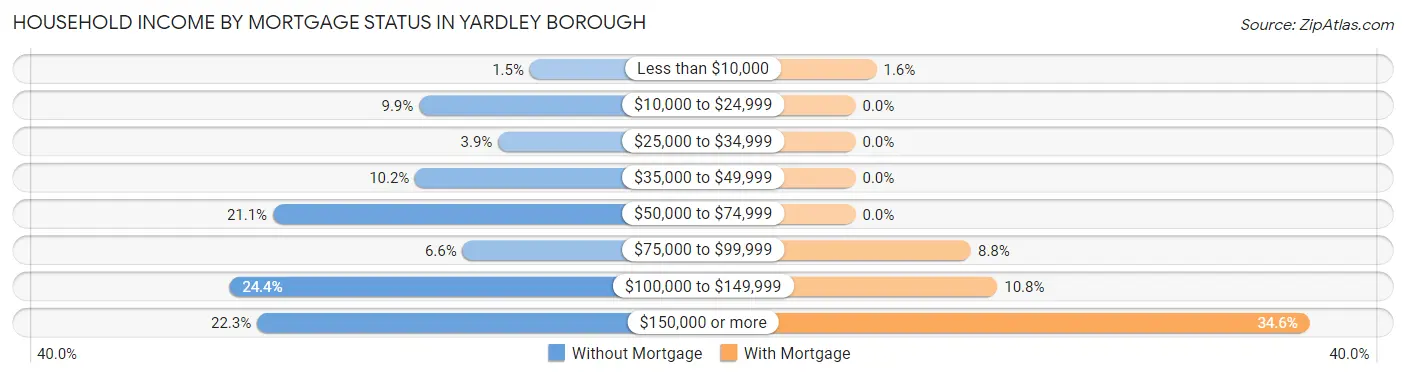
| Household Income | Without Mortgage | With Mortgage |
| Less than $10,000 | 5 (1.5%) | 8 (1.6%) |
| $10,000 to $24,999 | 33 (9.9%) | 0 (0.0%) |
| $25,000 to $34,999 | 13 (3.9%) | 0 (0.0%) |
| $35,000 to $49,999 | 34 (10.2%) | 0 (0.0%) |
| $50,000 to $74,999 | 70 (21.1%) | 0 (0.0%) |
| $75,000 to $99,999 | 22 (6.6%) | 44 (8.8%) |
| $100,000 to $149,999 | 81 (24.4%) | 54 (10.8%) |
| $150,000 or more | 74 (22.3%) | 173 (34.6%) |
| Total | 332 (100.0%) | 500 (100.0%) |
Property Value to Household Income Ratio in Yardley borough
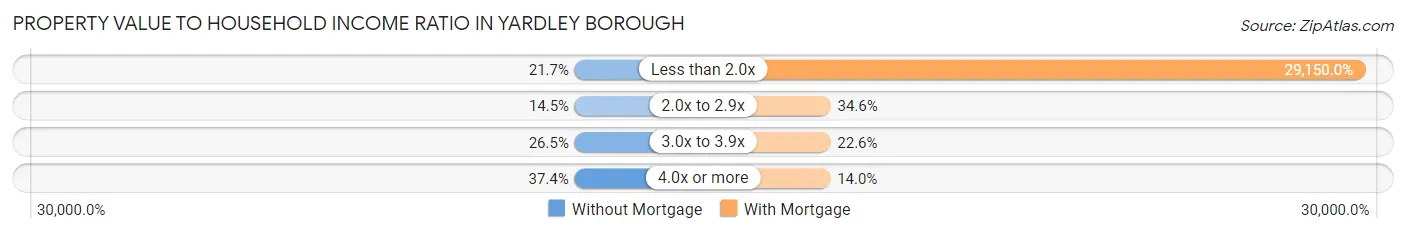
| Value-to-Income Ratio | Without Mortgage | With Mortgage |
| Less than 2.0x | 72 (21.7%) | 145,750 (29,150.0%) |
| 2.0x to 2.9x | 48 (14.5%) | 173 (34.6%) |
| 3.0x to 3.9x | 88 (26.5%) | 113 (22.6%) |
| 4.0x or more | 124 (37.3%) | 70 (14.0%) |
| Total | 332 (100.0%) | 500 (100.0%) |
Real Estate Taxes by Mortgage Status in Yardley borough
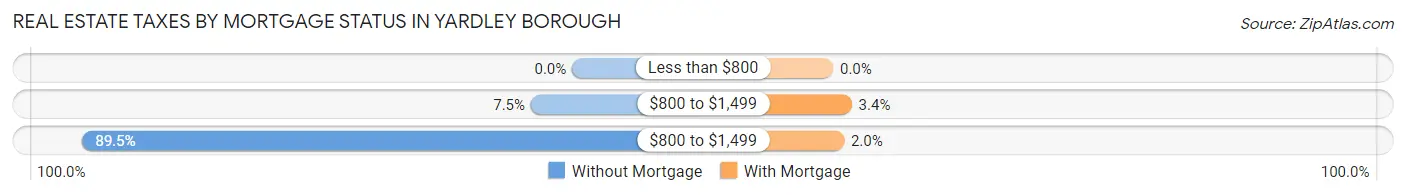
| Property Taxes | Without Mortgage | With Mortgage |
| Less than $800 | 0 (0.0%) | 0 (0.0%) |
| $800 to $1,499 | 25 (7.5%) | 17 (3.4%) |
| $800 to $1,499 | 297 (89.5%) | 10 (2.0%) |
| Total | 332 (100.0%) | 500 (100.0%) |
Health & Disability in Yardley borough
Health Insurance Coverage by Age in Yardley borough
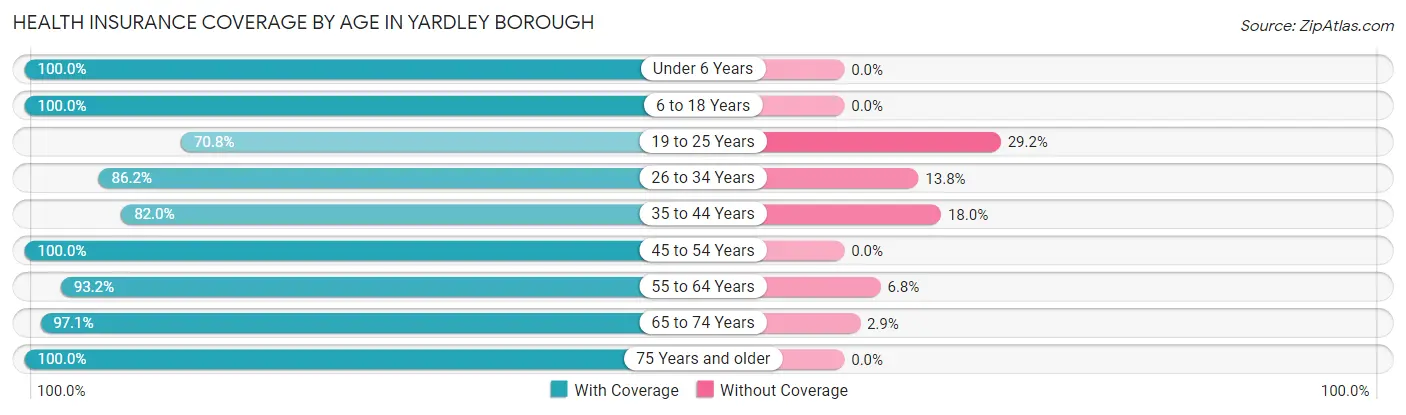
| Age Bracket | With Coverage | Without Coverage |
| Under 6 Years | 94 (100.0%) | 0 (0.0%) |
| 6 to 18 Years | 388 (100.0%) | 0 (0.0%) |
| 19 to 25 Years | 170 (70.8%) | 70 (29.2%) |
| 26 to 34 Years | 262 (86.2%) | 42 (13.8%) |
| 35 to 44 Years | 200 (82.0%) | 44 (18.0%) |
| 45 to 54 Years | 392 (100.0%) | 0 (0.0%) |
| 55 to 64 Years | 414 (93.2%) | 30 (6.8%) |
| 65 to 74 Years | 333 (97.1%) | 10 (2.9%) |
| 75 Years and older | 142 (100.0%) | 0 (0.0%) |
| Total | 2,395 (92.4%) | 196 (7.6%) |
Health Insurance Coverage by Citizenship Status in Yardley borough
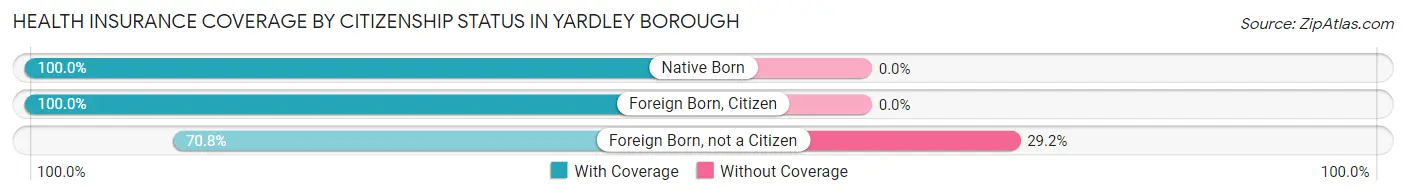
| Citizenship Status | With Coverage | Without Coverage |
| Native Born | 94 (100.0%) | 0 (0.0%) |
| Foreign Born, Citizen | 388 (100.0%) | 0 (0.0%) |
| Foreign Born, not a Citizen | 170 (70.8%) | 70 (29.2%) |
Health Insurance Coverage by Household Income in Yardley borough
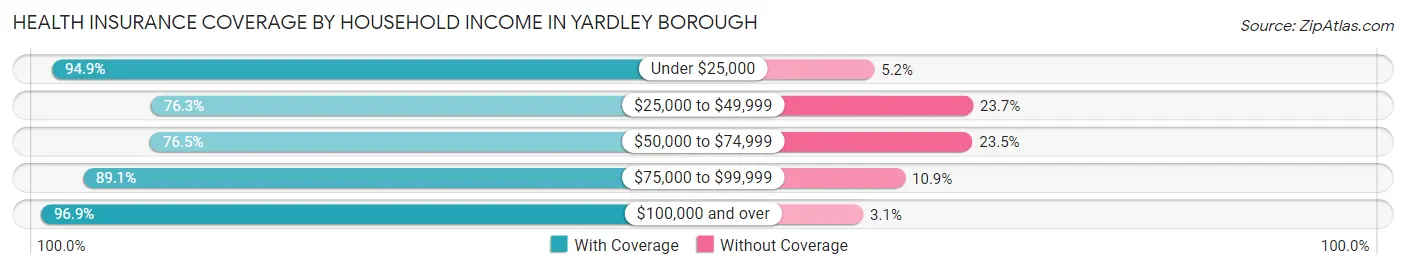
| Household Income | With Coverage | Without Coverage |
| Under $25,000 | 92 (94.9%) | 5 (5.1%) |
| $25,000 to $49,999 | 100 (76.3%) | 31 (23.7%) |
| $50,000 to $74,999 | 260 (76.5%) | 80 (23.5%) |
| $75,000 to $99,999 | 204 (89.1%) | 25 (10.9%) |
| $100,000 and over | 1,739 (96.9%) | 55 (3.1%) |
Public vs Private Health Insurance Coverage by Age in Yardley borough
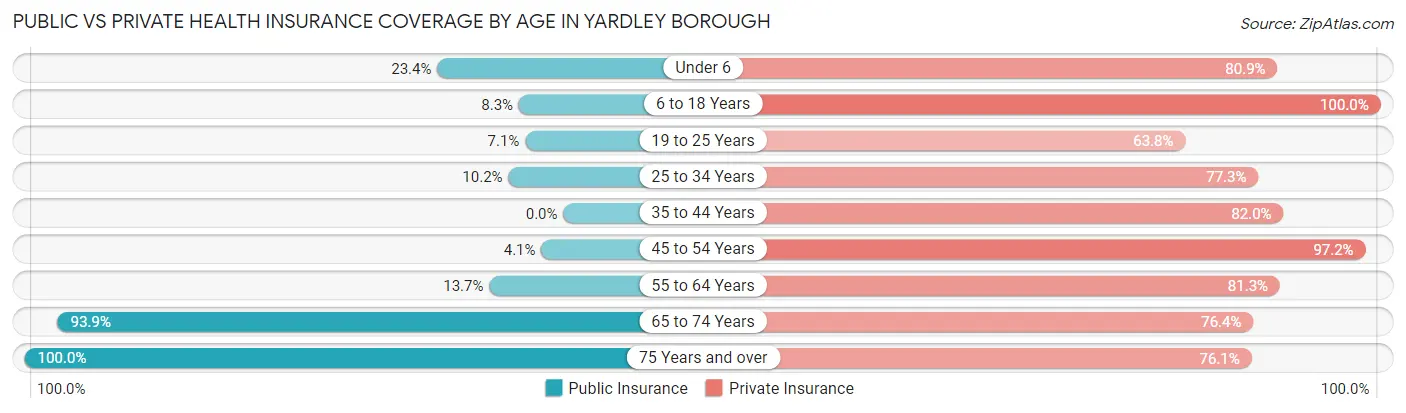
| Age Bracket | Public Insurance | Private Insurance |
| Under 6 | 22 (23.4%) | 76 (80.8%) |
| 6 to 18 Years | 32 (8.3%) | 388 (100.0%) |
| 19 to 25 Years | 17 (7.1%) | 153 (63.7%) |
| 25 to 34 Years | 31 (10.2%) | 235 (77.3%) |
| 35 to 44 Years | 0 (0.0%) | 200 (82.0%) |
| 45 to 54 Years | 16 (4.1%) | 381 (97.2%) |
| 55 to 64 Years | 61 (13.7%) | 361 (81.3%) |
| 65 to 74 Years | 322 (93.9%) | 262 (76.4%) |
| 75 Years and over | 142 (100.0%) | 108 (76.1%) |
| Total | 643 (24.8%) | 2,164 (83.5%) |
Disability Status by Sex by Age in Yardley borough
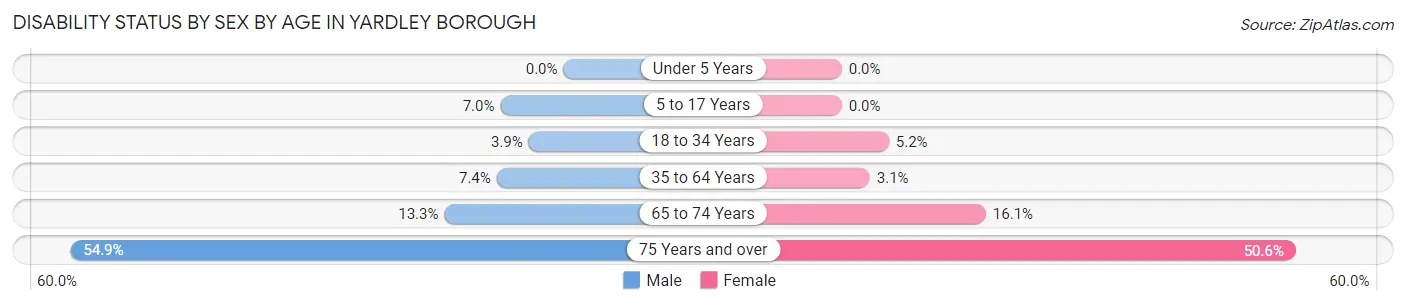
| Age Bracket | Male | Female |
| Under 5 Years | 0 (0.0%) | 0 (0.0%) |
| 5 to 17 Years | 12 (7.0%) | 0 (0.0%) |
| 18 to 34 Years | 12 (3.9%) | 14 (5.2%) |
| 35 to 64 Years | 35 (7.4%) | 19 (3.1%) |
| 65 to 74 Years | 24 (13.3%) | 26 (16.1%) |
| 75 Years and over | 28 (54.9%) | 46 (50.5%) |
Disability Class by Sex by Age in Yardley borough
Disability Class: Hearing Difficulty
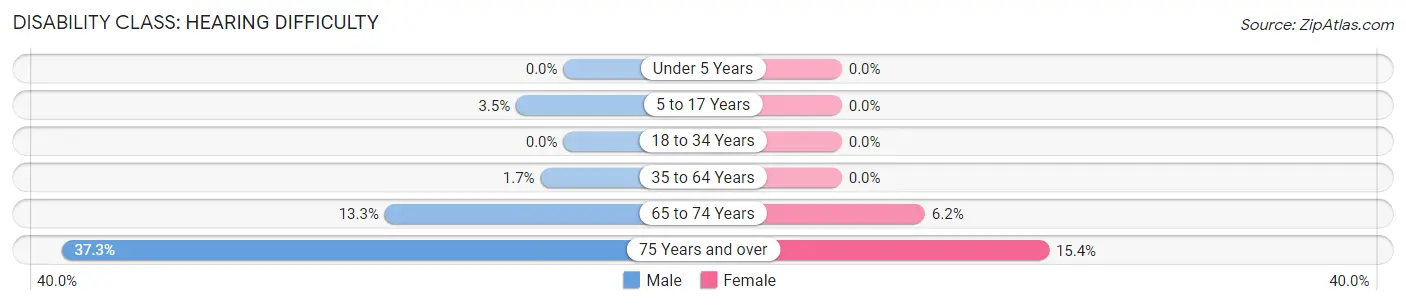
| Age Bracket | Male | Female |
| Under 5 Years | 0 (0.0%) | 0 (0.0%) |
| 5 to 17 Years | 6 (3.5%) | 0 (0.0%) |
| 18 to 34 Years | 0 (0.0%) | 0 (0.0%) |
| 35 to 64 Years | 8 (1.7%) | 0 (0.0%) |
| 65 to 74 Years | 24 (13.3%) | 10 (6.2%) |
| 75 Years and over | 19 (37.2%) | 14 (15.4%) |
Disability Class: Vision Difficulty
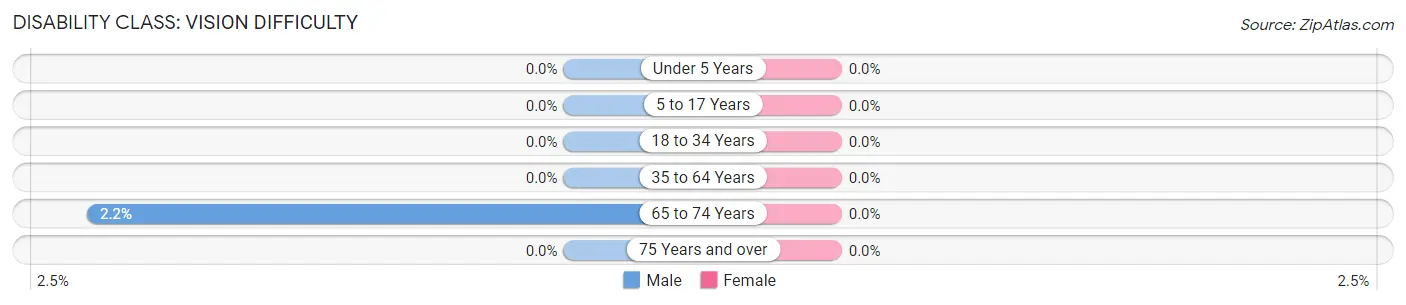
| Age Bracket | Male | Female |
| Under 5 Years | 0 (0.0%) | 0 (0.0%) |
| 5 to 17 Years | 0 (0.0%) | 0 (0.0%) |
| 18 to 34 Years | 0 (0.0%) | 0 (0.0%) |
| 35 to 64 Years | 0 (0.0%) | 0 (0.0%) |
| 65 to 74 Years | 4 (2.2%) | 0 (0.0%) |
| 75 Years and over | 0 (0.0%) | 0 (0.0%) |
Disability Class: Cognitive Difficulty
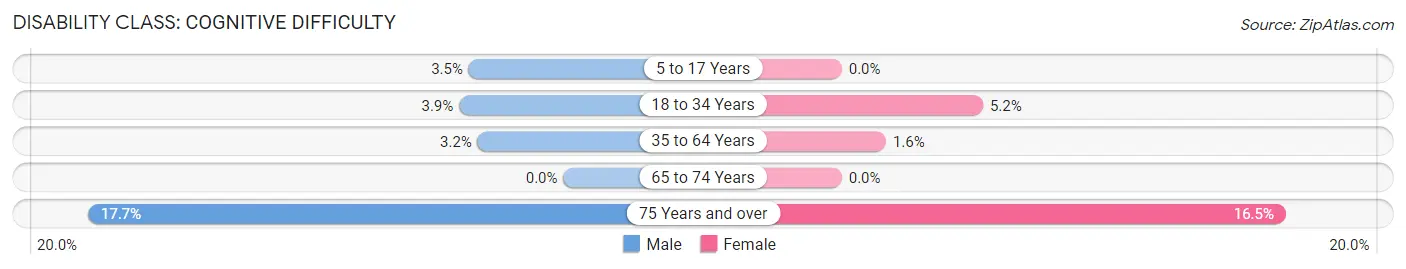
| Age Bracket | Male | Female |
| 5 to 17 Years | 6 (3.5%) | 0 (0.0%) |
| 18 to 34 Years | 12 (3.9%) | 14 (5.2%) |
| 35 to 64 Years | 15 (3.2%) | 10 (1.6%) |
| 65 to 74 Years | 0 (0.0%) | 0 (0.0%) |
| 75 Years and over | 9 (17.6%) | 15 (16.5%) |
Disability Class: Ambulatory Difficulty
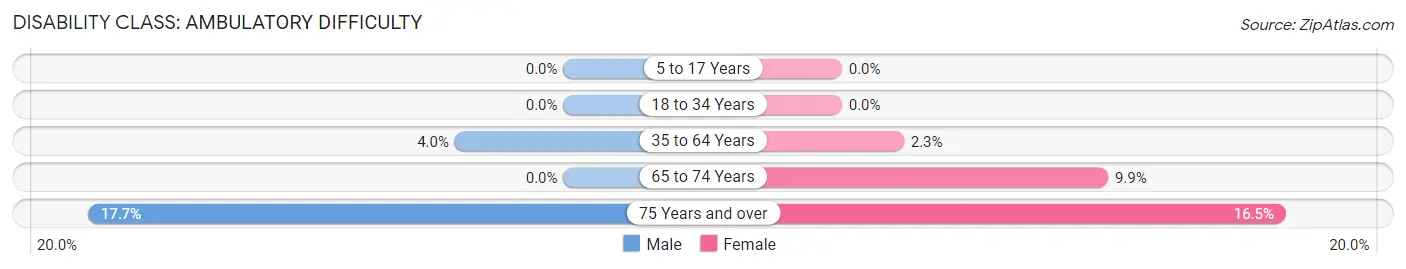
| Age Bracket | Male | Female |
| 5 to 17 Years | 0 (0.0%) | 0 (0.0%) |
| 18 to 34 Years | 0 (0.0%) | 0 (0.0%) |
| 35 to 64 Years | 19 (4.0%) | 14 (2.3%) |
| 65 to 74 Years | 0 (0.0%) | 16 (9.9%) |
| 75 Years and over | 9 (17.6%) | 15 (16.5%) |
Disability Class: Self-Care Difficulty
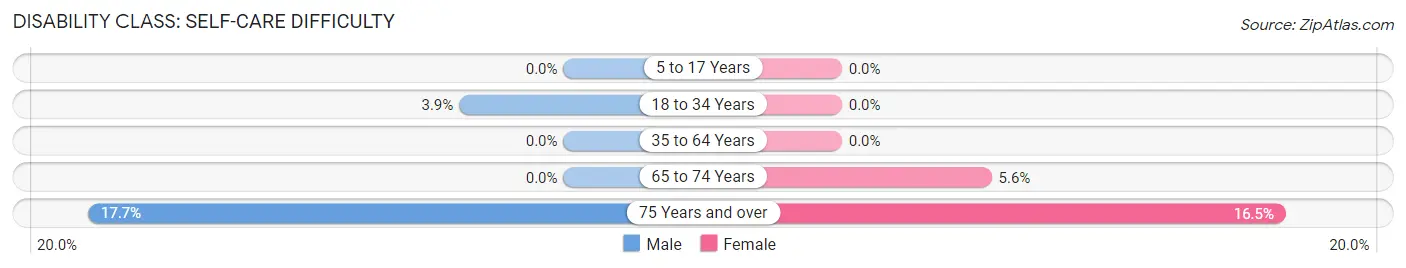
| Age Bracket | Male | Female |
| 5 to 17 Years | 0 (0.0%) | 0 (0.0%) |
| 18 to 34 Years | 12 (3.9%) | 0 (0.0%) |
| 35 to 64 Years | 0 (0.0%) | 0 (0.0%) |
| 65 to 74 Years | 0 (0.0%) | 9 (5.6%) |
| 75 Years and over | 9 (17.6%) | 15 (16.5%) |
Technology Access in Yardley borough
Computing Device Access in Yardley borough
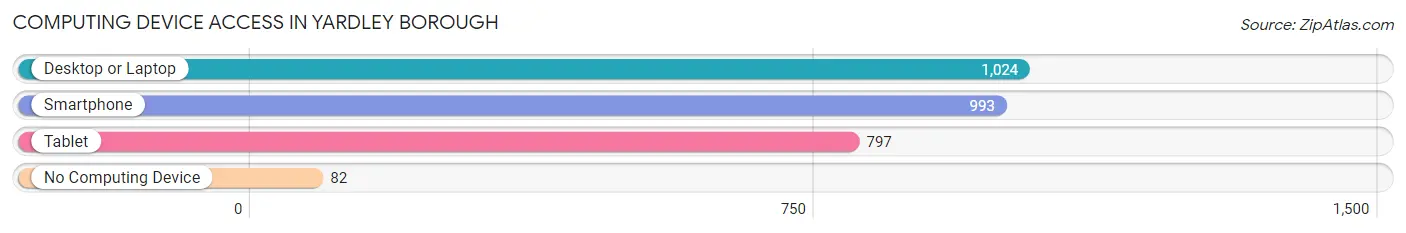
| Device Type | # Households | % Households |
| Desktop or Laptop | 1,024 | 88.8% |
| Smartphone | 993 | 86.1% |
| Tablet | 797 | 69.1% |
| No Computing Device | 82 | 7.1% |
| Total | 1,153 | 100.0% |
Internet Access in Yardley borough
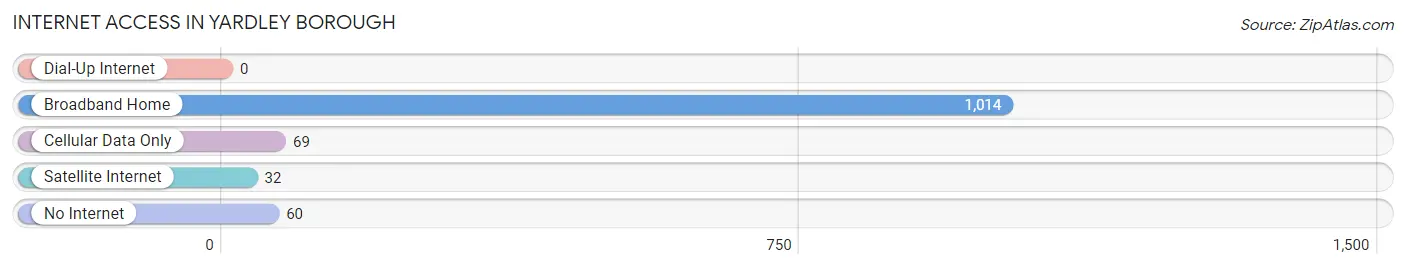
| Internet Type | # Households | % Households |
| Dial-Up Internet | 0 | 0.0% |
| Broadband Home | 1,014 | 87.9% |
| Cellular Data Only | 69 | 6.0% |
| Satellite Internet | 32 | 2.8% |
| No Internet | 60 | 5.2% |
| Total | 1,153 | 100.0% |
Yardley borough Summary
Yardley Borough is a small borough located in Bucks County, Pennsylvania. It is situated along the Delaware River, just north of Trenton, New Jersey. The borough is home to a population of approximately 2,500 people, and is part of the larger metropolitan area of Philadelphia.
History
Yardley Borough was first settled in 1682 by William Yardley, an English Quaker. The area was originally part of Makefield Township, and was known as Yardleyville. In 1876, the area was incorporated as a borough, and the name was changed to Yardley Borough.
The borough was an important stop on the Delaware Canal, which was built in the early 19th century. The canal was used to transport coal, lumber, and other goods from the Lehigh Valley to Philadelphia. The canal was also used for recreational purposes, and was a popular destination for fishing and boating.
The borough was also home to a number of mills, including a paper mill, a grist mill, and a saw mill. These mills provided employment for many of the residents of the borough.
Geography
Yardley Borough is located in Bucks County, Pennsylvania. It is situated along the Delaware River, just north of Trenton, New Jersey. The borough is bordered by Lower Makefield Township to the north, Falls Township to the east, and Morrisville Borough to the south.
The borough covers an area of 1.2 square miles, and is home to a population of approximately 2,500 people. The borough is part of the larger metropolitan area of Philadelphia.
The borough is located in a temperate climate zone, with hot summers and cold winters. The average annual temperature is around 50 degrees Fahrenheit. The average annual precipitation is around 40 inches.
Economy
Yardley Borough is home to a number of businesses, including restaurants, retail stores, and professional services. The borough is also home to a number of small manufacturing companies.
The borough is home to a number of educational institutions, including Bucks County Community College and Delaware Valley University. The borough is also home to a number of parks and recreational facilities, including a public pool, a skate park, and a community center.
Demographics
As of the 2010 census, the population of Yardley Borough was 2,434. The racial makeup of the borough was 94.3% White, 2.2% African American, 0.3% Native American, 1.2% Asian, 0.1% Pacific Islander, 0.7% from other races, and 1.3% from two or more races. Hispanic or Latino of any race were 2.3% of the population.
The median household income in the borough was $76,944, and the median family income was $90,917. The per capita income was $37,945. About 4.3% of families and 5.7% of the population were below the poverty line, including 6.3% of those under age 18 and 4.2% of those age 65 or over.
Common Questions
What is Per Capita Income in Yardley borough?
Per Capita income in Yardley borough is $64,777.
What is the Median Family Income in Yardley borough?
Median Family Income in Yardley borough is $139,469.
What is the Median Household income in Yardley borough?
Median Household Income in Yardley borough is $107,639.
What is Income or Wage Gap in Yardley borough?
Income or Wage Gap in Yardley borough is 7.7%.
Women in Yardley borough earn 92.3 cents for every dollar earned by a man.
What is Inequality or Gini Index in Yardley borough?
Inequality or Gini Index in Yardley borough is 0.43.
What is the Total Population of Yardley borough?
Total Population of Yardley borough is 2,591.
What is the Total Male Population of Yardley borough?
Total Male Population of Yardley borough is 1,240.
What is the Total Female Population of Yardley borough?
Total Female Population of Yardley borough is 1,351.
What is the Ratio of Males per 100 Females in Yardley borough?
There are 91.78 Males per 100 Females in Yardley borough.
What is the Ratio of Females per 100 Males in Yardley borough?
There are 108.95 Females per 100 Males in Yardley borough.
What is the Median Population Age in Yardley borough?
Median Population Age in Yardley borough is 46.1 Years.
What is the Average Family Size in Yardley borough
Average Family Size in Yardley borough is 2.9 People.
What is the Average Household Size in Yardley borough
Average Household Size in Yardley borough is 2.2 People.
How Large is the Labor Force in Yardley borough?
There are 1,586 People in the Labor Forcein in Yardley borough.
What is the Percentage of People in the Labor Force in Yardley borough?
72.0% of People are in the Labor Force in Yardley borough.
What is the Unemployment Rate in Yardley borough?
Unemployment Rate in Yardley borough is 7.4%.