Noblestown, PA Map & Demographics
Noblestown Map
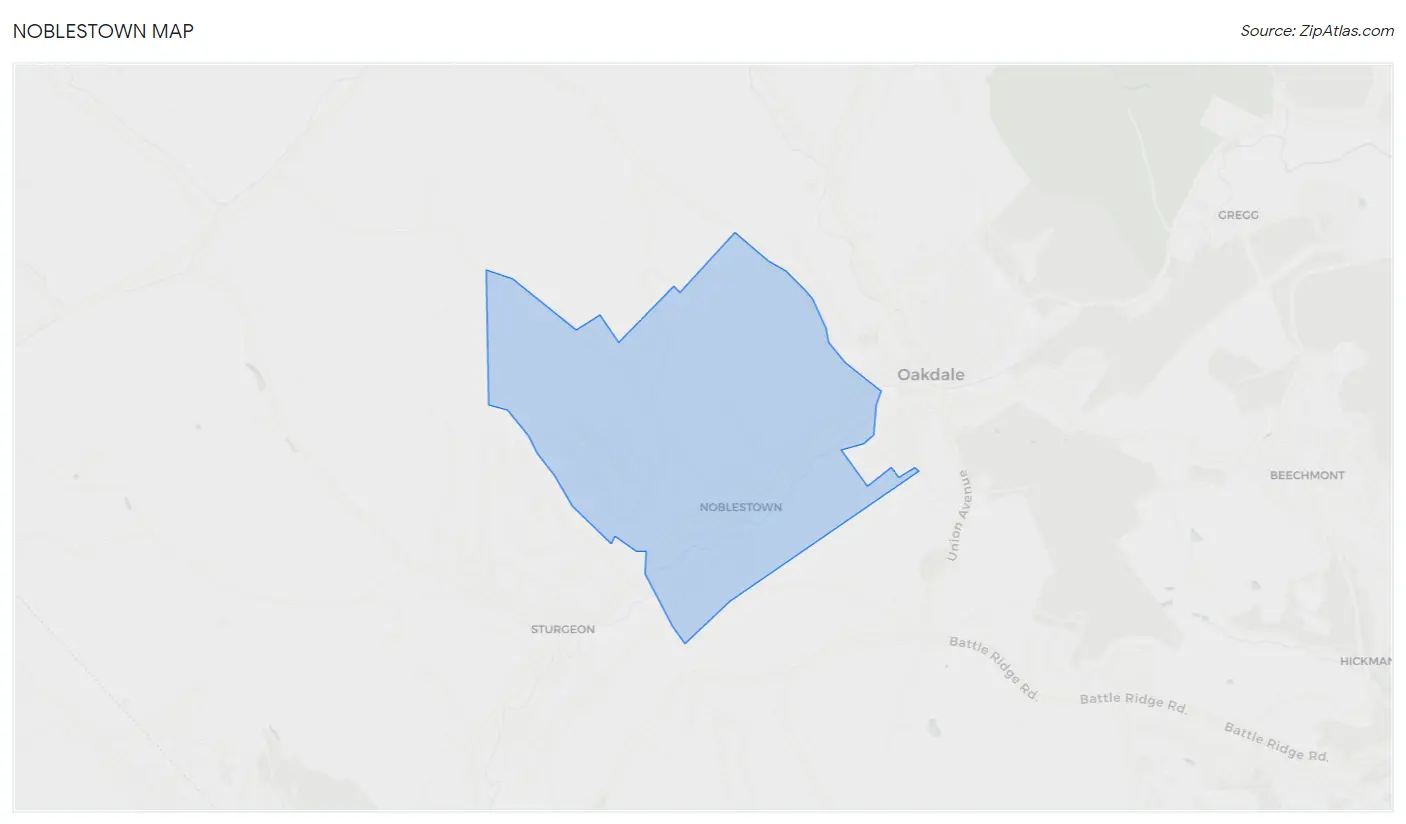
Noblestown Overview
$46,304
PER CAPITA INCOME
$142,109
AVG FAMILY INCOME
$88,618
AVG HOUSEHOLD INCOME
0.44
INEQUALITY / GINI INDEX
532
TOTAL POPULATION
229
MALE POPULATION
303
FEMALE POPULATION
75.58
MALES / 100 FEMALES
132.31
FEMALES / 100 MALES
50.1
MEDIAN AGE
3.0
AVG FAMILY SIZE
2.1
AVG HOUSEHOLD SIZE
252
LABOR FORCE [ PEOPLE ]
60.4%
PERCENT IN LABOR FORCE
Income in Noblestown
Income Overview in Noblestown
Per Capita Income in Noblestown is $46,304, while median incomes of families and households are $142,109 and $88,618 respectively.
| Characteristic | Number | Measure |
| Per Capita Income | 532 | $46,304 |
| Median Family Income | 137 | $142,109 |
| Mean Family Income | 137 | $149,733 |
| Median Household Income | 255 | $88,618 |
| Mean Household Income | 255 | $96,976 |
| Income Deficit | 137 | $0 |
| Wage / Income Gap (%) | 532 | 0.00% |
| Wage / Income Gap ($) | 532 | 100.00¢ per $1 |
| Gini / Inequality Index | 532 | 0.44 |
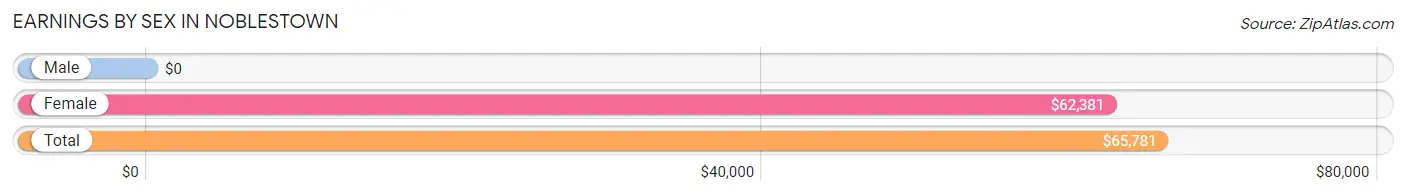
Earnings by Sex in Noblestown
| Sex | Number | Average Earnings |
| Male | 118 (46.8%) | $0 |
| Female | 134 (53.2%) | $62,381 |
| Total | 252 (100.0%) | $65,781 |
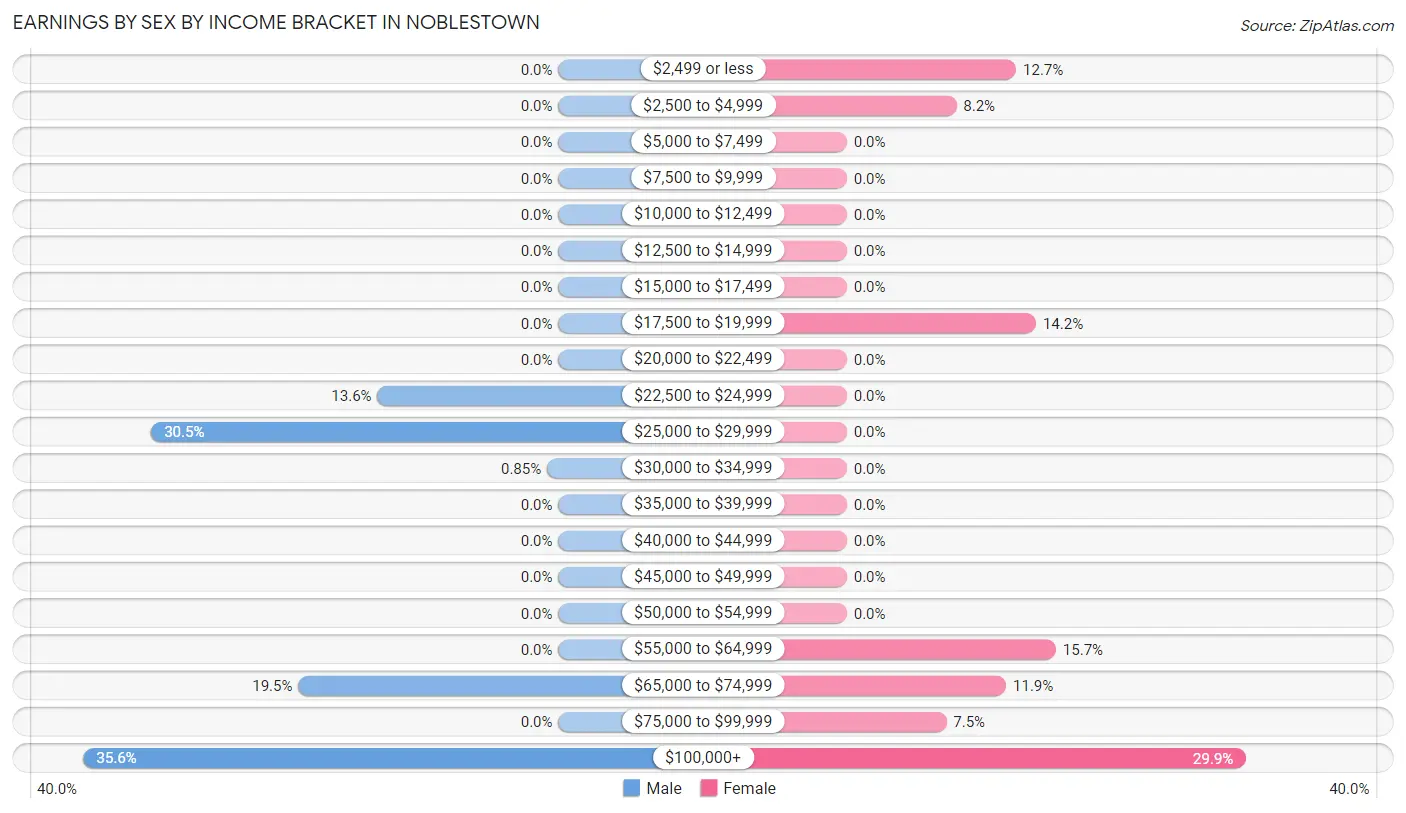
Earnings by Sex by Income Bracket in Noblestown
The most common earnings brackets in Noblestown are $100,000+ for men (42 | 35.6%) and $100,000+ for women (40 | 29.8%).
| Income | Male | Female |
| $2,499 or less | 0 (0.0%) | 17 (12.7%) |
| $2,500 to $4,999 | 0 (0.0%) | 11 (8.2%) |
| $5,000 to $7,499 | 0 (0.0%) | 0 (0.0%) |
| $7,500 to $9,999 | 0 (0.0%) | 0 (0.0%) |
| $10,000 to $12,499 | 0 (0.0%) | 0 (0.0%) |
| $12,500 to $14,999 | 0 (0.0%) | 0 (0.0%) |
| $15,000 to $17,499 | 0 (0.0%) | 0 (0.0%) |
| $17,500 to $19,999 | 0 (0.0%) | 19 (14.2%) |
| $20,000 to $22,499 | 0 (0.0%) | 0 (0.0%) |
| $22,500 to $24,999 | 16 (13.6%) | 0 (0.0%) |
| $25,000 to $29,999 | 36 (30.5%) | 0 (0.0%) |
| $30,000 to $34,999 | 1 (0.9%) | 0 (0.0%) |
| $35,000 to $39,999 | 0 (0.0%) | 0 (0.0%) |
| $40,000 to $44,999 | 0 (0.0%) | 0 (0.0%) |
| $45,000 to $49,999 | 0 (0.0%) | 0 (0.0%) |
| $50,000 to $54,999 | 0 (0.0%) | 0 (0.0%) |
| $55,000 to $64,999 | 0 (0.0%) | 21 (15.7%) |
| $65,000 to $74,999 | 23 (19.5%) | 16 (11.9%) |
| $75,000 to $99,999 | 0 (0.0%) | 10 (7.5%) |
| $100,000+ | 42 (35.6%) | 40 (29.8%) |
| Total | 118 (100.0%) | 134 (100.0%) |
Earnings by Sex by Educational Attainment in Noblestown
| Educational Attainment | Male Income | Female Income |
| Less than High School | - | - |
| High School Diploma | - | - |
| College or Associate's Degree | - | - |
| Bachelor's Degree | - | - |
| Graduate Degree | - | - |
| Total | - | - |
Family Income in Noblestown
Family Income Brackets in Noblestown
According to the Noblestown family income data, there are 49 families falling into the $150,000 to $199,999 income range, which is the most common income bracket and makes up 35.8% of all families.
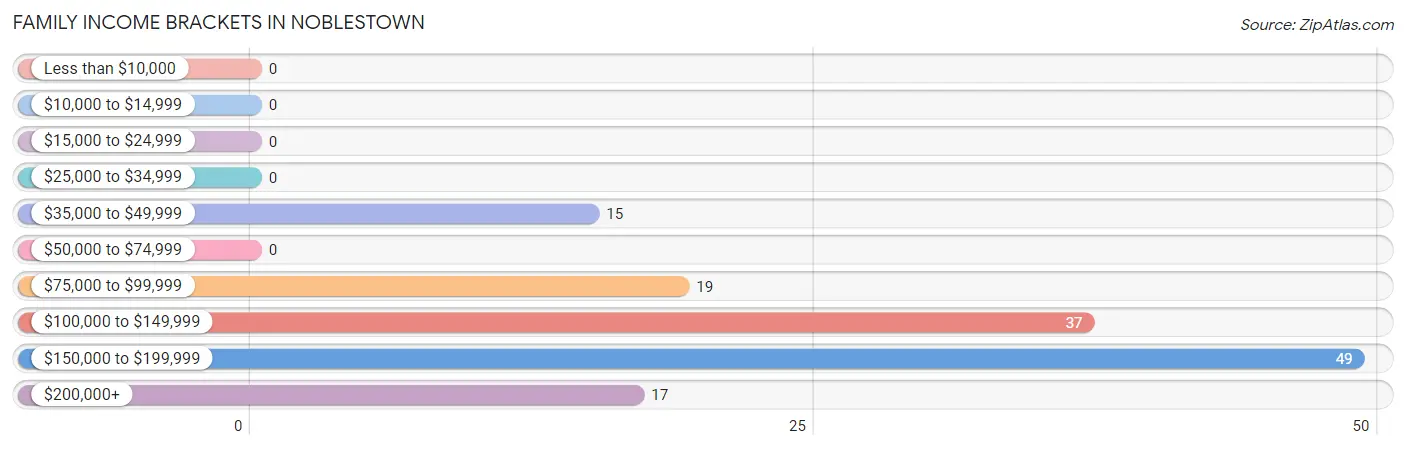
| Income Bracket | # Families | % Families |
| Less than $10,000 | 0 | 0.0% |
| $10,000 to $14,999 | 0 | 0.0% |
| $15,000 to $24,999 | 0 | 0.0% |
| $25,000 to $34,999 | 0 | 0.0% |
| $35,000 to $49,999 | 15 | 10.9% |
| $50,000 to $74,999 | 0 | 0.0% |
| $75,000 to $99,999 | 19 | 13.9% |
| $100,000 to $149,999 | 37 | 27.0% |
| $150,000 to $199,999 | 49 | 35.8% |
| $200,000+ | 17 | 12.4% |
Family Income by Famaliy Size in Noblestown
2-person families (55 | 40.2%) account for the highest median family income in Noblestown with $89,145 per family, while 2-person families (55 | 40.2%) have the highest median income of $44,572 per family member.
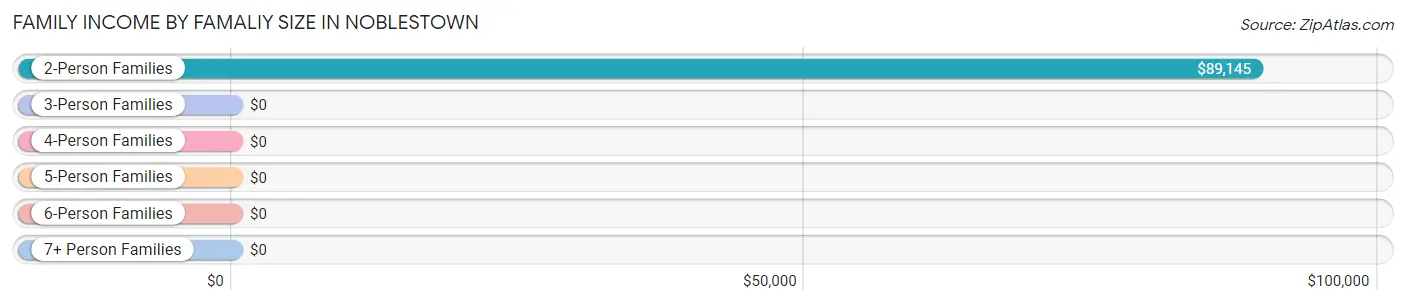
| Income Bracket | # Families | Median Income |
| 2-Person Families | 55 (40.2%) | $89,145 |
| 3-Person Families | 16 (11.7%) | $0 |
| 4-Person Families | 42 (30.7%) | $0 |
| 5-Person Families | 24 (17.5%) | $0 |
| 6-Person Families | 0 (0.0%) | $0 |
| 7+ Person Families | 0 (0.0%) | $0 |
| Total | 137 (100.0%) | $142,109 |
Family Income by Number of Earners in Noblestown
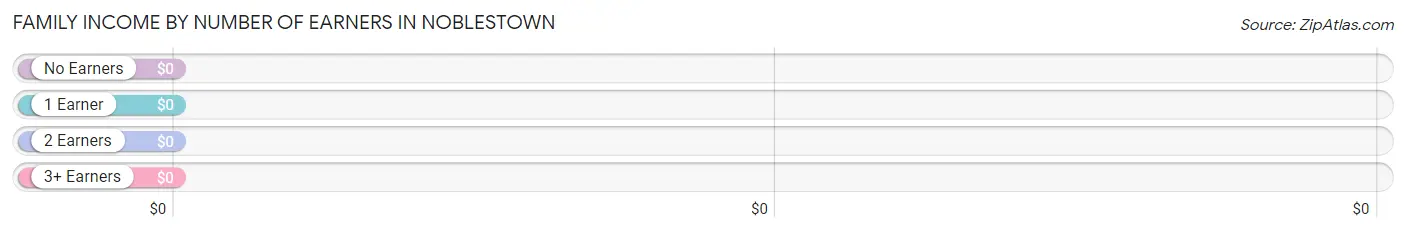
| Number of Earners | # Families | Median Income |
| No Earners | 34 (24.8%) | $0 |
| 1 Earner | 21 (15.3%) | $0 |
| 2 Earners | 49 (35.8%) | $0 |
| 3+ Earners | 33 (24.1%) | $0 |
| Total | 137 (100.0%) | $142,109 |
Household Income in Noblestown
Household Income Brackets in Noblestown
With 59 households falling in the category, the $15,000 to $24,999 income range is the most frequent in Noblestown, accounting for 23.1% of all households.
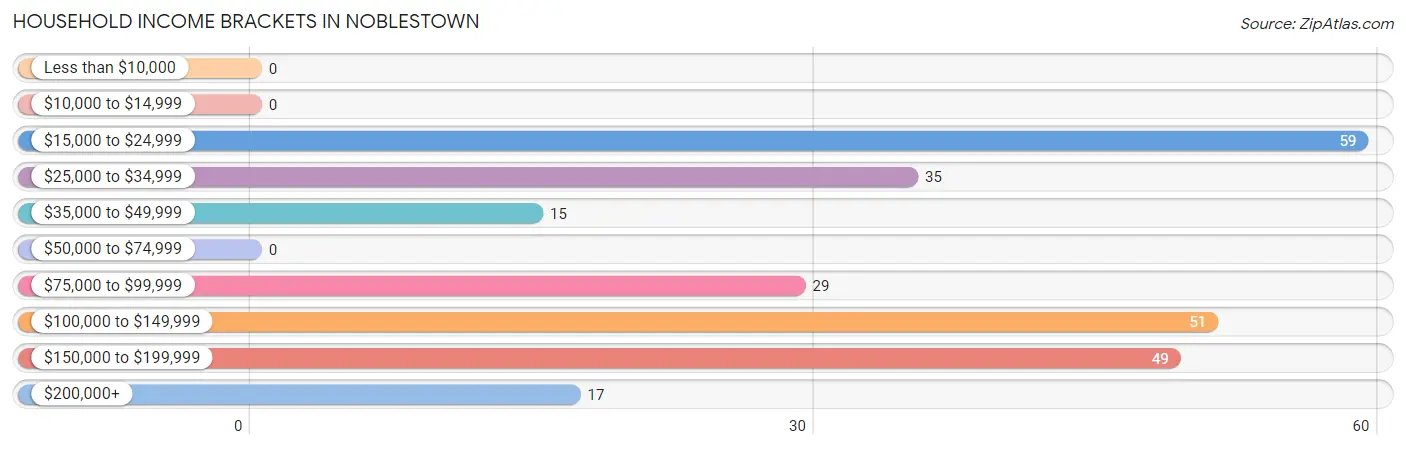
| Income Bracket | # Households | % Households |
| Less than $10,000 | 0 | 0.0% |
| $10,000 to $14,999 | 0 | 0.0% |
| $15,000 to $24,999 | 59 | 23.1% |
| $25,000 to $34,999 | 35 | 13.7% |
| $35,000 to $49,999 | 15 | 5.9% |
| $50,000 to $74,999 | 0 | 0.0% |
| $75,000 to $99,999 | 29 | 11.4% |
| $100,000 to $149,999 | 51 | 20.0% |
| $150,000 to $199,999 | 49 | 19.2% |
| $200,000+ | 17 | 6.7% |
Household Income by Householder Age in Noblestown
The median household income in Noblestown is $88,618, with the highest median household income of $89,013 found in the 65+ years age bracket for the primary householder. A total of 85 households (33.3%) fall into this category.
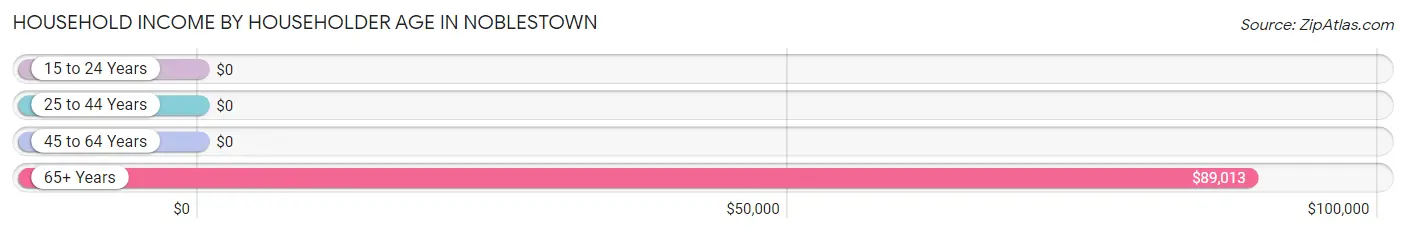
| Income Bracket | # Households | Median Income |
| 15 to 24 Years | 0 (0.0%) | $0 |
| 25 to 44 Years | 43 (16.9%) | $0 |
| 45 to 64 Years | 127 (49.8%) | $0 |
| 65+ Years | 85 (33.3%) | $89,013 |
| Total | 255 (100.0%) | $88,618 |
Poverty in Noblestown
Income Below Poverty by Sex and Age in Noblestown
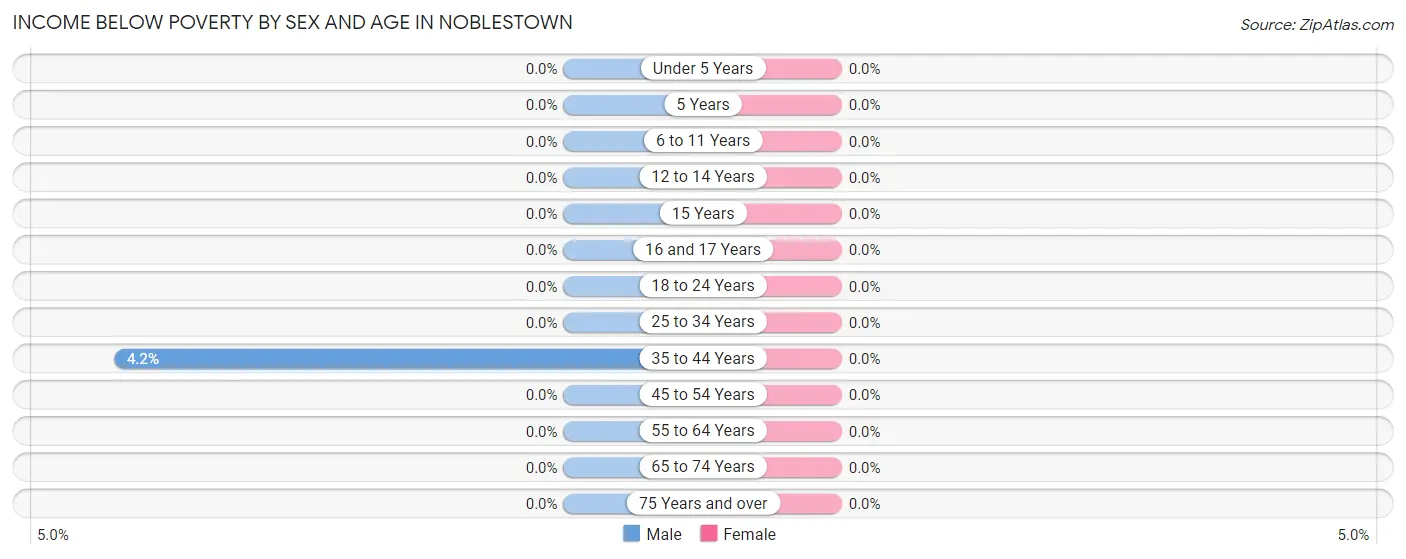
| Age Bracket | Male | Female |
| Under 5 Years | 0 (0.0%) | 0 (0.0%) |
| 5 Years | 0 (0.0%) | 0 (0.0%) |
| 6 to 11 Years | 0 (0.0%) | 0 (0.0%) |
| 12 to 14 Years | 0 (0.0%) | 0 (0.0%) |
| 15 Years | 0 (0.0%) | 0 (0.0%) |
| 16 and 17 Years | 0 (0.0%) | 0 (0.0%) |
| 18 to 24 Years | 0 (0.0%) | 0 (0.0%) |
| 25 to 34 Years | 0 (0.0%) | 0 (0.0%) |
| 35 to 44 Years | 1 (4.2%) | 0 (0.0%) |
| 45 to 54 Years | 0 (0.0%) | 0 (0.0%) |
| 55 to 64 Years | 0 (0.0%) | 0 (0.0%) |
| 65 to 74 Years | 0 (0.0%) | 0 (0.0%) |
| 75 Years and over | 0 (0.0%) | 0 (0.0%) |
| Total | 1 (0.4%) | 0 (0.0%) |
Income Above Poverty by Sex and Age in Noblestown
According to the poverty statistics in Noblestown, males aged under 5 years and females aged under 5 years are the age groups that are most secure financially, with 100.0% of males and 100.0% of females in these age groups living above the poverty line.
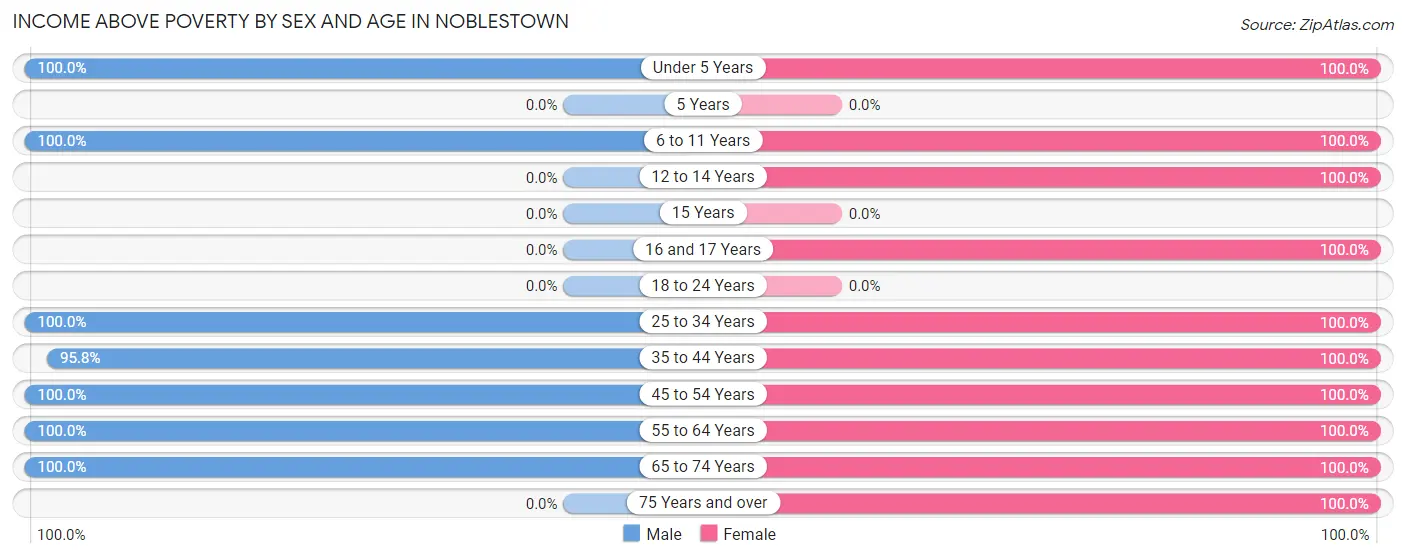
| Age Bracket | Male | Female |
| Under 5 Years | 21 (100.0%) | 23 (100.0%) |
| 5 Years | 0 (0.0%) | 0 (0.0%) |
| 6 to 11 Years | 31 (100.0%) | 24 (100.0%) |
| 12 to 14 Years | 0 (0.0%) | 16 (100.0%) |
| 15 Years | 0 (0.0%) | 0 (0.0%) |
| 16 and 17 Years | 0 (0.0%) | 17 (100.0%) |
| 18 to 24 Years | 0 (0.0%) | 0 (0.0%) |
| 25 to 34 Years | 20 (100.0%) | 24 (100.0%) |
| 35 to 44 Years | 23 (95.8%) | 30 (100.0%) |
| 45 to 54 Years | 42 (100.0%) | 16 (100.0%) |
| 55 to 64 Years | 40 (100.0%) | 103 (100.0%) |
| 65 to 74 Years | 51 (100.0%) | 36 (100.0%) |
| 75 Years and over | 0 (0.0%) | 14 (100.0%) |
| Total | 228 (99.6%) | 303 (100.0%) |
Income Below Poverty Among Married-Couple Families in Noblestown
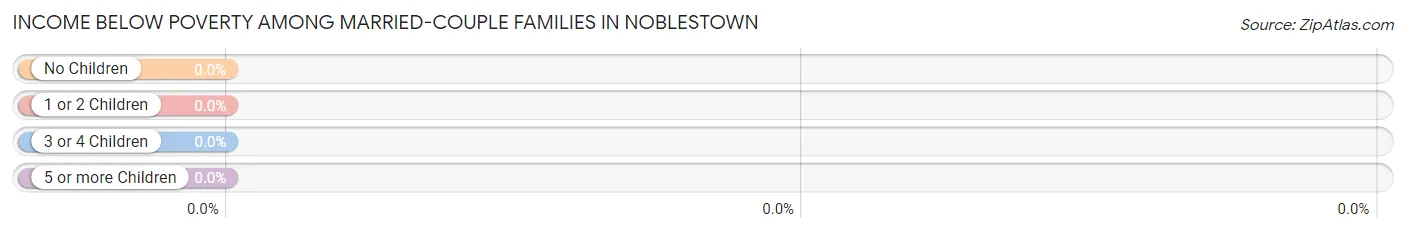
| Children | Above Poverty | Below Poverty |
| No Children | 50 (100.0%) | 0 (0.0%) |
| 1 or 2 Children | 42 (100.0%) | 0 (0.0%) |
| 3 or 4 Children | 24 (100.0%) | 0 (0.0%) |
| 5 or more Children | 0 (0.0%) | 0 (0.0%) |
| Total | 116 (100.0%) | 0 (0.0%) |
Income Below Poverty Among Single-Parent Households in Noblestown
| Children | Single Father | Single Mother |
| No Children | 0 (0.0%) | 0 (0.0%) |
| 1 or 2 Children | 0 (0.0%) | 0 (0.0%) |
| 3 or 4 Children | 0 (0.0%) | 0 (0.0%) |
| 5 or more Children | 0 (0.0%) | 0 (0.0%) |
| Total | 0 (0.0%) | 0 (0.0%) |
Income Below Poverty Among Married-Couple vs Single-Parent Households in Noblestown
| Children | Married-Couple Families | Single-Parent Households |
| No Children | 0 (0.0%) | 0 (0.0%) |
| 1 or 2 Children | 0 (0.0%) | 0 (0.0%) |
| 3 or 4 Children | 0 (0.0%) | 0 (0.0%) |
| 5 or more Children | 0 (0.0%) | 0 (0.0%) |
| Total | 0 (0.0%) | 0 (0.0%) |
Race in Noblestown
The most populous races in Noblestown are White / Caucasian (489 | 91.9%), Two or more Races (31 | 5.8%), and Asian (12 | 2.3%).
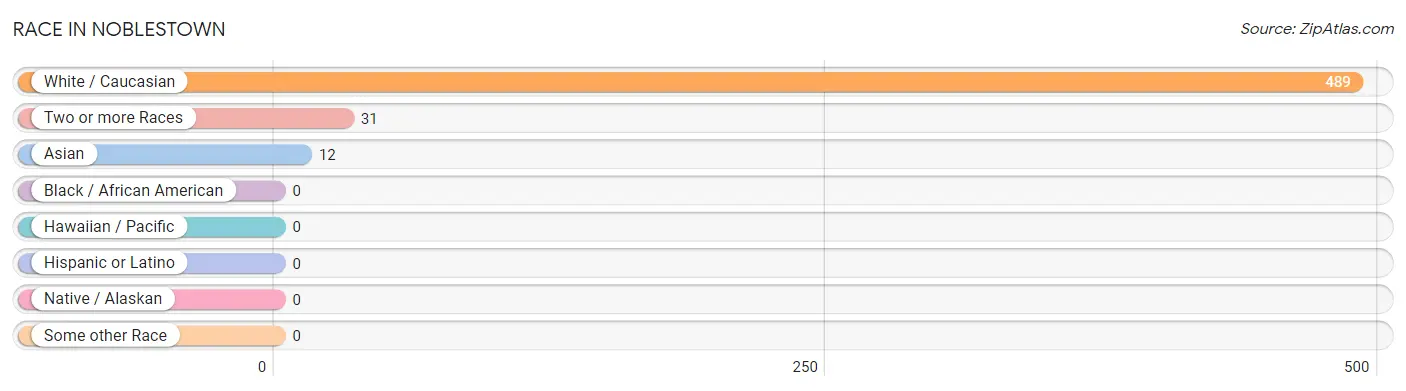
| Race | # Population | % Population |
| Asian | 12 | 2.3% |
| Black / African American | 0 | 0.0% |
| Hawaiian / Pacific | 0 | 0.0% |
| Hispanic or Latino | 0 | 0.0% |
| Native / Alaskan | 0 | 0.0% |
| White / Caucasian | 489 | 91.9% |
| Two or more Races | 31 | 5.8% |
| Some other Race | 0 | 0.0% |
| Total | 532 | 100.0% |
Ancestry in Noblestown
The most populous ancestries reported in Noblestown are Polish (132 | 24.8%), German (114 | 21.4%), Italian (110 | 20.7%), Czechoslovakian (78 | 14.7%), and Romanian (56 | 10.5%), together accounting for 92.1% of all Noblestown residents.
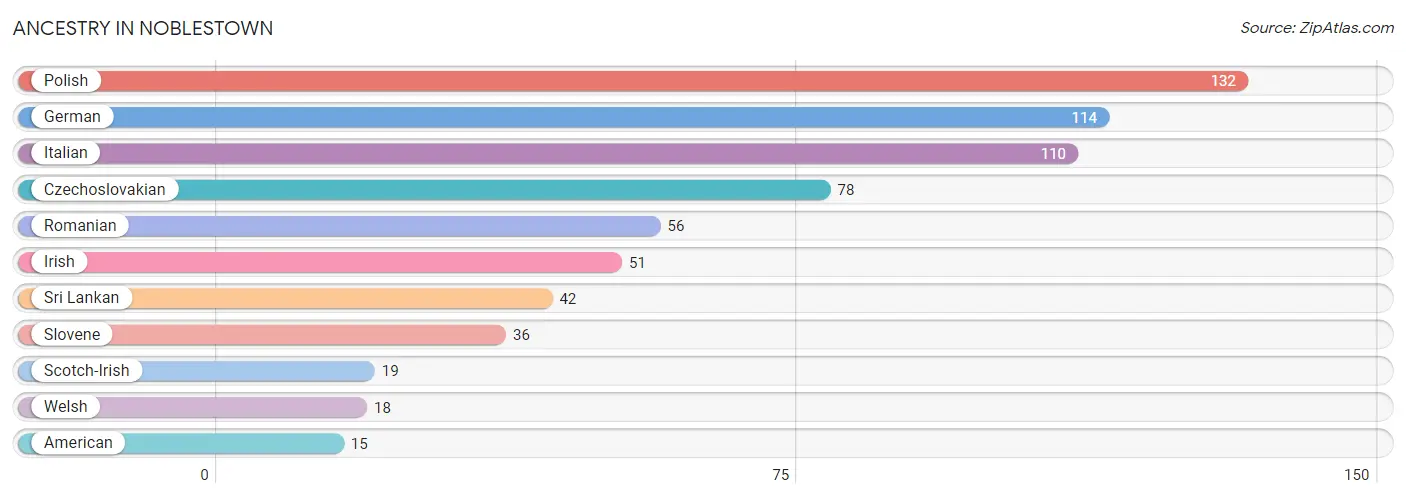
| Ancestry | # Population | % Population |
| American | 15 | 2.8% |
| Czechoslovakian | 78 | 14.7% |
| German | 114 | 21.4% |
| Irish | 51 | 9.6% |
| Italian | 110 | 20.7% |
| Polish | 132 | 24.8% |
| Romanian | 56 | 10.5% |
| Scotch-Irish | 19 | 3.6% |
| Slovene | 36 | 6.8% |
| Sri Lankan | 42 | 7.9% |
| Welsh | 18 | 3.4% | View All 11 Rows |
Immigrants in Noblestown
The most numerous immigrant groups reported in Noblestown came from Eastern Europe (25 | 4.7%), Europe (25 | 4.7%), Romania (25 | 4.7%), Asia (1 | 0.2%), and South Central Asia (1 | 0.2%), together accounting for 14.5% of all Noblestown residents.
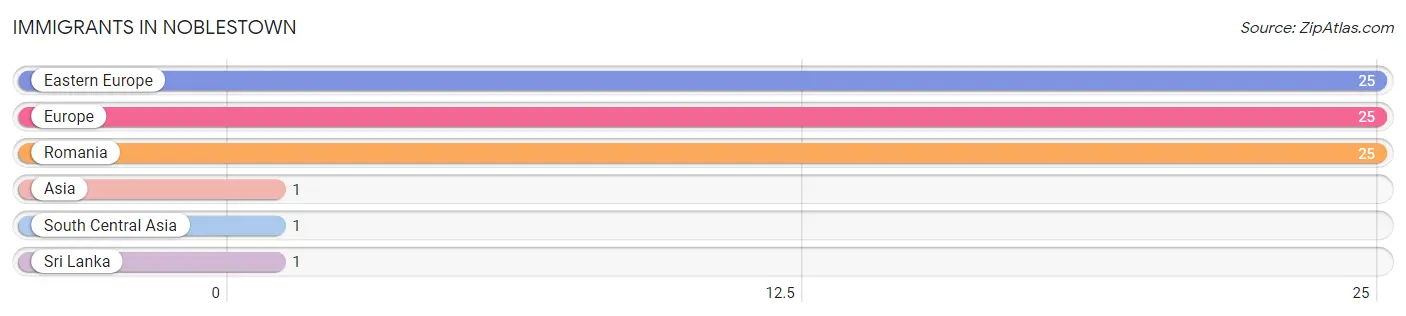
| Immigration Origin | # Population | % Population |
| Asia | 1 | 0.2% |
| Eastern Europe | 25 | 4.7% |
| Europe | 25 | 4.7% |
| Romania | 25 | 4.7% |
| South Central Asia | 1 | 0.2% |
| Sri Lanka | 1 | 0.2% | View All 6 Rows |
Sex and Age in Noblestown
Sex and Age in Noblestown
The most populous age groups in Noblestown are 55 to 59 Years (40 | 17.5%) for men and 60 to 64 Years (77 | 25.4%) for women.
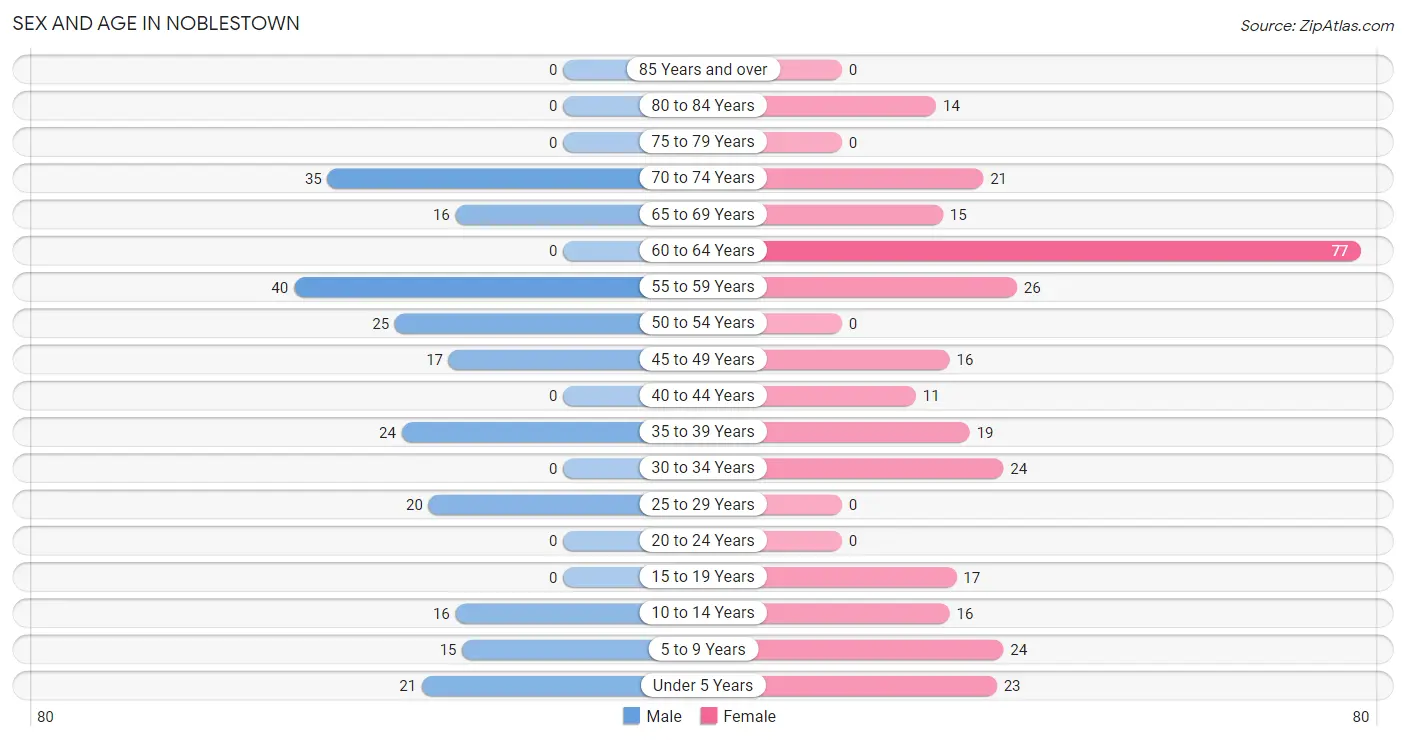
| Age Bracket | Male | Female |
| Under 5 Years | 21 (9.2%) | 23 (7.6%) |
| 5 to 9 Years | 15 (6.6%) | 24 (7.9%) |
| 10 to 14 Years | 16 (7.0%) | 16 (5.3%) |
| 15 to 19 Years | 0 (0.0%) | 17 (5.6%) |
| 20 to 24 Years | 0 (0.0%) | 0 (0.0%) |
| 25 to 29 Years | 20 (8.7%) | 0 (0.0%) |
| 30 to 34 Years | 0 (0.0%) | 24 (7.9%) |
| 35 to 39 Years | 24 (10.5%) | 19 (6.3%) |
| 40 to 44 Years | 0 (0.0%) | 11 (3.6%) |
| 45 to 49 Years | 17 (7.4%) | 16 (5.3%) |
| 50 to 54 Years | 25 (10.9%) | 0 (0.0%) |
| 55 to 59 Years | 40 (17.5%) | 26 (8.6%) |
| 60 to 64 Years | 0 (0.0%) | 77 (25.4%) |
| 65 to 69 Years | 16 (7.0%) | 15 (5.0%) |
| 70 to 74 Years | 35 (15.3%) | 21 (6.9%) |
| 75 to 79 Years | 0 (0.0%) | 0 (0.0%) |
| 80 to 84 Years | 0 (0.0%) | 14 (4.6%) |
| 85 Years and over | 0 (0.0%) | 0 (0.0%) |
| Total | 229 (100.0%) | 303 (100.0%) |
Families and Households in Noblestown
Median Family Size in Noblestown
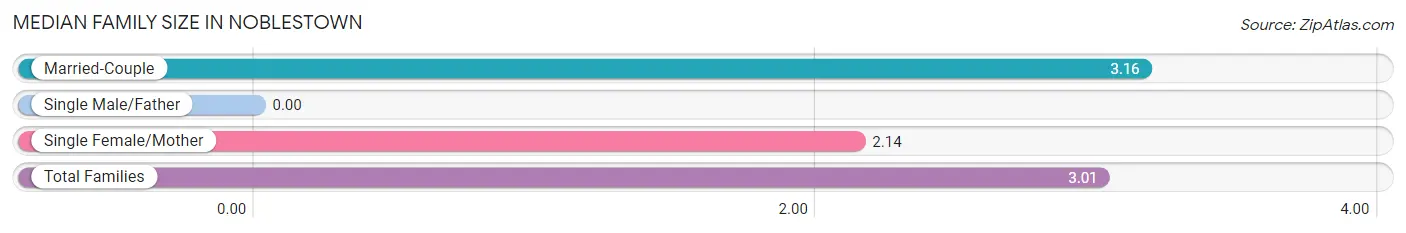
| Family Type | # Families | Family Size |
| Married-Couple | 116 (84.7%) | 3.16 |
| Single Male/Father | 0 (0.0%) | - |
| Single Female/Mother | 21 (15.3%) | 2.14 |
| Total Families | 137 (100.0%) | 3.01 |
Median Household Size in Noblestown
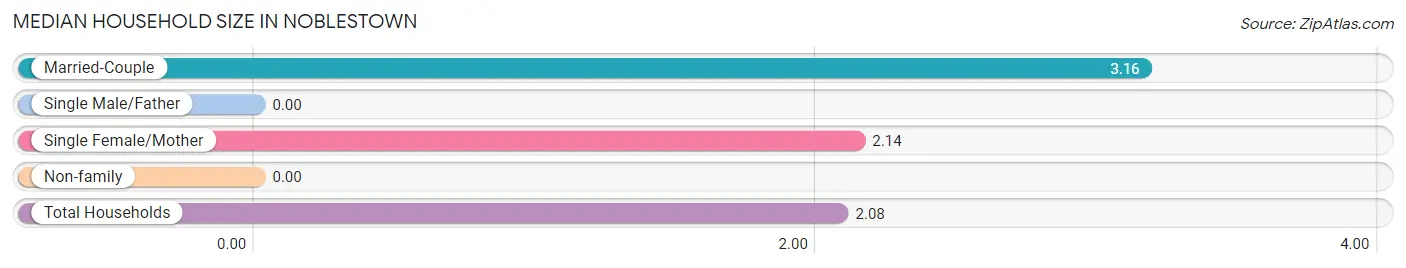
| Household Type | # Households | Household Size |
| Married-Couple | 116 (45.5%) | 3.16 |
| Single Male/Father | 0 (0.0%) | - |
| Single Female/Mother | 21 (8.2%) | 2.14 |
| Non-family | 118 (46.3%) | - |
| Total Households | 255 (100.0%) | 2.08 |
Household Size by Marriage Status in Noblestown
Out of a total of 255 households in Noblestown, 137 (53.7%) are family households, while 118 (46.3%) are nonfamily households. The most numerous type of family households are 2-person households, comprising 55, and the most common type of nonfamily households are 1-person households, comprising 118.
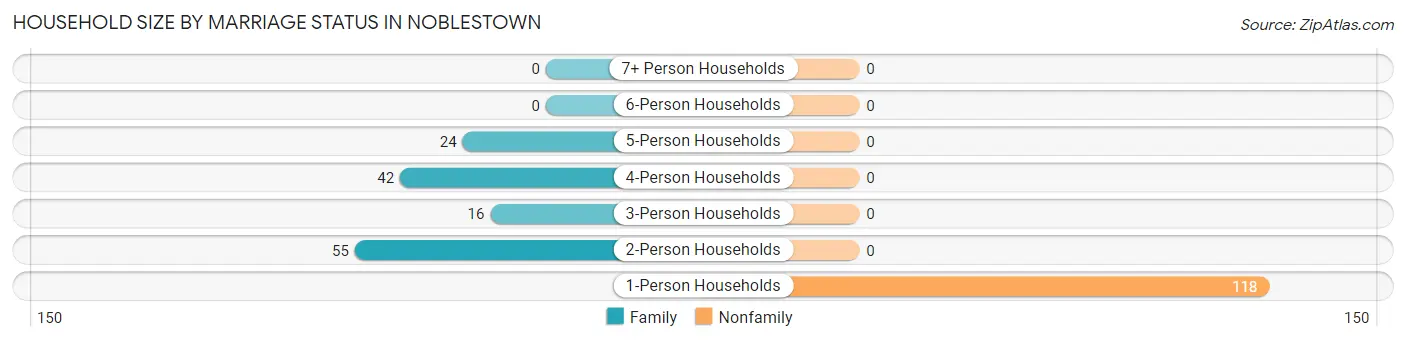
| Household Size | Family Households | Nonfamily Households |
| 1-Person Households | - | 118 (46.3%) |
| 2-Person Households | 55 (21.6%) | 0 (0.0%) |
| 3-Person Households | 16 (6.3%) | 0 (0.0%) |
| 4-Person Households | 42 (16.5%) | 0 (0.0%) |
| 5-Person Households | 24 (9.4%) | 0 (0.0%) |
| 6-Person Households | 0 (0.0%) | 0 (0.0%) |
| 7+ Person Households | 0 (0.0%) | 0 (0.0%) |
| Total | 137 (53.7%) | 118 (46.3%) |
Female Fertility in Noblestown
Fertility by Age in Noblestown
Average fertility rate in Noblestown is 276.0 births per 1,000 women. Women in the age bracket of 20 to 34 years have the highest fertility rate with 1,000.0 births per 1,000 women. Women in the age bracket of 20 to 34 years acount for 100.0% of all women with births.
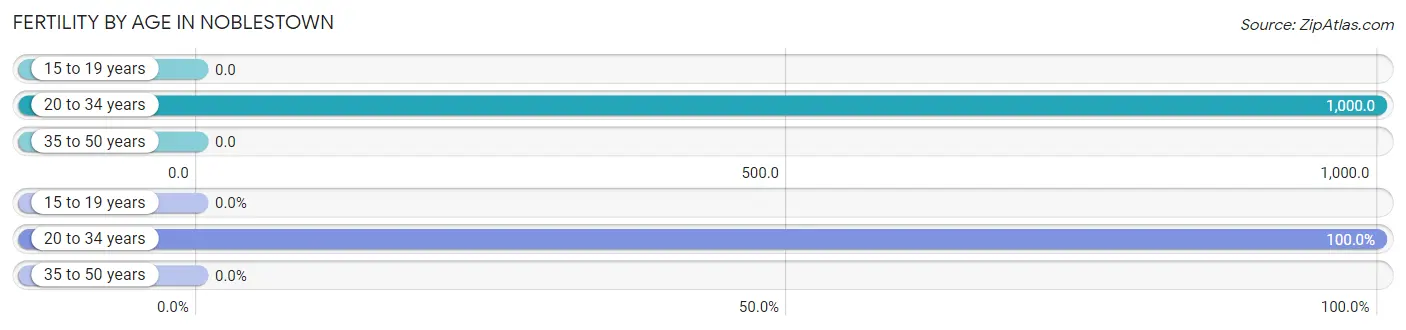
| Age Bracket | Women with Births | Births / 1,000 Women |
| 15 to 19 years | 0 (0.0%) | 0.0 |
| 20 to 34 years | 24 (100.0%) | 1,000.0 |
| 35 to 50 years | 0 (0.0%) | 0.0 |
| Total | 24 (100.0%) | 276.0 |
Fertility by Age by Marriage Status in Noblestown
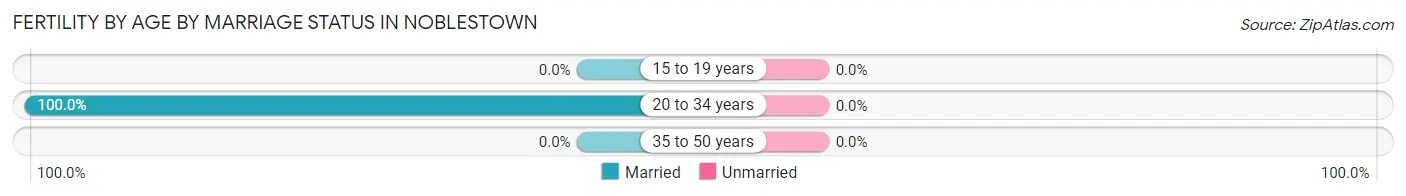
| Age Bracket | Married | Unmarried |
| 15 to 19 years | 0 (0.0%) | 0 (0.0%) |
| 20 to 34 years | 24 (100.0%) | 0 (0.0%) |
| 35 to 50 years | 0 (0.0%) | 0 (0.0%) |
| Total | 24 (100.0%) | 0 (0.0%) |
Fertility by Education in Noblestown
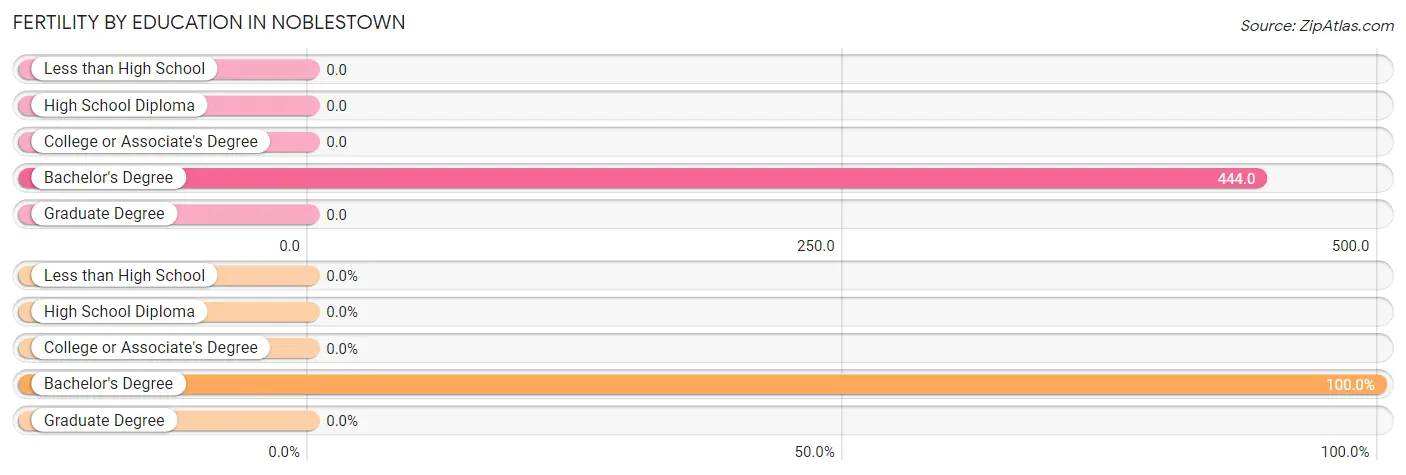
| Educational Attainment | Women with Births | Births / 1,000 Women |
| Less than High School | 0 (0.0%) | 0.0 |
| High School Diploma | 0 (0.0%) | 0.0 |
| College or Associate's Degree | 0 (0.0%) | 0.0 |
| Bachelor's Degree | 24 (100.0%) | 444.0 |
| Graduate Degree | 0 (0.0%) | 0.0 |
| Total | 24 (100.0%) | 276.0 |
Fertility by Education by Marriage Status in Noblestown
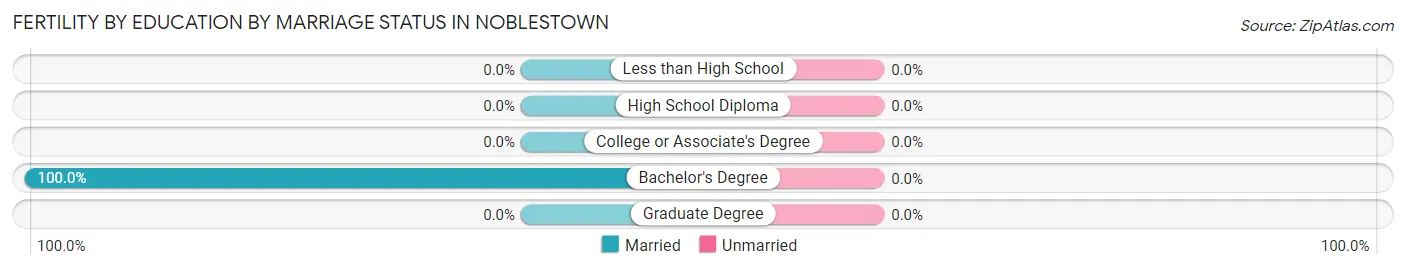
| Educational Attainment | Married | Unmarried |
| Less than High School | 0 (0.0%) | 0 (0.0%) |
| High School Diploma | 0 (0.0%) | 0 (0.0%) |
| College or Associate's Degree | 0 (0.0%) | 0 (0.0%) |
| Bachelor's Degree | 24 (100.0%) | 0 (0.0%) |
| Graduate Degree | 0 (0.0%) | 0 (0.0%) |
| Total | 24 (100.0%) | 0 (0.0%) |
Employment Characteristics in Noblestown
Employment by Class of Employer in Noblestown
Among the 242 employed individuals in Noblestown, private company employees (83 | 34.3%), self-employed (not incorporated) (47 | 19.4%), and not-for-profit organizations (42 | 17.4%) make up the most common classes of employment.
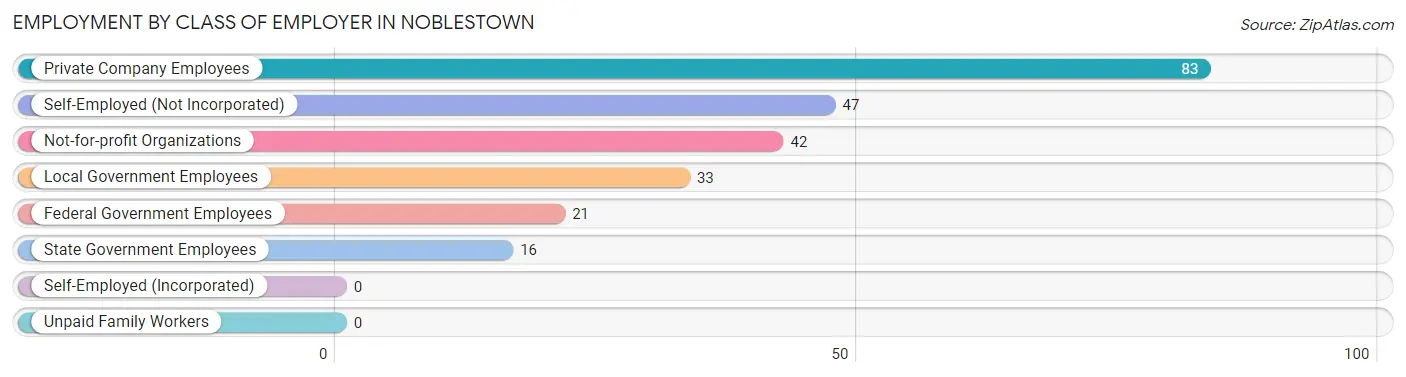
| Employer Class | # Employees | % Employees |
| Private Company Employees | 83 | 34.3% |
| Self-Employed (Incorporated) | 0 | 0.0% |
| Self-Employed (Not Incorporated) | 47 | 19.4% |
| Not-for-profit Organizations | 42 | 17.4% |
| Local Government Employees | 33 | 13.6% |
| State Government Employees | 16 | 6.6% |
| Federal Government Employees | 21 | 8.7% |
| Unpaid Family Workers | 0 | 0.0% |
| Total | 242 | 100.0% |
Employment Status by Age in Noblestown
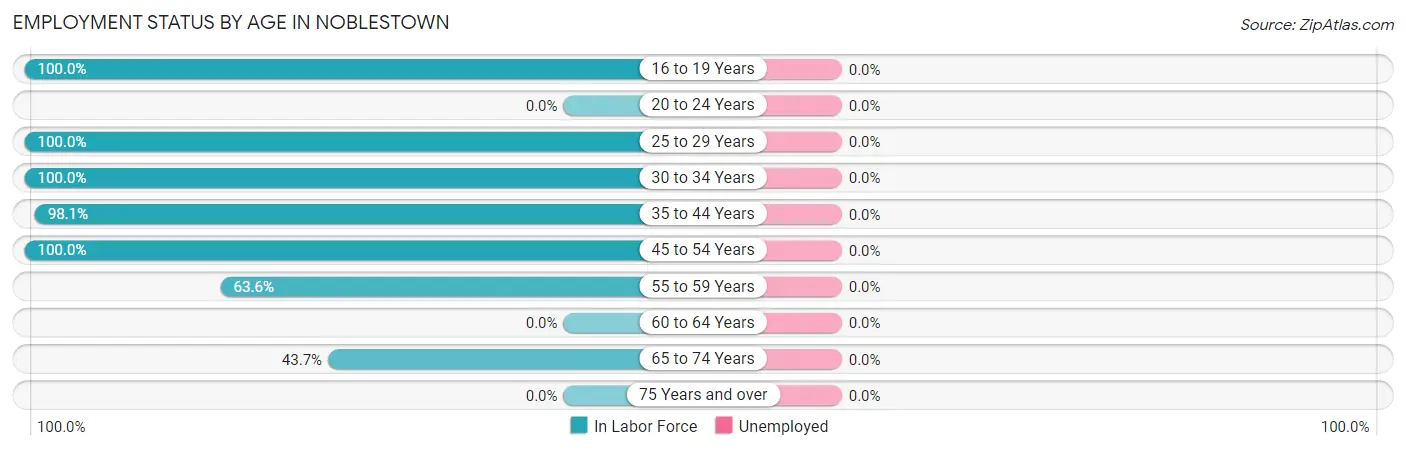
| Age Bracket | In Labor Force | Unemployed |
| 16 to 19 Years | 17 (100.0%) | 0 (0.0%) |
| 20 to 24 Years | 0 (0.0%) | 0 (0.0%) |
| 25 to 29 Years | 20 (100.0%) | 0 (0.0%) |
| 30 to 34 Years | 24 (100.0%) | 0 (0.0%) |
| 35 to 44 Years | 53 (98.1%) | 0 (0.0%) |
| 45 to 54 Years | 58 (100.0%) | 0 (0.0%) |
| 55 to 59 Years | 42 (63.6%) | 0 (0.0%) |
| 60 to 64 Years | 0 (0.0%) | 0 (0.0%) |
| 65 to 74 Years | 38 (43.7%) | 0 (0.0%) |
| 75 Years and over | 0 (0.0%) | 0 (0.0%) |
| Total | 252 (60.4%) | 0 (0.0%) |
Employment Status by Educational Attainment in Noblestown
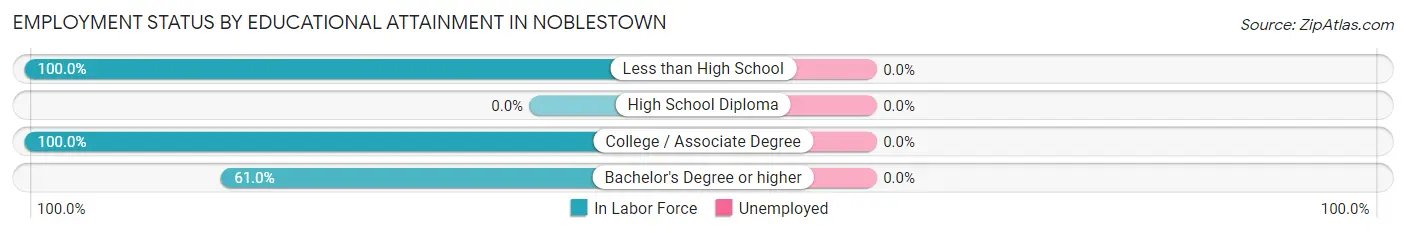
| Educational Attainment | In Labor Force | Unemployed |
| Less than High School | 23 (100.0%) | 0 (0.0%) |
| High School Diploma | 0 (0.0%) | 0 (0.0%) |
| College / Associate Degree | 52 (100.0%) | 0 (0.0%) |
| Bachelor's Degree or higher | 122 (61.0%) | 0 (0.0%) |
| Total | 197 (65.9%) | 0 (0.0%) |
Employment Occupations by Sex in Noblestown
Management, Business, Science and Arts Occupations
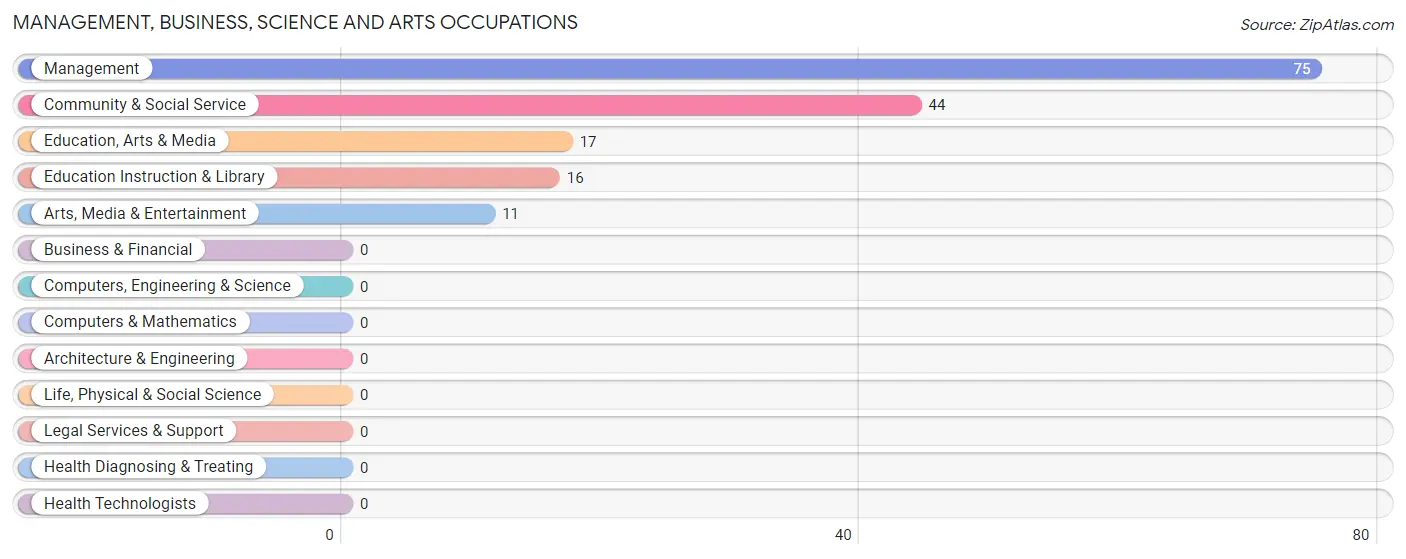
The most common Management, Business, Science and Arts occupations in Noblestown are Management (75 | 29.8%), Community & Social Service (44 | 17.5%), Education, Arts & Media (17 | 6.8%), Education Instruction & Library (16 | 6.4%), and Arts, Media & Entertainment (11 | 4.4%).
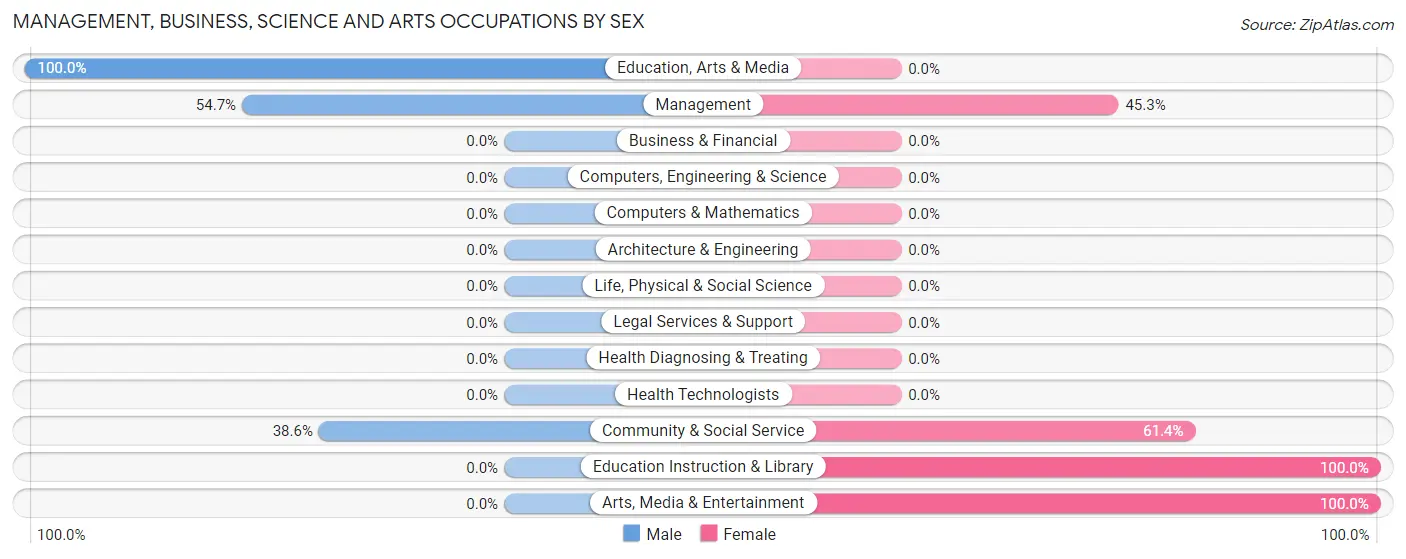
Management, Business, Science and Arts Occupations by Sex
Within the Management, Business, Science and Arts occupations in Noblestown, the most male-oriented occupations are Education, Arts & Media (100.0%), Management (54.7%), and Community & Social Service (38.6%), while the most female-oriented occupations are Education Instruction & Library (100.0%), Arts, Media & Entertainment (100.0%), and Community & Social Service (61.4%).
| Occupation | Male | Female |
| Management | 41 (54.7%) | 34 (45.3%) |
| Business & Financial | 0 (0.0%) | 0 (0.0%) |
| Computers, Engineering & Science | 0 (0.0%) | 0 (0.0%) |
| Computers & Mathematics | 0 (0.0%) | 0 (0.0%) |
| Architecture & Engineering | 0 (0.0%) | 0 (0.0%) |
| Life, Physical & Social Science | 0 (0.0%) | 0 (0.0%) |
| Community & Social Service | 17 (38.6%) | 27 (61.4%) |
| Education, Arts & Media | 17 (100.0%) | 0 (0.0%) |
| Legal Services & Support | 0 (0.0%) | 0 (0.0%) |
| Education Instruction & Library | 0 (0.0%) | 16 (100.0%) |
| Arts, Media & Entertainment | 0 (0.0%) | 11 (100.0%) |
| Health Diagnosing & Treating | 0 (0.0%) | 0 (0.0%) |
| Health Technologists | 0 (0.0%) | 0 (0.0%) |
| Total (Category) | 58 (48.7%) | 61 (51.3%) |
| Total (Overall) | 118 (46.8%) | 134 (53.2%) |
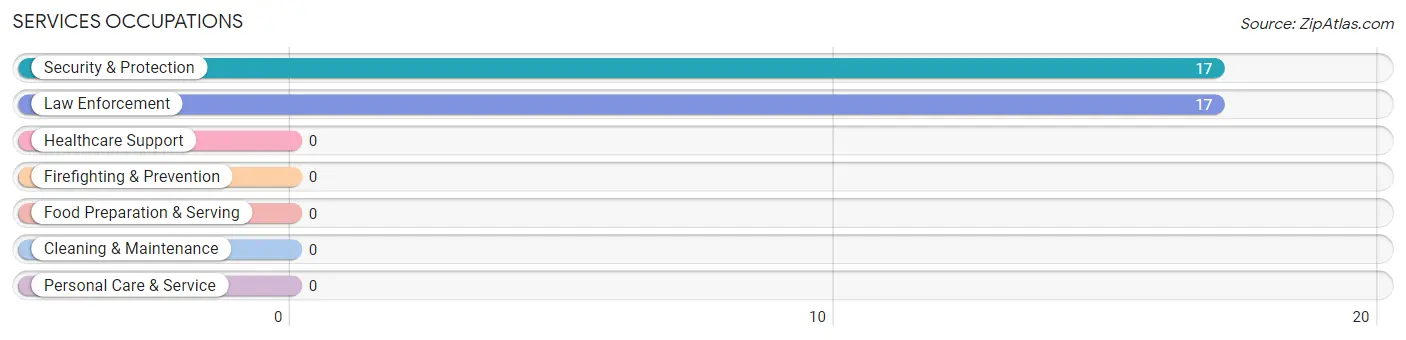
Services Occupations
The most common Services occupations in Noblestown are Security & Protection (17 | 6.8%), and Law Enforcement (17 | 6.8%).
Services Occupations by Sex
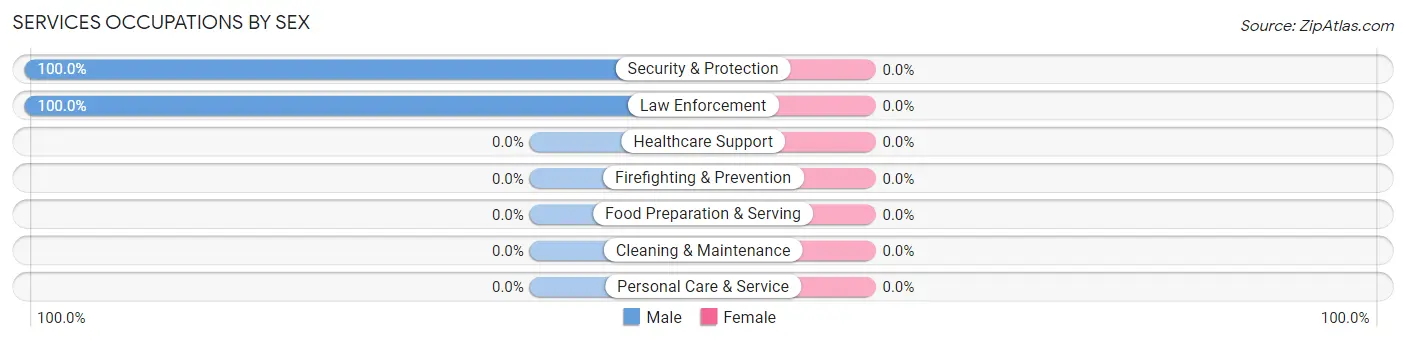
| Occupation | Male | Female |
| Healthcare Support | 0 (0.0%) | 0 (0.0%) |
| Security & Protection | 17 (100.0%) | 0 (0.0%) |
| Firefighting & Prevention | 0 (0.0%) | 0 (0.0%) |
| Law Enforcement | 17 (100.0%) | 0 (0.0%) |
| Food Preparation & Serving | 0 (0.0%) | 0 (0.0%) |
| Cleaning & Maintenance | 0 (0.0%) | 0 (0.0%) |
| Personal Care & Service | 0 (0.0%) | 0 (0.0%) |
| Total (Category) | 17 (100.0%) | 0 (0.0%) |
| Total (Overall) | 118 (46.8%) | 134 (53.2%) |
Sales and Office Occupations
The most common Sales and Office occupations in Noblestown are , and Office & Administration (33 | 13.1%).
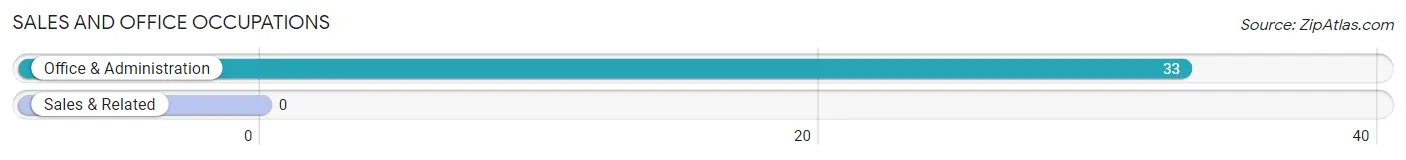
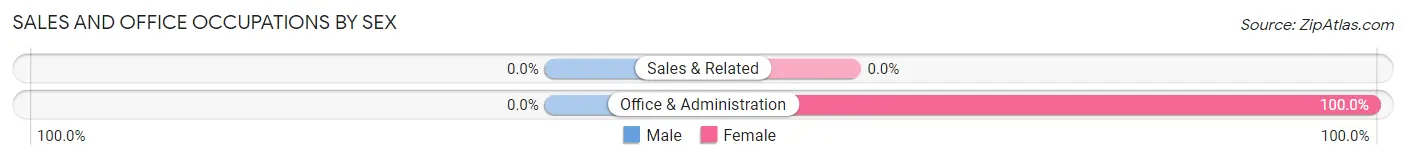
Sales and Office Occupations by Sex
| Occupation | Male | Female |
| Sales & Related | 0 (0.0%) | 0 (0.0%) |
| Office & Administration | 0 (0.0%) | 33 (100.0%) |
| Total (Category) | 0 (0.0%) | 33 (100.0%) |
| Total (Overall) | 118 (46.8%) | 134 (53.2%) |
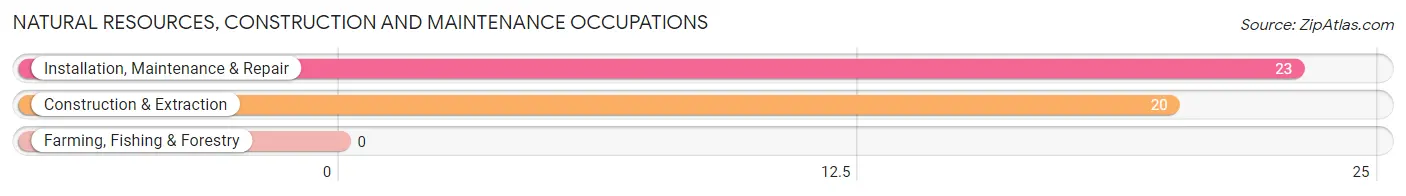
Natural Resources, Construction and Maintenance Occupations
The most common Natural Resources, Construction and Maintenance occupations in Noblestown are Installation, Maintenance & Repair (23 | 9.1%), and Construction & Extraction (20 | 7.9%).
Natural Resources, Construction and Maintenance Occupations by Sex
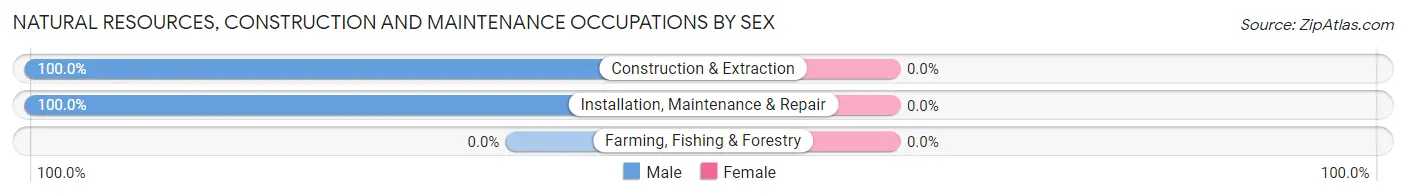
| Occupation | Male | Female |
| Farming, Fishing & Forestry | 0 (0.0%) | 0 (0.0%) |
| Construction & Extraction | 20 (100.0%) | 0 (0.0%) |
| Installation, Maintenance & Repair | 23 (100.0%) | 0 (0.0%) |
| Total (Category) | 43 (100.0%) | 0 (0.0%) |
| Total (Overall) | 118 (46.8%) | 134 (53.2%) |
Production, Transportation and Moving Occupations
The most common Production, Transportation and Moving occupations in Noblestown are Transportation (21 | 8.3%), and Material Moving (19 | 7.5%).
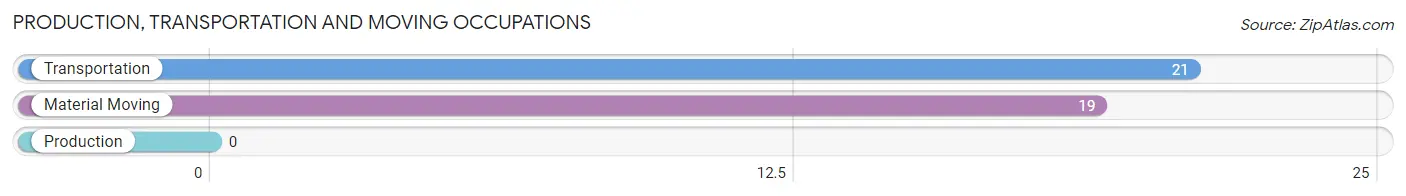
Production, Transportation and Moving Occupations by Sex
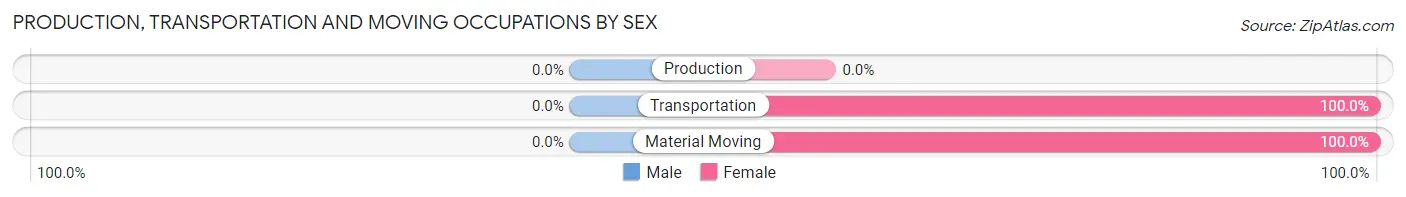
| Occupation | Male | Female |
| Production | 0 (0.0%) | 0 (0.0%) |
| Transportation | 0 (0.0%) | 21 (100.0%) |
| Material Moving | 0 (0.0%) | 19 (100.0%) |
| Total (Category) | 0 (0.0%) | 40 (100.0%) |
| Total (Overall) | 118 (46.8%) | 134 (53.2%) |
Employment Industries by Sex in Noblestown
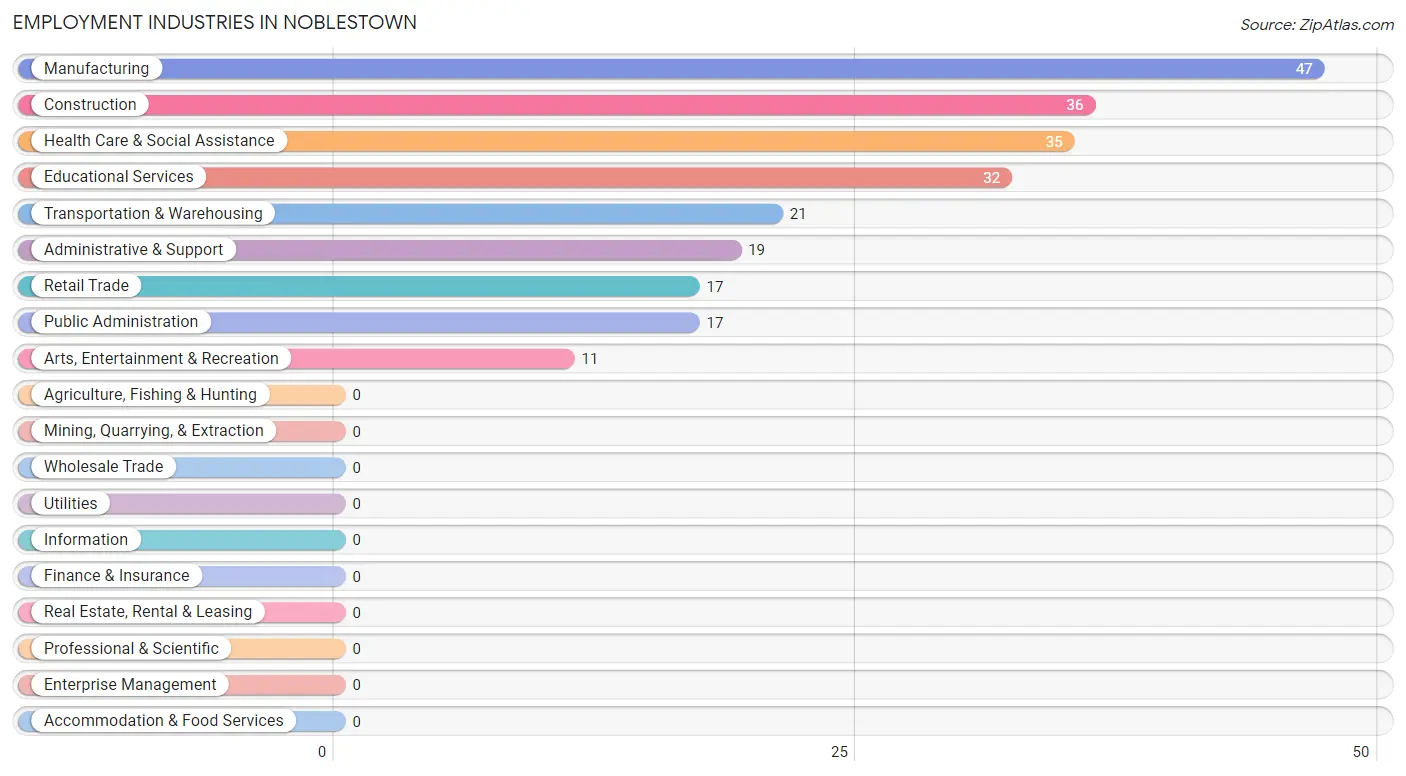
Employment Industries in Noblestown
The major employment industries in Noblestown include Manufacturing (47 | 18.6%), Construction (36 | 14.3%), Health Care & Social Assistance (35 | 13.9%), Educational Services (32 | 12.7%), and Transportation & Warehousing (21 | 8.3%).
Employment Industries by Sex in Noblestown
The Noblestown industries that see more men than women are Construction (100.0%), Public Administration (100.0%), and Health Care & Social Assistance (71.4%), whereas the industries that tend to have a higher number of women are Retail Trade (100.0%), Transportation & Warehousing (100.0%), and Administrative & Support (100.0%).
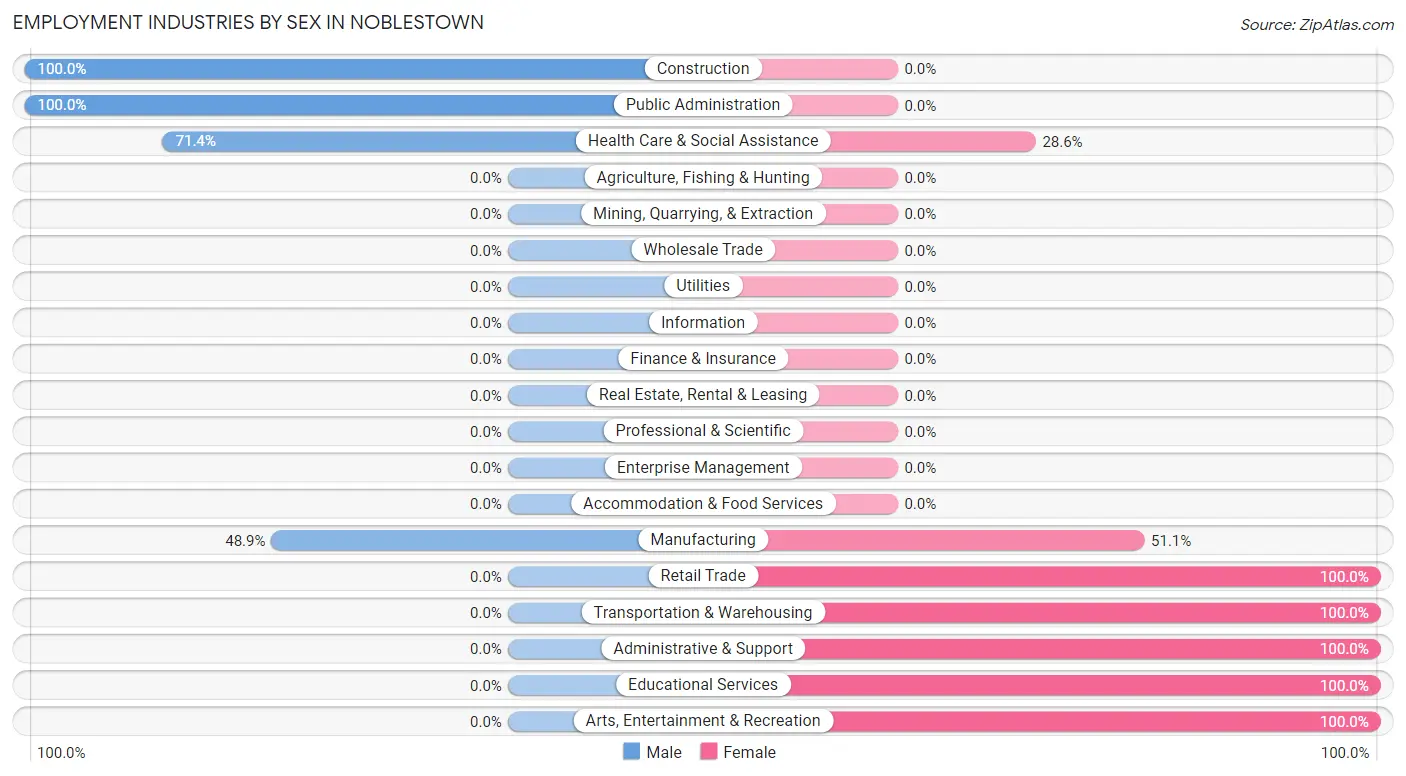
| Industry | Male | Female |
| Agriculture, Fishing & Hunting | 0 (0.0%) | 0 (0.0%) |
| Mining, Quarrying, & Extraction | 0 (0.0%) | 0 (0.0%) |
| Construction | 36 (100.0%) | 0 (0.0%) |
| Manufacturing | 23 (48.9%) | 24 (51.1%) |
| Wholesale Trade | 0 (0.0%) | 0 (0.0%) |
| Retail Trade | 0 (0.0%) | 17 (100.0%) |
| Transportation & Warehousing | 0 (0.0%) | 21 (100.0%) |
| Utilities | 0 (0.0%) | 0 (0.0%) |
| Information | 0 (0.0%) | 0 (0.0%) |
| Finance & Insurance | 0 (0.0%) | 0 (0.0%) |
| Real Estate, Rental & Leasing | 0 (0.0%) | 0 (0.0%) |
| Professional & Scientific | 0 (0.0%) | 0 (0.0%) |
| Enterprise Management | 0 (0.0%) | 0 (0.0%) |
| Administrative & Support | 0 (0.0%) | 19 (100.0%) |
| Educational Services | 0 (0.0%) | 32 (100.0%) |
| Health Care & Social Assistance | 25 (71.4%) | 10 (28.6%) |
| Arts, Entertainment & Recreation | 0 (0.0%) | 11 (100.0%) |
| Accommodation & Food Services | 0 (0.0%) | 0 (0.0%) |
| Public Administration | 17 (100.0%) | 0 (0.0%) |
| Total | 118 (46.8%) | 134 (53.2%) |
Education in Noblestown
School Enrollment in Noblestown
The most common levels of schooling among the 88 students in Noblestown are elementary school (39 | 44.3%), high school (33 | 37.5%), and middle school (16 | 18.2%).
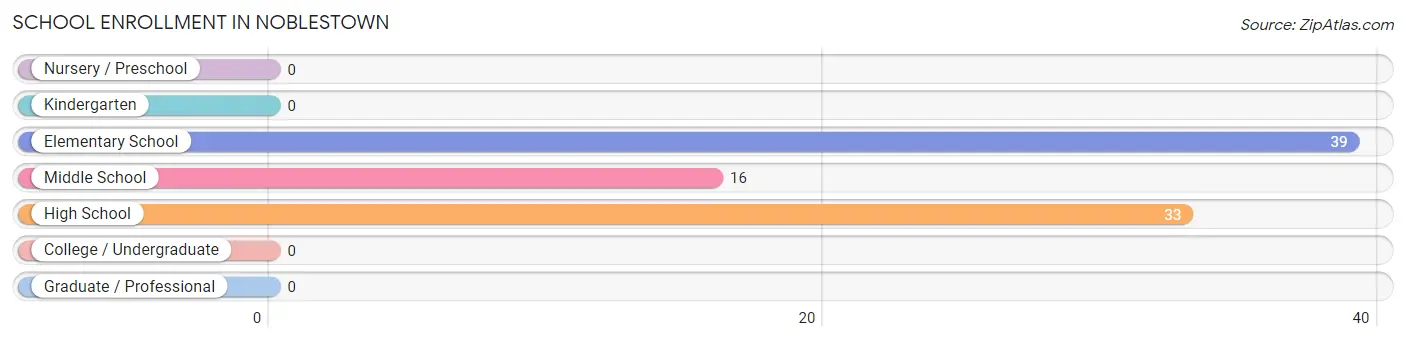
| School Level | # Students | % Students |
| Nursery / Preschool | 0 | 0.0% |
| Kindergarten | 0 | 0.0% |
| Elementary School | 39 | 44.3% |
| Middle School | 16 | 18.2% |
| High School | 33 | 37.5% |
| College / Undergraduate | 0 | 0.0% |
| Graduate / Professional | 0 | 0.0% |
| Total | 88 | 100.0% |
School Enrollment by Age by Funding Source in Noblestown
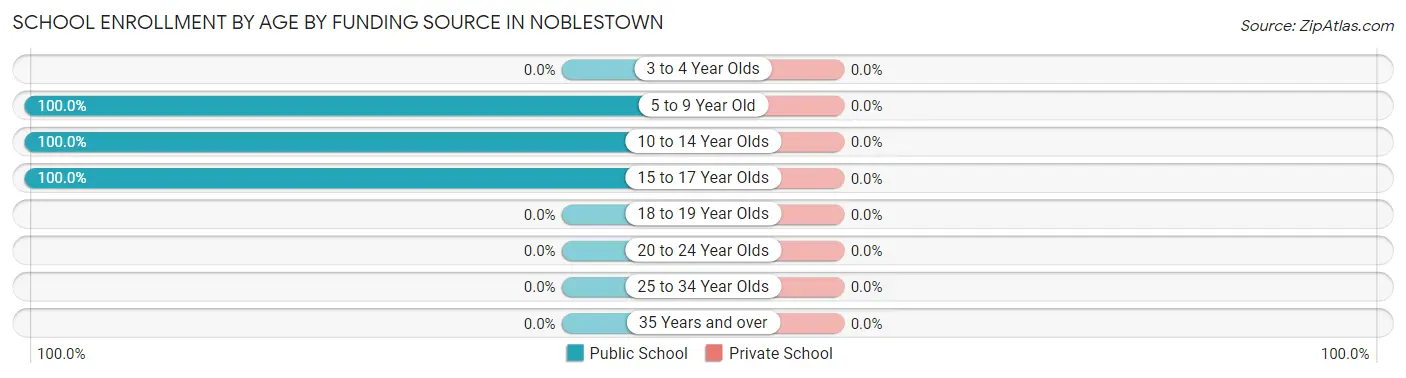
| Age Bracket | Public School | Private School |
| 3 to 4 Year Olds | 0 (0.0%) | 0 (0.0%) |
| 5 to 9 Year Old | 39 (100.0%) | 0 (0.0%) |
| 10 to 14 Year Olds | 32 (100.0%) | 0 (0.0%) |
| 15 to 17 Year Olds | 17 (100.0%) | 0 (0.0%) |
| 18 to 19 Year Olds | 0 (0.0%) | 0 (0.0%) |
| 20 to 24 Year Olds | 0 (0.0%) | 0 (0.0%) |
| 25 to 34 Year Olds | 0 (0.0%) | 0 (0.0%) |
| 35 Years and over | 0 (0.0%) | 0 (0.0%) |
| Total | 88 (100.0%) | 0 (0.0%) |
Educational Attainment by Field of Study in Noblestown
Education (83 | 31.2%), business (70 | 26.3%), engineering (25 | 9.4%), bio, nature & agricultural (24 | 9.0%), and visual & performing arts (19 | 7.1%) are the most common fields of study among 266 individuals in Noblestown who have obtained a bachelor's degree or higher.
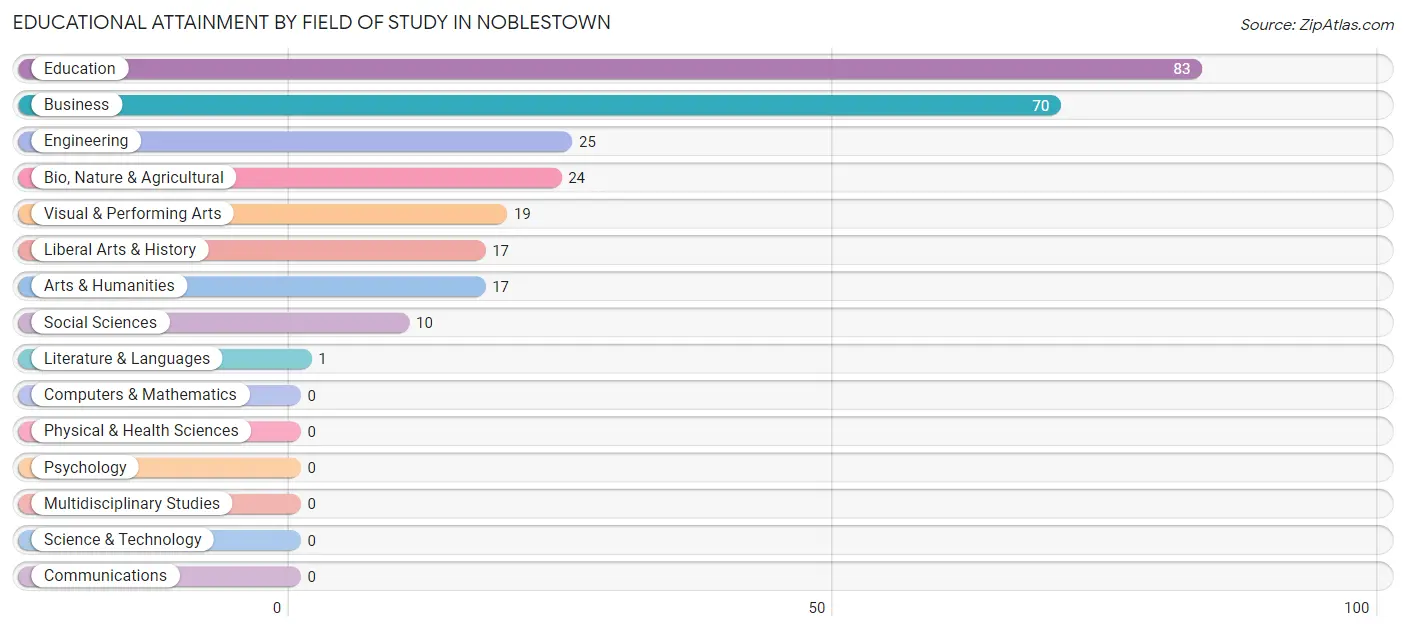
| Field of Study | # Graduates | % Graduates |
| Computers & Mathematics | 0 | 0.0% |
| Bio, Nature & Agricultural | 24 | 9.0% |
| Physical & Health Sciences | 0 | 0.0% |
| Psychology | 0 | 0.0% |
| Social Sciences | 10 | 3.8% |
| Engineering | 25 | 9.4% |
| Multidisciplinary Studies | 0 | 0.0% |
| Science & Technology | 0 | 0.0% |
| Business | 70 | 26.3% |
| Education | 83 | 31.2% |
| Literature & Languages | 1 | 0.4% |
| Liberal Arts & History | 17 | 6.4% |
| Visual & Performing Arts | 19 | 7.1% |
| Communications | 0 | 0.0% |
| Arts & Humanities | 17 | 6.4% |
| Total | 266 | 100.0% |
Transportation & Commute in Noblestown
Vehicle Availability by Sex in Noblestown
The most prevalent vehicle ownership categories in Noblestown are males with 3 vehicles (53, accounting for 45.3%) and females with 3 vehicles (49, making up 42.7%).
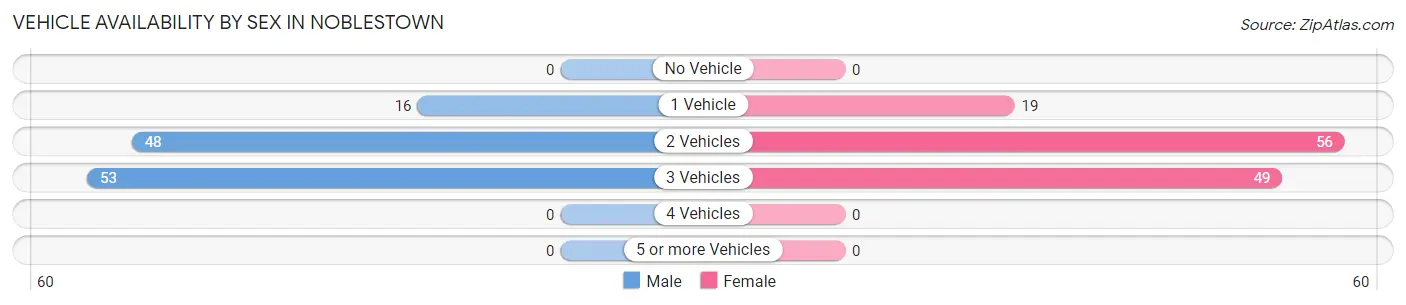
| Vehicles Available | Male | Female |
| No Vehicle | 0 (0.0%) | 0 (0.0%) |
| 1 Vehicle | 16 (13.7%) | 19 (15.3%) |
| 2 Vehicles | 48 (41.0%) | 56 (45.2%) |
| 3 Vehicles | 53 (45.3%) | 49 (39.5%) |
| 4 Vehicles | 0 (0.0%) | 0 (0.0%) |
| 5 or more Vehicles | 0 (0.0%) | 0 (0.0%) |
| Total | 117 (100.0%) | 124 (100.0%) |
Commute Time in Noblestown
The most frequently occuring commute durations in Noblestown are 10 to 14 minutes (52 commuters, 23.0%), 30 to 34 minutes (44 commuters, 19.5%), and 45 to 59 minutes (34 commuters, 15.0%).
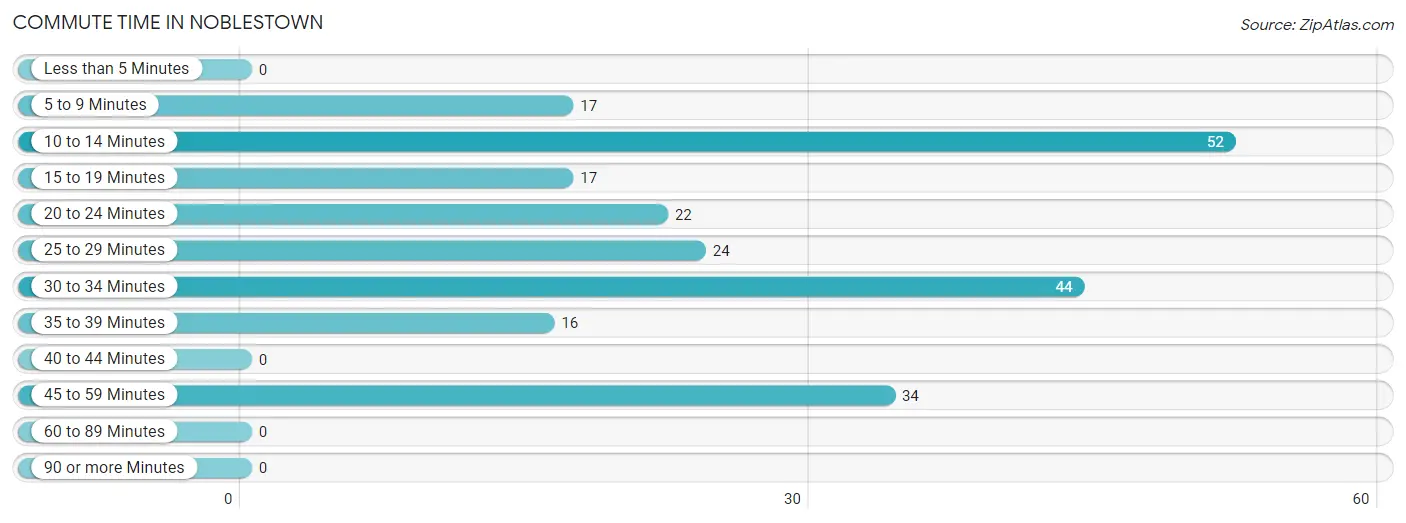
| Commute Time | # Commuters | % Commuters |
| Less than 5 Minutes | 0 | 0.0% |
| 5 to 9 Minutes | 17 | 7.5% |
| 10 to 14 Minutes | 52 | 23.0% |
| 15 to 19 Minutes | 17 | 7.5% |
| 20 to 24 Minutes | 22 | 9.7% |
| 25 to 29 Minutes | 24 | 10.6% |
| 30 to 34 Minutes | 44 | 19.5% |
| 35 to 39 Minutes | 16 | 7.1% |
| 40 to 44 Minutes | 0 | 0.0% |
| 45 to 59 Minutes | 34 | 15.0% |
| 60 to 89 Minutes | 0 | 0.0% |
| 90 or more Minutes | 0 | 0.0% |
Commute Time by Sex in Noblestown
The most common commute times in Noblestown are 10 to 14 minutes (36 commuters, 30.5%) for males and 25 to 29 minutes (24 commuters, 22.2%) for females.
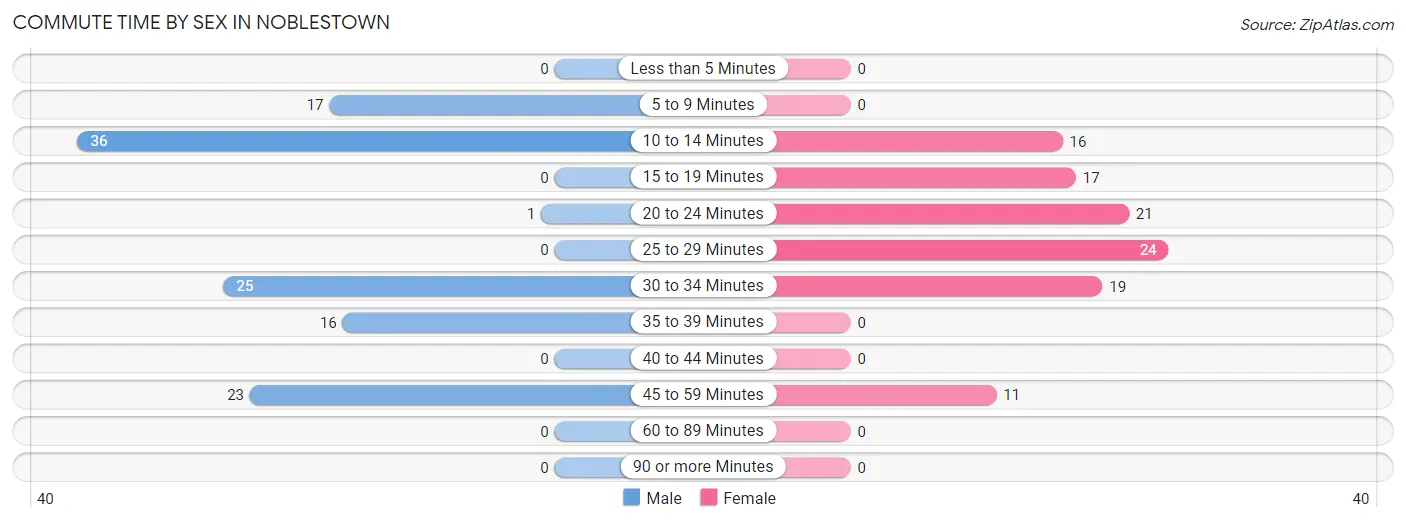
| Commute Time | Male | Female |
| Less than 5 Minutes | 0 (0.0%) | 0 (0.0%) |
| 5 to 9 Minutes | 17 (14.4%) | 0 (0.0%) |
| 10 to 14 Minutes | 36 (30.5%) | 16 (14.8%) |
| 15 to 19 Minutes | 0 (0.0%) | 17 (15.7%) |
| 20 to 24 Minutes | 1 (0.9%) | 21 (19.4%) |
| 25 to 29 Minutes | 0 (0.0%) | 24 (22.2%) |
| 30 to 34 Minutes | 25 (21.2%) | 19 (17.6%) |
| 35 to 39 Minutes | 16 (13.6%) | 0 (0.0%) |
| 40 to 44 Minutes | 0 (0.0%) | 0 (0.0%) |
| 45 to 59 Minutes | 23 (19.5%) | 11 (10.2%) |
| 60 to 89 Minutes | 0 (0.0%) | 0 (0.0%) |
| 90 or more Minutes | 0 (0.0%) | 0 (0.0%) |
Time of Departure to Work by Sex in Noblestown
The most frequent times of departure to work in Noblestown are 8:00 AM to 8:29 AM (36, 30.5%) for males and 8:00 AM to 8:29 AM (40, 37.0%) for females.
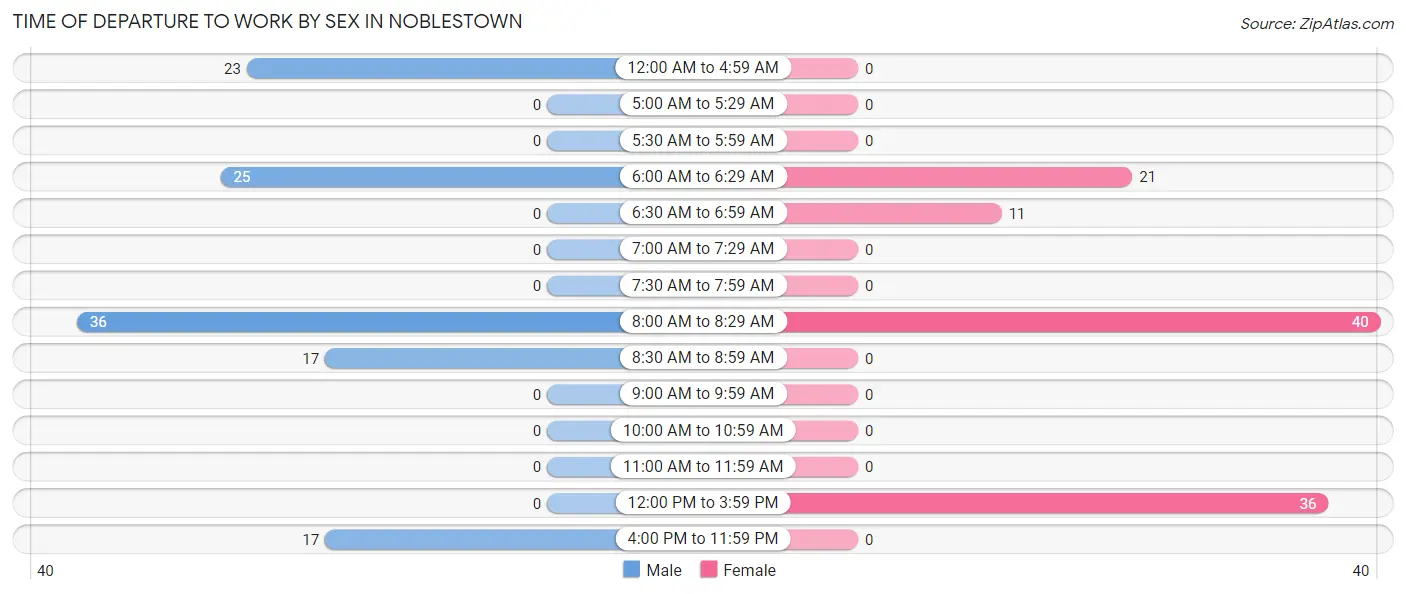
| Time of Departure | Male | Female |
| 12:00 AM to 4:59 AM | 23 (19.5%) | 0 (0.0%) |
| 5:00 AM to 5:29 AM | 0 (0.0%) | 0 (0.0%) |
| 5:30 AM to 5:59 AM | 0 (0.0%) | 0 (0.0%) |
| 6:00 AM to 6:29 AM | 25 (21.2%) | 21 (19.4%) |
| 6:30 AM to 6:59 AM | 0 (0.0%) | 11 (10.2%) |
| 7:00 AM to 7:29 AM | 0 (0.0%) | 0 (0.0%) |
| 7:30 AM to 7:59 AM | 0 (0.0%) | 0 (0.0%) |
| 8:00 AM to 8:29 AM | 36 (30.5%) | 40 (37.0%) |
| 8:30 AM to 8:59 AM | 17 (14.4%) | 0 (0.0%) |
| 9:00 AM to 9:59 AM | 0 (0.0%) | 0 (0.0%) |
| 10:00 AM to 10:59 AM | 0 (0.0%) | 0 (0.0%) |
| 11:00 AM to 11:59 AM | 0 (0.0%) | 0 (0.0%) |
| 12:00 PM to 3:59 PM | 0 (0.0%) | 36 (33.3%) |
| 4:00 PM to 11:59 PM | 17 (14.4%) | 0 (0.0%) |
| Total | 118 (100.0%) | 108 (100.0%) |
Housing Occupancy in Noblestown
Occupancy by Ownership in Noblestown
Of the total 255 dwellings in Noblestown, owner-occupied units account for 236 (92.5%), while renter-occupied units make up 19 (7.4%).
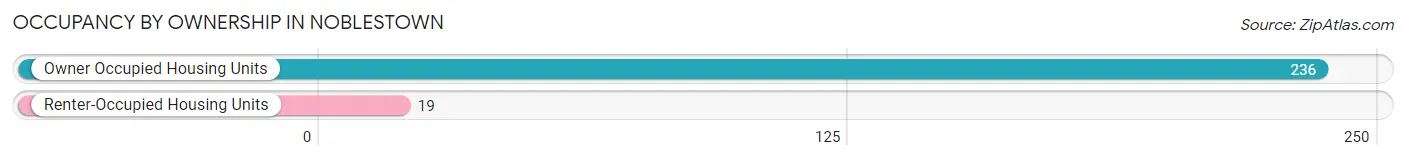
| Occupancy | # Housing Units | % Housing Units |
| Owner Occupied Housing Units | 236 | 92.5% |
| Renter-Occupied Housing Units | 19 | 7.4% |
| Total Occupied Housing Units | 255 | 100.0% |
Occupancy by Household Size in Noblestown
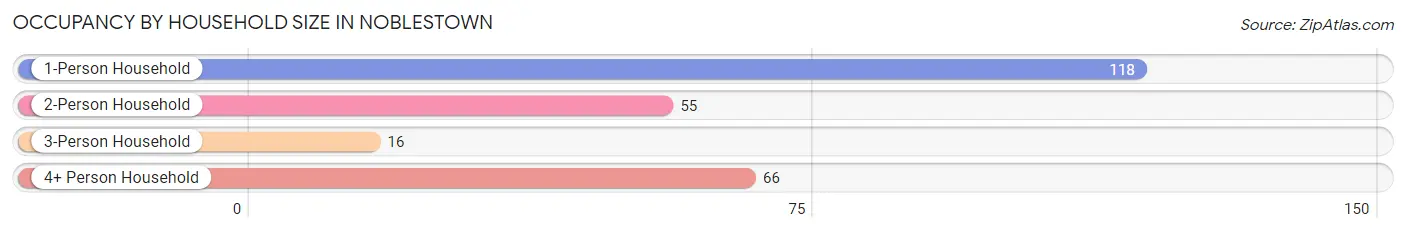
| Household Size | # Housing Units | % Housing Units |
| 1-Person Household | 118 | 46.3% |
| 2-Person Household | 55 | 21.6% |
| 3-Person Household | 16 | 6.3% |
| 4+ Person Household | 66 | 25.9% |
| Total Housing Units | 255 | 100.0% |
Occupancy by Ownership by Household Size in Noblestown
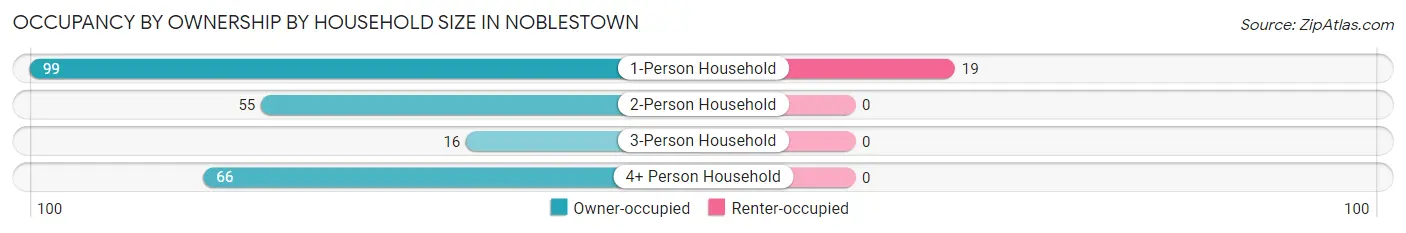
| Household Size | Owner-occupied | Renter-occupied |
| 1-Person Household | 99 (83.9%) | 19 (16.1%) |
| 2-Person Household | 55 (100.0%) | 0 (0.0%) |
| 3-Person Household | 16 (100.0%) | 0 (0.0%) |
| 4+ Person Household | 66 (100.0%) | 0 (0.0%) |
| Total Housing Units | 236 (92.5%) | 19 (7.4%) |
Occupancy by Educational Attainment in Noblestown
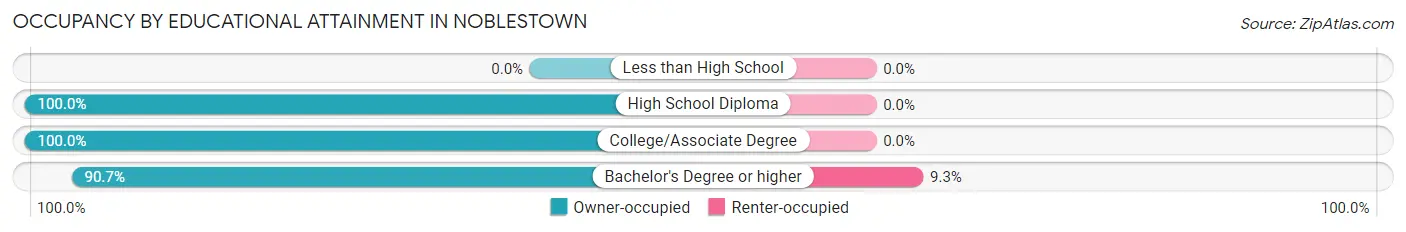
| Household Size | Owner-occupied | Renter-occupied |
| Less than High School | 0 (0.0%) | 0 (0.0%) |
| High School Diploma | 35 (100.0%) | 0 (0.0%) |
| College/Associate Degree | 16 (100.0%) | 0 (0.0%) |
| Bachelor's Degree or higher | 185 (90.7%) | 19 (9.3%) |
Occupancy by Age of Householder in Noblestown
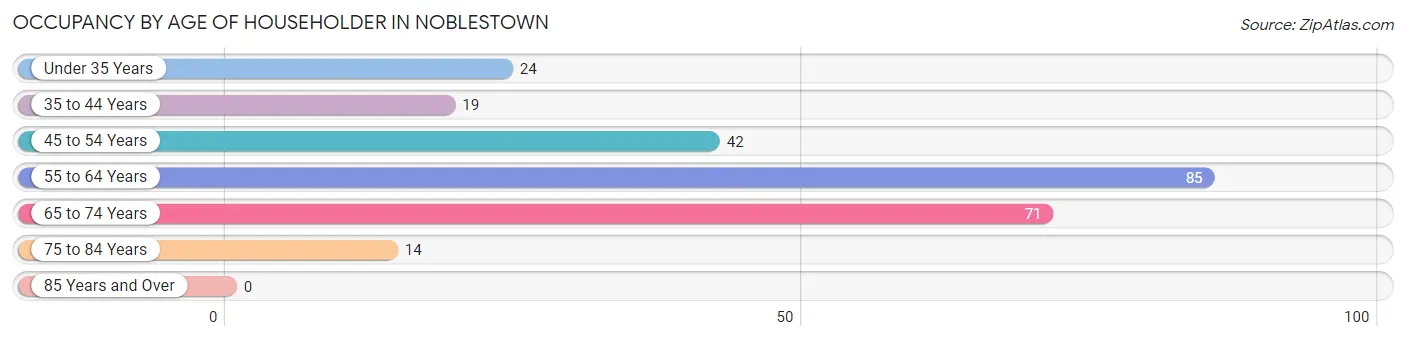
| Age Bracket | # Households | % Households |
| Under 35 Years | 24 | 9.4% |
| 35 to 44 Years | 19 | 7.4% |
| 45 to 54 Years | 42 | 16.5% |
| 55 to 64 Years | 85 | 33.3% |
| 65 to 74 Years | 71 | 27.8% |
| 75 to 84 Years | 14 | 5.5% |
| 85 Years and Over | 0 | 0.0% |
| Total | 255 | 100.0% |
Housing Finances in Noblestown
Median Income by Occupancy in Noblestown
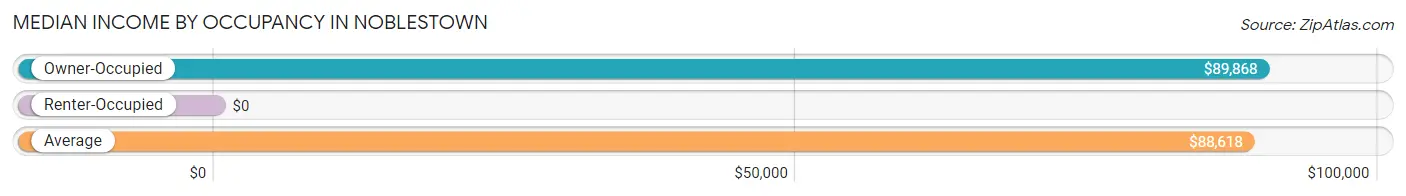
| Occupancy Type | # Households | Median Income |
| Owner-Occupied | 236 (92.5%) | $89,868 |
| Renter-Occupied | 19 (7.4%) | $0 |
| Average | 255 (100.0%) | $88,618 |
Occupancy by Householder Income Bracket in Noblestown
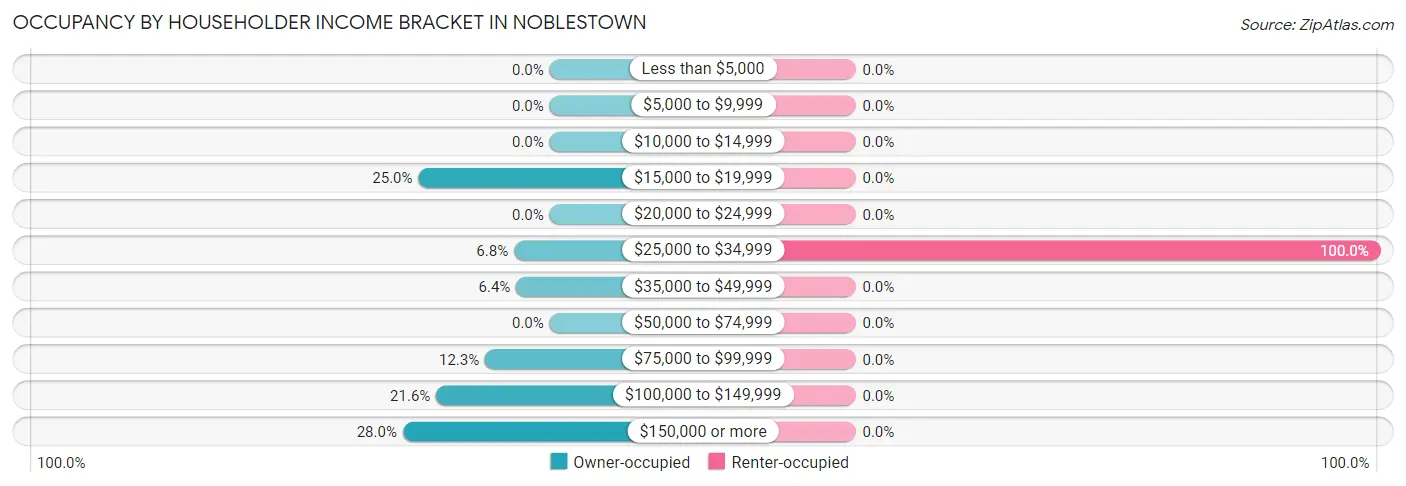
| Income Bracket | Owner-occupied | Renter-occupied |
| Less than $5,000 | 0 (0.0%) | 0 (0.0%) |
| $5,000 to $9,999 | 0 (0.0%) | 0 (0.0%) |
| $10,000 to $14,999 | 0 (0.0%) | 0 (0.0%) |
| $15,000 to $19,999 | 59 (25.0%) | 0 (0.0%) |
| $20,000 to $24,999 | 0 (0.0%) | 0 (0.0%) |
| $25,000 to $34,999 | 16 (6.8%) | 19 (100.0%) |
| $35,000 to $49,999 | 15 (6.4%) | 0 (0.0%) |
| $50,000 to $74,999 | 0 (0.0%) | 0 (0.0%) |
| $75,000 to $99,999 | 29 (12.3%) | 0 (0.0%) |
| $100,000 to $149,999 | 51 (21.6%) | 0 (0.0%) |
| $150,000 or more | 66 (28.0%) | 0 (0.0%) |
| Total | 236 (100.0%) | 19 (100.0%) |
Monthly Housing Cost Tiers in Noblestown
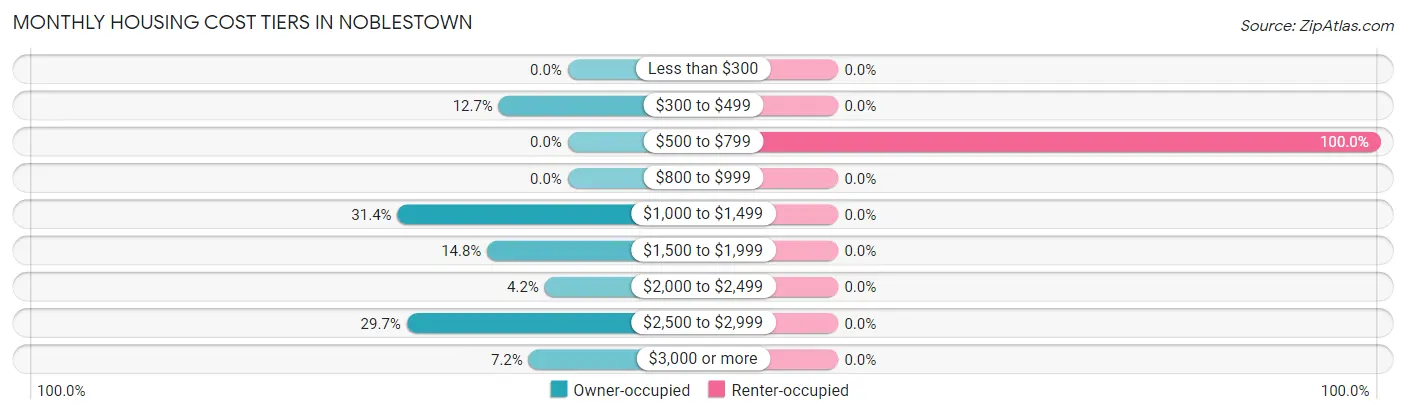
| Monthly Cost | Owner-occupied | Renter-occupied |
| Less than $300 | 0 (0.0%) | 0 (0.0%) |
| $300 to $499 | 30 (12.7%) | 0 (0.0%) |
| $500 to $799 | 0 (0.0%) | 19 (100.0%) |
| $800 to $999 | 0 (0.0%) | 0 (0.0%) |
| $1,000 to $1,499 | 74 (31.4%) | 0 (0.0%) |
| $1,500 to $1,999 | 35 (14.8%) | 0 (0.0%) |
| $2,000 to $2,499 | 10 (4.2%) | 0 (0.0%) |
| $2,500 to $2,999 | 70 (29.7%) | 0 (0.0%) |
| $3,000 or more | 17 (7.2%) | 0 (0.0%) |
| Total | 236 (100.0%) | 19 (100.0%) |
Physical Housing Characteristics in Noblestown
Housing Structures in Noblestown
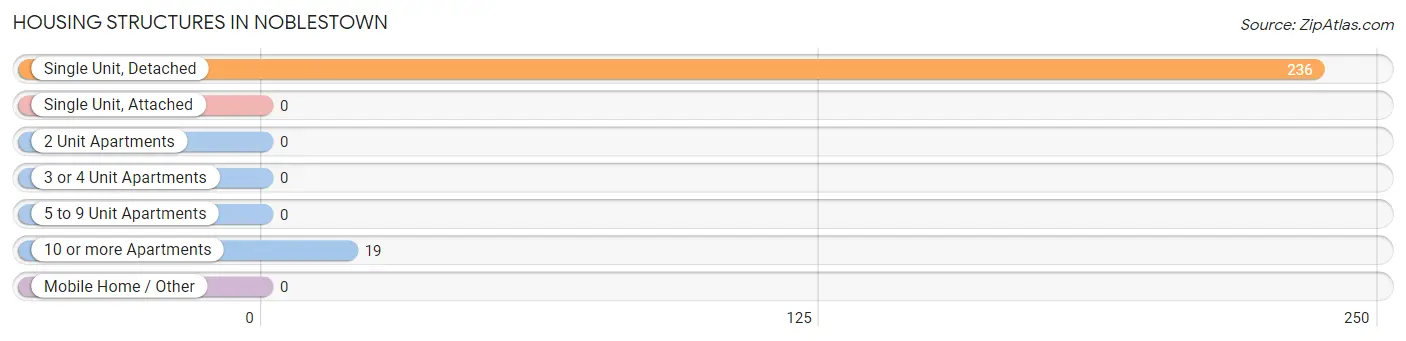
| Structure Type | # Housing Units | % Housing Units |
| Single Unit, Detached | 236 | 92.5% |
| Single Unit, Attached | 0 | 0.0% |
| 2 Unit Apartments | 0 | 0.0% |
| 3 or 4 Unit Apartments | 0 | 0.0% |
| 5 to 9 Unit Apartments | 0 | 0.0% |
| 10 or more Apartments | 19 | 7.4% |
| Mobile Home / Other | 0 | 0.0% |
| Total | 255 | 100.0% |
Housing Structures by Occupancy in Noblestown
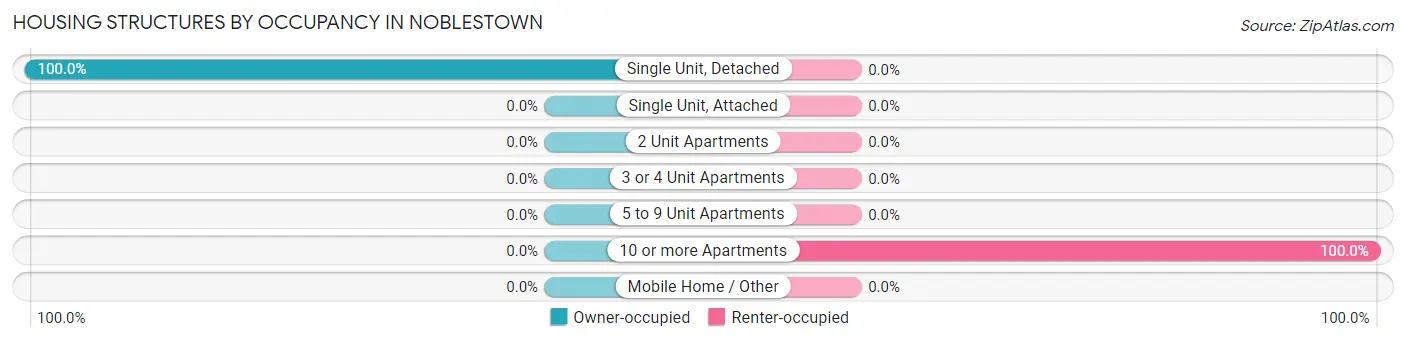
| Structure Type | Owner-occupied | Renter-occupied |
| Single Unit, Detached | 236 (100.0%) | 0 (0.0%) |
| Single Unit, Attached | 0 (0.0%) | 0 (0.0%) |
| 2 Unit Apartments | 0 (0.0%) | 0 (0.0%) |
| 3 or 4 Unit Apartments | 0 (0.0%) | 0 (0.0%) |
| 5 to 9 Unit Apartments | 0 (0.0%) | 0 (0.0%) |
| 10 or more Apartments | 0 (0.0%) | 19 (100.0%) |
| Mobile Home / Other | 0 (0.0%) | 0 (0.0%) |
| Total | 236 (92.5%) | 19 (7.4%) |
Housing Structures by Number of Rooms in Noblestown
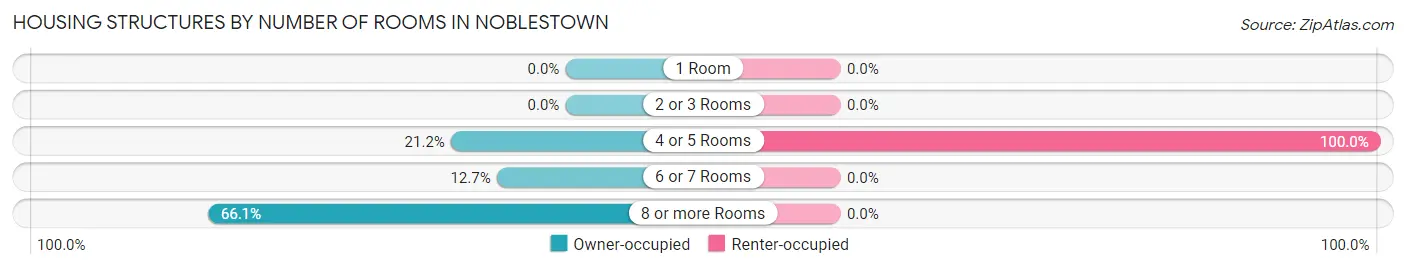
| Number of Rooms | Owner-occupied | Renter-occupied |
| 1 Room | 0 (0.0%) | 0 (0.0%) |
| 2 or 3 Rooms | 0 (0.0%) | 0 (0.0%) |
| 4 or 5 Rooms | 50 (21.2%) | 19 (100.0%) |
| 6 or 7 Rooms | 30 (12.7%) | 0 (0.0%) |
| 8 or more Rooms | 156 (66.1%) | 0 (0.0%) |
| Total | 236 (100.0%) | 19 (100.0%) |
Housing Structure by Heating Type in Noblestown
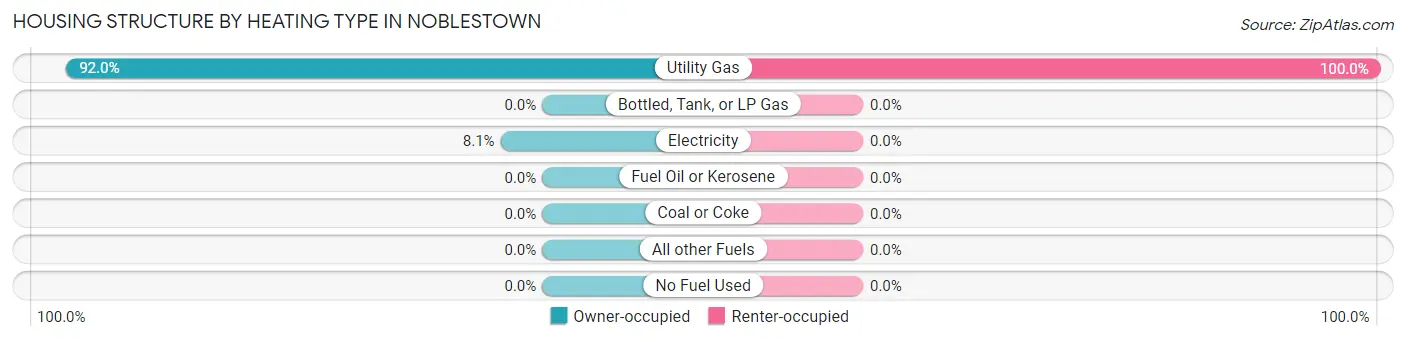
| Heating Type | Owner-occupied | Renter-occupied |
| Utility Gas | 217 (91.9%) | 19 (100.0%) |
| Bottled, Tank, or LP Gas | 0 (0.0%) | 0 (0.0%) |
| Electricity | 19 (8.1%) | 0 (0.0%) |
| Fuel Oil or Kerosene | 0 (0.0%) | 0 (0.0%) |
| Coal or Coke | 0 (0.0%) | 0 (0.0%) |
| All other Fuels | 0 (0.0%) | 0 (0.0%) |
| No Fuel Used | 0 (0.0%) | 0 (0.0%) |
| Total | 236 (100.0%) | 19 (100.0%) |
Household Vehicle Usage in Noblestown
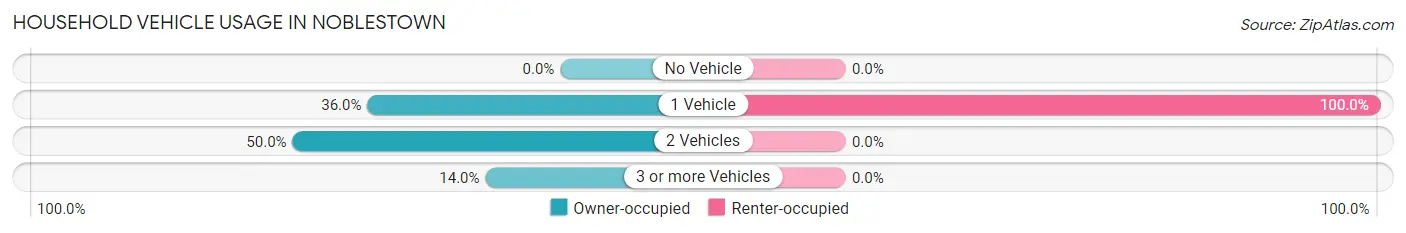
| Vehicles per Household | Owner-occupied | Renter-occupied |
| No Vehicle | 0 (0.0%) | 0 (0.0%) |
| 1 Vehicle | 85 (36.0%) | 19 (100.0%) |
| 2 Vehicles | 118 (50.0%) | 0 (0.0%) |
| 3 or more Vehicles | 33 (14.0%) | 0 (0.0%) |
| Total | 236 (100.0%) | 19 (100.0%) |
Real Estate & Mortgages in Noblestown
Real Estate and Mortgage Overview in Noblestown
| Characteristic | Without Mortgage | With Mortgage |
| Housing Units | 104 | 132 |
| Median Property Value | $529,700 | $390,400 |
| Median Household Income | - | - |
| Monthly Housing Costs | $1,212 | $17 |
| Real Estate Taxes | $10,001 | $0 |
Property Value by Mortgage Status in Noblestown
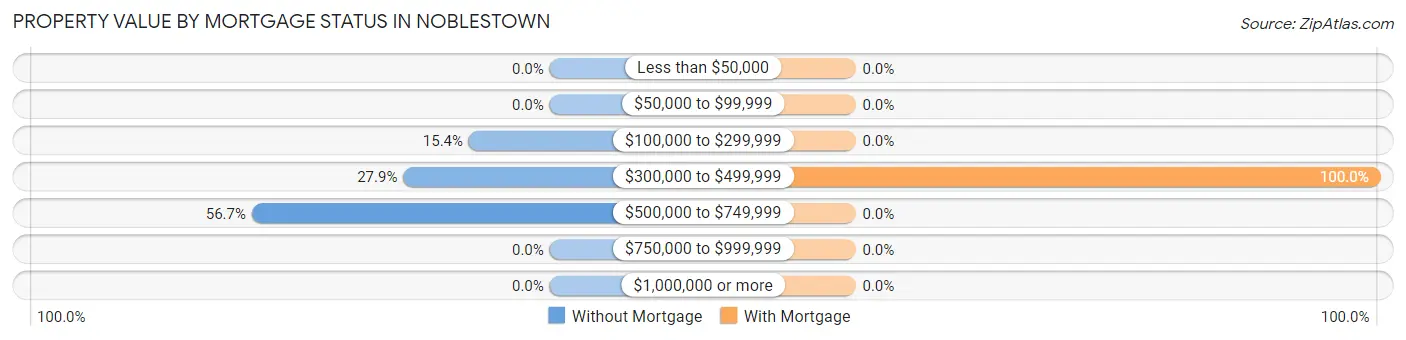
| Property Value | Without Mortgage | With Mortgage |
| Less than $50,000 | 0 (0.0%) | 0 (0.0%) |
| $50,000 to $99,999 | 0 (0.0%) | 0 (0.0%) |
| $100,000 to $299,999 | 16 (15.4%) | 0 (0.0%) |
| $300,000 to $499,999 | 29 (27.9%) | 132 (100.0%) |
| $500,000 to $749,999 | 59 (56.7%) | 0 (0.0%) |
| $750,000 to $999,999 | 0 (0.0%) | 0 (0.0%) |
| $1,000,000 or more | 0 (0.0%) | 0 (0.0%) |
| Total | 104 (100.0%) | 132 (100.0%) |
Household Income by Mortgage Status in Noblestown
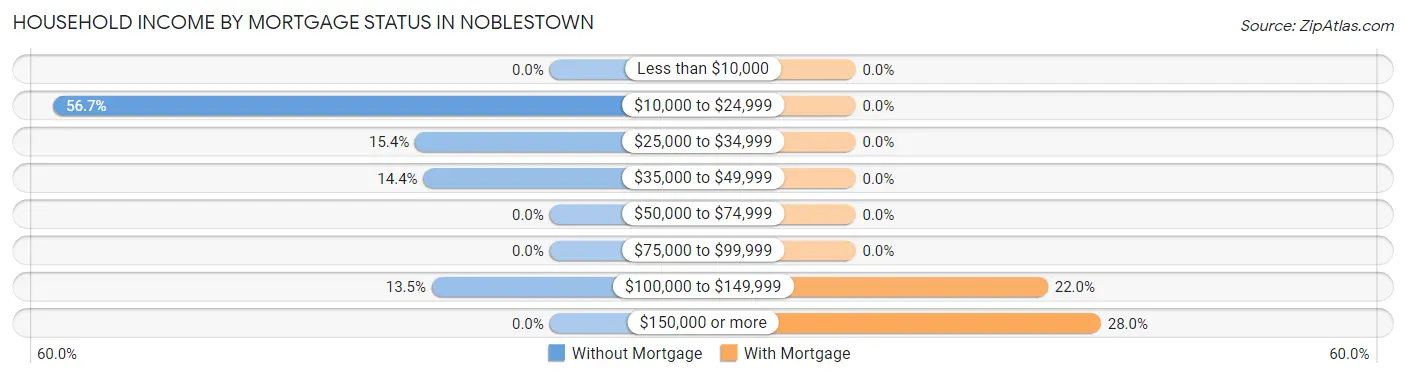
| Household Income | Without Mortgage | With Mortgage |
| Less than $10,000 | 0 (0.0%) | 0 (0.0%) |
| $10,000 to $24,999 | 59 (56.7%) | 0 (0.0%) |
| $25,000 to $34,999 | 16 (15.4%) | 0 (0.0%) |
| $35,000 to $49,999 | 15 (14.4%) | 0 (0.0%) |
| $50,000 to $74,999 | 0 (0.0%) | 0 (0.0%) |
| $75,000 to $99,999 | 0 (0.0%) | 0 (0.0%) |
| $100,000 to $149,999 | 14 (13.5%) | 29 (22.0%) |
| $150,000 or more | 0 (0.0%) | 37 (28.0%) |
| Total | 104 (100.0%) | 132 (100.0%) |
Property Value to Household Income Ratio in Noblestown
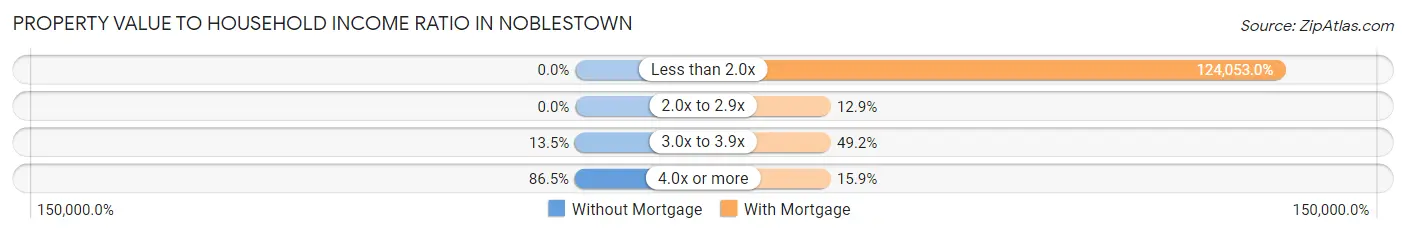
| Value-to-Income Ratio | Without Mortgage | With Mortgage |
| Less than 2.0x | 0 (0.0%) | 163,750 (124,053.0%) |
| 2.0x to 2.9x | 0 (0.0%) | 17 (12.9%) |
| 3.0x to 3.9x | 14 (13.5%) | 65 (49.2%) |
| 4.0x or more | 90 (86.5%) | 21 (15.9%) |
| Total | 104 (100.0%) | 132 (100.0%) |
Real Estate Taxes by Mortgage Status in Noblestown
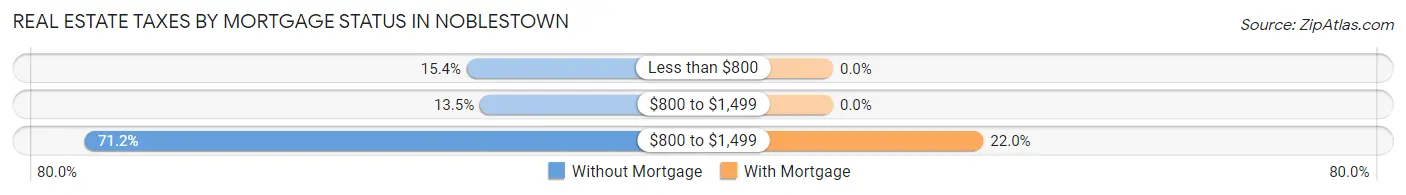
| Property Taxes | Without Mortgage | With Mortgage |
| Less than $800 | 16 (15.4%) | 0 (0.0%) |
| $800 to $1,499 | 14 (13.5%) | 0 (0.0%) |
| $800 to $1,499 | 74 (71.2%) | 29 (22.0%) |
| Total | 104 (100.0%) | 132 (100.0%) |
Health & Disability in Noblestown
Health Insurance Coverage by Age in Noblestown
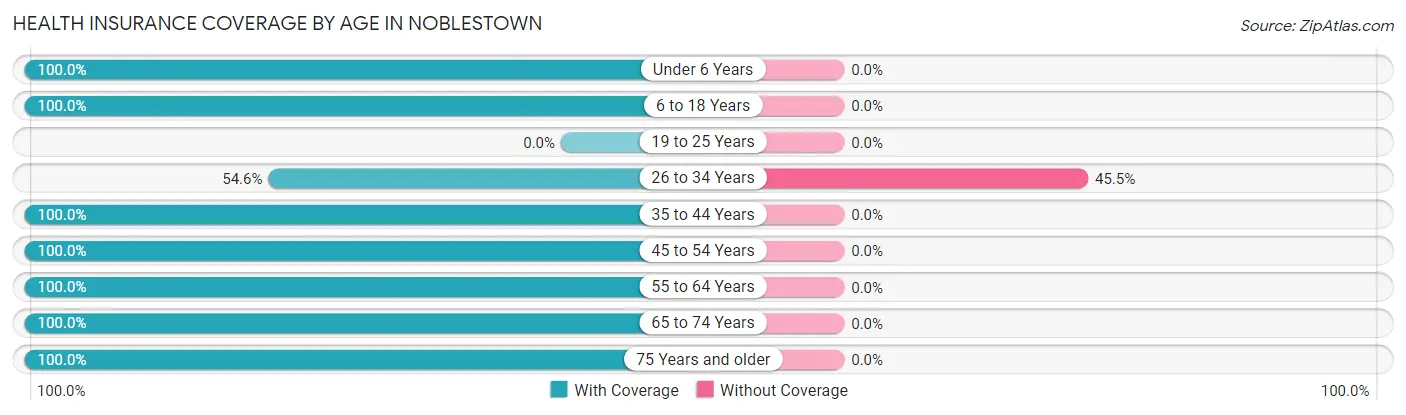
| Age Bracket | With Coverage | Without Coverage |
| Under 6 Years | 44 (100.0%) | 0 (0.0%) |
| 6 to 18 Years | 88 (100.0%) | 0 (0.0%) |
| 19 to 25 Years | 0 (0.0%) | 0 (0.0%) |
| 26 to 34 Years | 24 (54.5%) | 20 (45.5%) |
| 35 to 44 Years | 54 (100.0%) | 0 (0.0%) |
| 45 to 54 Years | 58 (100.0%) | 0 (0.0%) |
| 55 to 64 Years | 143 (100.0%) | 0 (0.0%) |
| 65 to 74 Years | 87 (100.0%) | 0 (0.0%) |
| 75 Years and older | 14 (100.0%) | 0 (0.0%) |
| Total | 512 (96.2%) | 20 (3.8%) |
Health Insurance Coverage by Citizenship Status in Noblestown
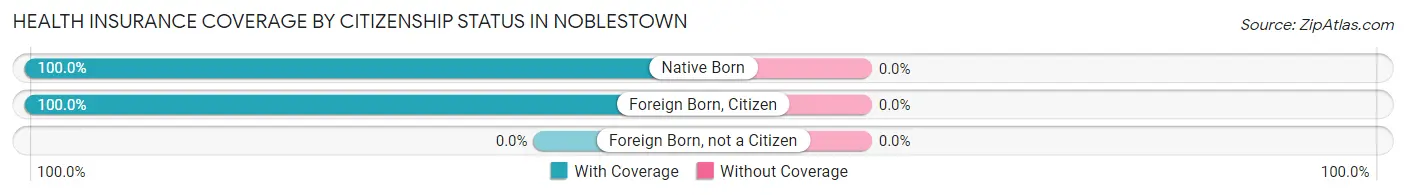
| Citizenship Status | With Coverage | Without Coverage |
| Native Born | 44 (100.0%) | 0 (0.0%) |
| Foreign Born, Citizen | 88 (100.0%) | 0 (0.0%) |
| Foreign Born, not a Citizen | 0 (0.0%) | 0 (0.0%) |
Health Insurance Coverage by Household Income in Noblestown
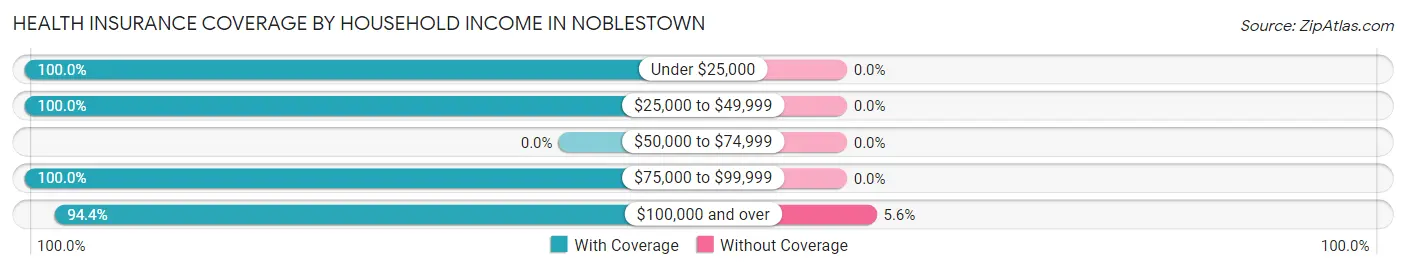
| Household Income | With Coverage | Without Coverage |
| Under $25,000 | 59 (100.0%) | 0 (0.0%) |
| $25,000 to $49,999 | 65 (100.0%) | 0 (0.0%) |
| $50,000 to $74,999 | 0 (0.0%) | 0 (0.0%) |
| $75,000 to $99,999 | 47 (100.0%) | 0 (0.0%) |
| $100,000 and over | 339 (94.4%) | 20 (5.6%) |
Public vs Private Health Insurance Coverage by Age in Noblestown
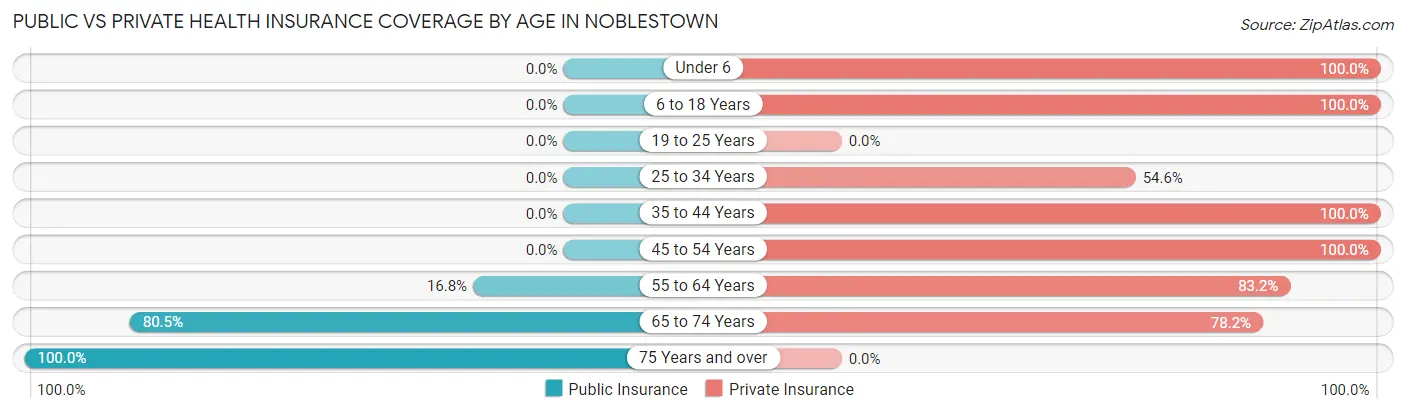
| Age Bracket | Public Insurance | Private Insurance |
| Under 6 | 0 (0.0%) | 44 (100.0%) |
| 6 to 18 Years | 0 (0.0%) | 88 (100.0%) |
| 19 to 25 Years | 0 (0.0%) | 0 (0.0%) |
| 25 to 34 Years | 0 (0.0%) | 24 (54.5%) |
| 35 to 44 Years | 0 (0.0%) | 54 (100.0%) |
| 45 to 54 Years | 0 (0.0%) | 58 (100.0%) |
| 55 to 64 Years | 24 (16.8%) | 119 (83.2%) |
| 65 to 74 Years | 70 (80.5%) | 68 (78.2%) |
| 75 Years and over | 14 (100.0%) | 0 (0.0%) |
| Total | 108 (20.3%) | 455 (85.5%) |
Disability Status by Sex by Age in Noblestown
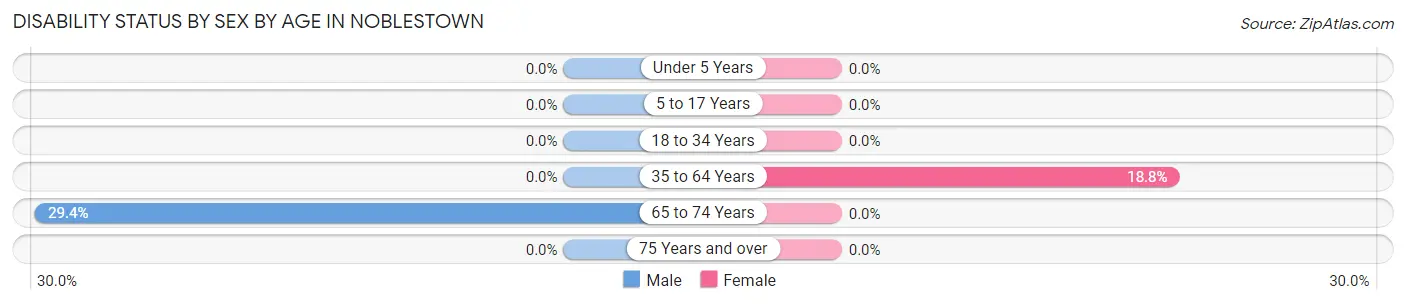
| Age Bracket | Male | Female |
| Under 5 Years | 0 (0.0%) | 0 (0.0%) |
| 5 to 17 Years | 0 (0.0%) | 0 (0.0%) |
| 18 to 34 Years | 0 (0.0%) | 0 (0.0%) |
| 35 to 64 Years | 0 (0.0%) | 28 (18.8%) |
| 65 to 74 Years | 15 (29.4%) | 0 (0.0%) |
| 75 Years and over | 0 (0.0%) | 0 (0.0%) |
Disability Class by Sex by Age in Noblestown
Disability Class: Hearing Difficulty
| Age Bracket | Male | Female |
| Under 5 Years | 0 (0.0%) | 0 (0.0%) |
| 5 to 17 Years | 0 (0.0%) | 0 (0.0%) |
| 18 to 34 Years | 0 (0.0%) | 0 (0.0%) |
| 35 to 64 Years | 0 (0.0%) | 0 (0.0%) |
| 65 to 74 Years | 0 (0.0%) | 0 (0.0%) |
| 75 Years and over | 0 (0.0%) | 0 (0.0%) |
Disability Class: Vision Difficulty
| Age Bracket | Male | Female |
| Under 5 Years | 0 (0.0%) | 0 (0.0%) |
| 5 to 17 Years | 0 (0.0%) | 0 (0.0%) |
| 18 to 34 Years | 0 (0.0%) | 0 (0.0%) |
| 35 to 64 Years | 0 (0.0%) | 0 (0.0%) |
| 65 to 74 Years | 0 (0.0%) | 0 (0.0%) |
| 75 Years and over | 0 (0.0%) | 0 (0.0%) |
Disability Class: Cognitive Difficulty
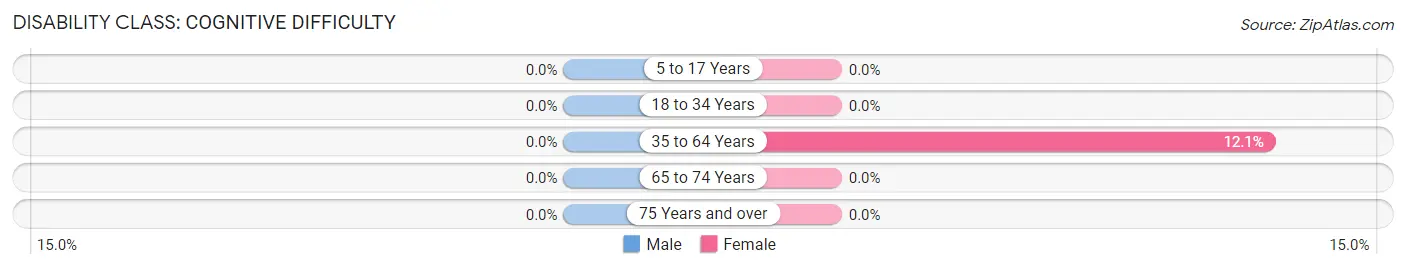
| Age Bracket | Male | Female |
| 5 to 17 Years | 0 (0.0%) | 0 (0.0%) |
| 18 to 34 Years | 0 (0.0%) | 0 (0.0%) |
| 35 to 64 Years | 0 (0.0%) | 18 (12.1%) |
| 65 to 74 Years | 0 (0.0%) | 0 (0.0%) |
| 75 Years and over | 0 (0.0%) | 0 (0.0%) |
Disability Class: Ambulatory Difficulty
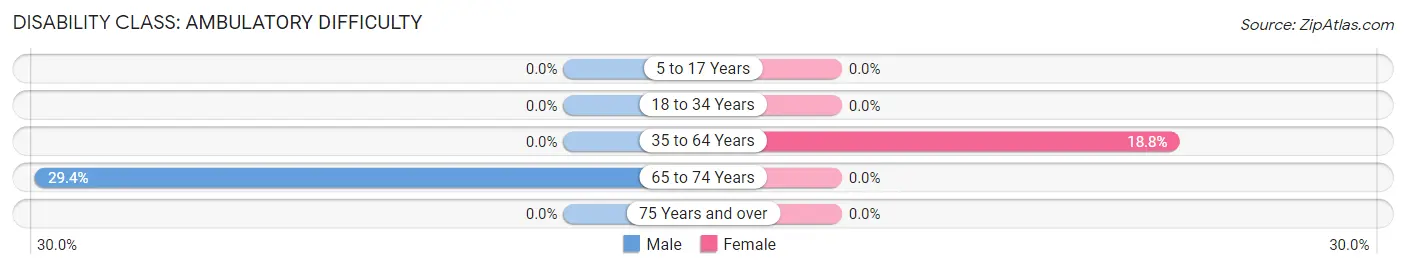
| Age Bracket | Male | Female |
| 5 to 17 Years | 0 (0.0%) | 0 (0.0%) |
| 18 to 34 Years | 0 (0.0%) | 0 (0.0%) |
| 35 to 64 Years | 0 (0.0%) | 28 (18.8%) |
| 65 to 74 Years | 15 (29.4%) | 0 (0.0%) |
| 75 Years and over | 0 (0.0%) | 0 (0.0%) |
Disability Class: Self-Care Difficulty
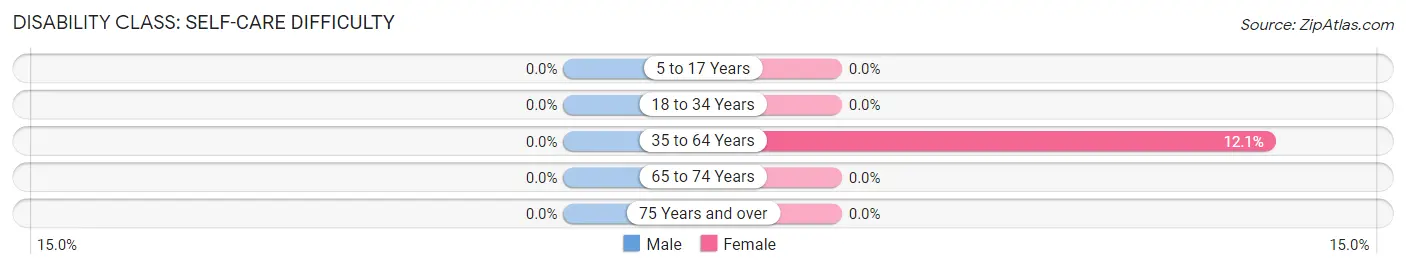
| Age Bracket | Male | Female |
| 5 to 17 Years | 0 (0.0%) | 0 (0.0%) |
| 18 to 34 Years | 0 (0.0%) | 0 (0.0%) |
| 35 to 64 Years | 0 (0.0%) | 18 (12.1%) |
| 65 to 74 Years | 0 (0.0%) | 0 (0.0%) |
| 75 Years and over | 0 (0.0%) | 0 (0.0%) |
Technology Access in Noblestown
Computing Device Access in Noblestown
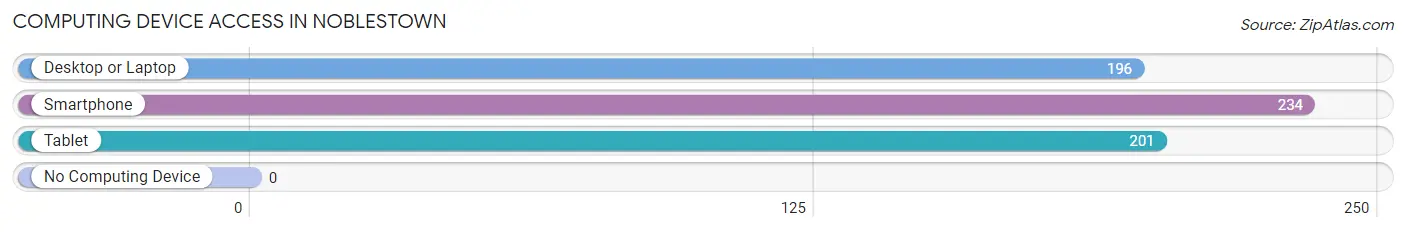
| Device Type | # Households | % Households |
| Desktop or Laptop | 196 | 76.9% |
| Smartphone | 234 | 91.8% |
| Tablet | 201 | 78.8% |
| No Computing Device | 0 | 0.0% |
| Total | 255 | 100.0% |
Internet Access in Noblestown
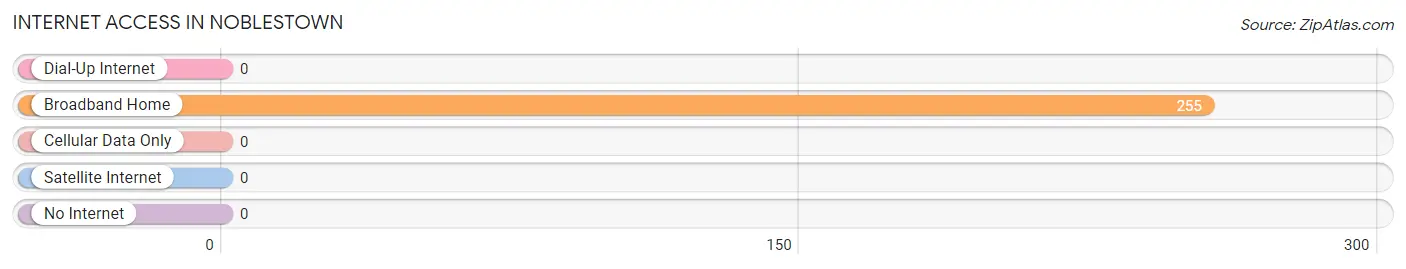
| Internet Type | # Households | % Households |
| Dial-Up Internet | 0 | 0.0% |
| Broadband Home | 255 | 100.0% |
| Cellular Data Only | 0 | 0.0% |
| Satellite Internet | 0 | 0.0% |
| No Internet | 0 | 0.0% |
| Total | 255 | 100.0% |
Noblestown Summary
Noblestown is a small borough located in Allegheny County, Pennsylvania. It is situated approximately 20 miles west of Pittsburgh and is part of the Greater Pittsburgh Metropolitan Area. The population of Noblestown was 1,845 as of the 2010 census.
History
Noblestown was founded in 1832 by John Noble, a local landowner. The town was originally known as Noble’s Town, but the name was changed to Noblestown in 1845. The town was incorporated in 1867.
Noblestown was a small farming community for much of its history. The town was home to several small businesses, including a general store, a blacksmith shop, and a grist mill. The town also had a post office, a school, and a church.
Geography
Noblestown is located in western Allegheny County, Pennsylvania. It is situated approximately 20 miles west of Pittsburgh. The borough is bordered by the boroughs of McDonald to the north, Midway to the east, and Oakdale to the south. The borough is also bordered by the townships of Robinson to the west and North Fayette to the northwest.
The borough has a total area of 0.8 square miles, all of which is land. The borough is located in the Allegheny Plateau region of Pennsylvania. The terrain is mostly flat, with some rolling hills. The borough is located in the watershed of the Ohio River.
Economy
Noblestown’s economy is largely based on agriculture and small businesses. The town is home to several small businesses, including a general store, a blacksmith shop, and a grist mill. The town also has a post office, a school, and a church.
The town is also home to several small manufacturing companies, including a metal fabrication shop and a plastics manufacturer. The town is also home to a number of small retail stores, including a hardware store, a grocery store, and a pharmacy.
Demographics
As of the 2010 census, the population of Noblestown was 1,845. The racial makeup of the borough was 97.3% White, 0.9% African American, 0.2% Native American, 0.2% Asian, 0.1% from other races, and 1.3% from two or more races. Hispanic or Latino of any race were 0.7% of the population.
The median household income in Noblestown was $45,938, and the median family income was $51,250. The per capita income for the borough was $20,945. About 8.3% of families and 10.2% of the population were below the poverty line, including 14.2% of those under age 18 and 5.2% of those age 65 or over.
Common Questions
What is Per Capita Income in Noblestown?
Per Capita income in Noblestown is $46,304.
What is the Median Family Income in Noblestown?
Median Family Income in Noblestown is $142,109.
What is the Median Household income in Noblestown?
Median Household Income in Noblestown is $88,618.
What is Inequality or Gini Index in Noblestown?
Inequality or Gini Index in Noblestown is 0.44.
What is the Total Population of Noblestown?
Total Population of Noblestown is 532.
What is the Total Male Population of Noblestown?
Total Male Population of Noblestown is 229.
What is the Total Female Population of Noblestown?
Total Female Population of Noblestown is 303.
What is the Ratio of Males per 100 Females in Noblestown?
There are 75.58 Males per 100 Females in Noblestown.
What is the Ratio of Females per 100 Males in Noblestown?
There are 132.31 Females per 100 Males in Noblestown.
What is the Median Population Age in Noblestown?
Median Population Age in Noblestown is 50.1 Years.
What is the Average Family Size in Noblestown
Average Family Size in Noblestown is 3.0 People.
What is the Average Household Size in Noblestown
Average Household Size in Noblestown is 2.1 People.
How Large is the Labor Force in Noblestown?
There are 252 People in the Labor Forcein in Noblestown.
What is the Percentage of People in the Labor Force in Noblestown?
60.4% of People are in the Labor Force in Noblestown.