Graceton, PA Map & Demographics
Graceton Map
Graceton Overview
$45,570
PER CAPITA INCOME
$128,285
AVG FAMILY INCOME
0.28
INEQUALITY / GINI INDEX
150
TOTAL POPULATION
83
MALE POPULATION
67
FEMALE POPULATION
123.88
MALES / 100 FEMALES
80.72
FEMALES / 100 MALES
64.5
MEDIAN AGE
2.1
AVG FAMILY SIZE
2.0
AVG HOUSEHOLD SIZE
73
LABOR FORCE [ PEOPLE ]
48.7%
PERCENT IN LABOR FORCE
Income in Graceton
Income Overview in Graceton
| Characteristic | Number | Measure |
| Per Capita Income | 150 | $45,570 |
| Median Family Income | 59 | $128,285 |
| Mean Family Income | 59 | $104,717 |
| Median Household Income | 73 | $0 |
| Mean Household Income | 73 | $89,458 |
| Income Deficit | 59 | $0 |
| Wage / Income Gap (%) | 150 | 0.00% |
| Wage / Income Gap ($) | 150 | 100.00¢ per $1 |
| Gini / Inequality Index | 150 | 0.28 |
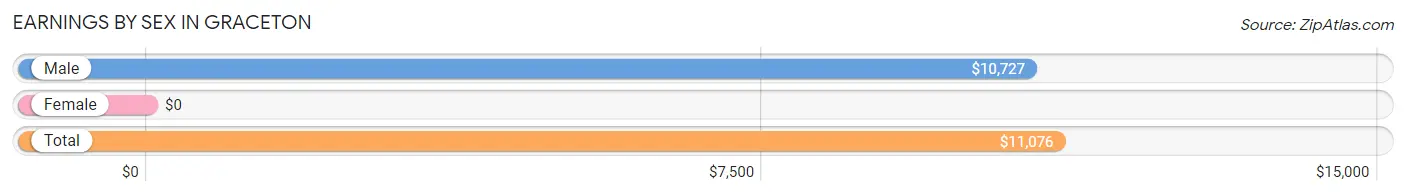
Earnings by Sex in Graceton
| Sex | Number | Average Earnings |
| Male | 61 (83.6%) | $10,727 |
| Female | 12 (16.4%) | $0 |
| Total | 73 (100.0%) | $11,076 |
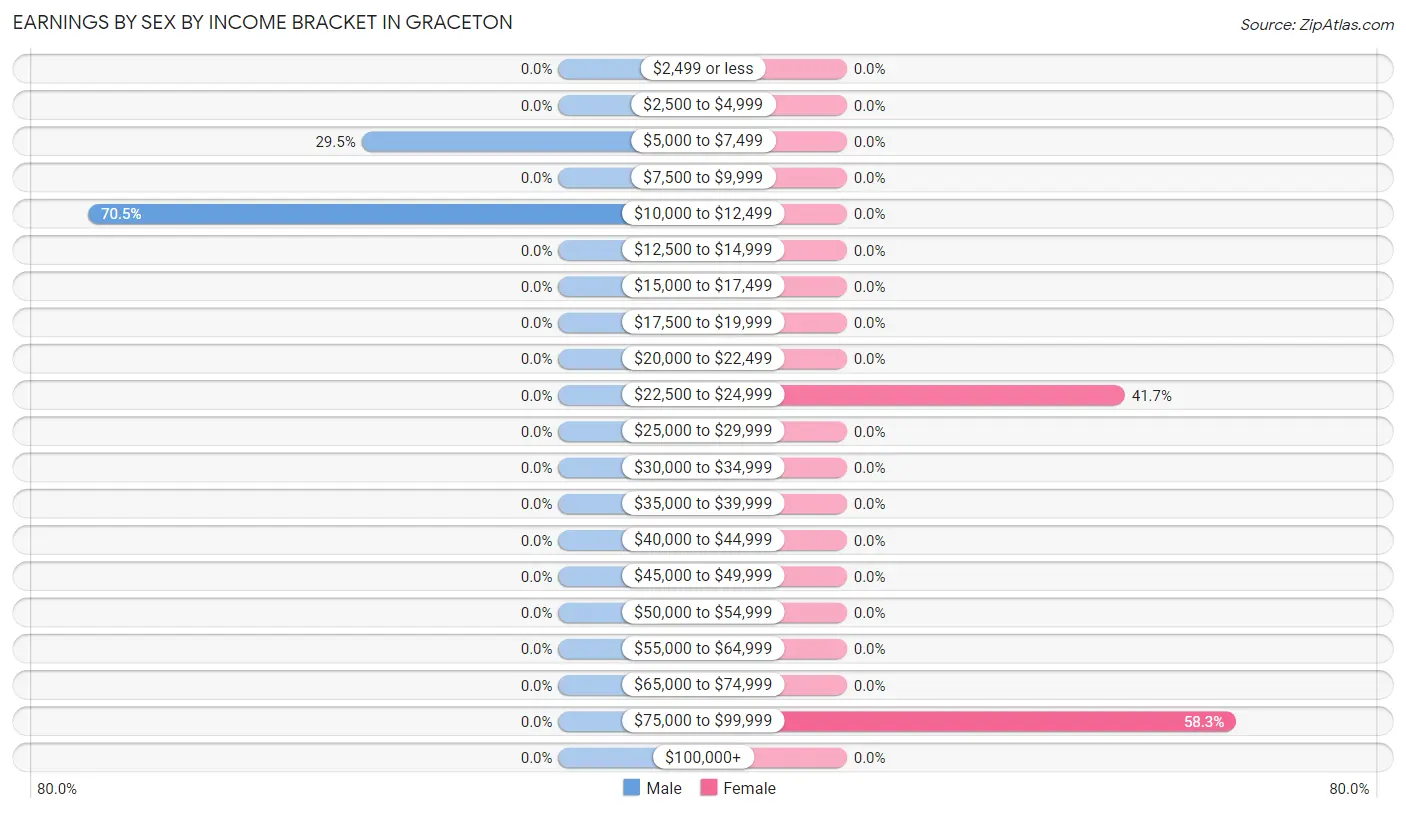
Earnings by Sex by Income Bracket in Graceton
The most common earnings brackets in Graceton are $10,000 to $12,499 for men (43 | 70.5%) and $75,000 to $99,999 for women (7 | 58.3%).
| Income | Male | Female |
| $2,499 or less | 0 (0.0%) | 0 (0.0%) |
| $2,500 to $4,999 | 0 (0.0%) | 0 (0.0%) |
| $5,000 to $7,499 | 18 (29.5%) | 0 (0.0%) |
| $7,500 to $9,999 | 0 (0.0%) | 0 (0.0%) |
| $10,000 to $12,499 | 43 (70.5%) | 0 (0.0%) |
| $12,500 to $14,999 | 0 (0.0%) | 0 (0.0%) |
| $15,000 to $17,499 | 0 (0.0%) | 0 (0.0%) |
| $17,500 to $19,999 | 0 (0.0%) | 0 (0.0%) |
| $20,000 to $22,499 | 0 (0.0%) | 0 (0.0%) |
| $22,500 to $24,999 | 0 (0.0%) | 5 (41.7%) |
| $25,000 to $29,999 | 0 (0.0%) | 0 (0.0%) |
| $30,000 to $34,999 | 0 (0.0%) | 0 (0.0%) |
| $35,000 to $39,999 | 0 (0.0%) | 0 (0.0%) |
| $40,000 to $44,999 | 0 (0.0%) | 0 (0.0%) |
| $45,000 to $49,999 | 0 (0.0%) | 0 (0.0%) |
| $50,000 to $54,999 | 0 (0.0%) | 0 (0.0%) |
| $55,000 to $64,999 | 0 (0.0%) | 0 (0.0%) |
| $65,000 to $74,999 | 0 (0.0%) | 0 (0.0%) |
| $75,000 to $99,999 | 0 (0.0%) | 7 (58.3%) |
| $100,000+ | 0 (0.0%) | 0 (0.0%) |
| Total | 61 (100.0%) | 12 (100.0%) |
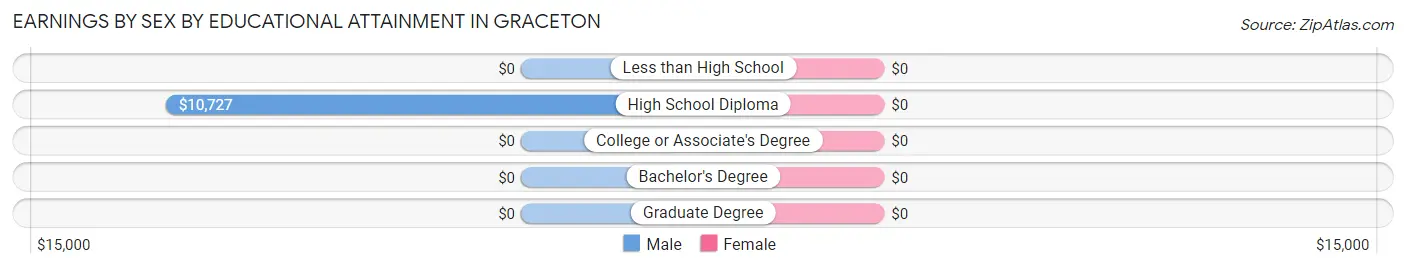
Earnings by Sex by Educational Attainment in Graceton
| Educational Attainment | Male Income | Female Income |
| Less than High School | - | - |
| High School Diploma | $10,727 | $0 |
| College or Associate's Degree | - | - |
| Bachelor's Degree | - | - |
| Graduate Degree | - | - |
| Total | $10,727 | $0 |
Family Income in Graceton
Family Income Brackets in Graceton
According to the Graceton family income data, there are 43 families falling into the $100,000 to $149,999 income range, which is the most common income bracket and makes up 72.9% of all families.
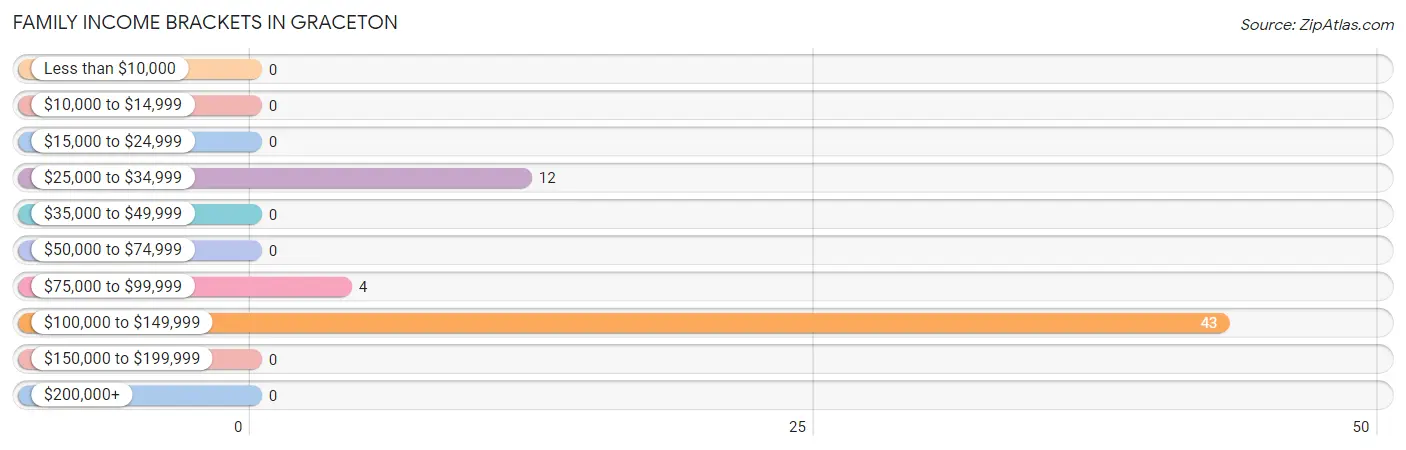
| Income Bracket | # Families | % Families |
| Less than $10,000 | 0 | 0.0% |
| $10,000 to $14,999 | 0 | 0.0% |
| $15,000 to $24,999 | 0 | 0.0% |
| $25,000 to $34,999 | 12 | 20.3% |
| $35,000 to $49,999 | 0 | 0.0% |
| $50,000 to $74,999 | 0 | 0.0% |
| $75,000 to $99,999 | 4 | 6.8% |
| $100,000 to $149,999 | 43 | 72.9% |
| $150,000 to $199,999 | 0 | 0.0% |
| $200,000+ | 0 | 0.0% |
Family Income by Famaliy Size in Graceton
2-person families (59 | 100.0%) account for the highest median family income in Graceton with $128,285 per family, while 2-person families (59 | 100.0%) have the highest median income of $64,142 per family member.
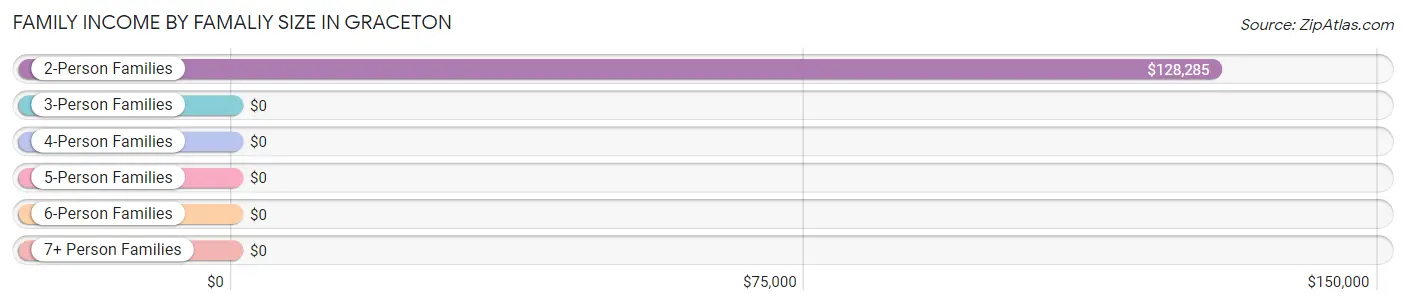
| Income Bracket | # Families | Median Income |
| 2-Person Families | 59 (100.0%) | $128,285 |
| 3-Person Families | 0 (0.0%) | $0 |
| 4-Person Families | 0 (0.0%) | $0 |
| 5-Person Families | 0 (0.0%) | $0 |
| 6-Person Families | 0 (0.0%) | $0 |
| 7+ Person Families | 0 (0.0%) | $0 |
| Total | 59 (100.0%) | $128,285 |
Family Income by Number of Earners in Graceton
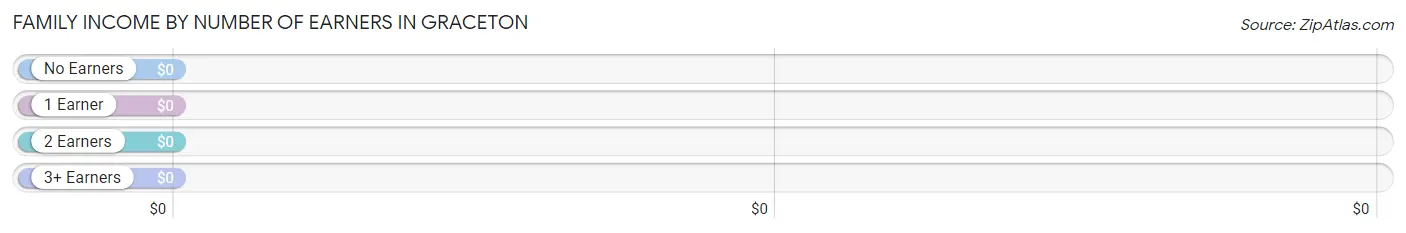
| Number of Earners | # Families | Median Income |
| No Earners | 12 (20.3%) | $0 |
| 1 Earner | 43 (72.9%) | $0 |
| 2 Earners | 4 (6.8%) | $0 |
| 3+ Earners | 0 (0.0%) | $0 |
| Total | 59 (100.0%) | $128,285 |
Household Income in Graceton
Household Income Brackets in Graceton
With 47 households falling in the category, the $100,000 to $149,999 income range is the most frequent in Graceton, accounting for 64.4% of all households.
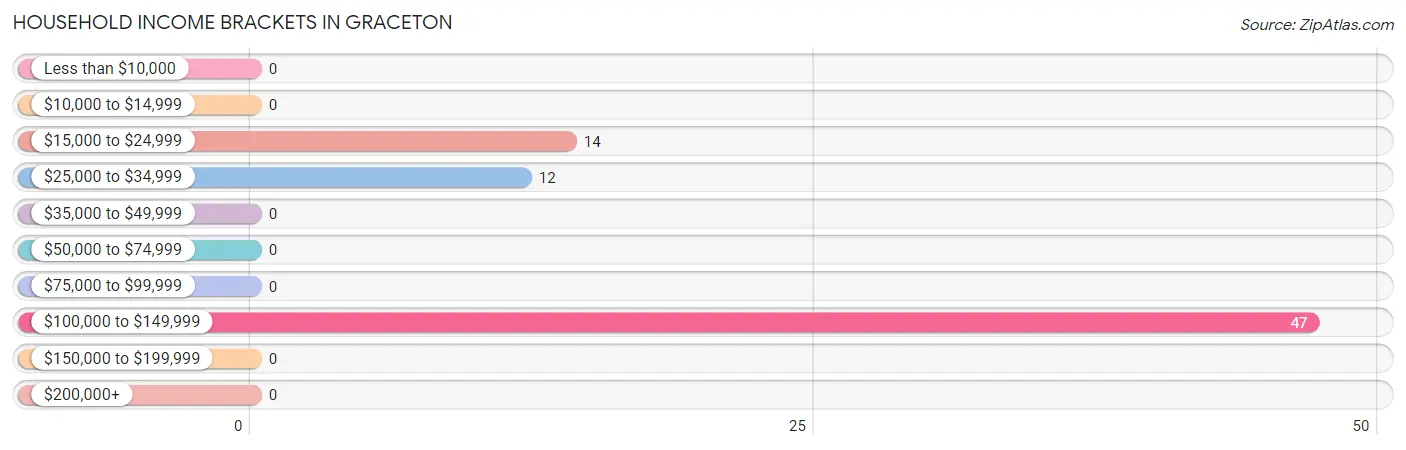
| Income Bracket | # Households | % Households |
| Less than $10,000 | 0 | 0.0% |
| $10,000 to $14,999 | 0 | 0.0% |
| $15,000 to $24,999 | 14 | 19.2% |
| $25,000 to $34,999 | 12 | 16.4% |
| $35,000 to $49,999 | 0 | 0.0% |
| $50,000 to $74,999 | 0 | 0.0% |
| $75,000 to $99,999 | 0 | 0.0% |
| $100,000 to $149,999 | 47 | 64.4% |
| $150,000 to $199,999 | 0 | 0.0% |
| $200,000+ | 0 | 0.0% |
Household Income by Householder Age in Graceton
| Income Bracket | # Households | Median Income |
| 15 to 24 Years | 0 (0.0%) | $0 |
| 25 to 44 Years | 0 (0.0%) | $0 |
| 45 to 64 Years | 18 (24.7%) | $0 |
| 65+ Years | 55 (75.3%) | $0 |
| Total | 73 (100.0%) | $0 |
Poverty in Graceton
Income Below Poverty by Sex and Age in Graceton
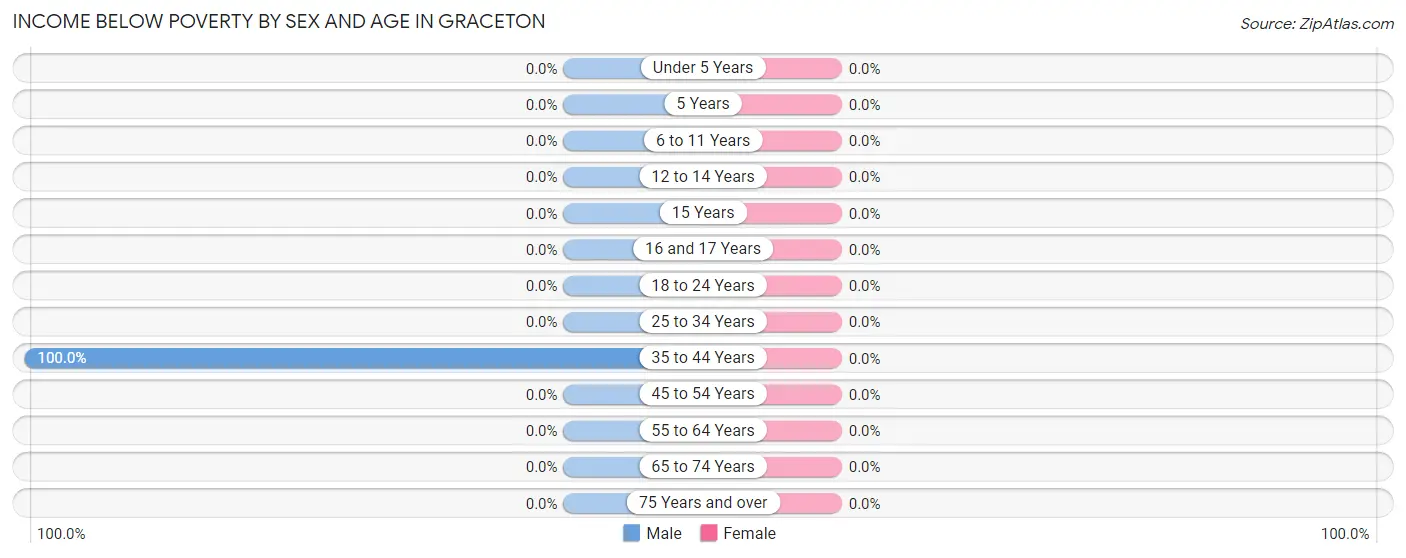
| Age Bracket | Male | Female |
| Under 5 Years | 0 (0.0%) | 0 (0.0%) |
| 5 Years | 0 (0.0%) | 0 (0.0%) |
| 6 to 11 Years | 0 (0.0%) | 0 (0.0%) |
| 12 to 14 Years | 0 (0.0%) | 0 (0.0%) |
| 15 Years | 0 (0.0%) | 0 (0.0%) |
| 16 and 17 Years | 0 (0.0%) | 0 (0.0%) |
| 18 to 24 Years | 0 (0.0%) | 0 (0.0%) |
| 25 to 34 Years | 0 (0.0%) | 0 (0.0%) |
| 35 to 44 Years | 6 (100.0%) | 0 (0.0%) |
| 45 to 54 Years | 0 (0.0%) | 0 (0.0%) |
| 55 to 64 Years | 0 (0.0%) | 0 (0.0%) |
| 65 to 74 Years | 0 (0.0%) | 0 (0.0%) |
| 75 Years and over | 0 (0.0%) | 0 (0.0%) |
| Total | 6 (7.2%) | 0 (0.0%) |
Income Above Poverty by Sex and Age in Graceton
According to the poverty statistics in Graceton, males aged 25 to 34 years and females aged 18 to 24 years are the age groups that are most secure financially, with 100.0% of males and 100.0% of females in these age groups living above the poverty line.
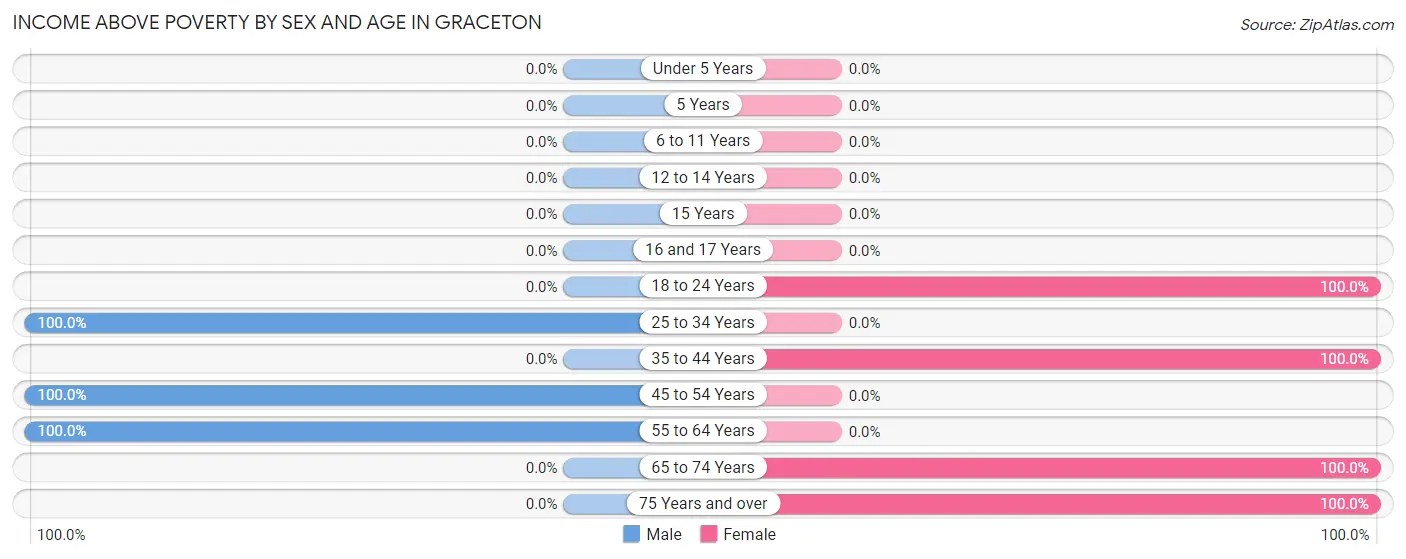
| Age Bracket | Male | Female |
| Under 5 Years | 0 (0.0%) | 0 (0.0%) |
| 5 Years | 0 (0.0%) | 0 (0.0%) |
| 6 to 11 Years | 0 (0.0%) | 0 (0.0%) |
| 12 to 14 Years | 0 (0.0%) | 0 (0.0%) |
| 15 Years | 0 (0.0%) | 0 (0.0%) |
| 16 and 17 Years | 0 (0.0%) | 0 (0.0%) |
| 18 to 24 Years | 0 (0.0%) | 7 (100.0%) |
| 25 to 34 Years | 16 (100.0%) | 0 (0.0%) |
| 35 to 44 Years | 0 (0.0%) | 5 (100.0%) |
| 45 to 54 Years | 4 (100.0%) | 0 (0.0%) |
| 55 to 64 Years | 57 (100.0%) | 0 (0.0%) |
| 65 to 74 Years | 0 (0.0%) | 43 (100.0%) |
| 75 Years and over | 0 (0.0%) | 12 (100.0%) |
| Total | 77 (92.8%) | 67 (100.0%) |
Income Below Poverty Among Married-Couple Families in Graceton
| Children | Above Poverty | Below Poverty |
| No Children | 43 (100.0%) | 0 (0.0%) |
| 1 or 2 Children | 0 (0.0%) | 0 (0.0%) |
| 3 or 4 Children | 0 (0.0%) | 0 (0.0%) |
| 5 or more Children | 0 (0.0%) | 0 (0.0%) |
| Total | 43 (100.0%) | 0 (0.0%) |
Income Below Poverty Among Single-Parent Households in Graceton

| Children | Single Father | Single Mother |
| No Children | 0 (0.0%) | 0 (0.0%) |
| 1 or 2 Children | 0 (0.0%) | 0 (0.0%) |
| 3 or 4 Children | 0 (0.0%) | 0 (0.0%) |
| 5 or more Children | 0 (0.0%) | 0 (0.0%) |
| Total | 0 (0.0%) | 0 (0.0%) |
Income Below Poverty Among Married-Couple vs Single-Parent Households in Graceton
| Children | Married-Couple Families | Single-Parent Households |
| No Children | 0 (0.0%) | 0 (0.0%) |
| 1 or 2 Children | 0 (0.0%) | 0 (0.0%) |
| 3 or 4 Children | 0 (0.0%) | 0 (0.0%) |
| 5 or more Children | 0 (0.0%) | 0 (0.0%) |
| Total | 0 (0.0%) | 0 (0.0%) |
Race in Graceton
The most populous races in Graceton are , and White / Caucasian (150 | 100.0%).
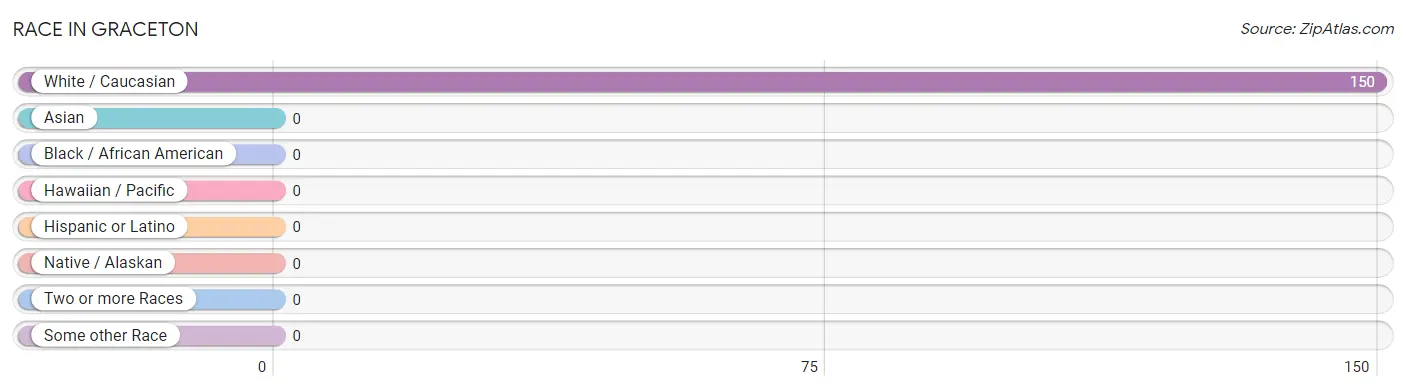
| Race | # Population | % Population |
| Asian | 0 | 0.0% |
| Black / African American | 0 | 0.0% |
| Hawaiian / Pacific | 0 | 0.0% |
| Hispanic or Latino | 0 | 0.0% |
| Native / Alaskan | 0 | 0.0% |
| White / Caucasian | 150 | 100.0% |
| Two or more Races | 0 | 0.0% |
| Some other Race | 0 | 0.0% |
| Total | 150 | 100.0% |
Ancestry in Graceton
The most populous ancestries reported in Graceton are Italian (47 | 31.3%), Slovak (43 | 28.7%), German (30 | 20.0%), Irish (16 | 10.7%), and Hungarian (14 | 9.3%), together accounting for 100.0% of all Graceton residents.
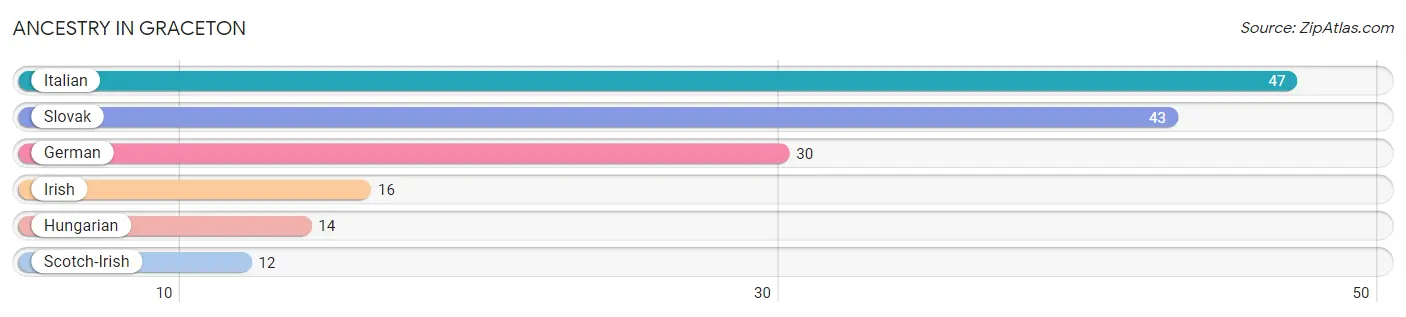
| Ancestry | # Population | % Population |
| German | 30 | 20.0% |
| Hungarian | 14 | 9.3% |
| Irish | 16 | 10.7% |
| Italian | 47 | 31.3% |
| Scotch-Irish | 12 | 8.0% |
| Slovak | 43 | 28.7% | View All 6 Rows |
Immigrants in Graceton

| Immigration Origin | # Population | % Population | View All 0 Rows |
Sex and Age in Graceton
Sex and Age in Graceton
The most populous age groups in Graceton are 60 to 64 Years (57 | 68.7%) for men and 65 to 69 Years (43 | 64.2%) for women.
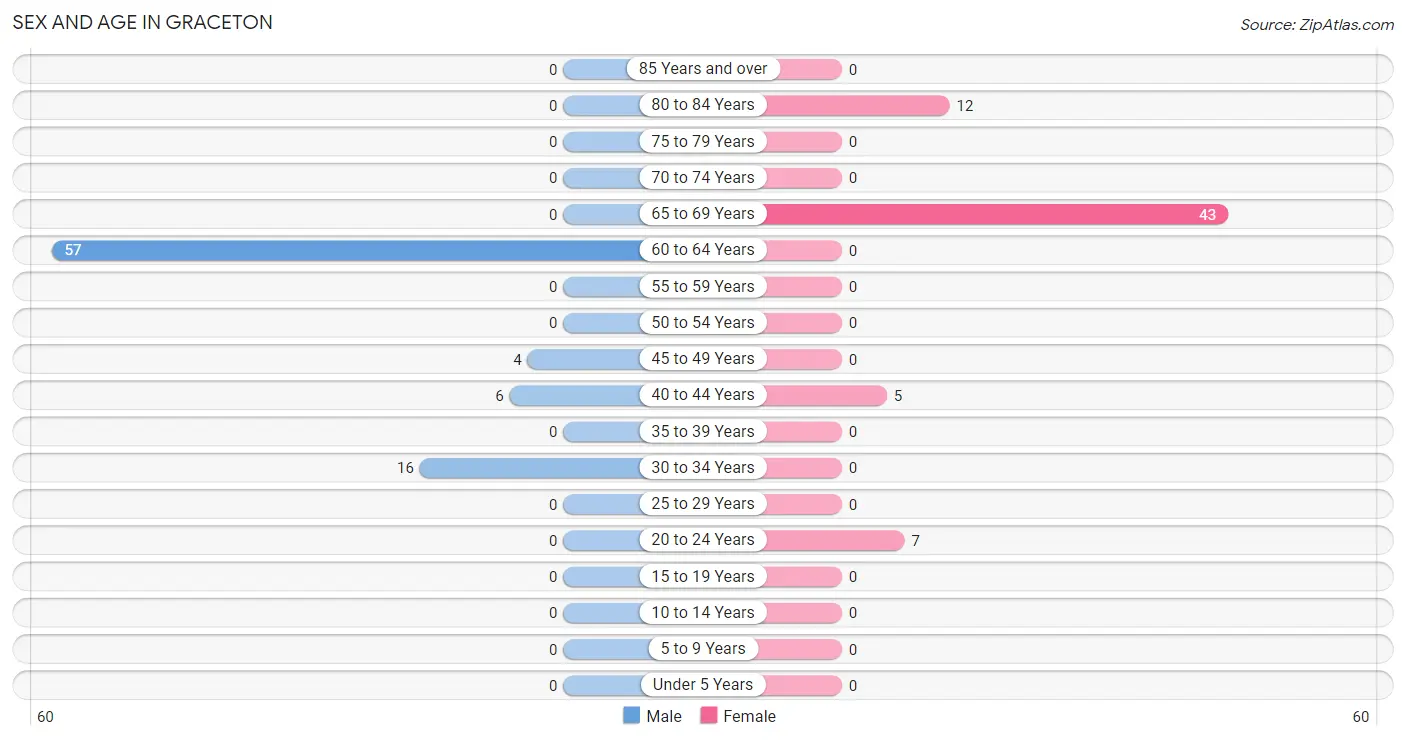
| Age Bracket | Male | Female |
| Under 5 Years | 0 (0.0%) | 0 (0.0%) |
| 5 to 9 Years | 0 (0.0%) | 0 (0.0%) |
| 10 to 14 Years | 0 (0.0%) | 0 (0.0%) |
| 15 to 19 Years | 0 (0.0%) | 0 (0.0%) |
| 20 to 24 Years | 0 (0.0%) | 7 (10.4%) |
| 25 to 29 Years | 0 (0.0%) | 0 (0.0%) |
| 30 to 34 Years | 16 (19.3%) | 0 (0.0%) |
| 35 to 39 Years | 0 (0.0%) | 0 (0.0%) |
| 40 to 44 Years | 6 (7.2%) | 5 (7.5%) |
| 45 to 49 Years | 4 (4.8%) | 0 (0.0%) |
| 50 to 54 Years | 0 (0.0%) | 0 (0.0%) |
| 55 to 59 Years | 0 (0.0%) | 0 (0.0%) |
| 60 to 64 Years | 57 (68.7%) | 0 (0.0%) |
| 65 to 69 Years | 0 (0.0%) | 43 (64.2%) |
| 70 to 74 Years | 0 (0.0%) | 0 (0.0%) |
| 75 to 79 Years | 0 (0.0%) | 0 (0.0%) |
| 80 to 84 Years | 0 (0.0%) | 12 (17.9%) |
| 85 Years and over | 0 (0.0%) | 0 (0.0%) |
| Total | 83 (100.0%) | 67 (100.0%) |
Families and Households in Graceton
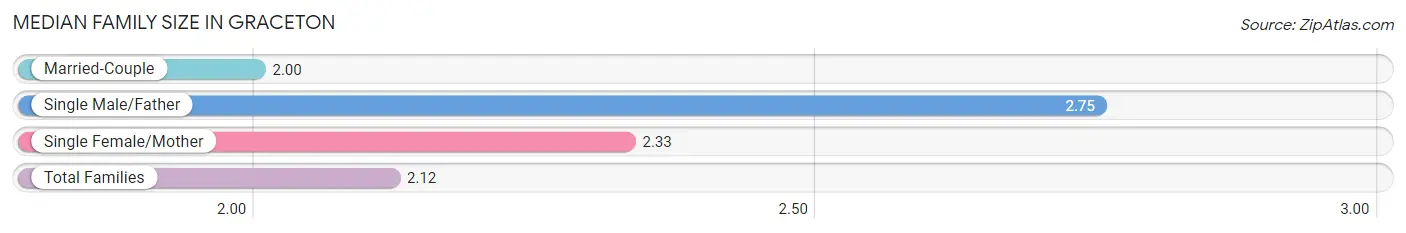
Median Family Size in Graceton
The median family size in Graceton is 2.12 persons per family, with single male/father families (4 | 6.8%) accounting for the largest median family size of 2.75 persons per family. On the other hand, married-couple families (43 | 72.9%) represent the smallest median family size with 2.00 persons per family.
| Family Type | # Families | Family Size |
| Married-Couple | 43 (72.9%) | 2.00 |
| Single Male/Father | 4 (6.8%) | 2.75 |
| Single Female/Mother | 12 (20.3%) | 2.33 |
| Total Families | 59 (100.0%) | 2.12 |
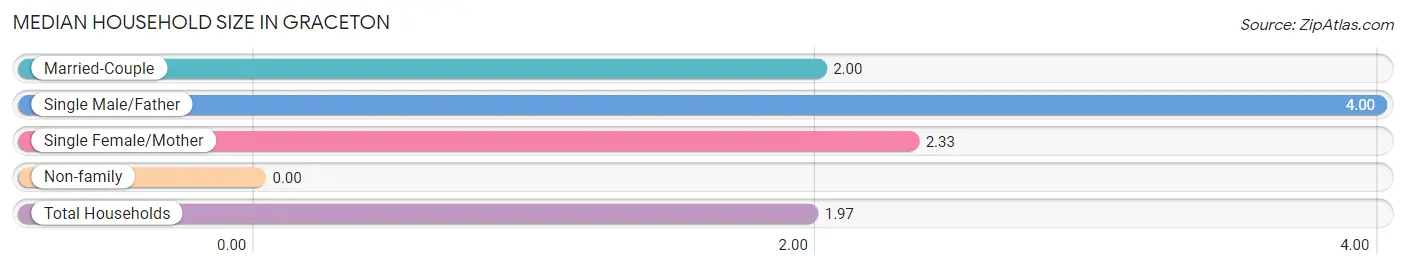
Median Household Size in Graceton
| Household Type | # Households | Household Size |
| Married-Couple | 43 (58.9%) | 2.00 |
| Single Male/Father | 4 (5.5%) | 4.00 |
| Single Female/Mother | 12 (16.4%) | 2.33 |
| Non-family | 14 (19.2%) | - |
| Total Households | 73 (100.0%) | 1.97 |
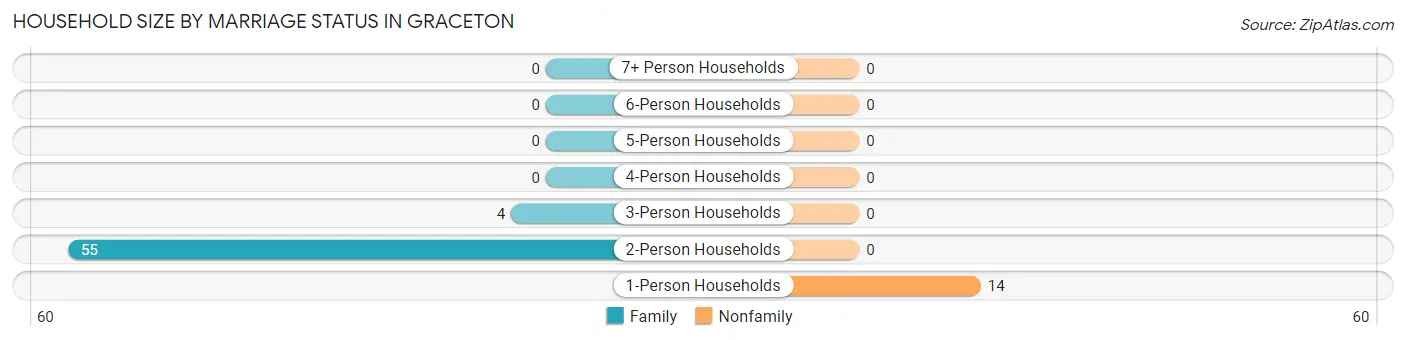
Household Size by Marriage Status in Graceton
Out of a total of 73 households in Graceton, 59 (80.8%) are family households, while 14 (19.2%) are nonfamily households. The most numerous type of family households are 2-person households, comprising 55, and the most common type of nonfamily households are 1-person households, comprising 14.
| Household Size | Family Households | Nonfamily Households |
| 1-Person Households | - | 14 (19.2%) |
| 2-Person Households | 55 (75.3%) | 0 (0.0%) |
| 3-Person Households | 4 (5.5%) | 0 (0.0%) |
| 4-Person Households | 0 (0.0%) | 0 (0.0%) |
| 5-Person Households | 0 (0.0%) | 0 (0.0%) |
| 6-Person Households | 0 (0.0%) | 0 (0.0%) |
| 7+ Person Households | 0 (0.0%) | 0 (0.0%) |
| Total | 59 (80.8%) | 14 (19.2%) |
Female Fertility in Graceton
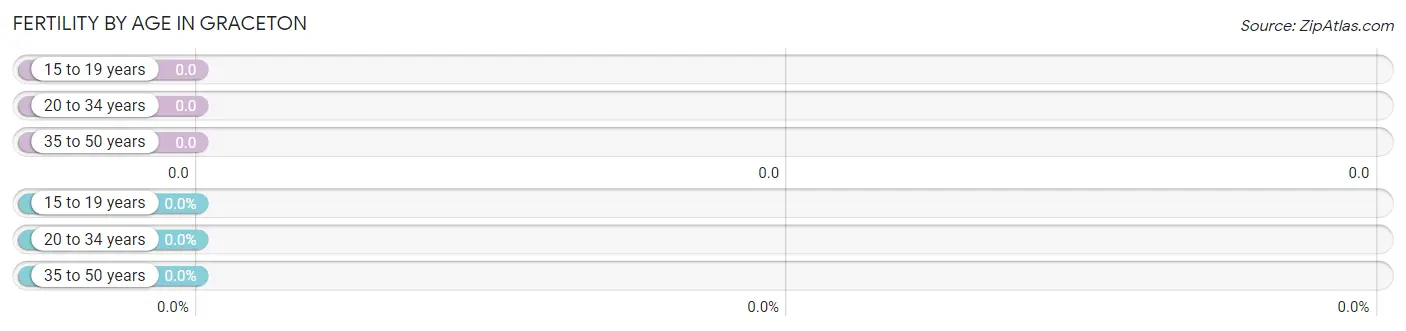
Fertility by Age in Graceton
| Age Bracket | Women with Births | Births / 1,000 Women |
| 15 to 19 years | 0 (0.0%) | 0.0 |
| 20 to 34 years | 0 (0.0%) | 0.0 |
| 35 to 50 years | 0 (0.0%) | 0.0 |
| Total | 0 (0.0%) | 0.0 |
Fertility by Age by Marriage Status in Graceton
| Age Bracket | Married | Unmarried |
| 15 to 19 years | 0 (0.0%) | 0 (0.0%) |
| 20 to 34 years | 0 (0.0%) | 0 (0.0%) |
| 35 to 50 years | 0 (0.0%) | 0 (0.0%) |
| Total | 0 (0.0%) | 0 (0.0%) |
Fertility by Education in Graceton
| Educational Attainment | Women with Births | Births / 1,000 Women |
| Less than High School | 0 (0.0%) | 0.0 |
| High School Diploma | 0 (0.0%) | 0.0 |
| College or Associate's Degree | 0 (0.0%) | 0.0 |
| Bachelor's Degree | 0 (0.0%) | 0.0 |
| Graduate Degree | 0 (0.0%) | 0.0 |
| Total | 0 (0.0%) | 0.0 |
Fertility by Education by Marriage Status in Graceton
| Educational Attainment | Married | Unmarried |
| Less than High School | 0 (0.0%) | 0 (0.0%) |
| High School Diploma | 0 (0.0%) | 0 (0.0%) |
| College or Associate's Degree | 0 (0.0%) | 0 (0.0%) |
| Bachelor's Degree | 0 (0.0%) | 0 (0.0%) |
| Graduate Degree | 0 (0.0%) | 0 (0.0%) |
| Total | 0 (0.0%) | 0 (0.0%) |
Employment Characteristics in Graceton
Employment by Class of Employer in Graceton
Among the 73 employed individuals in Graceton, self-employed (not incorporated) (47 | 64.4%), not-for-profit organizations (14 | 19.2%), and private company employees (12 | 16.4%) make up the most common classes of employment.
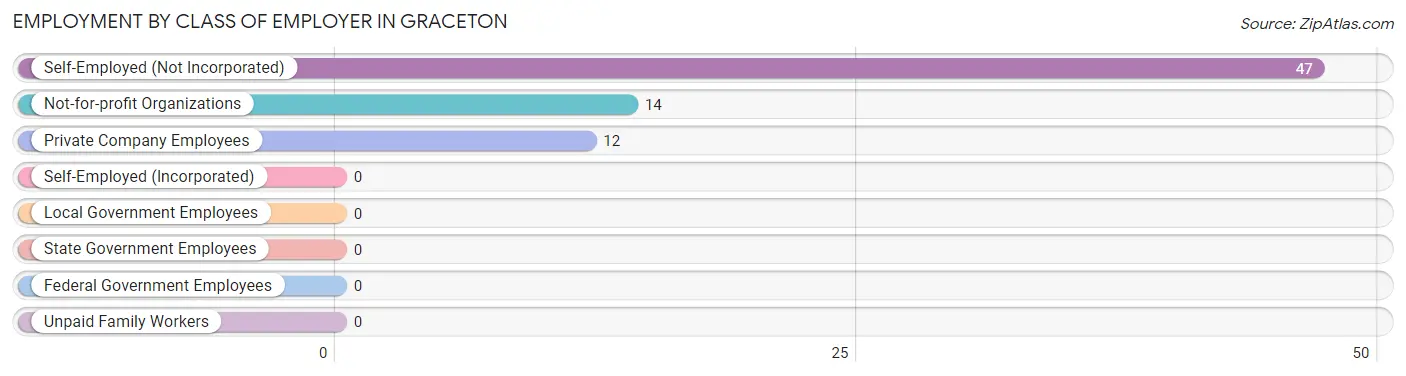
| Employer Class | # Employees | % Employees |
| Private Company Employees | 12 | 16.4% |
| Self-Employed (Incorporated) | 0 | 0.0% |
| Self-Employed (Not Incorporated) | 47 | 64.4% |
| Not-for-profit Organizations | 14 | 19.2% |
| Local Government Employees | 0 | 0.0% |
| State Government Employees | 0 | 0.0% |
| Federal Government Employees | 0 | 0.0% |
| Unpaid Family Workers | 0 | 0.0% |
| Total | 73 | 100.0% |
Employment Status by Age in Graceton
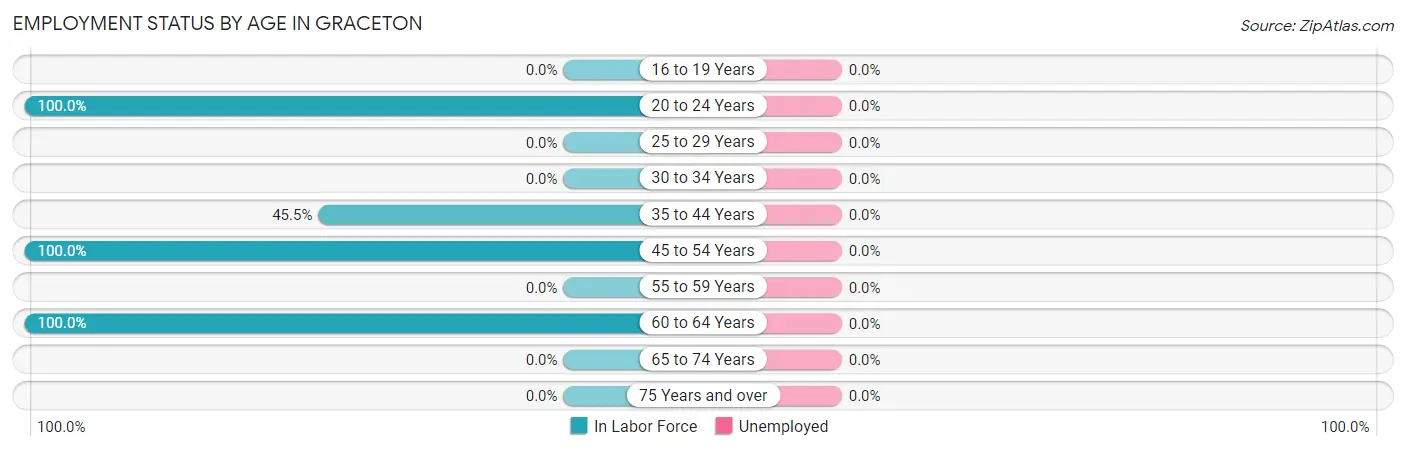
| Age Bracket | In Labor Force | Unemployed |
| 16 to 19 Years | 0 (0.0%) | 0 (0.0%) |
| 20 to 24 Years | 7 (100.0%) | 0 (0.0%) |
| 25 to 29 Years | 0 (0.0%) | 0 (0.0%) |
| 30 to 34 Years | 0 (0.0%) | 0 (0.0%) |
| 35 to 44 Years | 5 (45.5%) | 0 (0.0%) |
| 45 to 54 Years | 4 (100.0%) | 0 (0.0%) |
| 55 to 59 Years | 0 (0.0%) | 0 (0.0%) |
| 60 to 64 Years | 57 (100.0%) | 0 (0.0%) |
| 65 to 74 Years | 0 (0.0%) | 0 (0.0%) |
| 75 Years and over | 0 (0.0%) | 0 (0.0%) |
| Total | 73 (48.7%) | 0 (0.0%) |
Employment Status by Educational Attainment in Graceton
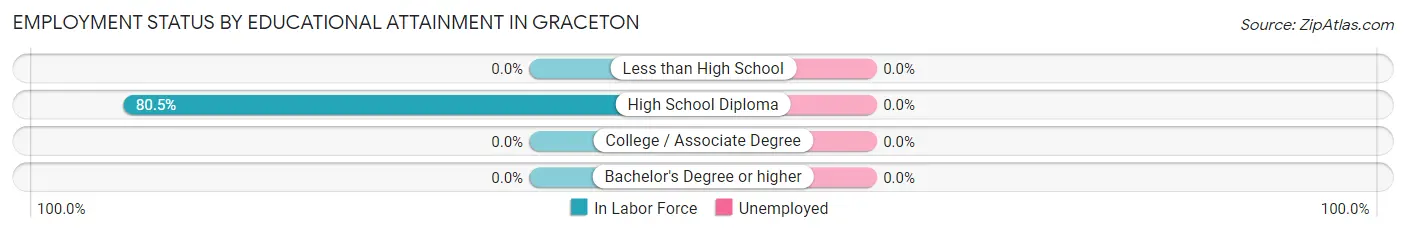
| Educational Attainment | In Labor Force | Unemployed |
| Less than High School | 0 (0.0%) | 0 (0.0%) |
| High School Diploma | 66 (80.5%) | 0 (0.0%) |
| College / Associate Degree | 0 (0.0%) | 0 (0.0%) |
| Bachelor's Degree or higher | 0 (0.0%) | 0 (0.0%) |
| Total | 66 (75.0%) | 0 (0.0%) |
Employment Occupations by Sex in Graceton
Management, Business, Science and Arts Occupations
The most common Management, Business, Science and Arts occupations in Graceton are Health Diagnosing & Treating (7 | 9.6%), and Health Technologists (7 | 9.6%).
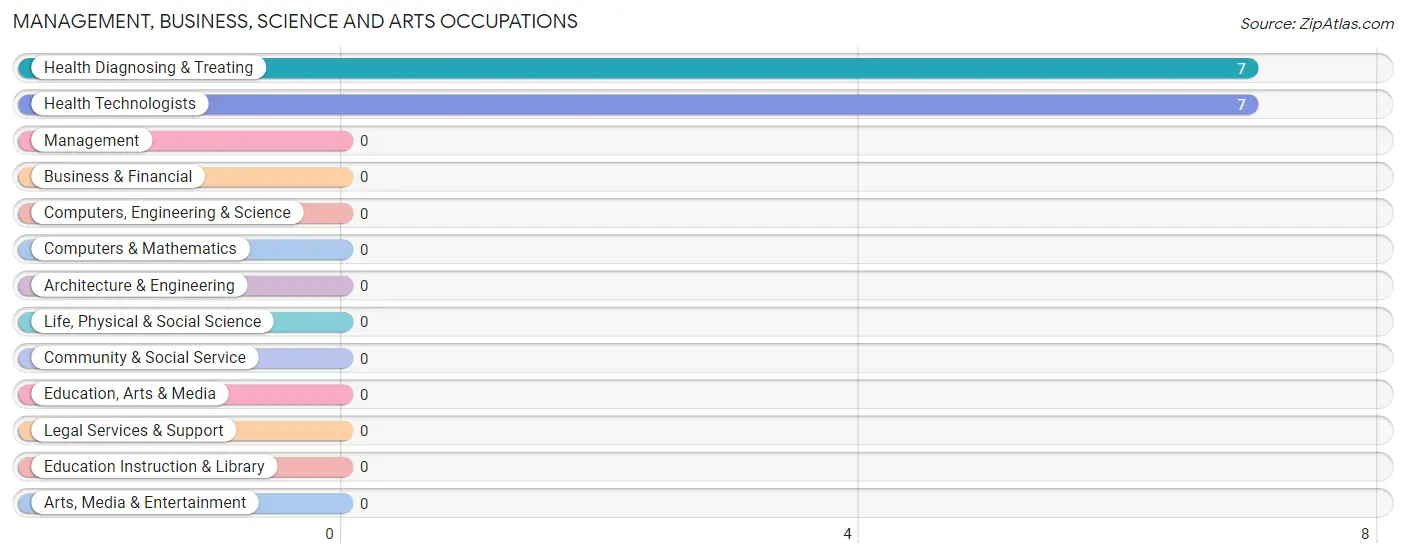
Management, Business, Science and Arts Occupations by Sex
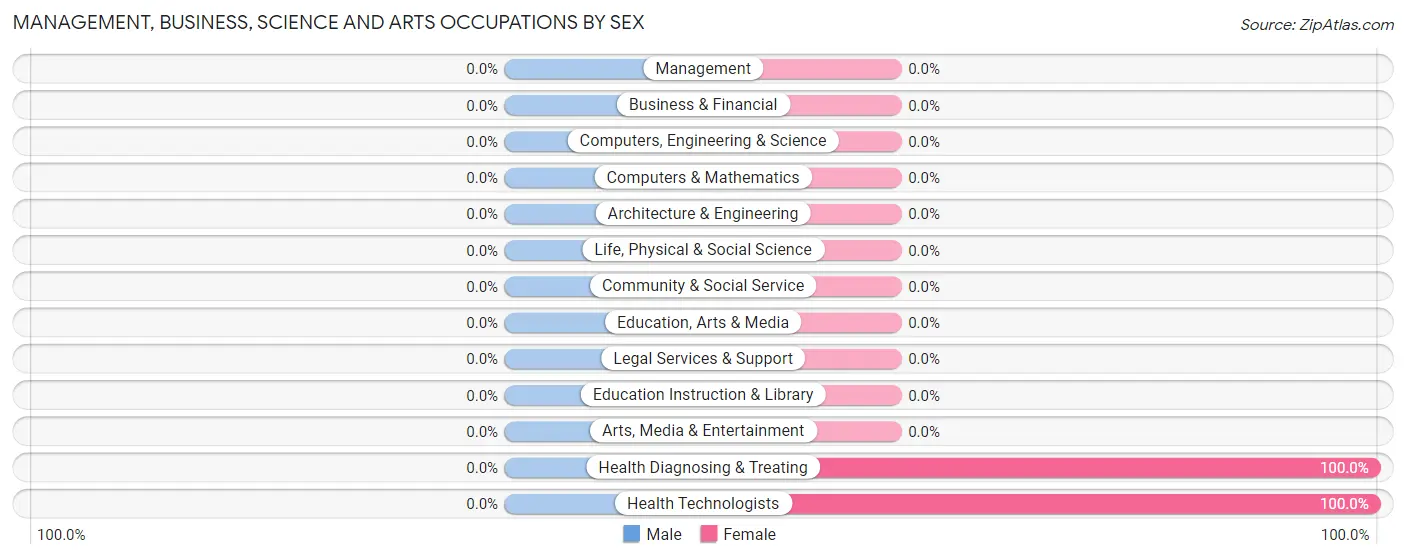
| Occupation | Male | Female |
| Management | 0 (0.0%) | 0 (0.0%) |
| Business & Financial | 0 (0.0%) | 0 (0.0%) |
| Computers, Engineering & Science | 0 (0.0%) | 0 (0.0%) |
| Computers & Mathematics | 0 (0.0%) | 0 (0.0%) |
| Architecture & Engineering | 0 (0.0%) | 0 (0.0%) |
| Life, Physical & Social Science | 0 (0.0%) | 0 (0.0%) |
| Community & Social Service | 0 (0.0%) | 0 (0.0%) |
| Education, Arts & Media | 0 (0.0%) | 0 (0.0%) |
| Legal Services & Support | 0 (0.0%) | 0 (0.0%) |
| Education Instruction & Library | 0 (0.0%) | 0 (0.0%) |
| Arts, Media & Entertainment | 0 (0.0%) | 0 (0.0%) |
| Health Diagnosing & Treating | 0 (0.0%) | 7 (100.0%) |
| Health Technologists | 0 (0.0%) | 7 (100.0%) |
| Total (Category) | 0 (0.0%) | 7 (100.0%) |
| Total (Overall) | 61 (83.6%) | 12 (16.4%) |
Services Occupations
The most common Services occupations in Graceton are Cleaning & Maintenance (14 | 19.2%), and Healthcare Support (5 | 6.9%).
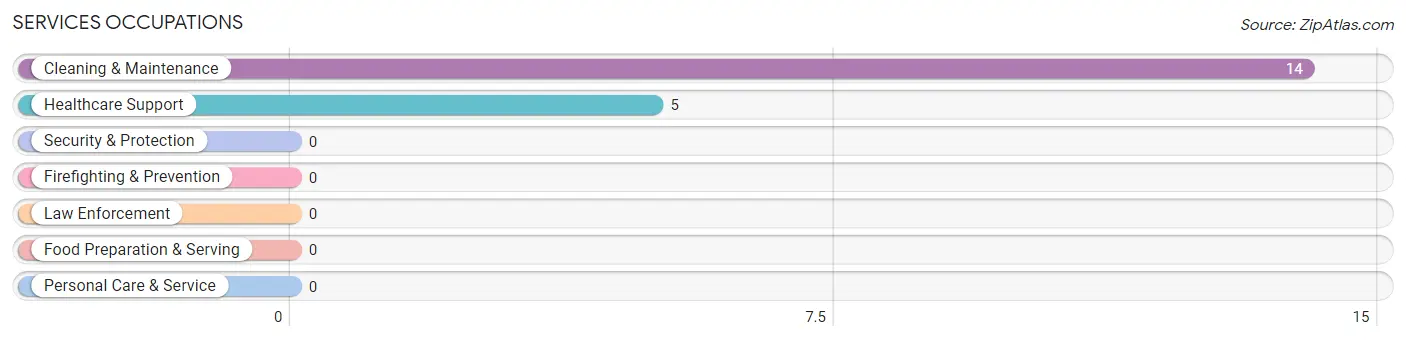
Services Occupations by Sex
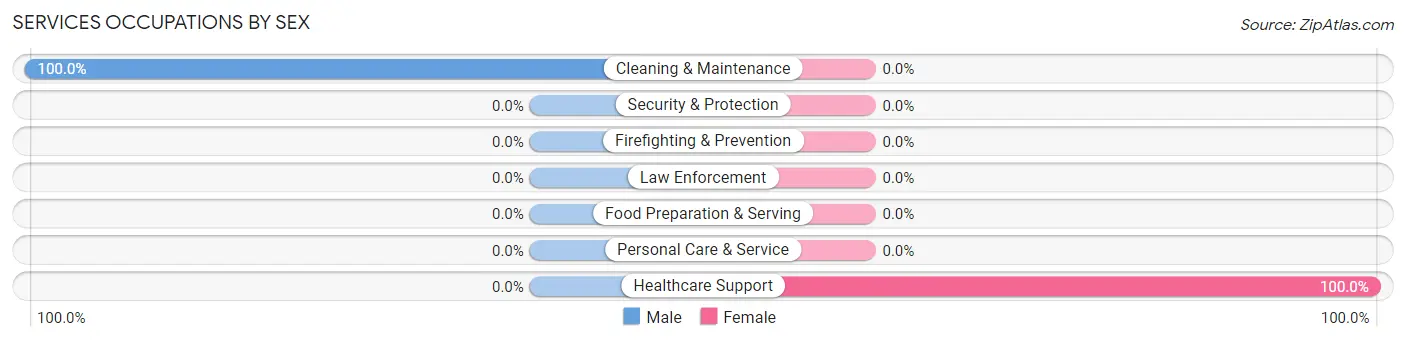
| Occupation | Male | Female |
| Healthcare Support | 0 (0.0%) | 5 (100.0%) |
| Security & Protection | 0 (0.0%) | 0 (0.0%) |
| Firefighting & Prevention | 0 (0.0%) | 0 (0.0%) |
| Law Enforcement | 0 (0.0%) | 0 (0.0%) |
| Food Preparation & Serving | 0 (0.0%) | 0 (0.0%) |
| Cleaning & Maintenance | 14 (100.0%) | 0 (0.0%) |
| Personal Care & Service | 0 (0.0%) | 0 (0.0%) |
| Total (Category) | 14 (73.7%) | 5 (26.3%) |
| Total (Overall) | 61 (83.6%) | 12 (16.4%) |
Sales and Office Occupations
Sales and Office Occupations by Sex
| Occupation | Male | Female |
| Sales & Related | 0 (0.0%) | 0 (0.0%) |
| Office & Administration | 0 (0.0%) | 0 (0.0%) |
| Total (Category) | 0 (0.0%) | 0 (0.0%) |
| Total (Overall) | 61 (83.6%) | 12 (16.4%) |
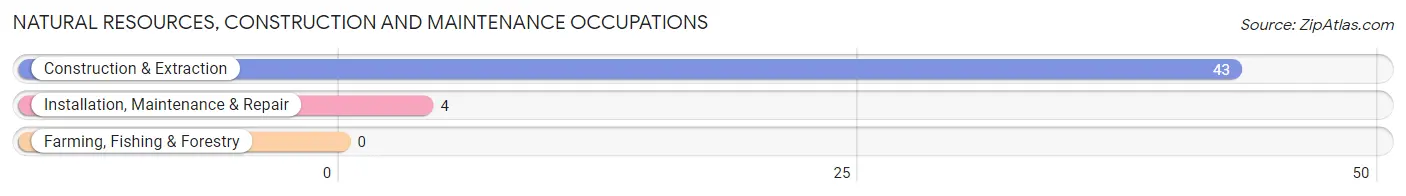
Natural Resources, Construction and Maintenance Occupations
The most common Natural Resources, Construction and Maintenance occupations in Graceton are Construction & Extraction (43 | 58.9%), and Installation, Maintenance & Repair (4 | 5.5%).
Natural Resources, Construction and Maintenance Occupations by Sex
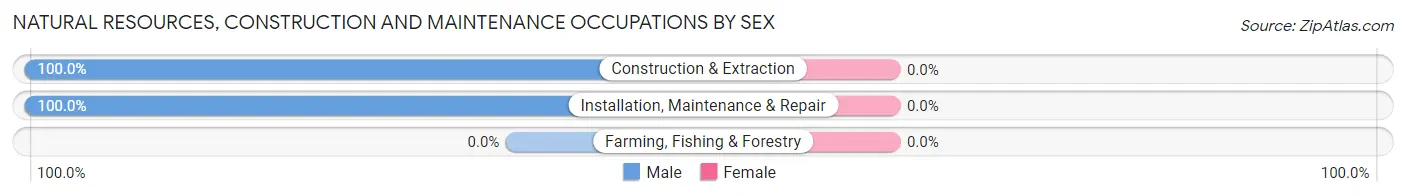
| Occupation | Male | Female |
| Farming, Fishing & Forestry | 0 (0.0%) | 0 (0.0%) |
| Construction & Extraction | 43 (100.0%) | 0 (0.0%) |
| Installation, Maintenance & Repair | 4 (100.0%) | 0 (0.0%) |
| Total (Category) | 47 (100.0%) | 0 (0.0%) |
| Total (Overall) | 61 (83.6%) | 12 (16.4%) |
Production, Transportation and Moving Occupations
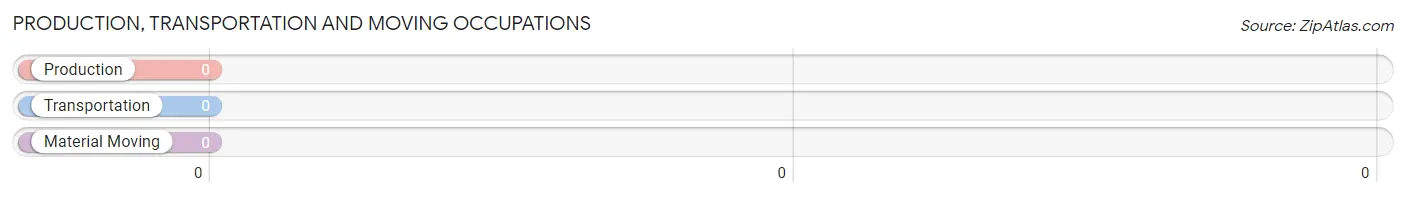
Production, Transportation and Moving Occupations by Sex
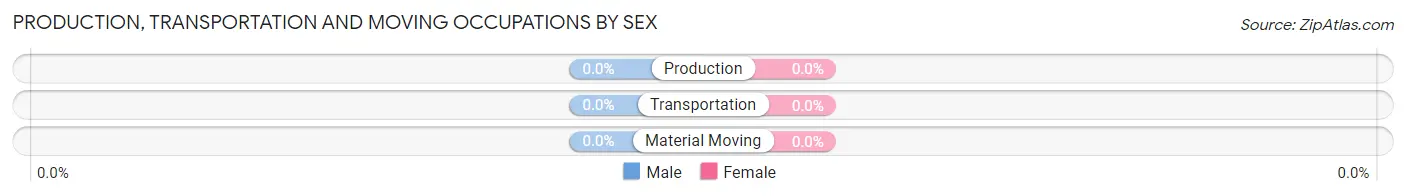
| Occupation | Male | Female |
| Production | 0 (0.0%) | 0 (0.0%) |
| Transportation | 0 (0.0%) | 0 (0.0%) |
| Material Moving | 0 (0.0%) | 0 (0.0%) |
| Total (Category) | 0 (0.0%) | 0 (0.0%) |
| Total (Overall) | 61 (83.6%) | 12 (16.4%) |
Employment Industries by Sex in Graceton
Employment Industries in Graceton
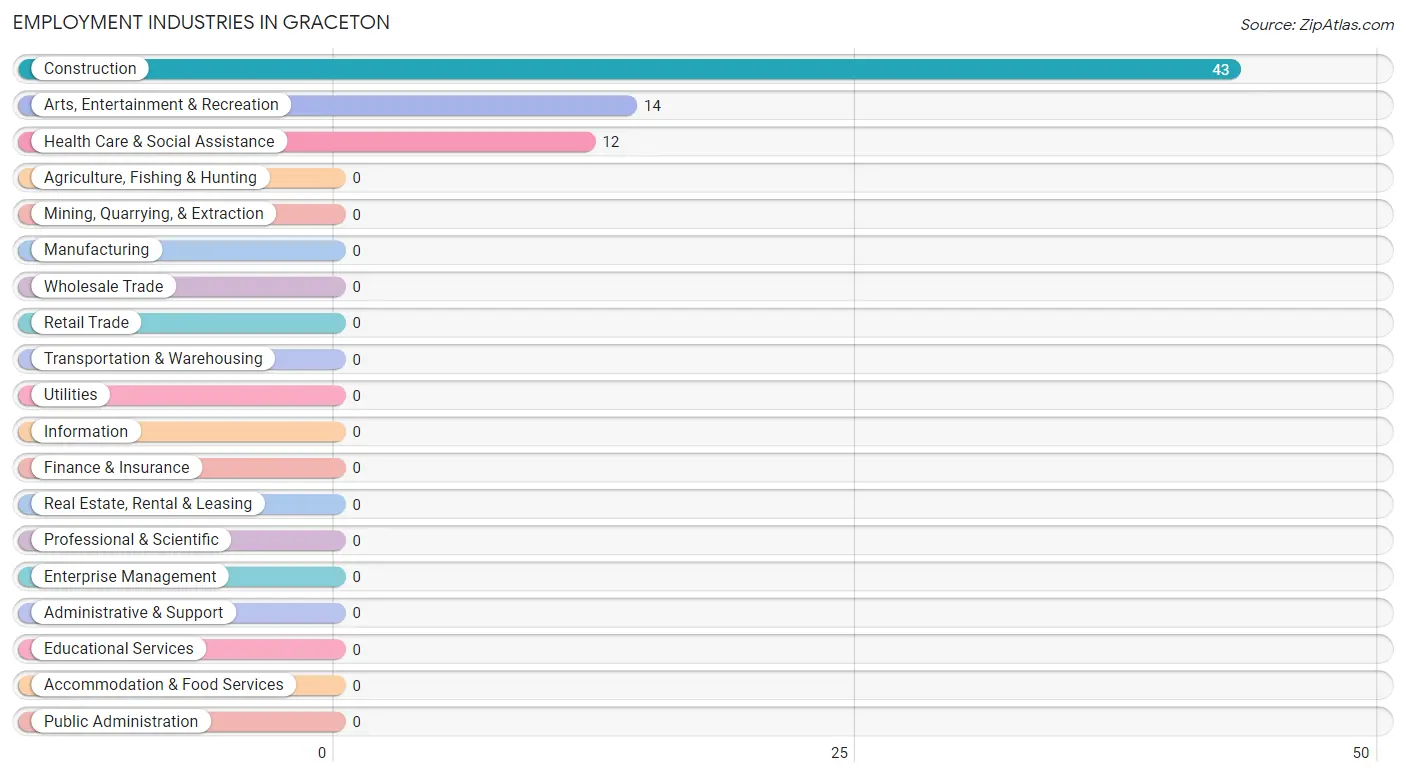
The major employment industries in Graceton include Construction (43 | 58.9%), Arts, Entertainment & Recreation (14 | 19.2%), and Health Care & Social Assistance (12 | 16.4%).
Employment Industries by Sex in Graceton
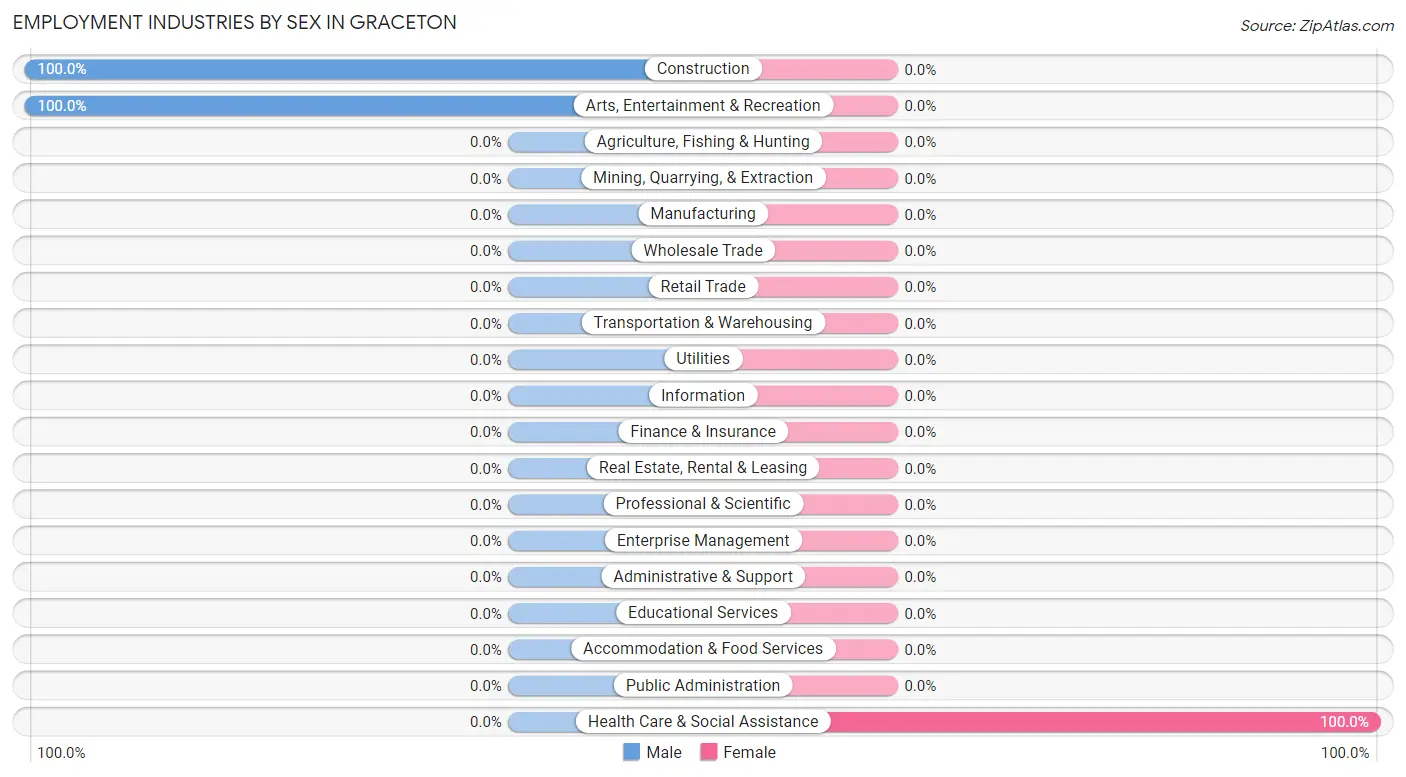
| Industry | Male | Female |
| Agriculture, Fishing & Hunting | 0 (0.0%) | 0 (0.0%) |
| Mining, Quarrying, & Extraction | 0 (0.0%) | 0 (0.0%) |
| Construction | 43 (100.0%) | 0 (0.0%) |
| Manufacturing | 0 (0.0%) | 0 (0.0%) |
| Wholesale Trade | 0 (0.0%) | 0 (0.0%) |
| Retail Trade | 0 (0.0%) | 0 (0.0%) |
| Transportation & Warehousing | 0 (0.0%) | 0 (0.0%) |
| Utilities | 0 (0.0%) | 0 (0.0%) |
| Information | 0 (0.0%) | 0 (0.0%) |
| Finance & Insurance | 0 (0.0%) | 0 (0.0%) |
| Real Estate, Rental & Leasing | 0 (0.0%) | 0 (0.0%) |
| Professional & Scientific | 0 (0.0%) | 0 (0.0%) |
| Enterprise Management | 0 (0.0%) | 0 (0.0%) |
| Administrative & Support | 0 (0.0%) | 0 (0.0%) |
| Educational Services | 0 (0.0%) | 0 (0.0%) |
| Health Care & Social Assistance | 0 (0.0%) | 12 (100.0%) |
| Arts, Entertainment & Recreation | 14 (100.0%) | 0 (0.0%) |
| Accommodation & Food Services | 0 (0.0%) | 0 (0.0%) |
| Public Administration | 0 (0.0%) | 0 (0.0%) |
| Total | 61 (83.6%) | 12 (16.4%) |
Education in Graceton
School Enrollment in Graceton
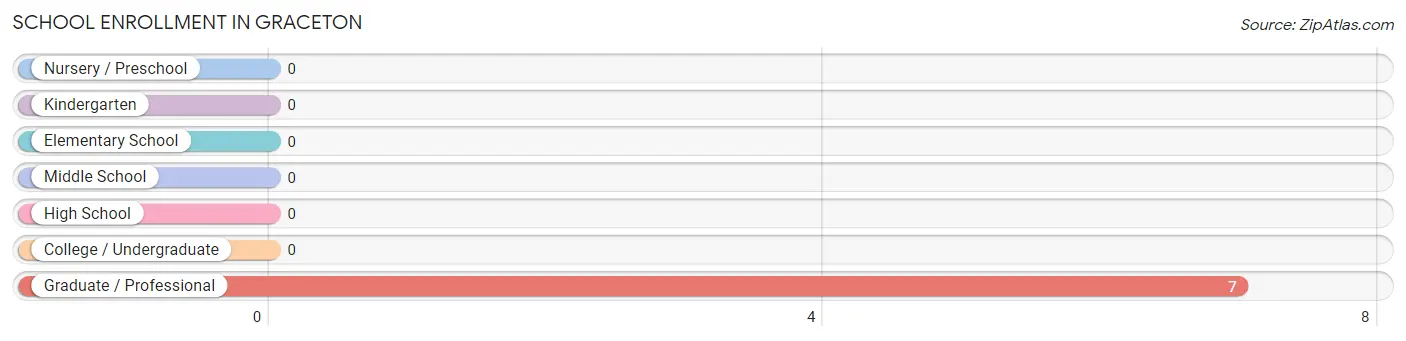
| School Level | # Students | % Students |
| Nursery / Preschool | 0 | 0.0% |
| Kindergarten | 0 | 0.0% |
| Elementary School | 0 | 0.0% |
| Middle School | 0 | 0.0% |
| High School | 0 | 0.0% |
| College / Undergraduate | 0 | 0.0% |
| Graduate / Professional | 7 | 100.0% |
| Total | 7 | 100.0% |
School Enrollment by Age by Funding Source in Graceton
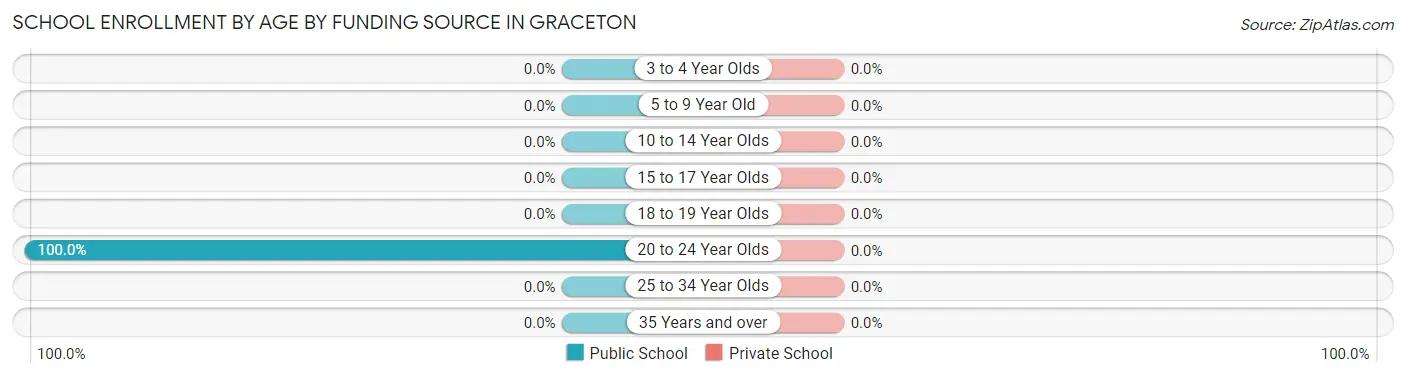
| Age Bracket | Public School | Private School |
| 3 to 4 Year Olds | 0 (0.0%) | 0 (0.0%) |
| 5 to 9 Year Old | 0 (0.0%) | 0 (0.0%) |
| 10 to 14 Year Olds | 0 (0.0%) | 0 (0.0%) |
| 15 to 17 Year Olds | 0 (0.0%) | 0 (0.0%) |
| 18 to 19 Year Olds | 0 (0.0%) | 0 (0.0%) |
| 20 to 24 Year Olds | 7 (100.0%) | 0 (0.0%) |
| 25 to 34 Year Olds | 0 (0.0%) | 0 (0.0%) |
| 35 Years and over | 0 (0.0%) | 0 (0.0%) |
| Total | 7 (100.0%) | 0 (0.0%) |
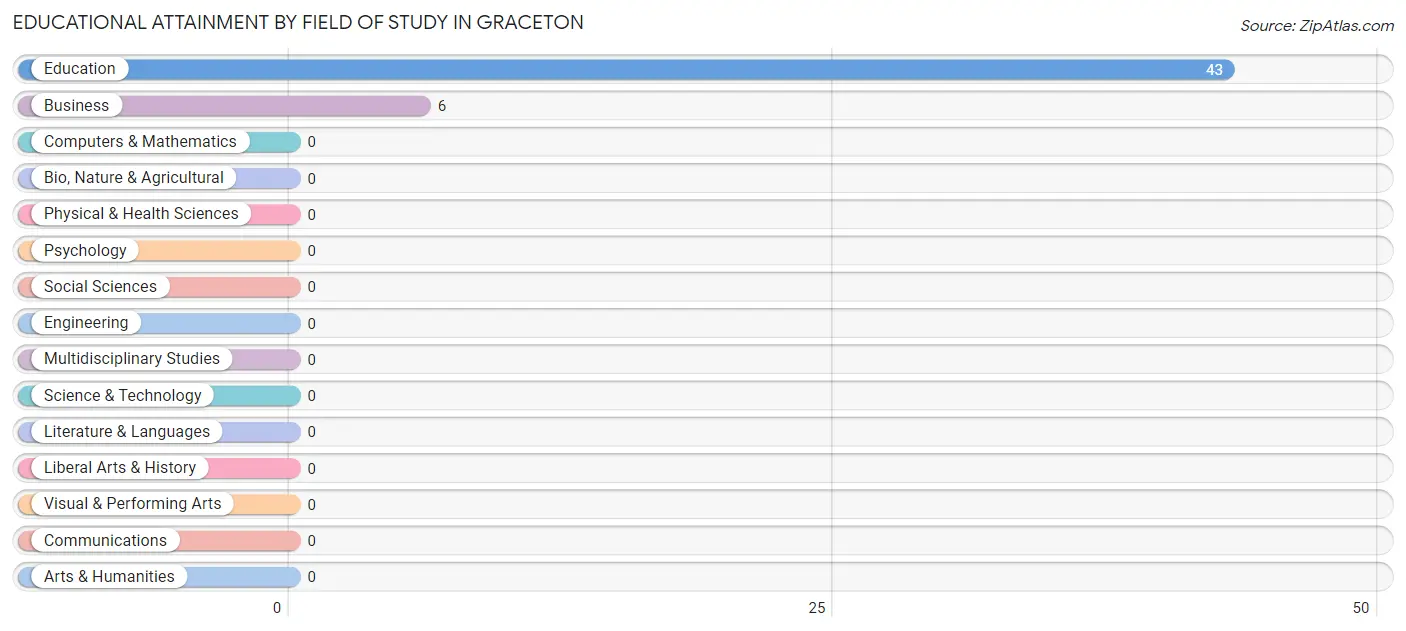
Educational Attainment by Field of Study in Graceton
Education (43 | 87.8%), and business (6 | 12.2%) are the most common fields of study among 49 individuals in Graceton who have obtained a bachelor's degree or higher.
| Field of Study | # Graduates | % Graduates |
| Computers & Mathematics | 0 | 0.0% |
| Bio, Nature & Agricultural | 0 | 0.0% |
| Physical & Health Sciences | 0 | 0.0% |
| Psychology | 0 | 0.0% |
| Social Sciences | 0 | 0.0% |
| Engineering | 0 | 0.0% |
| Multidisciplinary Studies | 0 | 0.0% |
| Science & Technology | 0 | 0.0% |
| Business | 6 | 12.2% |
| Education | 43 | 87.8% |
| Literature & Languages | 0 | 0.0% |
| Liberal Arts & History | 0 | 0.0% |
| Visual & Performing Arts | 0 | 0.0% |
| Communications | 0 | 0.0% |
| Arts & Humanities | 0 | 0.0% |
| Total | 49 | 100.0% |
Transportation & Commute in Graceton
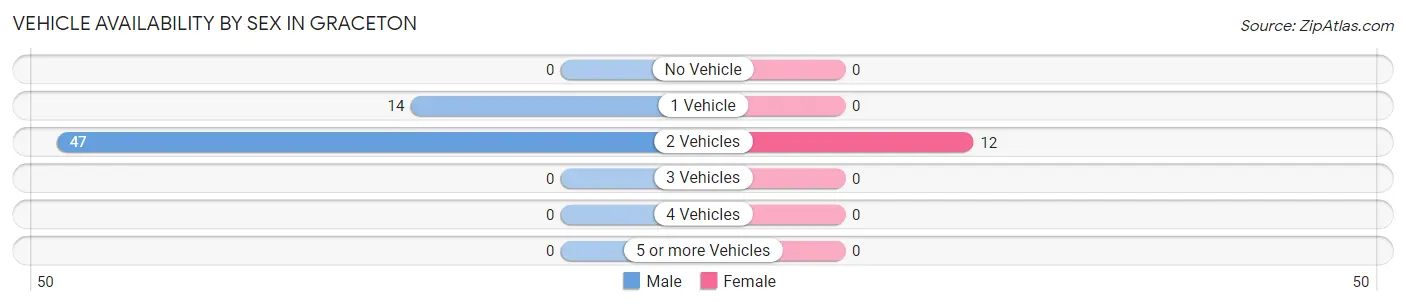
Vehicle Availability by Sex in Graceton
The most prevalent vehicle ownership categories in Graceton are males with 2 vehicles (47, accounting for 77.0%) and females with 2 vehicles (12, making up 391.7%).
| Vehicles Available | Male | Female |
| No Vehicle | 0 (0.0%) | 0 (0.0%) |
| 1 Vehicle | 14 (23.0%) | 0 (0.0%) |
| 2 Vehicles | 47 (77.0%) | 12 (100.0%) |
| 3 Vehicles | 0 (0.0%) | 0 (0.0%) |
| 4 Vehicles | 0 (0.0%) | 0 (0.0%) |
| 5 or more Vehicles | 0 (0.0%) | 0 (0.0%) |
| Total | 61 (100.0%) | 12 (100.0%) |
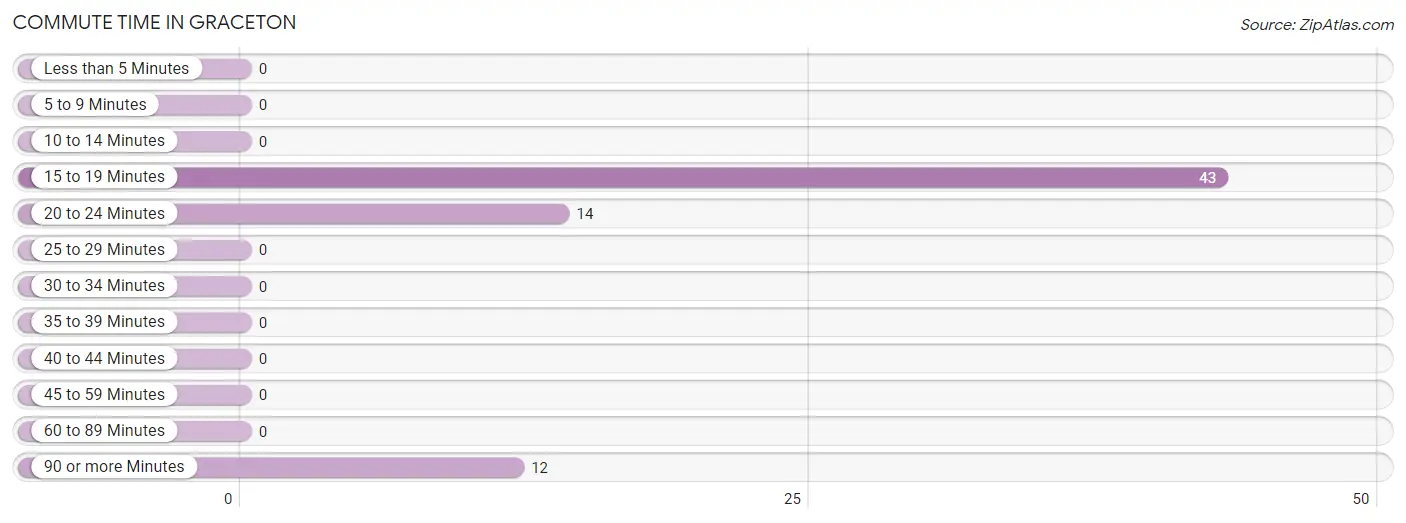
Commute Time in Graceton
The most frequently occuring commute durations in Graceton are 15 to 19 minutes (43 commuters, 62.3%), 20 to 24 minutes (14 commuters, 20.3%), and 90 or more minutes (12 commuters, 17.4%).
| Commute Time | # Commuters | % Commuters |
| Less than 5 Minutes | 0 | 0.0% |
| 5 to 9 Minutes | 0 | 0.0% |
| 10 to 14 Minutes | 0 | 0.0% |
| 15 to 19 Minutes | 43 | 62.3% |
| 20 to 24 Minutes | 14 | 20.3% |
| 25 to 29 Minutes | 0 | 0.0% |
| 30 to 34 Minutes | 0 | 0.0% |
| 35 to 39 Minutes | 0 | 0.0% |
| 40 to 44 Minutes | 0 | 0.0% |
| 45 to 59 Minutes | 0 | 0.0% |
| 60 to 89 Minutes | 0 | 0.0% |
| 90 or more Minutes | 12 | 17.4% |
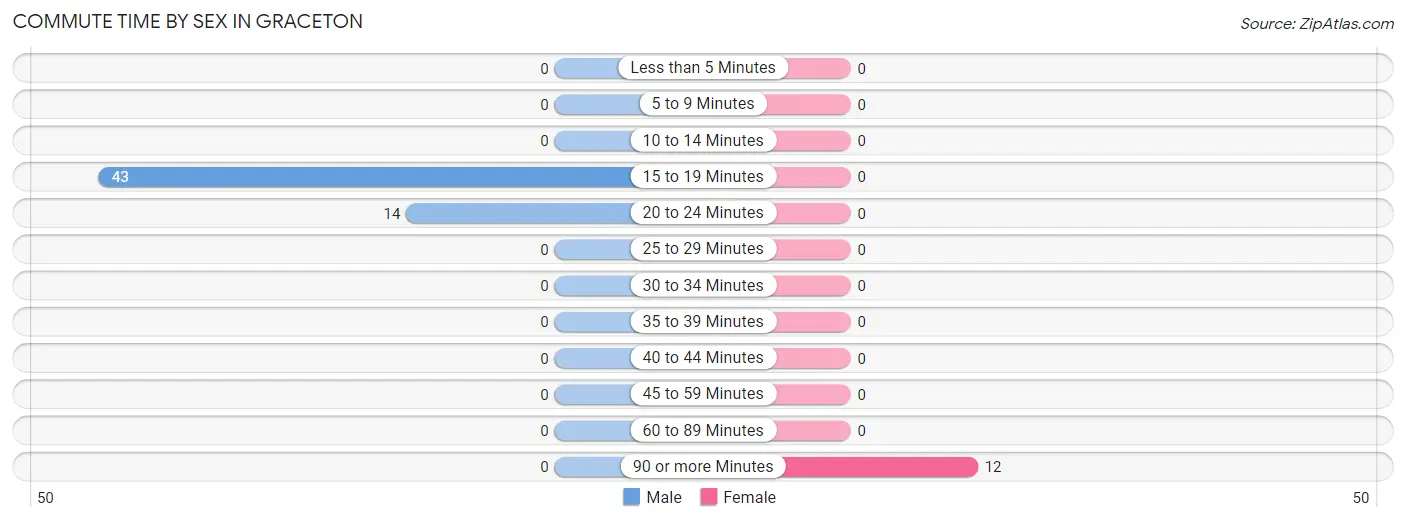
Commute Time by Sex in Graceton
The most common commute times in Graceton are 15 to 19 minutes (43 commuters, 75.4%) for males and 90 or more minutes (12 commuters, 100.0%) for females.
| Commute Time | Male | Female |
| Less than 5 Minutes | 0 (0.0%) | 0 (0.0%) |
| 5 to 9 Minutes | 0 (0.0%) | 0 (0.0%) |
| 10 to 14 Minutes | 0 (0.0%) | 0 (0.0%) |
| 15 to 19 Minutes | 43 (75.4%) | 0 (0.0%) |
| 20 to 24 Minutes | 14 (24.6%) | 0 (0.0%) |
| 25 to 29 Minutes | 0 (0.0%) | 0 (0.0%) |
| 30 to 34 Minutes | 0 (0.0%) | 0 (0.0%) |
| 35 to 39 Minutes | 0 (0.0%) | 0 (0.0%) |
| 40 to 44 Minutes | 0 (0.0%) | 0 (0.0%) |
| 45 to 59 Minutes | 0 (0.0%) | 0 (0.0%) |
| 60 to 89 Minutes | 0 (0.0%) | 0 (0.0%) |
| 90 or more Minutes | 0 (0.0%) | 12 (100.0%) |
Time of Departure to Work by Sex in Graceton
The most frequent times of departure to work in Graceton are 9:00 AM to 9:59 AM (43, 75.4%) for males and 4:00 PM to 11:59 PM (7, 58.3%) for females.
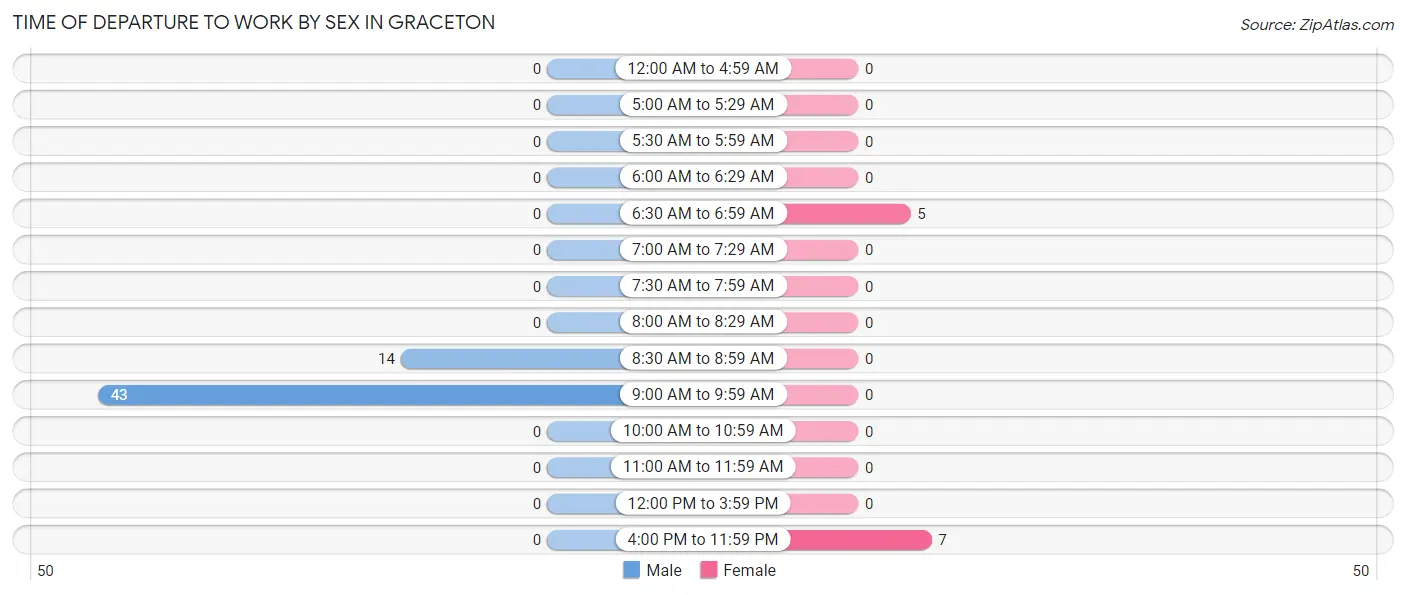
| Time of Departure | Male | Female |
| 12:00 AM to 4:59 AM | 0 (0.0%) | 0 (0.0%) |
| 5:00 AM to 5:29 AM | 0 (0.0%) | 0 (0.0%) |
| 5:30 AM to 5:59 AM | 0 (0.0%) | 0 (0.0%) |
| 6:00 AM to 6:29 AM | 0 (0.0%) | 0 (0.0%) |
| 6:30 AM to 6:59 AM | 0 (0.0%) | 5 (41.7%) |
| 7:00 AM to 7:29 AM | 0 (0.0%) | 0 (0.0%) |
| 7:30 AM to 7:59 AM | 0 (0.0%) | 0 (0.0%) |
| 8:00 AM to 8:29 AM | 0 (0.0%) | 0 (0.0%) |
| 8:30 AM to 8:59 AM | 14 (24.6%) | 0 (0.0%) |
| 9:00 AM to 9:59 AM | 43 (75.4%) | 0 (0.0%) |
| 10:00 AM to 10:59 AM | 0 (0.0%) | 0 (0.0%) |
| 11:00 AM to 11:59 AM | 0 (0.0%) | 0 (0.0%) |
| 12:00 PM to 3:59 PM | 0 (0.0%) | 0 (0.0%) |
| 4:00 PM to 11:59 PM | 0 (0.0%) | 7 (58.3%) |
| Total | 57 (100.0%) | 12 (100.0%) |
Housing Occupancy in Graceton
Occupancy by Ownership in Graceton
Of the total 73 dwellings in Graceton, owner-occupied units account for 59 (80.8%), while renter-occupied units make up 14 (19.2%).
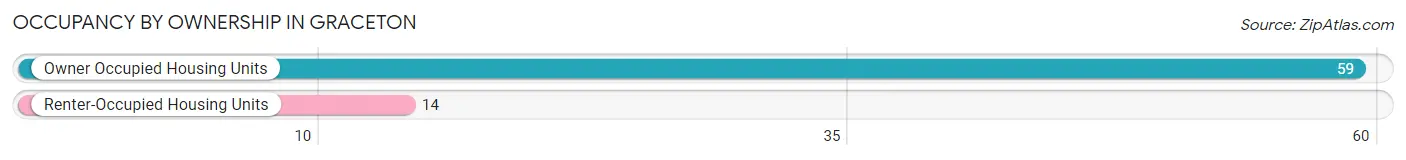
| Occupancy | # Housing Units | % Housing Units |
| Owner Occupied Housing Units | 59 | 80.8% |
| Renter-Occupied Housing Units | 14 | 19.2% |
| Total Occupied Housing Units | 73 | 100.0% |
Occupancy by Household Size in Graceton
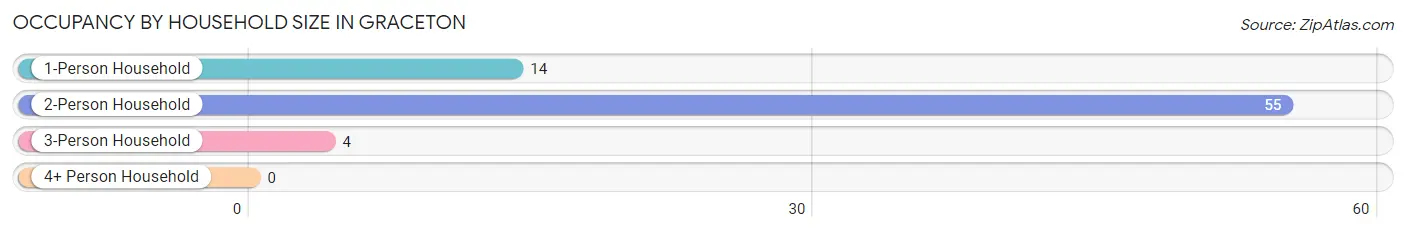
| Household Size | # Housing Units | % Housing Units |
| 1-Person Household | 14 | 19.2% |
| 2-Person Household | 55 | 75.3% |
| 3-Person Household | 4 | 5.5% |
| 4+ Person Household | 0 | 0.0% |
| Total Housing Units | 73 | 100.0% |
Occupancy by Ownership by Household Size in Graceton
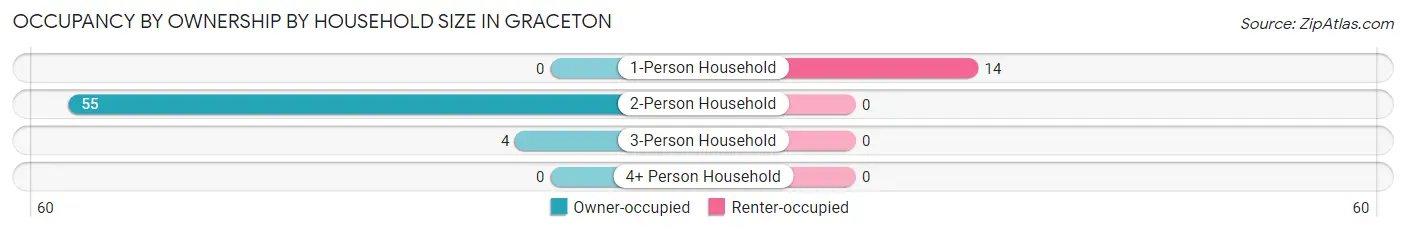
| Household Size | Owner-occupied | Renter-occupied |
| 1-Person Household | 0 (0.0%) | 14 (100.0%) |
| 2-Person Household | 55 (100.0%) | 0 (0.0%) |
| 3-Person Household | 4 (100.0%) | 0 (0.0%) |
| 4+ Person Household | 0 (0.0%) | 0 (0.0%) |
| Total Housing Units | 59 (80.8%) | 14 (19.2%) |
Occupancy by Educational Attainment in Graceton
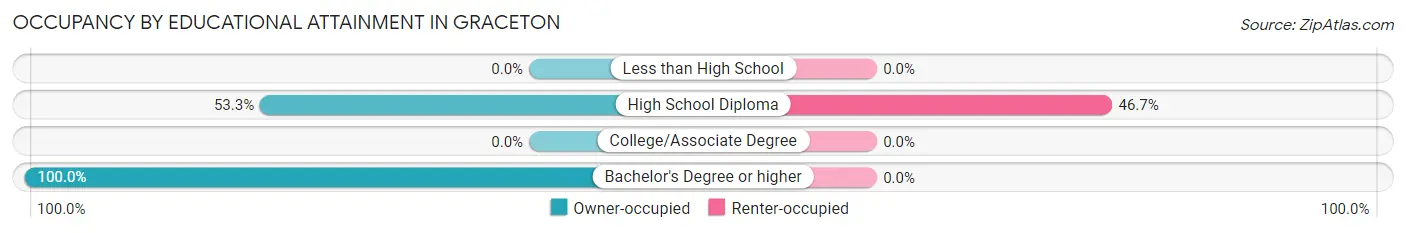
| Household Size | Owner-occupied | Renter-occupied |
| Less than High School | 0 (0.0%) | 0 (0.0%) |
| High School Diploma | 16 (53.3%) | 14 (46.7%) |
| College/Associate Degree | 0 (0.0%) | 0 (0.0%) |
| Bachelor's Degree or higher | 43 (100.0%) | 0 (0.0%) |
Occupancy by Age of Householder in Graceton
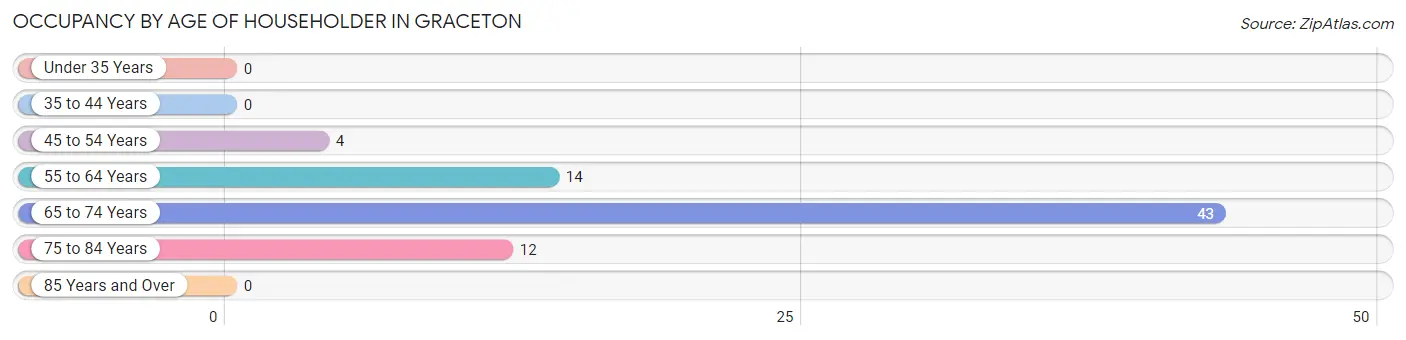
| Age Bracket | # Households | % Households |
| Under 35 Years | 0 | 0.0% |
| 35 to 44 Years | 0 | 0.0% |
| 45 to 54 Years | 4 | 5.5% |
| 55 to 64 Years | 14 | 19.2% |
| 65 to 74 Years | 43 | 58.9% |
| 75 to 84 Years | 12 | 16.4% |
| 85 Years and Over | 0 | 0.0% |
| Total | 73 | 100.0% |
Housing Finances in Graceton
Median Income by Occupancy in Graceton
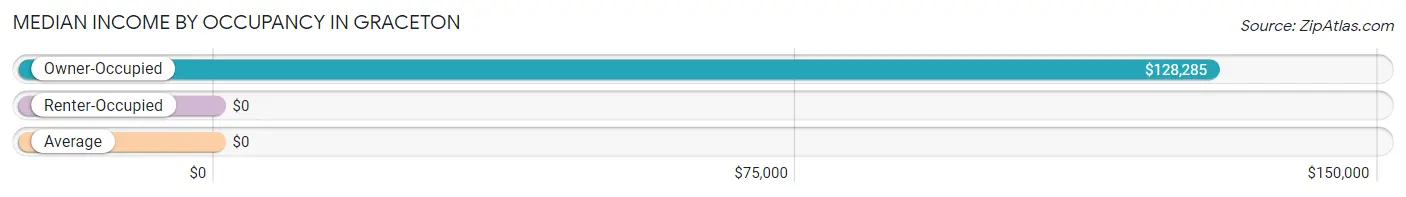
| Occupancy Type | # Households | Median Income |
| Owner-Occupied | 59 (80.8%) | $128,285 |
| Renter-Occupied | 14 (19.2%) | $0 |
| Average | 73 (100.0%) | $0 |
Occupancy by Householder Income Bracket in Graceton
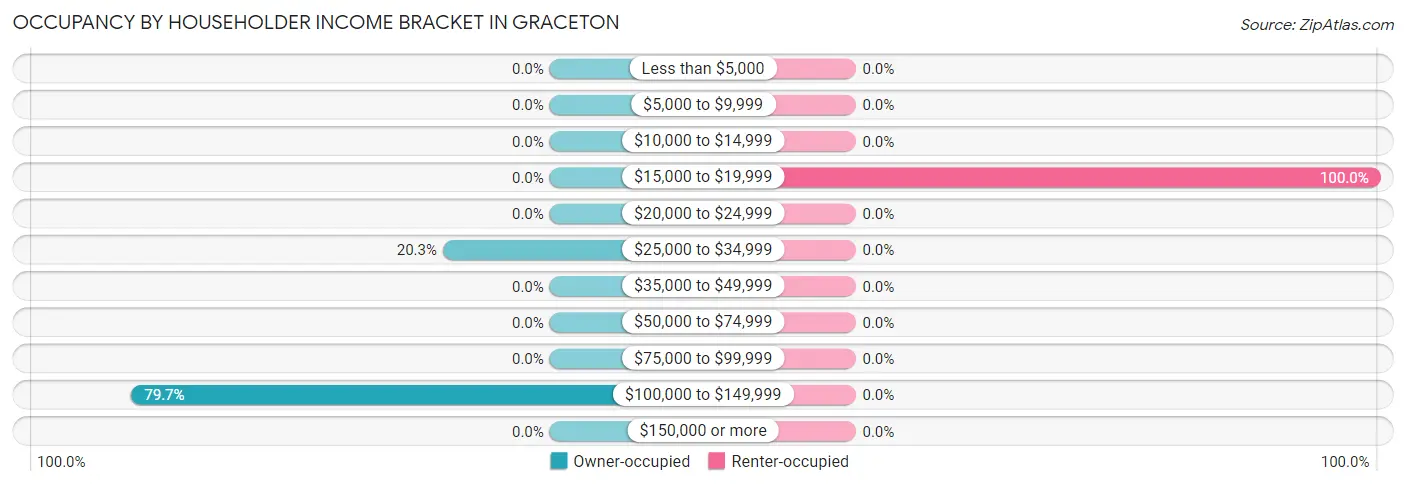
| Income Bracket | Owner-occupied | Renter-occupied |
| Less than $5,000 | 0 (0.0%) | 0 (0.0%) |
| $5,000 to $9,999 | 0 (0.0%) | 0 (0.0%) |
| $10,000 to $14,999 | 0 (0.0%) | 0 (0.0%) |
| $15,000 to $19,999 | 0 (0.0%) | 14 (100.0%) |
| $20,000 to $24,999 | 0 (0.0%) | 0 (0.0%) |
| $25,000 to $34,999 | 12 (20.3%) | 0 (0.0%) |
| $35,000 to $49,999 | 0 (0.0%) | 0 (0.0%) |
| $50,000 to $74,999 | 0 (0.0%) | 0 (0.0%) |
| $75,000 to $99,999 | 0 (0.0%) | 0 (0.0%) |
| $100,000 to $149,999 | 47 (79.7%) | 0 (0.0%) |
| $150,000 or more | 0 (0.0%) | 0 (0.0%) |
| Total | 59 (100.0%) | 14 (100.0%) |
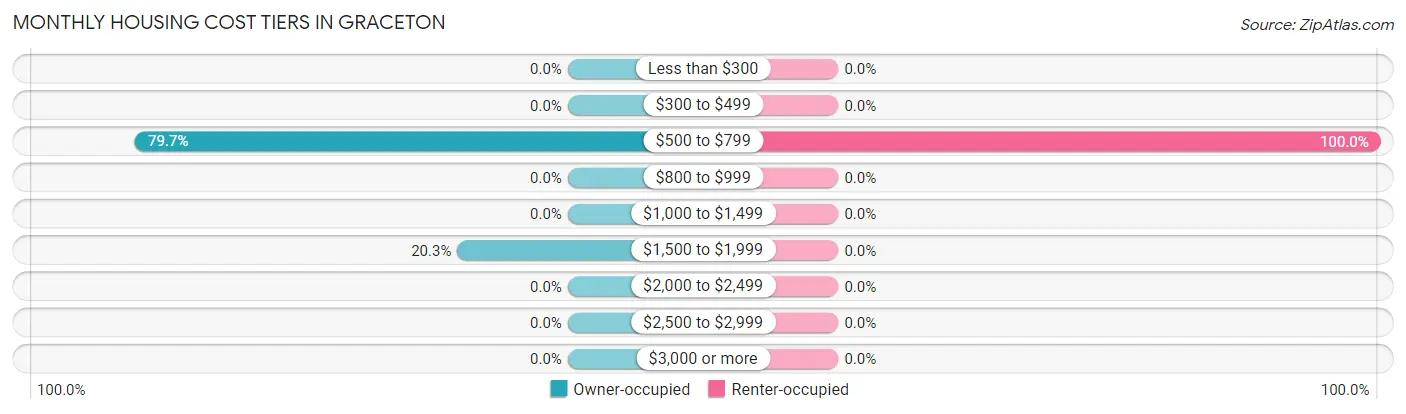
Monthly Housing Cost Tiers in Graceton
| Monthly Cost | Owner-occupied | Renter-occupied |
| Less than $300 | 0 (0.0%) | 0 (0.0%) |
| $300 to $499 | 0 (0.0%) | 0 (0.0%) |
| $500 to $799 | 47 (79.7%) | 14 (100.0%) |
| $800 to $999 | 0 (0.0%) | 0 (0.0%) |
| $1,000 to $1,499 | 0 (0.0%) | 0 (0.0%) |
| $1,500 to $1,999 | 12 (20.3%) | 0 (0.0%) |
| $2,000 to $2,499 | 0 (0.0%) | 0 (0.0%) |
| $2,500 to $2,999 | 0 (0.0%) | 0 (0.0%) |
| $3,000 or more | 0 (0.0%) | 0 (0.0%) |
| Total | 59 (100.0%) | 14 (100.0%) |
Physical Housing Characteristics in Graceton
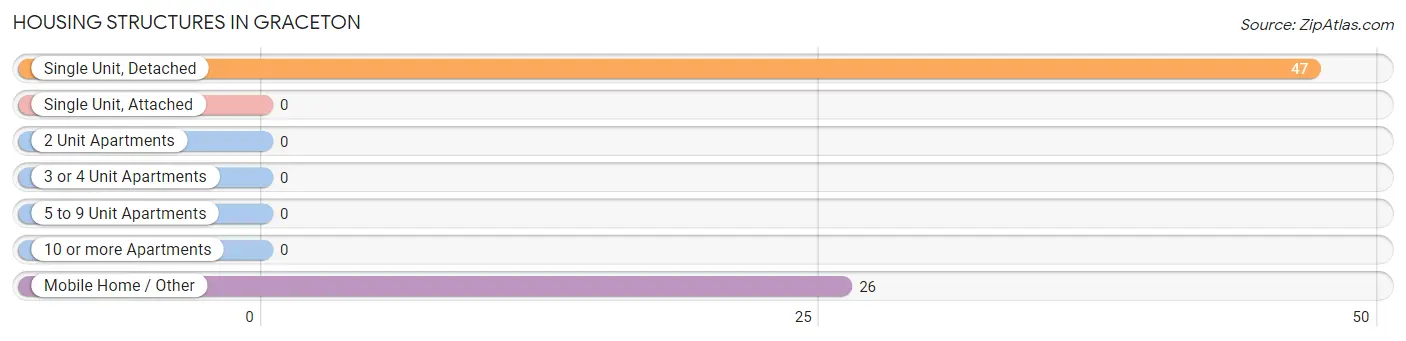
Housing Structures in Graceton
| Structure Type | # Housing Units | % Housing Units |
| Single Unit, Detached | 47 | 64.4% |
| Single Unit, Attached | 0 | 0.0% |
| 2 Unit Apartments | 0 | 0.0% |
| 3 or 4 Unit Apartments | 0 | 0.0% |
| 5 to 9 Unit Apartments | 0 | 0.0% |
| 10 or more Apartments | 0 | 0.0% |
| Mobile Home / Other | 26 | 35.6% |
| Total | 73 | 100.0% |
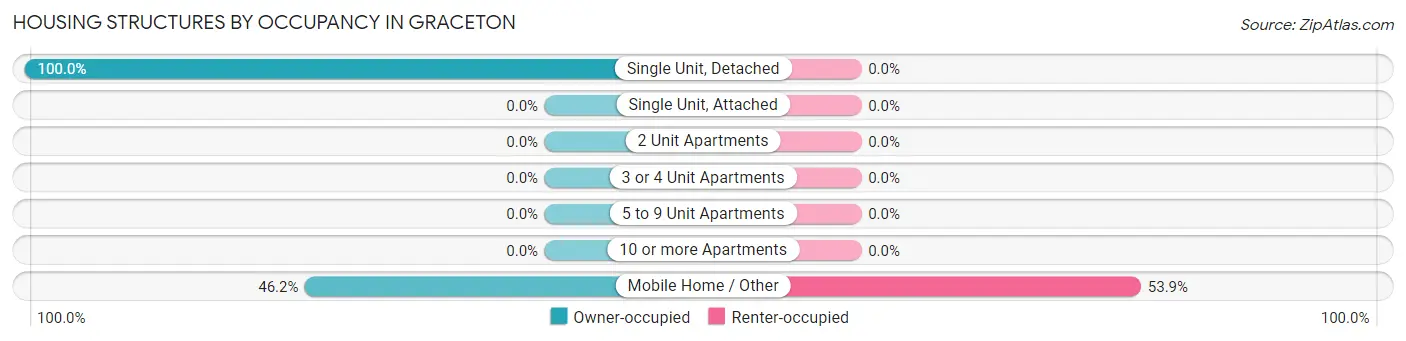
Housing Structures by Occupancy in Graceton
| Structure Type | Owner-occupied | Renter-occupied |
| Single Unit, Detached | 47 (100.0%) | 0 (0.0%) |
| Single Unit, Attached | 0 (0.0%) | 0 (0.0%) |
| 2 Unit Apartments | 0 (0.0%) | 0 (0.0%) |
| 3 or 4 Unit Apartments | 0 (0.0%) | 0 (0.0%) |
| 5 to 9 Unit Apartments | 0 (0.0%) | 0 (0.0%) |
| 10 or more Apartments | 0 (0.0%) | 0 (0.0%) |
| Mobile Home / Other | 12 (46.2%) | 14 (53.8%) |
| Total | 59 (80.8%) | 14 (19.2%) |
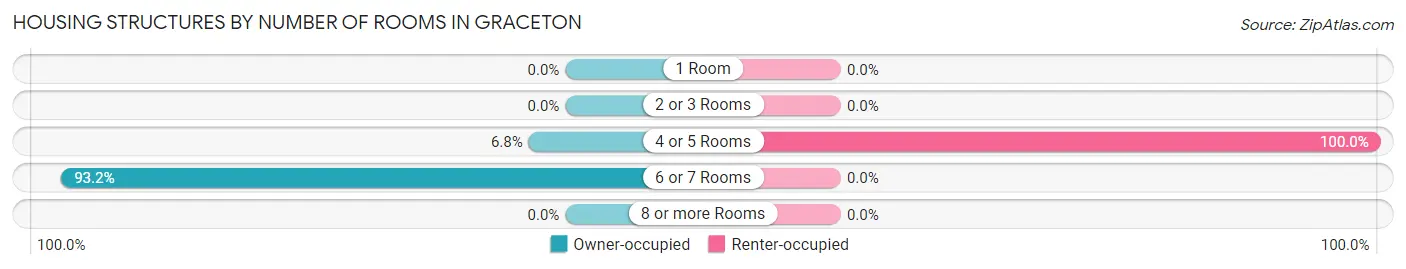
Housing Structures by Number of Rooms in Graceton
| Number of Rooms | Owner-occupied | Renter-occupied |
| 1 Room | 0 (0.0%) | 0 (0.0%) |
| 2 or 3 Rooms | 0 (0.0%) | 0 (0.0%) |
| 4 or 5 Rooms | 4 (6.8%) | 14 (100.0%) |
| 6 or 7 Rooms | 55 (93.2%) | 0 (0.0%) |
| 8 or more Rooms | 0 (0.0%) | 0 (0.0%) |
| Total | 59 (100.0%) | 14 (100.0%) |
Housing Structure by Heating Type in Graceton
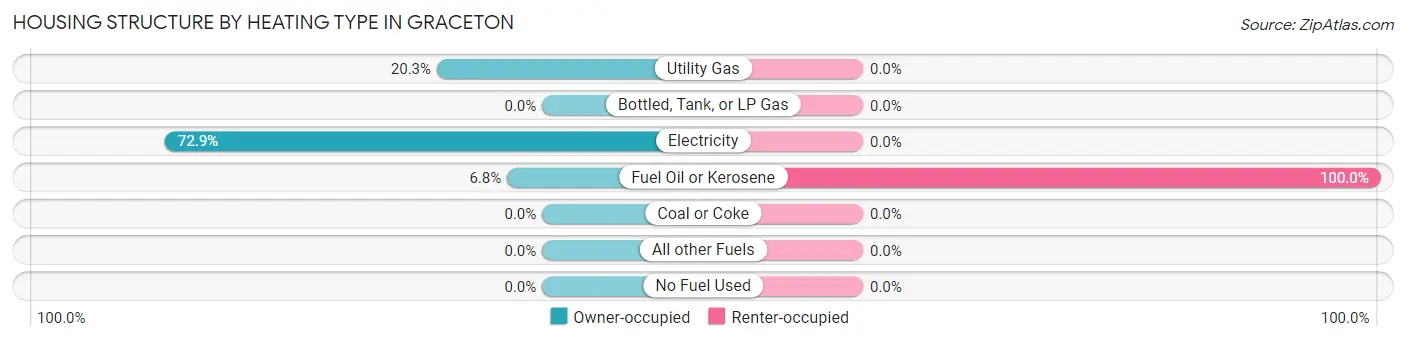
| Heating Type | Owner-occupied | Renter-occupied |
| Utility Gas | 12 (20.3%) | 0 (0.0%) |
| Bottled, Tank, or LP Gas | 0 (0.0%) | 0 (0.0%) |
| Electricity | 43 (72.9%) | 0 (0.0%) |
| Fuel Oil or Kerosene | 4 (6.8%) | 14 (100.0%) |
| Coal or Coke | 0 (0.0%) | 0 (0.0%) |
| All other Fuels | 0 (0.0%) | 0 (0.0%) |
| No Fuel Used | 0 (0.0%) | 0 (0.0%) |
| Total | 59 (100.0%) | 14 (100.0%) |
Household Vehicle Usage in Graceton
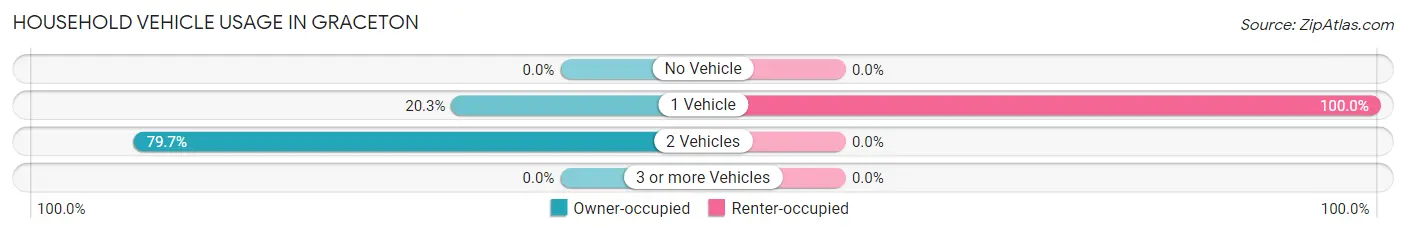
| Vehicles per Household | Owner-occupied | Renter-occupied |
| No Vehicle | 0 (0.0%) | 0 (0.0%) |
| 1 Vehicle | 12 (20.3%) | 14 (100.0%) |
| 2 Vehicles | 47 (79.7%) | 0 (0.0%) |
| 3 or more Vehicles | 0 (0.0%) | 0 (0.0%) |
| Total | 59 (100.0%) | 14 (100.0%) |
Real Estate & Mortgages in Graceton
Real Estate and Mortgage Overview in Graceton
| Characteristic | Without Mortgage | With Mortgage |
| Housing Units | 4 | 55 |
| Median Property Value | - | - |
| Median Household Income | - | - |
| Monthly Housing Costs | - | - |
| Real Estate Taxes | - | - |
Property Value by Mortgage Status in Graceton
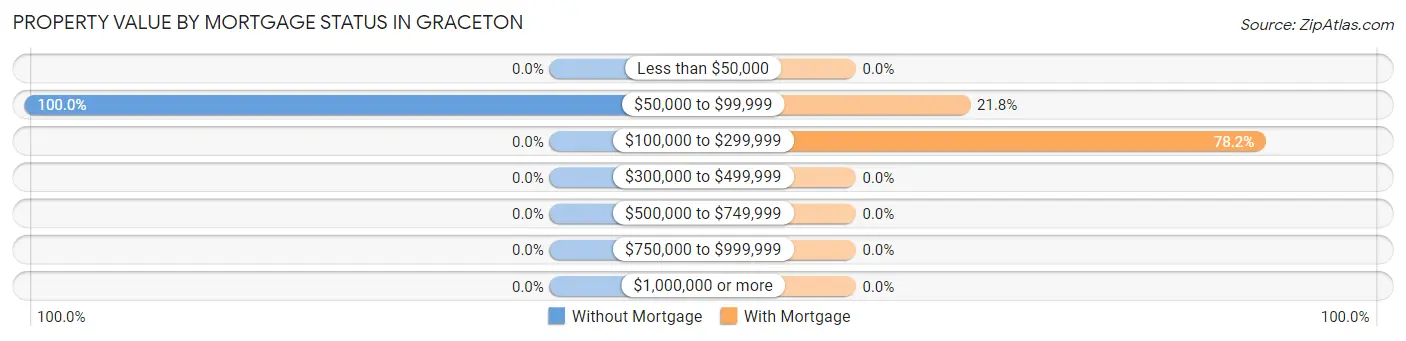
| Property Value | Without Mortgage | With Mortgage |
| Less than $50,000 | 0 (0.0%) | 0 (0.0%) |
| $50,000 to $99,999 | 4 (100.0%) | 12 (21.8%) |
| $100,000 to $299,999 | 0 (0.0%) | 43 (78.2%) |
| $300,000 to $499,999 | 0 (0.0%) | 0 (0.0%) |
| $500,000 to $749,999 | 0 (0.0%) | 0 (0.0%) |
| $750,000 to $999,999 | 0 (0.0%) | 0 (0.0%) |
| $1,000,000 or more | 0 (0.0%) | 0 (0.0%) |
| Total | 4 (100.0%) | 55 (100.0%) |
Household Income by Mortgage Status in Graceton
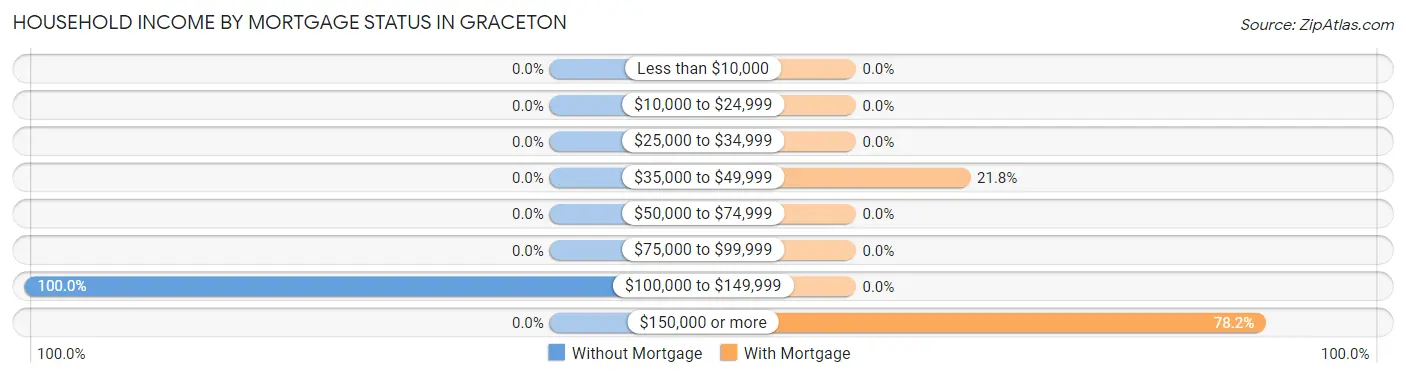
| Household Income | Without Mortgage | With Mortgage |
| Less than $10,000 | 0 (0.0%) | 0 (0.0%) |
| $10,000 to $24,999 | 0 (0.0%) | 0 (0.0%) |
| $25,000 to $34,999 | 0 (0.0%) | 0 (0.0%) |
| $35,000 to $49,999 | 0 (0.0%) | 12 (21.8%) |
| $50,000 to $74,999 | 0 (0.0%) | 0 (0.0%) |
| $75,000 to $99,999 | 0 (0.0%) | 0 (0.0%) |
| $100,000 to $149,999 | 4 (100.0%) | 0 (0.0%) |
| $150,000 or more | 0 (0.0%) | 43 (78.2%) |
| Total | 4 (100.0%) | 55 (100.0%) |
Property Value to Household Income Ratio in Graceton
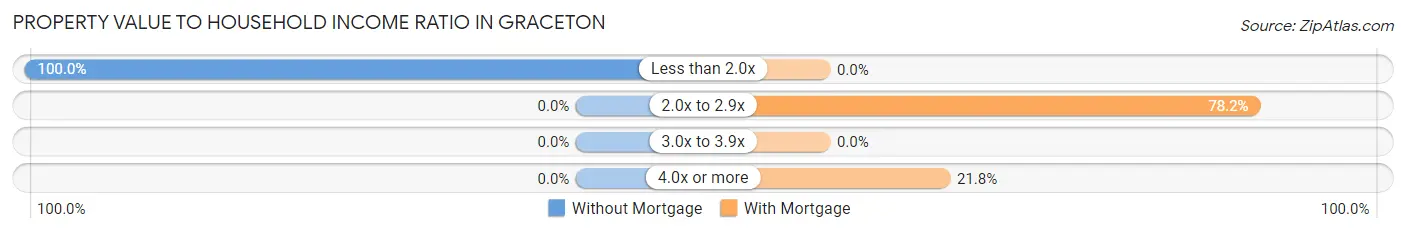
| Value-to-Income Ratio | Without Mortgage | With Mortgage |
| Less than 2.0x | 4 (100.0%) | 0 (0.0%) |
| 2.0x to 2.9x | 0 (0.0%) | 43 (78.2%) |
| 3.0x to 3.9x | 0 (0.0%) | 0 (0.0%) |
| 4.0x or more | 0 (0.0%) | 12 (21.8%) |
| Total | 4 (100.0%) | 55 (100.0%) |
Real Estate Taxes by Mortgage Status in Graceton
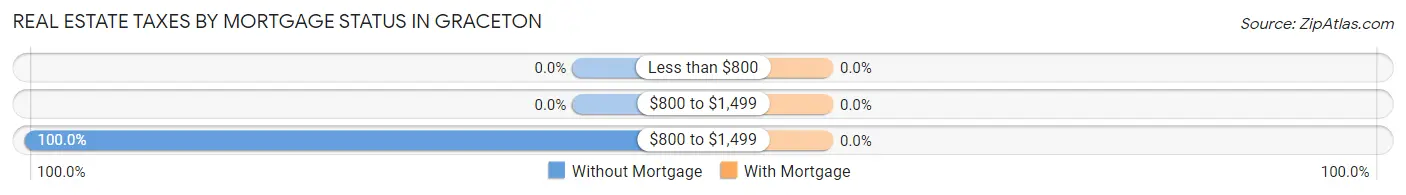
| Property Taxes | Without Mortgage | With Mortgage |
| Less than $800 | 0 (0.0%) | 0 (0.0%) |
| $800 to $1,499 | 0 (0.0%) | 0 (0.0%) |
| $800 to $1,499 | 4 (100.0%) | 0 (0.0%) |
| Total | 4 (100.0%) | 55 (100.0%) |
Health & Disability in Graceton
Health Insurance Coverage by Age in Graceton
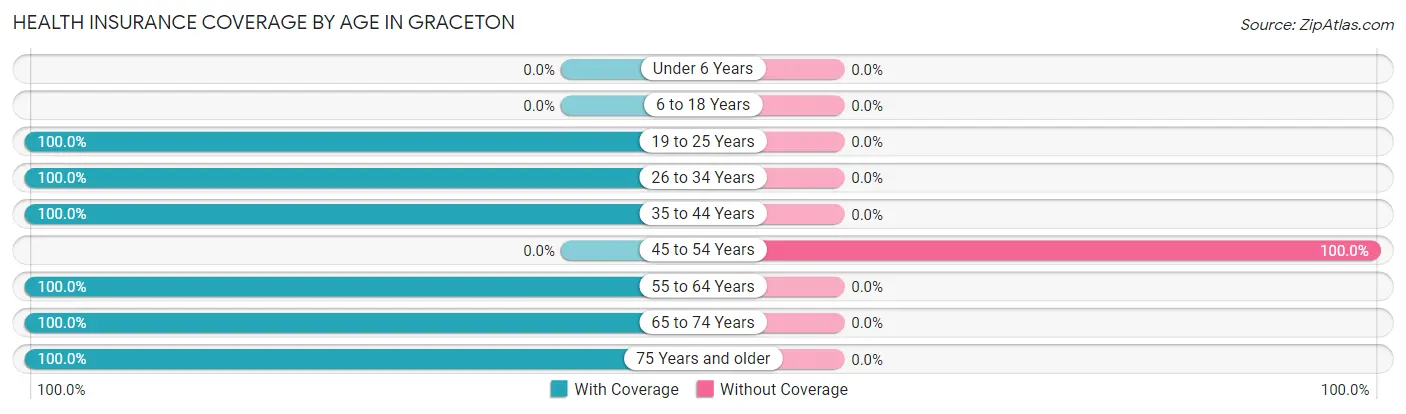
| Age Bracket | With Coverage | Without Coverage |
| Under 6 Years | 0 (0.0%) | 0 (0.0%) |
| 6 to 18 Years | 0 (0.0%) | 0 (0.0%) |
| 19 to 25 Years | 7 (100.0%) | 0 (0.0%) |
| 26 to 34 Years | 16 (100.0%) | 0 (0.0%) |
| 35 to 44 Years | 11 (100.0%) | 0 (0.0%) |
| 45 to 54 Years | 0 (0.0%) | 4 (100.0%) |
| 55 to 64 Years | 57 (100.0%) | 0 (0.0%) |
| 65 to 74 Years | 43 (100.0%) | 0 (0.0%) |
| 75 Years and older | 12 (100.0%) | 0 (0.0%) |
| Total | 146 (97.3%) | 4 (2.7%) |
Health Insurance Coverage by Citizenship Status in Graceton
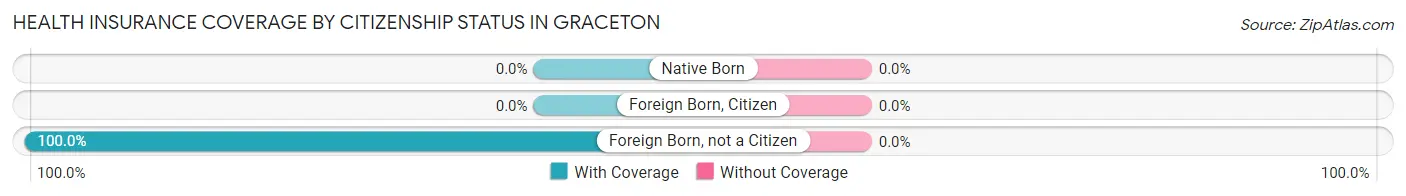
| Citizenship Status | With Coverage | Without Coverage |
| Native Born | 0 (0.0%) | 0 (0.0%) |
| Foreign Born, Citizen | 0 (0.0%) | 0 (0.0%) |
| Foreign Born, not a Citizen | 7 (100.0%) | 0 (0.0%) |
Health Insurance Coverage by Household Income in Graceton
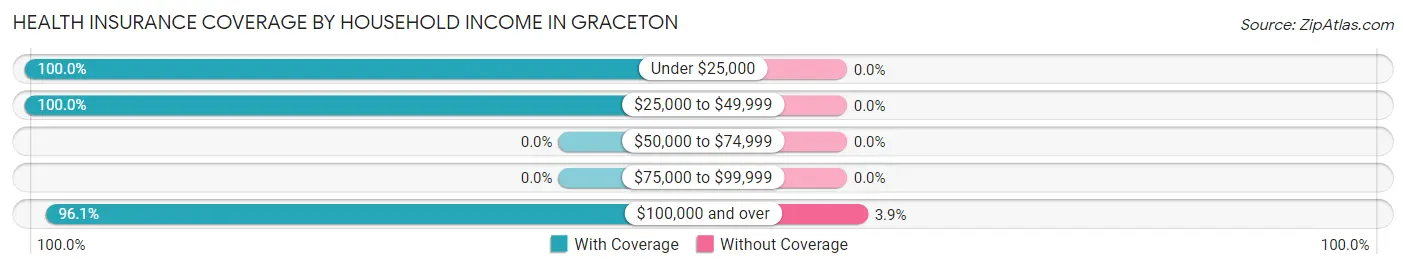
| Household Income | With Coverage | Without Coverage |
| Under $25,000 | 14 (100.0%) | 0 (0.0%) |
| $25,000 to $49,999 | 28 (100.0%) | 0 (0.0%) |
| $50,000 to $74,999 | 0 (0.0%) | 0 (0.0%) |
| $75,000 to $99,999 | 0 (0.0%) | 0 (0.0%) |
| $100,000 and over | 98 (96.1%) | 4 (3.9%) |
Public vs Private Health Insurance Coverage by Age in Graceton
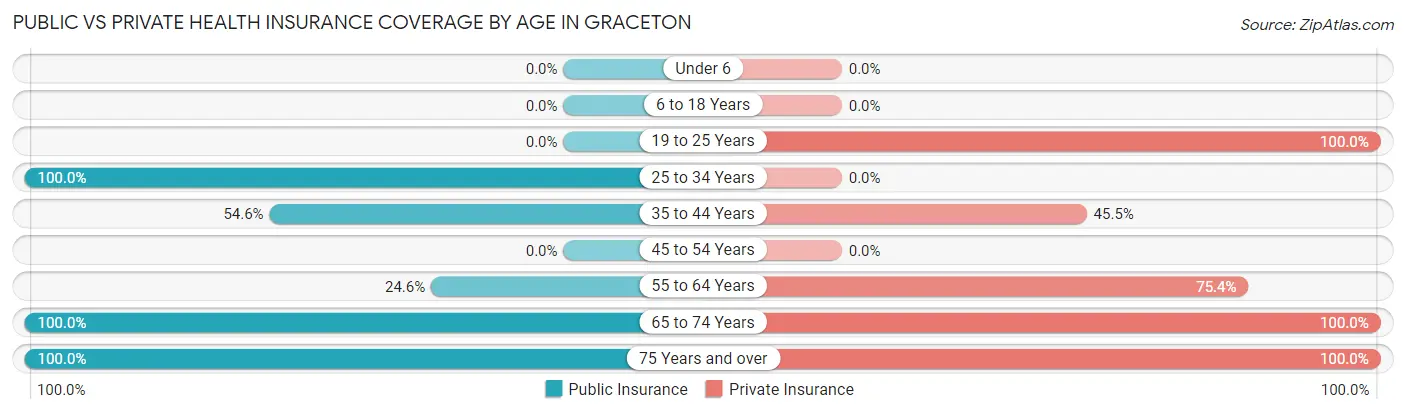
| Age Bracket | Public Insurance | Private Insurance |
| Under 6 | 0 (0.0%) | 0 (0.0%) |
| 6 to 18 Years | 0 (0.0%) | 0 (0.0%) |
| 19 to 25 Years | 0 (0.0%) | 7 (100.0%) |
| 25 to 34 Years | 16 (100.0%) | 0 (0.0%) |
| 35 to 44 Years | 6 (54.5%) | 5 (45.5%) |
| 45 to 54 Years | 0 (0.0%) | 0 (0.0%) |
| 55 to 64 Years | 14 (24.6%) | 43 (75.4%) |
| 65 to 74 Years | 43 (100.0%) | 43 (100.0%) |
| 75 Years and over | 12 (100.0%) | 12 (100.0%) |
| Total | 91 (60.7%) | 110 (73.3%) |
Disability Status by Sex by Age in Graceton
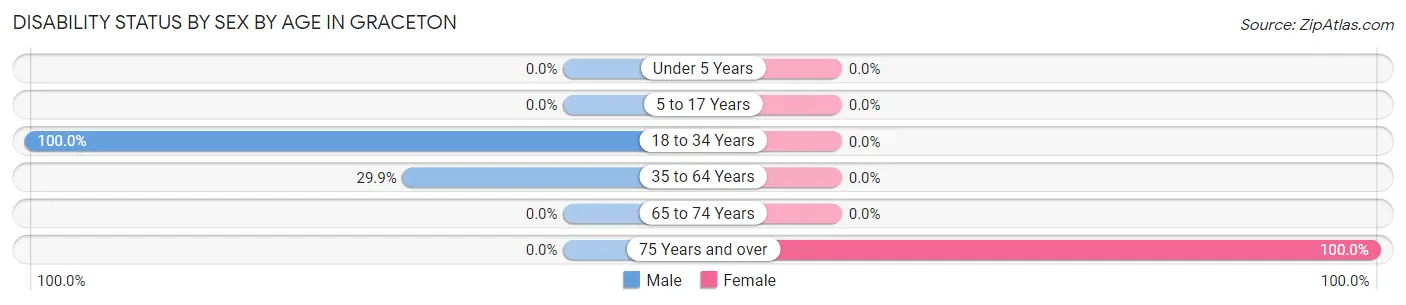
| Age Bracket | Male | Female |
| Under 5 Years | 0 (0.0%) | 0 (0.0%) |
| 5 to 17 Years | 0 (0.0%) | 0 (0.0%) |
| 18 to 34 Years | 16 (100.0%) | 0 (0.0%) |
| 35 to 64 Years | 20 (29.8%) | 0 (0.0%) |
| 65 to 74 Years | 0 (0.0%) | 0 (0.0%) |
| 75 Years and over | 0 (0.0%) | 12 (100.0%) |
Disability Class by Sex by Age in Graceton
Disability Class: Hearing Difficulty

| Age Bracket | Male | Female |
| Under 5 Years | 0 (0.0%) | 0 (0.0%) |
| 5 to 17 Years | 0 (0.0%) | 0 (0.0%) |
| 18 to 34 Years | 0 (0.0%) | 0 (0.0%) |
| 35 to 64 Years | 6 (9.0%) | 0 (0.0%) |
| 65 to 74 Years | 0 (0.0%) | 0 (0.0%) |
| 75 Years and over | 0 (0.0%) | 0 (0.0%) |
Disability Class: Vision Difficulty
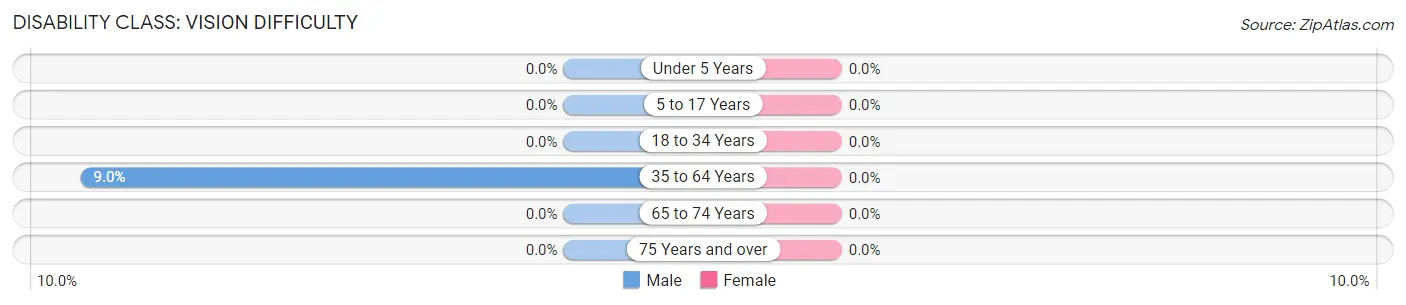
| Age Bracket | Male | Female |
| Under 5 Years | 0 (0.0%) | 0 (0.0%) |
| 5 to 17 Years | 0 (0.0%) | 0 (0.0%) |
| 18 to 34 Years | 0 (0.0%) | 0 (0.0%) |
| 35 to 64 Years | 6 (9.0%) | 0 (0.0%) |
| 65 to 74 Years | 0 (0.0%) | 0 (0.0%) |
| 75 Years and over | 0 (0.0%) | 0 (0.0%) |
Disability Class: Cognitive Difficulty
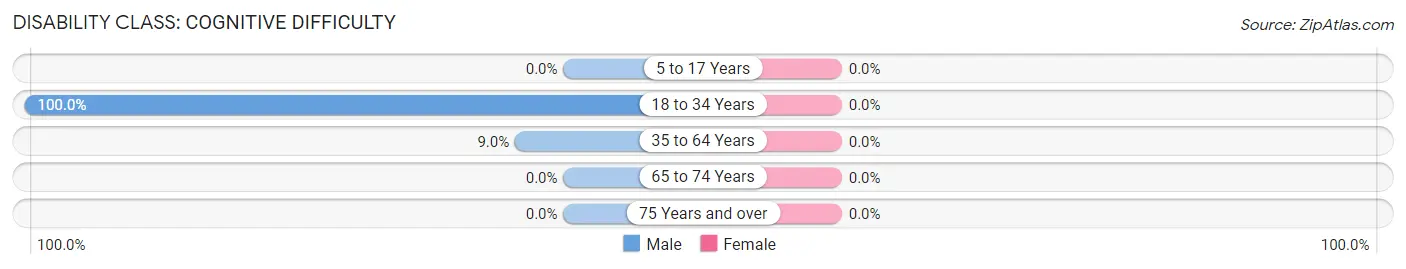
| Age Bracket | Male | Female |
| 5 to 17 Years | 0 (0.0%) | 0 (0.0%) |
| 18 to 34 Years | 16 (100.0%) | 0 (0.0%) |
| 35 to 64 Years | 6 (9.0%) | 0 (0.0%) |
| 65 to 74 Years | 0 (0.0%) | 0 (0.0%) |
| 75 Years and over | 0 (0.0%) | 0 (0.0%) |
Disability Class: Ambulatory Difficulty
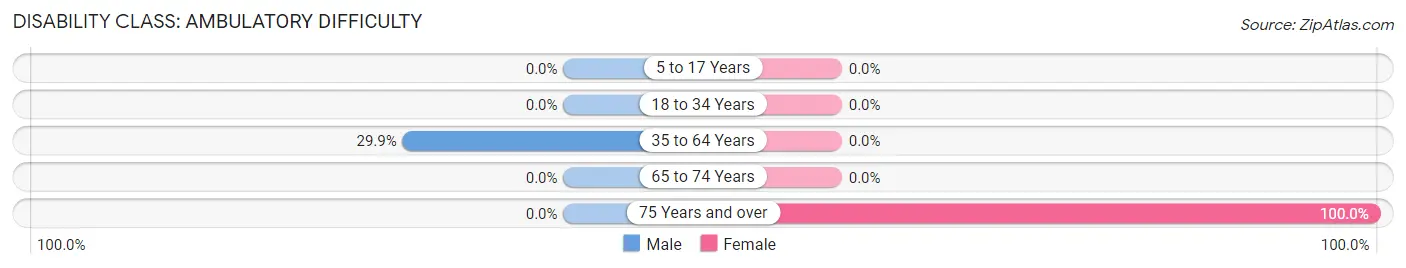
| Age Bracket | Male | Female |
| 5 to 17 Years | 0 (0.0%) | 0 (0.0%) |
| 18 to 34 Years | 0 (0.0%) | 0 (0.0%) |
| 35 to 64 Years | 20 (29.8%) | 0 (0.0%) |
| 65 to 74 Years | 0 (0.0%) | 0 (0.0%) |
| 75 Years and over | 0 (0.0%) | 12 (100.0%) |
Disability Class: Self-Care Difficulty
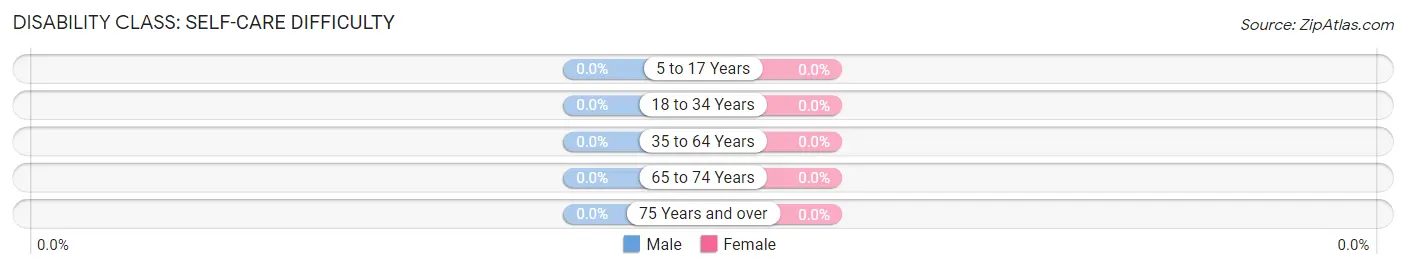
| Age Bracket | Male | Female |
| 5 to 17 Years | 0 (0.0%) | 0 (0.0%) |
| 18 to 34 Years | 0 (0.0%) | 0 (0.0%) |
| 35 to 64 Years | 0 (0.0%) | 0 (0.0%) |
| 65 to 74 Years | 0 (0.0%) | 0 (0.0%) |
| 75 Years and over | 0 (0.0%) | 0 (0.0%) |
Technology Access in Graceton
Computing Device Access in Graceton
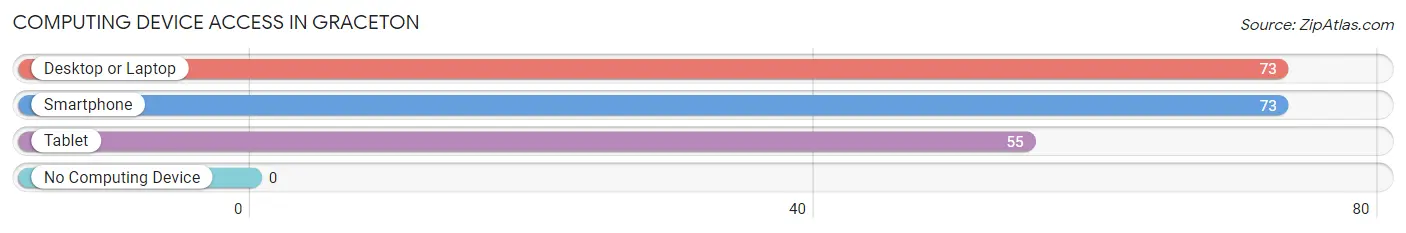
| Device Type | # Households | % Households |
| Desktop or Laptop | 73 | 100.0% |
| Smartphone | 73 | 100.0% |
| Tablet | 55 | 75.3% |
| No Computing Device | 0 | 0.0% |
| Total | 73 | 100.0% |
Internet Access in Graceton
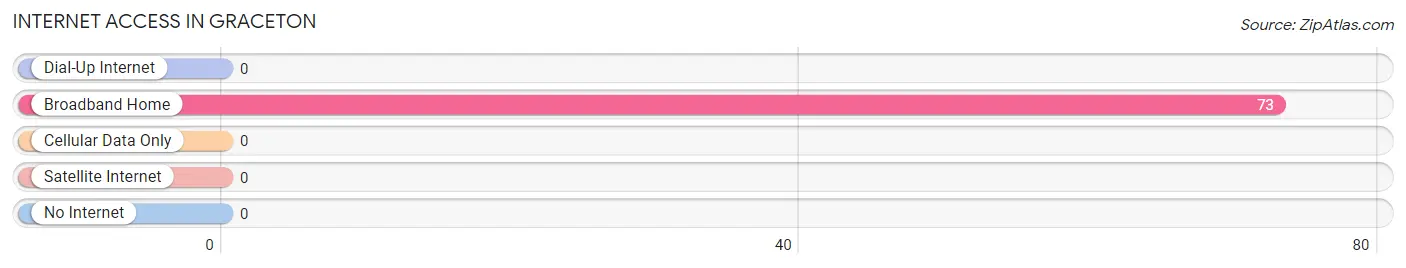
| Internet Type | # Households | % Households |
| Dial-Up Internet | 0 | 0.0% |
| Broadband Home | 73 | 100.0% |
| Cellular Data Only | 0 | 0.0% |
| Satellite Internet | 0 | 0.0% |
| No Internet | 0 | 0.0% |
| Total | 73 | 100.0% |
Graceton Summary
Graceton, Pennsylvania is a small borough located in Indiana County, Pennsylvania. It is situated in the foothills of the Allegheny Mountains, approximately 30 miles northeast of Pittsburgh. The borough was founded in 1876 and has a population of approximately 1,000 people.
Geography
Graceton is located in the foothills of the Allegheny Mountains, approximately 30 miles northeast of Pittsburgh. The borough is situated in a valley surrounded by hills and mountains. The terrain is mostly hilly and wooded, with some flat areas. The climate is humid continental, with cold winters and hot summers.
The borough is located in the Conemaugh River watershed. The Conemaugh River flows through the borough, and is a major source of water for the area. The borough is also home to several small creeks and streams, including the Little Conemaugh River, which flows through the borough.
Economy
Graceton is a small, rural borough with a limited economy. The primary industries in the borough are agriculture and tourism. The borough is home to several small farms, which produce a variety of crops, including corn, soybeans, hay, and wheat. The borough also has several small businesses, including a few restaurants, a grocery store, and a few small shops.
The borough is also home to several tourist attractions, including the Graceton Historical Society Museum, the Graceton Covered Bridge, and the Graceton Railroad Museum. The borough is also home to several parks, including the Graceton Park, which features a playground, picnic area, and walking trails.
Demographics
As of the 2010 census, the population of Graceton was 1,000 people. The racial makeup of the borough was 97.2% White, 0.7% African American, 0.2% Native American, 0.2% Asian, 0.2% from other races, and 1.7% from two or more races. Hispanic or Latino of any race were 0.7% of the population.
The median household income in the borough was $37,500, and the median family income was $45,000. The per capita income for the borough was $18,000. About 11.2% of families and 14.2% of the population were below the poverty line, including 18.2% of those under age 18 and 8.2% of those age 65 or over.
Conclusion
Graceton, Pennsylvania is a small borough located in Indiana County, Pennsylvania. It is situated in the foothills of the Allegheny Mountains, approximately 30 miles northeast of Pittsburgh. The borough was founded in 1876 and has a population of approximately 1,000 people. The primary industries in the borough are agriculture and tourism. The borough is home to several small farms, businesses, and tourist attractions. The racial makeup of the borough is mostly White, with a small percentage of African American, Native American, Asian, and other races. The median household income in the borough is $37,500, and the median family income is $45,000. The per capita income for the borough is $18,000.
Common Questions
What is Per Capita Income in Graceton?
Per Capita income in Graceton is $45,570.
What is the Median Family Income in Graceton?
Median Family Income in Graceton is $128,285.
What is Inequality or Gini Index in Graceton?
Inequality or Gini Index in Graceton is 0.28.
What is the Total Population of Graceton?
Total Population of Graceton is 150.
What is the Total Male Population of Graceton?
Total Male Population of Graceton is 83.
What is the Total Female Population of Graceton?
Total Female Population of Graceton is 67.
What is the Ratio of Males per 100 Females in Graceton?
There are 123.88 Males per 100 Females in Graceton.
What is the Ratio of Females per 100 Males in Graceton?
There are 80.72 Females per 100 Males in Graceton.
What is the Median Population Age in Graceton?
Median Population Age in Graceton is 64.5 Years.
What is the Average Family Size in Graceton
Average Family Size in Graceton is 2.1 People.
What is the Average Household Size in Graceton
Average Household Size in Graceton is 2.0 People.
How Large is the Labor Force in Graceton?
There are 73 People in the Labor Forcein in Graceton.
What is the Percentage of People in the Labor Force in Graceton?
48.7% of People are in the Labor Force in Graceton.