Zip Codes with the Highest Percentage of Families with Income Above $100,000 in Scranton, PA
RELATED REPORTS & OPTIONS
Family Income | $100k+
Scranton
Compare Zip Codes
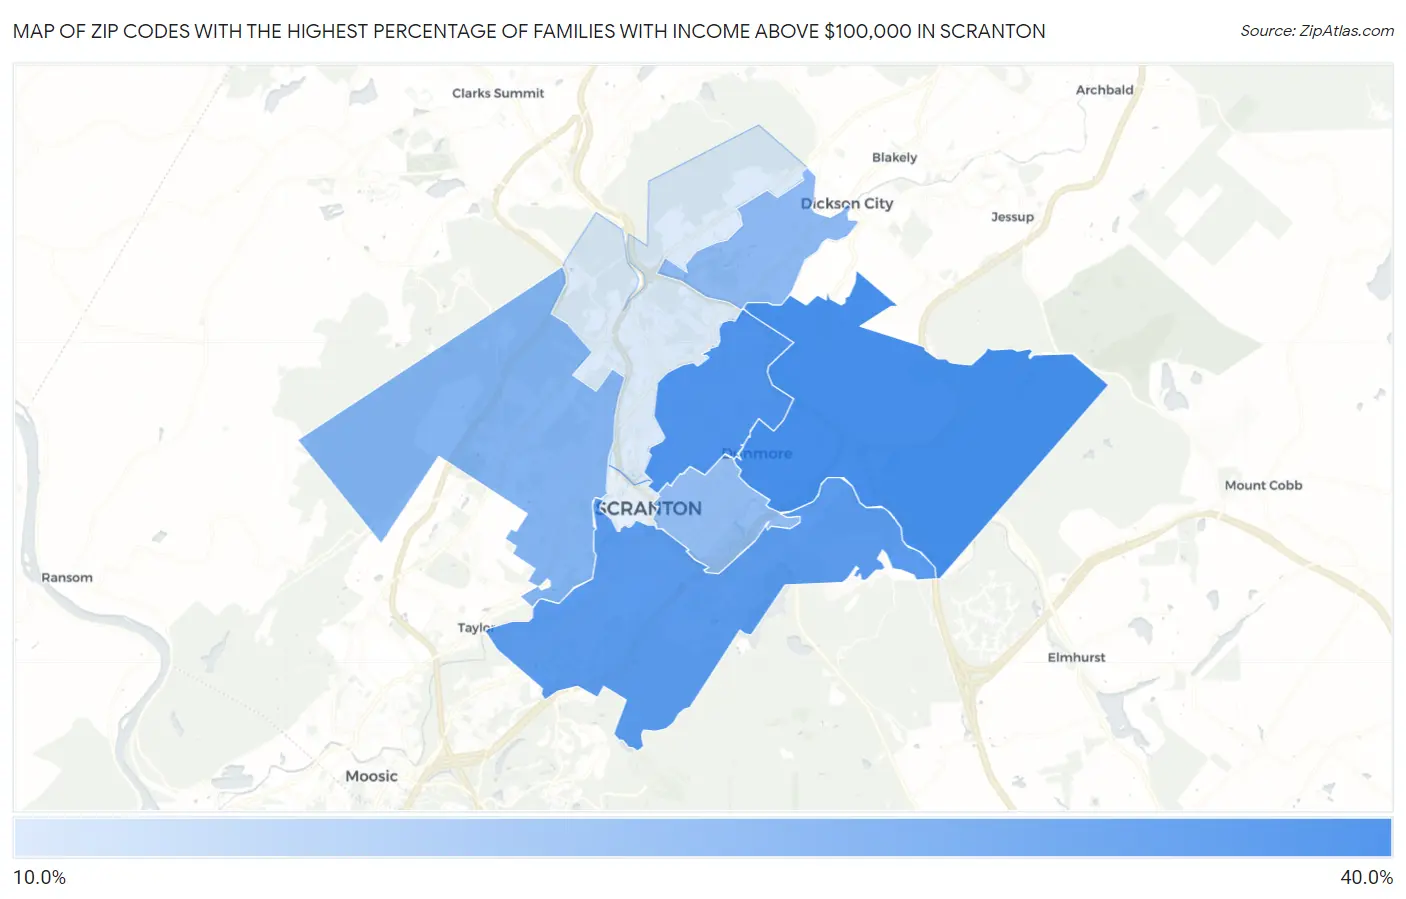
Map of Zip Codes with the Highest Percentage of Families with Income Above $100,000 in Scranton
19.7%
37.2%
Zip Codes with the Highest Percentage of Families with Income Above $100,000 in Scranton, PA
| Zip Code | Families with Income > $100k | vs State | vs National | |
| 1. | 18512 | 37.2% | 46.6%(-9.40)#920 | 46.1%(-8.90)#16,369 |
| 2. | 18509 | 36.0% | 46.6%(-10.6)#975 | 46.1%(-10.1)#17,195 |
| 3. | 18505 | 34.9% | 46.6%(-11.7)#1,019 | 46.1%(-11.2)#17,960 |
| 4. | 18504 | 29.9% | 46.6%(-16.7)#1,237 | 46.1%(-16.2)#21,478 |
| 5. | 18519 | 28.9% | 46.6%(-17.7)#1,286 | 46.1%(-17.2)#22,183 |
| 6. | 18510 | 27.9% | 46.6%(-18.7)#1,326 | 46.1%(-18.2)#22,839 |
| 7. | 18508 | 19.7% | 46.6%(-26.9)#1,546 | 46.1%(-26.4)#27,365 |
1
Common Questions
What are the Top 5 Zip Codes with the Highest Percentage of Families with Income Above $100,000 in Scranton, PA?
Top 5 Zip Codes with the Highest Percentage of Families with Income Above $100,000 in Scranton, PA are:
What zip code has the Highest Percentage of Families with Income Above $100,000 in Scranton, PA?
18512 has the Highest Percentage of Families with Income Above $100,000 in Scranton, PA with 37.2%.
What is the Percentage of Families with Income Above $100,000 in Scranton, PA?
Percentage of Families with Income Above $100,000 in Scranton is 29.1%.
What is the Percentage of Families with Income Above $100,000 in Pennsylvania?
Percentage of Families with Income Above $100,000 in Pennsylvania is 46.6%.
What is the Percentage of Families with Income Above $100,000 in the United States?
Percentage of Families with Income Above $100,000 in the United States is 46.1%.