North Zanesville, OH Map & Demographics
North Zanesville Map
North Zanesville Overview
$49,805
PER CAPITA INCOME
$126,250
AVG FAMILY INCOME
$100,156
AVG HOUSEHOLD INCOME
22.7%
WAGE / INCOME GAP [ % ]
77.3¢/ $1
WAGE / INCOME GAP [ $ ]
0.40
INEQUALITY / GINI INDEX
2,633
TOTAL POPULATION
1,286
MALE POPULATION
1,347
FEMALE POPULATION
95.47
MALES / 100 FEMALES
104.74
FEMALES / 100 MALES
54.1
MEDIAN AGE
2.6
AVG FAMILY SIZE
2.2
AVG HOUSEHOLD SIZE
1,322
LABOR FORCE [ PEOPLE ]
58.7%
PERCENT IN LABOR FORCE
3.1%
UNEMPLOYMENT RATE
Income in North Zanesville
Income Overview in North Zanesville
Per Capita Income in North Zanesville is $49,805, while median incomes of families and households are $126,250 and $100,156 respectively.
| Characteristic | Number | Measure |
| Per Capita Income | 2,633 | $49,805 |
| Median Family Income | 822 | $126,250 |
| Mean Family Income | 822 | $137,267 |
| Median Household Income | 1,196 | $100,156 |
| Mean Household Income | 1,196 | $110,695 |
| Income Deficit | 822 | $0 |
| Wage / Income Gap (%) | 2,633 | 22.70% |
| Wage / Income Gap ($) | 2,633 | 77.30¢ per $1 |
| Gini / Inequality Index | 2,633 | 0.40 |
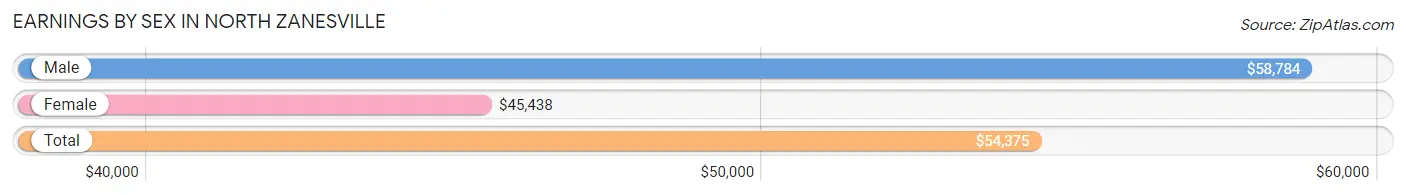
Earnings by Sex in North Zanesville
Average Earnings in North Zanesville are $54,375, $58,784 for men and $45,438 for women, a difference of 22.7%.
| Sex | Number | Average Earnings |
| Male | 744 (53.3%) | $58,784 |
| Female | 651 (46.7%) | $45,438 |
| Total | 1,395 (100.0%) | $54,375 |
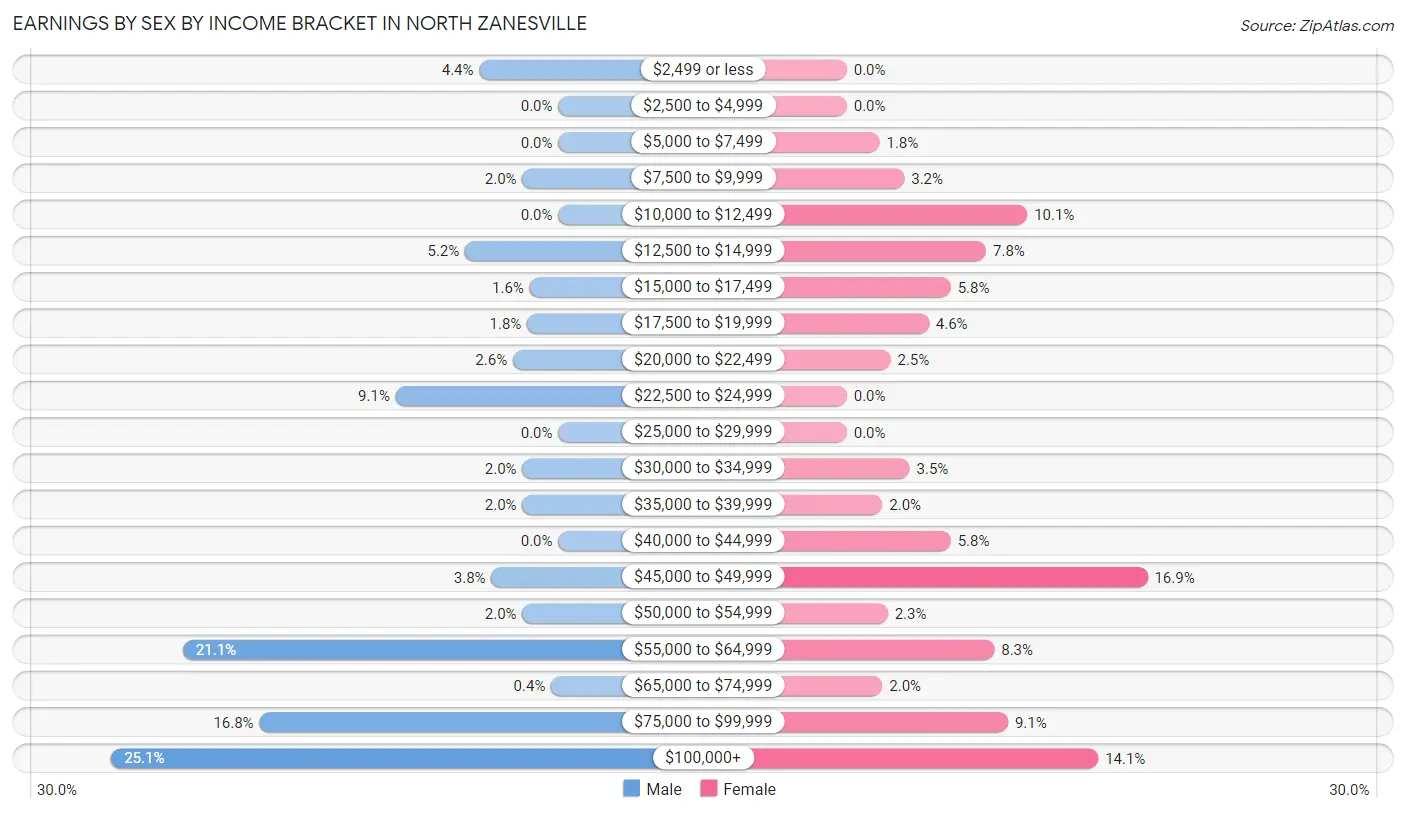
Earnings by Sex by Income Bracket in North Zanesville
The most common earnings brackets in North Zanesville are $100,000+ for men (187 | 25.1%) and $45,000 to $49,999 for women (110 | 16.9%).
| Income | Male | Female |
| $2,499 or less | 33 (4.4%) | 0 (0.0%) |
| $2,500 to $4,999 | 0 (0.0%) | 0 (0.0%) |
| $5,000 to $7,499 | 0 (0.0%) | 12 (1.8%) |
| $7,500 to $9,999 | 15 (2.0%) | 21 (3.2%) |
| $10,000 to $12,499 | 0 (0.0%) | 66 (10.1%) |
| $12,500 to $14,999 | 39 (5.2%) | 51 (7.8%) |
| $15,000 to $17,499 | 12 (1.6%) | 38 (5.8%) |
| $17,500 to $19,999 | 13 (1.8%) | 30 (4.6%) |
| $20,000 to $22,499 | 19 (2.5%) | 16 (2.5%) |
| $22,500 to $24,999 | 68 (9.1%) | 0 (0.0%) |
| $25,000 to $29,999 | 0 (0.0%) | 0 (0.0%) |
| $30,000 to $34,999 | 15 (2.0%) | 23 (3.5%) |
| $35,000 to $39,999 | 15 (2.0%) | 13 (2.0%) |
| $40,000 to $44,999 | 0 (0.0%) | 38 (5.8%) |
| $45,000 to $49,999 | 28 (3.8%) | 110 (16.9%) |
| $50,000 to $54,999 | 15 (2.0%) | 15 (2.3%) |
| $55,000 to $64,999 | 157 (21.1%) | 54 (8.3%) |
| $65,000 to $74,999 | 3 (0.4%) | 13 (2.0%) |
| $75,000 to $99,999 | 125 (16.8%) | 59 (9.1%) |
| $100,000+ | 187 (25.1%) | 92 (14.1%) |
| Total | 744 (100.0%) | 651 (100.0%) |
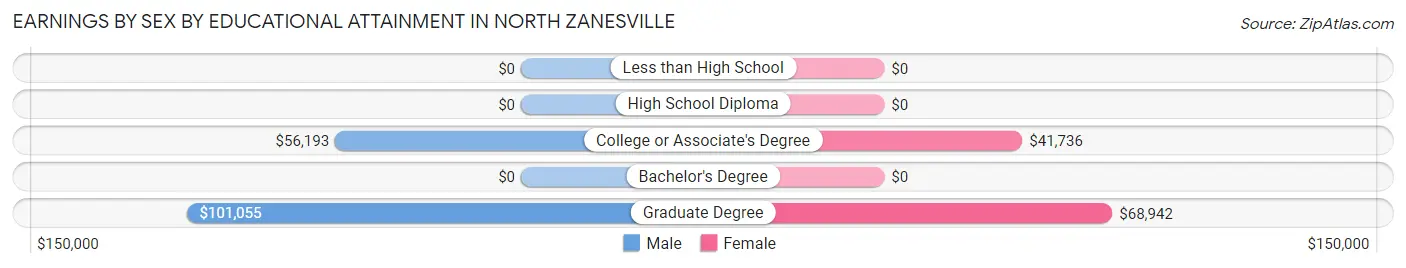
Earnings by Sex by Educational Attainment in North Zanesville
Average earnings in North Zanesville are $60,950 for men and $45,438 for women, a difference of 25.5%. Men with an educational attainment of graduate degree enjoy the highest average annual earnings of $101,055, while those with college or associate's degree education earn the least with $56,193. Women with an educational attainment of graduate degree earn the most with the average annual earnings of $68,942, while those with college or associate's degree education have the smallest earnings of $41,736.
| Educational Attainment | Male Income | Female Income |
| Less than High School | - | - |
| High School Diploma | - | - |
| College or Associate's Degree | $56,193 | $41,736 |
| Bachelor's Degree | - | - |
| Graduate Degree | $101,055 | $68,942 |
| Total | $60,950 | $45,438 |
Family Income in North Zanesville
Family Income Brackets in North Zanesville
According to the North Zanesville family income data, there are 240 families falling into the $200,000+ income range, which is the most common income bracket and makes up 29.2% of all families.
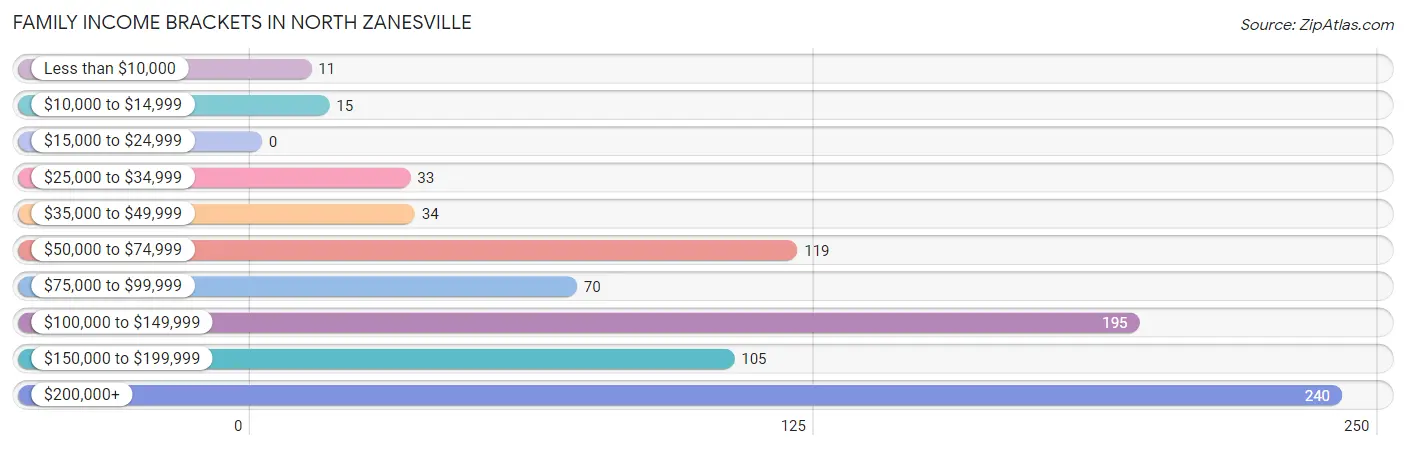
| Income Bracket | # Families | % Families |
| Less than $10,000 | 11 | 1.3% |
| $10,000 to $14,999 | 15 | 1.8% |
| $15,000 to $24,999 | 0 | 0.0% |
| $25,000 to $34,999 | 33 | 4.0% |
| $35,000 to $49,999 | 34 | 4.1% |
| $50,000 to $74,999 | 119 | 14.5% |
| $75,000 to $99,999 | 70 | 8.5% |
| $100,000 to $149,999 | 195 | 23.7% |
| $150,000 to $199,999 | 105 | 12.8% |
| $200,000+ | 240 | 29.2% |
Family Income by Famaliy Size in North Zanesville
4-person families (131 | 15.9%) account for the highest median family income in North Zanesville with $223,139 per family, while 4-person families (131 | 15.9%) have the highest median income of $55,785 per family member.
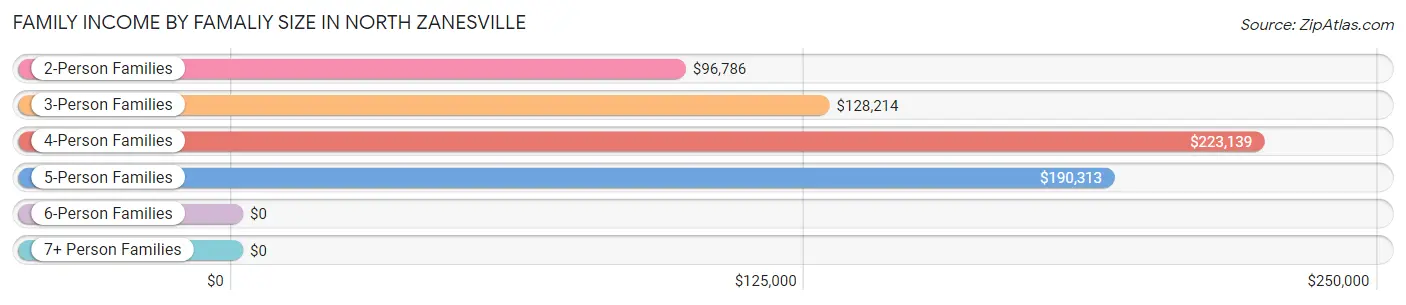
| Income Bracket | # Families | Median Income |
| 2-Person Families | 466 (56.7%) | $96,786 |
| 3-Person Families | 192 (23.4%) | $128,214 |
| 4-Person Families | 131 (15.9%) | $223,139 |
| 5-Person Families | 33 (4.0%) | $190,313 |
| 6-Person Families | 0 (0.0%) | $0 |
| 7+ Person Families | 0 (0.0%) | $0 |
| Total | 822 (100.0%) | $126,250 |
Family Income by Number of Earners in North Zanesville
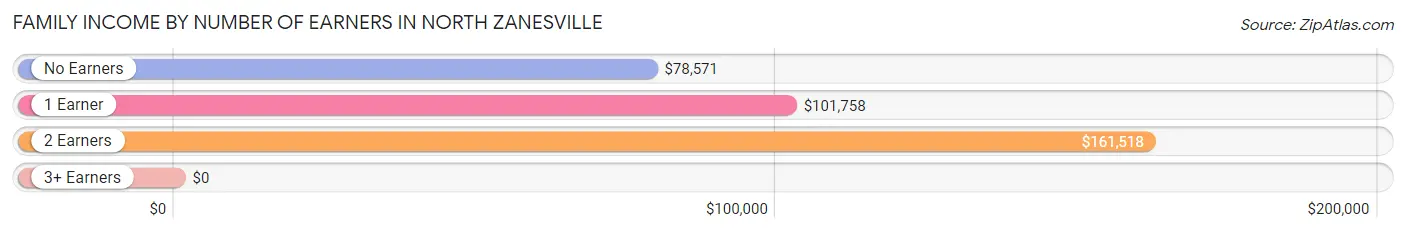
| Number of Earners | # Families | Median Income |
| No Earners | 192 (23.4%) | $78,571 |
| 1 Earner | 109 (13.3%) | $101,758 |
| 2 Earners | 495 (60.2%) | $161,518 |
| 3+ Earners | 26 (3.2%) | $0 |
| Total | 822 (100.0%) | $126,250 |
Household Income in North Zanesville
Household Income Brackets in North Zanesville
With 248 households falling in the category, the $100,000 to $149,999 income range is the most frequent in North Zanesville, accounting for 20.7% of all households.
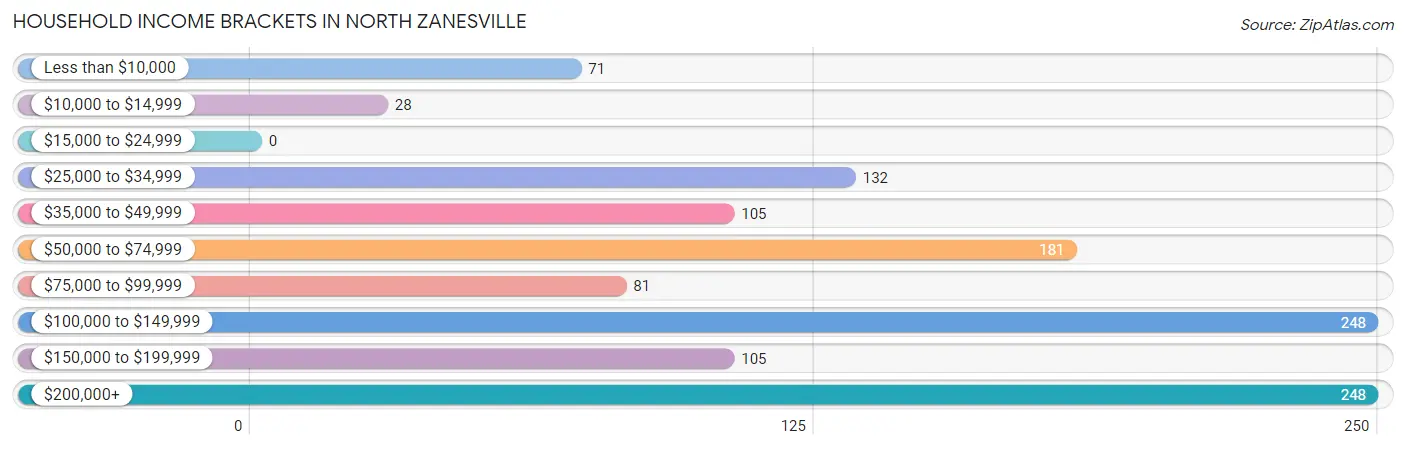
| Income Bracket | # Households | % Households |
| Less than $10,000 | 71 | 5.9% |
| $10,000 to $14,999 | 28 | 2.3% |
| $15,000 to $24,999 | 0 | 0.0% |
| $25,000 to $34,999 | 132 | 11.0% |
| $35,000 to $49,999 | 105 | 8.8% |
| $50,000 to $74,999 | 181 | 15.1% |
| $75,000 to $99,999 | 81 | 6.8% |
| $100,000 to $149,999 | 248 | 20.7% |
| $150,000 to $199,999 | 105 | 8.8% |
| $200,000+ | 248 | 20.7% |
Household Income by Householder Age in North Zanesville
The median household income in North Zanesville is $100,156, with the highest median household income of $138,750 found in the 25 to 44 years age bracket for the primary householder. A total of 242 households (20.2%) fall into this category. Meanwhile, the 15 to 24 years age bracket for the primary householder has the lowest median household income of $0, with 50 households (4.2%) in this group.
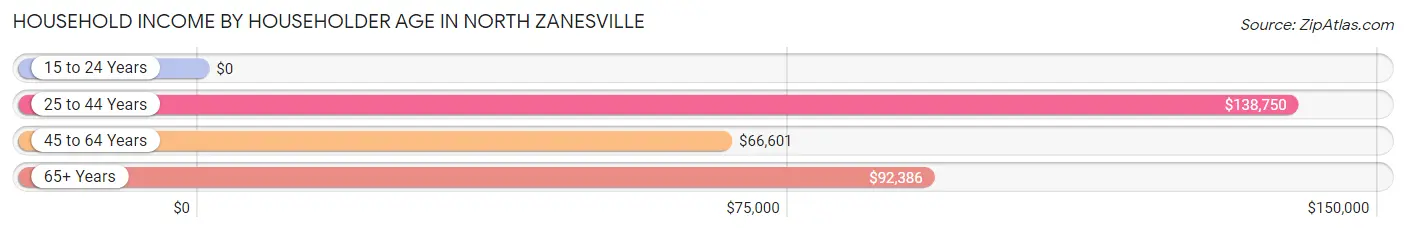
| Income Bracket | # Households | Median Income |
| 15 to 24 Years | 50 (4.2%) | $0 |
| 25 to 44 Years | 242 (20.2%) | $138,750 |
| 45 to 64 Years | 411 (34.4%) | $66,601 |
| 65+ Years | 493 (41.2%) | $92,386 |
| Total | 1,196 (100.0%) | $100,156 |
Poverty in North Zanesville
Income Below Poverty by Sex and Age in North Zanesville
With 3.1% poverty level for males and 7.9% for females among the residents of North Zanesville, 25 to 34 year old males and 18 to 24 year old females are the most vulnerable to poverty, with 14 males (9.9%) and 22 females (62.9%) in their respective age groups living below the poverty level.
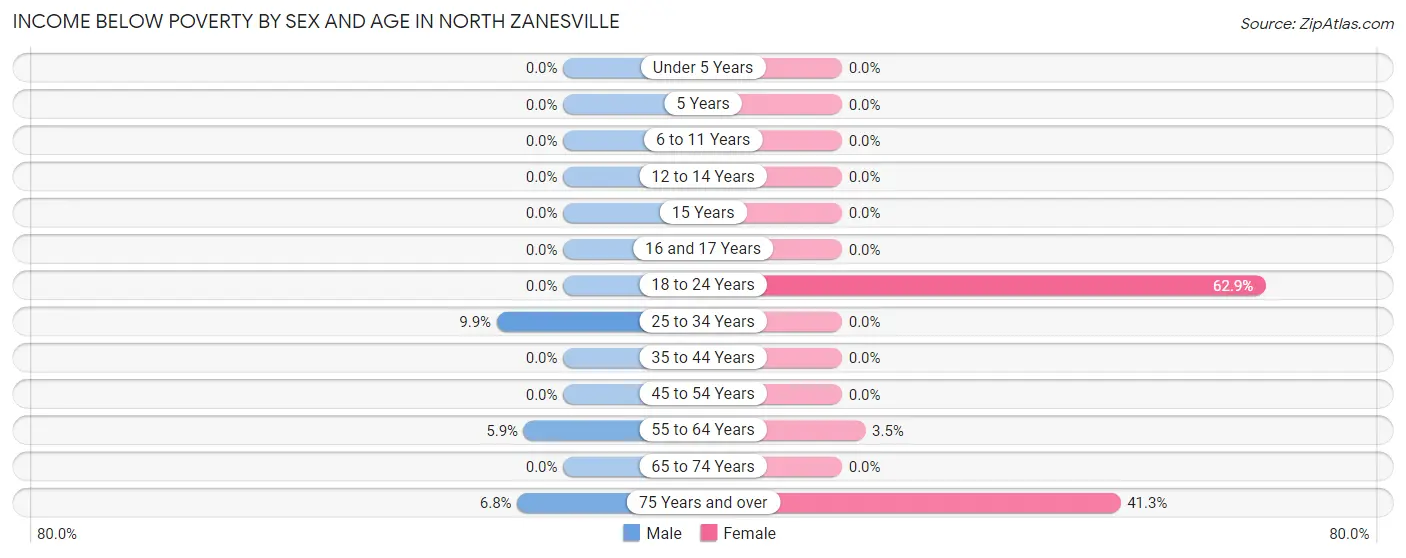
| Age Bracket | Male | Female |
| Under 5 Years | 0 (0.0%) | 0 (0.0%) |
| 5 Years | 0 (0.0%) | 0 (0.0%) |
| 6 to 11 Years | 0 (0.0%) | 0 (0.0%) |
| 12 to 14 Years | 0 (0.0%) | 0 (0.0%) |
| 15 Years | 0 (0.0%) | 0 (0.0%) |
| 16 and 17 Years | 0 (0.0%) | 0 (0.0%) |
| 18 to 24 Years | 0 (0.0%) | 22 (62.9%) |
| 25 to 34 Years | 14 (9.9%) | 0 (0.0%) |
| 35 to 44 Years | 0 (0.0%) | 0 (0.0%) |
| 45 to 54 Years | 0 (0.0%) | 0 (0.0%) |
| 55 to 64 Years | 11 (5.9%) | 10 (3.5%) |
| 65 to 74 Years | 0 (0.0%) | 0 (0.0%) |
| 75 Years and over | 15 (6.8%) | 74 (41.3%) |
| Total | 40 (3.1%) | 106 (7.9%) |
Income Above Poverty by Sex and Age in North Zanesville
According to the poverty statistics in North Zanesville, males aged under 5 years and females aged under 5 years are the age groups that are most secure financially, with 100.0% of males and 100.0% of females in these age groups living above the poverty line.
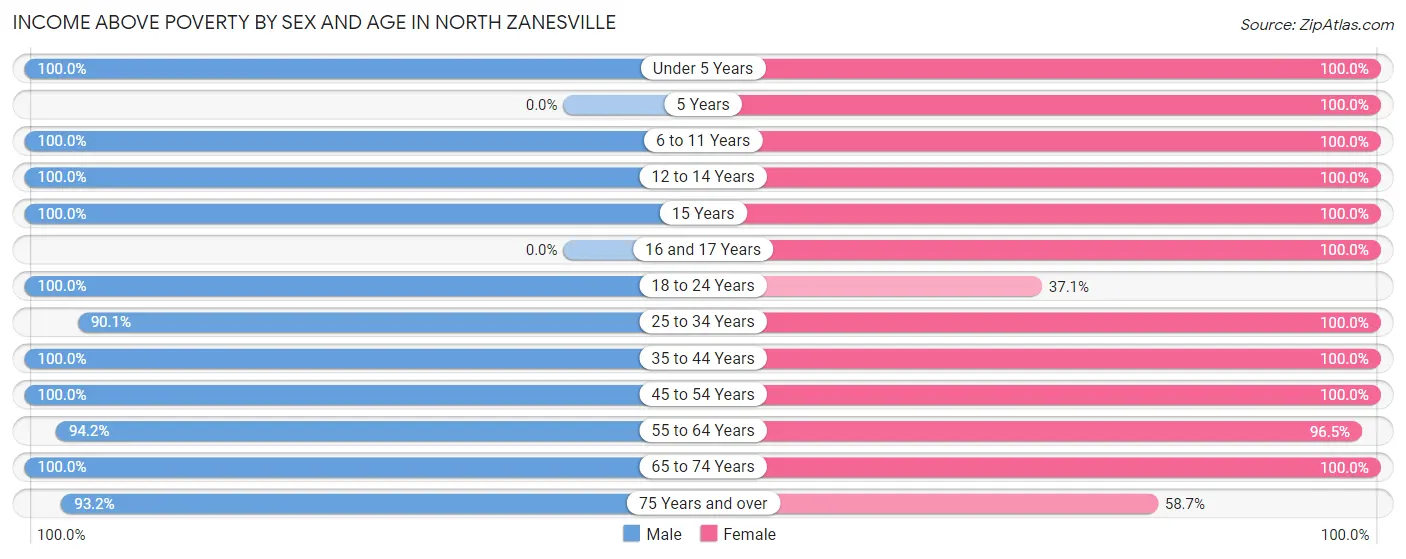
| Age Bracket | Male | Female |
| Under 5 Years | 77 (100.0%) | 69 (100.0%) |
| 5 Years | 0 (0.0%) | 20 (100.0%) |
| 6 to 11 Years | 20 (100.0%) | 48 (100.0%) |
| 12 to 14 Years | 36 (100.0%) | 43 (100.0%) |
| 15 Years | 53 (100.0%) | 15 (100.0%) |
| 16 and 17 Years | 0 (0.0%) | 9 (100.0%) |
| 18 to 24 Years | 72 (100.0%) | 13 (37.1%) |
| 25 to 34 Years | 128 (90.1%) | 95 (100.0%) |
| 35 to 44 Years | 174 (100.0%) | 177 (100.0%) |
| 45 to 54 Years | 125 (100.0%) | 125 (100.0%) |
| 55 to 64 Years | 177 (94.2%) | 279 (96.5%) |
| 65 to 74 Years | 179 (100.0%) | 243 (100.0%) |
| 75 Years and over | 205 (93.2%) | 105 (58.7%) |
| Total | 1,246 (96.9%) | 1,241 (92.1%) |
Income Below Poverty Among Married-Couple Families in North Zanesville
The poverty statistics for married-couple families in North Zanesville show that 3.2% or 26 of the total 804 families live below the poverty line. Families with no children have the highest poverty rate of 4.2%, comprising of 26 families. On the other hand, families with 1 or 2 children have the lowest poverty rate of 0.0%, which includes 0 families.
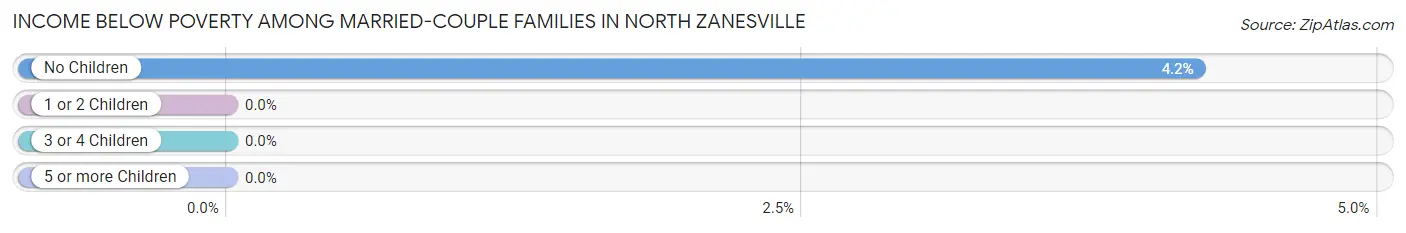
| Children | Above Poverty | Below Poverty |
| No Children | 592 (95.8%) | 26 (4.2%) |
| 1 or 2 Children | 171 (100.0%) | 0 (0.0%) |
| 3 or 4 Children | 15 (100.0%) | 0 (0.0%) |
| 5 or more Children | 0 (0.0%) | 0 (0.0%) |
| Total | 778 (96.8%) | 26 (3.2%) |
Income Below Poverty Among Single-Parent Households in North Zanesville
| Children | Single Father | Single Mother |
| No Children | 0 (0.0%) | 0 (0.0%) |
| 1 or 2 Children | 0 (0.0%) | 0 (0.0%) |
| 3 or 4 Children | 0 (0.0%) | 0 (0.0%) |
| 5 or more Children | 0 (0.0%) | 0 (0.0%) |
| Total | 0 (0.0%) | 0 (0.0%) |
Income Below Poverty Among Married-Couple vs Single-Parent Households in North Zanesville
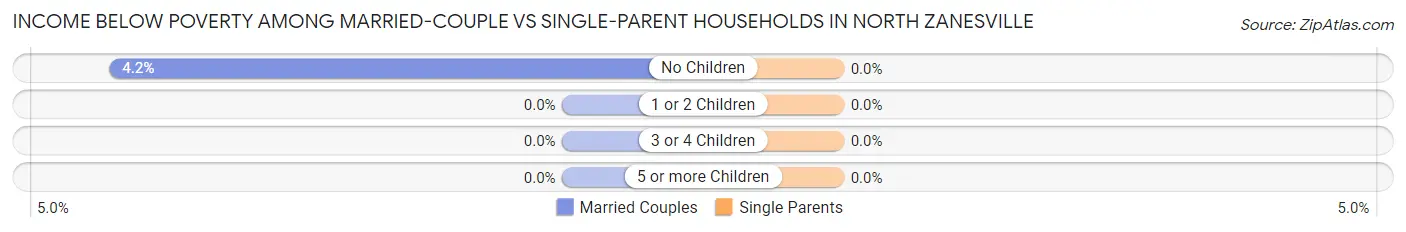
| Children | Married-Couple Families | Single-Parent Households |
| No Children | 26 (4.2%) | 0 (0.0%) |
| 1 or 2 Children | 0 (0.0%) | 0 (0.0%) |
| 3 or 4 Children | 0 (0.0%) | 0 (0.0%) |
| 5 or more Children | 0 (0.0%) | 0 (0.0%) |
| Total | 26 (3.2%) | 0 (0.0%) |
Race in North Zanesville
The most populous races in North Zanesville are White / Caucasian (2,061 | 78.3%), Two or more Races (414 | 15.7%), and Hispanic or Latino (326 | 12.4%).
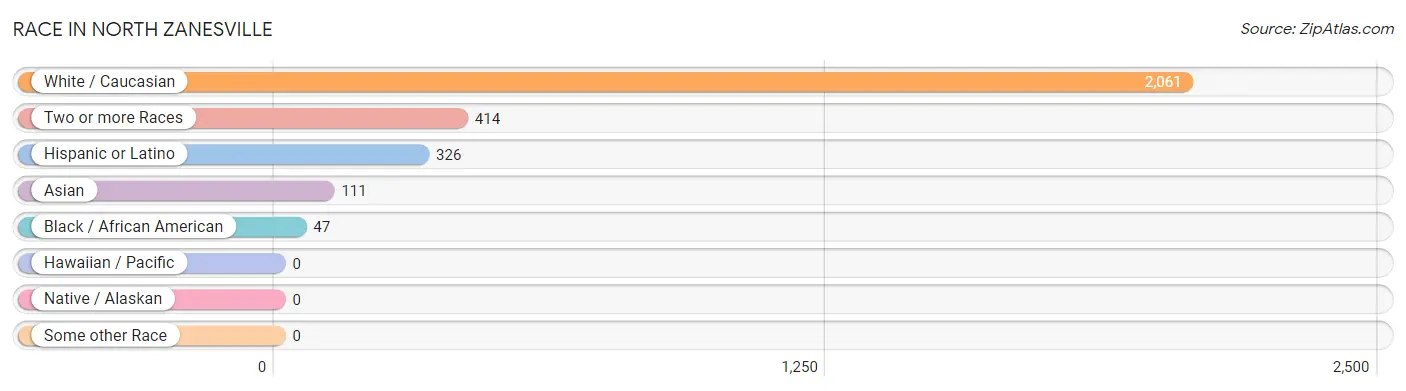
| Race | # Population | % Population |
| Asian | 111 | 4.2% |
| Black / African American | 47 | 1.8% |
| Hawaiian / Pacific | 0 | 0.0% |
| Hispanic or Latino | 326 | 12.4% |
| Native / Alaskan | 0 | 0.0% |
| White / Caucasian | 2,061 | 78.3% |
| Two or more Races | 414 | 15.7% |
| Some other Race | 0 | 0.0% |
| Total | 2,633 | 100.0% |
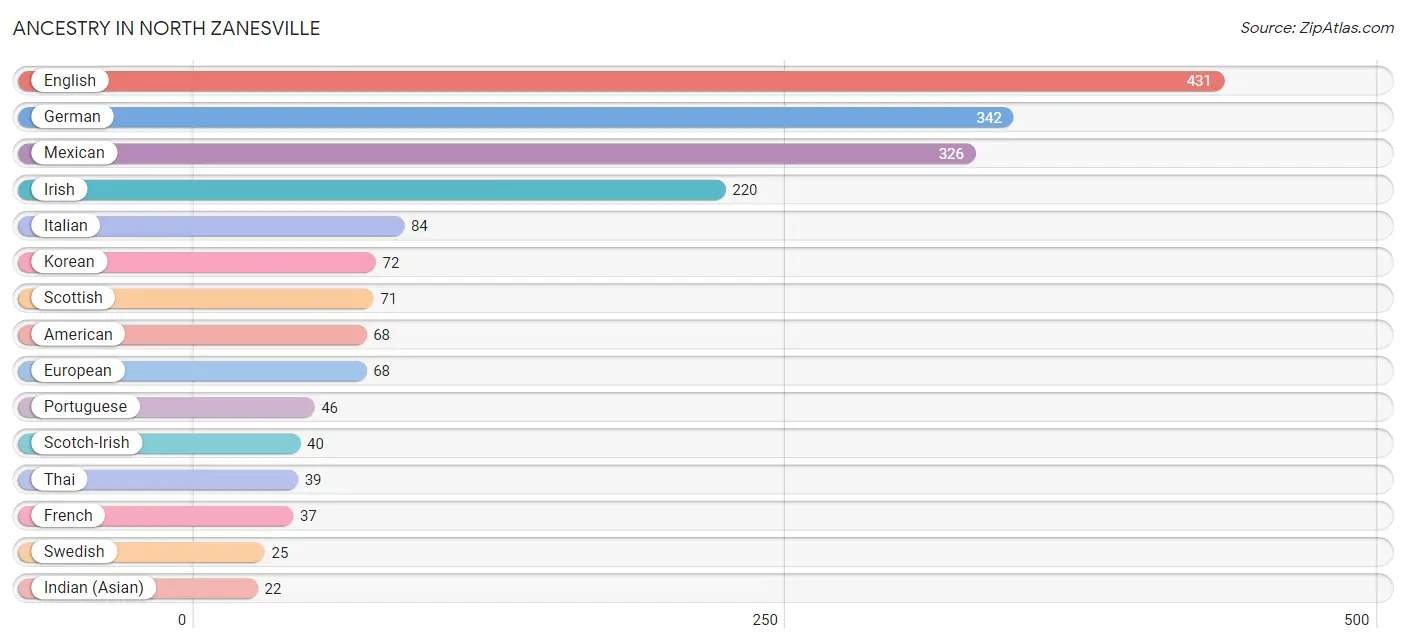
Ancestry in North Zanesville
The most populous ancestries reported in North Zanesville are English (431 | 16.4%), German (342 | 13.0%), Mexican (326 | 12.4%), Irish (220 | 8.4%), and Italian (84 | 3.2%), together accounting for 53.3% of all North Zanesville residents.
| Ancestry | # Population | % Population |
| American | 68 | 2.6% |
| Arab | 19 | 0.7% |
| Brazilian | 13 | 0.5% |
| Czech | 14 | 0.5% |
| Dutch | 8 | 0.3% |
| English | 431 | 16.4% |
| European | 68 | 2.6% |
| French | 37 | 1.4% |
| German | 342 | 13.0% |
| Greek | 15 | 0.6% |
| Hungarian | 12 | 0.5% |
| Indian (Asian) | 22 | 0.8% |
| Irish | 220 | 8.4% |
| Italian | 84 | 3.2% |
| Korean | 72 | 2.7% |
| Lebanese | 19 | 0.7% |
| Mexican | 326 | 12.4% |
| Norwegian | 15 | 0.6% |
| Polish | 22 | 0.8% |
| Portuguese | 46 | 1.8% |
| Scotch-Irish | 40 | 1.5% |
| Scottish | 71 | 2.7% |
| Swedish | 25 | 0.9% |
| Swiss | 19 | 0.7% |
| Thai | 39 | 1.5% | View All 25 Rows |
Immigrants in North Zanesville
The most numerous immigrant groups reported in North Zanesville came from Latin America (216 | 8.2%), Central America (183 | 7.0%), Mexico (183 | 7.0%), Asia (101 | 3.8%), and South Eastern Asia (72 | 2.7%), together accounting for 28.7% of all North Zanesville residents.
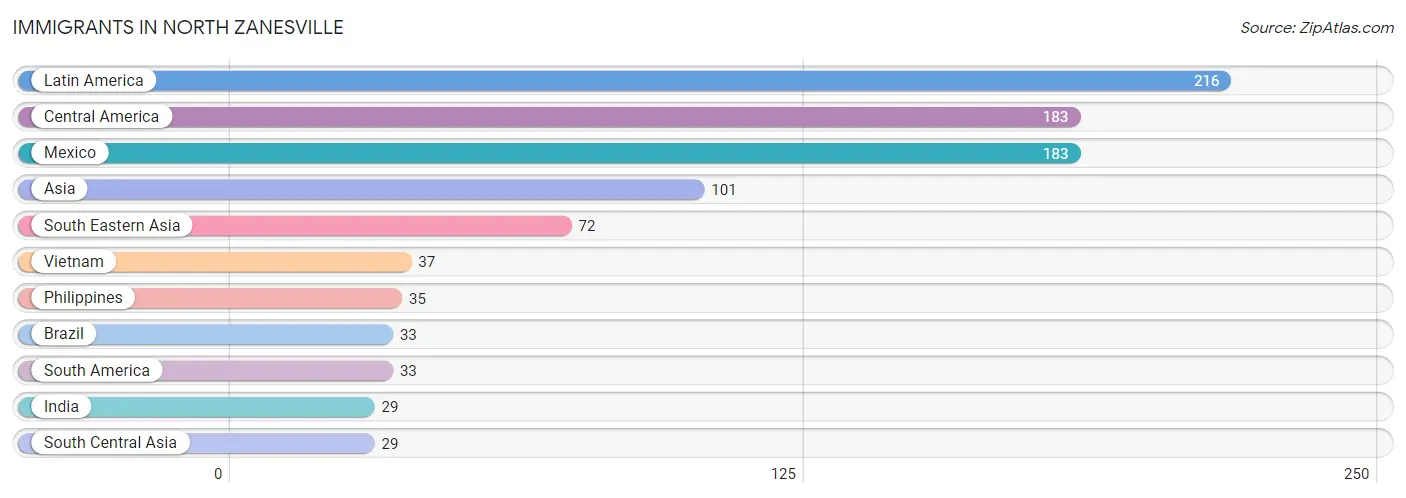
| Immigration Origin | # Population | % Population |
| Asia | 101 | 3.8% |
| Brazil | 33 | 1.3% |
| Central America | 183 | 7.0% |
| India | 29 | 1.1% |
| Latin America | 216 | 8.2% |
| Mexico | 183 | 7.0% |
| Philippines | 35 | 1.3% |
| South America | 33 | 1.3% |
| South Central Asia | 29 | 1.1% |
| South Eastern Asia | 72 | 2.7% |
| Vietnam | 37 | 1.4% | View All 11 Rows |
Sex and Age in North Zanesville
Sex and Age in North Zanesville
The most populous age groups in North Zanesville are 60 to 64 Years (158 | 12.3%) for men and 60 to 64 Years (267 | 19.8%) for women.
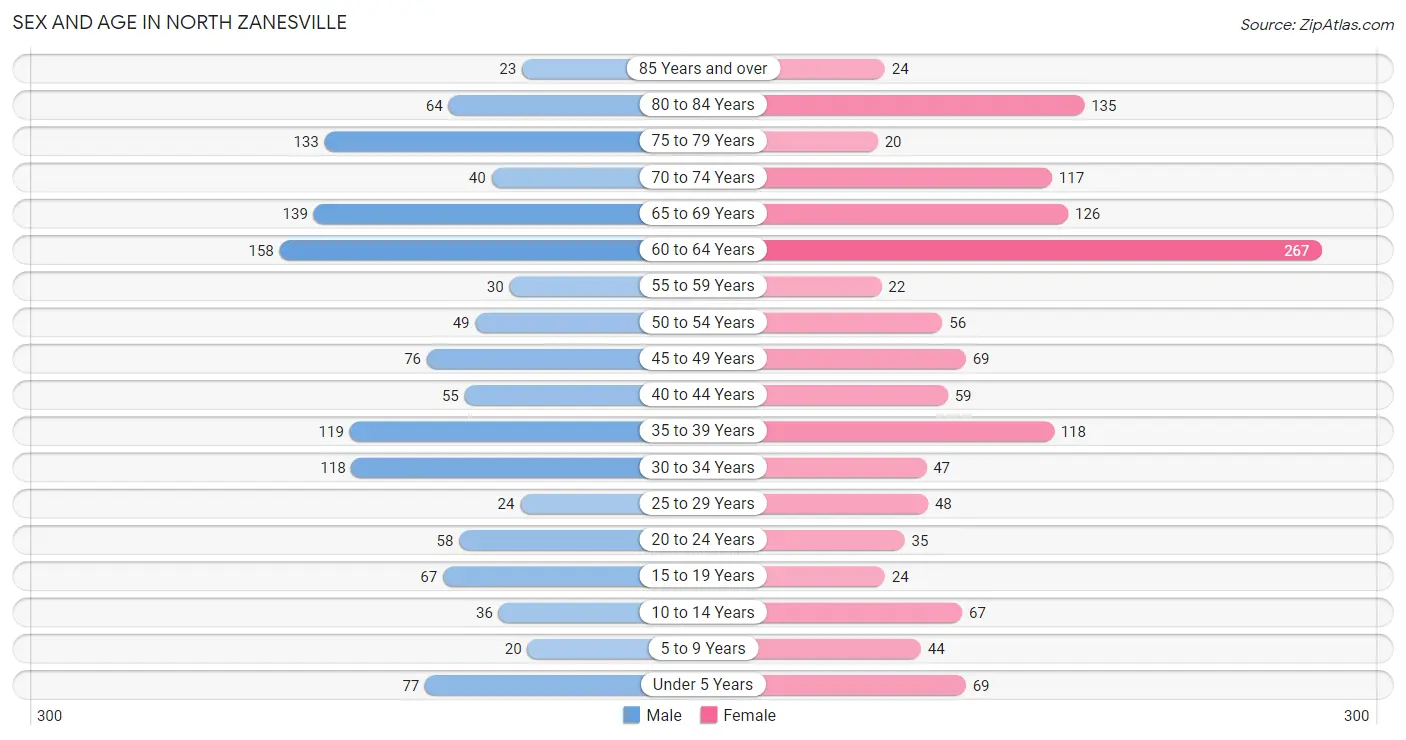
| Age Bracket | Male | Female |
| Under 5 Years | 77 (6.0%) | 69 (5.1%) |
| 5 to 9 Years | 20 (1.6%) | 44 (3.3%) |
| 10 to 14 Years | 36 (2.8%) | 67 (5.0%) |
| 15 to 19 Years | 67 (5.2%) | 24 (1.8%) |
| 20 to 24 Years | 58 (4.5%) | 35 (2.6%) |
| 25 to 29 Years | 24 (1.9%) | 48 (3.6%) |
| 30 to 34 Years | 118 (9.2%) | 47 (3.5%) |
| 35 to 39 Years | 119 (9.2%) | 118 (8.8%) |
| 40 to 44 Years | 55 (4.3%) | 59 (4.4%) |
| 45 to 49 Years | 76 (5.9%) | 69 (5.1%) |
| 50 to 54 Years | 49 (3.8%) | 56 (4.2%) |
| 55 to 59 Years | 30 (2.3%) | 22 (1.6%) |
| 60 to 64 Years | 158 (12.3%) | 267 (19.8%) |
| 65 to 69 Years | 139 (10.8%) | 126 (9.3%) |
| 70 to 74 Years | 40 (3.1%) | 117 (8.7%) |
| 75 to 79 Years | 133 (10.3%) | 20 (1.5%) |
| 80 to 84 Years | 64 (5.0%) | 135 (10.0%) |
| 85 Years and over | 23 (1.8%) | 24 (1.8%) |
| Total | 1,286 (100.0%) | 1,347 (100.0%) |
Families and Households in North Zanesville
Median Family Size in North Zanesville
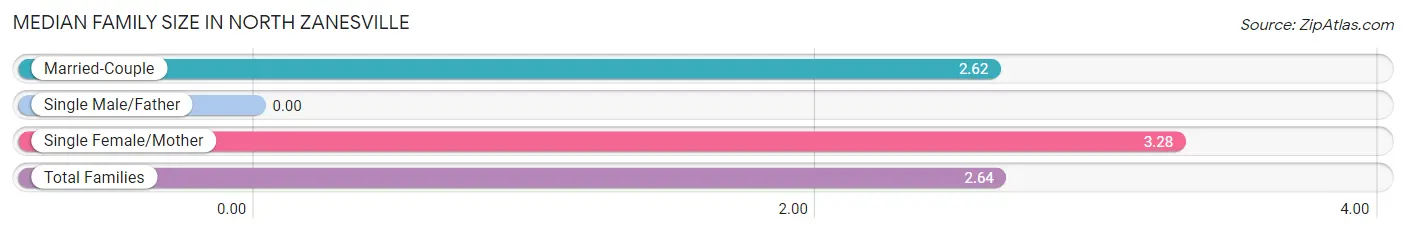
| Family Type | # Families | Family Size |
| Married-Couple | 804 (97.8%) | 2.62 |
| Single Male/Father | 0 (0.0%) | - |
| Single Female/Mother | 18 (2.2%) | 3.28 |
| Total Families | 822 (100.0%) | 2.64 |
Median Household Size in North Zanesville
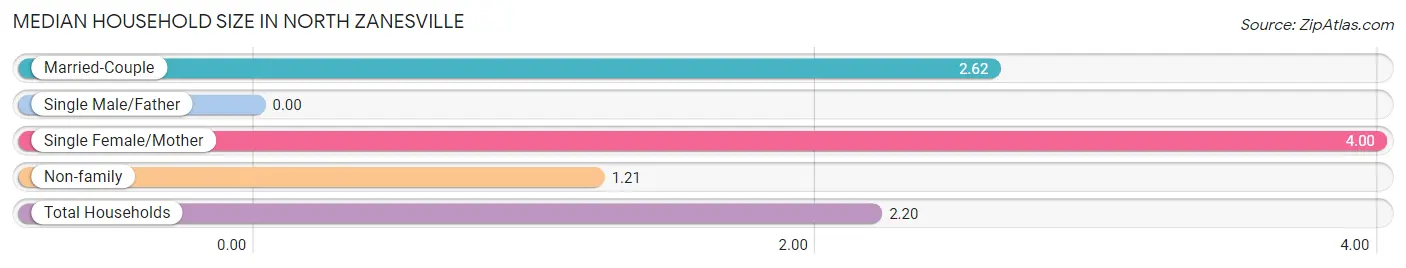
| Household Type | # Households | Household Size |
| Married-Couple | 804 (67.2%) | 2.62 |
| Single Male/Father | 0 (0.0%) | - |
| Single Female/Mother | 18 (1.5%) | 4.00 |
| Non-family | 374 (31.3%) | 1.21 |
| Total Households | 1,196 (100.0%) | 2.20 |
Household Size by Marriage Status in North Zanesville
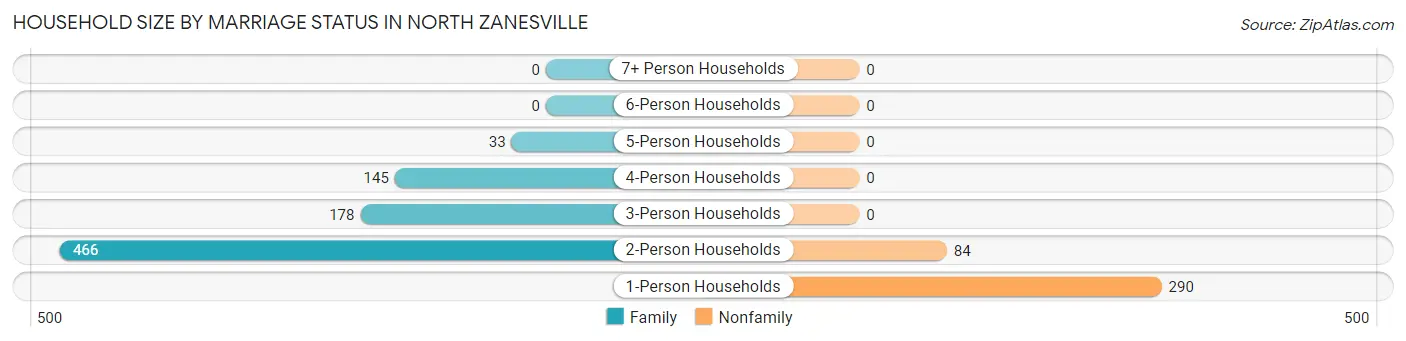
Out of a total of 1,196 households in North Zanesville, 822 (68.7%) are family households, while 374 (31.3%) are nonfamily households. The most numerous type of family households are 2-person households, comprising 466, and the most common type of nonfamily households are 1-person households, comprising 290.
| Household Size | Family Households | Nonfamily Households |
| 1-Person Households | - | 290 (24.2%) |
| 2-Person Households | 466 (39.0%) | 84 (7.0%) |
| 3-Person Households | 178 (14.9%) | 0 (0.0%) |
| 4-Person Households | 145 (12.1%) | 0 (0.0%) |
| 5-Person Households | 33 (2.8%) | 0 (0.0%) |
| 6-Person Households | 0 (0.0%) | 0 (0.0%) |
| 7+ Person Households | 0 (0.0%) | 0 (0.0%) |
| Total | 822 (68.7%) | 374 (31.3%) |
Female Fertility in North Zanesville
Fertility by Age in North Zanesville
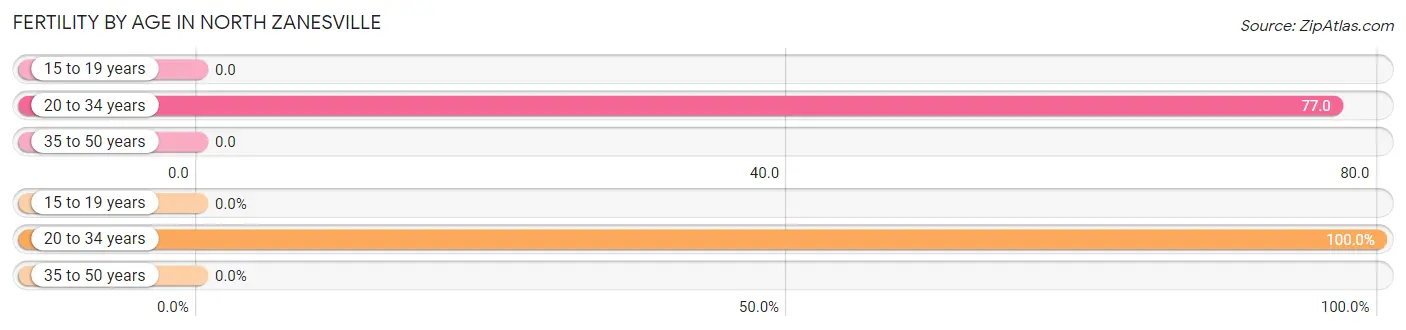
Average fertility rate in North Zanesville is 25.0 births per 1,000 women. Women in the age bracket of 20 to 34 years have the highest fertility rate with 77.0 births per 1,000 women. Women in the age bracket of 20 to 34 years acount for 100.0% of all women with births.
| Age Bracket | Women with Births | Births / 1,000 Women |
| 15 to 19 years | 0 (0.0%) | 0.0 |
| 20 to 34 years | 10 (100.0%) | 77.0 |
| 35 to 50 years | 0 (0.0%) | 0.0 |
| Total | 10 (100.0%) | 25.0 |
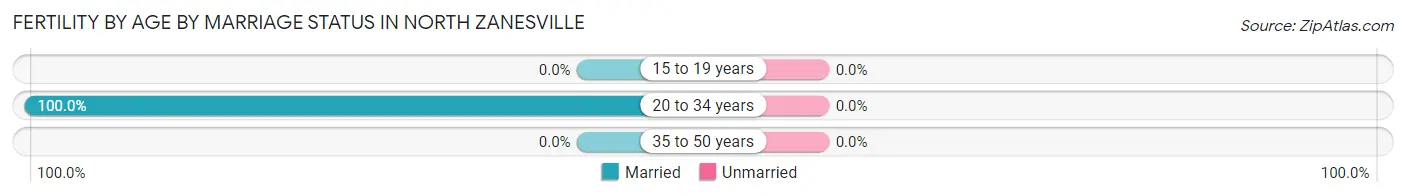
Fertility by Age by Marriage Status in North Zanesville
| Age Bracket | Married | Unmarried |
| 15 to 19 years | 0 (0.0%) | 0 (0.0%) |
| 20 to 34 years | 10 (100.0%) | 0 (0.0%) |
| 35 to 50 years | 0 (0.0%) | 0 (0.0%) |
| Total | 10 (100.0%) | 0 (0.0%) |
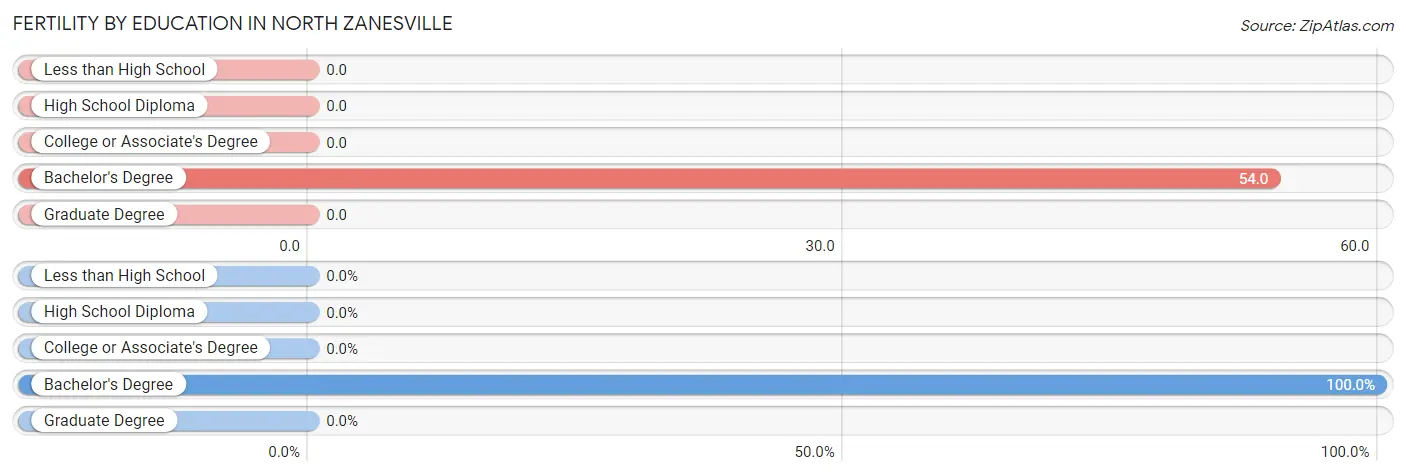
Fertility by Education in North Zanesville
| Educational Attainment | Women with Births | Births / 1,000 Women |
| Less than High School | 0 (0.0%) | 0.0 |
| High School Diploma | 0 (0.0%) | 0.0 |
| College or Associate's Degree | 0 (0.0%) | 0.0 |
| Bachelor's Degree | 10 (100.0%) | 54.0 |
| Graduate Degree | 0 (0.0%) | 0.0 |
| Total | 10 (100.0%) | 25.0 |
Fertility by Education by Marriage Status in North Zanesville
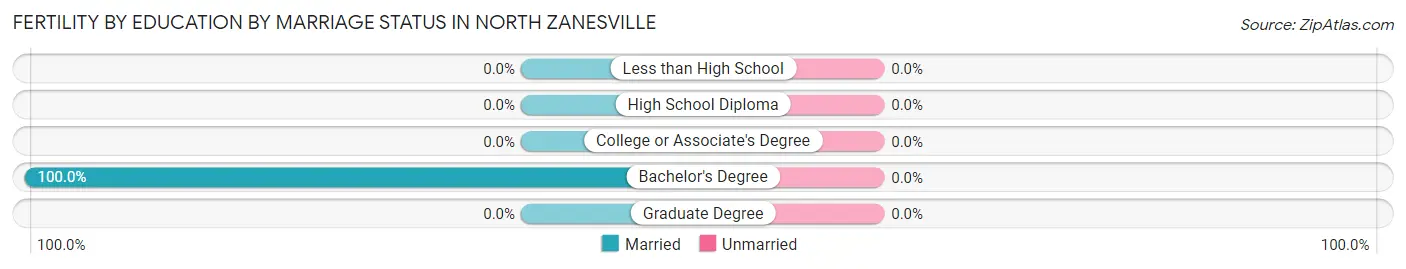
| Educational Attainment | Married | Unmarried |
| Less than High School | 0 (0.0%) | 0 (0.0%) |
| High School Diploma | 0 (0.0%) | 0 (0.0%) |
| College or Associate's Degree | 0 (0.0%) | 0 (0.0%) |
| Bachelor's Degree | 10 (100.0%) | 0 (0.0%) |
| Graduate Degree | 0 (0.0%) | 0 (0.0%) |
| Total | 10 (100.0%) | 0 (0.0%) |
Employment Characteristics in North Zanesville
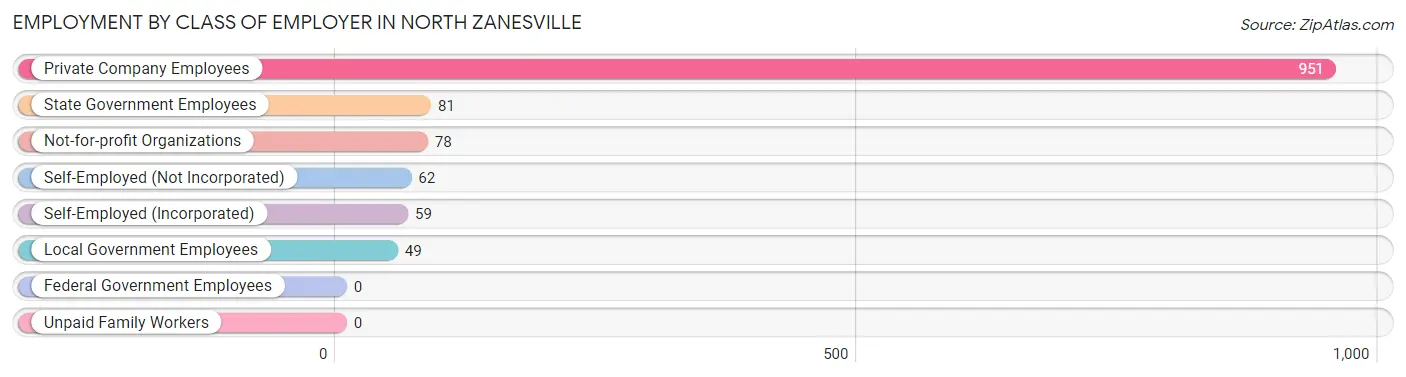
Employment by Class of Employer in North Zanesville
Among the 1,280 employed individuals in North Zanesville, private company employees (951 | 74.3%), state government employees (81 | 6.3%), and not-for-profit organizations (78 | 6.1%) make up the most common classes of employment.
| Employer Class | # Employees | % Employees |
| Private Company Employees | 951 | 74.3% |
| Self-Employed (Incorporated) | 59 | 4.6% |
| Self-Employed (Not Incorporated) | 62 | 4.8% |
| Not-for-profit Organizations | 78 | 6.1% |
| Local Government Employees | 49 | 3.8% |
| State Government Employees | 81 | 6.3% |
| Federal Government Employees | 0 | 0.0% |
| Unpaid Family Workers | 0 | 0.0% |
| Total | 1,280 | 100.0% |
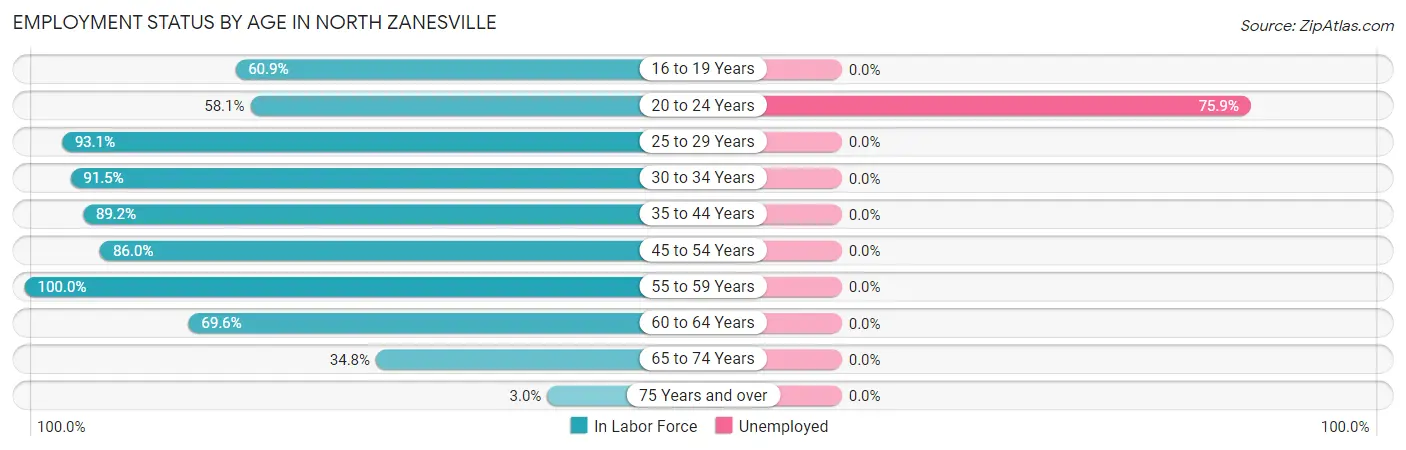
Employment Status by Age in North Zanesville
According to the labor force statistics for North Zanesville, out of the total population over 16 years of age (2,252), 58.7% or 1,322 individuals are in the labor force, with 3.1% or 41 of them unemployed. The age group with the highest labor force participation rate is 55 to 59 years, with 100.0% or 52 individuals in the labor force. Within the labor force, the 20 to 24 years age range has the highest percentage of unemployed individuals, with 75.9% or 41 of them being unemployed.
| Age Bracket | In Labor Force | Unemployed |
| 16 to 19 Years | 14 (60.9%) | 0 (0.0%) |
| 20 to 24 Years | 54 (58.1%) | 41 (75.9%) |
| 25 to 29 Years | 67 (93.1%) | 0 (0.0%) |
| 30 to 34 Years | 151 (91.5%) | 0 (0.0%) |
| 35 to 44 Years | 313 (89.2%) | 0 (0.0%) |
| 45 to 54 Years | 215 (86.0%) | 0 (0.0%) |
| 55 to 59 Years | 52 (100.0%) | 0 (0.0%) |
| 60 to 64 Years | 296 (69.6%) | 0 (0.0%) |
| 65 to 74 Years | 147 (34.8%) | 0 (0.0%) |
| 75 Years and over | 12 (3.0%) | 0 (0.0%) |
| Total | 1,322 (58.7%) | 41 (3.1%) |
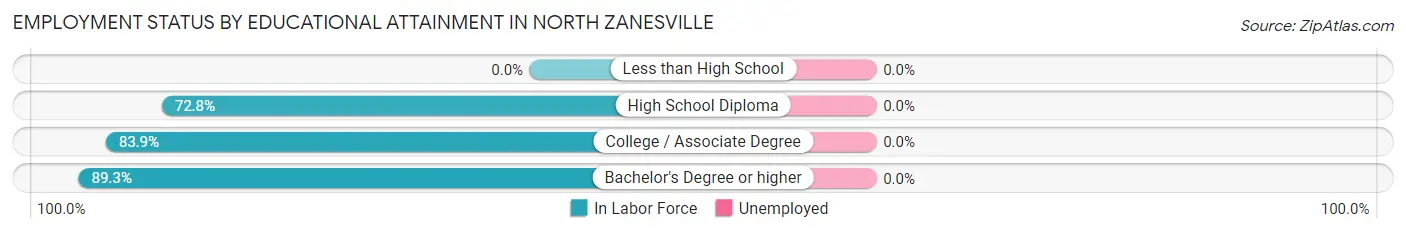
Employment Status by Educational Attainment in North Zanesville
| Educational Attainment | In Labor Force | Unemployed |
| Less than High School | 0 (0.0%) | 0 (0.0%) |
| High School Diploma | 214 (72.8%) | 0 (0.0%) |
| College / Associate Degree | 344 (83.9%) | 0 (0.0%) |
| Bachelor's Degree or higher | 536 (89.3%) | 0 (0.0%) |
| Total | 1,094 (83.2%) | 0 (0.0%) |
Employment Occupations by Sex in North Zanesville
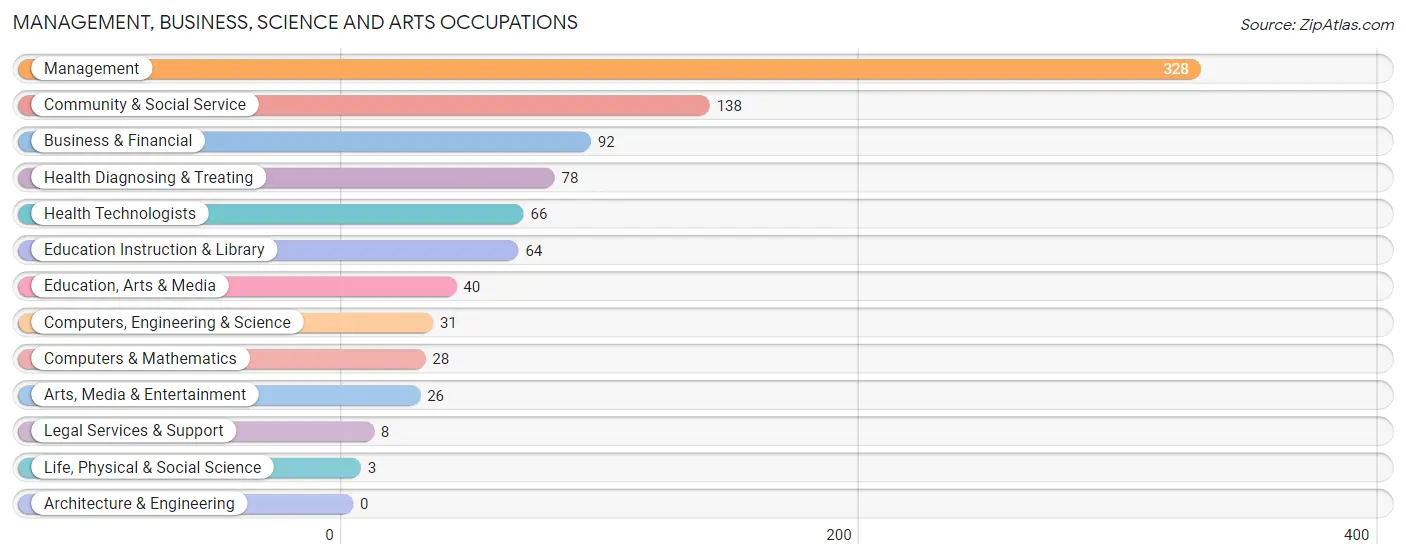
Management, Business, Science and Arts Occupations
The most common Management, Business, Science and Arts occupations in North Zanesville are Management (328 | 25.6%), Community & Social Service (138 | 10.8%), Business & Financial (92 | 7.2%), Health Diagnosing & Treating (78 | 6.1%), and Health Technologists (66 | 5.2%).
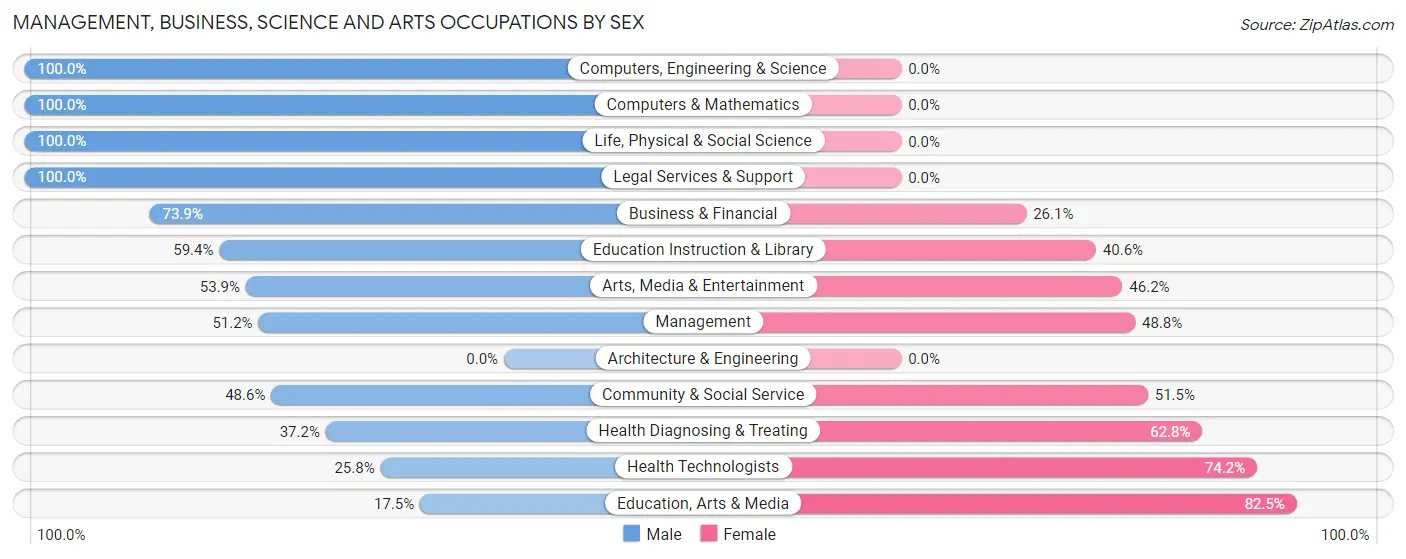
Management, Business, Science and Arts Occupations by Sex
Within the Management, Business, Science and Arts occupations in North Zanesville, the most male-oriented occupations are Computers, Engineering & Science (100.0%), Computers & Mathematics (100.0%), and Life, Physical & Social Science (100.0%), while the most female-oriented occupations are Education, Arts & Media (82.5%), Health Technologists (74.2%), and Health Diagnosing & Treating (62.8%).
| Occupation | Male | Female |
| Management | 168 (51.2%) | 160 (48.8%) |
| Business & Financial | 68 (73.9%) | 24 (26.1%) |
| Computers, Engineering & Science | 31 (100.0%) | 0 (0.0%) |
| Computers & Mathematics | 28 (100.0%) | 0 (0.0%) |
| Architecture & Engineering | 0 (0.0%) | 0 (0.0%) |
| Life, Physical & Social Science | 3 (100.0%) | 0 (0.0%) |
| Community & Social Service | 67 (48.5%) | 71 (51.4%) |
| Education, Arts & Media | 7 (17.5%) | 33 (82.5%) |
| Legal Services & Support | 8 (100.0%) | 0 (0.0%) |
| Education Instruction & Library | 38 (59.4%) | 26 (40.6%) |
| Arts, Media & Entertainment | 14 (53.8%) | 12 (46.2%) |
| Health Diagnosing & Treating | 29 (37.2%) | 49 (62.8%) |
| Health Technologists | 17 (25.8%) | 49 (74.2%) |
| Total (Category) | 363 (54.4%) | 304 (45.6%) |
| Total (Overall) | 716 (55.9%) | 564 (44.1%) |
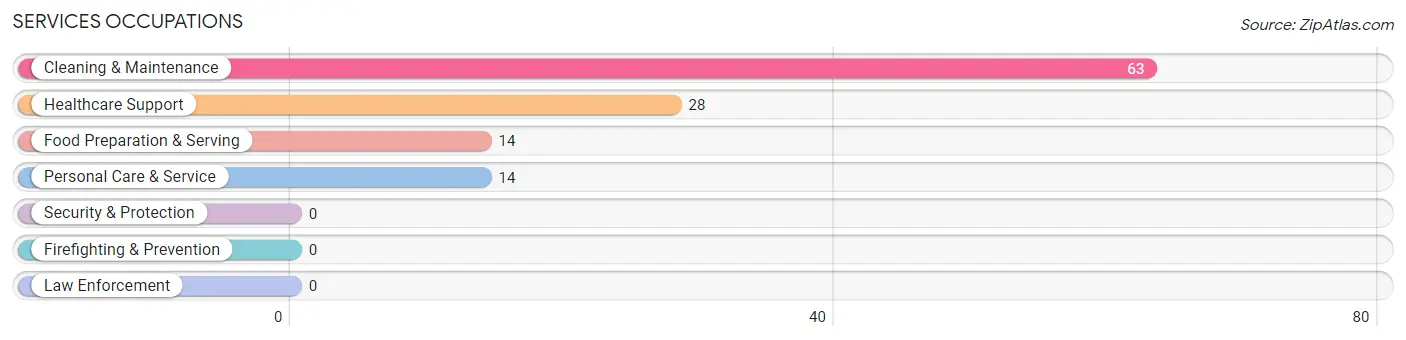
Services Occupations
The most common Services occupations in North Zanesville are Cleaning & Maintenance (63 | 4.9%), Healthcare Support (28 | 2.2%), Food Preparation & Serving (14 | 1.1%), and Personal Care & Service (14 | 1.1%).
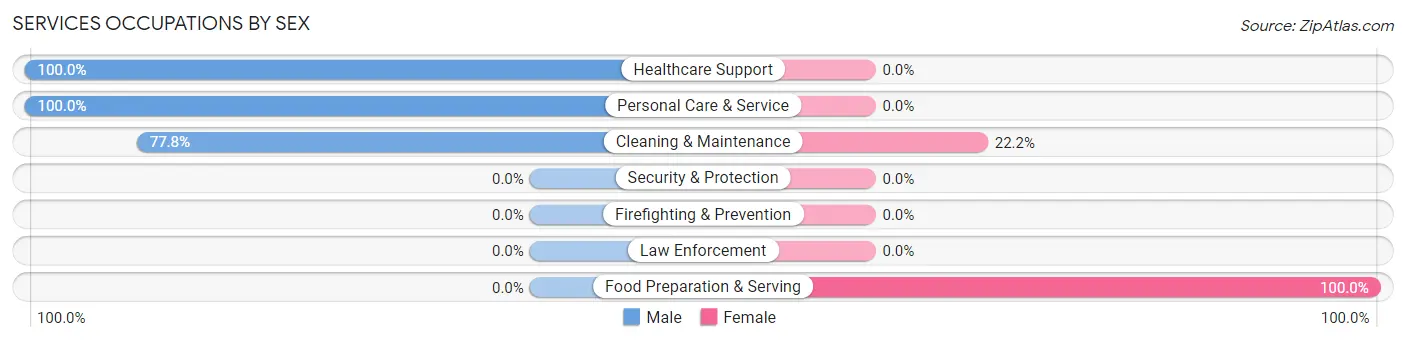
Services Occupations by Sex
Within the Services occupations in North Zanesville, the most male-oriented occupations are Healthcare Support (100.0%), Personal Care & Service (100.0%), and Cleaning & Maintenance (77.8%), while the most female-oriented occupations are Food Preparation & Serving (100.0%), and Cleaning & Maintenance (22.2%).
| Occupation | Male | Female |
| Healthcare Support | 28 (100.0%) | 0 (0.0%) |
| Security & Protection | 0 (0.0%) | 0 (0.0%) |
| Firefighting & Prevention | 0 (0.0%) | 0 (0.0%) |
| Law Enforcement | 0 (0.0%) | 0 (0.0%) |
| Food Preparation & Serving | 0 (0.0%) | 14 (100.0%) |
| Cleaning & Maintenance | 49 (77.8%) | 14 (22.2%) |
| Personal Care & Service | 14 (100.0%) | 0 (0.0%) |
| Total (Category) | 91 (76.5%) | 28 (23.5%) |
| Total (Overall) | 716 (55.9%) | 564 (44.1%) |
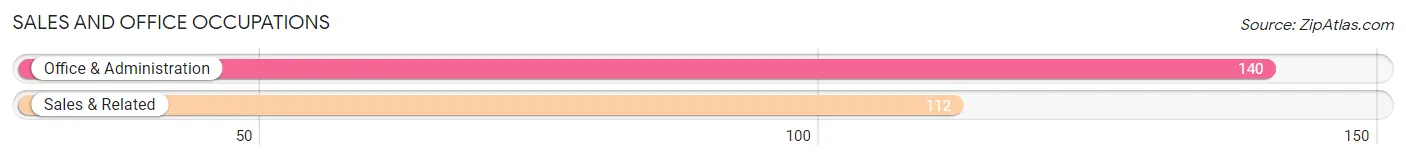
Sales and Office Occupations
The most common Sales and Office occupations in North Zanesville are Office & Administration (140 | 10.9%), and Sales & Related (112 | 8.7%).
Sales and Office Occupations by Sex
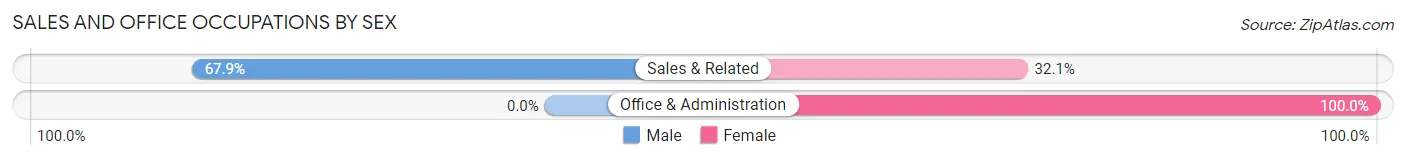
| Occupation | Male | Female |
| Sales & Related | 76 (67.9%) | 36 (32.1%) |
| Office & Administration | 0 (0.0%) | 140 (100.0%) |
| Total (Category) | 76 (30.2%) | 176 (69.8%) |
| Total (Overall) | 716 (55.9%) | 564 (44.1%) |
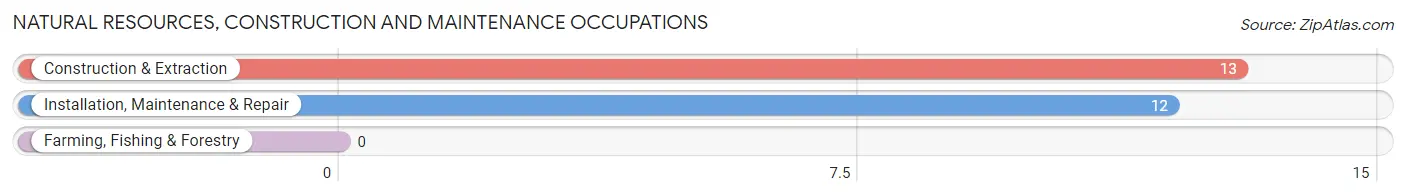
Natural Resources, Construction and Maintenance Occupations
The most common Natural Resources, Construction and Maintenance occupations in North Zanesville are Construction & Extraction (13 | 1.0%), and Installation, Maintenance & Repair (12 | 0.9%).
Natural Resources, Construction and Maintenance Occupations by Sex
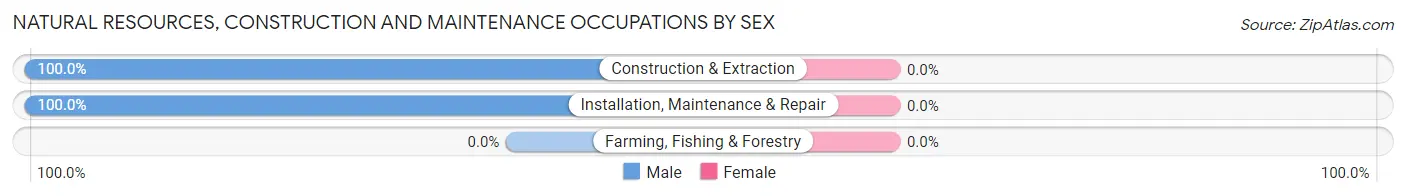
| Occupation | Male | Female |
| Farming, Fishing & Forestry | 0 (0.0%) | 0 (0.0%) |
| Construction & Extraction | 13 (100.0%) | 0 (0.0%) |
| Installation, Maintenance & Repair | 12 (100.0%) | 0 (0.0%) |
| Total (Category) | 25 (100.0%) | 0 (0.0%) |
| Total (Overall) | 716 (55.9%) | 564 (44.1%) |
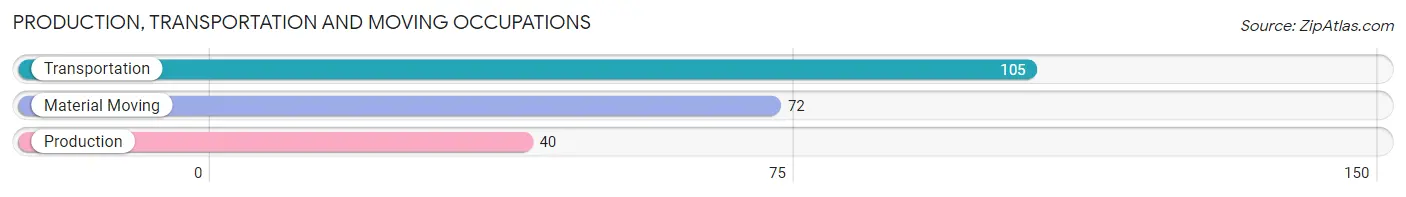
Production, Transportation and Moving Occupations
The most common Production, Transportation and Moving occupations in North Zanesville are Transportation (105 | 8.2%), Material Moving (72 | 5.6%), and Production (40 | 3.1%).
Production, Transportation and Moving Occupations by Sex
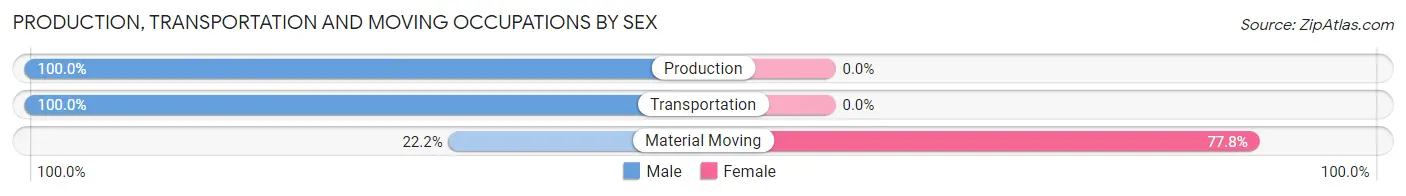
| Occupation | Male | Female |
| Production | 40 (100.0%) | 0 (0.0%) |
| Transportation | 105 (100.0%) | 0 (0.0%) |
| Material Moving | 16 (22.2%) | 56 (77.8%) |
| Total (Category) | 161 (74.2%) | 56 (25.8%) |
| Total (Overall) | 716 (55.9%) | 564 (44.1%) |
Employment Industries by Sex in North Zanesville
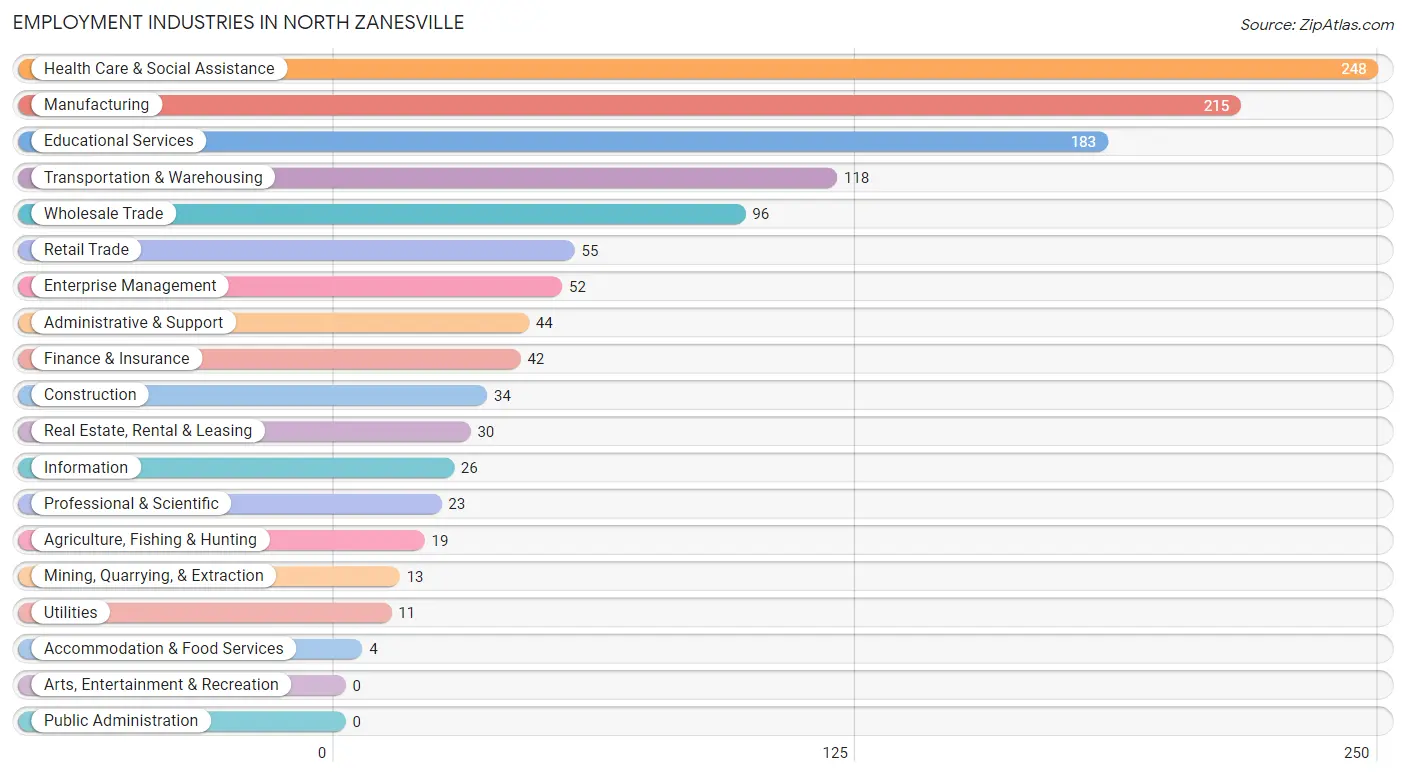
Employment Industries in North Zanesville
The major employment industries in North Zanesville include Health Care & Social Assistance (248 | 19.4%), Manufacturing (215 | 16.8%), Educational Services (183 | 14.3%), Transportation & Warehousing (118 | 9.2%), and Wholesale Trade (96 | 7.5%).
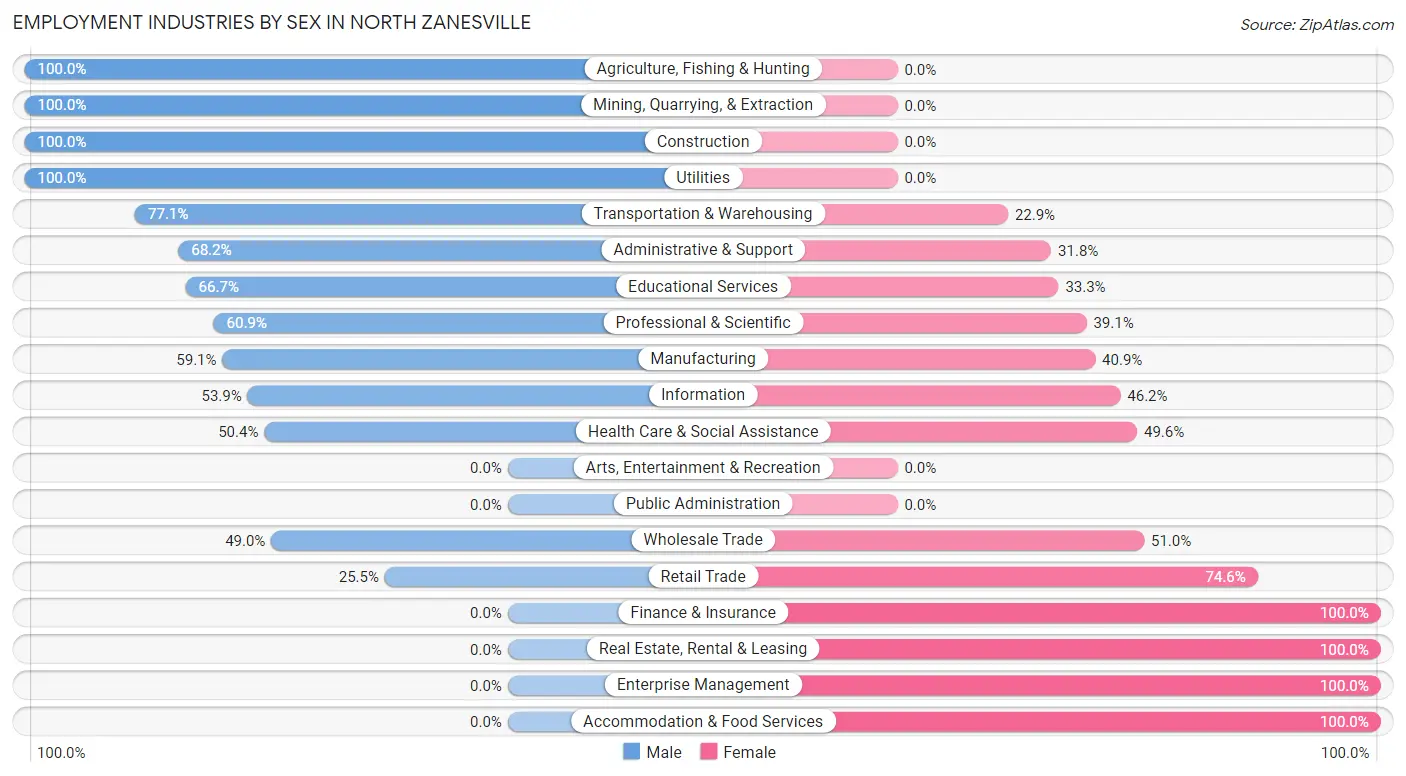
Employment Industries by Sex in North Zanesville
The North Zanesville industries that see more men than women are Agriculture, Fishing & Hunting (100.0%), Mining, Quarrying, & Extraction (100.0%), and Construction (100.0%), whereas the industries that tend to have a higher number of women are Finance & Insurance (100.0%), Real Estate, Rental & Leasing (100.0%), and Enterprise Management (100.0%).
| Industry | Male | Female |
| Agriculture, Fishing & Hunting | 19 (100.0%) | 0 (0.0%) |
| Mining, Quarrying, & Extraction | 13 (100.0%) | 0 (0.0%) |
| Construction | 34 (100.0%) | 0 (0.0%) |
| Manufacturing | 127 (59.1%) | 88 (40.9%) |
| Wholesale Trade | 47 (49.0%) | 49 (51.0%) |
| Retail Trade | 14 (25.5%) | 41 (74.6%) |
| Transportation & Warehousing | 91 (77.1%) | 27 (22.9%) |
| Utilities | 11 (100.0%) | 0 (0.0%) |
| Information | 14 (53.8%) | 12 (46.2%) |
| Finance & Insurance | 0 (0.0%) | 42 (100.0%) |
| Real Estate, Rental & Leasing | 0 (0.0%) | 30 (100.0%) |
| Professional & Scientific | 14 (60.9%) | 9 (39.1%) |
| Enterprise Management | 0 (0.0%) | 52 (100.0%) |
| Administrative & Support | 30 (68.2%) | 14 (31.8%) |
| Educational Services | 122 (66.7%) | 61 (33.3%) |
| Health Care & Social Assistance | 125 (50.4%) | 123 (49.6%) |
| Arts, Entertainment & Recreation | 0 (0.0%) | 0 (0.0%) |
| Accommodation & Food Services | 0 (0.0%) | 4 (100.0%) |
| Public Administration | 0 (0.0%) | 0 (0.0%) |
| Total | 716 (55.9%) | 564 (44.1%) |
Education in North Zanesville
School Enrollment in North Zanesville
The most common levels of schooling among the 393 students in North Zanesville are high school (113 | 28.7%), middle school (87 | 22.1%), and graduate / professional (58 | 14.8%).
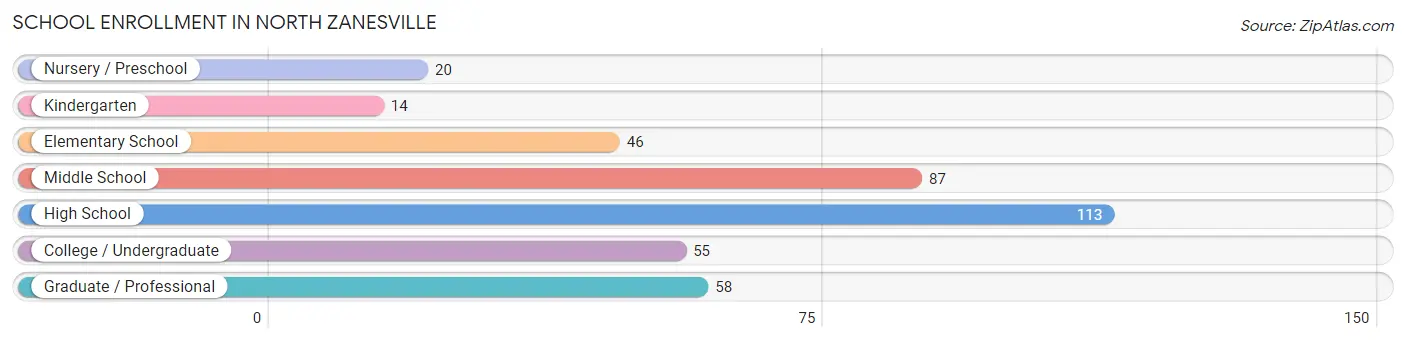
| School Level | # Students | % Students |
| Nursery / Preschool | 20 | 5.1% |
| Kindergarten | 14 | 3.6% |
| Elementary School | 46 | 11.7% |
| Middle School | 87 | 22.1% |
| High School | 113 | 28.7% |
| College / Undergraduate | 55 | 14.0% |
| Graduate / Professional | 58 | 14.8% |
| Total | 393 | 100.0% |
School Enrollment by Age by Funding Source in North Zanesville
Out of a total of 393 students who are enrolled in schools in North Zanesville, 44 (11.2%) attend a private institution, while the remaining 349 (88.8%) are enrolled in public schools. The age group of 35 years and over has the highest likelihood of being enrolled in private schools, with 32 (36.4% in the age bracket) enrolled. Conversely, the age group of 10 to 14 year olds has the lowest likelihood of being enrolled in a private school, with 103 (100.0% in the age bracket) attending a public institution.
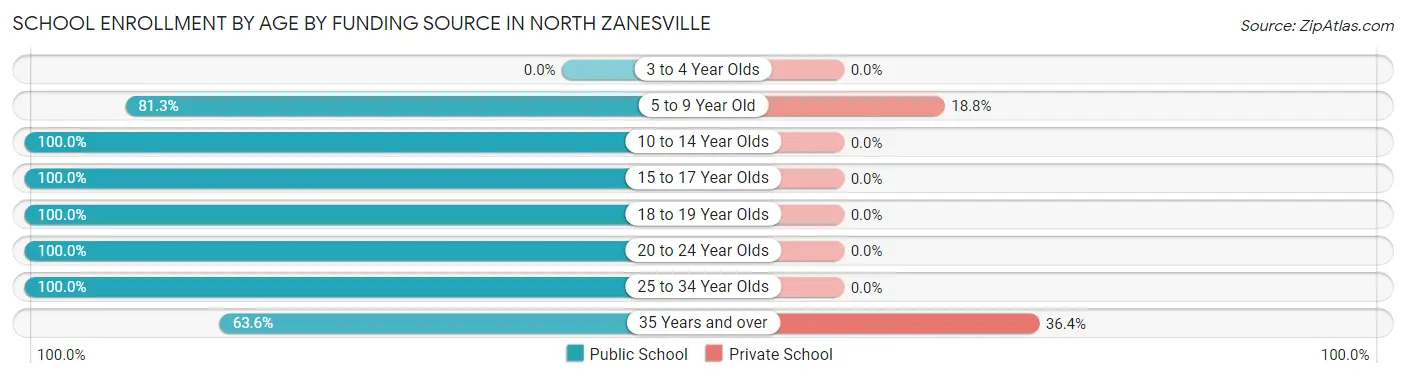
| Age Bracket | Public School | Private School |
| 3 to 4 Year Olds | 0 (0.0%) | 0 (0.0%) |
| 5 to 9 Year Old | 52 (81.2%) | 12 (18.8%) |
| 10 to 14 Year Olds | 103 (100.0%) | 0 (0.0%) |
| 15 to 17 Year Olds | 77 (100.0%) | 0 (0.0%) |
| 18 to 19 Year Olds | 14 (100.0%) | 0 (0.0%) |
| 20 to 24 Year Olds | 22 (100.0%) | 0 (0.0%) |
| 25 to 34 Year Olds | 25 (100.0%) | 0 (0.0%) |
| 35 Years and over | 56 (63.6%) | 32 (36.4%) |
| Total | 349 (88.8%) | 44 (11.2%) |
Educational Attainment by Field of Study in North Zanesville
Engineering (198 | 22.1%), education (158 | 17.6%), science & technology (124 | 13.8%), bio, nature & agricultural (94 | 10.5%), and social sciences (92 | 10.2%) are the most common fields of study among 898 individuals in North Zanesville who have obtained a bachelor's degree or higher.
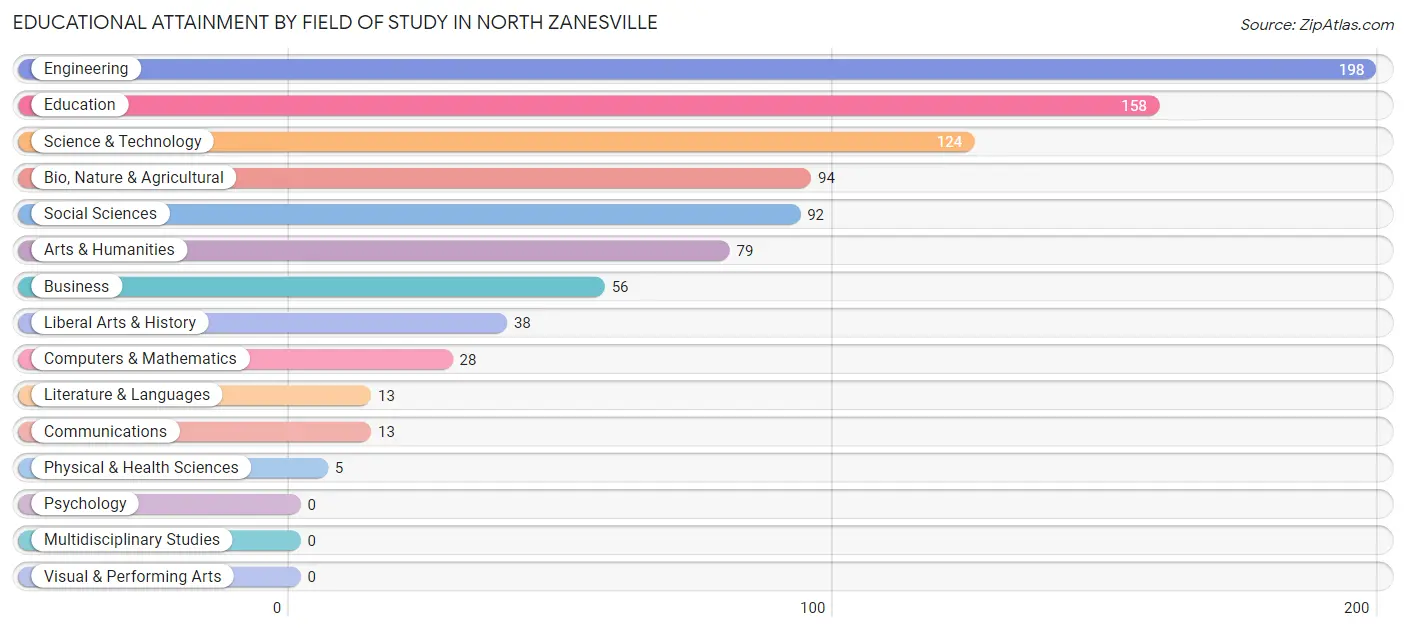
| Field of Study | # Graduates | % Graduates |
| Computers & Mathematics | 28 | 3.1% |
| Bio, Nature & Agricultural | 94 | 10.5% |
| Physical & Health Sciences | 5 | 0.6% |
| Psychology | 0 | 0.0% |
| Social Sciences | 92 | 10.2% |
| Engineering | 198 | 22.1% |
| Multidisciplinary Studies | 0 | 0.0% |
| Science & Technology | 124 | 13.8% |
| Business | 56 | 6.2% |
| Education | 158 | 17.6% |
| Literature & Languages | 13 | 1.5% |
| Liberal Arts & History | 38 | 4.2% |
| Visual & Performing Arts | 0 | 0.0% |
| Communications | 13 | 1.5% |
| Arts & Humanities | 79 | 8.8% |
| Total | 898 | 100.0% |
Transportation & Commute in North Zanesville
Vehicle Availability by Sex in North Zanesville
The most prevalent vehicle ownership categories in North Zanesville are males with 2 vehicles (410, accounting for 57.3%) and females with 2 vehicles (375, making up 72.7%).
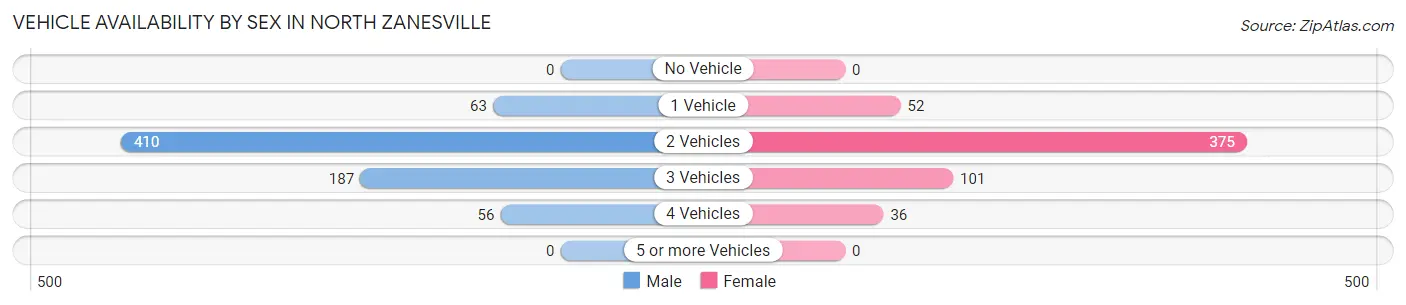
| Vehicles Available | Male | Female |
| No Vehicle | 0 (0.0%) | 0 (0.0%) |
| 1 Vehicle | 63 (8.8%) | 52 (9.2%) |
| 2 Vehicles | 410 (57.3%) | 375 (66.5%) |
| 3 Vehicles | 187 (26.1%) | 101 (17.9%) |
| 4 Vehicles | 56 (7.8%) | 36 (6.4%) |
| 5 or more Vehicles | 0 (0.0%) | 0 (0.0%) |
| Total | 716 (100.0%) | 564 (100.0%) |
Commute Time in North Zanesville
The most frequently occuring commute durations in North Zanesville are 10 to 14 minutes (286 commuters, 26.7%), 5 to 9 minutes (266 commuters, 24.9%), and 45 to 59 minutes (177 commuters, 16.5%).
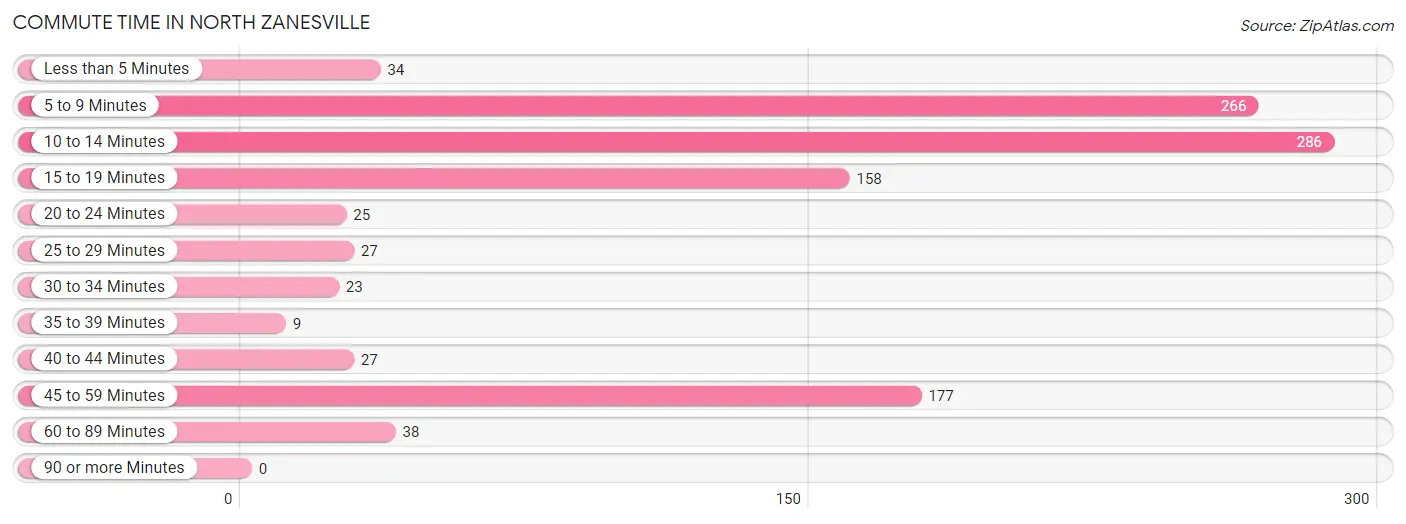
| Commute Time | # Commuters | % Commuters |
| Less than 5 Minutes | 34 | 3.2% |
| 5 to 9 Minutes | 266 | 24.9% |
| 10 to 14 Minutes | 286 | 26.7% |
| 15 to 19 Minutes | 158 | 14.8% |
| 20 to 24 Minutes | 25 | 2.3% |
| 25 to 29 Minutes | 27 | 2.5% |
| 30 to 34 Minutes | 23 | 2.1% |
| 35 to 39 Minutes | 9 | 0.8% |
| 40 to 44 Minutes | 27 | 2.5% |
| 45 to 59 Minutes | 177 | 16.5% |
| 60 to 89 Minutes | 38 | 3.5% |
| 90 or more Minutes | 0 | 0.0% |
Commute Time by Sex in North Zanesville
The most common commute times in North Zanesville are 10 to 14 minutes (187 commuters, 33.0%) for males and 5 to 9 minutes (149 commuters, 29.6%) for females.
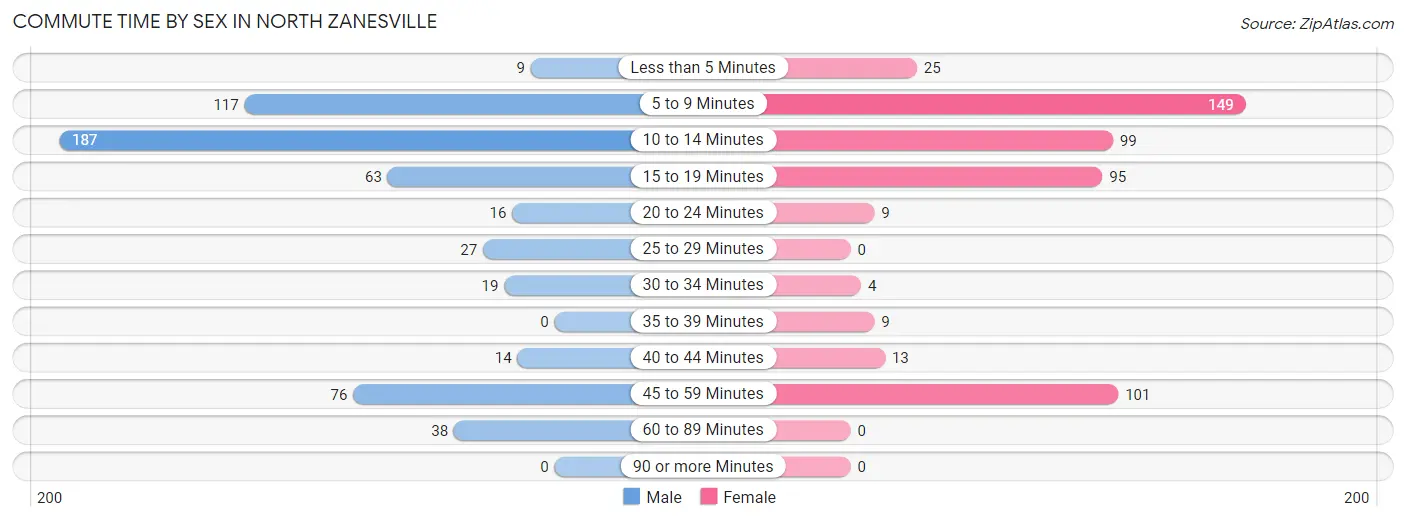
| Commute Time | Male | Female |
| Less than 5 Minutes | 9 (1.6%) | 25 (5.0%) |
| 5 to 9 Minutes | 117 (20.7%) | 149 (29.6%) |
| 10 to 14 Minutes | 187 (33.0%) | 99 (19.6%) |
| 15 to 19 Minutes | 63 (11.1%) | 95 (18.9%) |
| 20 to 24 Minutes | 16 (2.8%) | 9 (1.8%) |
| 25 to 29 Minutes | 27 (4.8%) | 0 (0.0%) |
| 30 to 34 Minutes | 19 (3.4%) | 4 (0.8%) |
| 35 to 39 Minutes | 0 (0.0%) | 9 (1.8%) |
| 40 to 44 Minutes | 14 (2.5%) | 13 (2.6%) |
| 45 to 59 Minutes | 76 (13.4%) | 101 (20.0%) |
| 60 to 89 Minutes | 38 (6.7%) | 0 (0.0%) |
| 90 or more Minutes | 0 (0.0%) | 0 (0.0%) |
Time of Departure to Work by Sex in North Zanesville
The most frequent times of departure to work in North Zanesville are 6:30 AM to 6:59 AM (170, 30.0%) for males and 6:30 AM to 6:59 AM (184, 36.5%) for females.
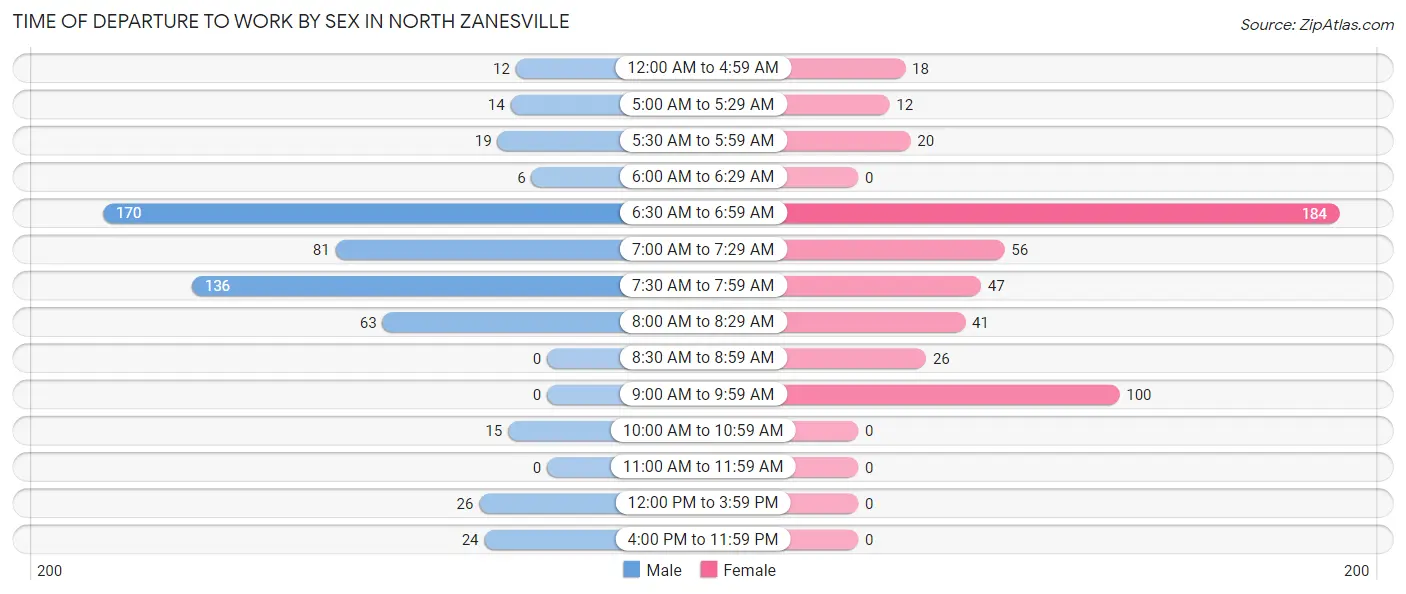
| Time of Departure | Male | Female |
| 12:00 AM to 4:59 AM | 12 (2.1%) | 18 (3.6%) |
| 5:00 AM to 5:29 AM | 14 (2.5%) | 12 (2.4%) |
| 5:30 AM to 5:59 AM | 19 (3.4%) | 20 (4.0%) |
| 6:00 AM to 6:29 AM | 6 (1.1%) | 0 (0.0%) |
| 6:30 AM to 6:59 AM | 170 (30.0%) | 184 (36.5%) |
| 7:00 AM to 7:29 AM | 81 (14.3%) | 56 (11.1%) |
| 7:30 AM to 7:59 AM | 136 (24.0%) | 47 (9.3%) |
| 8:00 AM to 8:29 AM | 63 (11.1%) | 41 (8.1%) |
| 8:30 AM to 8:59 AM | 0 (0.0%) | 26 (5.2%) |
| 9:00 AM to 9:59 AM | 0 (0.0%) | 100 (19.8%) |
| 10:00 AM to 10:59 AM | 15 (2.6%) | 0 (0.0%) |
| 11:00 AM to 11:59 AM | 0 (0.0%) | 0 (0.0%) |
| 12:00 PM to 3:59 PM | 26 (4.6%) | 0 (0.0%) |
| 4:00 PM to 11:59 PM | 24 (4.2%) | 0 (0.0%) |
| Total | 566 (100.0%) | 504 (100.0%) |
Housing Occupancy in North Zanesville
Occupancy by Ownership in North Zanesville
Of the total 1,196 dwellings in North Zanesville, owner-occupied units account for 1,070 (89.5%), while renter-occupied units make up 126 (10.5%).
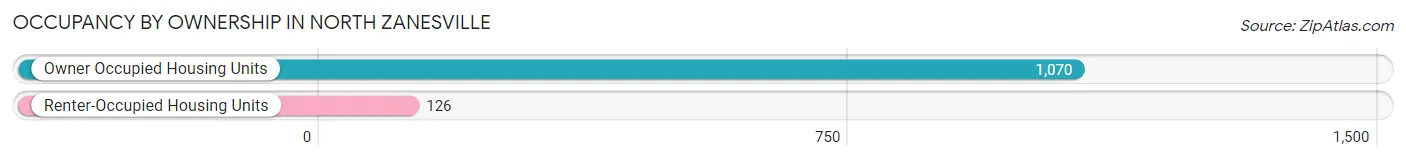
| Occupancy | # Housing Units | % Housing Units |
| Owner Occupied Housing Units | 1,070 | 89.5% |
| Renter-Occupied Housing Units | 126 | 10.5% |
| Total Occupied Housing Units | 1,196 | 100.0% |
Occupancy by Household Size in North Zanesville
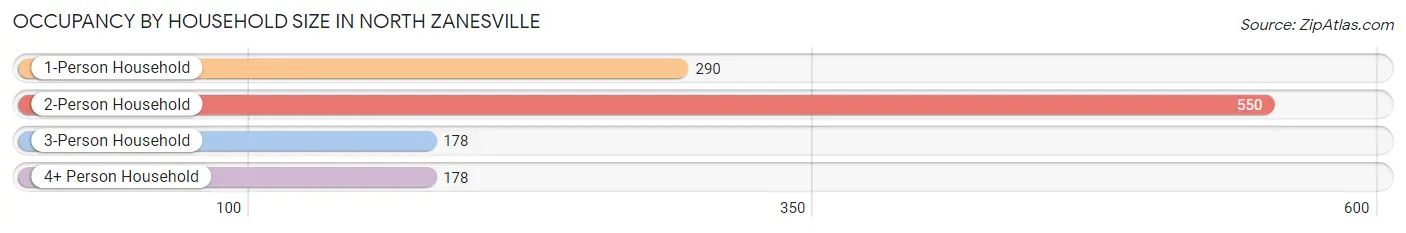
| Household Size | # Housing Units | % Housing Units |
| 1-Person Household | 290 | 24.2% |
| 2-Person Household | 550 | 46.0% |
| 3-Person Household | 178 | 14.9% |
| 4+ Person Household | 178 | 14.9% |
| Total Housing Units | 1,196 | 100.0% |
Occupancy by Ownership by Household Size in North Zanesville
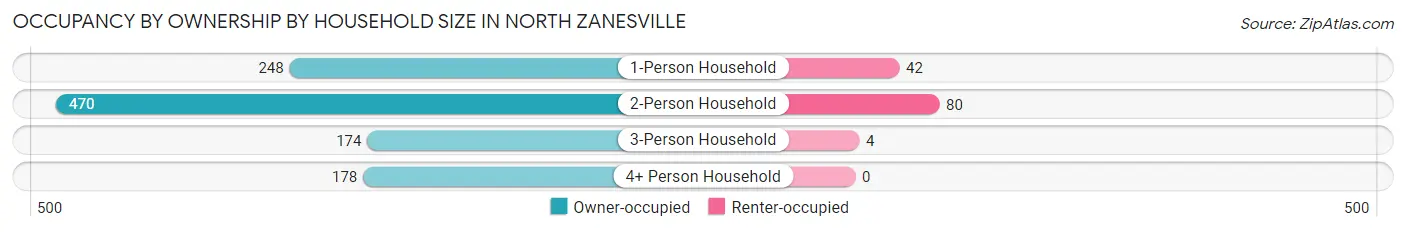
| Household Size | Owner-occupied | Renter-occupied |
| 1-Person Household | 248 (85.5%) | 42 (14.5%) |
| 2-Person Household | 470 (85.5%) | 80 (14.5%) |
| 3-Person Household | 174 (97.8%) | 4 (2.2%) |
| 4+ Person Household | 178 (100.0%) | 0 (0.0%) |
| Total Housing Units | 1,070 (89.5%) | 126 (10.5%) |
Occupancy by Educational Attainment in North Zanesville
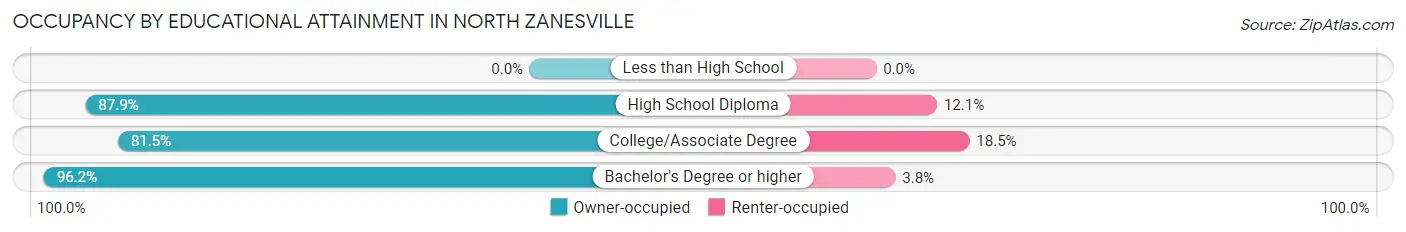
| Household Size | Owner-occupied | Renter-occupied |
| Less than High School | 0 (0.0%) | 0 (0.0%) |
| High School Diploma | 299 (87.9%) | 41 (12.1%) |
| College/Associate Degree | 291 (81.5%) | 66 (18.5%) |
| Bachelor's Degree or higher | 480 (96.2%) | 19 (3.8%) |
Occupancy by Age of Householder in North Zanesville
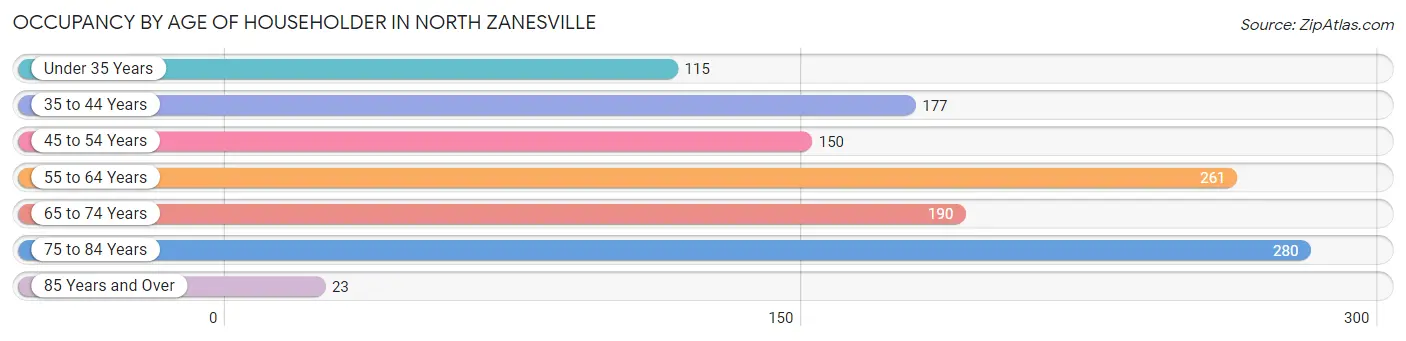
| Age Bracket | # Households | % Households |
| Under 35 Years | 115 | 9.6% |
| 35 to 44 Years | 177 | 14.8% |
| 45 to 54 Years | 150 | 12.5% |
| 55 to 64 Years | 261 | 21.8% |
| 65 to 74 Years | 190 | 15.9% |
| 75 to 84 Years | 280 | 23.4% |
| 85 Years and Over | 23 | 1.9% |
| Total | 1,196 | 100.0% |
Housing Finances in North Zanesville
Median Income by Occupancy in North Zanesville
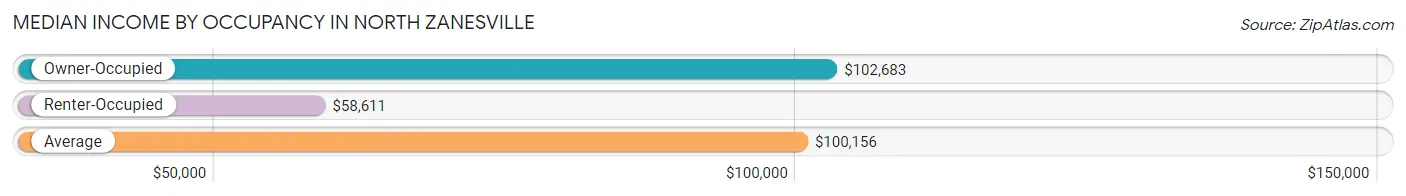
| Occupancy Type | # Households | Median Income |
| Owner-Occupied | 1,070 (89.5%) | $102,683 |
| Renter-Occupied | 126 (10.5%) | $58,611 |
| Average | 1,196 (100.0%) | $100,156 |
Occupancy by Householder Income Bracket in North Zanesville
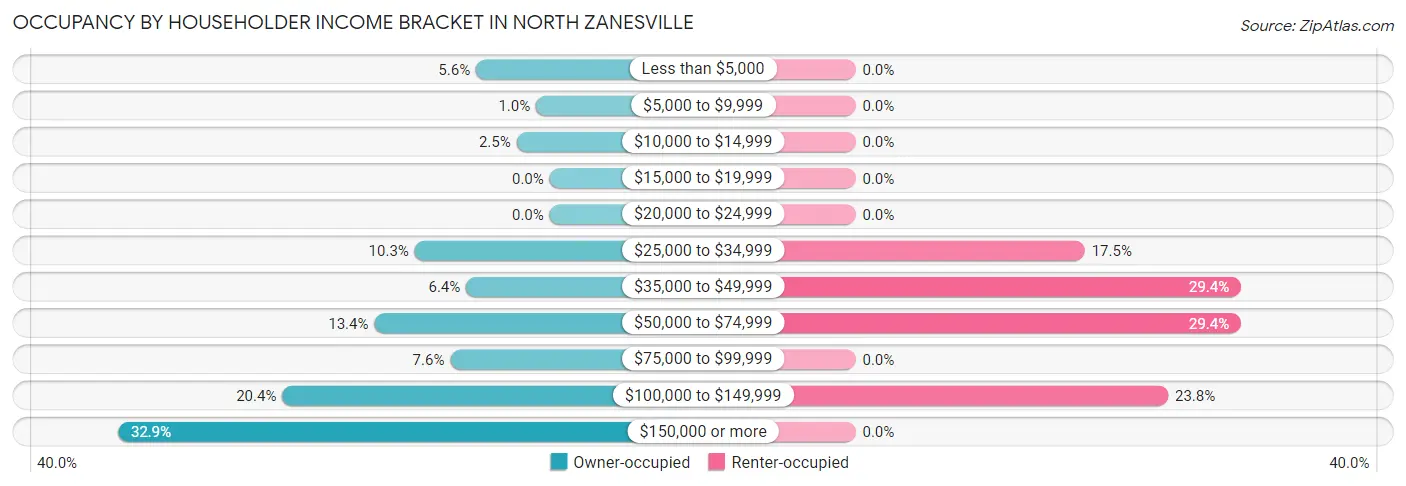
| Income Bracket | Owner-occupied | Renter-occupied |
| Less than $5,000 | 60 (5.6%) | 0 (0.0%) |
| $5,000 to $9,999 | 11 (1.0%) | 0 (0.0%) |
| $10,000 to $14,999 | 27 (2.5%) | 0 (0.0%) |
| $15,000 to $19,999 | 0 (0.0%) | 0 (0.0%) |
| $20,000 to $24,999 | 0 (0.0%) | 0 (0.0%) |
| $25,000 to $34,999 | 110 (10.3%) | 22 (17.5%) |
| $35,000 to $49,999 | 68 (6.4%) | 37 (29.4%) |
| $50,000 to $74,999 | 143 (13.4%) | 37 (29.4%) |
| $75,000 to $99,999 | 81 (7.6%) | 0 (0.0%) |
| $100,000 to $149,999 | 218 (20.4%) | 30 (23.8%) |
| $150,000 or more | 352 (32.9%) | 0 (0.0%) |
| Total | 1,070 (100.0%) | 126 (100.0%) |
Monthly Housing Cost Tiers in North Zanesville
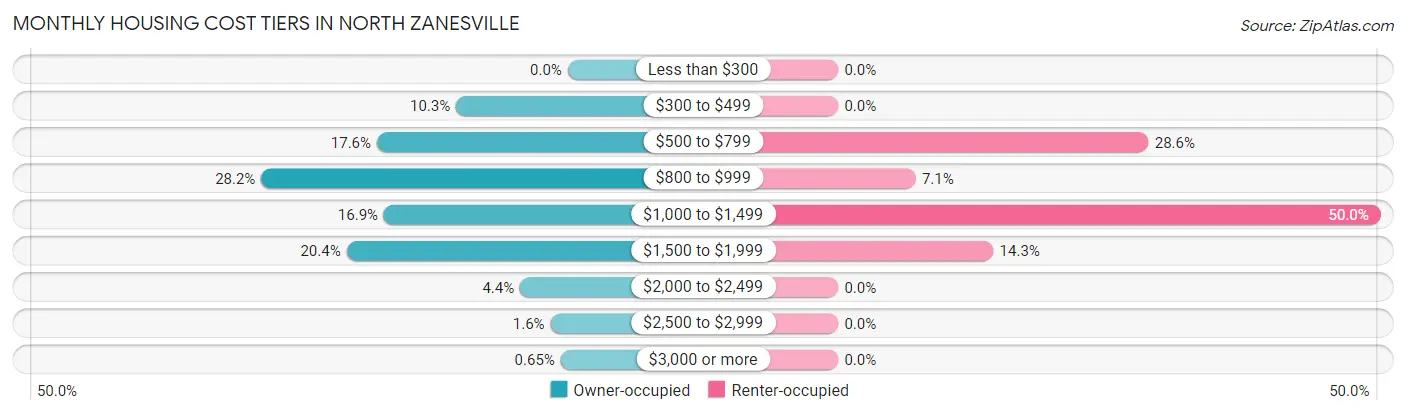
| Monthly Cost | Owner-occupied | Renter-occupied |
| Less than $300 | 0 (0.0%) | 0 (0.0%) |
| $300 to $499 | 110 (10.3%) | 0 (0.0%) |
| $500 to $799 | 188 (17.6%) | 36 (28.6%) |
| $800 to $999 | 302 (28.2%) | 9 (7.1%) |
| $1,000 to $1,499 | 181 (16.9%) | 63 (50.0%) |
| $1,500 to $1,999 | 218 (20.4%) | 18 (14.3%) |
| $2,000 to $2,499 | 47 (4.4%) | 0 (0.0%) |
| $2,500 to $2,999 | 17 (1.6%) | 0 (0.0%) |
| $3,000 or more | 7 (0.6%) | 0 (0.0%) |
| Total | 1,070 (100.0%) | 126 (100.0%) |
Physical Housing Characteristics in North Zanesville
Housing Structures in North Zanesville
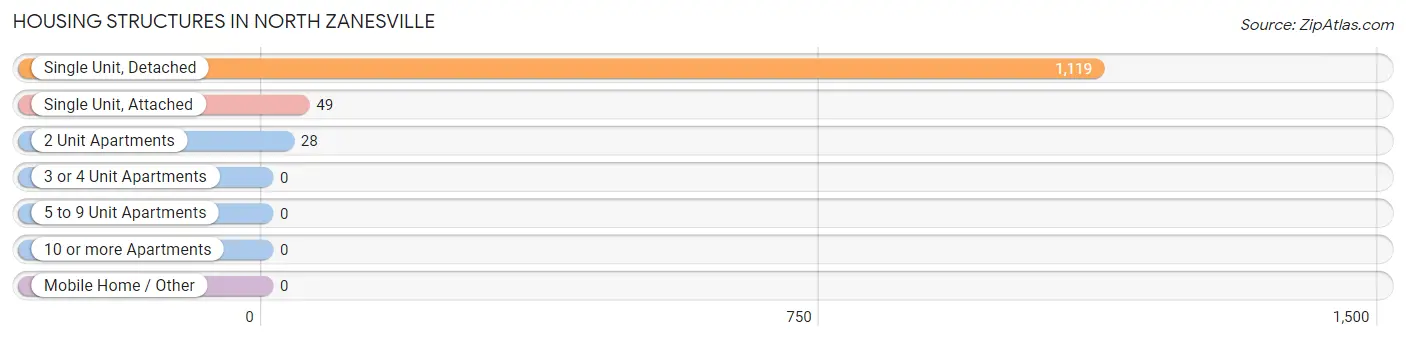
| Structure Type | # Housing Units | % Housing Units |
| Single Unit, Detached | 1,119 | 93.6% |
| Single Unit, Attached | 49 | 4.1% |
| 2 Unit Apartments | 28 | 2.3% |
| 3 or 4 Unit Apartments | 0 | 0.0% |
| 5 to 9 Unit Apartments | 0 | 0.0% |
| 10 or more Apartments | 0 | 0.0% |
| Mobile Home / Other | 0 | 0.0% |
| Total | 1,196 | 100.0% |
Housing Structures by Occupancy in North Zanesville
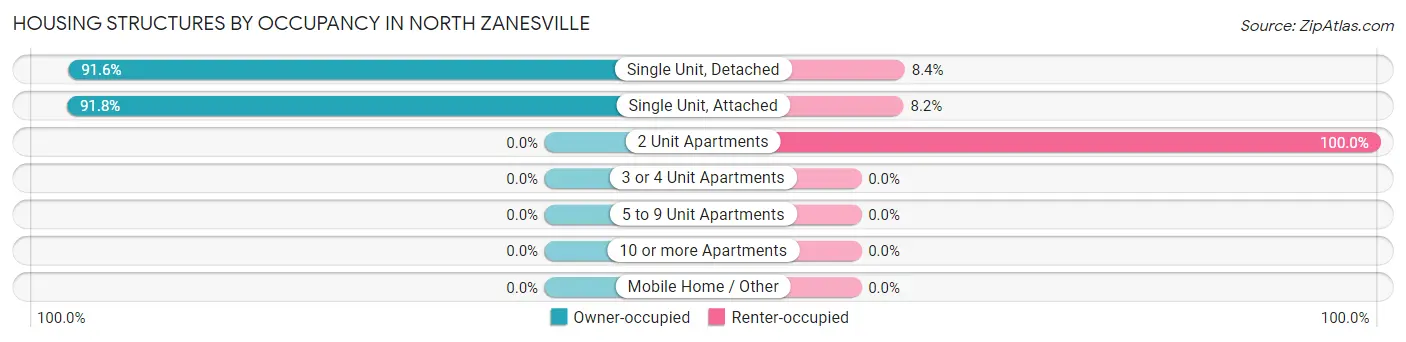
| Structure Type | Owner-occupied | Renter-occupied |
| Single Unit, Detached | 1,025 (91.6%) | 94 (8.4%) |
| Single Unit, Attached | 45 (91.8%) | 4 (8.2%) |
| 2 Unit Apartments | 0 (0.0%) | 28 (100.0%) |
| 3 or 4 Unit Apartments | 0 (0.0%) | 0 (0.0%) |
| 5 to 9 Unit Apartments | 0 (0.0%) | 0 (0.0%) |
| 10 or more Apartments | 0 (0.0%) | 0 (0.0%) |
| Mobile Home / Other | 0 (0.0%) | 0 (0.0%) |
| Total | 1,070 (89.5%) | 126 (10.5%) |
Housing Structures by Number of Rooms in North Zanesville
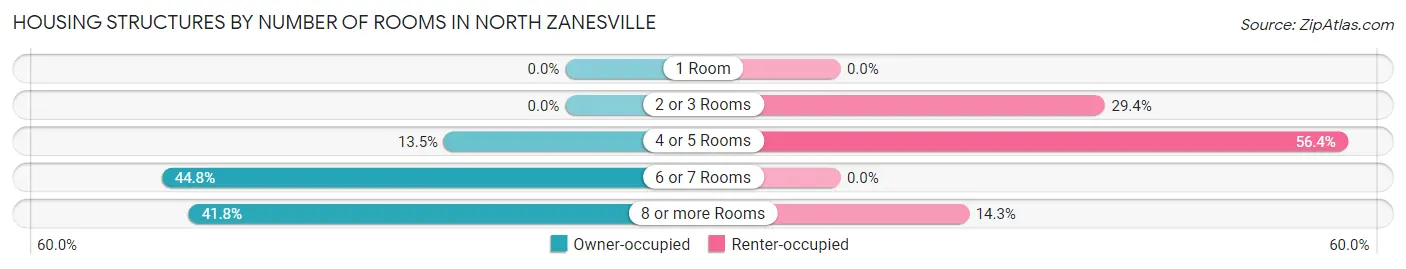
| Number of Rooms | Owner-occupied | Renter-occupied |
| 1 Room | 0 (0.0%) | 0 (0.0%) |
| 2 or 3 Rooms | 0 (0.0%) | 37 (29.4%) |
| 4 or 5 Rooms | 144 (13.5%) | 71 (56.4%) |
| 6 or 7 Rooms | 479 (44.8%) | 0 (0.0%) |
| 8 or more Rooms | 447 (41.8%) | 18 (14.3%) |
| Total | 1,070 (100.0%) | 126 (100.0%) |
Housing Structure by Heating Type in North Zanesville
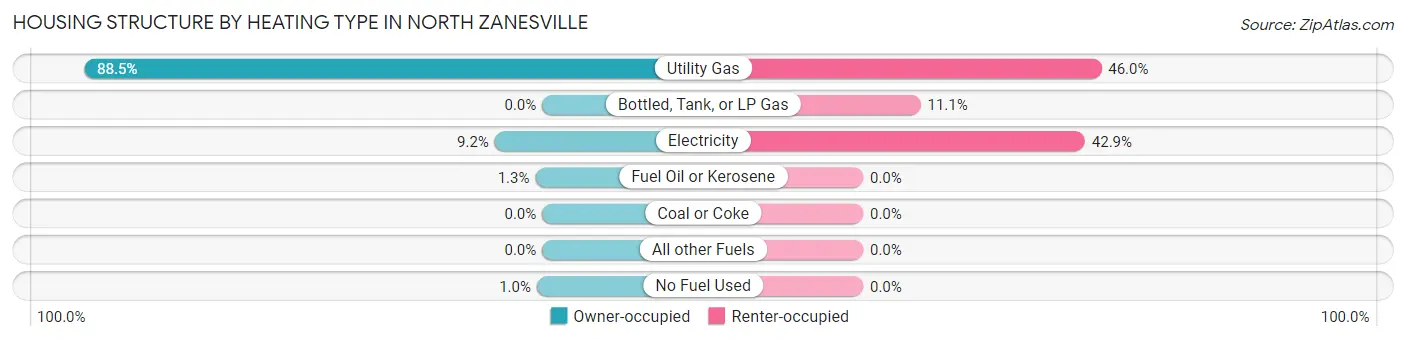
| Heating Type | Owner-occupied | Renter-occupied |
| Utility Gas | 947 (88.5%) | 58 (46.0%) |
| Bottled, Tank, or LP Gas | 0 (0.0%) | 14 (11.1%) |
| Electricity | 98 (9.2%) | 54 (42.9%) |
| Fuel Oil or Kerosene | 14 (1.3%) | 0 (0.0%) |
| Coal or Coke | 0 (0.0%) | 0 (0.0%) |
| All other Fuels | 0 (0.0%) | 0 (0.0%) |
| No Fuel Used | 11 (1.0%) | 0 (0.0%) |
| Total | 1,070 (100.0%) | 126 (100.0%) |
Household Vehicle Usage in North Zanesville
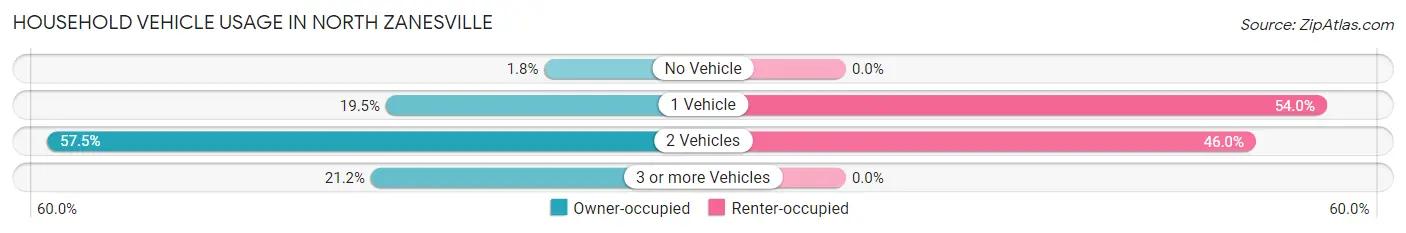
| Vehicles per Household | Owner-occupied | Renter-occupied |
| No Vehicle | 19 (1.8%) | 0 (0.0%) |
| 1 Vehicle | 209 (19.5%) | 68 (54.0%) |
| 2 Vehicles | 615 (57.5%) | 58 (46.0%) |
| 3 or more Vehicles | 227 (21.2%) | 0 (0.0%) |
| Total | 1,070 (100.0%) | 126 (100.0%) |
Real Estate & Mortgages in North Zanesville
Real Estate and Mortgage Overview in North Zanesville
| Characteristic | Without Mortgage | With Mortgage |
| Housing Units | 480 | 590 |
| Median Property Value | $209,500 | $219,100 |
| Median Household Income | $96,500 | $217 |
| Monthly Housing Costs | $580 | $7 |
| Real Estate Taxes | $2,504 | $0 |
Property Value by Mortgage Status in North Zanesville
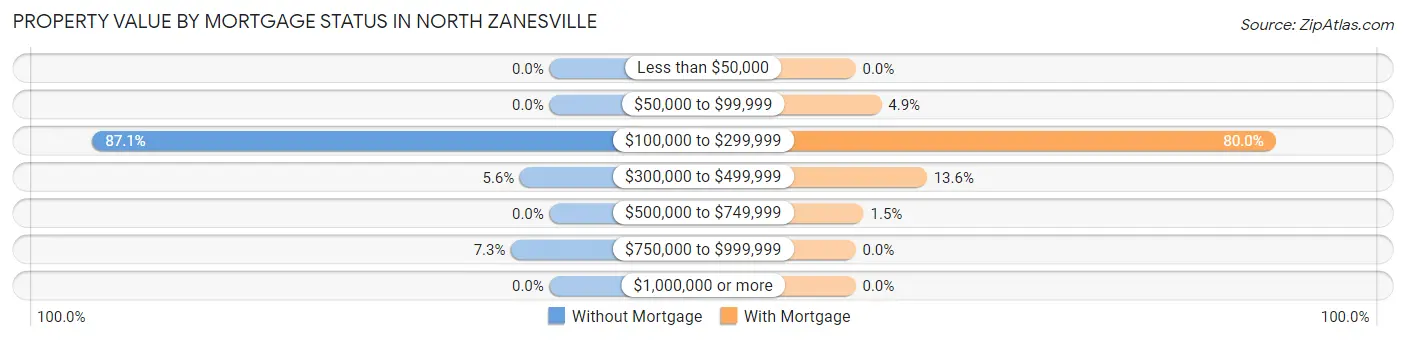
| Property Value | Without Mortgage | With Mortgage |
| Less than $50,000 | 0 (0.0%) | 0 (0.0%) |
| $50,000 to $99,999 | 0 (0.0%) | 29 (4.9%) |
| $100,000 to $299,999 | 418 (87.1%) | 472 (80.0%) |
| $300,000 to $499,999 | 27 (5.6%) | 80 (13.6%) |
| $500,000 to $749,999 | 0 (0.0%) | 9 (1.5%) |
| $750,000 to $999,999 | 35 (7.3%) | 0 (0.0%) |
| $1,000,000 or more | 0 (0.0%) | 0 (0.0%) |
| Total | 480 (100.0%) | 590 (100.0%) |
Household Income by Mortgage Status in North Zanesville
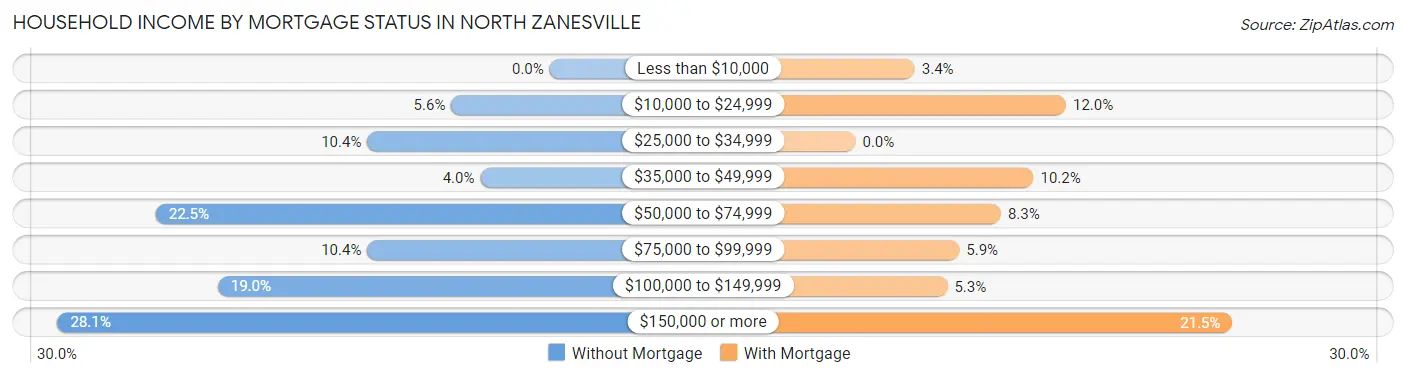
| Household Income | Without Mortgage | With Mortgage |
| Less than $10,000 | 0 (0.0%) | 20 (3.4%) |
| $10,000 to $24,999 | 27 (5.6%) | 71 (12.0%) |
| $25,000 to $34,999 | 50 (10.4%) | 0 (0.0%) |
| $35,000 to $49,999 | 19 (4.0%) | 60 (10.2%) |
| $50,000 to $74,999 | 108 (22.5%) | 49 (8.3%) |
| $75,000 to $99,999 | 50 (10.4%) | 35 (5.9%) |
| $100,000 to $149,999 | 91 (19.0%) | 31 (5.2%) |
| $150,000 or more | 135 (28.1%) | 127 (21.5%) |
| Total | 480 (100.0%) | 590 (100.0%) |
Property Value to Household Income Ratio in North Zanesville
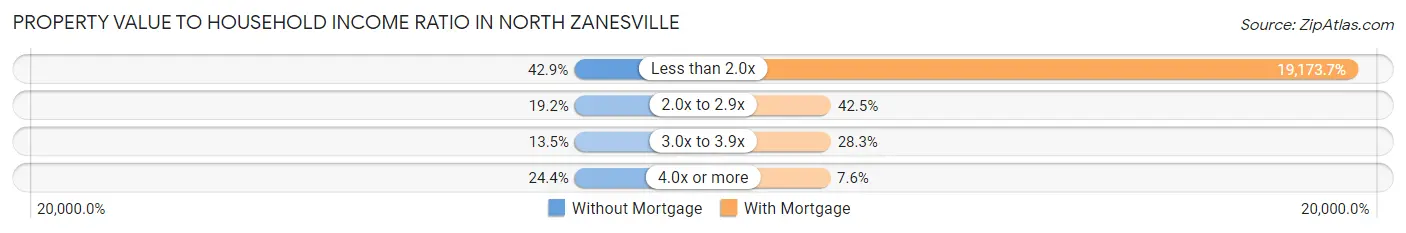
| Value-to-Income Ratio | Without Mortgage | With Mortgage |
| Less than 2.0x | 206 (42.9%) | 113,125 (19,173.7%) |
| 2.0x to 2.9x | 92 (19.2%) | 251 (42.5%) |
| 3.0x to 3.9x | 65 (13.5%) | 167 (28.3%) |
| 4.0x or more | 117 (24.4%) | 45 (7.6%) |
| Total | 480 (100.0%) | 590 (100.0%) |
Real Estate Taxes by Mortgage Status in North Zanesville
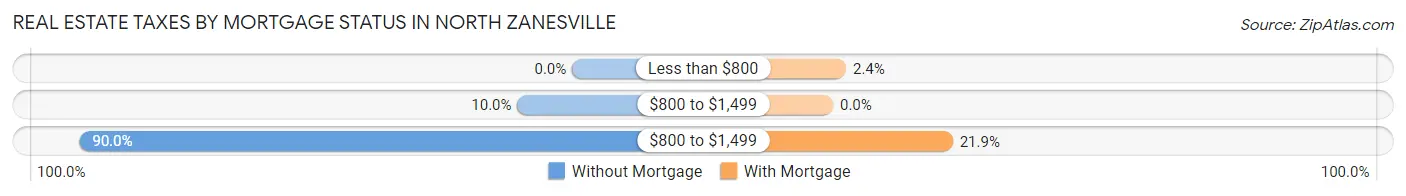
| Property Taxes | Without Mortgage | With Mortgage |
| Less than $800 | 0 (0.0%) | 14 (2.4%) |
| $800 to $1,499 | 48 (10.0%) | 0 (0.0%) |
| $800 to $1,499 | 432 (90.0%) | 129 (21.9%) |
| Total | 480 (100.0%) | 590 (100.0%) |
Health & Disability in North Zanesville
Health Insurance Coverage by Age in North Zanesville
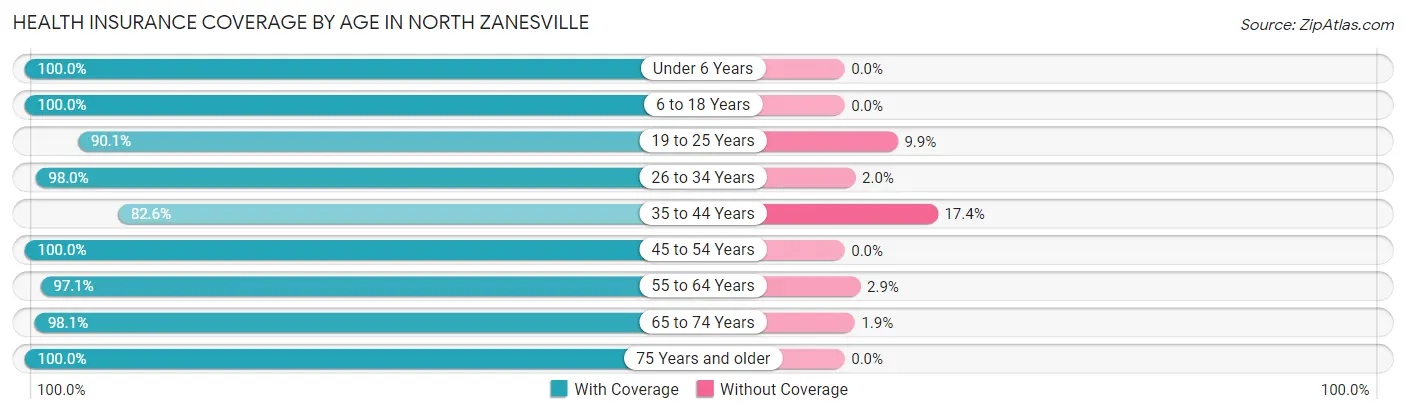
| Age Bracket | With Coverage | Without Coverage |
| Under 6 Years | 166 (100.0%) | 0 (0.0%) |
| 6 to 18 Years | 238 (100.0%) | 0 (0.0%) |
| 19 to 25 Years | 118 (90.1%) | 13 (9.9%) |
| 26 to 34 Years | 195 (98.0%) | 4 (2.0%) |
| 35 to 44 Years | 290 (82.6%) | 61 (17.4%) |
| 45 to 54 Years | 250 (100.0%) | 0 (0.0%) |
| 55 to 64 Years | 463 (97.1%) | 14 (2.9%) |
| 65 to 74 Years | 414 (98.1%) | 8 (1.9%) |
| 75 Years and older | 399 (100.0%) | 0 (0.0%) |
| Total | 2,533 (96.2%) | 100 (3.8%) |
Health Insurance Coverage by Citizenship Status in North Zanesville
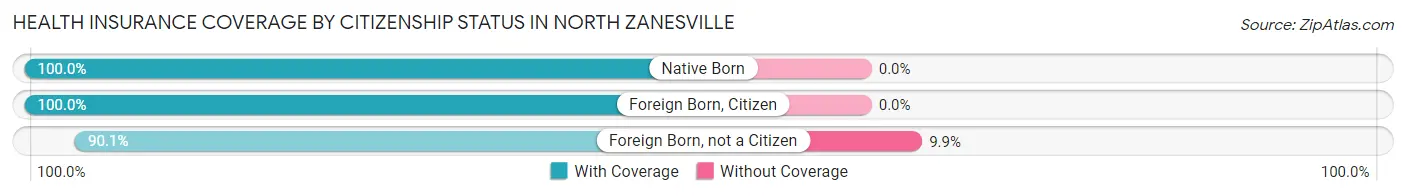
| Citizenship Status | With Coverage | Without Coverage |
| Native Born | 166 (100.0%) | 0 (0.0%) |
| Foreign Born, Citizen | 238 (100.0%) | 0 (0.0%) |
| Foreign Born, not a Citizen | 118 (90.1%) | 13 (9.9%) |
Health Insurance Coverage by Household Income in North Zanesville
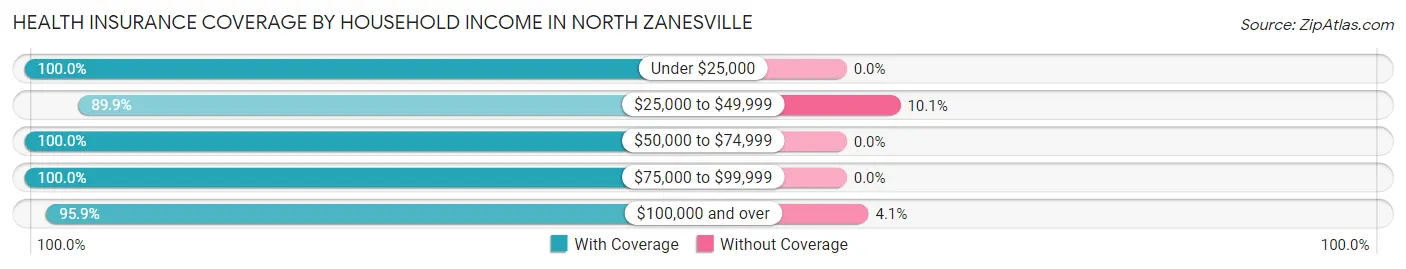
| Household Income | With Coverage | Without Coverage |
| Under $25,000 | 124 (100.0%) | 0 (0.0%) |
| $25,000 to $49,999 | 277 (89.9%) | 31 (10.1%) |
| $50,000 to $74,999 | 351 (100.0%) | 0 (0.0%) |
| $75,000 to $99,999 | 151 (100.0%) | 0 (0.0%) |
| $100,000 and over | 1,627 (95.9%) | 69 (4.1%) |
Public vs Private Health Insurance Coverage by Age in North Zanesville
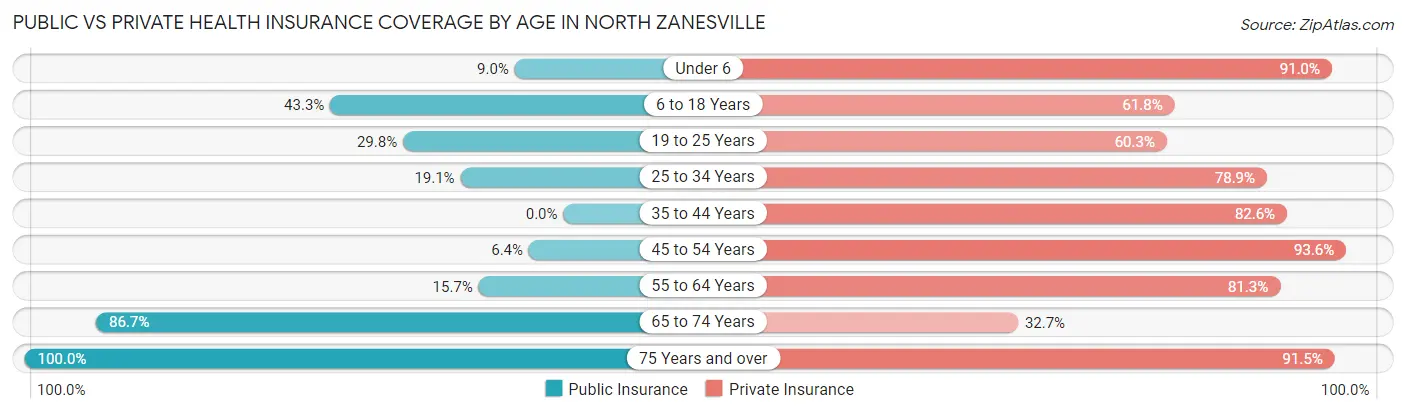
| Age Bracket | Public Insurance | Private Insurance |
| Under 6 | 15 (9.0%) | 151 (91.0%) |
| 6 to 18 Years | 103 (43.3%) | 147 (61.8%) |
| 19 to 25 Years | 39 (29.8%) | 79 (60.3%) |
| 25 to 34 Years | 38 (19.1%) | 157 (78.9%) |
| 35 to 44 Years | 0 (0.0%) | 290 (82.6%) |
| 45 to 54 Years | 16 (6.4%) | 234 (93.6%) |
| 55 to 64 Years | 75 (15.7%) | 388 (81.3%) |
| 65 to 74 Years | 366 (86.7%) | 138 (32.7%) |
| 75 Years and over | 399 (100.0%) | 365 (91.5%) |
| Total | 1,051 (39.9%) | 1,949 (74.0%) |
Disability Status by Sex by Age in North Zanesville
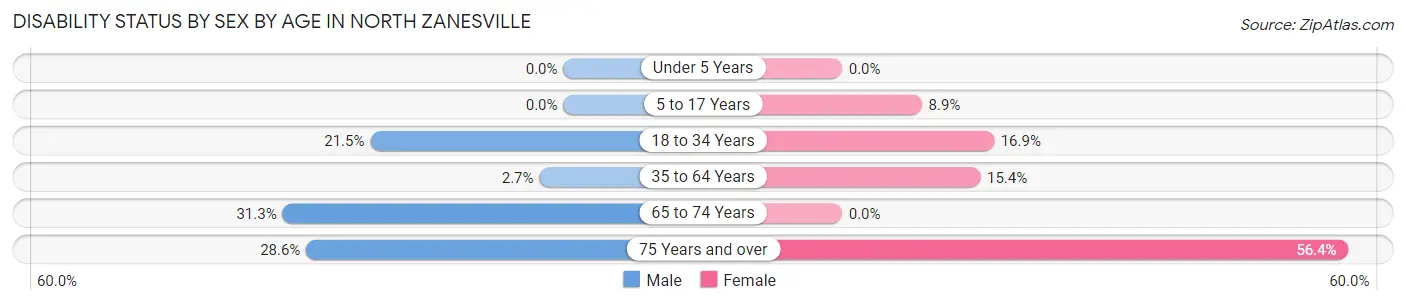
| Age Bracket | Male | Female |
| Under 5 Years | 0 (0.0%) | 0 (0.0%) |
| 5 to 17 Years | 0 (0.0%) | 12 (8.9%) |
| 18 to 34 Years | 46 (21.5%) | 22 (16.9%) |
| 35 to 64 Years | 13 (2.7%) | 91 (15.4%) |
| 65 to 74 Years | 56 (31.3%) | 0 (0.0%) |
| 75 Years and over | 63 (28.6%) | 101 (56.4%) |
Disability Class by Sex by Age in North Zanesville
Disability Class: Hearing Difficulty
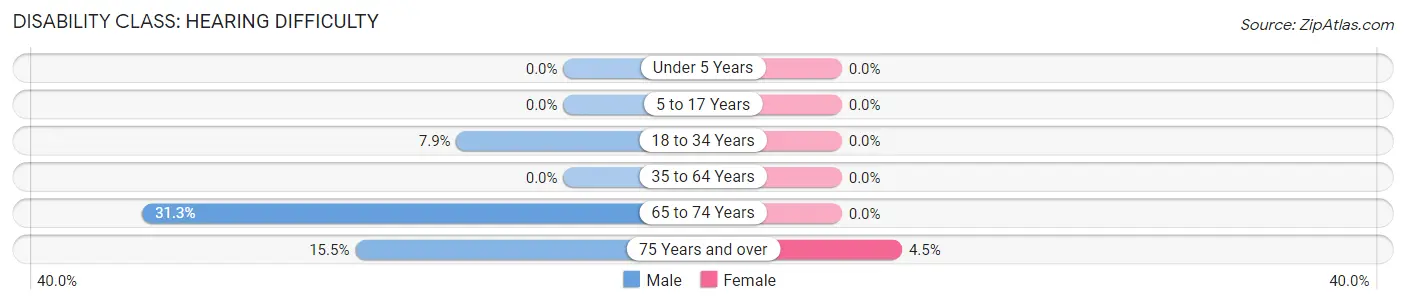
| Age Bracket | Male | Female |
| Under 5 Years | 0 (0.0%) | 0 (0.0%) |
| 5 to 17 Years | 0 (0.0%) | 0 (0.0%) |
| 18 to 34 Years | 17 (7.9%) | 0 (0.0%) |
| 35 to 64 Years | 0 (0.0%) | 0 (0.0%) |
| 65 to 74 Years | 56 (31.3%) | 0 (0.0%) |
| 75 Years and over | 34 (15.4%) | 8 (4.5%) |
Disability Class: Vision Difficulty
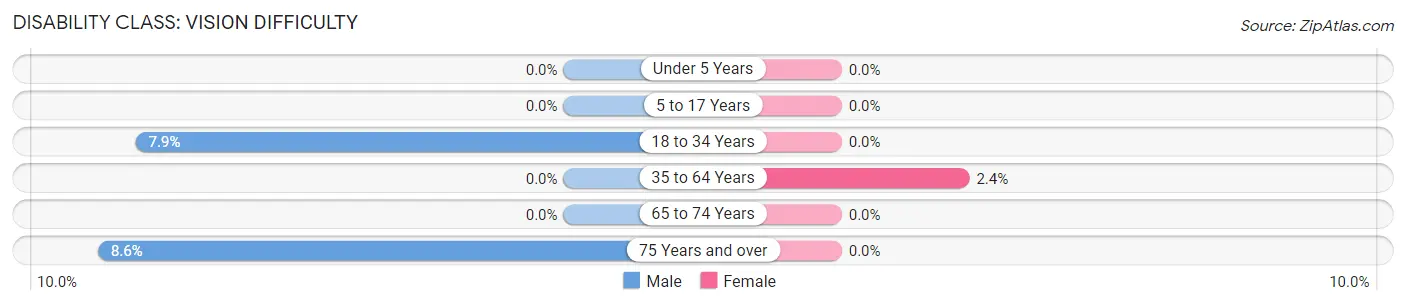
| Age Bracket | Male | Female |
| Under 5 Years | 0 (0.0%) | 0 (0.0%) |
| 5 to 17 Years | 0 (0.0%) | 0 (0.0%) |
| 18 to 34 Years | 17 (7.9%) | 0 (0.0%) |
| 35 to 64 Years | 0 (0.0%) | 14 (2.4%) |
| 65 to 74 Years | 0 (0.0%) | 0 (0.0%) |
| 75 Years and over | 19 (8.6%) | 0 (0.0%) |
Disability Class: Cognitive Difficulty
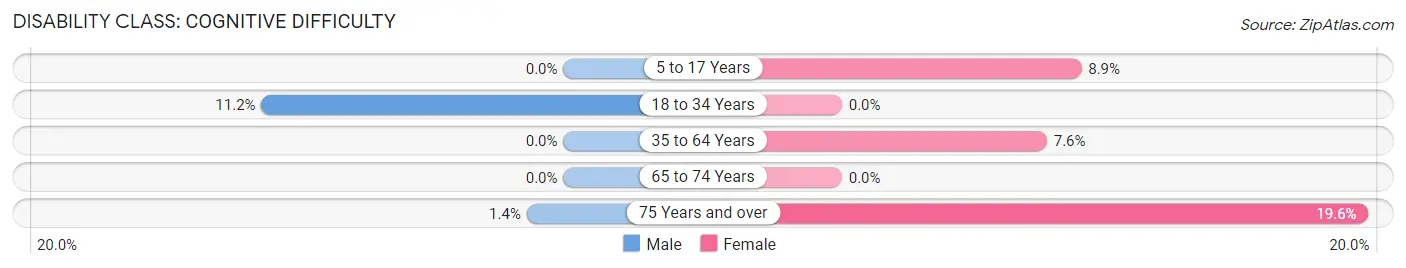
| Age Bracket | Male | Female |
| 5 to 17 Years | 0 (0.0%) | 12 (8.9%) |
| 18 to 34 Years | 24 (11.2%) | 0 (0.0%) |
| 35 to 64 Years | 0 (0.0%) | 45 (7.6%) |
| 65 to 74 Years | 0 (0.0%) | 0 (0.0%) |
| 75 Years and over | 3 (1.4%) | 35 (19.6%) |
Disability Class: Ambulatory Difficulty
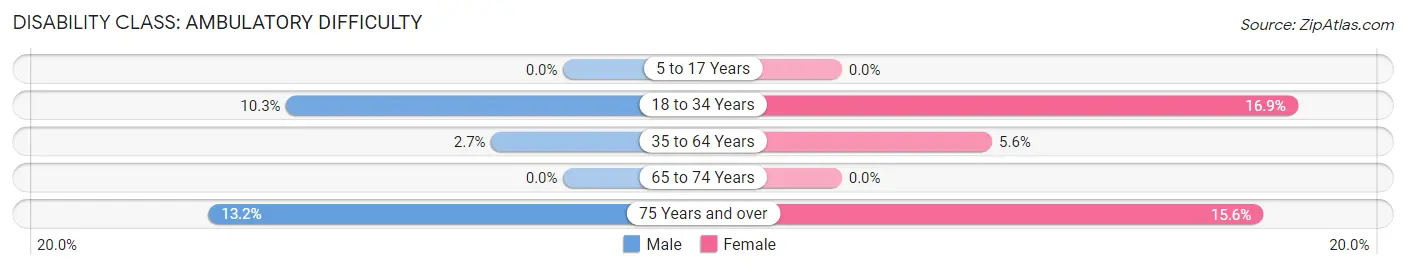
| Age Bracket | Male | Female |
| 5 to 17 Years | 0 (0.0%) | 0 (0.0%) |
| 18 to 34 Years | 22 (10.3%) | 22 (16.9%) |
| 35 to 64 Years | 13 (2.7%) | 33 (5.6%) |
| 65 to 74 Years | 0 (0.0%) | 0 (0.0%) |
| 75 Years and over | 29 (13.2%) | 28 (15.6%) |
Disability Class: Self-Care Difficulty
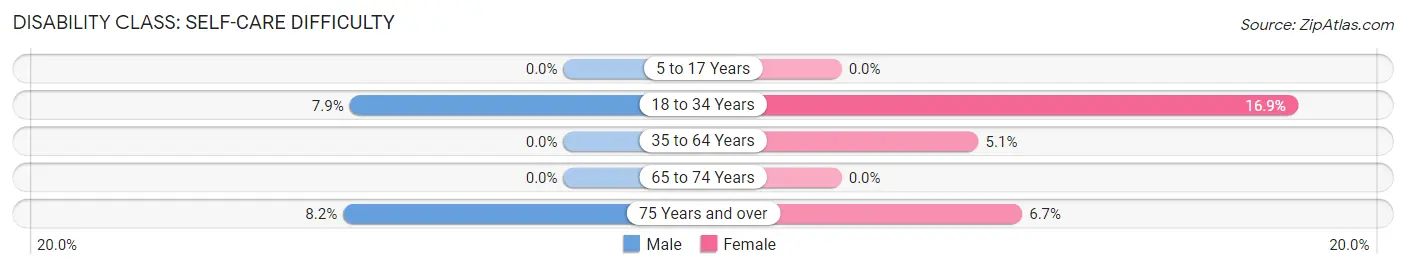
| Age Bracket | Male | Female |
| 5 to 17 Years | 0 (0.0%) | 0 (0.0%) |
| 18 to 34 Years | 17 (7.9%) | 22 (16.9%) |
| 35 to 64 Years | 0 (0.0%) | 30 (5.1%) |
| 65 to 74 Years | 0 (0.0%) | 0 (0.0%) |
| 75 Years and over | 18 (8.2%) | 12 (6.7%) |
Technology Access in North Zanesville
Computing Device Access in North Zanesville
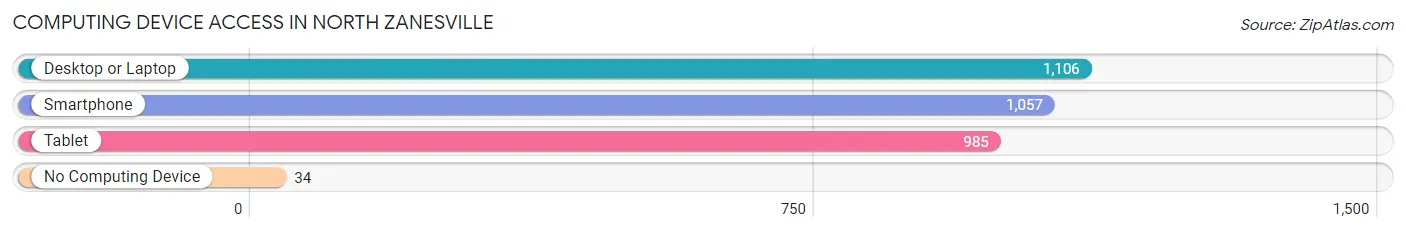
| Device Type | # Households | % Households |
| Desktop or Laptop | 1,106 | 92.5% |
| Smartphone | 1,057 | 88.4% |
| Tablet | 985 | 82.4% |
| No Computing Device | 34 | 2.8% |
| Total | 1,196 | 100.0% |
Internet Access in North Zanesville
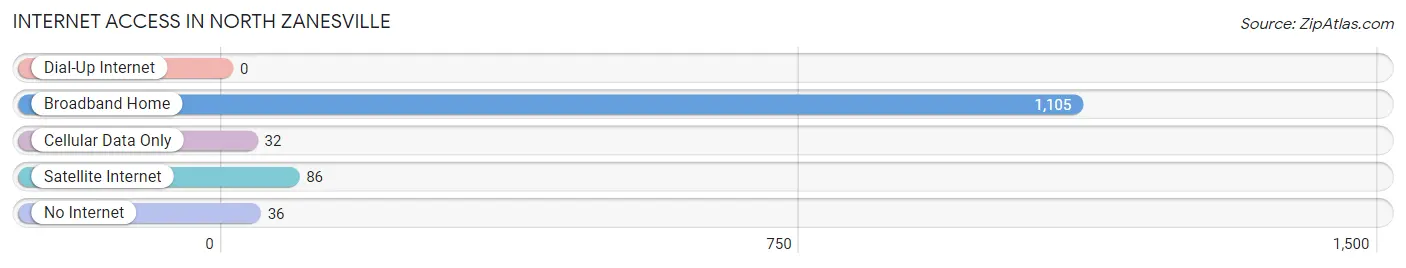
| Internet Type | # Households | % Households |
| Dial-Up Internet | 0 | 0.0% |
| Broadband Home | 1,105 | 92.4% |
| Cellular Data Only | 32 | 2.7% |
| Satellite Internet | 86 | 7.2% |
| No Internet | 36 | 3.0% |
| Total | 1,196 | 100.0% |
North Zanesville Summary
North Zanesville is a small village located in Muskingum County, Ohio. It is situated along the Muskingum River, approximately 10 miles north of Zanesville. The village has a population of approximately 1,000 people and is part of the Zanesville Metropolitan Statistical Area.
History
North Zanesville was founded in 1817 by a group of settlers from Pennsylvania. The village was originally known as “New Philadelphia” and was later renamed “North Zanesville” in 1820. The village was incorporated in 1837 and has remained a small, rural community ever since.
The village was home to a number of industries throughout its history, including a flour mill, a sawmill, a grist mill, a tannery, and a brickyard. The village also had a number of stores, including a general store, a drug store, and a hardware store.
Geography
North Zanesville is located in Muskingum County, Ohio. It is situated along the Muskingum River, approximately 10 miles north of Zanesville. The village is located in a rural area and is surrounded by farmland. The village is located at an elevation of 845 feet above sea level.
The climate in North Zanesville is classified as humid continental, with hot summers and cold winters. The average annual temperature is 52 degrees Fahrenheit, with an average high of 79 degrees in the summer and an average low of 25 degrees in the winter. The average annual precipitation is 40 inches.
Economy
The economy of North Zanesville is largely based on agriculture. The village is home to a number of farms, including dairy farms, beef farms, and vegetable farms. The village also has a number of small businesses, including restaurants, convenience stores, and auto repair shops.
Demographics
As of the 2010 census, the population of North Zanesville was 1,000. The racial makeup of the village was 97.2% White, 0.7% African American, 0.2% Native American, 0.2% Asian, and 1.7% from other races. The median household income was $37,500 and the median family income was $45,000. The per capita income was $18,000.
Conclusion
North Zanesville is a small village located in Muskingum County, Ohio. It is situated along the Muskingum River, approximately 10 miles north of Zanesville. The village has a population of approximately 1,000 people and is part of the Zanesville Metropolitan Statistical Area. The economy of North Zanesville is largely based on agriculture, and the village is home to a number of small businesses. The racial makeup of the village is predominantly White, with a small percentage of African American, Native American, and Asian residents. The median household income is $37,500 and the median family income is $45,000.
Common Questions
What is Per Capita Income in North Zanesville?
Per Capita income in North Zanesville is $49,805.
What is the Median Family Income in North Zanesville?
Median Family Income in North Zanesville is $126,250.
What is the Median Household income in North Zanesville?
Median Household Income in North Zanesville is $100,156.
What is Income or Wage Gap in North Zanesville?
Income or Wage Gap in North Zanesville is 22.7%.
Women in North Zanesville earn 77.3 cents for every dollar earned by a man.
What is Inequality or Gini Index in North Zanesville?
Inequality or Gini Index in North Zanesville is 0.40.
What is the Total Population of North Zanesville?
Total Population of North Zanesville is 2,633.
What is the Total Male Population of North Zanesville?
Total Male Population of North Zanesville is 1,286.
What is the Total Female Population of North Zanesville?
Total Female Population of North Zanesville is 1,347.
What is the Ratio of Males per 100 Females in North Zanesville?
There are 95.47 Males per 100 Females in North Zanesville.
What is the Ratio of Females per 100 Males in North Zanesville?
There are 104.74 Females per 100 Males in North Zanesville.
What is the Median Population Age in North Zanesville?
Median Population Age in North Zanesville is 54.1 Years.
What is the Average Family Size in North Zanesville
Average Family Size in North Zanesville is 2.6 People.
What is the Average Household Size in North Zanesville
Average Household Size in North Zanesville is 2.2 People.
How Large is the Labor Force in North Zanesville?
There are 1,322 People in the Labor Forcein in North Zanesville.
What is the Percentage of People in the Labor Force in North Zanesville?
58.7% of People are in the Labor Force in North Zanesville.
What is the Unemployment Rate in North Zanesville?
Unemployment Rate in North Zanesville is 3.1%.