Upper Arlington, OH Map & Demographics
Upper Arlington Map
Upper Arlington Overview
$79,874
PER CAPITA INCOME
$187,754
AVG FAMILY INCOME
$144,705
AVG HOUSEHOLD INCOME
44.8%
WAGE / INCOME GAP [ % ]
55.2¢/ $1
WAGE / INCOME GAP [ $ ]
$16,816
FAMILY INCOME DEFICIT
0.47
INEQUALITY / GINI INDEX
36,500
TOTAL POPULATION
18,260
MALE POPULATION
18,240
FEMALE POPULATION
100.11
MALES / 100 FEMALES
99.89
FEMALES / 100 MALES
40.3
MEDIAN AGE
3.1
AVG FAMILY SIZE
2.5
AVG HOUSEHOLD SIZE
18,693
LABOR FORCE [ PEOPLE ]
67.9%
PERCENT IN LABOR FORCE
2.2%
UNEMPLOYMENT RATE
Upper Arlington Area Codes
Income in Upper Arlington
Income Overview in Upper Arlington
Per Capita Income in Upper Arlington is $79,874, while median incomes of families and households are $187,754 and $144,705 respectively.
| Characteristic | Number | Measure |
| Per Capita Income | 36,500 | $79,874 |
| Median Family Income | 9,944 | $187,754 |
| Mean Family Income | 9,944 | $243,633 |
| Median Household Income | 14,268 | $144,705 |
| Mean Household Income | 14,268 | $202,933 |
| Income Deficit | 9,944 | $16,816 |
| Wage / Income Gap (%) | 36,500 | 44.83% |
| Wage / Income Gap ($) | 36,500 | 55.17¢ per $1 |
| Gini / Inequality Index | 36,500 | 0.47 |
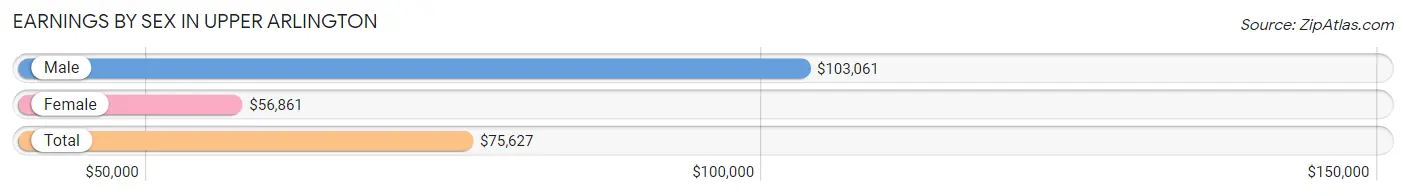
Earnings by Sex in Upper Arlington
Average Earnings in Upper Arlington are $75,627, $103,061 for men and $56,861 for women, a difference of 44.8%.
| Sex | Number | Average Earnings |
| Male | 10,527 (53.7%) | $103,061 |
| Female | 9,083 (46.3%) | $56,861 |
| Total | 19,610 (100.0%) | $75,627 |
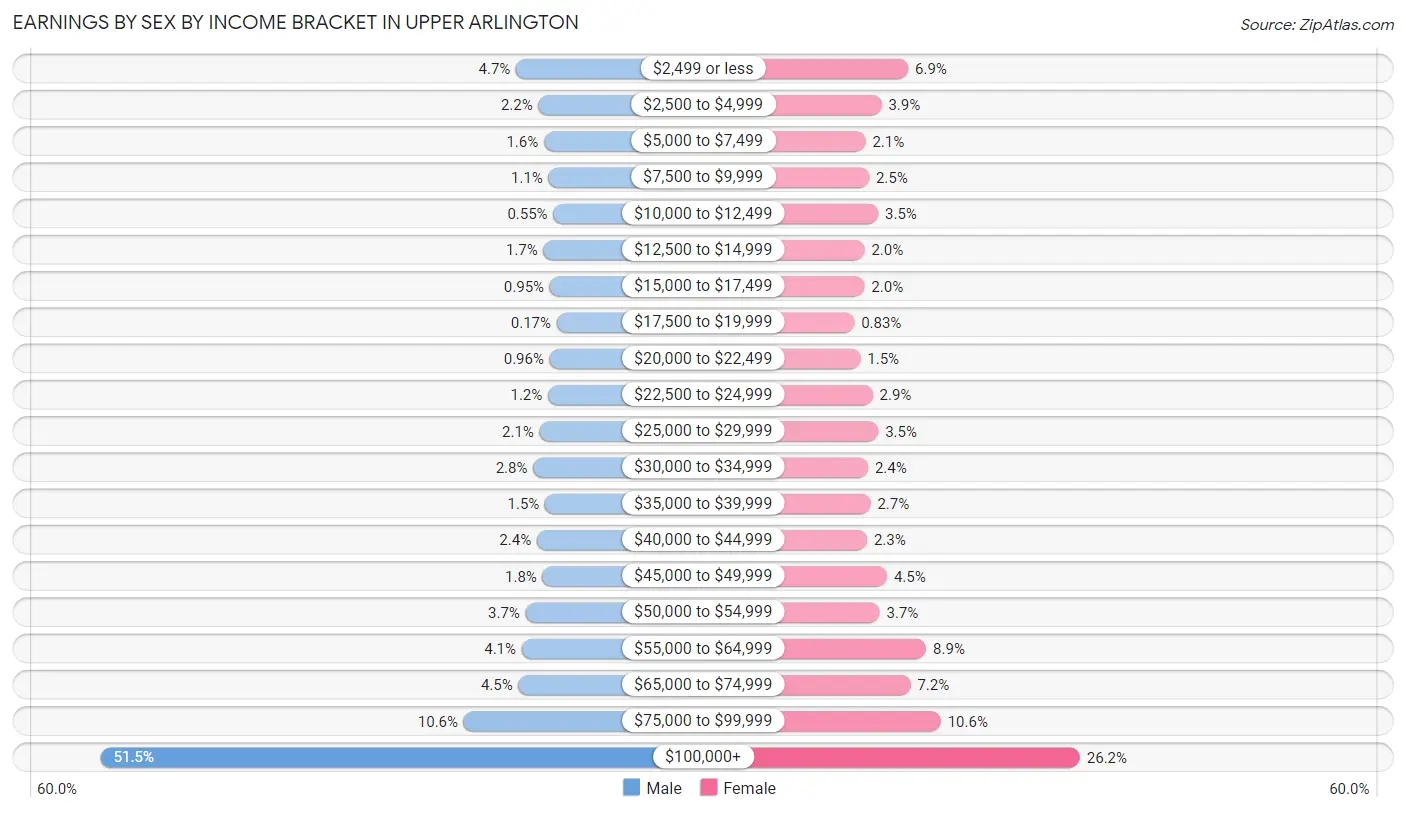
Earnings by Sex by Income Bracket in Upper Arlington
The most common earnings brackets in Upper Arlington are $100,000+ for men (5,416 | 51.4%) and $100,000+ for women (2,380 | 26.2%).
| Income | Male | Female |
| $2,499 or less | 499 (4.7%) | 626 (6.9%) |
| $2,500 to $4,999 | 235 (2.2%) | 354 (3.9%) |
| $5,000 to $7,499 | 170 (1.6%) | 191 (2.1%) |
| $7,500 to $9,999 | 115 (1.1%) | 226 (2.5%) |
| $10,000 to $12,499 | 58 (0.5%) | 320 (3.5%) |
| $12,500 to $14,999 | 175 (1.7%) | 181 (2.0%) |
| $15,000 to $17,499 | 100 (0.9%) | 180 (2.0%) |
| $17,500 to $19,999 | 18 (0.2%) | 75 (0.8%) |
| $20,000 to $22,499 | 101 (1.0%) | 138 (1.5%) |
| $22,500 to $24,999 | 121 (1.1%) | 263 (2.9%) |
| $25,000 to $29,999 | 221 (2.1%) | 321 (3.5%) |
| $30,000 to $34,999 | 297 (2.8%) | 216 (2.4%) |
| $35,000 to $39,999 | 156 (1.5%) | 242 (2.7%) |
| $40,000 to $44,999 | 253 (2.4%) | 206 (2.3%) |
| $45,000 to $49,999 | 185 (1.8%) | 411 (4.5%) |
| $50,000 to $54,999 | 386 (3.7%) | 334 (3.7%) |
| $55,000 to $64,999 | 432 (4.1%) | 810 (8.9%) |
| $65,000 to $74,999 | 471 (4.5%) | 650 (7.2%) |
| $75,000 to $99,999 | 1,118 (10.6%) | 959 (10.6%) |
| $100,000+ | 5,416 (51.4%) | 2,380 (26.2%) |
| Total | 10,527 (100.0%) | 9,083 (100.0%) |
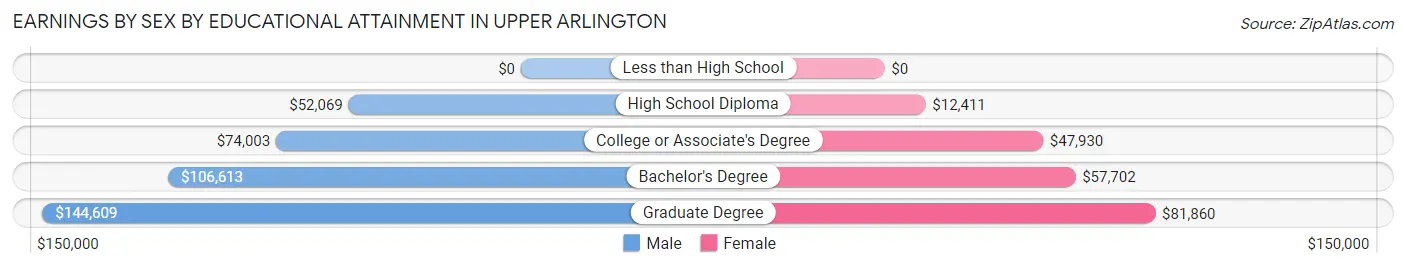
Earnings by Sex by Educational Attainment in Upper Arlington
Average earnings in Upper Arlington are $108,260 for men and $62,851 for women, a difference of 41.9%. Men with an educational attainment of graduate degree enjoy the highest average annual earnings of $144,609, while those with high school diploma education earn the least with $52,069. Women with an educational attainment of graduate degree earn the most with the average annual earnings of $81,860, while those with high school diploma education have the smallest earnings of $12,411.
| Educational Attainment | Male Income | Female Income |
| Less than High School | - | - |
| High School Diploma | $52,069 | $12,411 |
| College or Associate's Degree | $74,003 | $47,930 |
| Bachelor's Degree | $106,613 | $57,702 |
| Graduate Degree | $144,609 | $81,860 |
| Total | $108,260 | $62,851 |
Family Income in Upper Arlington
Family Income Brackets in Upper Arlington
According to the Upper Arlington family income data, there are 4,684 families falling into the $200,000+ income range, which is the most common income bracket and makes up 47.1% of all families. Conversely, the less than $10,000 income bracket is the least frequent group with only 20 families (0.2%) belonging to this category.
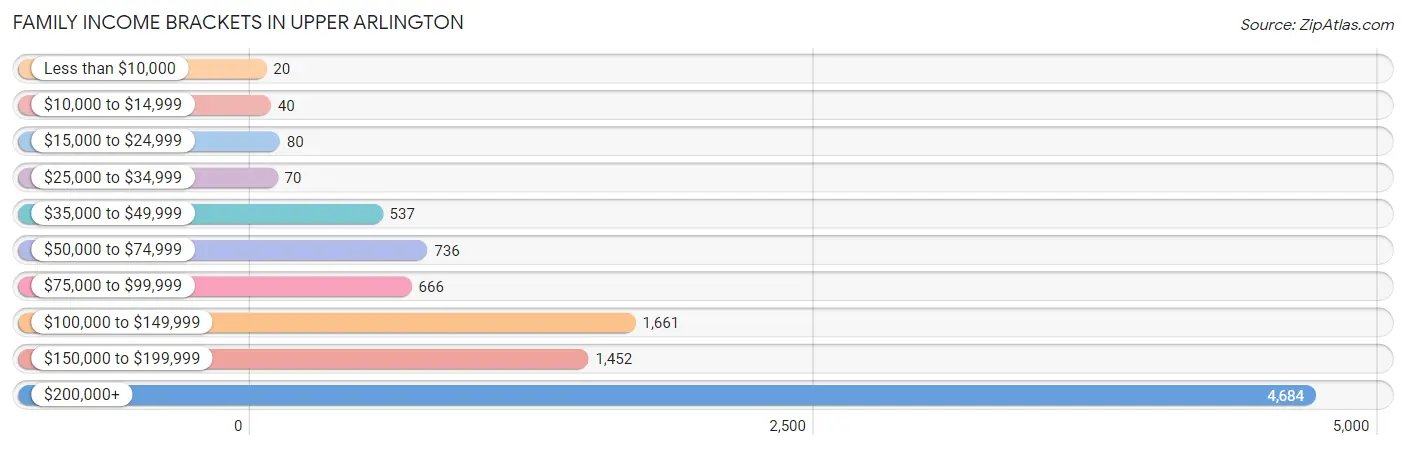
| Income Bracket | # Families | % Families |
| Less than $10,000 | 20 | 0.2% |
| $10,000 to $14,999 | 40 | 0.4% |
| $15,000 to $24,999 | 80 | 0.8% |
| $25,000 to $34,999 | 70 | 0.7% |
| $35,000 to $49,999 | 537 | 5.4% |
| $50,000 to $74,999 | 736 | 7.4% |
| $75,000 to $99,999 | 666 | 6.7% |
| $100,000 to $149,999 | 1,661 | 16.7% |
| $150,000 to $199,999 | 1,452 | 14.6% |
| $200,000+ | 4,684 | 47.1% |
Family Income by Famaliy Size in Upper Arlington
4-person families (2,647 | 26.6%) account for the highest median family income in Upper Arlington with $224,310 per family, while 2-person families (4,213 | 42.4%) have the highest median income of $78,519 per family member.
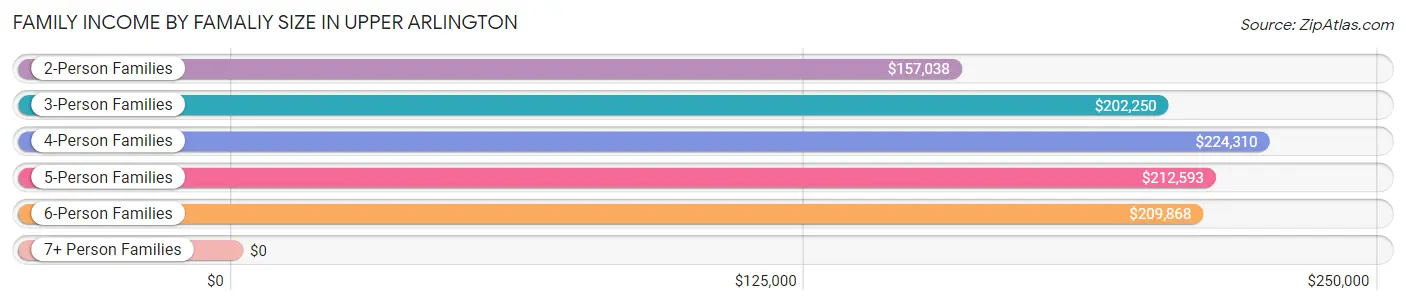
| Income Bracket | # Families | Median Income |
| 2-Person Families | 4,213 (42.4%) | $157,038 |
| 3-Person Families | 1,963 (19.7%) | $202,250 |
| 4-Person Families | 2,647 (26.6%) | $224,310 |
| 5-Person Families | 796 (8.0%) | $212,593 |
| 6-Person Families | 206 (2.1%) | $209,868 |
| 7+ Person Families | 119 (1.2%) | $0 |
| Total | 9,944 (100.0%) | $187,754 |
Family Income by Number of Earners in Upper Arlington
The median family income in Upper Arlington is $187,754, with families comprising 2 earners (4,919) having the highest median family income of $215,096, while families with no earners (1,092) have the lowest median family income of $108,173, accounting for 49.5% and 11.0% of families, respectively.
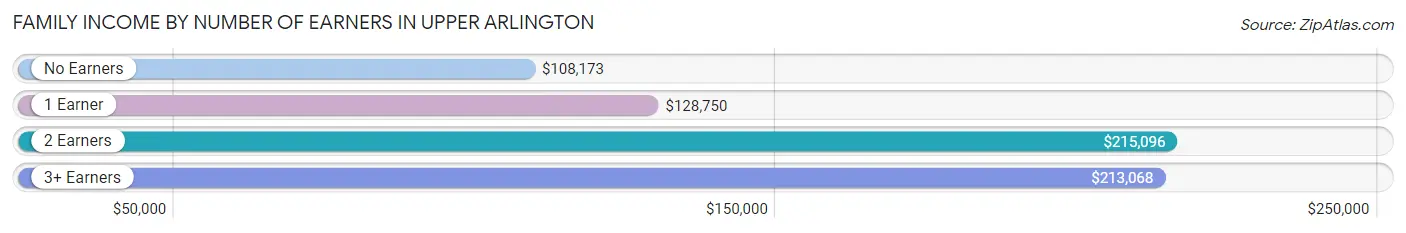
| Number of Earners | # Families | Median Income |
| No Earners | 1,092 (11.0%) | $108,173 |
| 1 Earner | 2,826 (28.4%) | $128,750 |
| 2 Earners | 4,919 (49.5%) | $215,096 |
| 3+ Earners | 1,107 (11.1%) | $213,068 |
| Total | 9,944 (100.0%) | $187,754 |
Household Income in Upper Arlington
Household Income Brackets in Upper Arlington
With 5,108 households falling in the category, the $200,000+ income range is the most frequent in Upper Arlington, accounting for 35.8% of all households. In contrast, only 86 households (0.6%) fall into the $10,000 to $14,999 income bracket, making it the least populous group.
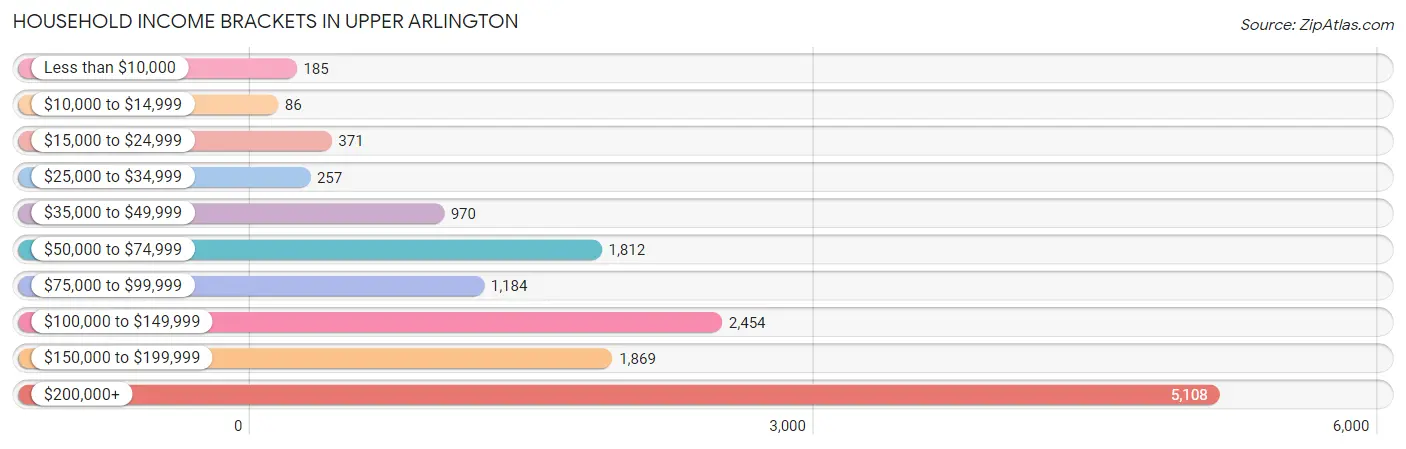
| Income Bracket | # Households | % Households |
| Less than $10,000 | 185 | 1.3% |
| $10,000 to $14,999 | 86 | 0.6% |
| $15,000 to $24,999 | 371 | 2.6% |
| $25,000 to $34,999 | 257 | 1.8% |
| $35,000 to $49,999 | 970 | 6.8% |
| $50,000 to $74,999 | 1,812 | 12.7% |
| $75,000 to $99,999 | 1,184 | 8.3% |
| $100,000 to $149,999 | 2,454 | 17.2% |
| $150,000 to $199,999 | 1,869 | 13.1% |
| $200,000+ | 5,108 | 35.8% |
Household Income by Householder Age in Upper Arlington
The median household income in Upper Arlington is $144,705, with the highest median household income of $184,274 found in the 45 to 64 years age bracket for the primary householder. A total of 5,259 households (36.9%) fall into this category. Meanwhile, the 15 to 24 years age bracket for the primary householder has the lowest median household income of $50,179, with 132 households (0.9%) in this group.
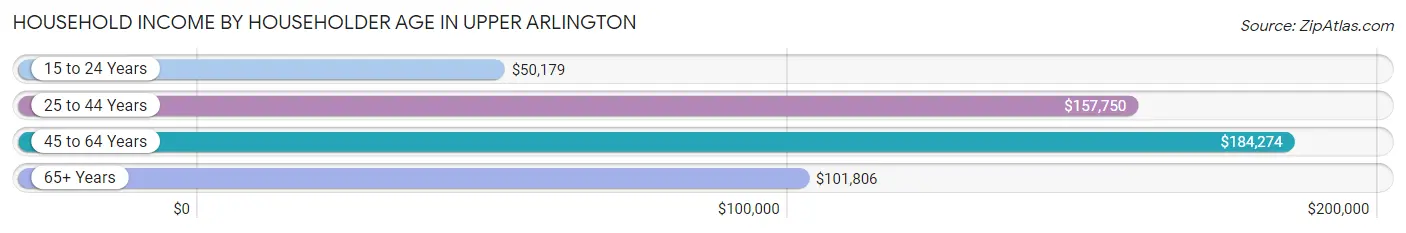
| Income Bracket | # Households | Median Income |
| 15 to 24 Years | 132 (0.9%) | $50,179 |
| 25 to 44 Years | 4,611 (32.3%) | $157,750 |
| 45 to 64 Years | 5,259 (36.9%) | $184,274 |
| 65+ Years | 4,266 (29.9%) | $101,806 |
| Total | 14,268 (100.0%) | $144,705 |
Poverty in Upper Arlington
Income Below Poverty by Sex and Age in Upper Arlington
With 2.3% poverty level for males and 2.9% for females among the residents of Upper Arlington, 15 year old males and 18 to 24 year old females are the most vulnerable to poverty, with 25 males (10.3%) and 77 females (11.2%) in their respective age groups living below the poverty level.
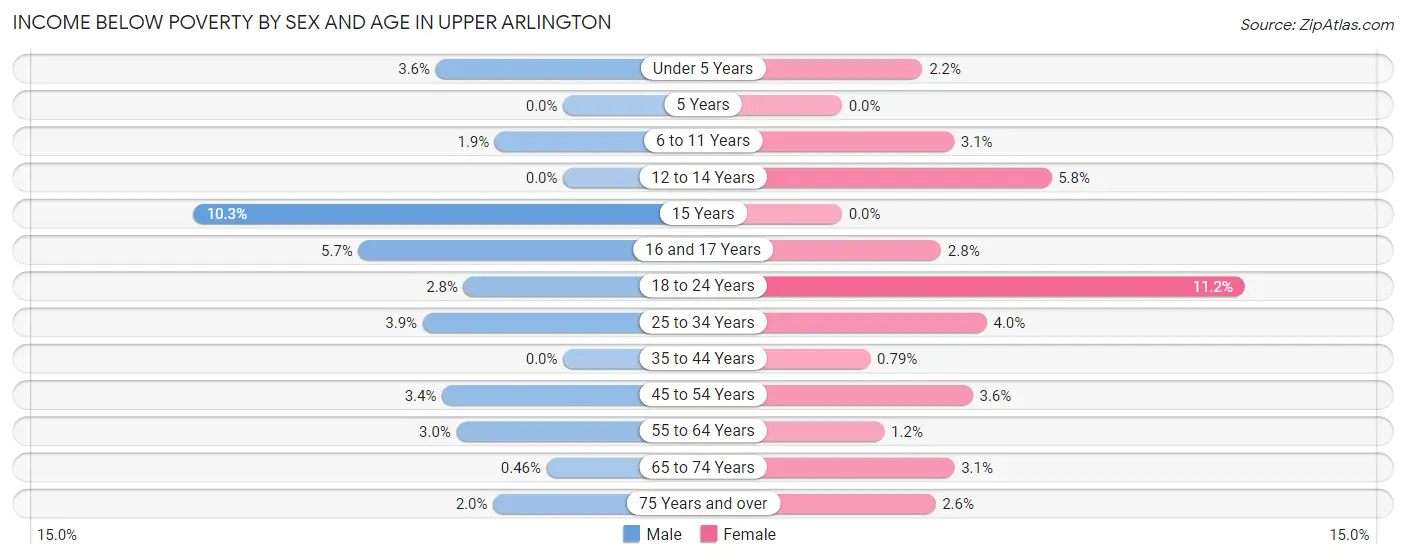
| Age Bracket | Male | Female |
| Under 5 Years | 43 (3.5%) | 31 (2.2%) |
| 5 Years | 0 (0.0%) | 0 (0.0%) |
| 6 to 11 Years | 35 (1.9%) | 48 (3.1%) |
| 12 to 14 Years | 0 (0.0%) | 51 (5.8%) |
| 15 Years | 25 (10.3%) | 0 (0.0%) |
| 16 and 17 Years | 41 (5.7%) | 11 (2.8%) |
| 18 to 24 Years | 20 (2.8%) | 77 (11.2%) |
| 25 to 34 Years | 72 (3.9%) | 69 (4.0%) |
| 35 to 44 Years | 0 (0.0%) | 22 (0.8%) |
| 45 to 54 Years | 89 (3.4%) | 96 (3.6%) |
| 55 to 64 Years | 55 (3.0%) | 25 (1.2%) |
| 65 to 74 Years | 8 (0.5%) | 63 (3.1%) |
| 75 Years and over | 27 (1.9%) | 36 (2.6%) |
| Total | 415 (2.3%) | 529 (2.9%) |
Income Above Poverty by Sex and Age in Upper Arlington
According to the poverty statistics in Upper Arlington, males aged 5 years and females aged 5 years are the age groups that are most secure financially, with 100.0% of males and 100.0% of females in these age groups living above the poverty line.
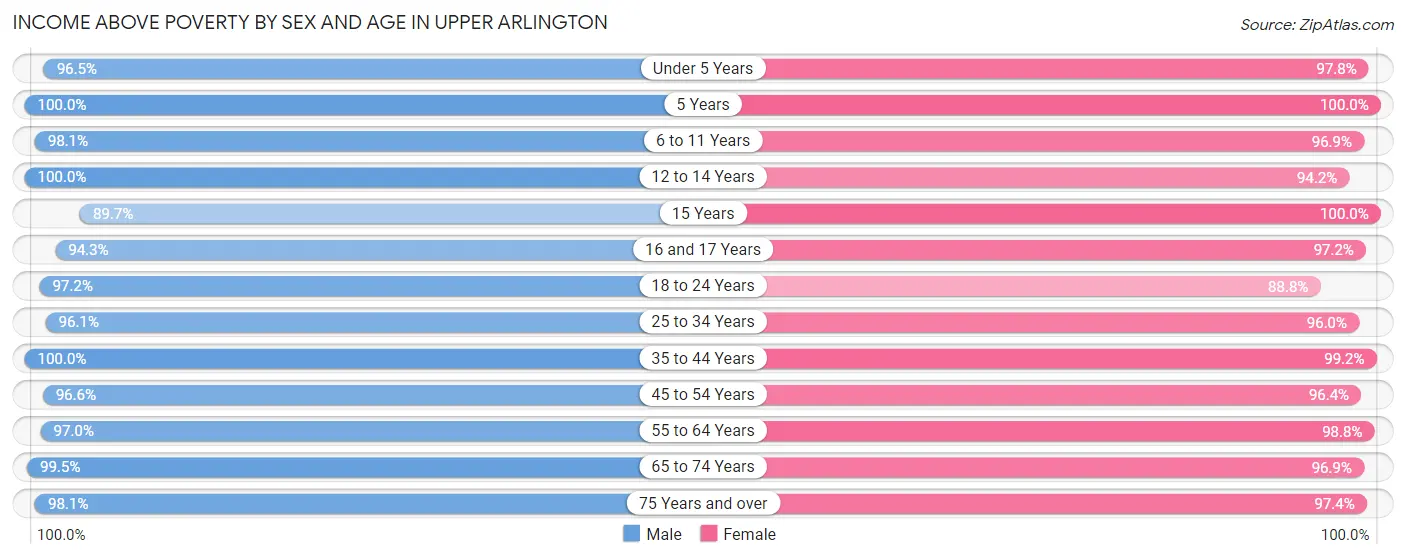
| Age Bracket | Male | Female |
| Under 5 Years | 1,169 (96.5%) | 1,352 (97.8%) |
| 5 Years | 330 (100.0%) | 284 (100.0%) |
| 6 to 11 Years | 1,805 (98.1%) | 1,492 (96.9%) |
| 12 to 14 Years | 964 (100.0%) | 824 (94.2%) |
| 15 Years | 218 (89.7%) | 291 (100.0%) |
| 16 and 17 Years | 678 (94.3%) | 387 (97.2%) |
| 18 to 24 Years | 701 (97.2%) | 609 (88.8%) |
| 25 to 34 Years | 1,771 (96.1%) | 1,642 (96.0%) |
| 35 to 44 Years | 2,712 (100.0%) | 2,758 (99.2%) |
| 45 to 54 Years | 2,552 (96.6%) | 2,538 (96.4%) |
| 55 to 64 Years | 1,798 (97.0%) | 2,096 (98.8%) |
| 65 to 74 Years | 1,719 (99.5%) | 1,952 (96.9%) |
| 75 Years and over | 1,359 (98.1%) | 1,347 (97.4%) |
| Total | 17,776 (97.7%) | 17,572 (97.1%) |
Income Below Poverty Among Married-Couple Families in Upper Arlington
The poverty statistics for married-couple families in Upper Arlington show that 0.9% or 76 of the total 8,710 families live below the poverty line. Families with 3 or 4 children have the highest poverty rate of 3.6%, comprising of 32 families. On the other hand, families with 5 or more children have the lowest poverty rate of 0.0%, which includes 0 families.
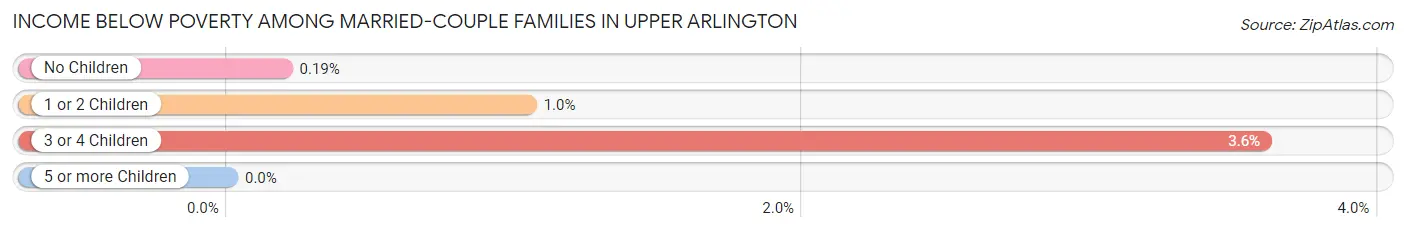
| Children | Above Poverty | Below Poverty |
| No Children | 4,243 (99.8%) | 8 (0.2%) |
| 1 or 2 Children | 3,437 (99.0%) | 36 (1.0%) |
| 3 or 4 Children | 857 (96.4%) | 32 (3.6%) |
| 5 or more Children | 97 (100.0%) | 0 (0.0%) |
| Total | 8,634 (99.1%) | 76 (0.9%) |
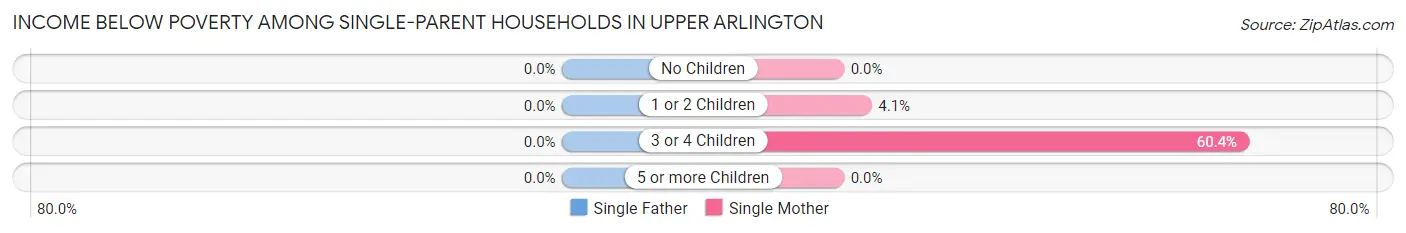
Income Below Poverty Among Single-Parent Households in Upper Arlington
| Children | Single Father | Single Mother |
| No Children | 0 (0.0%) | 0 (0.0%) |
| 1 or 2 Children | 0 (0.0%) | 20 (4.1%) |
| 3 or 4 Children | 0 (0.0%) | 32 (60.4%) |
| 5 or more Children | 0 (0.0%) | 0 (0.0%) |
| Total | 0 (0.0%) | 52 (5.9%) |
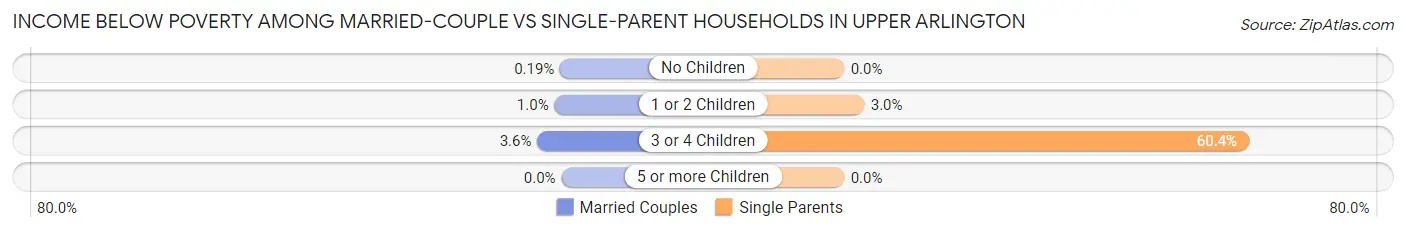
Income Below Poverty Among Married-Couple vs Single-Parent Households in Upper Arlington
The poverty data for Upper Arlington shows that 76 of the married-couple family households (0.9%) and 52 of the single-parent households (4.2%) are living below the poverty level. Within the married-couple family households, those with 3 or 4 children have the highest poverty rate, with 32 households (3.6%) falling below the poverty line. Among the single-parent households, those with 3 or 4 children have the highest poverty rate, with 32 household (60.4%) living below poverty.
| Children | Married-Couple Families | Single-Parent Households |
| No Children | 8 (0.2%) | 0 (0.0%) |
| 1 or 2 Children | 36 (1.0%) | 20 (3.0%) |
| 3 or 4 Children | 32 (3.6%) | 32 (60.4%) |
| 5 or more Children | 0 (0.0%) | 0 (0.0%) |
| Total | 76 (0.9%) | 52 (4.2%) |
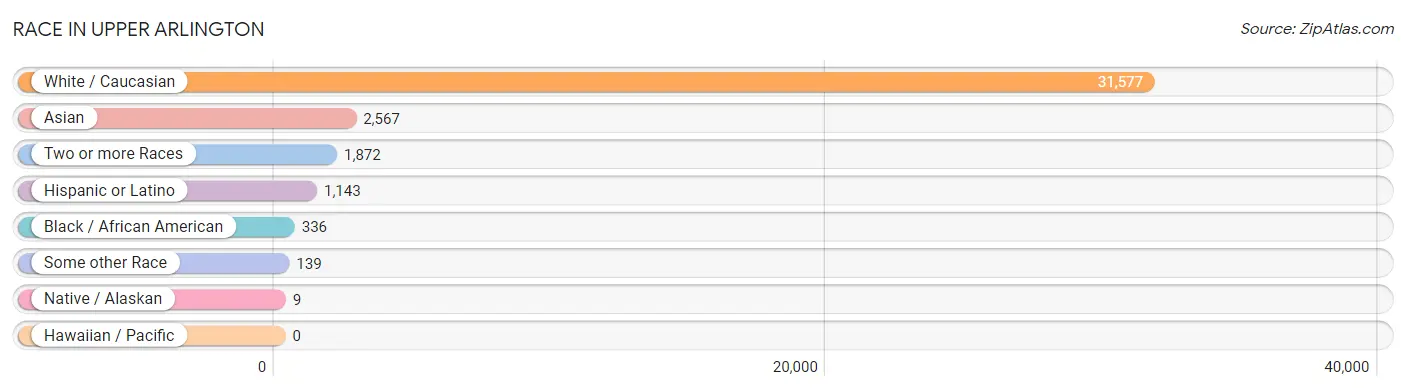
Race in Upper Arlington
The most populous races in Upper Arlington are White / Caucasian (31,577 | 86.5%), Asian (2,567 | 7.0%), and Two or more Races (1,872 | 5.1%).
| Race | # Population | % Population |
| Asian | 2,567 | 7.0% |
| Black / African American | 336 | 0.9% |
| Hawaiian / Pacific | 0 | 0.0% |
| Hispanic or Latino | 1,143 | 3.1% |
| Native / Alaskan | 9 | 0.0% |
| White / Caucasian | 31,577 | 86.5% |
| Two or more Races | 1,872 | 5.1% |
| Some other Race | 139 | 0.4% |
| Total | 36,500 | 100.0% |
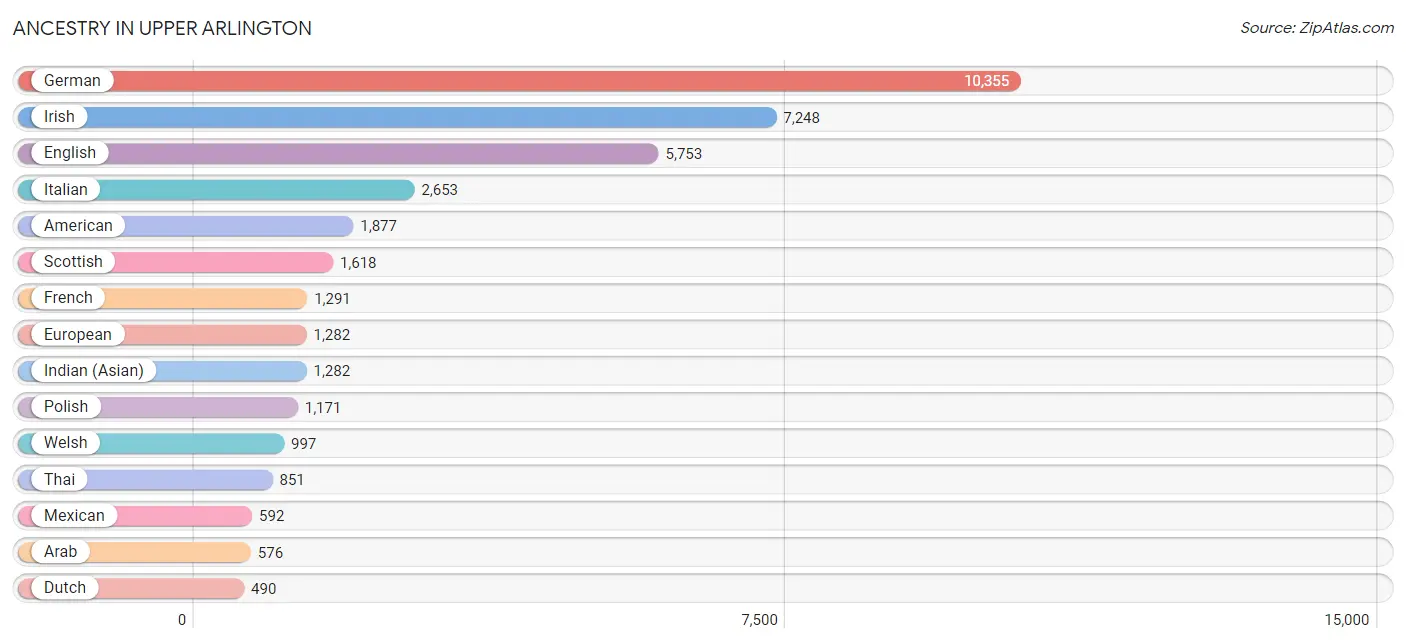
Ancestry in Upper Arlington
The most populous ancestries reported in Upper Arlington are German (10,355 | 28.4%), Irish (7,248 | 19.9%), English (5,753 | 15.8%), Italian (2,653 | 7.3%), and American (1,877 | 5.1%), together accounting for 76.4% of all Upper Arlington residents.
| Ancestry | # Population | % Population |
| African | 54 | 0.2% |
| Albanian | 9 | 0.0% |
| Alsatian | 10 | 0.0% |
| American | 1,877 | 5.1% |
| Arab | 576 | 1.6% |
| Armenian | 58 | 0.2% |
| Australian | 18 | 0.1% |
| Austrian | 108 | 0.3% |
| Belgian | 41 | 0.1% |
| Bhutanese | 173 | 0.5% |
| British | 294 | 0.8% |
| Burmese | 339 | 0.9% |
| Canadian | 36 | 0.1% |
| Central American | 111 | 0.3% |
| Central American Indian | 4 | 0.0% |
| Cherokee | 31 | 0.1% |
| Colombian | 45 | 0.1% |
| Croatian | 197 | 0.5% |
| Cuban | 9 | 0.0% |
| Czech | 220 | 0.6% |
| Czechoslovakian | 44 | 0.1% |
| Danish | 147 | 0.4% |
| Dutch | 490 | 1.3% |
| Eastern European | 157 | 0.4% |
| Egyptian | 144 | 0.4% |
| English | 5,753 | 15.8% |
| European | 1,282 | 3.5% |
| Filipino | 173 | 0.5% |
| Finnish | 97 | 0.3% |
| French | 1,291 | 3.5% |
| French Canadian | 288 | 0.8% |
| German | 10,355 | 28.4% |
| Ghanaian | 42 | 0.1% |
| Greek | 426 | 1.2% |
| Guatemalan | 39 | 0.1% |
| Honduran | 17 | 0.1% |
| Hungarian | 446 | 1.2% |
| Indian (Asian) | 1,282 | 3.5% |
| Indonesian | 9 | 0.0% |
| Iranian | 46 | 0.1% |
| Irish | 7,248 | 19.9% |
| Iroquois | 13 | 0.0% |
| Israeli | 6 | 0.0% |
| Italian | 2,653 | 7.3% |
| Jordanian | 80 | 0.2% |
| Korean | 175 | 0.5% |
| Latvian | 12 | 0.0% |
| Lebanese | 122 | 0.3% |
| Lithuanian | 121 | 0.3% |
| Luxembourger | 20 | 0.1% |
| Macedonian | 14 | 0.0% |
| Mexican | 592 | 1.6% |
| Mexican American Indian | 5 | 0.0% |
| Mongolian | 39 | 0.1% |
| Moroccan | 6 | 0.0% |
| New Zealander | 51 | 0.1% |
| Nicaraguan | 46 | 0.1% |
| Nigerian | 15 | 0.0% |
| Northern European | 106 | 0.3% |
| Norwegian | 355 | 1.0% |
| Ottawa | 6 | 0.0% |
| Pakistani | 5 | 0.0% |
| Palestinian | 144 | 0.4% |
| Panamanian | 9 | 0.0% |
| Pennsylvania German | 9 | 0.0% |
| Polish | 1,171 | 3.2% |
| Portuguese | 72 | 0.2% |
| Puerto Rican | 113 | 0.3% |
| Romanian | 93 | 0.3% |
| Russian | 254 | 0.7% |
| Scandinavian | 76 | 0.2% |
| Scotch-Irish | 308 | 0.8% |
| Scottish | 1,618 | 4.4% |
| Slavic | 24 | 0.1% |
| Slovak | 435 | 1.2% |
| Slovene | 76 | 0.2% |
| South American | 140 | 0.4% |
| Spaniard | 136 | 0.4% |
| Sri Lankan | 88 | 0.2% |
| Subsaharan African | 128 | 0.4% |
| Swedish | 230 | 0.6% |
| Swiss | 221 | 0.6% |
| Thai | 851 | 2.3% |
| Turkish | 34 | 0.1% |
| Ukrainian | 76 | 0.2% |
| Venezuelan | 95 | 0.3% |
| Welsh | 997 | 2.7% |
| Yugoslavian | 48 | 0.1% | View All 88 Rows |
Immigrants in Upper Arlington
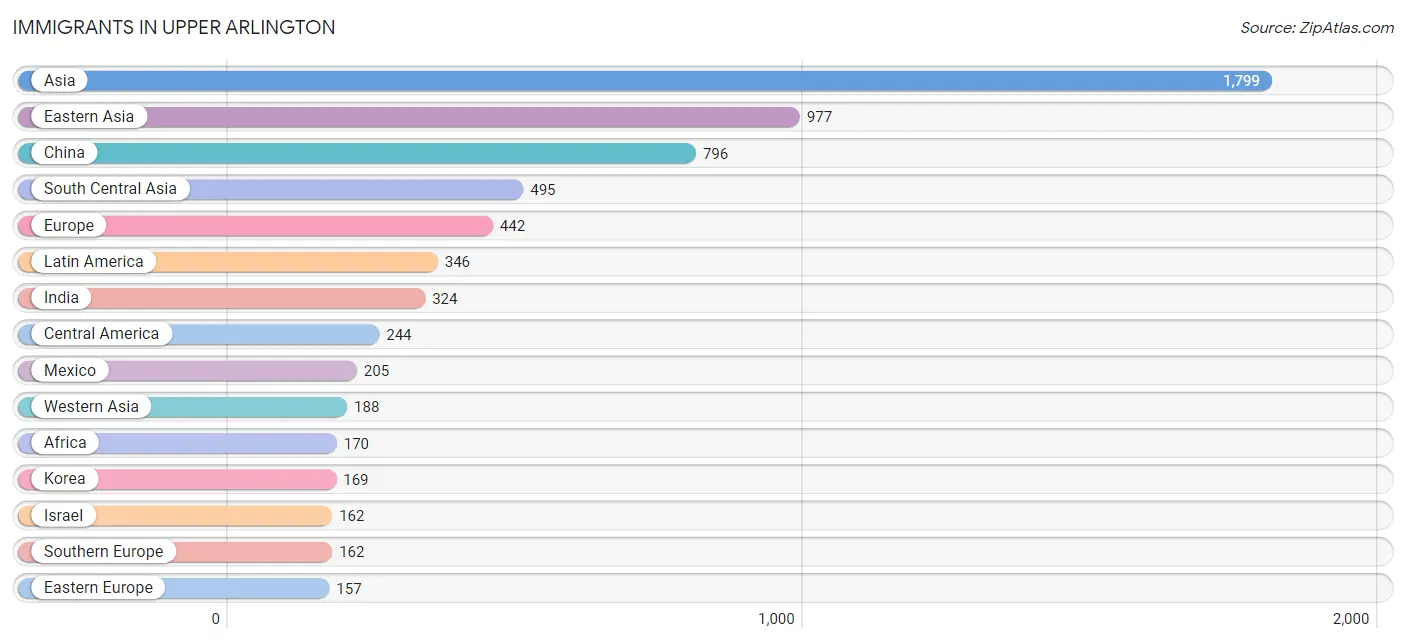
The most numerous immigrant groups reported in Upper Arlington came from Asia (1,799 | 4.9%), Eastern Asia (977 | 2.7%), China (796 | 2.2%), South Central Asia (495 | 1.4%), and Europe (442 | 1.2%), together accounting for 12.4% of all Upper Arlington residents.
| Immigration Origin | # Population | % Population |
| Africa | 170 | 0.5% |
| Argentina | 10 | 0.0% |
| Asia | 1,799 | 4.9% |
| Australia | 11 | 0.0% |
| Belgium | 5 | 0.0% |
| Bosnia and Herzegovina | 9 | 0.0% |
| Brazil | 12 | 0.0% |
| Cameroon | 7 | 0.0% |
| Canada | 105 | 0.3% |
| Caribbean | 5 | 0.0% |
| Central America | 244 | 0.7% |
| China | 796 | 2.2% |
| Colombia | 21 | 0.1% |
| Czechoslovakia | 12 | 0.0% |
| Eastern Asia | 977 | 2.7% |
| Eastern Europe | 157 | 0.4% |
| Egypt | 88 | 0.2% |
| England | 45 | 0.1% |
| Europe | 442 | 1.2% |
| Germany | 19 | 0.1% |
| Ghana | 9 | 0.0% |
| Greece | 56 | 0.2% |
| Guatemala | 30 | 0.1% |
| Guyana | 11 | 0.0% |
| India | 324 | 0.9% |
| Iran | 28 | 0.1% |
| Ireland | 9 | 0.0% |
| Israel | 162 | 0.4% |
| Italy | 22 | 0.1% |
| Jamaica | 5 | 0.0% |
| Japan | 12 | 0.0% |
| Jordan | 18 | 0.1% |
| Korea | 169 | 0.5% |
| Latin America | 346 | 0.9% |
| Lithuania | 9 | 0.0% |
| Malaysia | 39 | 0.1% |
| Mexico | 205 | 0.6% |
| Middle Africa | 7 | 0.0% |
| Nepal | 86 | 0.2% |
| Nigeria | 38 | 0.1% |
| Northern Africa | 116 | 0.3% |
| Northern Europe | 99 | 0.3% |
| Oceania | 30 | 0.1% |
| Pakistan | 40 | 0.1% |
| Panama | 9 | 0.0% |
| Peru | 5 | 0.0% |
| Philippines | 21 | 0.1% |
| Poland | 12 | 0.0% |
| Romania | 55 | 0.2% |
| Russia | 48 | 0.1% |
| Scotland | 7 | 0.0% |
| Singapore | 18 | 0.1% |
| South America | 97 | 0.3% |
| South Central Asia | 495 | 1.4% |
| South Eastern Asia | 139 | 0.4% |
| Southern Europe | 162 | 0.4% |
| Spain | 84 | 0.2% |
| Sri Lanka | 17 | 0.1% |
| Taiwan | 67 | 0.2% |
| Thailand | 14 | 0.0% |
| Turkey | 8 | 0.0% |
| Venezuela | 26 | 0.1% |
| Vietnam | 47 | 0.1% |
| Western Africa | 47 | 0.1% |
| Western Asia | 188 | 0.5% |
| Western Europe | 24 | 0.1% | View All 66 Rows |
Sex and Age in Upper Arlington
Sex and Age in Upper Arlington
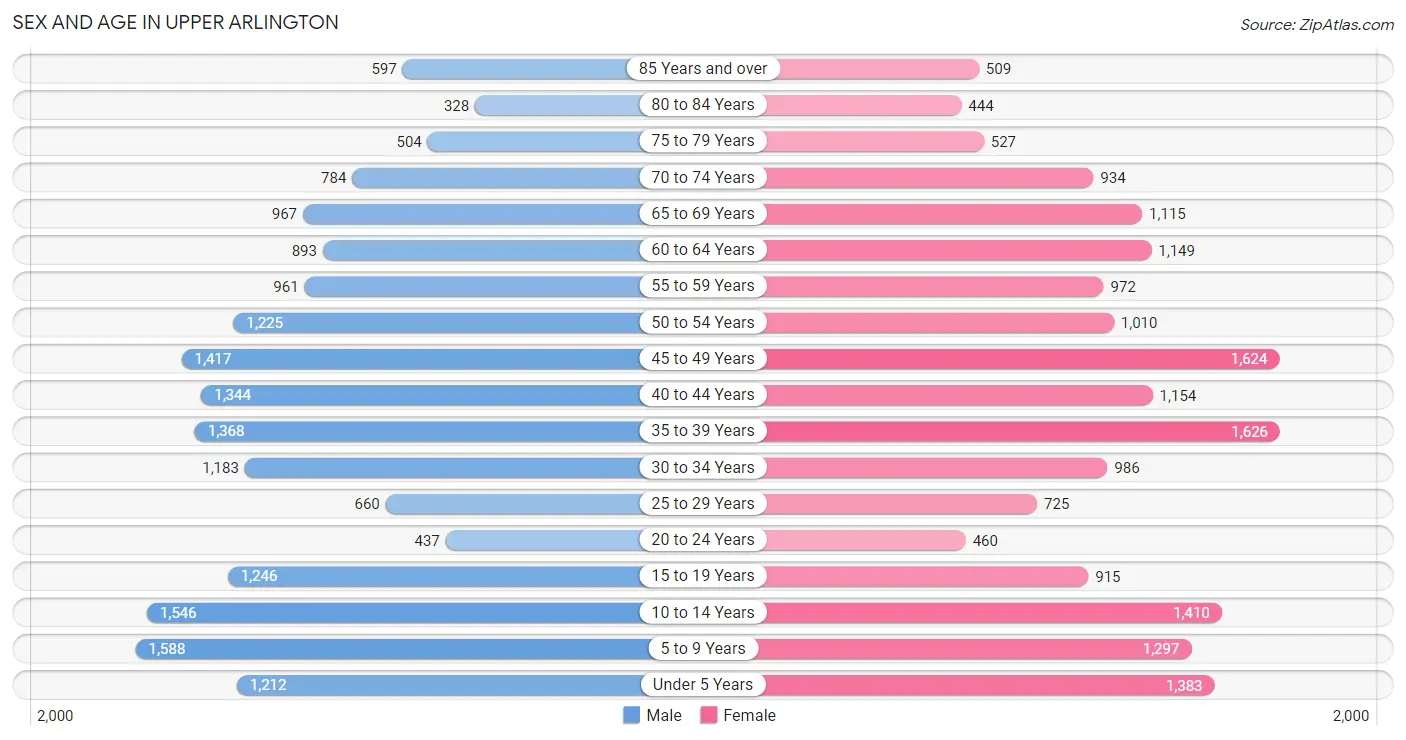
The most populous age groups in Upper Arlington are 5 to 9 Years (1,588 | 8.7%) for men and 35 to 39 Years (1,626 | 8.9%) for women.
| Age Bracket | Male | Female |
| Under 5 Years | 1,212 (6.6%) | 1,383 (7.6%) |
| 5 to 9 Years | 1,588 (8.7%) | 1,297 (7.1%) |
| 10 to 14 Years | 1,546 (8.5%) | 1,410 (7.7%) |
| 15 to 19 Years | 1,246 (6.8%) | 915 (5.0%) |
| 20 to 24 Years | 437 (2.4%) | 460 (2.5%) |
| 25 to 29 Years | 660 (3.6%) | 725 (4.0%) |
| 30 to 34 Years | 1,183 (6.5%) | 986 (5.4%) |
| 35 to 39 Years | 1,368 (7.5%) | 1,626 (8.9%) |
| 40 to 44 Years | 1,344 (7.4%) | 1,154 (6.3%) |
| 45 to 49 Years | 1,417 (7.8%) | 1,624 (8.9%) |
| 50 to 54 Years | 1,225 (6.7%) | 1,010 (5.5%) |
| 55 to 59 Years | 961 (5.3%) | 972 (5.3%) |
| 60 to 64 Years | 893 (4.9%) | 1,149 (6.3%) |
| 65 to 69 Years | 967 (5.3%) | 1,115 (6.1%) |
| 70 to 74 Years | 784 (4.3%) | 934 (5.1%) |
| 75 to 79 Years | 504 (2.8%) | 527 (2.9%) |
| 80 to 84 Years | 328 (1.8%) | 444 (2.4%) |
| 85 Years and over | 597 (3.3%) | 509 (2.8%) |
| Total | 18,260 (100.0%) | 18,240 (100.0%) |
Families and Households in Upper Arlington
Median Family Size in Upper Arlington
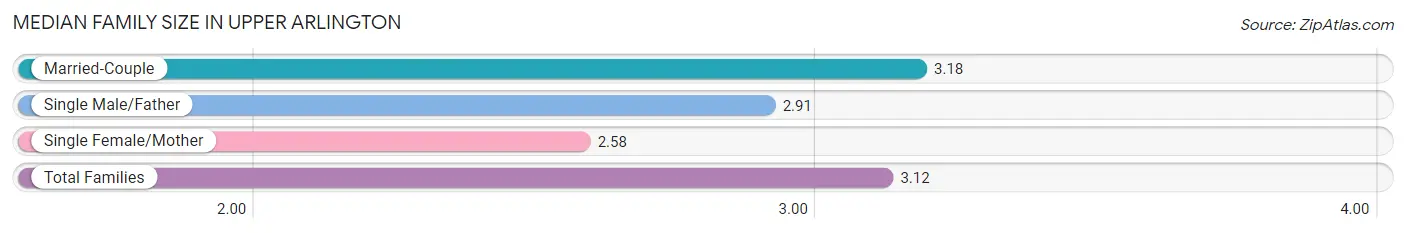
The median family size in Upper Arlington is 3.12 persons per family, with married-couple families (8,710 | 87.6%) accounting for the largest median family size of 3.18 persons per family. On the other hand, single female/mother families (885 | 8.9%) represent the smallest median family size with 2.58 persons per family.
| Family Type | # Families | Family Size |
| Married-Couple | 8,710 (87.6%) | 3.18 |
| Single Male/Father | 349 (3.5%) | 2.91 |
| Single Female/Mother | 885 (8.9%) | 2.58 |
| Total Families | 9,944 (100.0%) | 3.12 |
Median Household Size in Upper Arlington
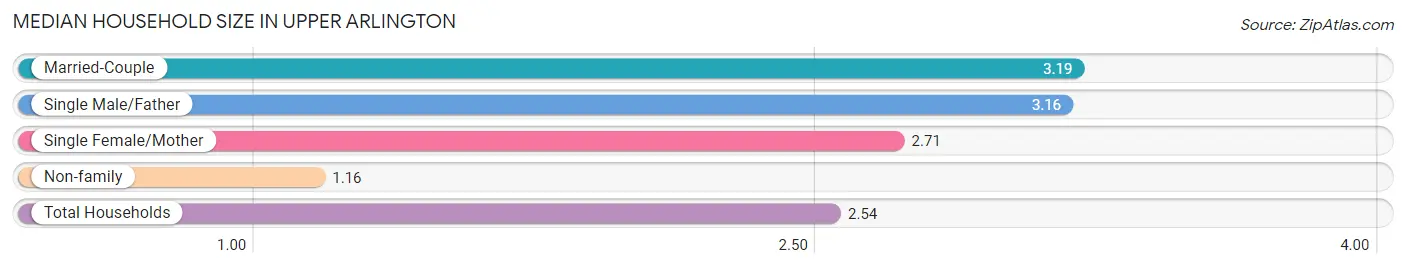
The median household size in Upper Arlington is 2.54 persons per household, with married-couple households (8,710 | 61.1%) accounting for the largest median household size of 3.19 persons per household. non-family households (4,324 | 30.3%) represent the smallest median household size with 1.16 persons per household.
| Household Type | # Households | Household Size |
| Married-Couple | 8,710 (61.1%) | 3.19 |
| Single Male/Father | 349 (2.5%) | 3.16 |
| Single Female/Mother | 885 (6.2%) | 2.71 |
| Non-family | 4,324 (30.3%) | 1.16 |
| Total Households | 14,268 (100.0%) | 2.54 |
Household Size by Marriage Status in Upper Arlington
Out of a total of 14,268 households in Upper Arlington, 9,944 (69.7%) are family households, while 4,324 (30.3%) are nonfamily households. The most numerous type of family households are 2-person households, comprising 4,127, and the most common type of nonfamily households are 1-person households, comprising 3,697.
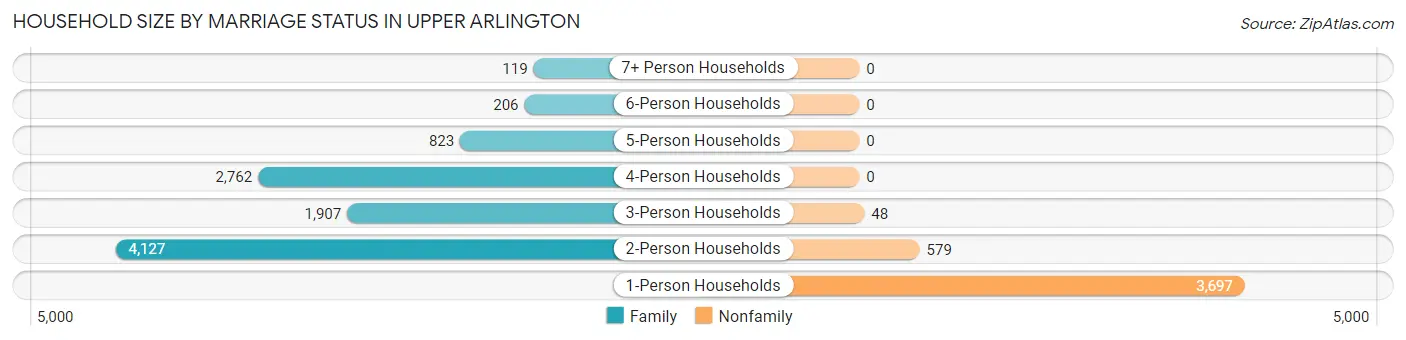
| Household Size | Family Households | Nonfamily Households |
| 1-Person Households | - | 3,697 (25.9%) |
| 2-Person Households | 4,127 (28.9%) | 579 (4.1%) |
| 3-Person Households | 1,907 (13.4%) | 48 (0.3%) |
| 4-Person Households | 2,762 (19.4%) | 0 (0.0%) |
| 5-Person Households | 823 (5.8%) | 0 (0.0%) |
| 6-Person Households | 206 (1.4%) | 0 (0.0%) |
| 7+ Person Households | 119 (0.8%) | 0 (0.0%) |
| Total | 9,944 (69.7%) | 4,324 (30.3%) |
Female Fertility in Upper Arlington
Fertility by Age in Upper Arlington
Average fertility rate in Upper Arlington is 76.0 births per 1,000 women. Women in the age bracket of 20 to 34 years have the highest fertility rate with 115.0 births per 1,000 women. Women in the age bracket of 35 to 50 years acount for 57.4% of all women with births.
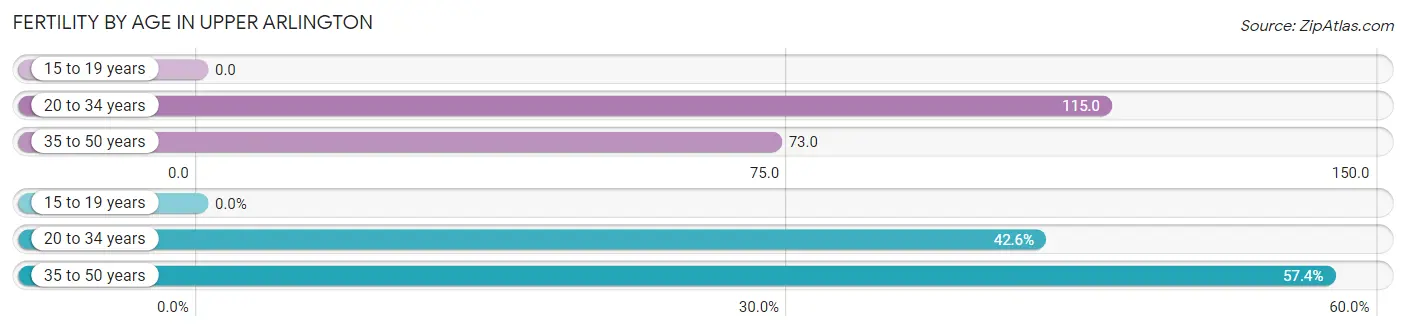
| Age Bracket | Women with Births | Births / 1,000 Women |
| 15 to 19 years | 0 (0.0%) | 0.0 |
| 20 to 34 years | 249 (42.6%) | 115.0 |
| 35 to 50 years | 335 (57.4%) | 73.0 |
| Total | 584 (100.0%) | 76.0 |
Fertility by Age by Marriage Status in Upper Arlington
95.7% of women with births (584) in Upper Arlington are married. The highest percentage of unmarried women with births falls into 20 to 34 years age bracket with 10.0% of them unmarried at the time of birth, while the lowest percentage of unmarried women with births belong to 35 to 50 years age bracket with 0.0% of them unmarried.
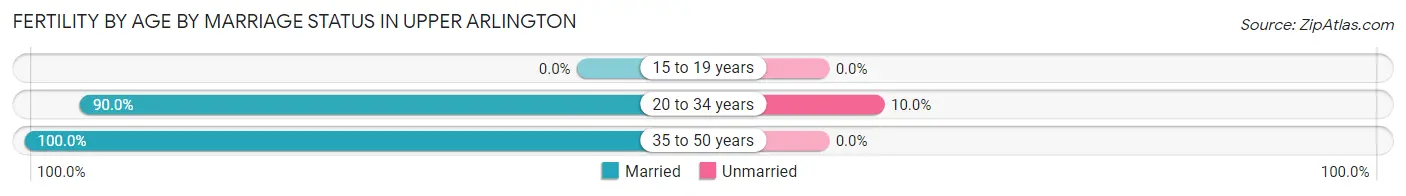
| Age Bracket | Married | Unmarried |
| 15 to 19 years | 0 (0.0%) | 0 (0.0%) |
| 20 to 34 years | 224 (90.0%) | 25 (10.0%) |
| 35 to 50 years | 335 (100.0%) | 0 (0.0%) |
| Total | 559 (95.7%) | 25 (4.3%) |
Fertility by Education in Upper Arlington
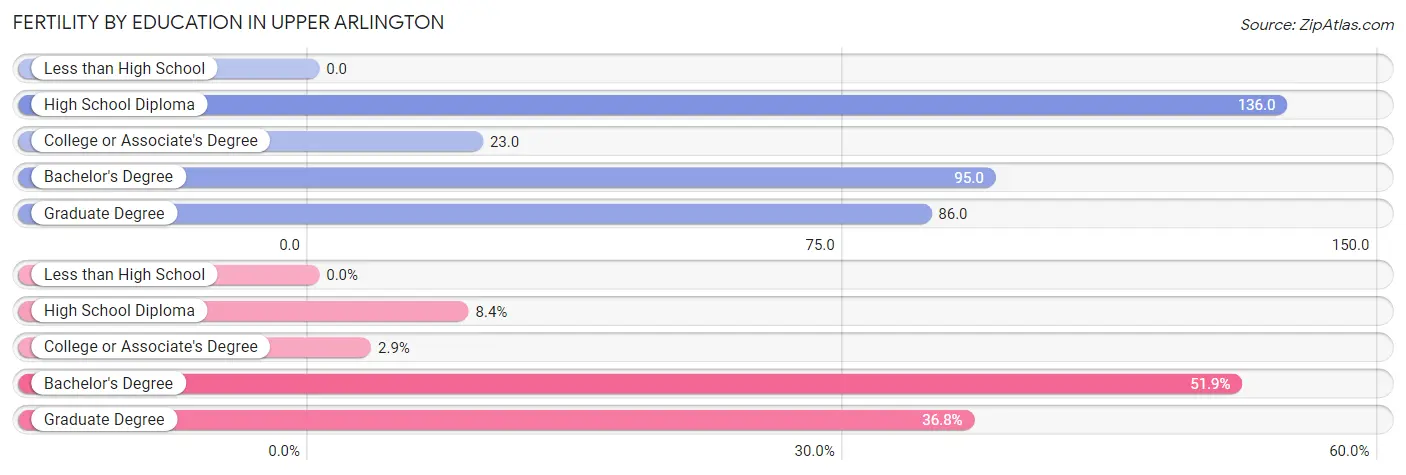
| Educational Attainment | Women with Births | Births / 1,000 Women |
| Less than High School | 0 (0.0%) | 0.0 |
| High School Diploma | 49 (8.4%) | 136.0 |
| College or Associate's Degree | 17 (2.9%) | 23.0 |
| Bachelor's Degree | 303 (51.9%) | 95.0 |
| Graduate Degree | 215 (36.8%) | 86.0 |
| Total | 584 (100.0%) | 76.0 |
Fertility by Education by Marriage Status in Upper Arlington
4.3% of women with births in Upper Arlington are unmarried. Women with the educational attainment of college or associate's degree are most likely to be married with 100.0% of them married at childbirth, while women with the educational attainment of high school diploma are least likely to be married with 51.0% of them unmarried at childbirth.
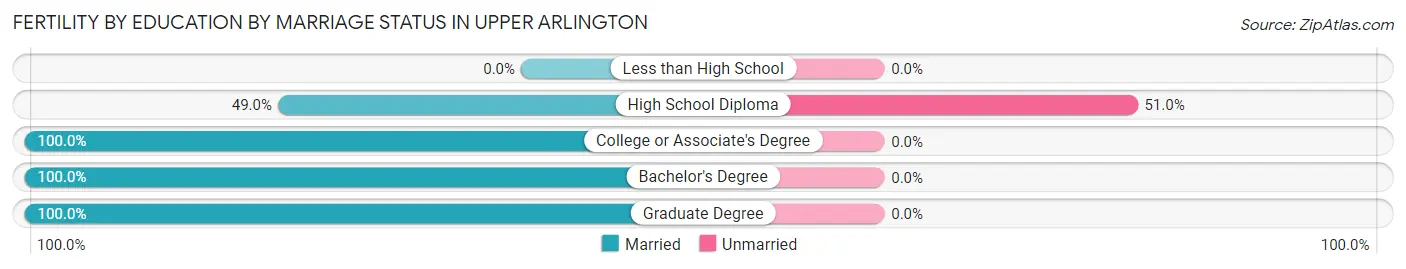
| Educational Attainment | Married | Unmarried |
| Less than High School | 0 (0.0%) | 0 (0.0%) |
| High School Diploma | 24 (49.0%) | 25 (51.0%) |
| College or Associate's Degree | 17 (100.0%) | 0 (0.0%) |
| Bachelor's Degree | 303 (100.0%) | 0 (0.0%) |
| Graduate Degree | 215 (100.0%) | 0 (0.0%) |
| Total | 559 (95.7%) | 25 (4.3%) |
Employment Characteristics in Upper Arlington
Employment by Class of Employer in Upper Arlington
Among the 18,056 employed individuals in Upper Arlington, private company employees (10,067 | 55.7%), not-for-profit organizations (2,286 | 12.7%), and state government employees (1,874 | 10.4%) make up the most common classes of employment.
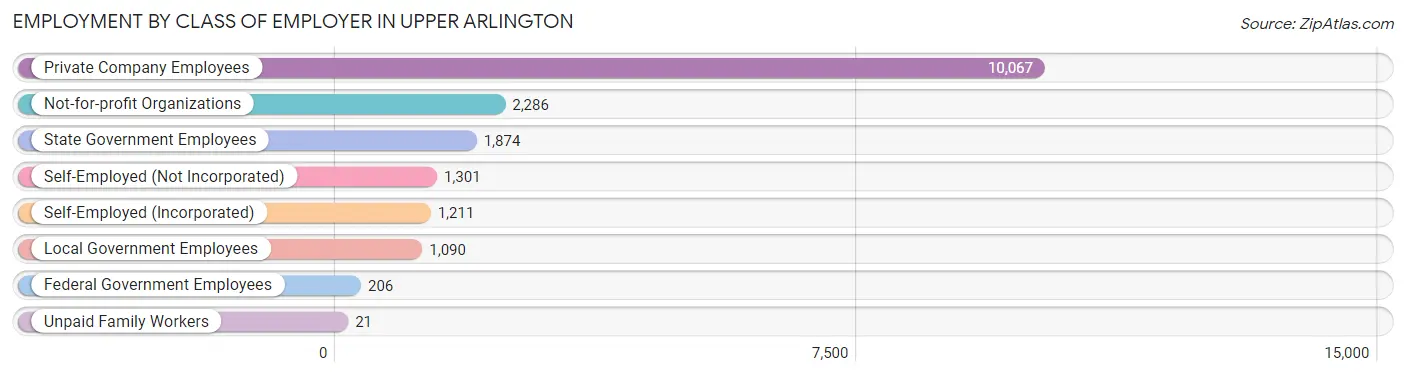
| Employer Class | # Employees | % Employees |
| Private Company Employees | 10,067 | 55.7% |
| Self-Employed (Incorporated) | 1,211 | 6.7% |
| Self-Employed (Not Incorporated) | 1,301 | 7.2% |
| Not-for-profit Organizations | 2,286 | 12.7% |
| Local Government Employees | 1,090 | 6.0% |
| State Government Employees | 1,874 | 10.4% |
| Federal Government Employees | 206 | 1.1% |
| Unpaid Family Workers | 21 | 0.1% |
| Total | 18,056 | 100.0% |
Employment Status by Age in Upper Arlington
According to the labor force statistics for Upper Arlington, out of the total population over 16 years of age (27,530), 67.9% or 18,693 individuals are in the labor force, with 2.2% or 411 of them unemployed. The age group with the highest labor force participation rate is 25 to 29 years, with 92.4% or 1,280 individuals in the labor force. Within the labor force, the 20 to 24 years age range has the highest percentage of unemployed individuals, with 9.2% or 60 of them being unemployed.
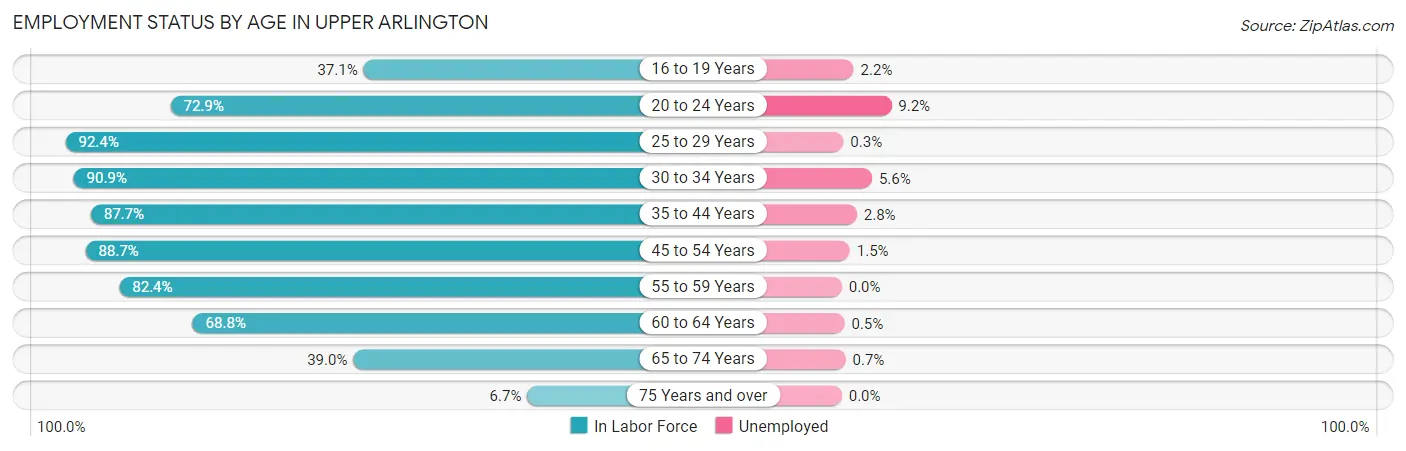
| Age Bracket | In Labor Force | Unemployed |
| 16 to 19 Years | 604 (37.1%) | 13 (2.2%) |
| 20 to 24 Years | 654 (72.9%) | 60 (9.2%) |
| 25 to 29 Years | 1,280 (92.4%) | 4 (0.3%) |
| 30 to 34 Years | 1,972 (90.9%) | 110 (5.6%) |
| 35 to 44 Years | 4,816 (87.7%) | 135 (2.8%) |
| 45 to 54 Years | 4,680 (88.7%) | 70 (1.5%) |
| 55 to 59 Years | 1,593 (82.4%) | 0 (0.0%) |
| 60 to 64 Years | 1,405 (68.8%) | 7 (0.5%) |
| 65 to 74 Years | 1,482 (39.0%) | 10 (0.7%) |
| 75 Years and over | 195 (6.7%) | 0 (0.0%) |
| Total | 18,693 (67.9%) | 411 (2.2%) |
Employment Status by Educational Attainment in Upper Arlington
According to labor force statistics for Upper Arlington, 86.1% of individuals (15,754) out of the total population between 25 and 64 years of age (18,297) are in the labor force, with 2.1% or 331 of them being unemployed. The group with the highest labor force participation rate are those with the educational attainment of bachelor's degree or higher, with 87.1% or 13,183 individuals in the labor force. Within the labor force, individuals with college / associate degree education have the highest percentage of unemployment, with 3.4% or 58 of them being unemployed.
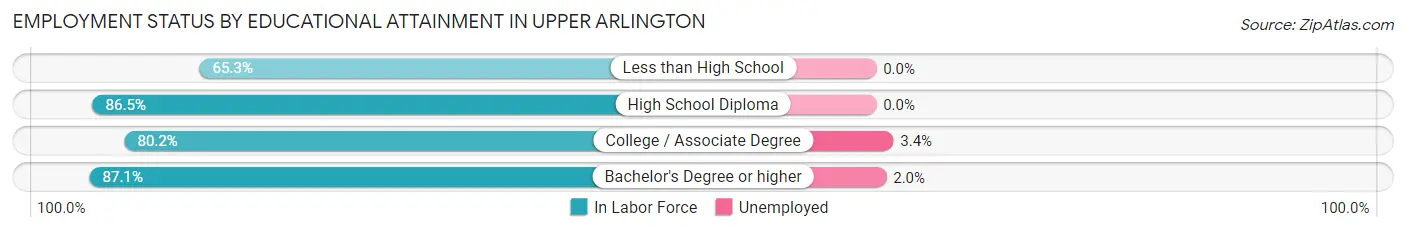
| Educational Attainment | In Labor Force | Unemployed |
| Less than High School | 132 (65.3%) | 0 (0.0%) |
| High School Diploma | 733 (86.5%) | 0 (0.0%) |
| College / Associate Degree | 1,694 (80.2%) | 72 (3.4%) |
| Bachelor's Degree or higher | 13,183 (87.1%) | 303 (2.0%) |
| Total | 15,754 (86.1%) | 384 (2.1%) |
Employment Occupations by Sex in Upper Arlington
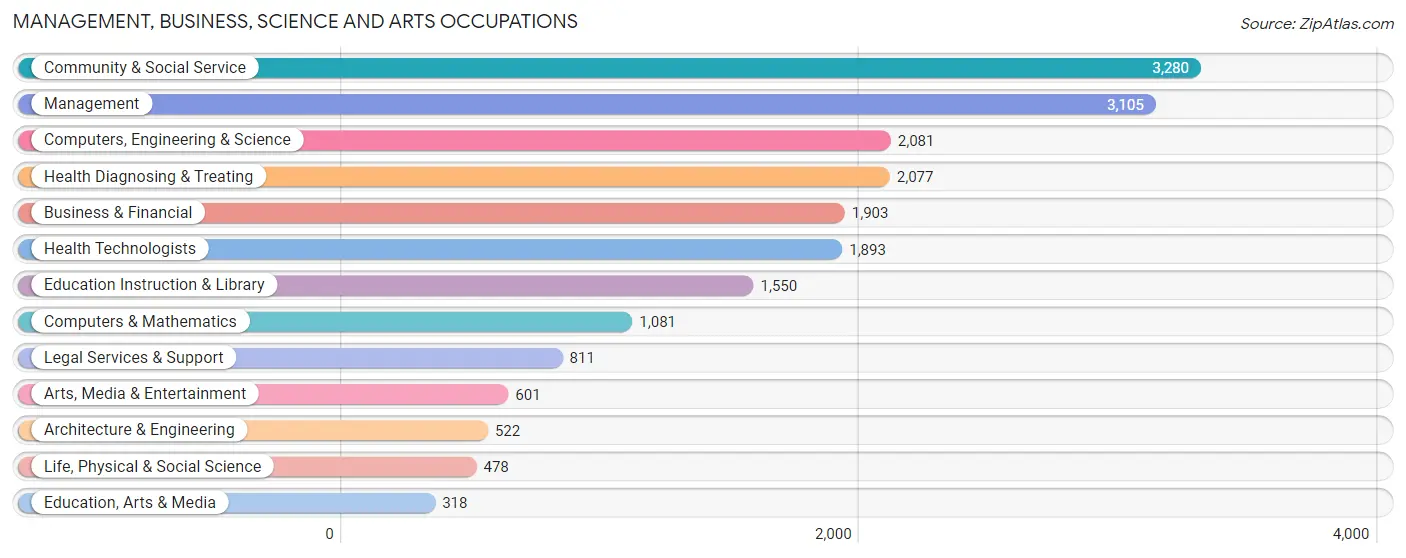
Management, Business, Science and Arts Occupations
The most common Management, Business, Science and Arts occupations in Upper Arlington are Community & Social Service (3,280 | 17.9%), Management (3,105 | 17.0%), Computers, Engineering & Science (2,081 | 11.4%), Health Diagnosing & Treating (2,077 | 11.4%), and Business & Financial (1,903 | 10.4%).
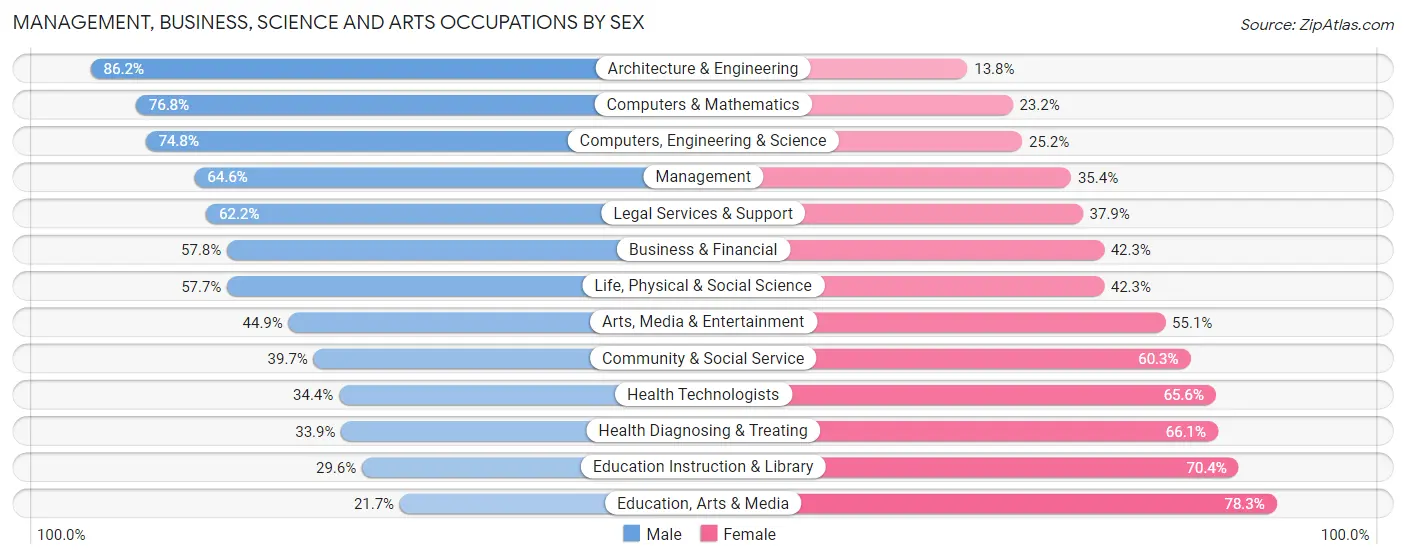
Management, Business, Science and Arts Occupations by Sex
Within the Management, Business, Science and Arts occupations in Upper Arlington, the most male-oriented occupations are Architecture & Engineering (86.2%), Computers & Mathematics (76.8%), and Computers, Engineering & Science (74.8%), while the most female-oriented occupations are Education, Arts & Media (78.3%), Education Instruction & Library (70.4%), and Health Diagnosing & Treating (66.1%).
| Occupation | Male | Female |
| Management | 2,005 (64.6%) | 1,100 (35.4%) |
| Business & Financial | 1,099 (57.8%) | 804 (42.2%) |
| Computers, Engineering & Science | 1,556 (74.8%) | 525 (25.2%) |
| Computers & Mathematics | 830 (76.8%) | 251 (23.2%) |
| Architecture & Engineering | 450 (86.2%) | 72 (13.8%) |
| Life, Physical & Social Science | 276 (57.7%) | 202 (42.3%) |
| Community & Social Service | 1,302 (39.7%) | 1,978 (60.3%) |
| Education, Arts & Media | 69 (21.7%) | 249 (78.3%) |
| Legal Services & Support | 504 (62.2%) | 307 (37.9%) |
| Education Instruction & Library | 459 (29.6%) | 1,091 (70.4%) |
| Arts, Media & Entertainment | 270 (44.9%) | 331 (55.1%) |
| Health Diagnosing & Treating | 705 (33.9%) | 1,372 (66.1%) |
| Health Technologists | 651 (34.4%) | 1,242 (65.6%) |
| Total (Category) | 6,667 (53.6%) | 5,779 (46.4%) |
| Total (Overall) | 9,877 (54.0%) | 8,396 (46.0%) |
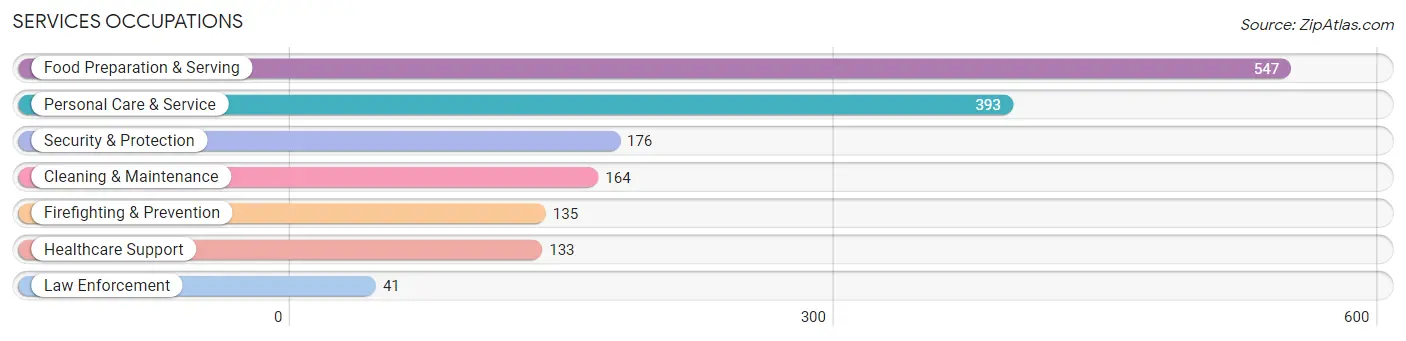
Services Occupations
The most common Services occupations in Upper Arlington are Food Preparation & Serving (547 | 3.0%), Personal Care & Service (393 | 2.1%), Security & Protection (176 | 1.0%), Cleaning & Maintenance (164 | 0.9%), and Firefighting & Prevention (135 | 0.7%).
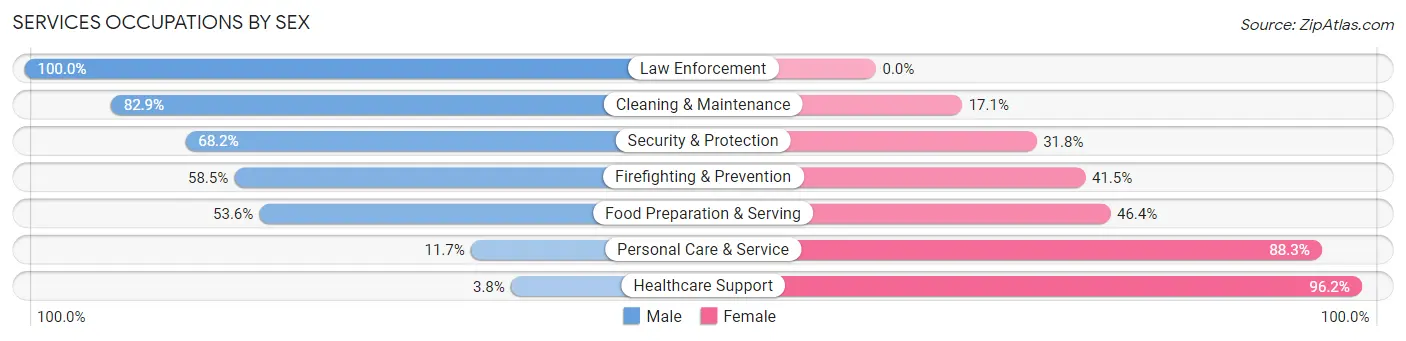
Services Occupations by Sex
Within the Services occupations in Upper Arlington, the most male-oriented occupations are Law Enforcement (100.0%), Cleaning & Maintenance (82.9%), and Security & Protection (68.2%), while the most female-oriented occupations are Healthcare Support (96.2%), Personal Care & Service (88.3%), and Food Preparation & Serving (46.4%).
| Occupation | Male | Female |
| Healthcare Support | 5 (3.8%) | 128 (96.2%) |
| Security & Protection | 120 (68.2%) | 56 (31.8%) |
| Firefighting & Prevention | 79 (58.5%) | 56 (41.5%) |
| Law Enforcement | 41 (100.0%) | 0 (0.0%) |
| Food Preparation & Serving | 293 (53.6%) | 254 (46.4%) |
| Cleaning & Maintenance | 136 (82.9%) | 28 (17.1%) |
| Personal Care & Service | 46 (11.7%) | 347 (88.3%) |
| Total (Category) | 600 (42.5%) | 813 (57.5%) |
| Total (Overall) | 9,877 (54.0%) | 8,396 (46.0%) |
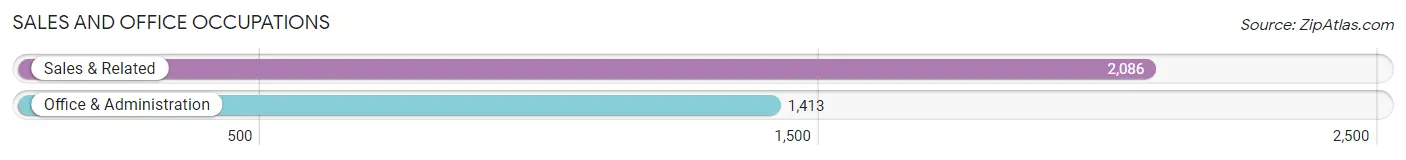
Sales and Office Occupations
The most common Sales and Office occupations in Upper Arlington are Sales & Related (2,086 | 11.4%), and Office & Administration (1,413 | 7.7%).
Sales and Office Occupations by Sex
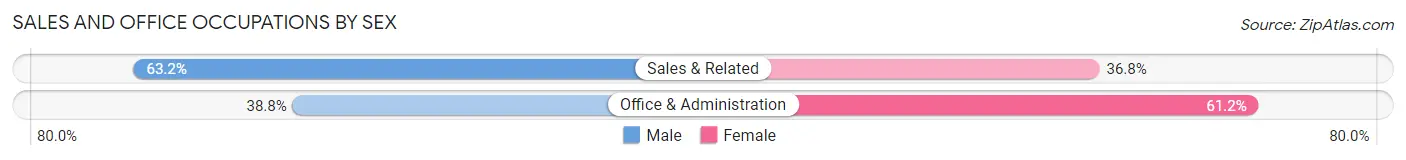
| Occupation | Male | Female |
| Sales & Related | 1,319 (63.2%) | 767 (36.8%) |
| Office & Administration | 548 (38.8%) | 865 (61.2%) |
| Total (Category) | 1,867 (53.4%) | 1,632 (46.6%) |
| Total (Overall) | 9,877 (54.0%) | 8,396 (46.0%) |
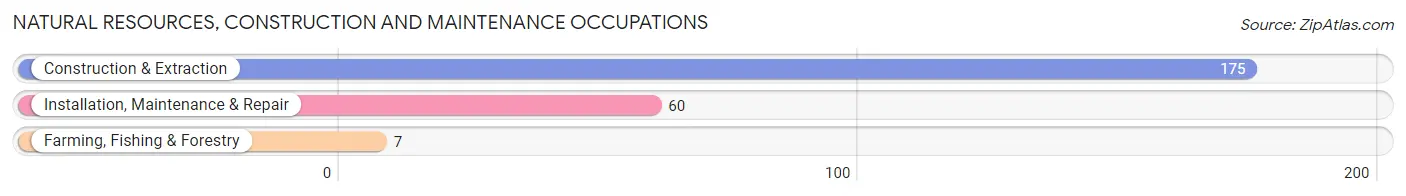
Natural Resources, Construction and Maintenance Occupations
The most common Natural Resources, Construction and Maintenance occupations in Upper Arlington are Construction & Extraction (175 | 1.0%), Installation, Maintenance & Repair (60 | 0.3%), and Farming, Fishing & Forestry (7 | 0.0%).
Natural Resources, Construction and Maintenance Occupations by Sex
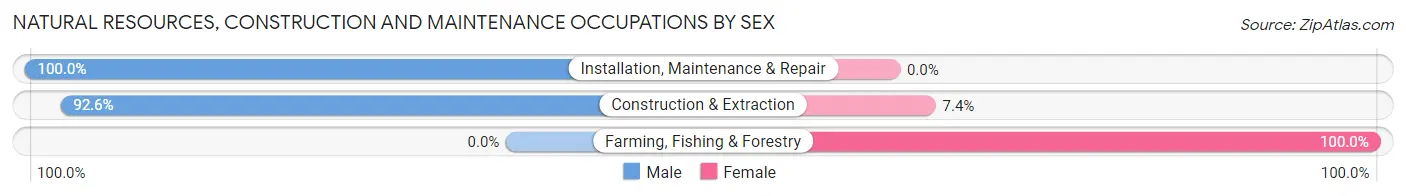
| Occupation | Male | Female |
| Farming, Fishing & Forestry | 0 (0.0%) | 7 (100.0%) |
| Construction & Extraction | 162 (92.6%) | 13 (7.4%) |
| Installation, Maintenance & Repair | 60 (100.0%) | 0 (0.0%) |
| Total (Category) | 222 (91.7%) | 20 (8.3%) |
| Total (Overall) | 9,877 (54.0%) | 8,396 (46.0%) |
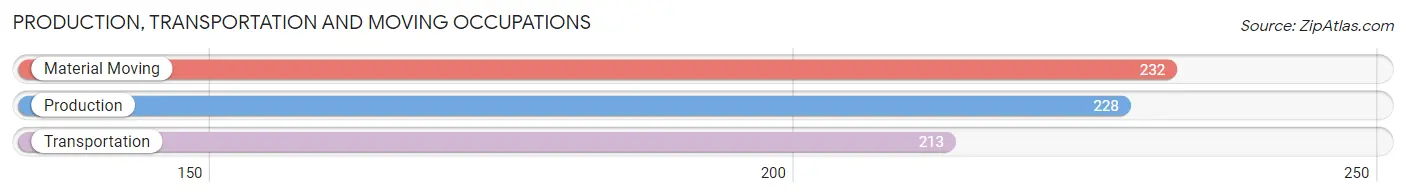
Production, Transportation and Moving Occupations
The most common Production, Transportation and Moving occupations in Upper Arlington are Material Moving (232 | 1.3%), Production (228 | 1.3%), and Transportation (213 | 1.2%).
Production, Transportation and Moving Occupations by Sex
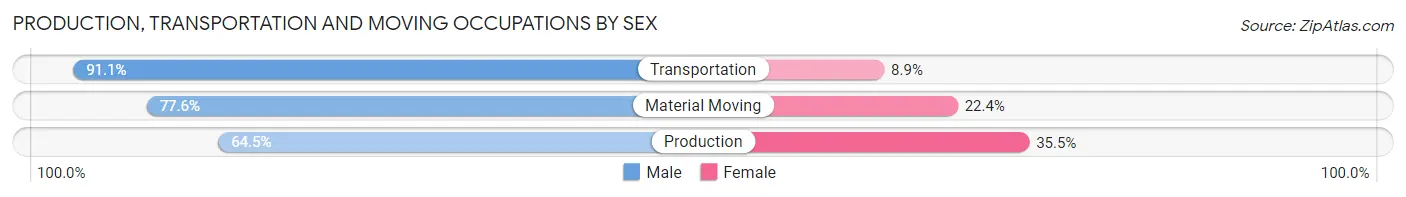
| Occupation | Male | Female |
| Production | 147 (64.5%) | 81 (35.5%) |
| Transportation | 194 (91.1%) | 19 (8.9%) |
| Material Moving | 180 (77.6%) | 52 (22.4%) |
| Total (Category) | 521 (77.4%) | 152 (22.6%) |
| Total (Overall) | 9,877 (54.0%) | 8,396 (46.0%) |
Employment Industries by Sex in Upper Arlington
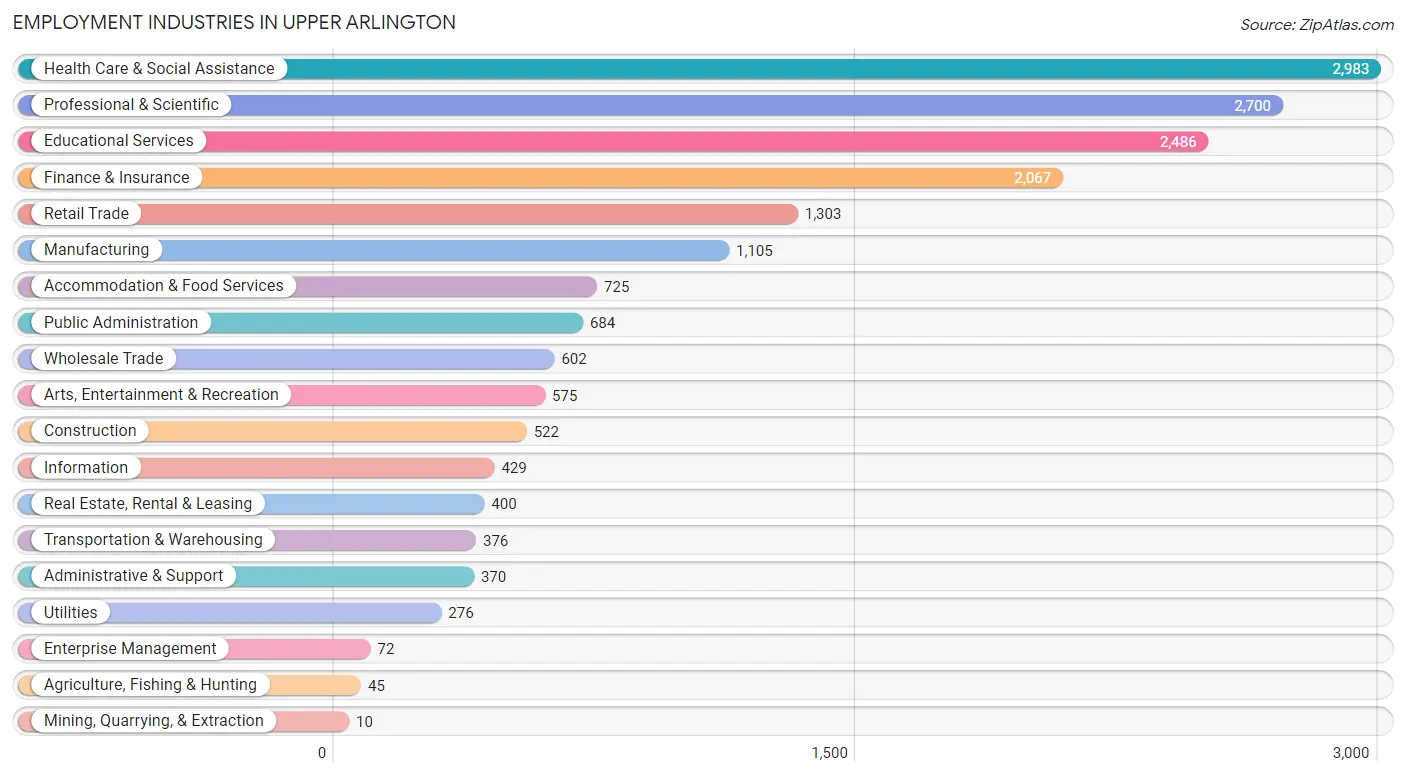
Employment Industries in Upper Arlington
The major employment industries in Upper Arlington include Health Care & Social Assistance (2,983 | 16.3%), Professional & Scientific (2,700 | 14.8%), Educational Services (2,486 | 13.6%), Finance & Insurance (2,067 | 11.3%), and Retail Trade (1,303 | 7.1%).
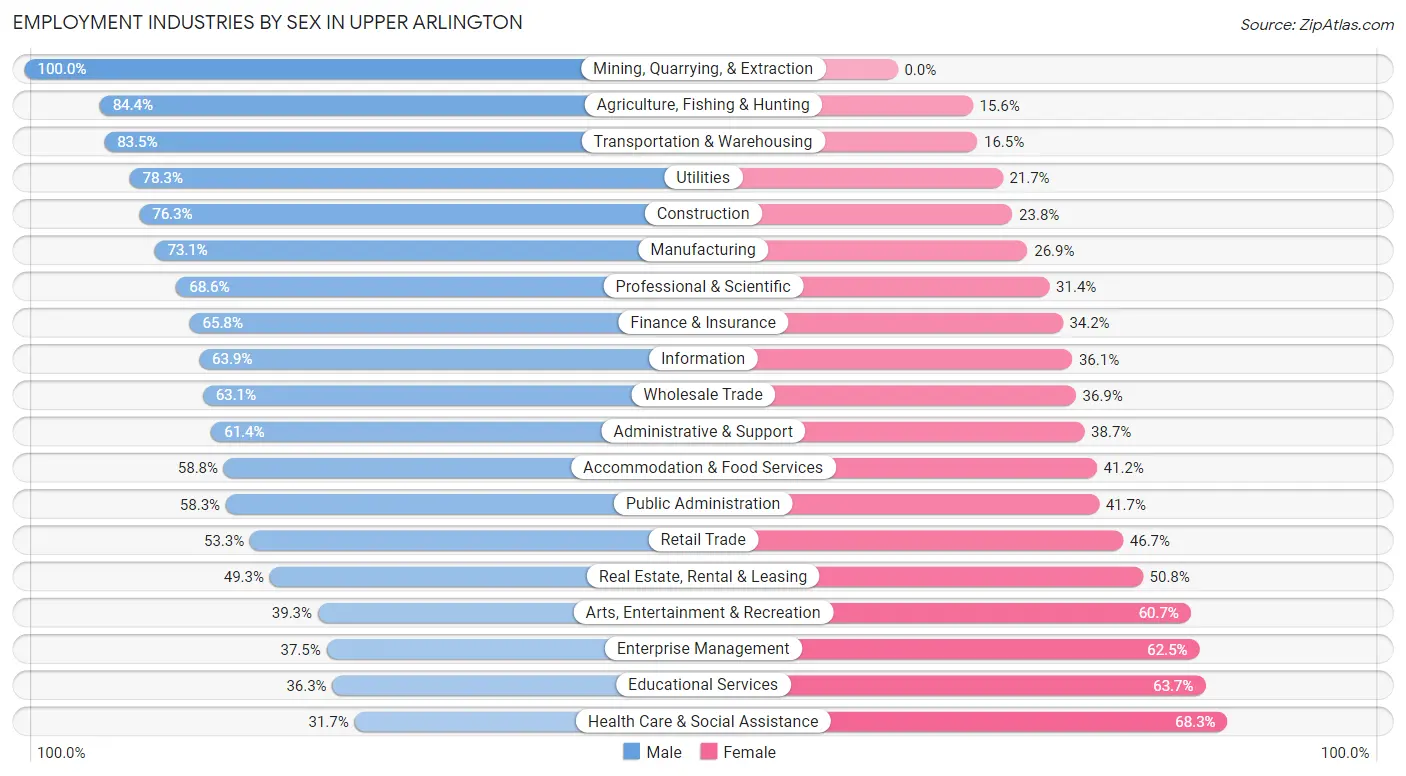
Employment Industries by Sex in Upper Arlington
The Upper Arlington industries that see more men than women are Mining, Quarrying, & Extraction (100.0%), Agriculture, Fishing & Hunting (84.4%), and Transportation & Warehousing (83.5%), whereas the industries that tend to have a higher number of women are Health Care & Social Assistance (68.3%), Educational Services (63.7%), and Enterprise Management (62.5%).
| Industry | Male | Female |
| Agriculture, Fishing & Hunting | 38 (84.4%) | 7 (15.6%) |
| Mining, Quarrying, & Extraction | 10 (100.0%) | 0 (0.0%) |
| Construction | 398 (76.2%) | 124 (23.7%) |
| Manufacturing | 808 (73.1%) | 297 (26.9%) |
| Wholesale Trade | 380 (63.1%) | 222 (36.9%) |
| Retail Trade | 695 (53.3%) | 608 (46.7%) |
| Transportation & Warehousing | 314 (83.5%) | 62 (16.5%) |
| Utilities | 216 (78.3%) | 60 (21.7%) |
| Information | 274 (63.9%) | 155 (36.1%) |
| Finance & Insurance | 1,361 (65.8%) | 706 (34.2%) |
| Real Estate, Rental & Leasing | 197 (49.2%) | 203 (50.7%) |
| Professional & Scientific | 1,852 (68.6%) | 848 (31.4%) |
| Enterprise Management | 27 (37.5%) | 45 (62.5%) |
| Administrative & Support | 227 (61.4%) | 143 (38.7%) |
| Educational Services | 902 (36.3%) | 1,584 (63.7%) |
| Health Care & Social Assistance | 946 (31.7%) | 2,037 (68.3%) |
| Arts, Entertainment & Recreation | 226 (39.3%) | 349 (60.7%) |
| Accommodation & Food Services | 426 (58.8%) | 299 (41.2%) |
| Public Administration | 399 (58.3%) | 285 (41.7%) |
| Total | 9,877 (54.0%) | 8,396 (46.0%) |
Education in Upper Arlington
School Enrollment in Upper Arlington
The most common levels of schooling among the 9,974 students in Upper Arlington are middle school (2,427 | 24.3%), high school (2,137 | 21.4%), and elementary school (2,124 | 21.3%).
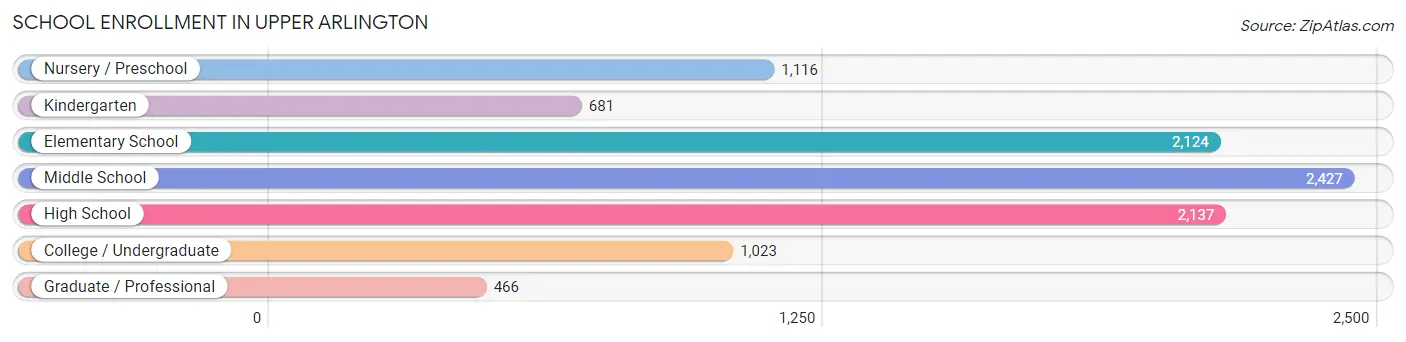
| School Level | # Students | % Students |
| Nursery / Preschool | 1,116 | 11.2% |
| Kindergarten | 681 | 6.8% |
| Elementary School | 2,124 | 21.3% |
| Middle School | 2,427 | 24.3% |
| High School | 2,137 | 21.4% |
| College / Undergraduate | 1,023 | 10.3% |
| Graduate / Professional | 466 | 4.7% |
| Total | 9,974 | 100.0% |
School Enrollment by Age by Funding Source in Upper Arlington
Out of a total of 9,974 students who are enrolled in schools in Upper Arlington, 1,646 (16.5%) attend a private institution, while the remaining 8,328 (83.5%) are enrolled in public schools. The age group of 3 to 4 year olds has the highest likelihood of being enrolled in private schools, with 400 (49.9% in the age bracket) enrolled. Conversely, the age group of 10 to 14 year olds has the lowest likelihood of being enrolled in a private school, with 2,661 (90.4% in the age bracket) attending a public institution.
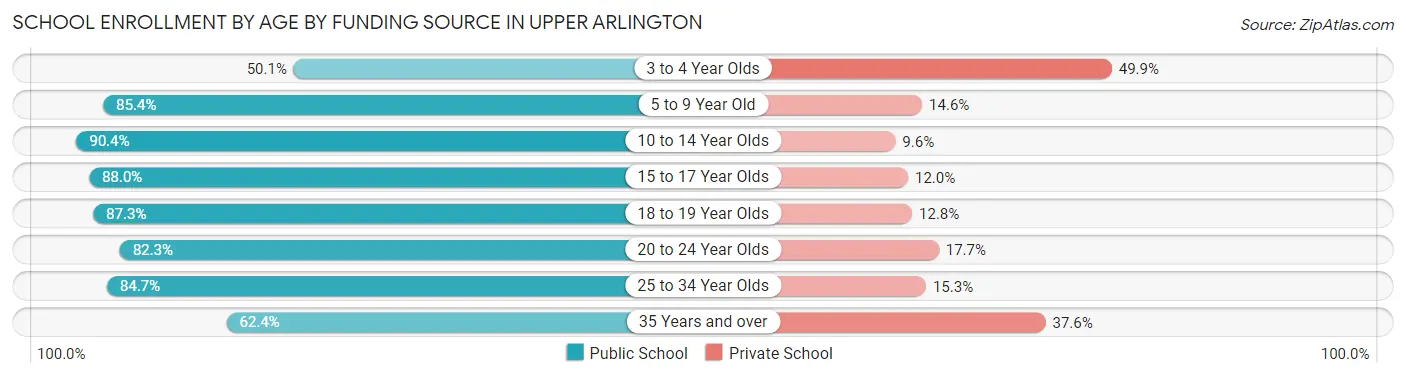
| Age Bracket | Public School | Private School |
| 3 to 4 Year Olds | 401 (50.1%) | 400 (49.9%) |
| 5 to 9 Year Old | 2,382 (85.4%) | 408 (14.6%) |
| 10 to 14 Year Olds | 2,661 (90.4%) | 284 (9.6%) |
| 15 to 17 Year Olds | 1,453 (88.0%) | 198 (12.0%) |
| 18 to 19 Year Olds | 390 (87.3%) | 57 (12.8%) |
| 20 to 24 Year Olds | 469 (82.3%) | 101 (17.7%) |
| 25 to 34 Year Olds | 348 (84.7%) | 63 (15.3%) |
| 35 Years and over | 224 (62.4%) | 135 (37.6%) |
| Total | 8,328 (83.5%) | 1,646 (16.5%) |
Educational Attainment by Field of Study in Upper Arlington
Business (4,152 | 19.8%), bio, nature & agricultural (2,272 | 10.8%), social sciences (2,144 | 10.2%), education (2,019 | 9.6%), and science & technology (1,954 | 9.3%) are the most common fields of study among 20,974 individuals in Upper Arlington who have obtained a bachelor's degree or higher.
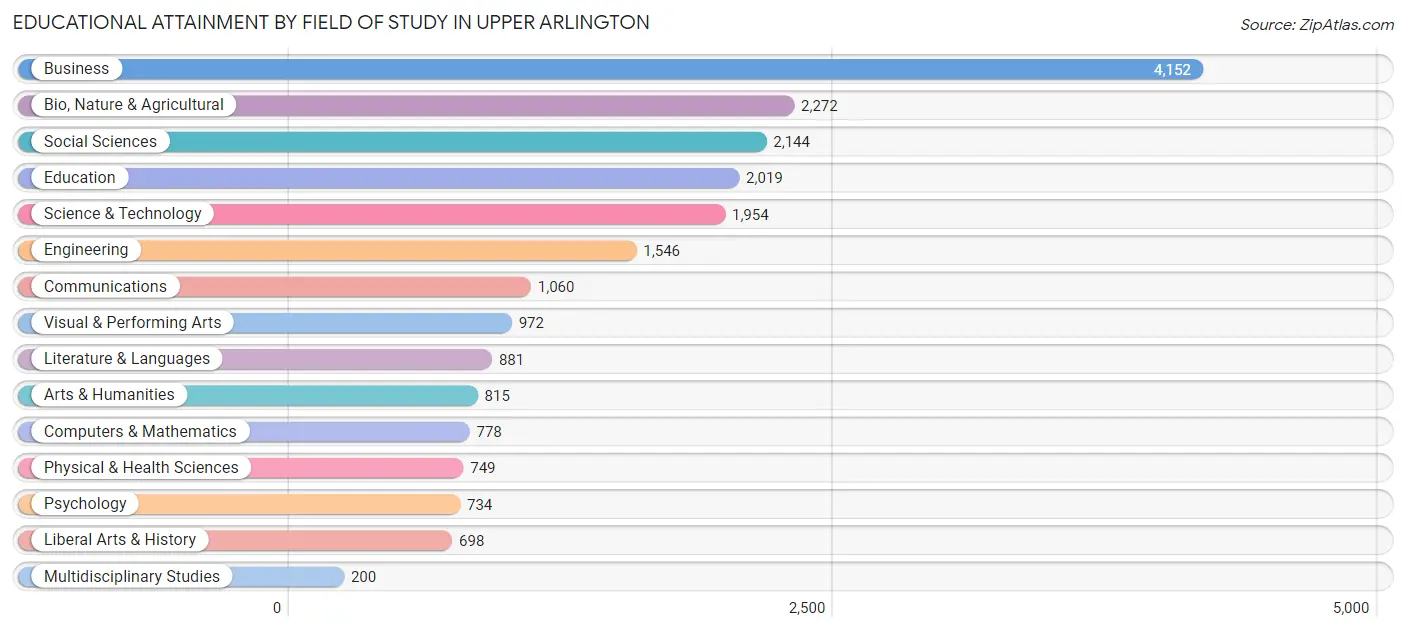
| Field of Study | # Graduates | % Graduates |
| Computers & Mathematics | 778 | 3.7% |
| Bio, Nature & Agricultural | 2,272 | 10.8% |
| Physical & Health Sciences | 749 | 3.6% |
| Psychology | 734 | 3.5% |
| Social Sciences | 2,144 | 10.2% |
| Engineering | 1,546 | 7.4% |
| Multidisciplinary Studies | 200 | 0.9% |
| Science & Technology | 1,954 | 9.3% |
| Business | 4,152 | 19.8% |
| Education | 2,019 | 9.6% |
| Literature & Languages | 881 | 4.2% |
| Liberal Arts & History | 698 | 3.3% |
| Visual & Performing Arts | 972 | 4.6% |
| Communications | 1,060 | 5.1% |
| Arts & Humanities | 815 | 3.9% |
| Total | 20,974 | 100.0% |
Transportation & Commute in Upper Arlington
Vehicle Availability by Sex in Upper Arlington
The most prevalent vehicle ownership categories in Upper Arlington are males with 2 vehicles (5,618, accounting for 57.3%) and females with 2 vehicles (4,286, making up 68.1%).
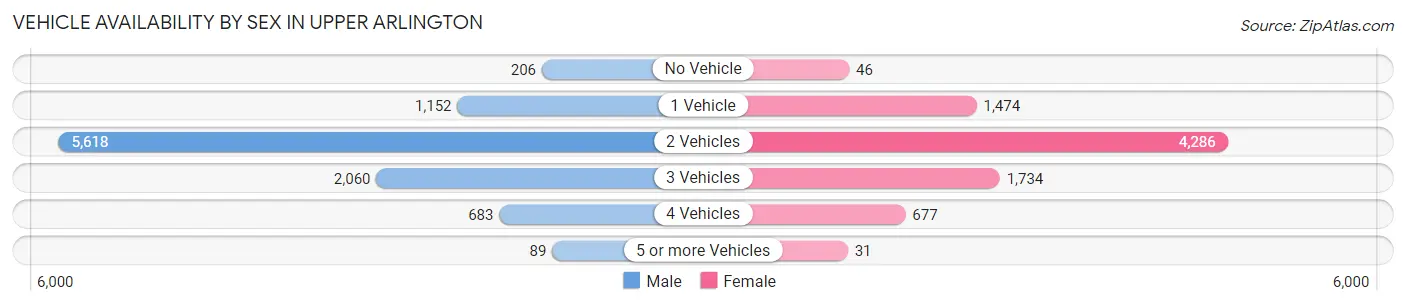
| Vehicles Available | Male | Female |
| No Vehicle | 206 (2.1%) | 46 (0.6%) |
| 1 Vehicle | 1,152 (11.7%) | 1,474 (17.9%) |
| 2 Vehicles | 5,618 (57.3%) | 4,286 (52.0%) |
| 3 Vehicles | 2,060 (21.0%) | 1,734 (21.0%) |
| 4 Vehicles | 683 (7.0%) | 677 (8.2%) |
| 5 or more Vehicles | 89 (0.9%) | 31 (0.4%) |
| Total | 9,808 (100.0%) | 8,248 (100.0%) |
Commute Time in Upper Arlington
The most frequently occuring commute durations in Upper Arlington are 20 to 24 minutes (3,103 commuters, 21.9%), 15 to 19 minutes (2,953 commuters, 20.8%), and 10 to 14 minutes (2,533 commuters, 17.9%).
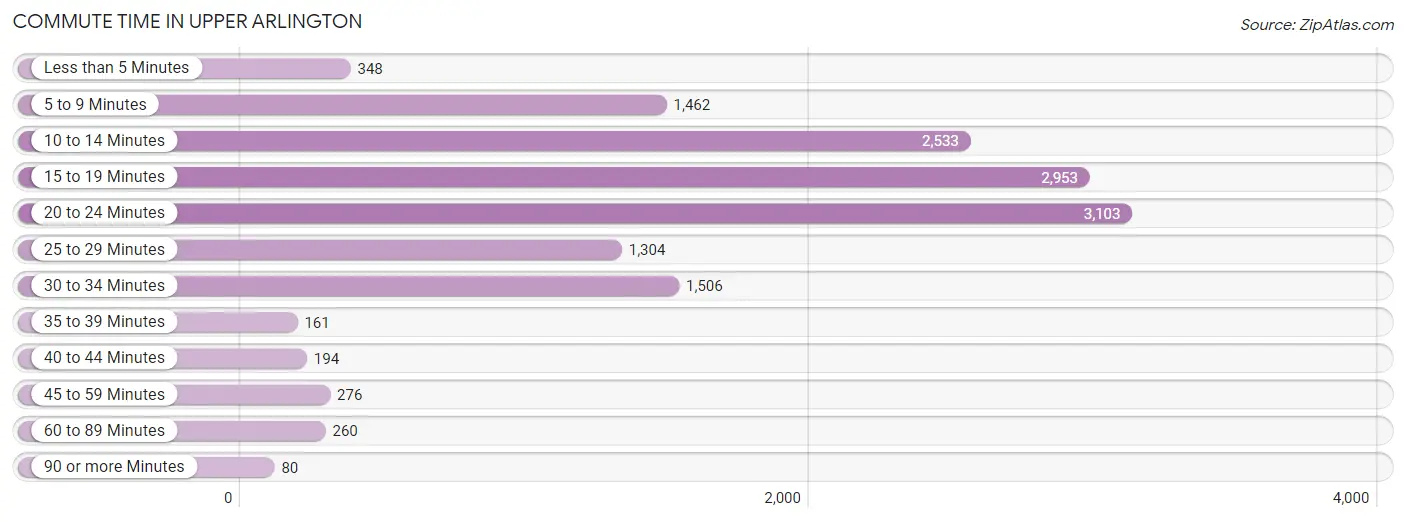
| Commute Time | # Commuters | % Commuters |
| Less than 5 Minutes | 348 | 2.5% |
| 5 to 9 Minutes | 1,462 | 10.3% |
| 10 to 14 Minutes | 2,533 | 17.9% |
| 15 to 19 Minutes | 2,953 | 20.8% |
| 20 to 24 Minutes | 3,103 | 21.9% |
| 25 to 29 Minutes | 1,304 | 9.2% |
| 30 to 34 Minutes | 1,506 | 10.6% |
| 35 to 39 Minutes | 161 | 1.1% |
| 40 to 44 Minutes | 194 | 1.4% |
| 45 to 59 Minutes | 276 | 1.9% |
| 60 to 89 Minutes | 260 | 1.8% |
| 90 or more Minutes | 80 | 0.6% |
Commute Time by Sex in Upper Arlington
The most common commute times in Upper Arlington are 15 to 19 minutes (1,682 commuters, 22.1%) for males and 20 to 24 minutes (1,490 commuters, 22.7%) for females.
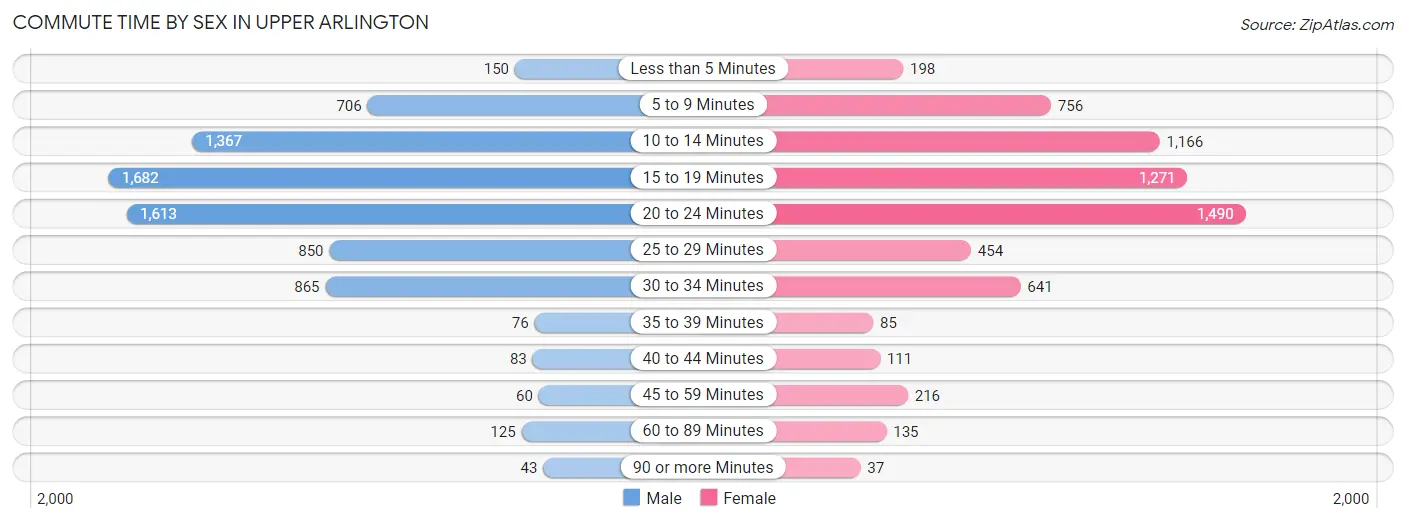
| Commute Time | Male | Female |
| Less than 5 Minutes | 150 (2.0%) | 198 (3.0%) |
| 5 to 9 Minutes | 706 (9.3%) | 756 (11.5%) |
| 10 to 14 Minutes | 1,367 (17.9%) | 1,166 (17.8%) |
| 15 to 19 Minutes | 1,682 (22.1%) | 1,271 (19.4%) |
| 20 to 24 Minutes | 1,613 (21.2%) | 1,490 (22.7%) |
| 25 to 29 Minutes | 850 (11.2%) | 454 (6.9%) |
| 30 to 34 Minutes | 865 (11.4%) | 641 (9.8%) |
| 35 to 39 Minutes | 76 (1.0%) | 85 (1.3%) |
| 40 to 44 Minutes | 83 (1.1%) | 111 (1.7%) |
| 45 to 59 Minutes | 60 (0.8%) | 216 (3.3%) |
| 60 to 89 Minutes | 125 (1.6%) | 135 (2.1%) |
| 90 or more Minutes | 43 (0.6%) | 37 (0.6%) |
Time of Departure to Work by Sex in Upper Arlington
The most frequent times of departure to work in Upper Arlington are 8:00 AM to 8:29 AM (2,086, 27.4%) for males and 8:00 AM to 8:29 AM (1,501, 22.9%) for females.
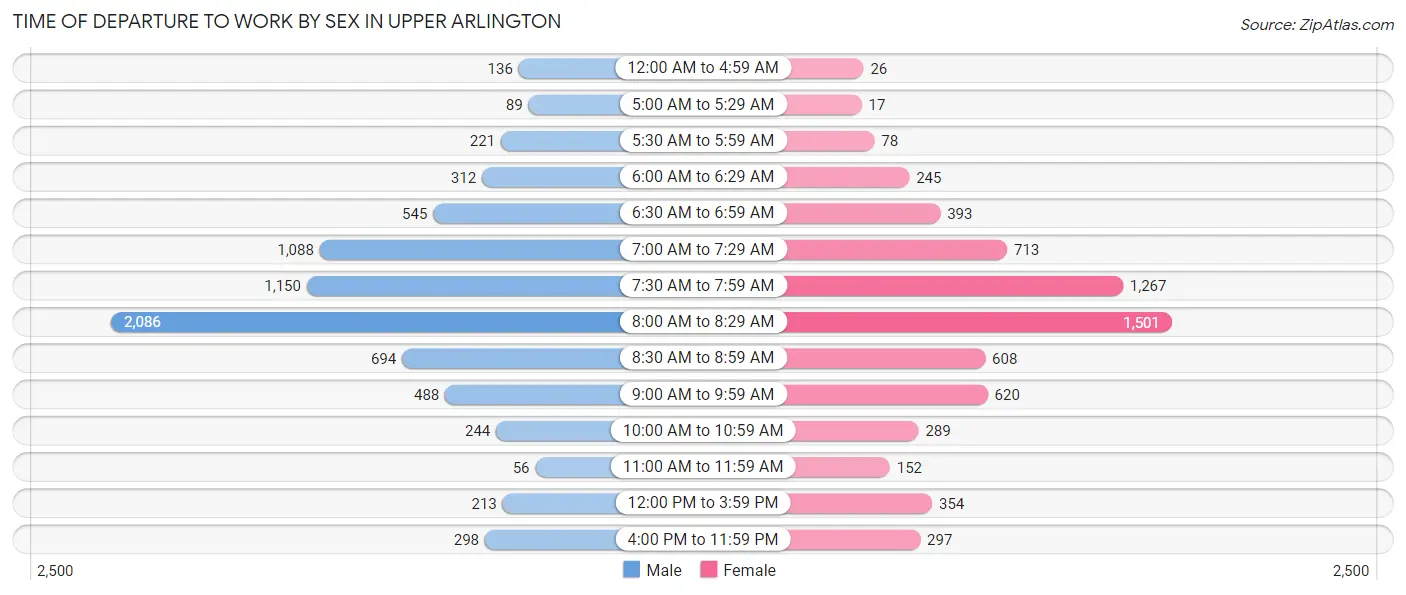
| Time of Departure | Male | Female |
| 12:00 AM to 4:59 AM | 136 (1.8%) | 26 (0.4%) |
| 5:00 AM to 5:29 AM | 89 (1.2%) | 17 (0.3%) |
| 5:30 AM to 5:59 AM | 221 (2.9%) | 78 (1.2%) |
| 6:00 AM to 6:29 AM | 312 (4.1%) | 245 (3.7%) |
| 6:30 AM to 6:59 AM | 545 (7.1%) | 393 (6.0%) |
| 7:00 AM to 7:29 AM | 1,088 (14.3%) | 713 (10.9%) |
| 7:30 AM to 7:59 AM | 1,150 (15.1%) | 1,267 (19.3%) |
| 8:00 AM to 8:29 AM | 2,086 (27.4%) | 1,501 (22.9%) |
| 8:30 AM to 8:59 AM | 694 (9.1%) | 608 (9.3%) |
| 9:00 AM to 9:59 AM | 488 (6.4%) | 620 (9.5%) |
| 10:00 AM to 10:59 AM | 244 (3.2%) | 289 (4.4%) |
| 11:00 AM to 11:59 AM | 56 (0.7%) | 152 (2.3%) |
| 12:00 PM to 3:59 PM | 213 (2.8%) | 354 (5.4%) |
| 4:00 PM to 11:59 PM | 298 (3.9%) | 297 (4.5%) |
| Total | 7,620 (100.0%) | 6,560 (100.0%) |
Housing Occupancy in Upper Arlington
Occupancy by Ownership in Upper Arlington
Of the total 14,268 dwellings in Upper Arlington, owner-occupied units account for 11,215 (78.6%), while renter-occupied units make up 3,053 (21.4%).
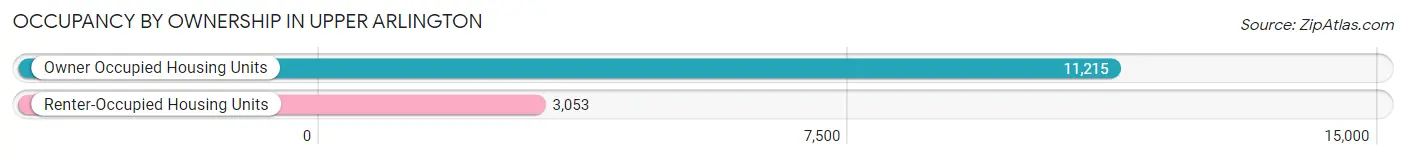
| Occupancy | # Housing Units | % Housing Units |
| Owner Occupied Housing Units | 11,215 | 78.6% |
| Renter-Occupied Housing Units | 3,053 | 21.4% |
| Total Occupied Housing Units | 14,268 | 100.0% |
Occupancy by Household Size in Upper Arlington
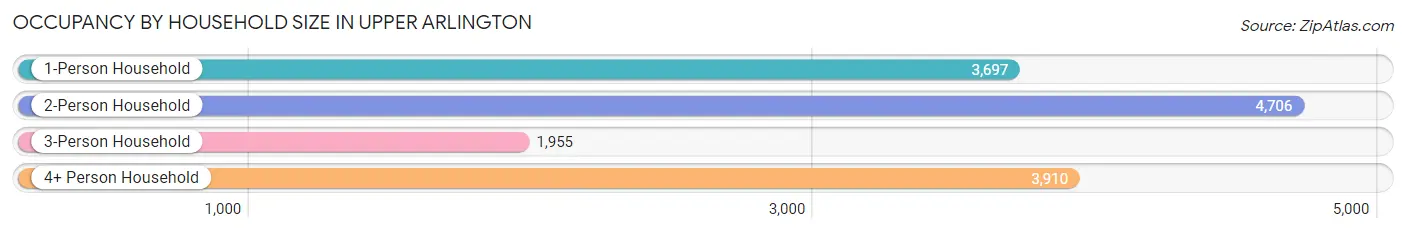
| Household Size | # Housing Units | % Housing Units |
| 1-Person Household | 3,697 | 25.9% |
| 2-Person Household | 4,706 | 33.0% |
| 3-Person Household | 1,955 | 13.7% |
| 4+ Person Household | 3,910 | 27.4% |
| Total Housing Units | 14,268 | 100.0% |
Occupancy by Ownership by Household Size in Upper Arlington
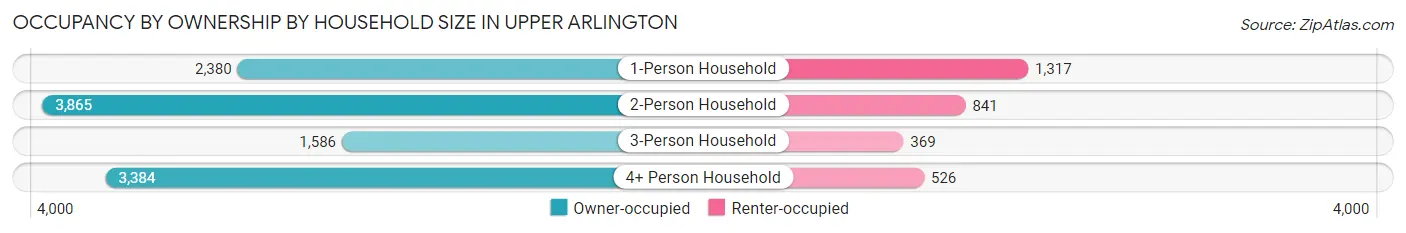
| Household Size | Owner-occupied | Renter-occupied |
| 1-Person Household | 2,380 (64.4%) | 1,317 (35.6%) |
| 2-Person Household | 3,865 (82.1%) | 841 (17.9%) |
| 3-Person Household | 1,586 (81.1%) | 369 (18.9%) |
| 4+ Person Household | 3,384 (86.6%) | 526 (13.5%) |
| Total Housing Units | 11,215 (78.6%) | 3,053 (21.4%) |
Occupancy by Educational Attainment in Upper Arlington
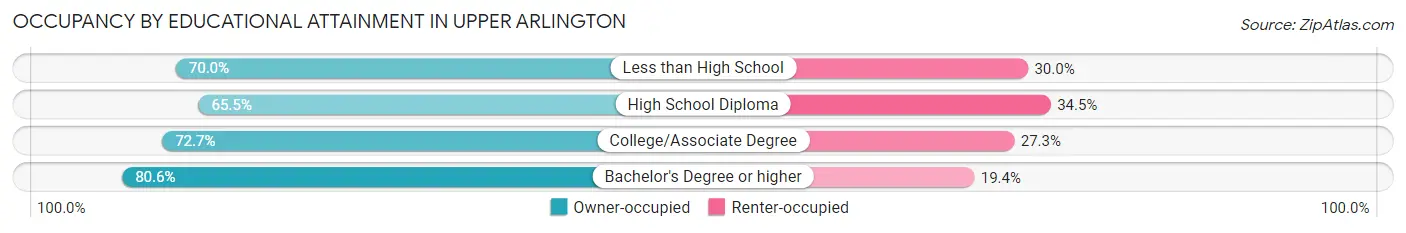
| Household Size | Owner-occupied | Renter-occupied |
| Less than High School | 35 (70.0%) | 15 (30.0%) |
| High School Diploma | 488 (65.5%) | 257 (34.5%) |
| College/Associate Degree | 1,577 (72.7%) | 592 (27.3%) |
| Bachelor's Degree or higher | 9,115 (80.6%) | 2,189 (19.4%) |
Occupancy by Age of Householder in Upper Arlington
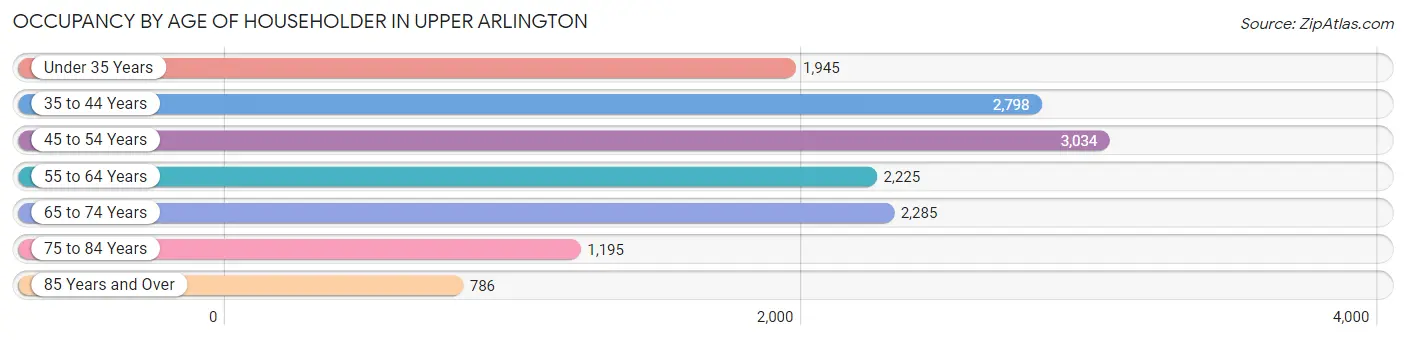
| Age Bracket | # Households | % Households |
| Under 35 Years | 1,945 | 13.6% |
| 35 to 44 Years | 2,798 | 19.6% |
| 45 to 54 Years | 3,034 | 21.3% |
| 55 to 64 Years | 2,225 | 15.6% |
| 65 to 74 Years | 2,285 | 16.0% |
| 75 to 84 Years | 1,195 | 8.4% |
| 85 Years and Over | 786 | 5.5% |
| Total | 14,268 | 100.0% |
Housing Finances in Upper Arlington
Median Income by Occupancy in Upper Arlington
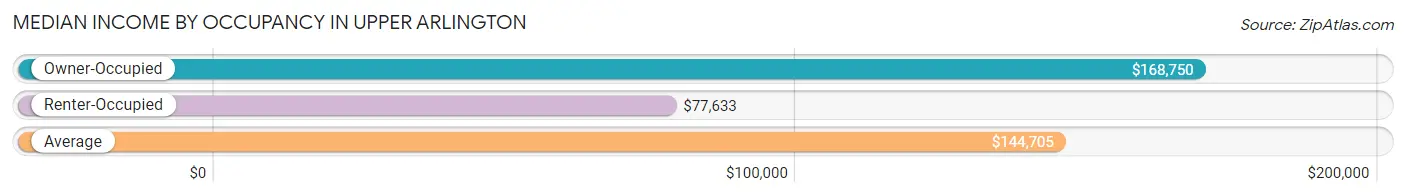
| Occupancy Type | # Households | Median Income |
| Owner-Occupied | 11,215 (78.6%) | $168,750 |
| Renter-Occupied | 3,053 (21.4%) | $77,633 |
| Average | 14,268 (100.0%) | $144,705 |
Occupancy by Householder Income Bracket in Upper Arlington
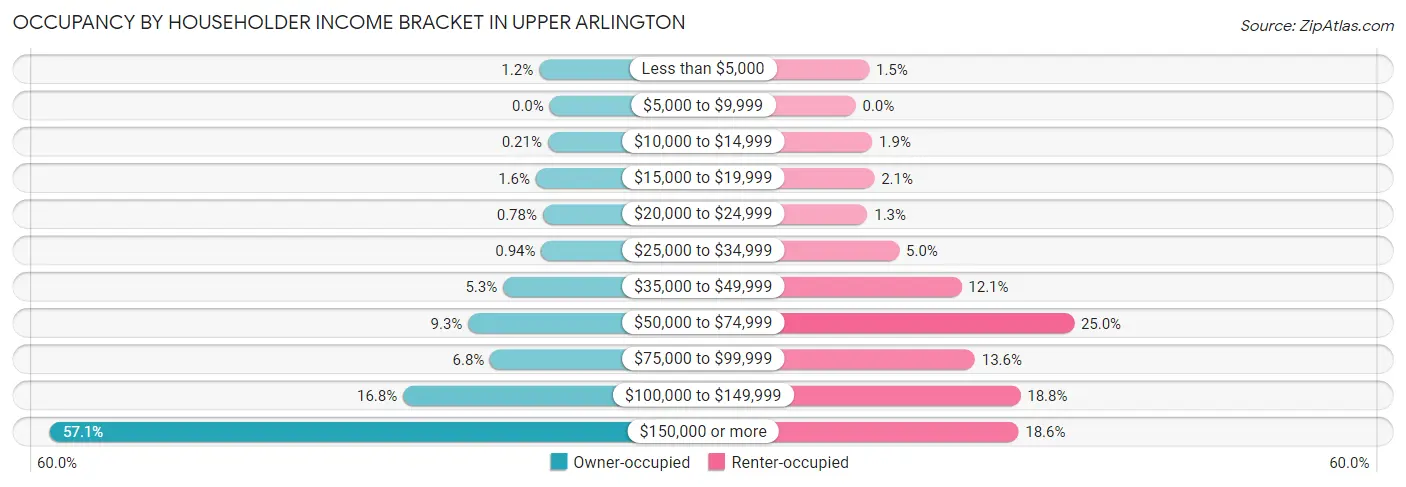
| Income Bracket | Owner-occupied | Renter-occupied |
| Less than $5,000 | 136 (1.2%) | 47 (1.5%) |
| $5,000 to $9,999 | 0 (0.0%) | 0 (0.0%) |
| $10,000 to $14,999 | 24 (0.2%) | 58 (1.9%) |
| $15,000 to $19,999 | 176 (1.6%) | 65 (2.1%) |
| $20,000 to $24,999 | 88 (0.8%) | 41 (1.3%) |
| $25,000 to $34,999 | 105 (0.9%) | 152 (5.0%) |
| $35,000 to $49,999 | 597 (5.3%) | 369 (12.1%) |
| $50,000 to $74,999 | 1,044 (9.3%) | 762 (25.0%) |
| $75,000 to $99,999 | 762 (6.8%) | 416 (13.6%) |
| $100,000 to $149,999 | 1,879 (16.8%) | 575 (18.8%) |
| $150,000 or more | 6,404 (57.1%) | 568 (18.6%) |
| Total | 11,215 (100.0%) | 3,053 (100.0%) |
Monthly Housing Cost Tiers in Upper Arlington
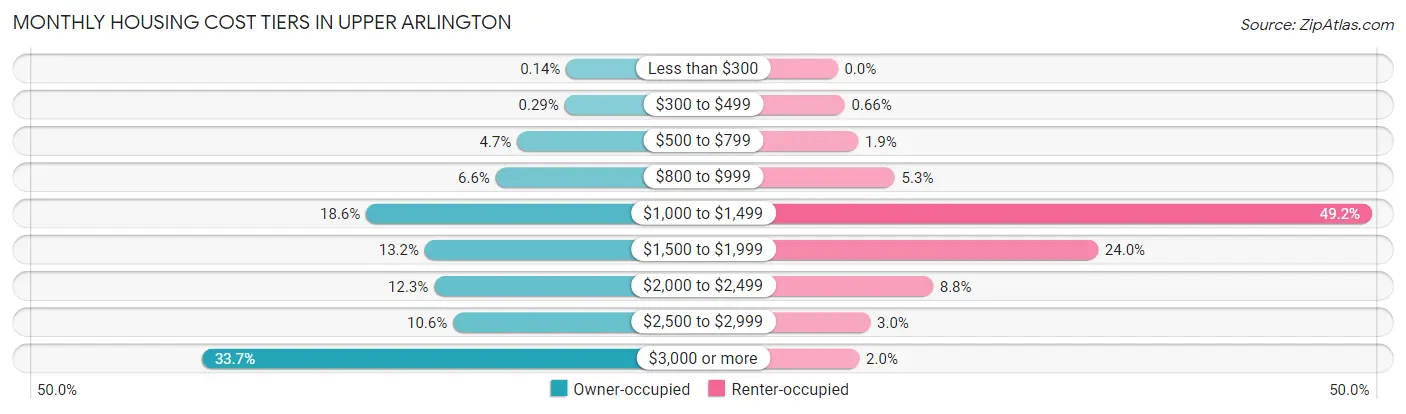
| Monthly Cost | Owner-occupied | Renter-occupied |
| Less than $300 | 16 (0.1%) | 0 (0.0%) |
| $300 to $499 | 33 (0.3%) | 20 (0.7%) |
| $500 to $799 | 523 (4.7%) | 58 (1.9%) |
| $800 to $999 | 743 (6.6%) | 161 (5.3%) |
| $1,000 to $1,499 | 2,082 (18.6%) | 1,502 (49.2%) |
| $1,500 to $1,999 | 1,476 (13.2%) | 732 (24.0%) |
| $2,000 to $2,499 | 1,380 (12.3%) | 268 (8.8%) |
| $2,500 to $2,999 | 1,184 (10.6%) | 92 (3.0%) |
| $3,000 or more | 3,778 (33.7%) | 61 (2.0%) |
| Total | 11,215 (100.0%) | 3,053 (100.0%) |
Physical Housing Characteristics in Upper Arlington
Housing Structures in Upper Arlington
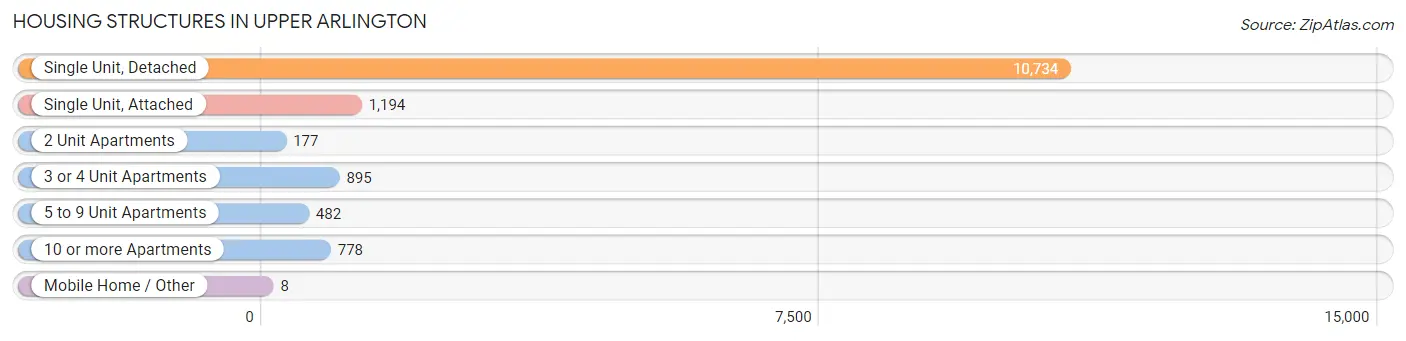
| Structure Type | # Housing Units | % Housing Units |
| Single Unit, Detached | 10,734 | 75.2% |
| Single Unit, Attached | 1,194 | 8.4% |
| 2 Unit Apartments | 177 | 1.2% |
| 3 or 4 Unit Apartments | 895 | 6.3% |
| 5 to 9 Unit Apartments | 482 | 3.4% |
| 10 or more Apartments | 778 | 5.4% |
| Mobile Home / Other | 8 | 0.1% |
| Total | 14,268 | 100.0% |
Housing Structures by Occupancy in Upper Arlington
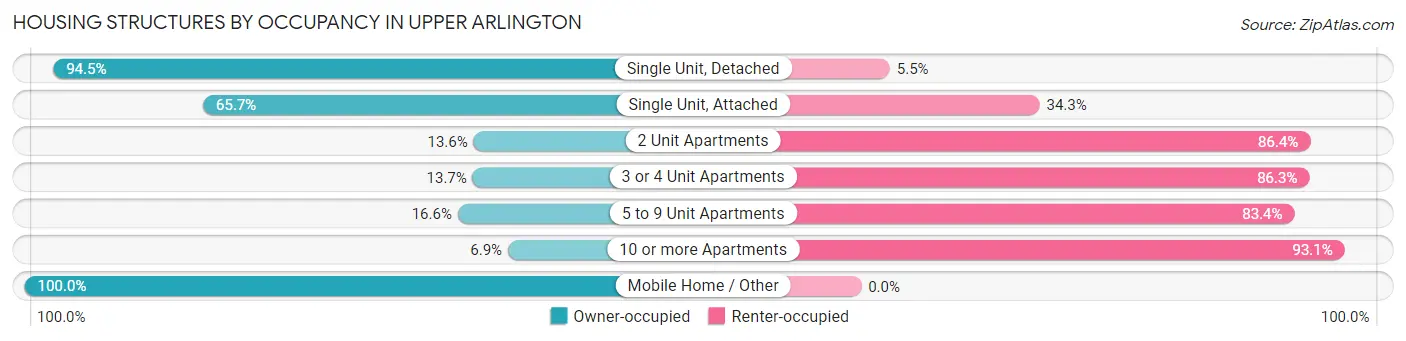
| Structure Type | Owner-occupied | Renter-occupied |
| Single Unit, Detached | 10,142 (94.5%) | 592 (5.5%) |
| Single Unit, Attached | 784 (65.7%) | 410 (34.3%) |
| 2 Unit Apartments | 24 (13.6%) | 153 (86.4%) |
| 3 or 4 Unit Apartments | 123 (13.7%) | 772 (86.3%) |
| 5 to 9 Unit Apartments | 80 (16.6%) | 402 (83.4%) |
| 10 or more Apartments | 54 (6.9%) | 724 (93.1%) |
| Mobile Home / Other | 8 (100.0%) | 0 (0.0%) |
| Total | 11,215 (78.6%) | 3,053 (21.4%) |
Housing Structures by Number of Rooms in Upper Arlington
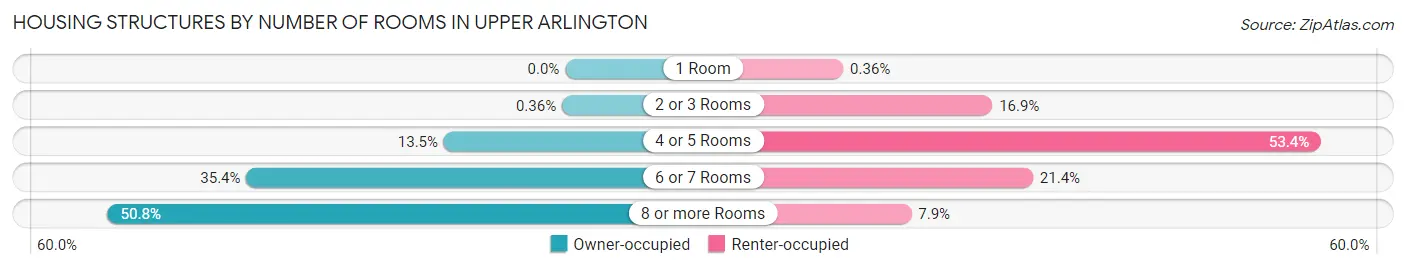
| Number of Rooms | Owner-occupied | Renter-occupied |
| 1 Room | 0 (0.0%) | 11 (0.4%) |
| 2 or 3 Rooms | 40 (0.4%) | 516 (16.9%) |
| 4 or 5 Rooms | 1,511 (13.5%) | 1,630 (53.4%) |
| 6 or 7 Rooms | 3,969 (35.4%) | 654 (21.4%) |
| 8 or more Rooms | 5,695 (50.8%) | 242 (7.9%) |
| Total | 11,215 (100.0%) | 3,053 (100.0%) |
Housing Structure by Heating Type in Upper Arlington
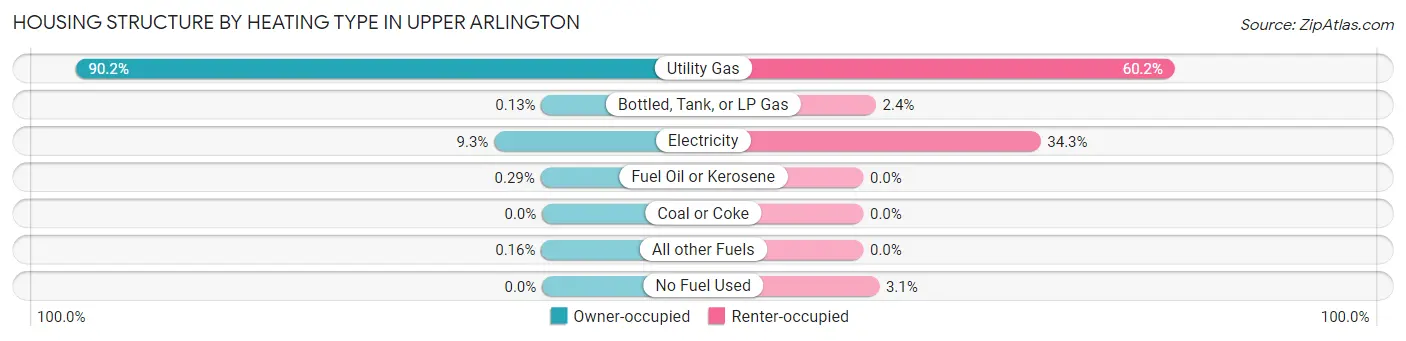
| Heating Type | Owner-occupied | Renter-occupied |
| Utility Gas | 10,111 (90.2%) | 1,839 (60.2%) |
| Bottled, Tank, or LP Gas | 15 (0.1%) | 74 (2.4%) |
| Electricity | 1,039 (9.3%) | 1,046 (34.3%) |
| Fuel Oil or Kerosene | 32 (0.3%) | 0 (0.0%) |
| Coal or Coke | 0 (0.0%) | 0 (0.0%) |
| All other Fuels | 18 (0.2%) | 0 (0.0%) |
| No Fuel Used | 0 (0.0%) | 94 (3.1%) |
| Total | 11,215 (100.0%) | 3,053 (100.0%) |
Household Vehicle Usage in Upper Arlington
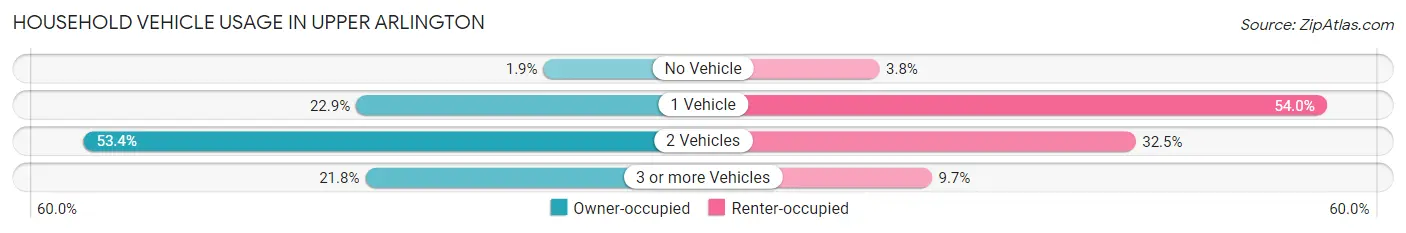
| Vehicles per Household | Owner-occupied | Renter-occupied |
| No Vehicle | 212 (1.9%) | 117 (3.8%) |
| 1 Vehicle | 2,566 (22.9%) | 1,647 (53.9%) |
| 2 Vehicles | 5,988 (53.4%) | 993 (32.5%) |
| 3 or more Vehicles | 2,449 (21.8%) | 296 (9.7%) |
| Total | 11,215 (100.0%) | 3,053 (100.0%) |
Real Estate & Mortgages in Upper Arlington
Real Estate and Mortgage Overview in Upper Arlington
| Characteristic | Without Mortgage | With Mortgage |
| Housing Units | 3,678 | 7,537 |
| Median Property Value | $465,000 | $562,100 |
| Median Household Income | $128,611 | $4,790 |
| Monthly Housing Costs | $1,181 | $3,726 |
| Real Estate Taxes | $9,087 | $30 |
Property Value by Mortgage Status in Upper Arlington
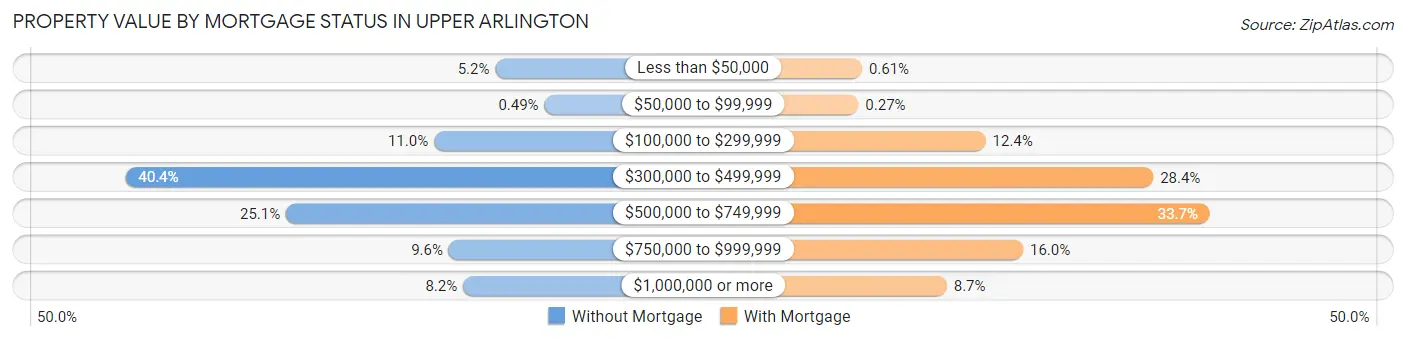
| Property Value | Without Mortgage | With Mortgage |
| Less than $50,000 | 190 (5.2%) | 46 (0.6%) |
| $50,000 to $99,999 | 18 (0.5%) | 20 (0.3%) |
| $100,000 to $299,999 | 405 (11.0%) | 934 (12.4%) |
| $300,000 to $499,999 | 1,486 (40.4%) | 2,137 (28.3%) |
| $500,000 to $749,999 | 923 (25.1%) | 2,543 (33.7%) |
| $750,000 to $999,999 | 353 (9.6%) | 1,202 (16.0%) |
| $1,000,000 or more | 303 (8.2%) | 655 (8.7%) |
| Total | 3,678 (100.0%) | 7,537 (100.0%) |
Household Income by Mortgage Status in Upper Arlington
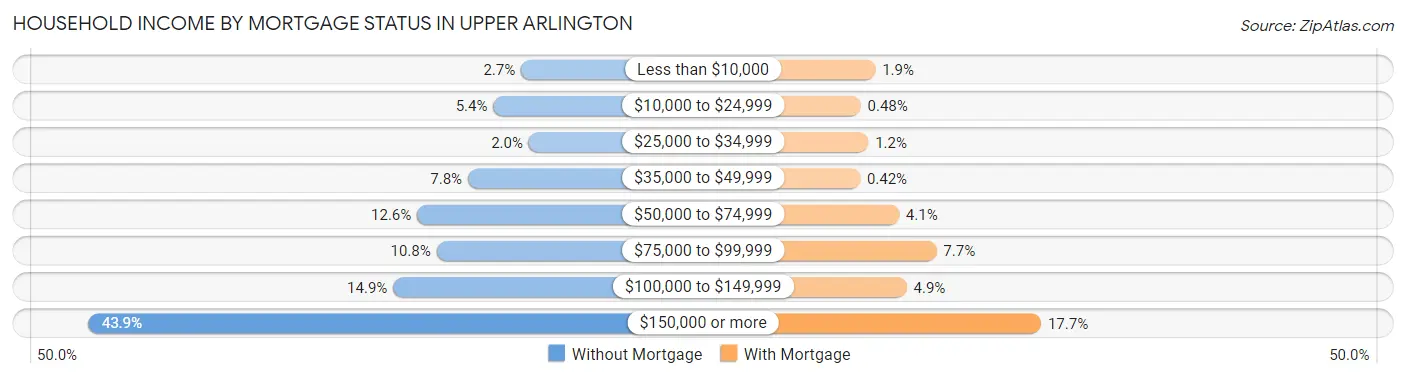
| Household Income | Without Mortgage | With Mortgage |
| Less than $10,000 | 100 (2.7%) | 141 (1.9%) |
| $10,000 to $24,999 | 197 (5.4%) | 36 (0.5%) |
| $25,000 to $34,999 | 73 (2.0%) | 91 (1.2%) |
| $35,000 to $49,999 | 286 (7.8%) | 32 (0.4%) |
| $50,000 to $74,999 | 464 (12.6%) | 311 (4.1%) |
| $75,000 to $99,999 | 396 (10.8%) | 580 (7.7%) |
| $100,000 to $149,999 | 548 (14.9%) | 366 (4.9%) |
| $150,000 or more | 1,614 (43.9%) | 1,331 (17.7%) |
| Total | 3,678 (100.0%) | 7,537 (100.0%) |
Property Value to Household Income Ratio in Upper Arlington
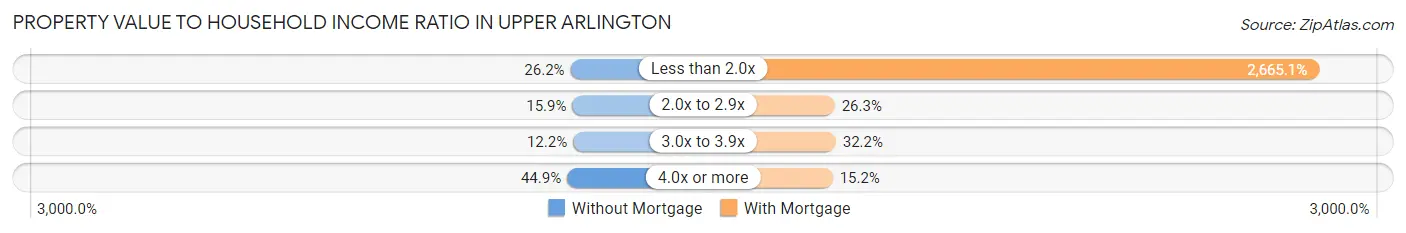
| Value-to-Income Ratio | Without Mortgage | With Mortgage |
| Less than 2.0x | 964 (26.2%) | 200,865 (2,665.1%) |
| 2.0x to 2.9x | 585 (15.9%) | 1,979 (26.3%) |
| 3.0x to 3.9x | 449 (12.2%) | 2,428 (32.2%) |
| 4.0x or more | 1,653 (44.9%) | 1,142 (15.1%) |
| Total | 3,678 (100.0%) | 7,537 (100.0%) |
Real Estate Taxes by Mortgage Status in Upper Arlington
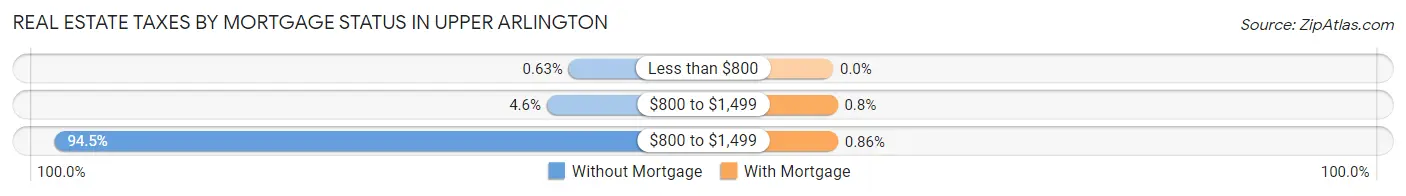
| Property Taxes | Without Mortgage | With Mortgage |
| Less than $800 | 23 (0.6%) | 0 (0.0%) |
| $800 to $1,499 | 170 (4.6%) | 60 (0.8%) |
| $800 to $1,499 | 3,477 (94.5%) | 65 (0.9%) |
| Total | 3,678 (100.0%) | 7,537 (100.0%) |
Health & Disability in Upper Arlington
Health Insurance Coverage by Age in Upper Arlington
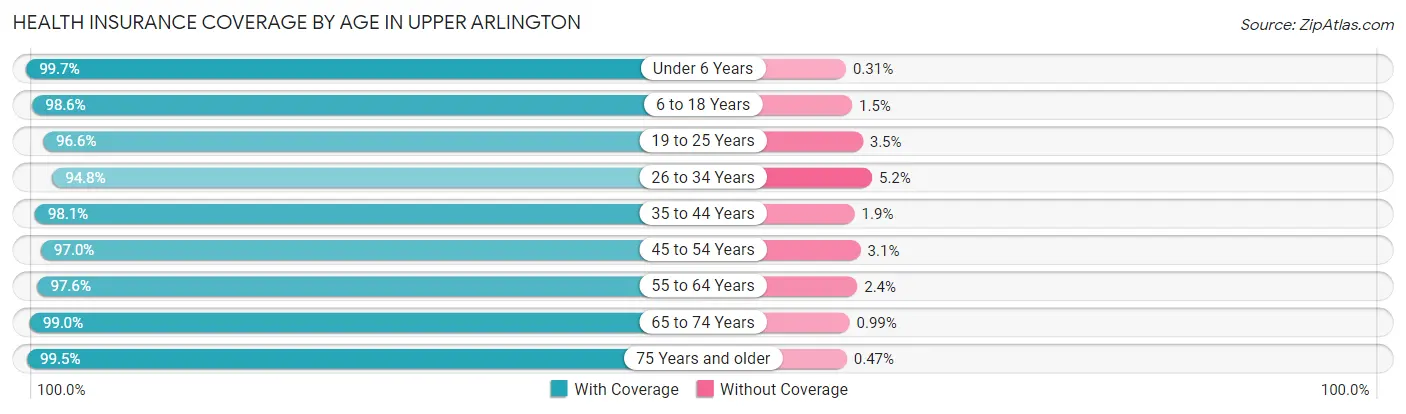
| Age Bracket | With Coverage | Without Coverage |
| Under 6 Years | 3,199 (99.7%) | 10 (0.3%) |
| 6 to 18 Years | 7,113 (98.6%) | 105 (1.5%) |
| 19 to 25 Years | 1,176 (96.6%) | 42 (3.5%) |
| 26 to 34 Years | 3,227 (94.8%) | 176 (5.2%) |
| 35 to 44 Years | 5,386 (98.1%) | 106 (1.9%) |
| 45 to 54 Years | 5,114 (97.0%) | 161 (3.0%) |
| 55 to 64 Years | 3,878 (97.6%) | 96 (2.4%) |
| 65 to 74 Years | 3,705 (99.0%) | 37 (1.0%) |
| 75 Years and older | 2,756 (99.5%) | 13 (0.5%) |
| Total | 35,554 (97.9%) | 746 (2.1%) |
Health Insurance Coverage by Citizenship Status in Upper Arlington
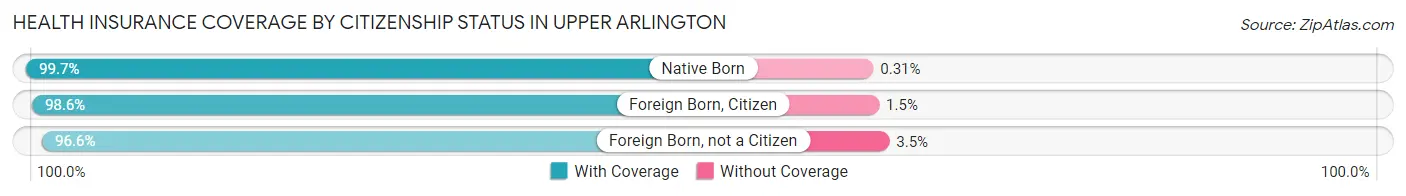
| Citizenship Status | With Coverage | Without Coverage |
| Native Born | 3,199 (99.7%) | 10 (0.3%) |
| Foreign Born, Citizen | 7,113 (98.6%) | 105 (1.5%) |
| Foreign Born, not a Citizen | 1,176 (96.6%) | 42 (3.5%) |
Health Insurance Coverage by Household Income in Upper Arlington
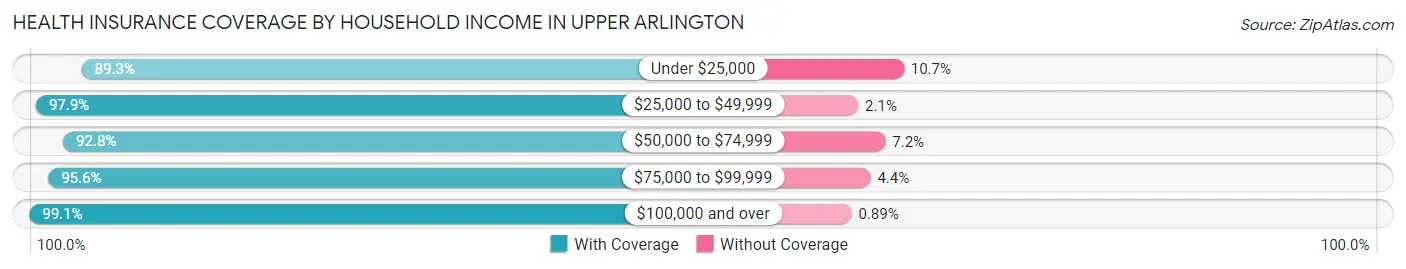
| Household Income | With Coverage | Without Coverage |
| Under $25,000 | 945 (89.3%) | 113 (10.7%) |
| $25,000 to $49,999 | 1,980 (97.9%) | 43 (2.1%) |
| $50,000 to $74,999 | 2,989 (92.8%) | 233 (7.2%) |
| $75,000 to $99,999 | 2,461 (95.6%) | 114 (4.4%) |
| $100,000 and over | 27,179 (99.1%) | 243 (0.9%) |
Public vs Private Health Insurance Coverage by Age in Upper Arlington
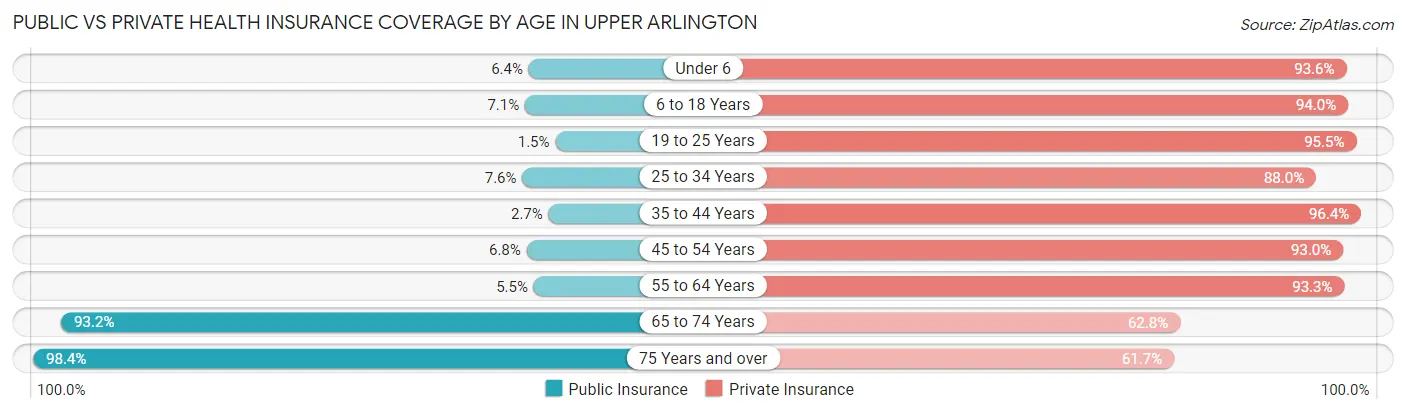
| Age Bracket | Public Insurance | Private Insurance |
| Under 6 | 206 (6.4%) | 3,005 (93.6%) |
| 6 to 18 Years | 513 (7.1%) | 6,782 (94.0%) |
| 19 to 25 Years | 18 (1.5%) | 1,163 (95.5%) |
| 25 to 34 Years | 259 (7.6%) | 2,995 (88.0%) |
| 35 to 44 Years | 150 (2.7%) | 5,294 (96.4%) |
| 45 to 54 Years | 360 (6.8%) | 4,908 (93.0%) |
| 55 to 64 Years | 218 (5.5%) | 3,706 (93.3%) |
| 65 to 74 Years | 3,489 (93.2%) | 2,349 (62.8%) |
| 75 Years and over | 2,725 (98.4%) | 1,707 (61.7%) |
| Total | 7,938 (21.9%) | 31,909 (87.9%) |
Disability Status by Sex by Age in Upper Arlington
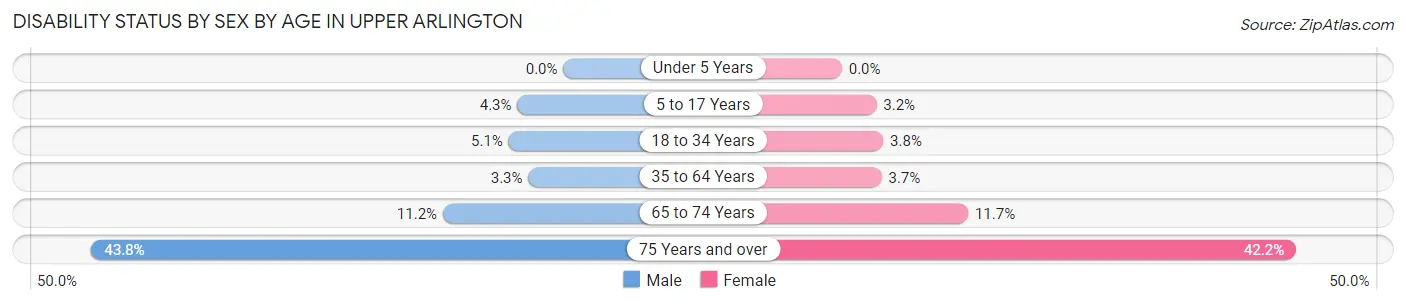
| Age Bracket | Male | Female |
| Under 5 Years | 0 (0.0%) | 0 (0.0%) |
| 5 to 17 Years | 175 (4.3%) | 109 (3.2%) |
| 18 to 34 Years | 130 (5.1%) | 92 (3.8%) |
| 35 to 64 Years | 234 (3.3%) | 278 (3.7%) |
| 65 to 74 Years | 193 (11.2%) | 236 (11.7%) |
| 75 Years and over | 607 (43.8%) | 583 (42.1%) |
Disability Class by Sex by Age in Upper Arlington
Disability Class: Hearing Difficulty
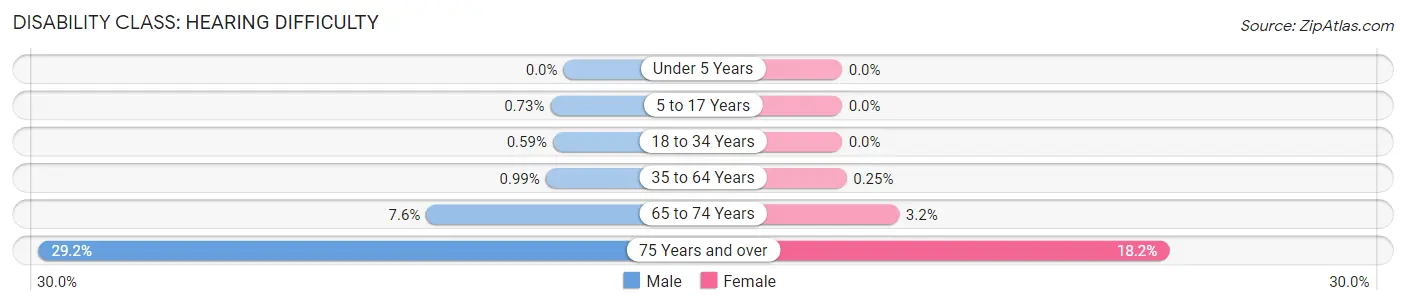
| Age Bracket | Male | Female |
| Under 5 Years | 0 (0.0%) | 0 (0.0%) |
| 5 to 17 Years | 30 (0.7%) | 0 (0.0%) |
| 18 to 34 Years | 15 (0.6%) | 0 (0.0%) |
| 35 to 64 Years | 71 (1.0%) | 19 (0.3%) |
| 65 to 74 Years | 132 (7.6%) | 64 (3.2%) |
| 75 Years and over | 405 (29.2%) | 252 (18.2%) |
Disability Class: Vision Difficulty
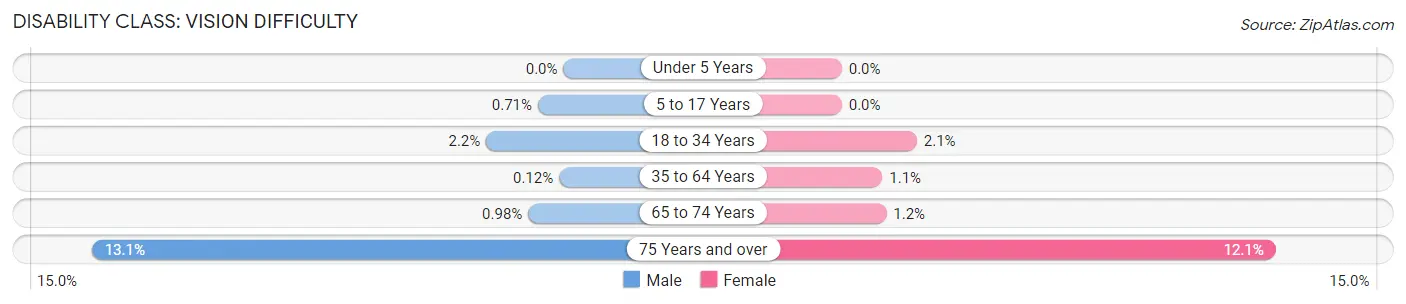
| Age Bracket | Male | Female |
| Under 5 Years | 0 (0.0%) | 0 (0.0%) |
| 5 to 17 Years | 29 (0.7%) | 0 (0.0%) |
| 18 to 34 Years | 55 (2.1%) | 50 (2.1%) |
| 35 to 64 Years | 9 (0.1%) | 85 (1.1%) |
| 65 to 74 Years | 17 (1.0%) | 25 (1.2%) |
| 75 Years and over | 182 (13.1%) | 167 (12.1%) |
Disability Class: Cognitive Difficulty
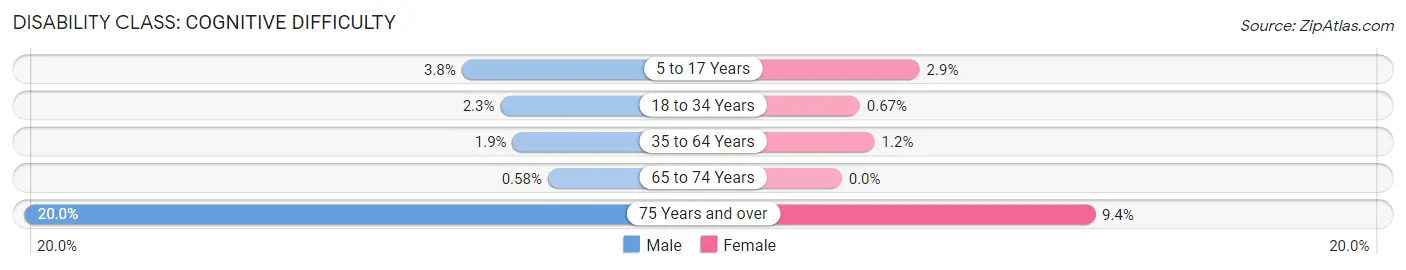
| Age Bracket | Male | Female |
| 5 to 17 Years | 155 (3.8%) | 98 (2.9%) |
| 18 to 34 Years | 60 (2.3%) | 16 (0.7%) |
| 35 to 64 Years | 136 (1.9%) | 92 (1.2%) |
| 65 to 74 Years | 10 (0.6%) | 0 (0.0%) |
| 75 Years and over | 277 (20.0%) | 130 (9.4%) |
Disability Class: Ambulatory Difficulty
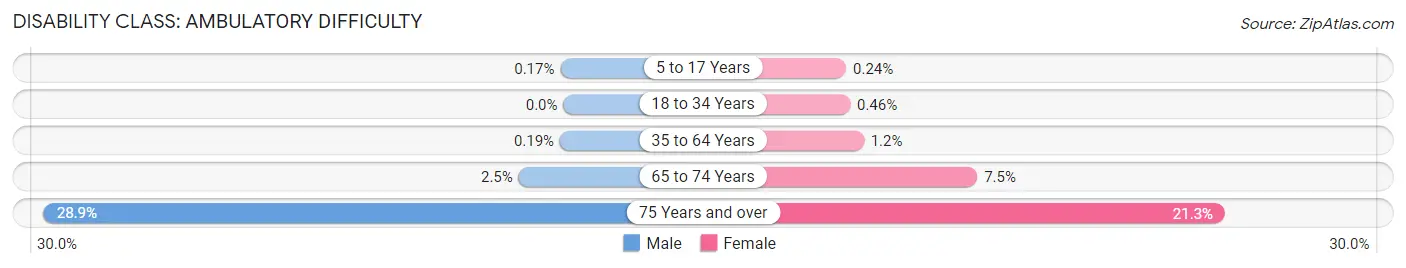
| Age Bracket | Male | Female |
| 5 to 17 Years | 7 (0.2%) | 8 (0.2%) |
| 18 to 34 Years | 0 (0.0%) | 11 (0.5%) |
| 35 to 64 Years | 14 (0.2%) | 92 (1.2%) |
| 65 to 74 Years | 43 (2.5%) | 152 (7.5%) |
| 75 Years and over | 401 (28.9%) | 295 (21.3%) |
Disability Class: Self-Care Difficulty
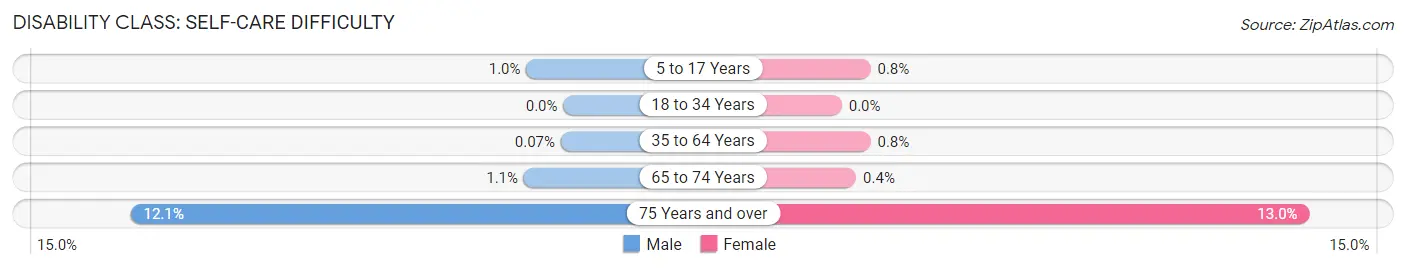
| Age Bracket | Male | Female |
| 5 to 17 Years | 42 (1.0%) | 27 (0.8%) |
| 18 to 34 Years | 0 (0.0%) | 0 (0.0%) |
| 35 to 64 Years | 5 (0.1%) | 60 (0.8%) |
| 65 to 74 Years | 19 (1.1%) | 8 (0.4%) |
| 75 Years and over | 167 (12.0%) | 180 (13.0%) |
Technology Access in Upper Arlington
Computing Device Access in Upper Arlington
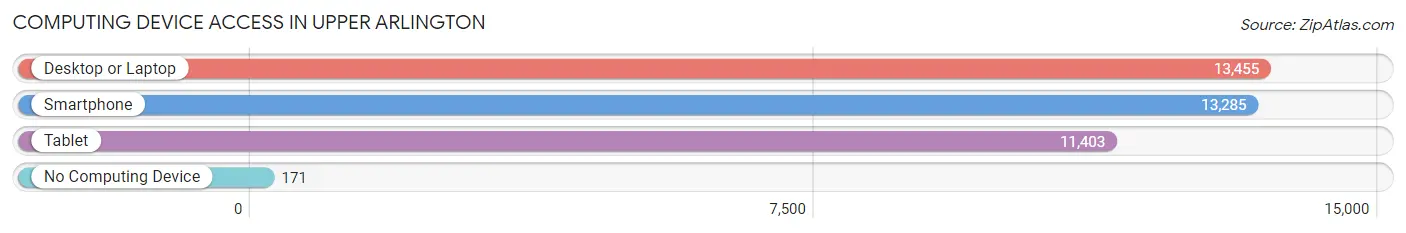
| Device Type | # Households | % Households |
| Desktop or Laptop | 13,455 | 94.3% |
| Smartphone | 13,285 | 93.1% |
| Tablet | 11,403 | 79.9% |
| No Computing Device | 171 | 1.2% |
| Total | 14,268 | 100.0% |
Internet Access in Upper Arlington
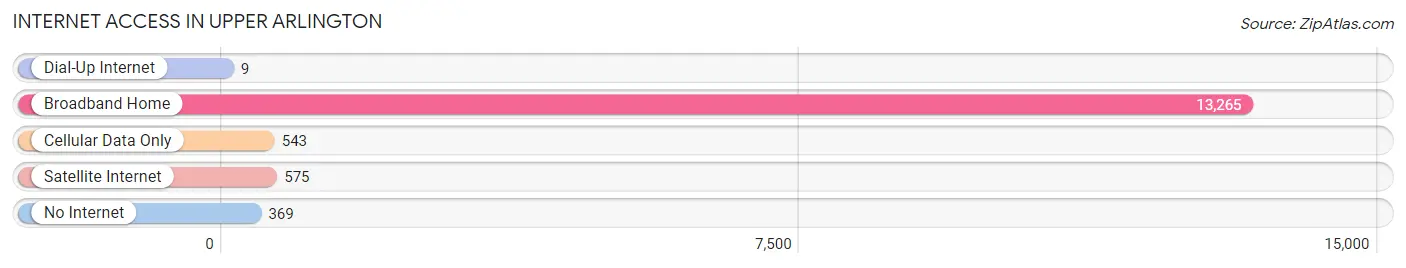
| Internet Type | # Households | % Households |
| Dial-Up Internet | 9 | 0.1% |
| Broadband Home | 13,265 | 93.0% |
| Cellular Data Only | 543 | 3.8% |
| Satellite Internet | 575 | 4.0% |
| No Internet | 369 | 2.6% |
| Total | 14,268 | 100.0% |
Upper Arlington Summary
Upper Arlington is a city located in Franklin County, Ohio, United States. It is a suburb of Columbus, the state capital and largest city in Ohio. The population was 33,771 at the 2010 census. Upper Arlington is a wealthy suburb of Columbus and is home to the Ohio State University.
Geography
Upper Arlington is located at 40°3′17″N 83°4′25″W (40.054722, -83.073611). According to the United States Census Bureau, the city has a total area of 8.90 square miles (23.09 km2), of which 8.87 square miles (22.99 km2) is land and 0.03 square miles (0.10 km2) is water.
Upper Arlington is bordered by the cities of Grandview Heights to the north, Marble Cliff to the east, Columbus to the south, and Hilliard to the west. The Scioto River forms the western boundary of the city.
History
Upper Arlington was founded in 1918 by brothers King and Ben Thompson, who purchased the land from the Shoenberger family. The brothers had previously developed the nearby suburb of Marble Cliff. The name "Upper Arlington" was chosen to distinguish it from the nearby city of Arlington, which was then a separate municipality.
The city was incorporated in 1941 and has since grown to become one of the most affluent suburbs of Columbus. Upper Arlington is home to the Ohio State University, which is located just south of the city limits.
Economy
Upper Arlington is a wealthy suburb of Columbus and is home to many corporate headquarters and other businesses. The city's largest employers include the Ohio State University, Nationwide Insurance, and the OhioHealth Corporation.
Upper Arlington is also home to a number of retail establishments, including the Mall at Tuttle Crossing, which is located just south of the city limits. The city also has a number of restaurants, bars, and other entertainment venues.
Demographics
As of the 2010 census, there were 33,771 people, 14,845 households, and 8,945 families residing in the city. The population density was 3,811.3 people per square mile (1,470.2/km2). There were 15,845 housing units at an average density of 1,788.3 per square mile (692.2/km2). The racial makeup of the city was 90.2% White, 3.2% African American, 0.2% Native American, 4.3% Asian, 0.7% from other races, and 1.4% from two or more races. Hispanic or Latino of any race were 2.2% of the population.
There were 14,845 households, out of which 28.2% had children under the age of 18 living with them, 51.2% were married couples living together, 8.2% had a female householder with no husband present, and 37.7% were non-families. 32.2% of all households were made up of individuals, and 13.2% had someone living alone who was 65 years of age or older. The average household size was 2.27 and the average family size was 2.91.
In the city, the population was spread out, with 22.7% under the age of 18, 8.2% from 18 to 24, 25.7% from 25 to 44, 25.7% from 45 to 64, and 17.7% who were 65 years of age or older. The median age was 40 years. For every 100 females, there were 90.2 males. For every 100 females age 18 and over, there were 86.3 males.
The median income for a household in the city was $76,837, and the median income for a family was $97,837. Males had a median income of $63,917 versus $45,917 for females. The per capita income for the city was $41,945. About 2.7% of families and 4.2% of the population were below the poverty line, including 4.2% of those under age 18 and 4.2% of those age 65 or over.
Common Questions
What is Per Capita Income in Upper Arlington?
Per Capita income in Upper Arlington is $79,874.
What is the Median Family Income in Upper Arlington?
Median Family Income in Upper Arlington is $187,754.
What is the Median Household income in Upper Arlington?
Median Household Income in Upper Arlington is $144,705.
What is Income or Wage Gap in Upper Arlington?
Income or Wage Gap in Upper Arlington is 44.8%.
Women in Upper Arlington earn 55.2 cents for every dollar earned by a man.
What is Family Income Deficit in Upper Arlington?
Family Income Deficit in Upper Arlington is $16,816.
Families that are below poverty line in Upper Arlington earn $16,816 less on average than the poverty threshold level.
What is Inequality or Gini Index in Upper Arlington?
Inequality or Gini Index in Upper Arlington is 0.47.
What is the Total Population of Upper Arlington?
Total Population of Upper Arlington is 36,500.
What is the Total Male Population of Upper Arlington?
Total Male Population of Upper Arlington is 18,260.
What is the Total Female Population of Upper Arlington?
Total Female Population of Upper Arlington is 18,240.
What is the Ratio of Males per 100 Females in Upper Arlington?
There are 100.11 Males per 100 Females in Upper Arlington.
What is the Ratio of Females per 100 Males in Upper Arlington?
There are 99.89 Females per 100 Males in Upper Arlington.
What is the Median Population Age in Upper Arlington?
Median Population Age in Upper Arlington is 40.3 Years.
What is the Average Family Size in Upper Arlington
Average Family Size in Upper Arlington is 3.1 People.
What is the Average Household Size in Upper Arlington
Average Household Size in Upper Arlington is 2.5 People.
How Large is the Labor Force in Upper Arlington?
There are 18,693 People in the Labor Forcein in Upper Arlington.
What is the Percentage of People in the Labor Force in Upper Arlington?
67.9% of People are in the Labor Force in Upper Arlington.
What is the Unemployment Rate in Upper Arlington?
Unemployment Rate in Upper Arlington is 2.2%.