Orange, OH Map & Demographics
Orange Map
Orange Overview
$78,936
PER CAPITA INCOME
$165,625
AVG FAMILY INCOME
$150,729
AVG HOUSEHOLD INCOME
57.6%
WAGE / INCOME GAP [ % ]
42.4¢/ $1
WAGE / INCOME GAP [ $ ]
0.51
INEQUALITY / GINI INDEX
3,432
TOTAL POPULATION
1,736
MALE POPULATION
1,696
FEMALE POPULATION
102.36
MALES / 100 FEMALES
97.70
FEMALES / 100 MALES
47.4
MEDIAN AGE
2.8
AVG FAMILY SIZE
2.5
AVG HOUSEHOLD SIZE
1,656
LABOR FORCE [ PEOPLE ]
60.9%
PERCENT IN LABOR FORCE
9.3%
UNEMPLOYMENT RATE
Income in Orange
Income Overview in Orange
Per Capita Income in Orange is $78,936, while median incomes of families and households are $165,625 and $150,729 respectively.
| Characteristic | Number | Measure |
| Per Capita Income | 3,432 | $78,936 |
| Median Family Income | 1,118 | $165,625 |
| Mean Family Income | 1,118 | $225,938 |
| Median Household Income | 1,373 | $150,729 |
| Mean Household Income | 1,373 | $198,669 |
| Income Deficit | 1,118 | $0 |
| Wage / Income Gap (%) | 3,432 | 57.61% |
| Wage / Income Gap ($) | 3,432 | 42.39¢ per $1 |
| Gini / Inequality Index | 3,432 | 0.51 |
Earnings by Sex in Orange
Average Earnings in Orange are $70,000, $114,306 for men and $48,454 for women, a difference of 57.6%.
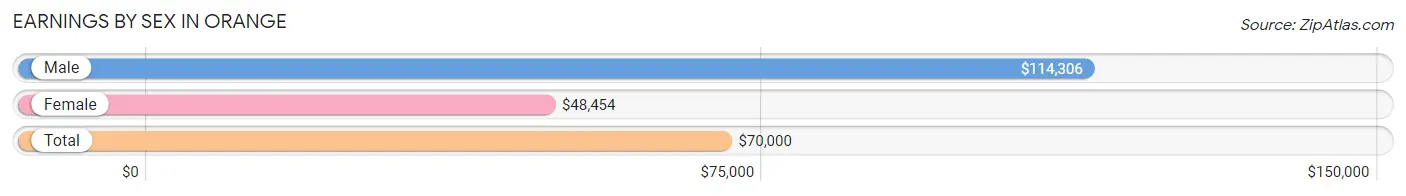
| Sex | Number | Average Earnings |
| Male | 1,041 (60.0%) | $114,306 |
| Female | 695 (40.0%) | $48,454 |
| Total | 1,736 (100.0%) | $70,000 |
Earnings by Sex by Income Bracket in Orange
The most common earnings brackets in Orange are $100,000+ for men (547 | 52.5%) and $100,000+ for women (116 | 16.7%).
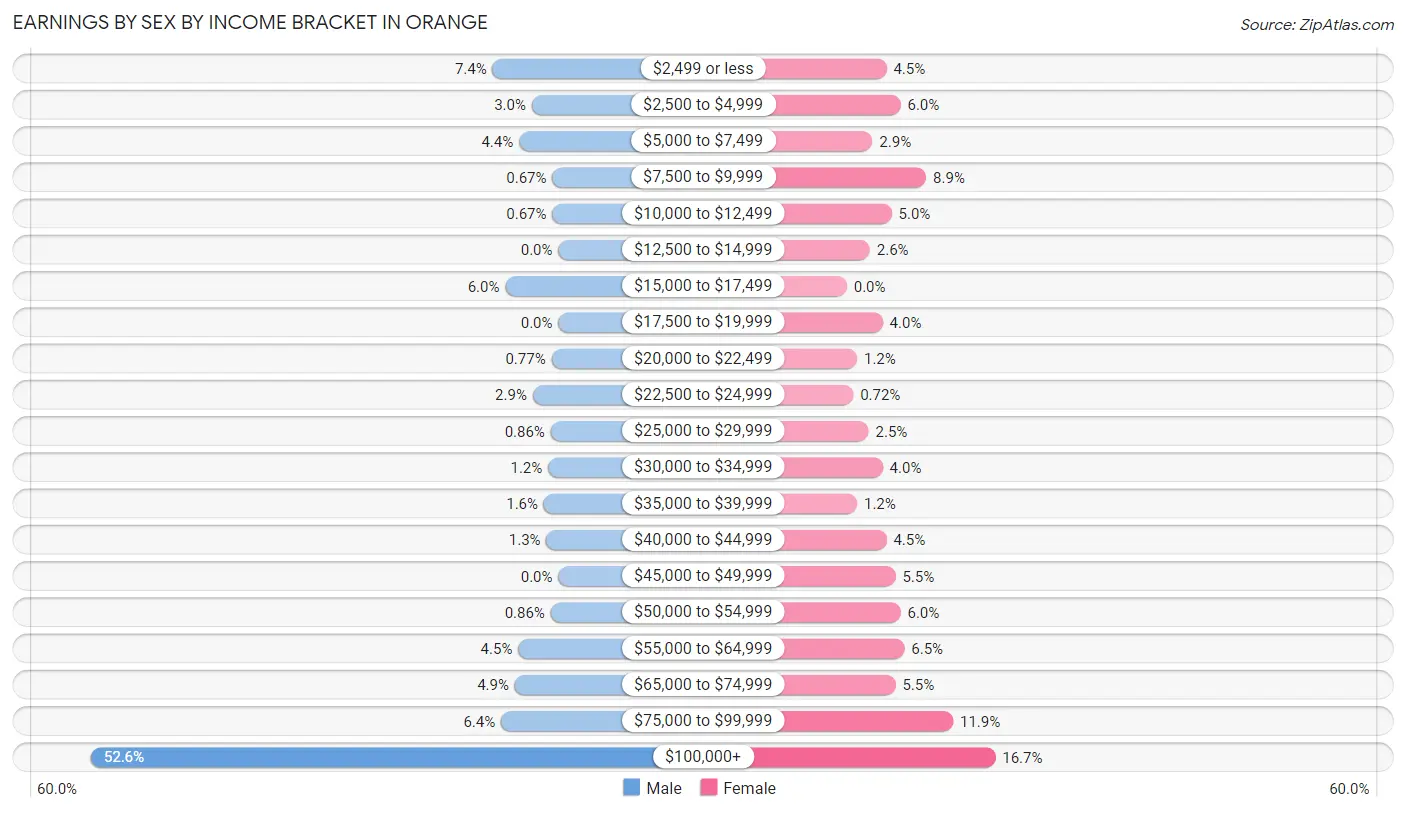
| Income | Male | Female |
| $2,499 or less | 77 (7.4%) | 31 (4.5%) |
| $2,500 to $4,999 | 31 (3.0%) | 42 (6.0%) |
| $5,000 to $7,499 | 46 (4.4%) | 20 (2.9%) |
| $7,500 to $9,999 | 7 (0.7%) | 62 (8.9%) |
| $10,000 to $12,499 | 7 (0.7%) | 35 (5.0%) |
| $12,500 to $14,999 | 0 (0.0%) | 18 (2.6%) |
| $15,000 to $17,499 | 62 (6.0%) | 0 (0.0%) |
| $17,500 to $19,999 | 0 (0.0%) | 28 (4.0%) |
| $20,000 to $22,499 | 8 (0.8%) | 8 (1.1%) |
| $22,500 to $24,999 | 30 (2.9%) | 5 (0.7%) |
| $25,000 to $29,999 | 9 (0.9%) | 17 (2.5%) |
| $30,000 to $34,999 | 12 (1.1%) | 28 (4.0%) |
| $35,000 to $39,999 | 17 (1.6%) | 8 (1.1%) |
| $40,000 to $44,999 | 14 (1.3%) | 31 (4.5%) |
| $45,000 to $49,999 | 0 (0.0%) | 38 (5.5%) |
| $50,000 to $54,999 | 9 (0.9%) | 42 (6.0%) |
| $55,000 to $64,999 | 47 (4.5%) | 45 (6.5%) |
| $65,000 to $74,999 | 51 (4.9%) | 38 (5.5%) |
| $75,000 to $99,999 | 67 (6.4%) | 83 (11.9%) |
| $100,000+ | 547 (52.5%) | 116 (16.7%) |
| Total | 1,041 (100.0%) | 695 (100.0%) |
Earnings by Sex by Educational Attainment in Orange
Average earnings in Orange are $125,563 for men and $50,565 for women, a difference of 59.7%. Men with an educational attainment of graduate degree enjoy the highest average annual earnings of $145,938, while those with college or associate's degree education earn the least with $74,500. Women with an educational attainment of graduate degree earn the most with the average annual earnings of $87,768, while those with graduate degree education have the smallest earnings of $87,768.
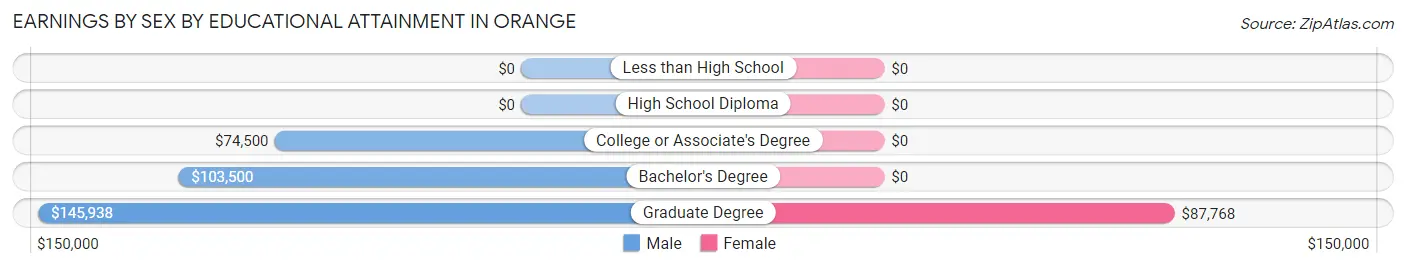
| Educational Attainment | Male Income | Female Income |
| Less than High School | - | - |
| High School Diploma | - | - |
| College or Associate's Degree | $74,500 | $0 |
| Bachelor's Degree | $103,500 | $0 |
| Graduate Degree | $145,938 | $87,768 |
| Total | $125,563 | $50,565 |
Family Income in Orange
Family Income Brackets in Orange
According to the Orange family income data, there are 430 families falling into the $200,000+ income range, which is the most common income bracket and makes up 38.5% of all families.
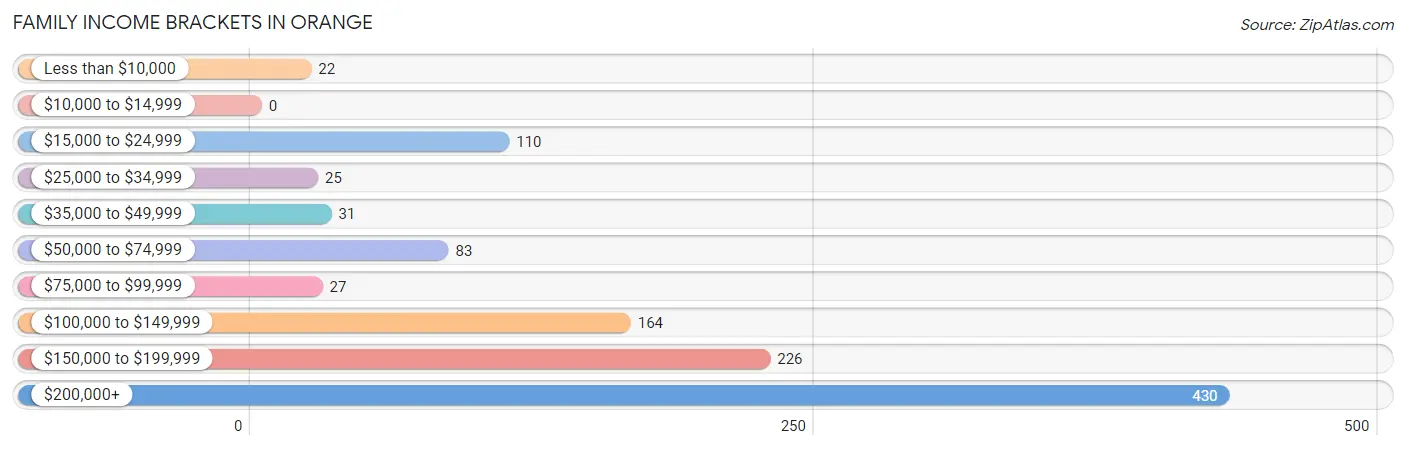
| Income Bracket | # Families | % Families |
| Less than $10,000 | 22 | 2.0% |
| $10,000 to $14,999 | 0 | 0.0% |
| $15,000 to $24,999 | 110 | 9.8% |
| $25,000 to $34,999 | 25 | 2.2% |
| $35,000 to $49,999 | 31 | 2.8% |
| $50,000 to $74,999 | 83 | 7.4% |
| $75,000 to $99,999 | 27 | 2.4% |
| $100,000 to $149,999 | 164 | 14.7% |
| $150,000 to $199,999 | 226 | 20.2% |
| $200,000+ | 430 | 38.5% |
Family Income by Famaliy Size in Orange
3-person families (210 | 18.8%) account for the highest median family income in Orange with $193,750 per family, while 2-person families (609 | 54.5%) have the highest median income of $90,202 per family member.
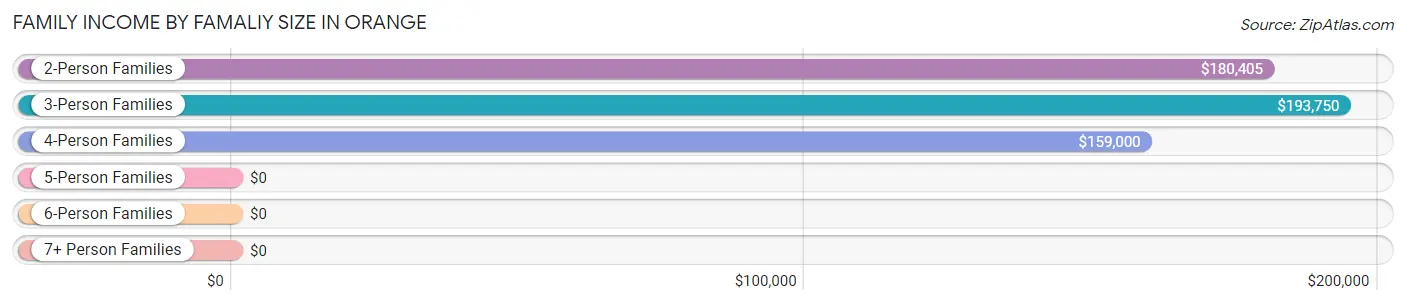
| Income Bracket | # Families | Median Income |
| 2-Person Families | 609 (54.5%) | $180,405 |
| 3-Person Families | 210 (18.8%) | $193,750 |
| 4-Person Families | 268 (24.0%) | $159,000 |
| 5-Person Families | 31 (2.8%) | $0 |
| 6-Person Families | 0 (0.0%) | $0 |
| 7+ Person Families | 0 (0.0%) | $0 |
| Total | 1,118 (100.0%) | $165,625 |
Family Income by Number of Earners in Orange
The median family income in Orange is $165,625, with families comprising 2 earners (457) having the highest median family income of $185,625, while families with no earners (120) have the lowest median family income of $103,417, accounting for 40.9% and 10.7% of families, respectively.
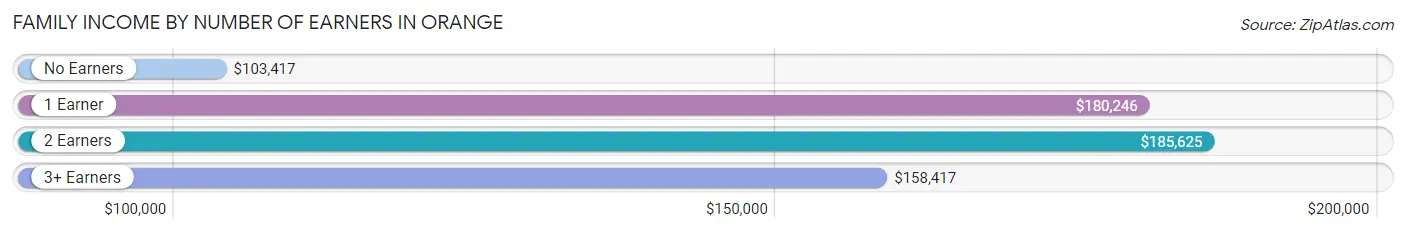
| Number of Earners | # Families | Median Income |
| No Earners | 120 (10.7%) | $103,417 |
| 1 Earner | 484 (43.3%) | $180,246 |
| 2 Earners | 457 (40.9%) | $185,625 |
| 3+ Earners | 57 (5.1%) | $158,417 |
| Total | 1,118 (100.0%) | $165,625 |
Household Income in Orange
Household Income Brackets in Orange
With 454 households falling in the category, the $200,000+ income range is the most frequent in Orange, accounting for 33.1% of all households. In contrast, only 12 households (0.9%) fall into the $10,000 to $14,999 income bracket, making it the least populous group.
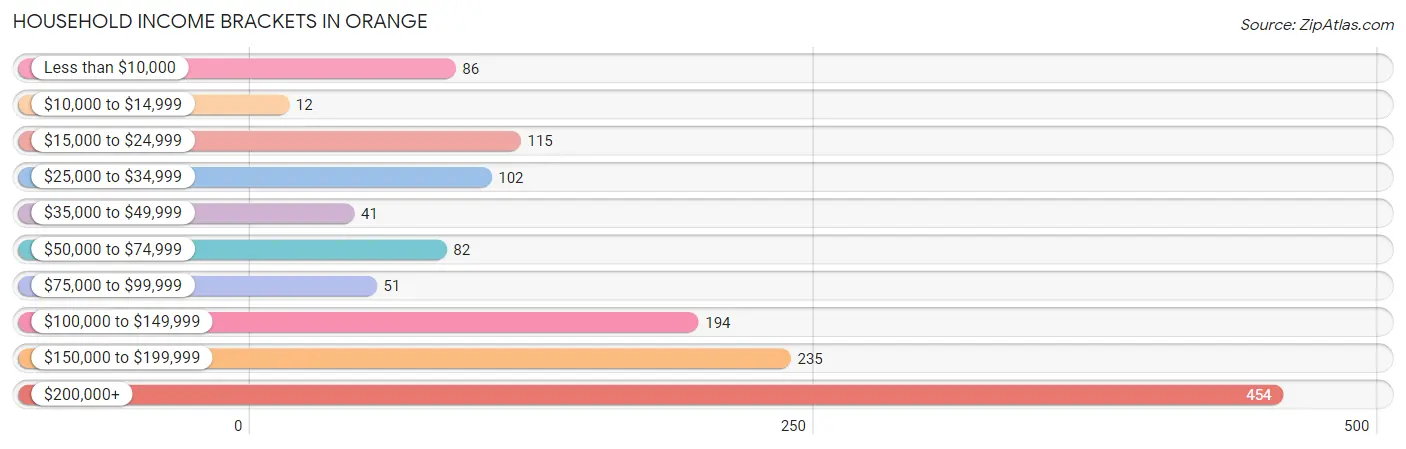
| Income Bracket | # Households | % Households |
| Less than $10,000 | 86 | 6.3% |
| $10,000 to $14,999 | 12 | 0.9% |
| $15,000 to $24,999 | 115 | 8.4% |
| $25,000 to $34,999 | 102 | 7.4% |
| $35,000 to $49,999 | 41 | 3.0% |
| $50,000 to $74,999 | 82 | 6.0% |
| $75,000 to $99,999 | 51 | 3.7% |
| $100,000 to $149,999 | 194 | 14.1% |
| $150,000 to $199,999 | 235 | 17.1% |
| $200,000+ | 454 | 33.1% |
Household Income by Householder Age in Orange
The median household income in Orange is $150,729, with the highest median household income of $160,375 found in the 45 to 64 years age bracket for the primary householder. A total of 514 households (37.4%) fall into this category.
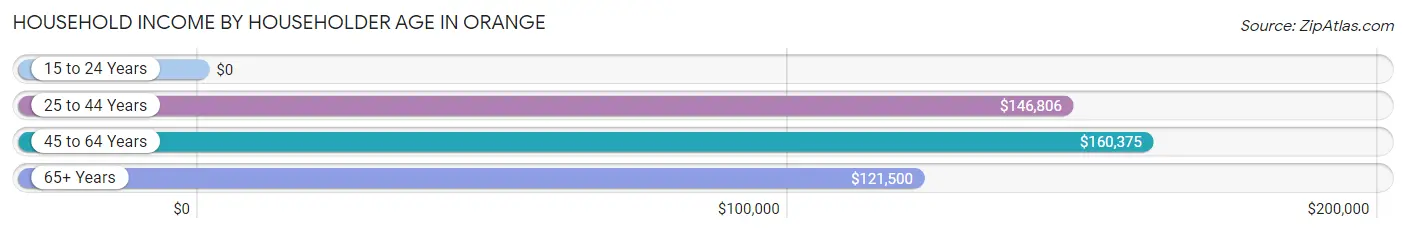
| Income Bracket | # Households | Median Income |
| 15 to 24 Years | 0 (0.0%) | $0 |
| 25 to 44 Years | 341 (24.8%) | $146,806 |
| 45 to 64 Years | 514 (37.4%) | $160,375 |
| 65+ Years | 518 (37.7%) | $121,500 |
| Total | 1,373 (100.0%) | $150,729 |
Poverty in Orange
Income Below Poverty by Sex and Age in Orange
With 14.5% poverty level for males and 19.4% for females among the residents of Orange, 12 to 14 year old males and 16 and 17 year old females are the most vulnerable to poverty, with 79 males (69.9%) and 58 females (58.6%) in their respective age groups living below the poverty level.
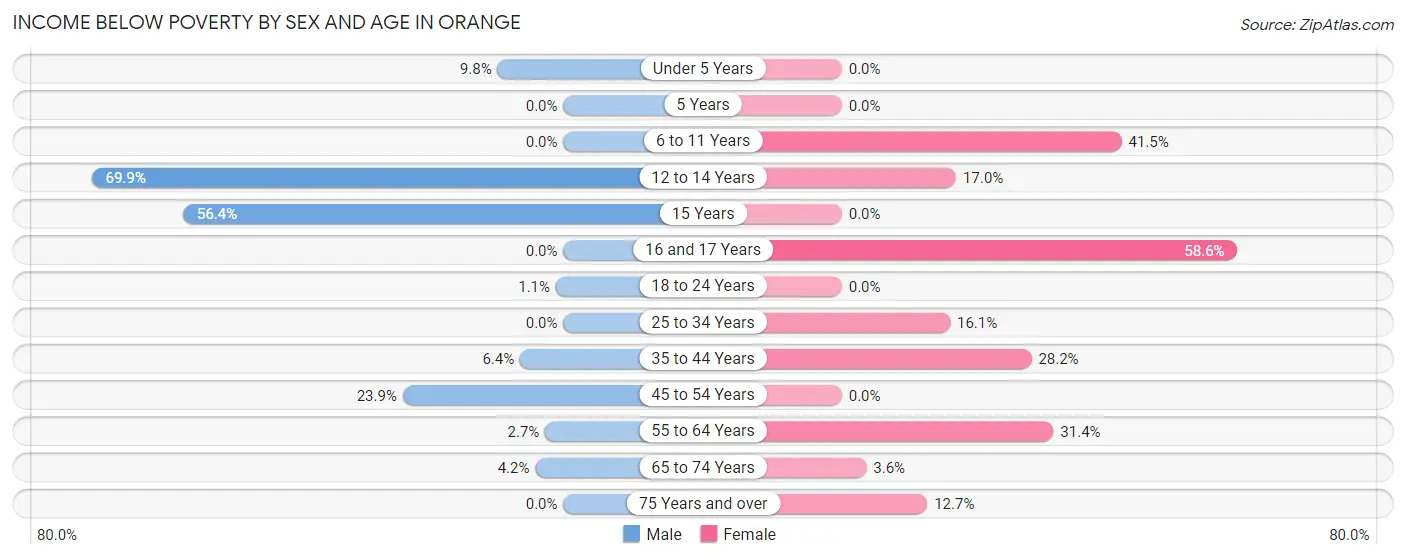
| Age Bracket | Male | Female |
| Under 5 Years | 9 (9.8%) | 0 (0.0%) |
| 5 Years | 0 (0.0%) | 0 (0.0%) |
| 6 to 11 Years | 0 (0.0%) | 27 (41.5%) |
| 12 to 14 Years | 79 (69.9%) | 18 (17.0%) |
| 15 Years | 71 (56.4%) | 0 (0.0%) |
| 16 and 17 Years | 0 (0.0%) | 58 (58.6%) |
| 18 to 24 Years | 1 (1.1%) | 0 (0.0%) |
| 25 to 34 Years | 0 (0.0%) | 9 (16.1%) |
| 35 to 44 Years | 12 (6.4%) | 78 (28.2%) |
| 45 to 54 Years | 62 (23.8%) | 0 (0.0%) |
| 55 to 64 Years | 7 (2.7%) | 104 (31.4%) |
| 65 to 74 Years | 11 (4.2%) | 10 (3.6%) |
| 75 Years and over | 0 (0.0%) | 25 (12.7%) |
| Total | 252 (14.5%) | 329 (19.4%) |
Income Above Poverty by Sex and Age in Orange
According to the poverty statistics in Orange, males aged 5 years and females aged under 5 years are the age groups that are most secure financially, with 100.0% of males and 100.0% of females in these age groups living above the poverty line.
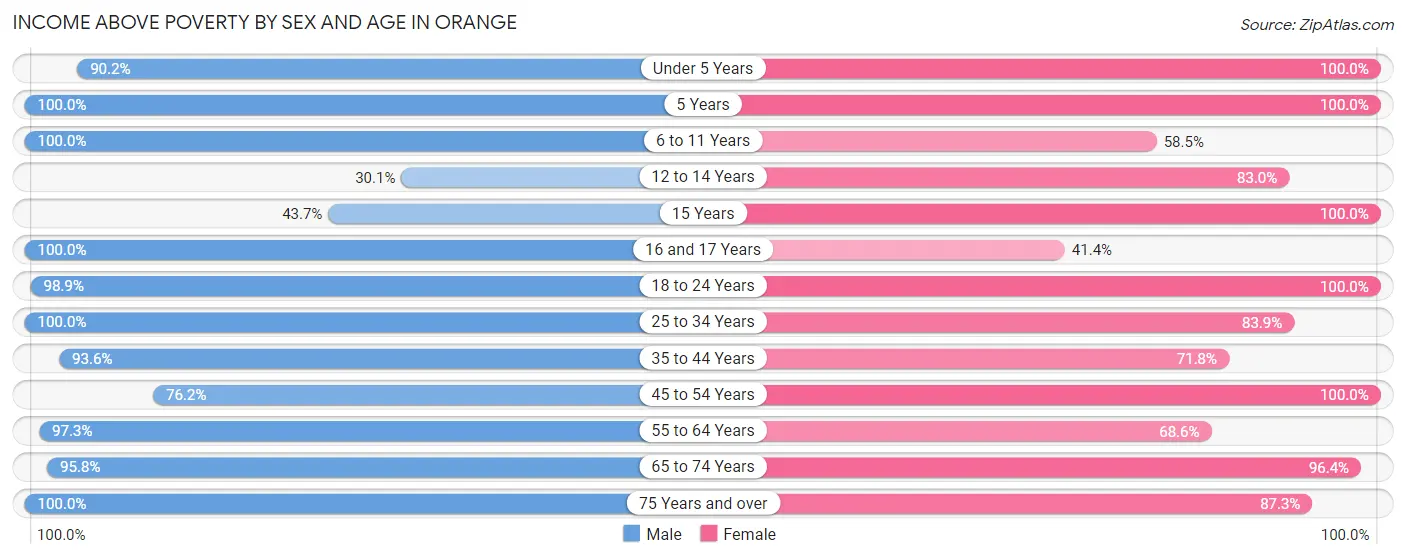
| Age Bracket | Male | Female |
| Under 5 Years | 83 (90.2%) | 59 (100.0%) |
| 5 Years | 17 (100.0%) | 20 (100.0%) |
| 6 to 11 Years | 101 (100.0%) | 38 (58.5%) |
| 12 to 14 Years | 34 (30.1%) | 88 (83.0%) |
| 15 Years | 55 (43.6%) | 14 (100.0%) |
| 16 and 17 Years | 31 (100.0%) | 41 (41.4%) |
| 18 to 24 Years | 89 (98.9%) | 48 (100.0%) |
| 25 to 34 Years | 68 (100.0%) | 47 (83.9%) |
| 35 to 44 Years | 175 (93.6%) | 199 (71.8%) |
| 45 to 54 Years | 198 (76.1%) | 149 (100.0%) |
| 55 to 64 Years | 252 (97.3%) | 227 (68.6%) |
| 65 to 74 Years | 253 (95.8%) | 265 (96.4%) |
| 75 Years and over | 128 (100.0%) | 172 (87.3%) |
| Total | 1,484 (85.5%) | 1,367 (80.6%) |
Income Below Poverty Among Married-Couple Families in Orange
The poverty statistics for married-couple families in Orange show that 8.4% or 80 of the total 957 families live below the poverty line. Families with no children have the highest poverty rate of 11.0%, comprising of 71 families. On the other hand, families with 3 or 4 children have the lowest poverty rate of 0.0%, which includes 0 families.
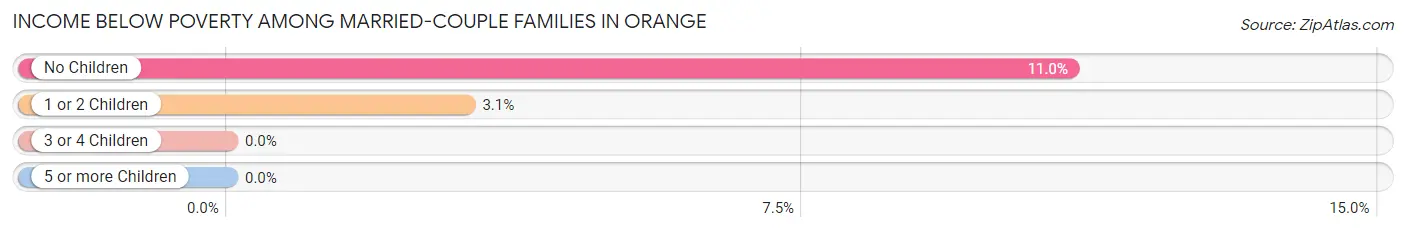
| Children | Above Poverty | Below Poverty |
| No Children | 575 (89.0%) | 71 (11.0%) |
| 1 or 2 Children | 281 (96.9%) | 9 (3.1%) |
| 3 or 4 Children | 21 (100.0%) | 0 (0.0%) |
| 5 or more Children | 0 (0.0%) | 0 (0.0%) |
| Total | 877 (91.6%) | 80 (8.4%) |
Income Below Poverty Among Single-Parent Households in Orange
According to the poverty data in Orange, 7.5% or 3 single-father households and 54.5% or 66 single-mother households are living below the poverty line. Among single-father households, those with 1 or 2 children have the highest poverty rate, with 3 households (7.5%) experiencing poverty. Likewise, among single-mother households, those with 3 or 4 children have the highest poverty rate, with 66 households (78.6%) falling below the poverty line.
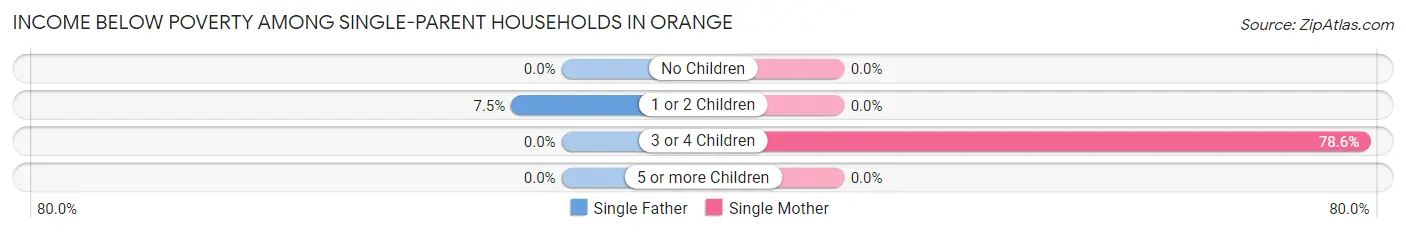
| Children | Single Father | Single Mother |
| No Children | 0 (0.0%) | 0 (0.0%) |
| 1 or 2 Children | 3 (7.5%) | 0 (0.0%) |
| 3 or 4 Children | 0 (0.0%) | 66 (78.6%) |
| 5 or more Children | 0 (0.0%) | 0 (0.0%) |
| Total | 3 (7.5%) | 66 (54.5%) |
Income Below Poverty Among Married-Couple vs Single-Parent Households in Orange
The poverty data for Orange shows that 80 of the married-couple family households (8.4%) and 69 of the single-parent households (42.9%) are living below the poverty level. Within the married-couple family households, those with no children have the highest poverty rate, with 71 households (11.0%) falling below the poverty line. Among the single-parent households, those with 3 or 4 children have the highest poverty rate, with 66 household (78.6%) living below poverty.
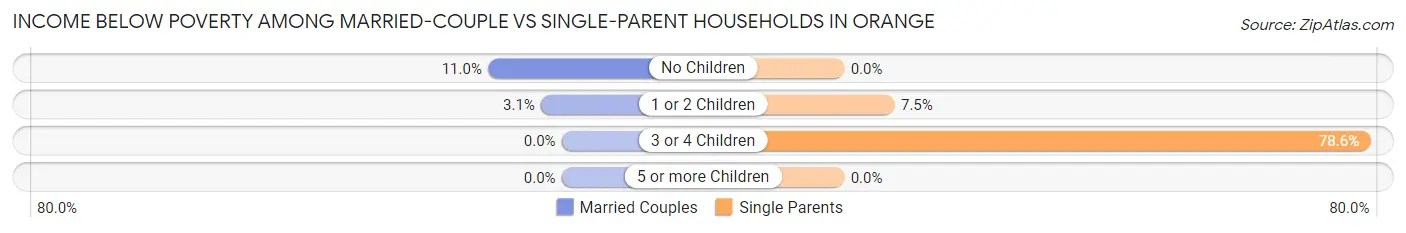
| Children | Married-Couple Families | Single-Parent Households |
| No Children | 71 (11.0%) | 0 (0.0%) |
| 1 or 2 Children | 9 (3.1%) | 3 (7.5%) |
| 3 or 4 Children | 0 (0.0%) | 66 (78.6%) |
| 5 or more Children | 0 (0.0%) | 0 (0.0%) |
| Total | 80 (8.4%) | 69 (42.9%) |
Race in Orange
The most populous races in Orange are White / Caucasian (2,351 | 68.5%), Black / African American (598 | 17.4%), and Asian (268 | 7.8%).
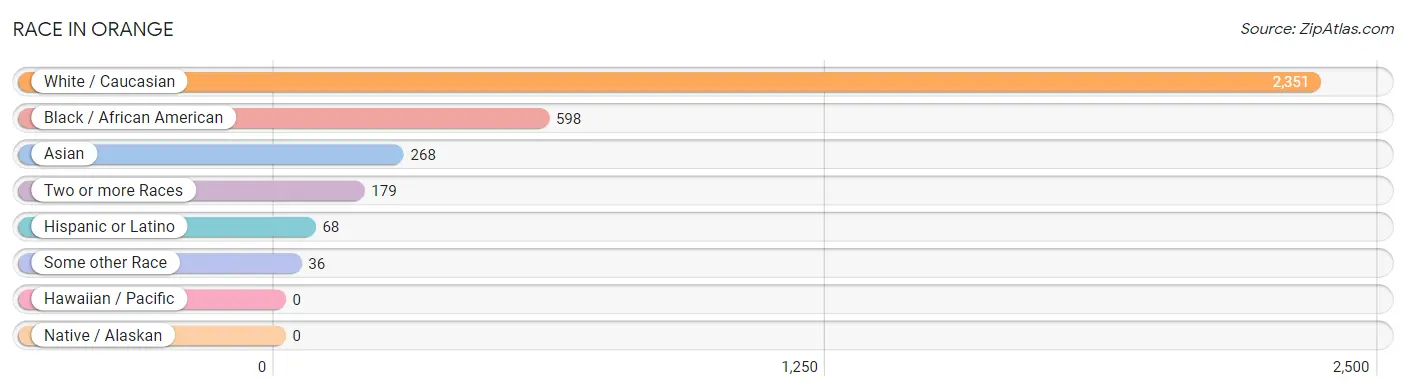
| Race | # Population | % Population |
| Asian | 268 | 7.8% |
| Black / African American | 598 | 17.4% |
| Hawaiian / Pacific | 0 | 0.0% |
| Hispanic or Latino | 68 | 2.0% |
| Native / Alaskan | 0 | 0.0% |
| White / Caucasian | 2,351 | 68.5% |
| Two or more Races | 179 | 5.2% |
| Some other Race | 36 | 1.1% |
| Total | 3,432 | 100.0% |
Ancestry in Orange
The most populous ancestries reported in Orange are Polish (418 | 12.2%), Russian (359 | 10.5%), Eastern European (207 | 6.0%), German (193 | 5.6%), and Irish (192 | 5.6%), together accounting for 39.9% of all Orange residents.
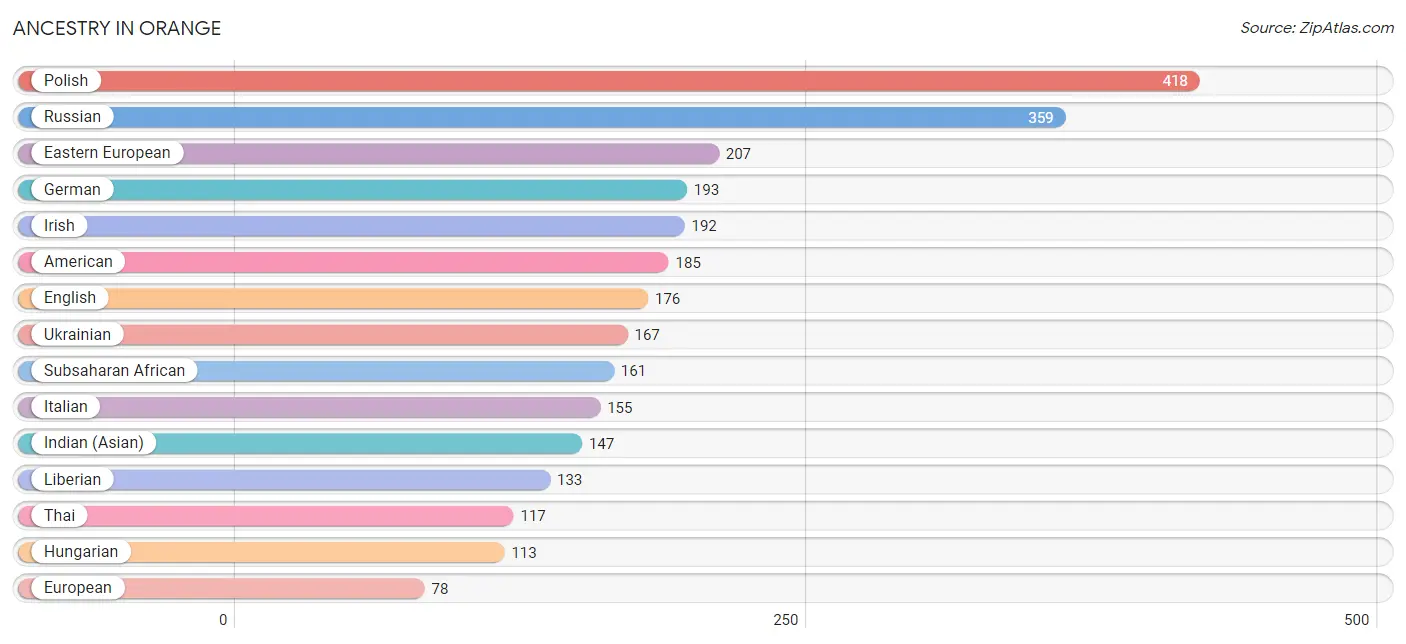
| Ancestry | # Population | % Population |
| American | 185 | 5.4% |
| Arab | 22 | 0.6% |
| Austrian | 21 | 0.6% |
| Bhutanese | 30 | 0.9% |
| Brazilian | 8 | 0.2% |
| Burmese | 17 | 0.5% |
| Cherokee | 61 | 1.8% |
| Cuban | 12 | 0.4% |
| Czech | 16 | 0.5% |
| Dominican | 36 | 1.1% |
| Eastern European | 207 | 6.0% |
| English | 176 | 5.1% |
| European | 78 | 2.3% |
| French | 29 | 0.8% |
| German | 193 | 5.6% |
| Greek | 21 | 0.6% |
| Hungarian | 113 | 3.3% |
| Indian (Asian) | 147 | 4.3% |
| Iranian | 16 | 0.5% |
| Irish | 192 | 5.6% |
| Italian | 155 | 4.5% |
| Liberian | 133 | 3.9% |
| Lithuanian | 36 | 1.1% |
| Mexican | 8 | 0.2% |
| Polish | 418 | 12.2% |
| Puerto Rican | 12 | 0.4% |
| Romanian | 39 | 1.1% |
| Russian | 359 | 10.5% |
| Scotch-Irish | 10 | 0.3% |
| Scottish | 38 | 1.1% |
| Slovak | 31 | 0.9% |
| Slovene | 8 | 0.2% |
| South African | 28 | 0.8% |
| Subsaharan African | 161 | 4.7% |
| Swedish | 18 | 0.5% |
| Syrian | 22 | 0.6% |
| Thai | 117 | 3.4% |
| Ukrainian | 167 | 4.9% |
| Welsh | 53 | 1.5% | View All 39 Rows |
Immigrants in Orange
The most numerous immigrant groups reported in Orange came from Asia (230 | 6.7%), Europe (127 | 3.7%), Eastern Europe (108 | 3.2%), Africa (100 | 2.9%), and Liberia (100 | 2.9%), together accounting for 19.4% of all Orange residents.
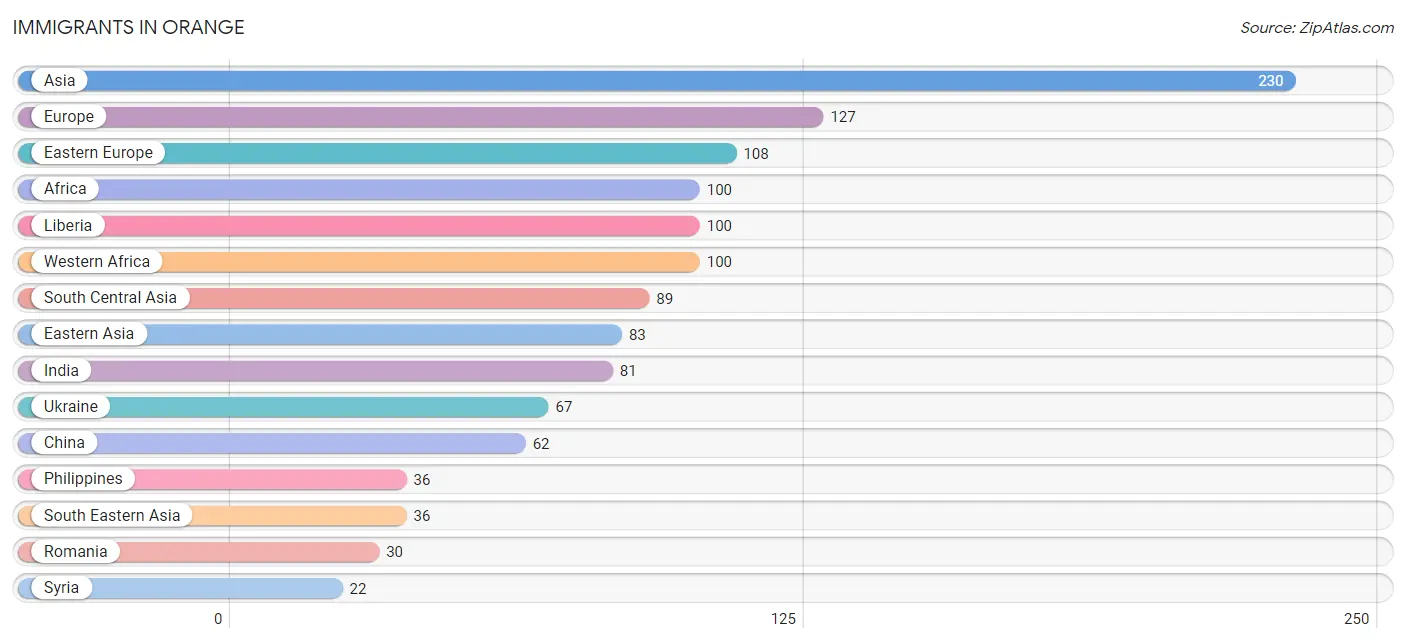
| Immigration Origin | # Population | % Population |
| Africa | 100 | 2.9% |
| Asia | 230 | 6.7% |
| Brazil | 10 | 0.3% |
| China | 62 | 1.8% |
| Eastern Asia | 83 | 2.4% |
| Eastern Europe | 108 | 3.2% |
| Europe | 127 | 3.7% |
| Germany | 9 | 0.3% |
| Greece | 10 | 0.3% |
| Hong Kong | 6 | 0.2% |
| India | 81 | 2.4% |
| Iran | 8 | 0.2% |
| Japan | 21 | 0.6% |
| Latin America | 10 | 0.3% |
| Liberia | 100 | 2.9% |
| Philippines | 36 | 1.1% |
| Romania | 30 | 0.9% |
| Russia | 11 | 0.3% |
| South America | 10 | 0.3% |
| South Central Asia | 89 | 2.6% |
| South Eastern Asia | 36 | 1.1% |
| Southern Europe | 10 | 0.3% |
| Syria | 22 | 0.6% |
| Ukraine | 67 | 1.9% |
| Western Africa | 100 | 2.9% |
| Western Asia | 22 | 0.6% |
| Western Europe | 9 | 0.3% | View All 27 Rows |
Sex and Age in Orange
Sex and Age in Orange
The most populous age groups in Orange are 45 to 49 Years (210 | 12.1%) for men and 55 to 59 Years (179 | 10.5%) for women.
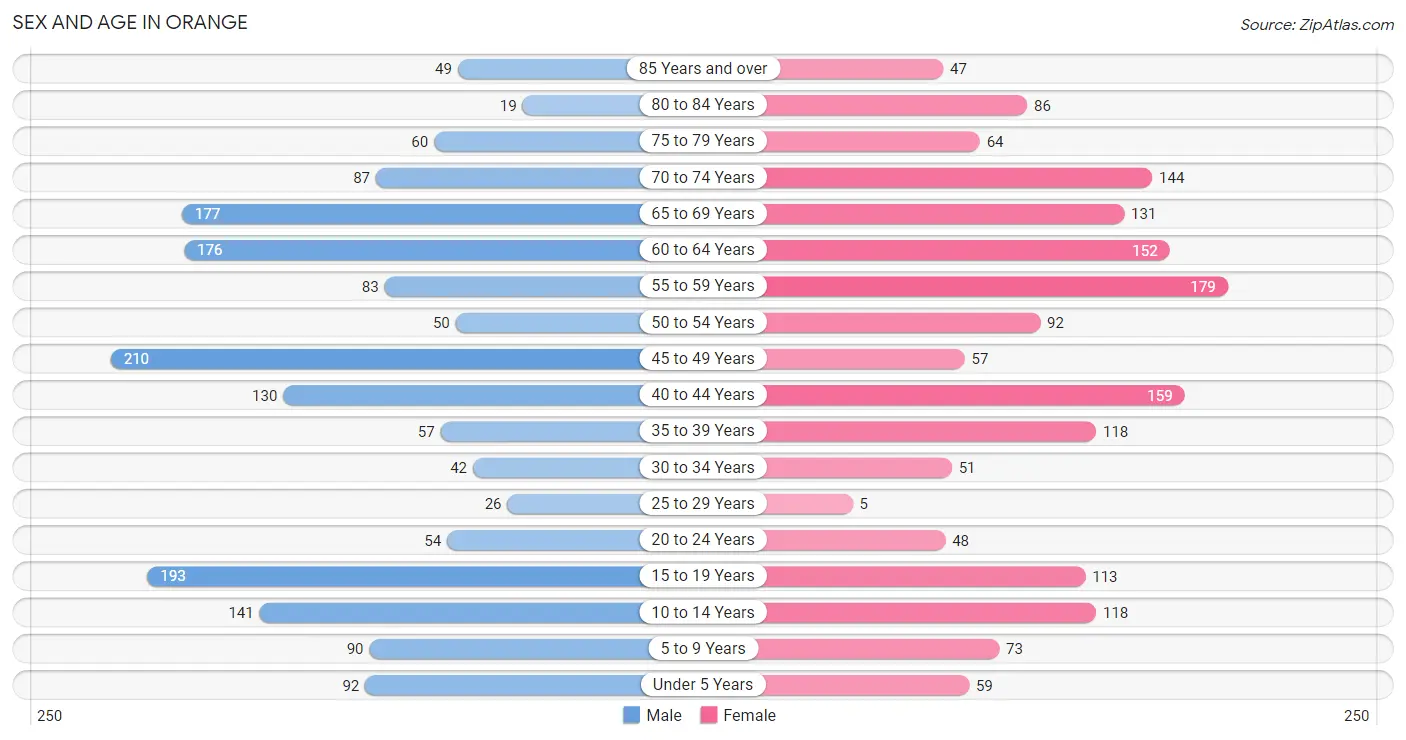
| Age Bracket | Male | Female |
| Under 5 Years | 92 (5.3%) | 59 (3.5%) |
| 5 to 9 Years | 90 (5.2%) | 73 (4.3%) |
| 10 to 14 Years | 141 (8.1%) | 118 (7.0%) |
| 15 to 19 Years | 193 (11.1%) | 113 (6.7%) |
| 20 to 24 Years | 54 (3.1%) | 48 (2.8%) |
| 25 to 29 Years | 26 (1.5%) | 5 (0.3%) |
| 30 to 34 Years | 42 (2.4%) | 51 (3.0%) |
| 35 to 39 Years | 57 (3.3%) | 118 (7.0%) |
| 40 to 44 Years | 130 (7.5%) | 159 (9.4%) |
| 45 to 49 Years | 210 (12.1%) | 57 (3.4%) |
| 50 to 54 Years | 50 (2.9%) | 92 (5.4%) |
| 55 to 59 Years | 83 (4.8%) | 179 (10.5%) |
| 60 to 64 Years | 176 (10.1%) | 152 (9.0%) |
| 65 to 69 Years | 177 (10.2%) | 131 (7.7%) |
| 70 to 74 Years | 87 (5.0%) | 144 (8.5%) |
| 75 to 79 Years | 60 (3.5%) | 64 (3.8%) |
| 80 to 84 Years | 19 (1.1%) | 86 (5.1%) |
| 85 Years and over | 49 (2.8%) | 47 (2.8%) |
| Total | 1,736 (100.0%) | 1,696 (100.0%) |
Families and Households in Orange
Median Family Size in Orange
The median family size in Orange is 2.80 persons per family, with single male/father families (40 | 3.6%) accounting for the largest median family size of 4 persons per family. On the other hand, married-couple families (957 | 85.6%) represent the smallest median family size with 2.61 persons per family.
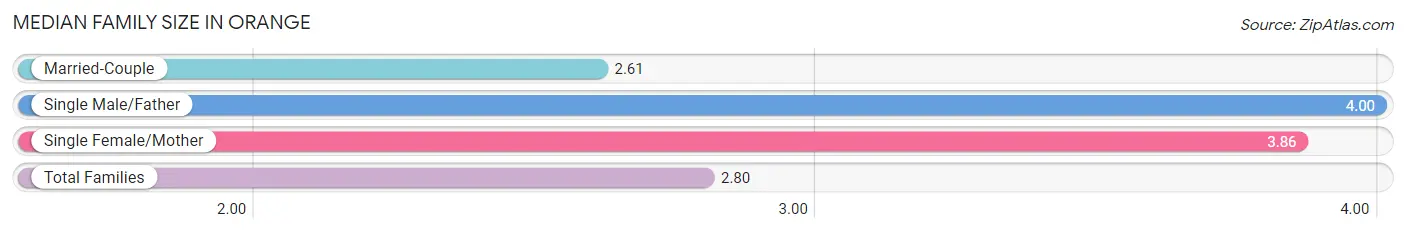
| Family Type | # Families | Family Size |
| Married-Couple | 957 (85.6%) | 2.61 |
| Single Male/Father | 40 (3.6%) | 4.00 |
| Single Female/Mother | 121 (10.8%) | 3.86 |
| Total Families | 1,118 (100.0%) | 2.80 |
Median Household Size in Orange
The median household size in Orange is 2.49 persons per household, with single male/father households (40 | 2.9%) accounting for the largest median household size of 4 persons per household. non-family households (255 | 18.6%) represent the smallest median household size with 1.11 persons per household.
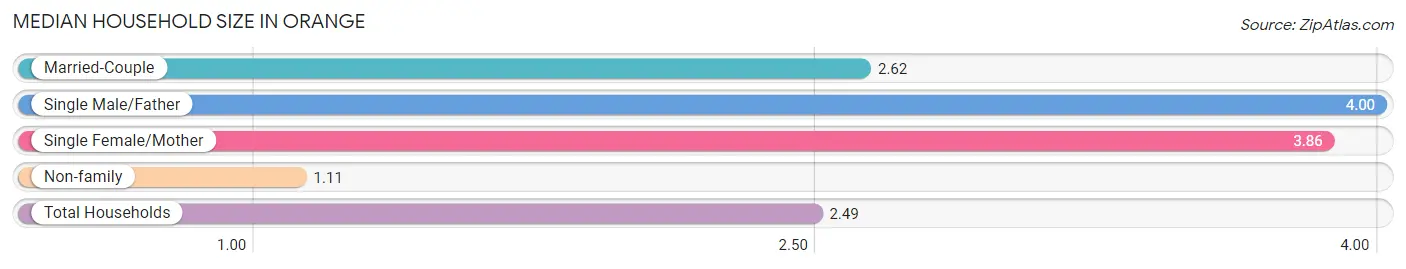
| Household Type | # Households | Household Size |
| Married-Couple | 957 (69.7%) | 2.62 |
| Single Male/Father | 40 (2.9%) | 4.00 |
| Single Female/Mother | 121 (8.8%) | 3.86 |
| Non-family | 255 (18.6%) | 1.11 |
| Total Households | 1,373 (100.0%) | 2.49 |
Household Size by Marriage Status in Orange
Out of a total of 1,373 households in Orange, 1,118 (81.4%) are family households, while 255 (18.6%) are nonfamily households. The most numerous type of family households are 2-person households, comprising 609, and the most common type of nonfamily households are 1-person households, comprising 228.
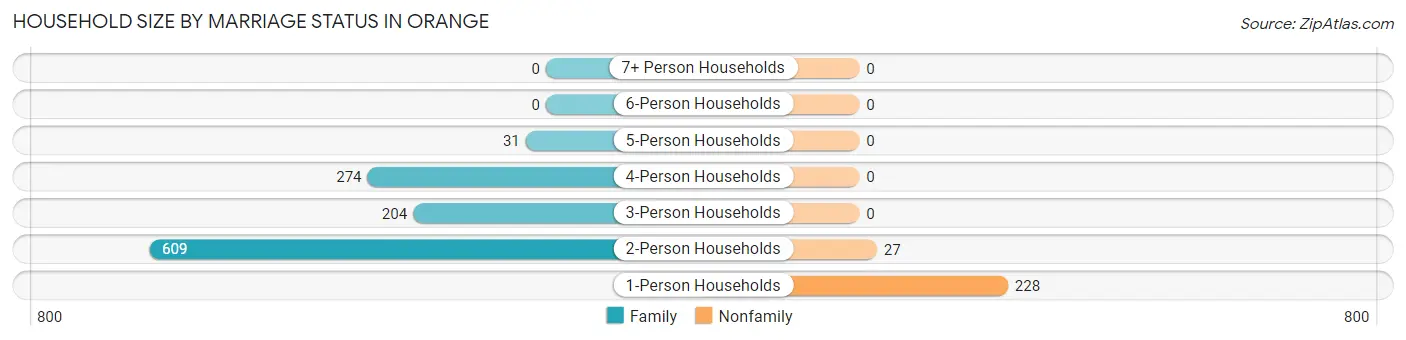
| Household Size | Family Households | Nonfamily Households |
| 1-Person Households | - | 228 (16.6%) |
| 2-Person Households | 609 (44.4%) | 27 (2.0%) |
| 3-Person Households | 204 (14.9%) | 0 (0.0%) |
| 4-Person Households | 274 (20.0%) | 0 (0.0%) |
| 5-Person Households | 31 (2.3%) | 0 (0.0%) |
| 6-Person Households | 0 (0.0%) | 0 (0.0%) |
| 7+ Person Households | 0 (0.0%) | 0 (0.0%) |
| Total | 1,118 (81.4%) | 255 (18.6%) |
Female Fertility in Orange
Fertility by Age in Orange
Average fertility rate in Orange is 51.0 births per 1,000 women. Women in the age bracket of 20 to 34 years have the highest fertility rate with 96.0 births per 1,000 women. Women in the age bracket of 35 to 50 years acount for 66.7% of all women with births.
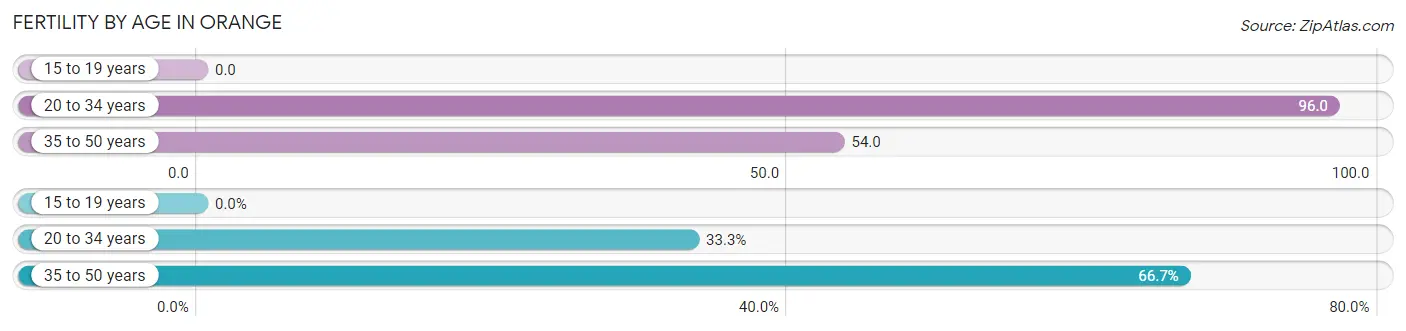
| Age Bracket | Women with Births | Births / 1,000 Women |
| 15 to 19 years | 0 (0.0%) | 0.0 |
| 20 to 34 years | 10 (33.3%) | 96.0 |
| 35 to 50 years | 20 (66.7%) | 54.0 |
| Total | 30 (100.0%) | 51.0 |
Fertility by Age by Marriage Status in Orange
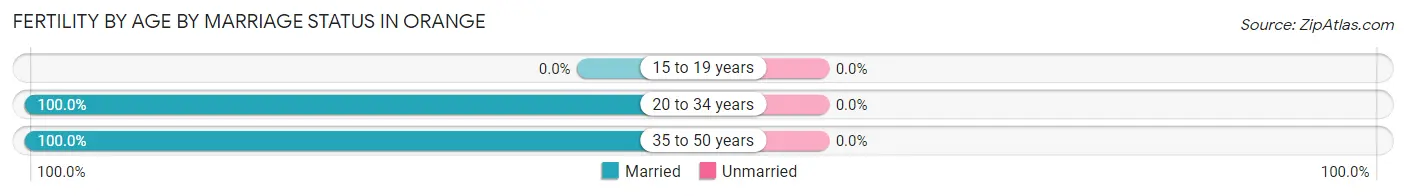
| Age Bracket | Married | Unmarried |
| 15 to 19 years | 0 (0.0%) | 0 (0.0%) |
| 20 to 34 years | 10 (100.0%) | 0 (0.0%) |
| 35 to 50 years | 20 (100.0%) | 0 (0.0%) |
| Total | 30 (100.0%) | 0 (0.0%) |
Fertility by Education in Orange
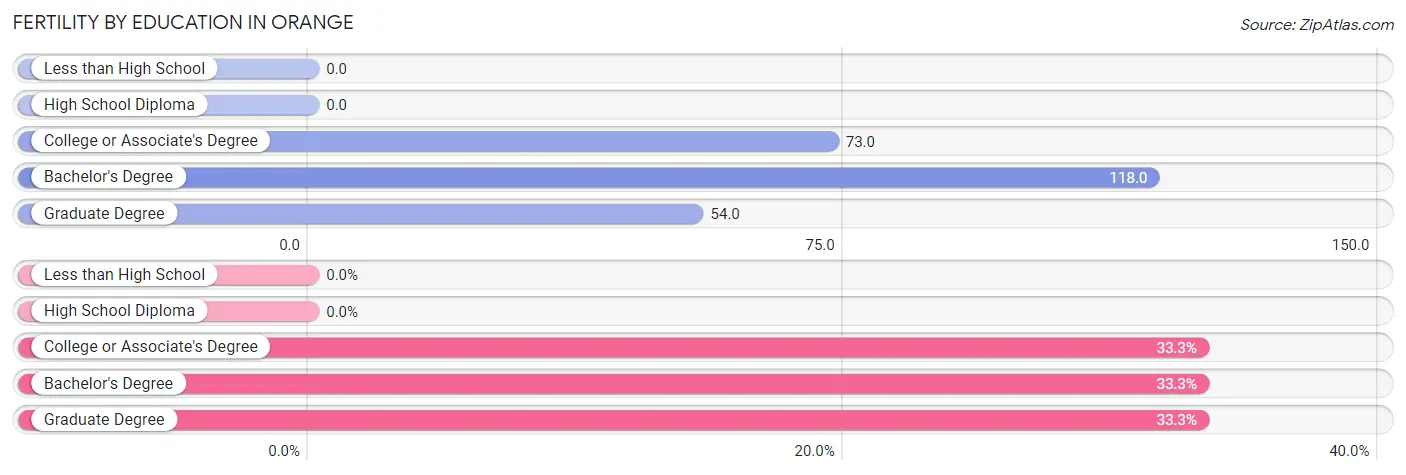
| Educational Attainment | Women with Births | Births / 1,000 Women |
| Less than High School | 0 (0.0%) | 0.0 |
| High School Diploma | 0 (0.0%) | 0.0 |
| College or Associate's Degree | 10 (33.3%) | 73.0 |
| Bachelor's Degree | 10 (33.3%) | 118.0 |
| Graduate Degree | 10 (33.3%) | 54.0 |
| Total | 30 (100.0%) | 51.0 |
Fertility by Education by Marriage Status in Orange
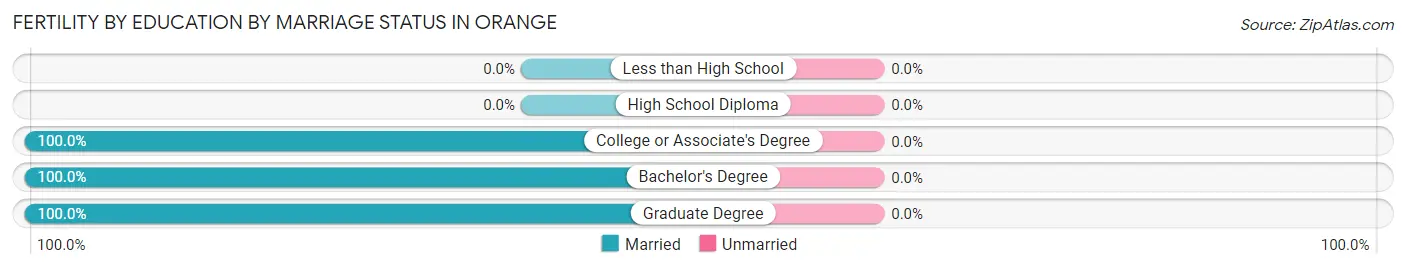
| Educational Attainment | Married | Unmarried |
| Less than High School | 0 (0.0%) | 0 (0.0%) |
| High School Diploma | 0 (0.0%) | 0 (0.0%) |
| College or Associate's Degree | 10 (100.0%) | 0 (0.0%) |
| Bachelor's Degree | 10 (100.0%) | 0 (0.0%) |
| Graduate Degree | 10 (100.0%) | 0 (0.0%) |
| Total | 30 (100.0%) | 0 (0.0%) |
Employment Characteristics in Orange
Employment by Class of Employer in Orange
Among the 1,475 employed individuals in Orange, private company employees (895 | 60.7%), not-for-profit organizations (270 | 18.3%), and self-employed (incorporated) (83 | 5.6%) make up the most common classes of employment.
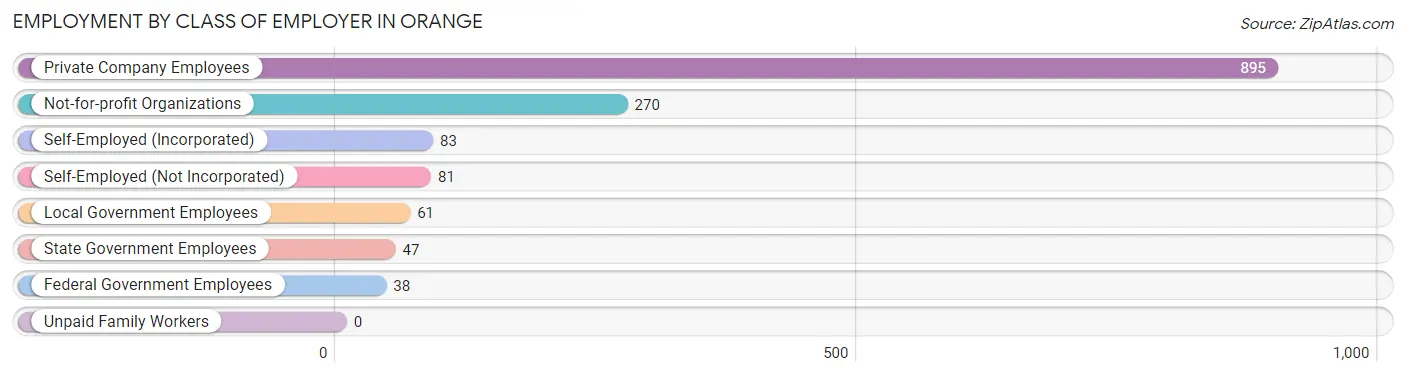
| Employer Class | # Employees | % Employees |
| Private Company Employees | 895 | 60.7% |
| Self-Employed (Incorporated) | 83 | 5.6% |
| Self-Employed (Not Incorporated) | 81 | 5.5% |
| Not-for-profit Organizations | 270 | 18.3% |
| Local Government Employees | 61 | 4.1% |
| State Government Employees | 47 | 3.2% |
| Federal Government Employees | 38 | 2.6% |
| Unpaid Family Workers | 0 | 0.0% |
| Total | 1,475 | 100.0% |
Employment Status by Age in Orange
According to the labor force statistics for Orange, out of the total population over 16 years of age (2,719), 60.9% or 1,656 individuals are in the labor force, with 9.3% or 154 of them unemployed. The age group with the highest labor force participation rate is 25 to 29 years, with 100.0% or 31 individuals in the labor force. Within the labor force, the 20 to 24 years age range has the highest percentage of unemployed individuals, with 56.2% or 50 of them being unemployed.
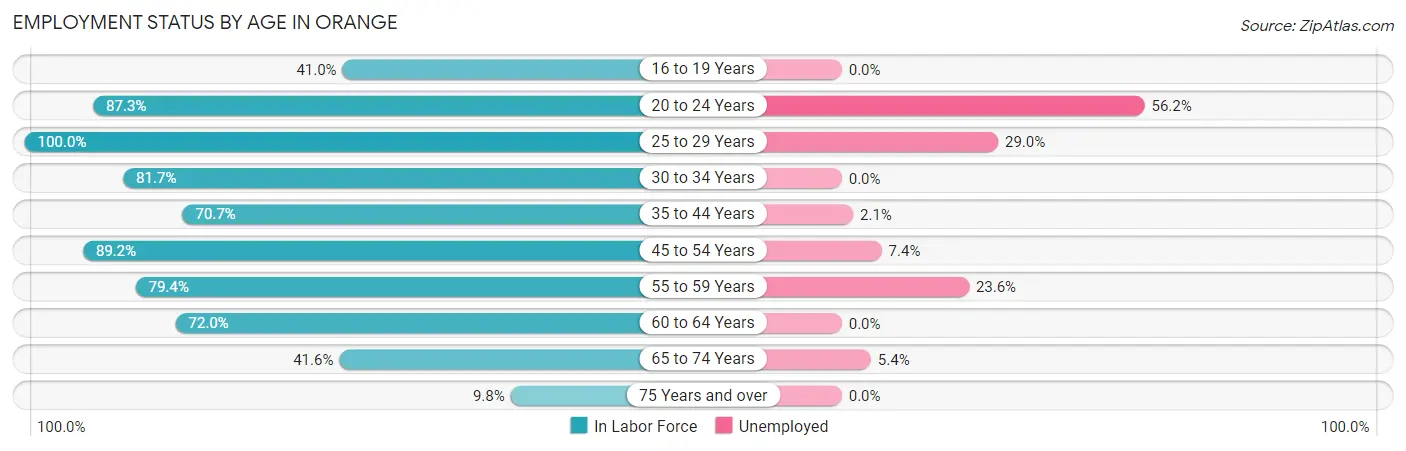
| Age Bracket | In Labor Force | Unemployed |
| 16 to 19 Years | 68 (41.0%) | 0 (0.0%) |
| 20 to 24 Years | 89 (87.3%) | 50 (56.2%) |
| 25 to 29 Years | 31 (100.0%) | 9 (29.0%) |
| 30 to 34 Years | 76 (81.7%) | 0 (0.0%) |
| 35 to 44 Years | 328 (70.7%) | 7 (2.1%) |
| 45 to 54 Years | 365 (89.2%) | 27 (7.4%) |
| 55 to 59 Years | 208 (79.4%) | 49 (23.6%) |
| 60 to 64 Years | 236 (72.0%) | 0 (0.0%) |
| 65 to 74 Years | 224 (41.6%) | 12 (5.4%) |
| 75 Years and over | 32 (9.8%) | 0 (0.0%) |
| Total | 1,656 (60.9%) | 154 (9.3%) |
Employment Status by Educational Attainment in Orange
According to labor force statistics for Orange, 78.4% of individuals (1,244) out of the total population between 25 and 64 years of age (1,587) are in the labor force, with 7.4% or 92 of them being unemployed. The group with the highest labor force participation rate are those with the educational attainment of less than high school, with 100.0% or 74 individuals in the labor force. Within the labor force, individuals with college / associate degree education have the highest percentage of unemployment, with 29.9% or 49 of them being unemployed.
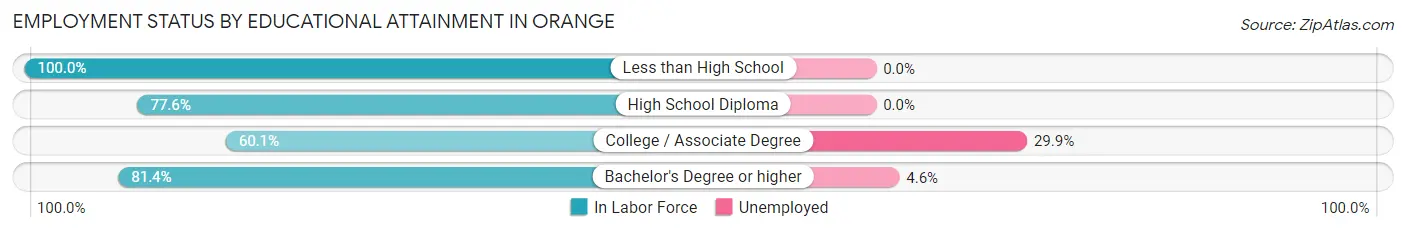
| Educational Attainment | In Labor Force | Unemployed |
| Less than High School | 74 (100.0%) | 0 (0.0%) |
| High School Diploma | 66 (77.6%) | 0 (0.0%) |
| College / Associate Degree | 164 (60.1%) | 82 (29.9%) |
| Bachelor's Degree or higher | 940 (81.4%) | 53 (4.6%) |
| Total | 1,244 (78.4%) | 117 (7.4%) |
Employment Occupations by Sex in Orange
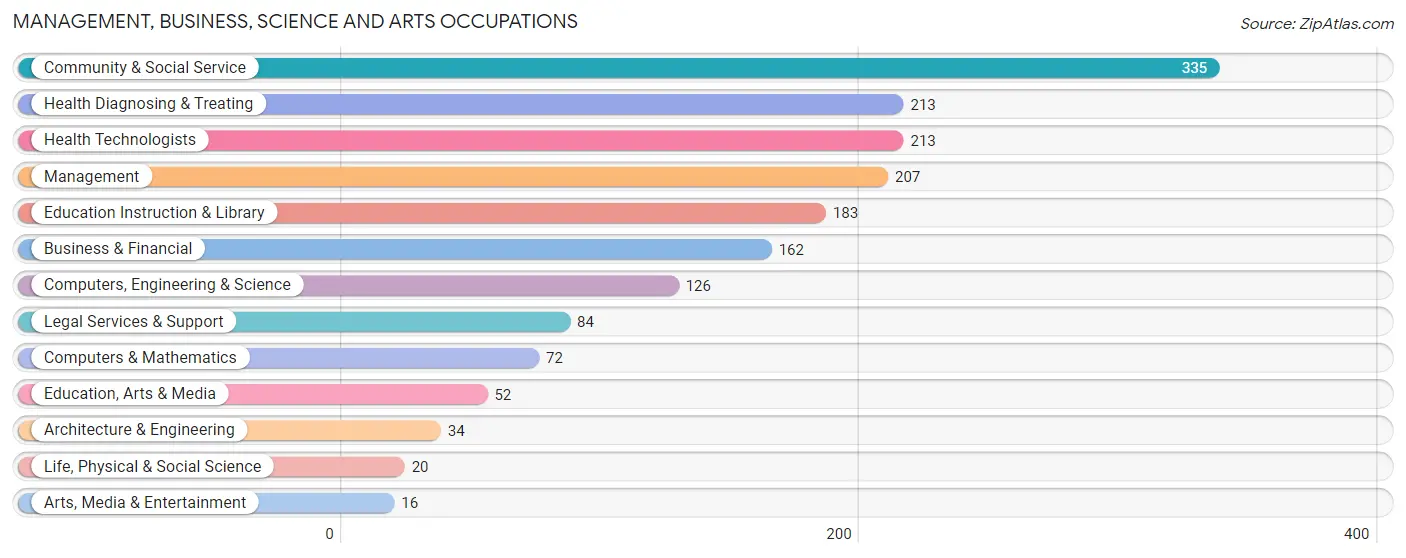
Management, Business, Science and Arts Occupations
The most common Management, Business, Science and Arts occupations in Orange are Community & Social Service (335 | 22.3%), Health Diagnosing & Treating (213 | 14.2%), Health Technologists (213 | 14.2%), Management (207 | 13.8%), and Education Instruction & Library (183 | 12.2%).
Management, Business, Science and Arts Occupations by Sex
Within the Management, Business, Science and Arts occupations in Orange, the most male-oriented occupations are Architecture & Engineering (100.0%), Life, Physical & Social Science (100.0%), and Computers, Engineering & Science (93.6%), while the most female-oriented occupations are Arts, Media & Entertainment (100.0%), Education, Arts & Media (76.9%), and Management (45.9%).
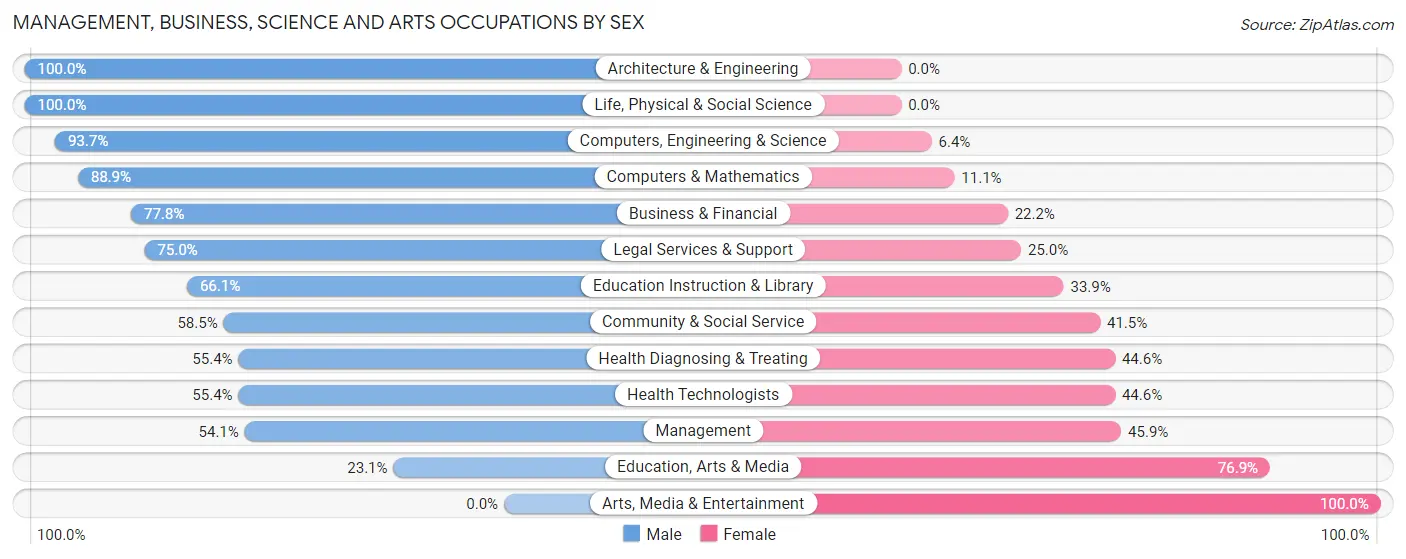
| Occupation | Male | Female |
| Management | 112 (54.1%) | 95 (45.9%) |
| Business & Financial | 126 (77.8%) | 36 (22.2%) |
| Computers, Engineering & Science | 118 (93.6%) | 8 (6.4%) |
| Computers & Mathematics | 64 (88.9%) | 8 (11.1%) |
| Architecture & Engineering | 34 (100.0%) | 0 (0.0%) |
| Life, Physical & Social Science | 20 (100.0%) | 0 (0.0%) |
| Community & Social Service | 196 (58.5%) | 139 (41.5%) |
| Education, Arts & Media | 12 (23.1%) | 40 (76.9%) |
| Legal Services & Support | 63 (75.0%) | 21 (25.0%) |
| Education Instruction & Library | 121 (66.1%) | 62 (33.9%) |
| Arts, Media & Entertainment | 0 (0.0%) | 16 (100.0%) |
| Health Diagnosing & Treating | 118 (55.4%) | 95 (44.6%) |
| Health Technologists | 118 (55.4%) | 95 (44.6%) |
| Total (Category) | 670 (64.2%) | 373 (35.8%) |
| Total (Overall) | 946 (62.9%) | 557 (37.1%) |
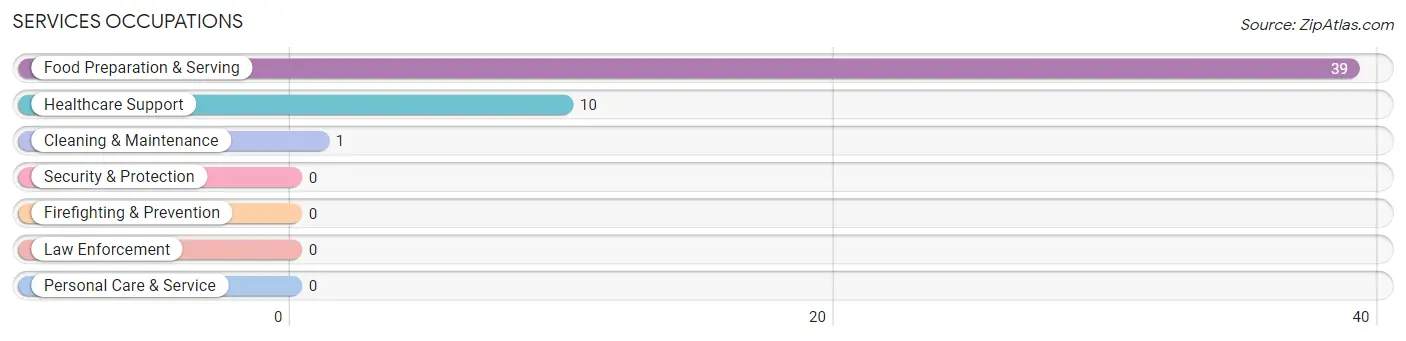
Services Occupations
The most common Services occupations in Orange are Food Preparation & Serving (39 | 2.6%), Healthcare Support (10 | 0.7%), and Cleaning & Maintenance (1 | 0.1%).
Services Occupations by Sex
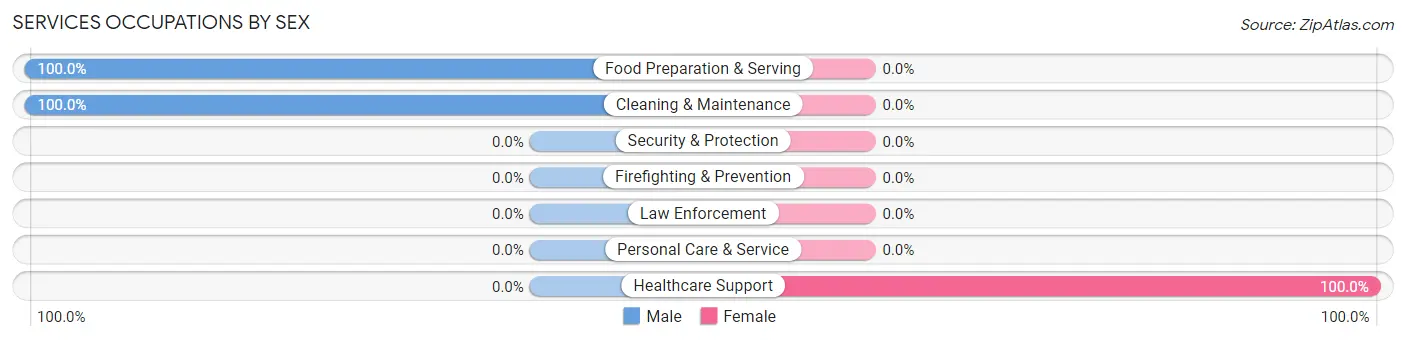
| Occupation | Male | Female |
| Healthcare Support | 0 (0.0%) | 10 (100.0%) |
| Security & Protection | 0 (0.0%) | 0 (0.0%) |
| Firefighting & Prevention | 0 (0.0%) | 0 (0.0%) |
| Law Enforcement | 0 (0.0%) | 0 (0.0%) |
| Food Preparation & Serving | 39 (100.0%) | 0 (0.0%) |
| Cleaning & Maintenance | 1 (100.0%) | 0 (0.0%) |
| Personal Care & Service | 0 (0.0%) | 0 (0.0%) |
| Total (Category) | 40 (80.0%) | 10 (20.0%) |
| Total (Overall) | 946 (62.9%) | 557 (37.1%) |
Sales and Office Occupations
The most common Sales and Office occupations in Orange are Office & Administration (129 | 8.6%), and Sales & Related (119 | 7.9%).
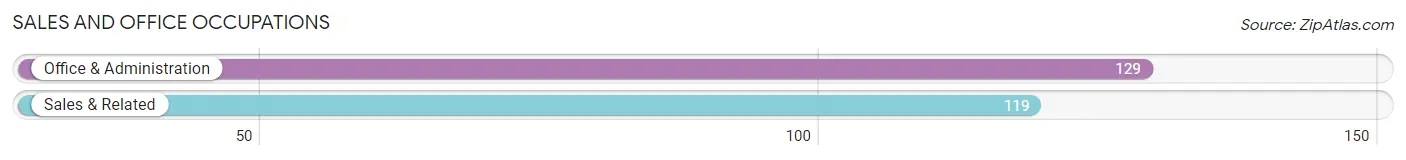
Sales and Office Occupations by Sex
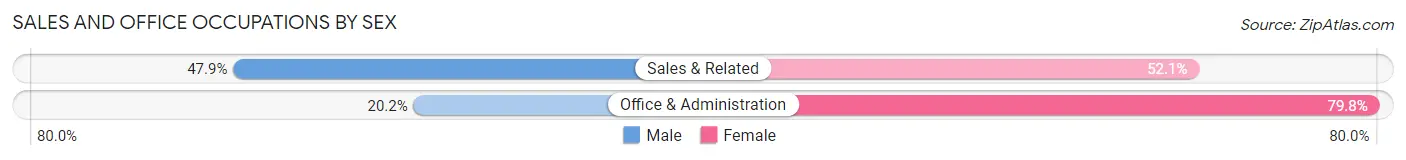
| Occupation | Male | Female |
| Sales & Related | 57 (47.9%) | 62 (52.1%) |
| Office & Administration | 26 (20.2%) | 103 (79.8%) |
| Total (Category) | 83 (33.5%) | 165 (66.5%) |
| Total (Overall) | 946 (62.9%) | 557 (37.1%) |
Natural Resources, Construction and Maintenance Occupations
The most common Natural Resources, Construction and Maintenance occupations in Orange are , and Construction & Extraction (41 | 2.7%).
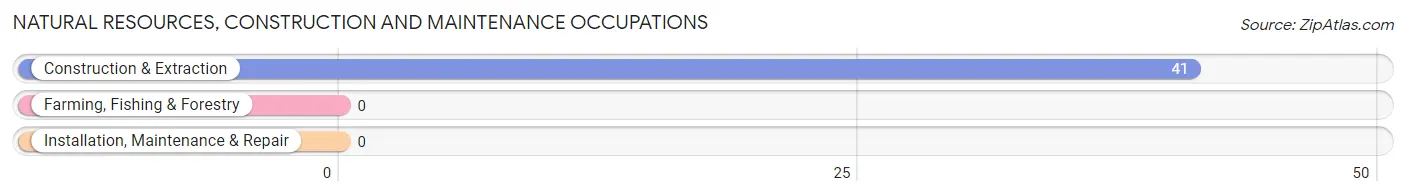
Natural Resources, Construction and Maintenance Occupations by Sex
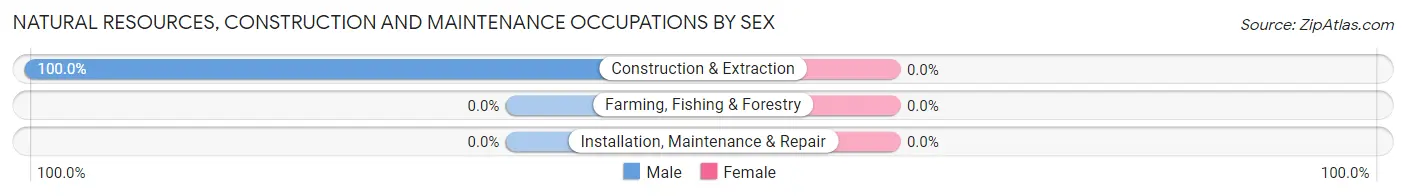
| Occupation | Male | Female |
| Farming, Fishing & Forestry | 0 (0.0%) | 0 (0.0%) |
| Construction & Extraction | 41 (100.0%) | 0 (0.0%) |
| Installation, Maintenance & Repair | 0 (0.0%) | 0 (0.0%) |
| Total (Category) | 41 (100.0%) | 0 (0.0%) |
| Total (Overall) | 946 (62.9%) | 557 (37.1%) |
Production, Transportation and Moving Occupations
The most common Production, Transportation and Moving occupations in Orange are Material Moving (83 | 5.5%), and Production (38 | 2.5%).
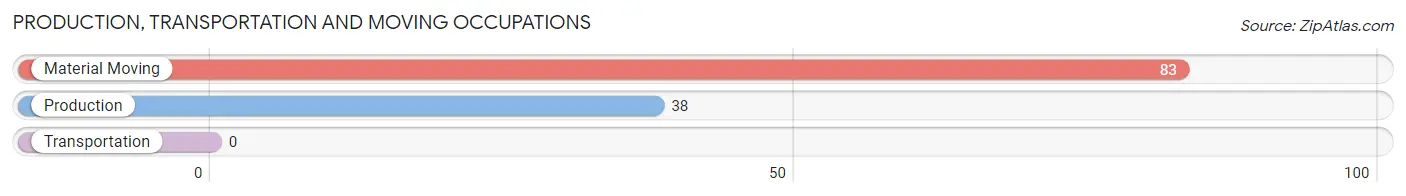
Production, Transportation and Moving Occupations by Sex
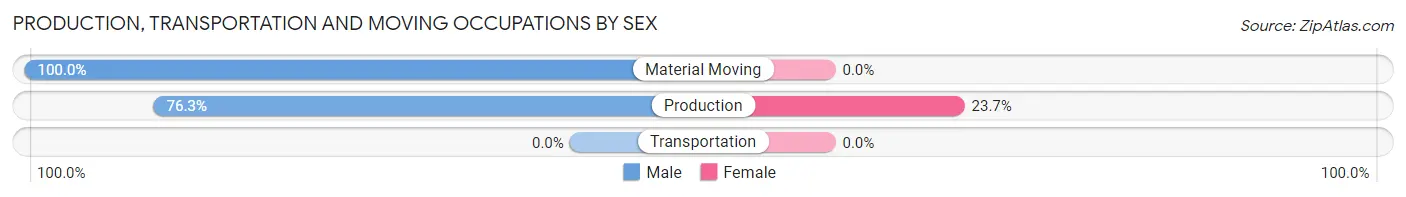
| Occupation | Male | Female |
| Production | 29 (76.3%) | 9 (23.7%) |
| Transportation | 0 (0.0%) | 0 (0.0%) |
| Material Moving | 83 (100.0%) | 0 (0.0%) |
| Total (Category) | 112 (92.6%) | 9 (7.4%) |
| Total (Overall) | 946 (62.9%) | 557 (37.1%) |
Employment Industries by Sex in Orange
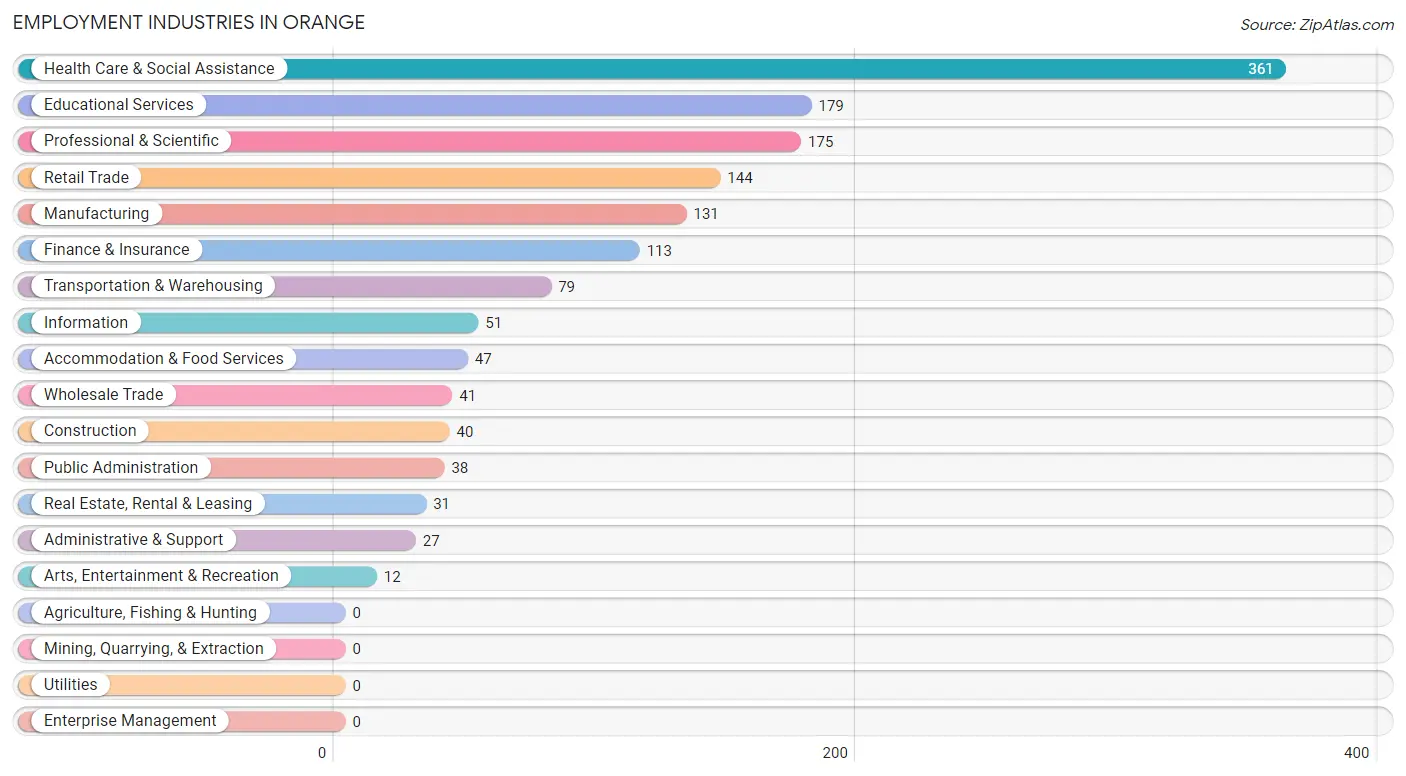
Employment Industries in Orange
The major employment industries in Orange include Health Care & Social Assistance (361 | 24.0%), Educational Services (179 | 11.9%), Professional & Scientific (175 | 11.6%), Retail Trade (144 | 9.6%), and Manufacturing (131 | 8.7%).
Employment Industries by Sex in Orange
The Orange industries that see more men than women are Construction (100.0%), Transportation & Warehousing (100.0%), and Real Estate, Rental & Leasing (100.0%), whereas the industries that tend to have a higher number of women are Information (100.0%), Health Care & Social Assistance (60.4%), and Public Administration (55.3%).
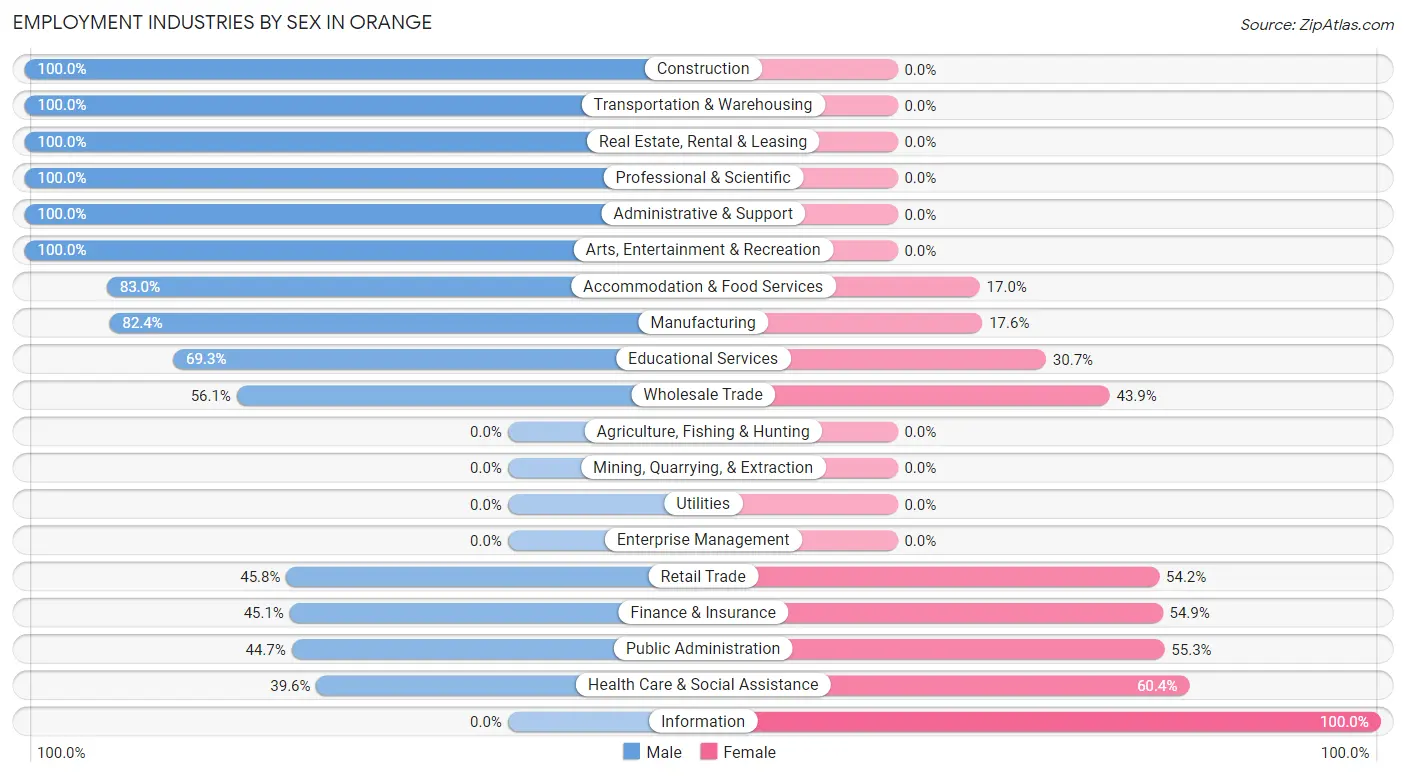
| Industry | Male | Female |
| Agriculture, Fishing & Hunting | 0 (0.0%) | 0 (0.0%) |
| Mining, Quarrying, & Extraction | 0 (0.0%) | 0 (0.0%) |
| Construction | 40 (100.0%) | 0 (0.0%) |
| Manufacturing | 108 (82.4%) | 23 (17.6%) |
| Wholesale Trade | 23 (56.1%) | 18 (43.9%) |
| Retail Trade | 66 (45.8%) | 78 (54.2%) |
| Transportation & Warehousing | 79 (100.0%) | 0 (0.0%) |
| Utilities | 0 (0.0%) | 0 (0.0%) |
| Information | 0 (0.0%) | 51 (100.0%) |
| Finance & Insurance | 51 (45.1%) | 62 (54.9%) |
| Real Estate, Rental & Leasing | 31 (100.0%) | 0 (0.0%) |
| Professional & Scientific | 175 (100.0%) | 0 (0.0%) |
| Enterprise Management | 0 (0.0%) | 0 (0.0%) |
| Administrative & Support | 27 (100.0%) | 0 (0.0%) |
| Educational Services | 124 (69.3%) | 55 (30.7%) |
| Health Care & Social Assistance | 143 (39.6%) | 218 (60.4%) |
| Arts, Entertainment & Recreation | 12 (100.0%) | 0 (0.0%) |
| Accommodation & Food Services | 39 (83.0%) | 8 (17.0%) |
| Public Administration | 17 (44.7%) | 21 (55.3%) |
| Total | 946 (62.9%) | 557 (37.1%) |
Education in Orange
School Enrollment in Orange
The most common levels of schooling among the 853 students in Orange are high school (298 | 34.9%), middle school (208 | 24.4%), and elementary school (149 | 17.5%).
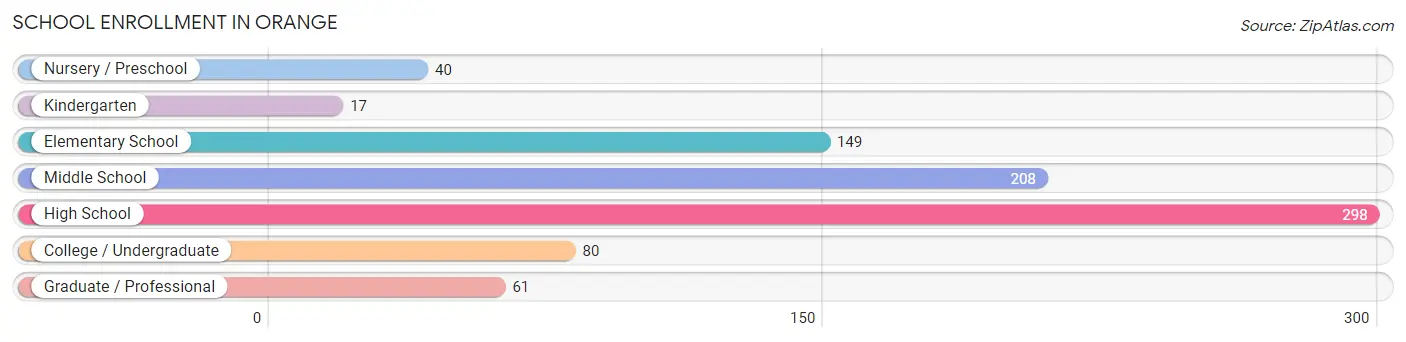
| School Level | # Students | % Students |
| Nursery / Preschool | 40 | 4.7% |
| Kindergarten | 17 | 2.0% |
| Elementary School | 149 | 17.5% |
| Middle School | 208 | 24.4% |
| High School | 298 | 34.9% |
| College / Undergraduate | 80 | 9.4% |
| Graduate / Professional | 61 | 7.1% |
| Total | 853 | 100.0% |
School Enrollment by Age by Funding Source in Orange
Out of a total of 853 students who are enrolled in schools in Orange, 175 (20.5%) attend a private institution, while the remaining 678 (79.5%) are enrolled in public schools. The age group of 20 to 24 year olds has the highest likelihood of being enrolled in private schools, with 27 (52.9% in the age bracket) enrolled. Conversely, the age group of 18 to 19 year olds has the lowest likelihood of being enrolled in a private school, with 24 (100.0% in the age bracket) attending a public institution.
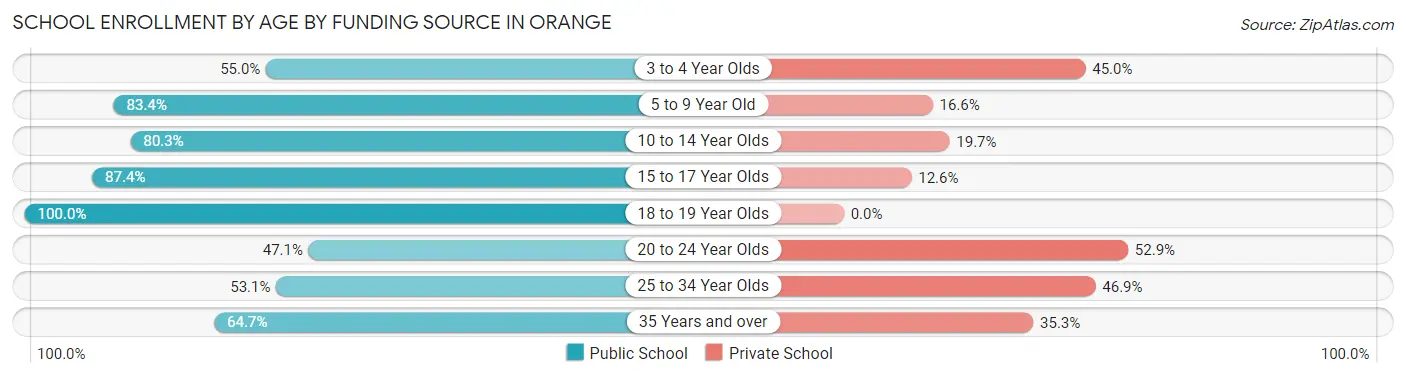
| Age Bracket | Public School | Private School |
| 3 to 4 Year Olds | 11 (55.0%) | 9 (45.0%) |
| 5 to 9 Year Old | 136 (83.4%) | 27 (16.6%) |
| 10 to 14 Year Olds | 208 (80.3%) | 51 (19.7%) |
| 15 to 17 Year Olds | 236 (87.4%) | 34 (12.6%) |
| 18 to 19 Year Olds | 24 (100.0%) | 0 (0.0%) |
| 20 to 24 Year Olds | 24 (47.1%) | 27 (52.9%) |
| 25 to 34 Year Olds | 17 (53.1%) | 15 (46.9%) |
| 35 Years and over | 22 (64.7%) | 12 (35.3%) |
| Total | 678 (79.5%) | 175 (20.5%) |
Educational Attainment by Field of Study in Orange
Business (321 | 16.7%), bio, nature & agricultural (254 | 13.2%), education (203 | 10.5%), social sciences (198 | 10.3%), and science & technology (145 | 7.5%) are the most common fields of study among 1,927 individuals in Orange who have obtained a bachelor's degree or higher.
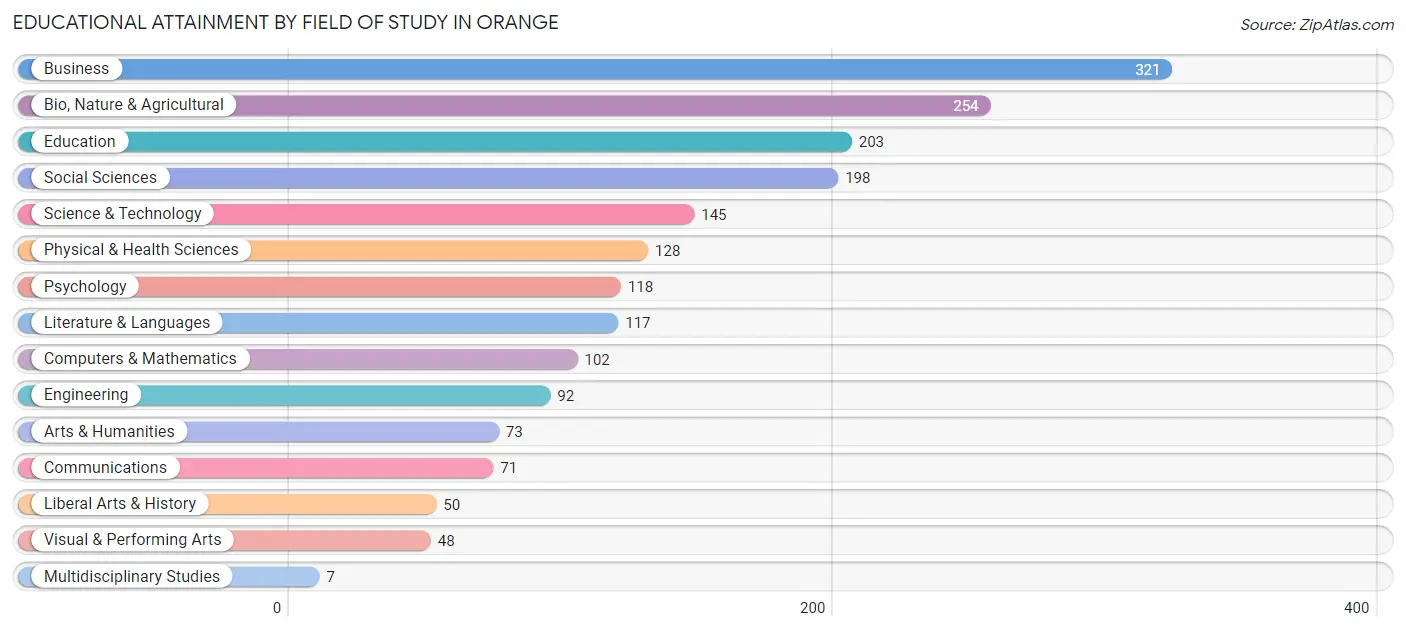
| Field of Study | # Graduates | % Graduates |
| Computers & Mathematics | 102 | 5.3% |
| Bio, Nature & Agricultural | 254 | 13.2% |
| Physical & Health Sciences | 128 | 6.6% |
| Psychology | 118 | 6.1% |
| Social Sciences | 198 | 10.3% |
| Engineering | 92 | 4.8% |
| Multidisciplinary Studies | 7 | 0.4% |
| Science & Technology | 145 | 7.5% |
| Business | 321 | 16.7% |
| Education | 203 | 10.5% |
| Literature & Languages | 117 | 6.1% |
| Liberal Arts & History | 50 | 2.6% |
| Visual & Performing Arts | 48 | 2.5% |
| Communications | 71 | 3.7% |
| Arts & Humanities | 73 | 3.8% |
| Total | 1,927 | 100.0% |
Transportation & Commute in Orange
Vehicle Availability by Sex in Orange
The most prevalent vehicle ownership categories in Orange are males with 2 vehicles (634, accounting for 67.7%) and females with 2 vehicles (332, making up 117.8%).
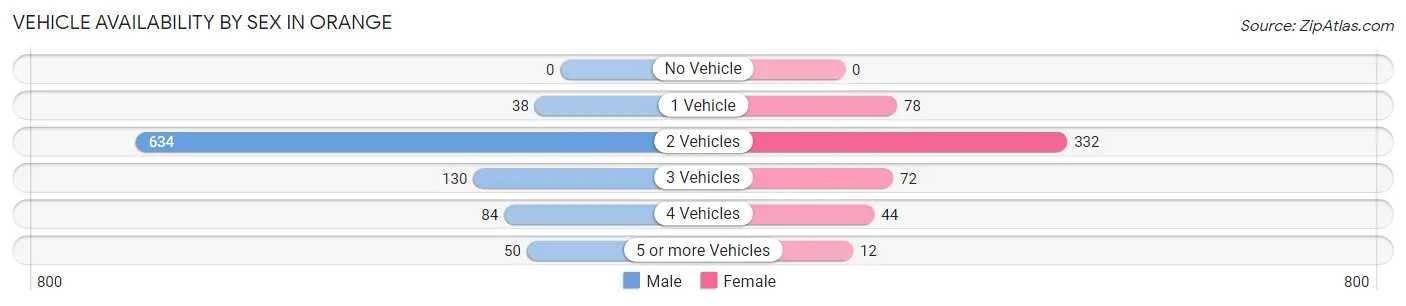
| Vehicles Available | Male | Female |
| No Vehicle | 0 (0.0%) | 0 (0.0%) |
| 1 Vehicle | 38 (4.1%) | 78 (14.5%) |
| 2 Vehicles | 634 (67.7%) | 332 (61.7%) |
| 3 Vehicles | 130 (13.9%) | 72 (13.4%) |
| 4 Vehicles | 84 (9.0%) | 44 (8.2%) |
| 5 or more Vehicles | 50 (5.3%) | 12 (2.2%) |
| Total | 936 (100.0%) | 538 (100.0%) |
Commute Time in Orange
The most frequently occuring commute durations in Orange are 10 to 14 minutes (227 commuters, 18.8%), 25 to 29 minutes (214 commuters, 17.7%), and 30 to 34 minutes (188 commuters, 15.5%).
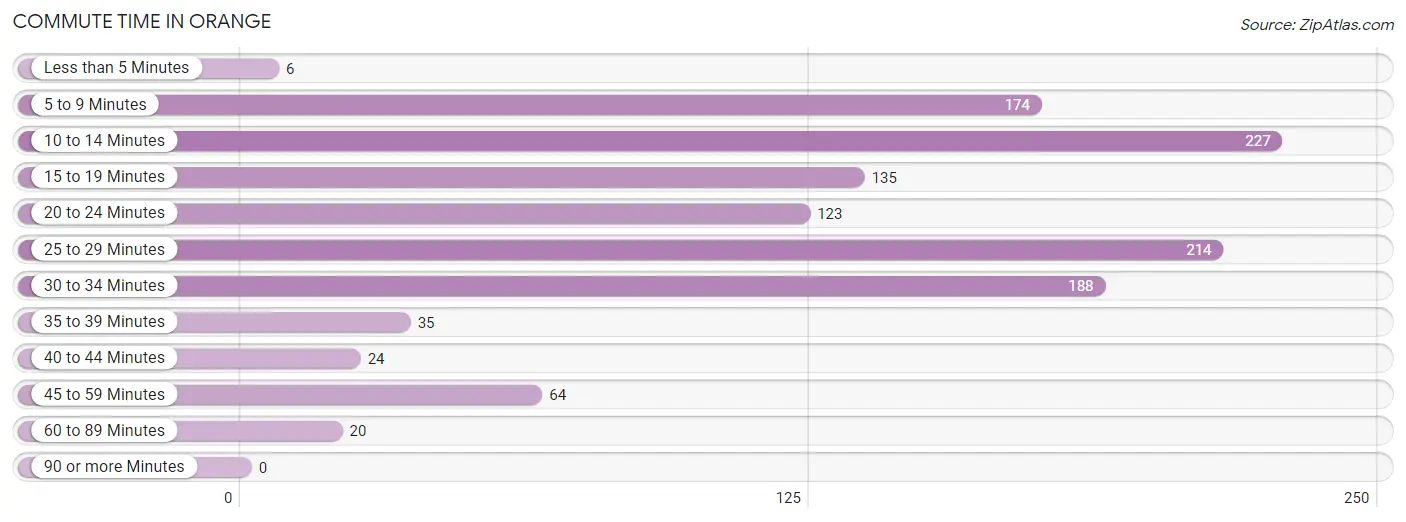
| Commute Time | # Commuters | % Commuters |
| Less than 5 Minutes | 6 | 0.5% |
| 5 to 9 Minutes | 174 | 14.4% |
| 10 to 14 Minutes | 227 | 18.8% |
| 15 to 19 Minutes | 135 | 11.2% |
| 20 to 24 Minutes | 123 | 10.2% |
| 25 to 29 Minutes | 214 | 17.7% |
| 30 to 34 Minutes | 188 | 15.5% |
| 35 to 39 Minutes | 35 | 2.9% |
| 40 to 44 Minutes | 24 | 2.0% |
| 45 to 59 Minutes | 64 | 5.3% |
| 60 to 89 Minutes | 20 | 1.7% |
| 90 or more Minutes | 0 | 0.0% |
Commute Time by Sex in Orange
The most common commute times in Orange are 25 to 29 minutes (168 commuters, 21.2%) for males and 10 to 14 minutes (134 commuters, 32.1%) for females.
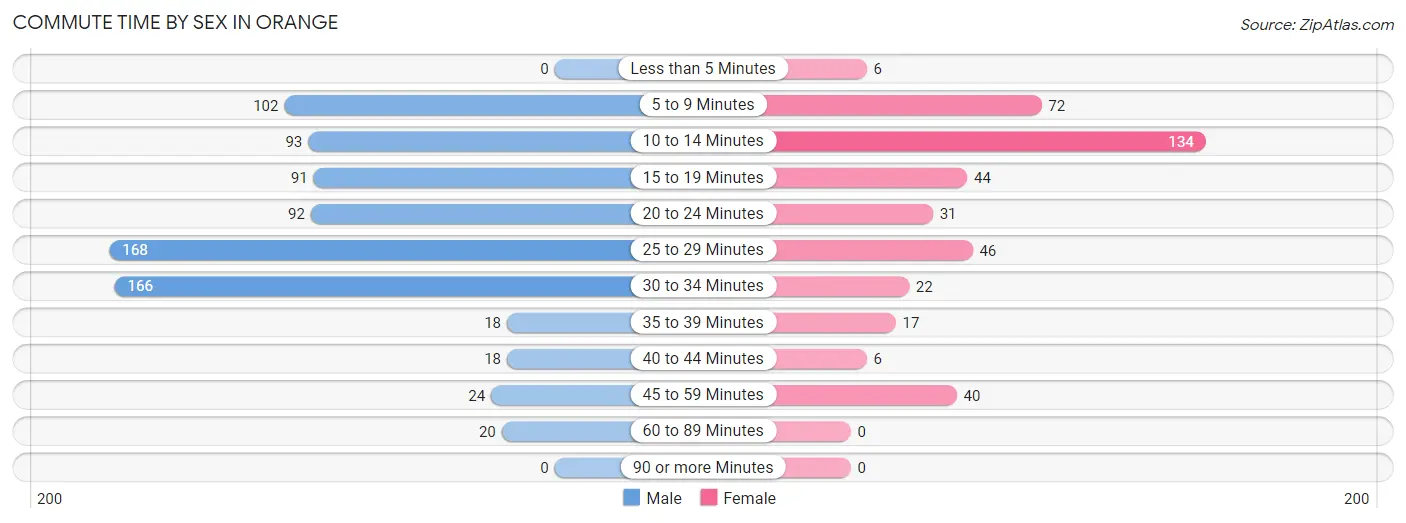
| Commute Time | Male | Female |
| Less than 5 Minutes | 0 (0.0%) | 6 (1.4%) |
| 5 to 9 Minutes | 102 (12.9%) | 72 (17.2%) |
| 10 to 14 Minutes | 93 (11.7%) | 134 (32.1%) |
| 15 to 19 Minutes | 91 (11.5%) | 44 (10.5%) |
| 20 to 24 Minutes | 92 (11.6%) | 31 (7.4%) |
| 25 to 29 Minutes | 168 (21.2%) | 46 (11.0%) |
| 30 to 34 Minutes | 166 (21.0%) | 22 (5.3%) |
| 35 to 39 Minutes | 18 (2.3%) | 17 (4.1%) |
| 40 to 44 Minutes | 18 (2.3%) | 6 (1.4%) |
| 45 to 59 Minutes | 24 (3.0%) | 40 (9.6%) |
| 60 to 89 Minutes | 20 (2.5%) | 0 (0.0%) |
| 90 or more Minutes | 0 (0.0%) | 0 (0.0%) |
Time of Departure to Work by Sex in Orange
The most frequent times of departure to work in Orange are 7:00 AM to 7:29 AM (125, 15.8%) for males and 8:30 AM to 8:59 AM (123, 29.4%) for females.
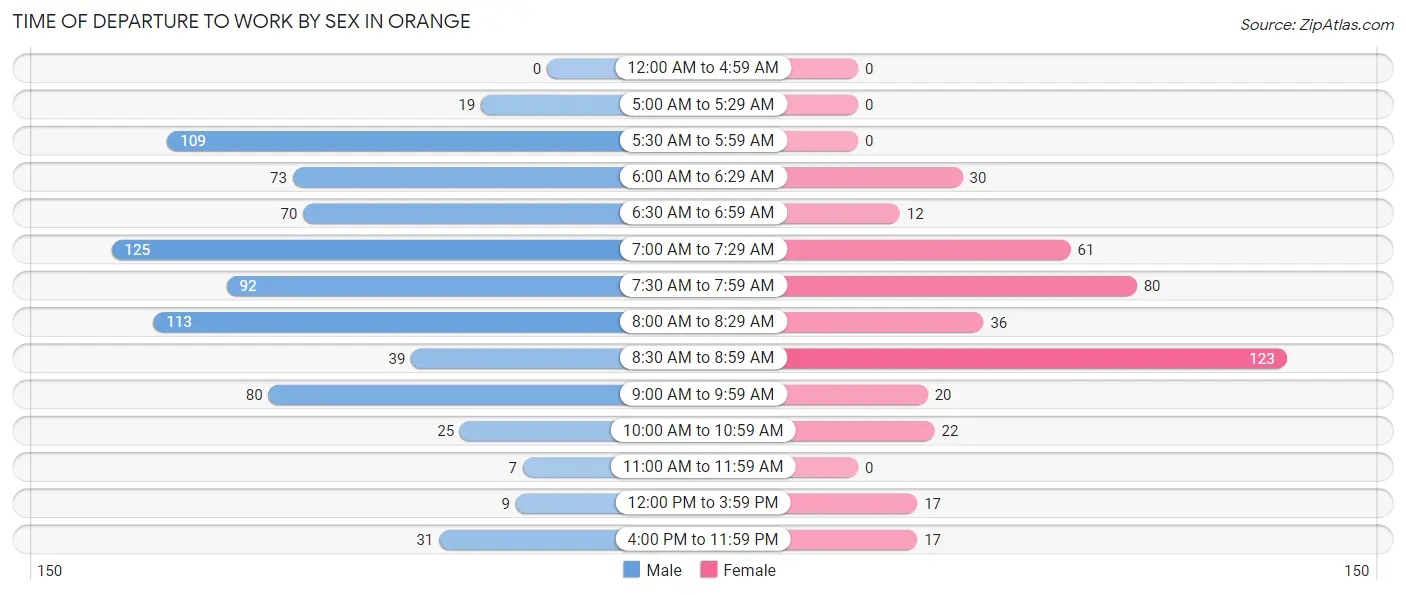
| Time of Departure | Male | Female |
| 12:00 AM to 4:59 AM | 0 (0.0%) | 0 (0.0%) |
| 5:00 AM to 5:29 AM | 19 (2.4%) | 0 (0.0%) |
| 5:30 AM to 5:59 AM | 109 (13.8%) | 0 (0.0%) |
| 6:00 AM to 6:29 AM | 73 (9.2%) | 30 (7.2%) |
| 6:30 AM to 6:59 AM | 70 (8.8%) | 12 (2.9%) |
| 7:00 AM to 7:29 AM | 125 (15.8%) | 61 (14.6%) |
| 7:30 AM to 7:59 AM | 92 (11.6%) | 80 (19.1%) |
| 8:00 AM to 8:29 AM | 113 (14.3%) | 36 (8.6%) |
| 8:30 AM to 8:59 AM | 39 (4.9%) | 123 (29.4%) |
| 9:00 AM to 9:59 AM | 80 (10.1%) | 20 (4.8%) |
| 10:00 AM to 10:59 AM | 25 (3.2%) | 22 (5.3%) |
| 11:00 AM to 11:59 AM | 7 (0.9%) | 0 (0.0%) |
| 12:00 PM to 3:59 PM | 9 (1.1%) | 17 (4.1%) |
| 4:00 PM to 11:59 PM | 31 (3.9%) | 17 (4.1%) |
| Total | 792 (100.0%) | 418 (100.0%) |
Housing Occupancy in Orange
Occupancy by Ownership in Orange
Of the total 1,373 dwellings in Orange, owner-occupied units account for 1,243 (90.5%), while renter-occupied units make up 130 (9.5%).
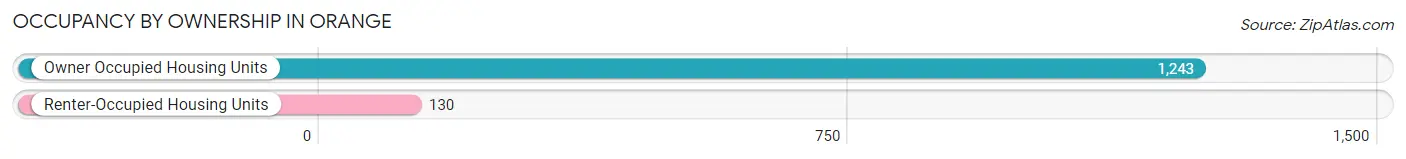
| Occupancy | # Housing Units | % Housing Units |
| Owner Occupied Housing Units | 1,243 | 90.5% |
| Renter-Occupied Housing Units | 130 | 9.5% |
| Total Occupied Housing Units | 1,373 | 100.0% |
Occupancy by Household Size in Orange
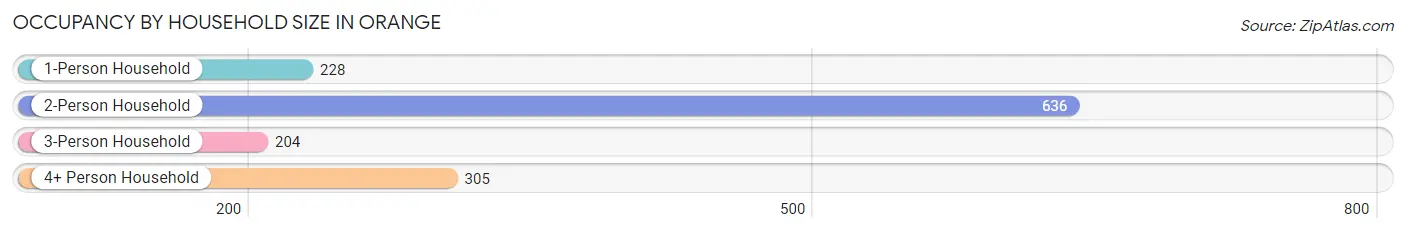
| Household Size | # Housing Units | % Housing Units |
| 1-Person Household | 228 | 16.6% |
| 2-Person Household | 636 | 46.3% |
| 3-Person Household | 204 | 14.9% |
| 4+ Person Household | 305 | 22.2% |
| Total Housing Units | 1,373 | 100.0% |
Occupancy by Ownership by Household Size in Orange
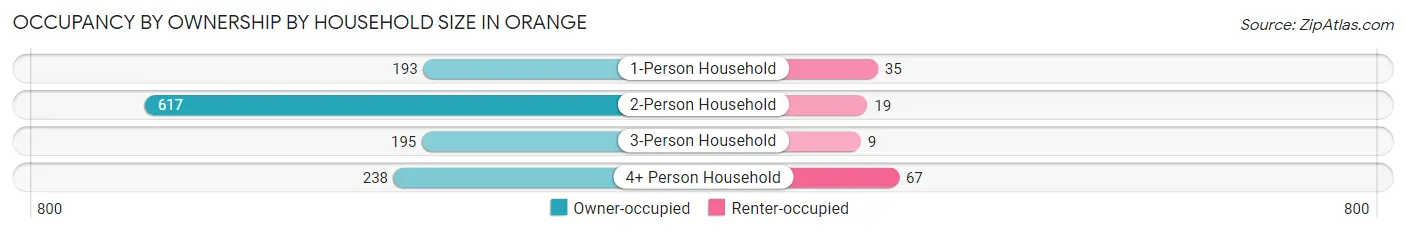
| Household Size | Owner-occupied | Renter-occupied |
| 1-Person Household | 193 (84.7%) | 35 (15.3%) |
| 2-Person Household | 617 (97.0%) | 19 (3.0%) |
| 3-Person Household | 195 (95.6%) | 9 (4.4%) |
| 4+ Person Household | 238 (78.0%) | 67 (22.0%) |
| Total Housing Units | 1,243 (90.5%) | 130 (9.5%) |
Occupancy by Educational Attainment in Orange
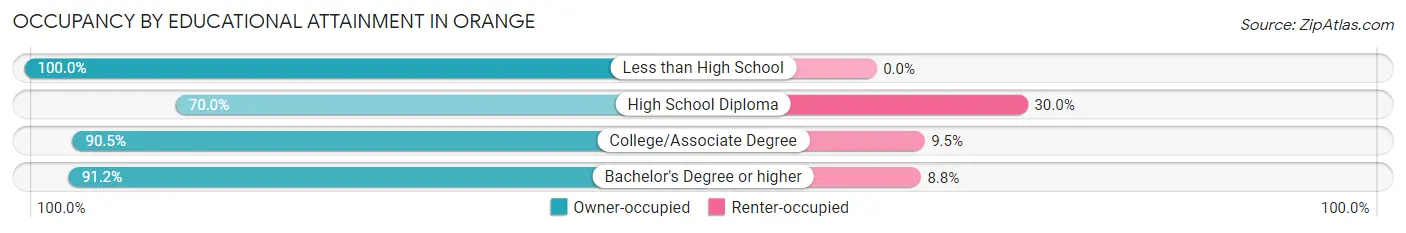
| Household Size | Owner-occupied | Renter-occupied |
| Less than High School | 38 (100.0%) | 0 (0.0%) |
| High School Diploma | 35 (70.0%) | 15 (30.0%) |
| College/Associate Degree | 266 (90.5%) | 28 (9.5%) |
| Bachelor's Degree or higher | 904 (91.2%) | 87 (8.8%) |
Occupancy by Age of Householder in Orange
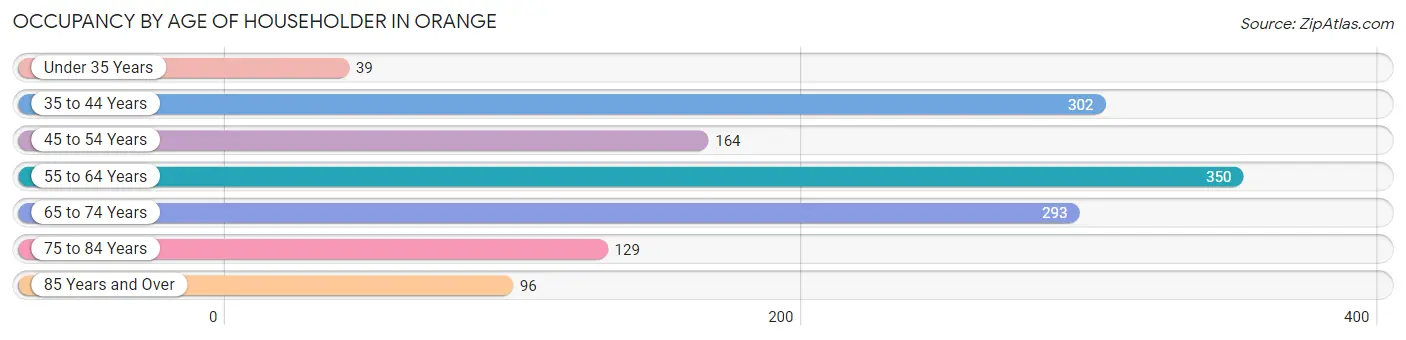
| Age Bracket | # Households | % Households |
| Under 35 Years | 39 | 2.8% |
| 35 to 44 Years | 302 | 22.0% |
| 45 to 54 Years | 164 | 11.9% |
| 55 to 64 Years | 350 | 25.5% |
| 65 to 74 Years | 293 | 21.3% |
| 75 to 84 Years | 129 | 9.4% |
| 85 Years and Over | 96 | 7.0% |
| Total | 1,373 | 100.0% |
Housing Finances in Orange
Median Income by Occupancy in Orange
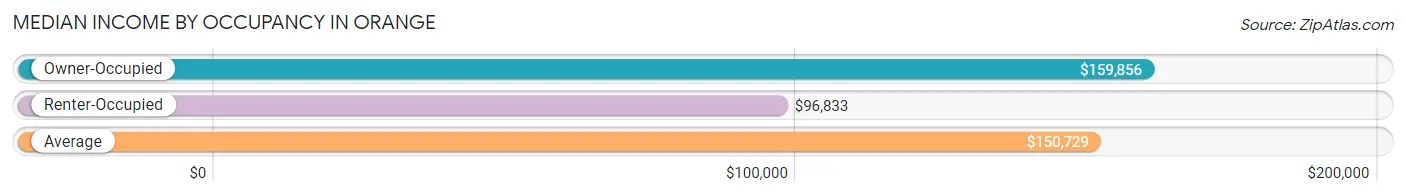
| Occupancy Type | # Households | Median Income |
| Owner-Occupied | 1,243 (90.5%) | $159,856 |
| Renter-Occupied | 130 (9.5%) | $96,833 |
| Average | 1,373 (100.0%) | $150,729 |
Occupancy by Householder Income Bracket in Orange
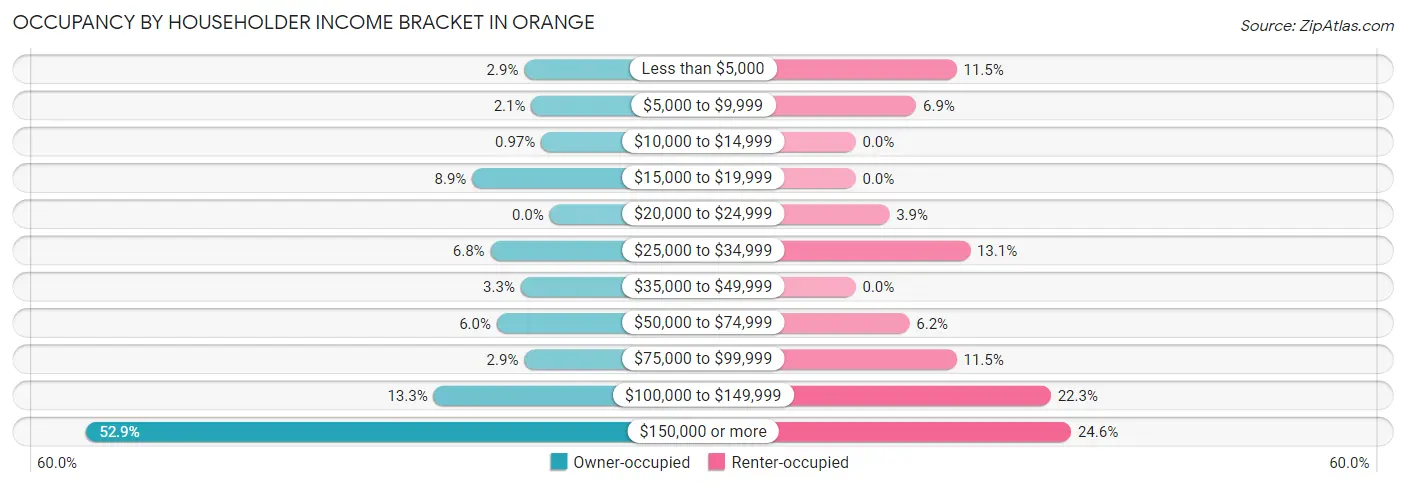
| Income Bracket | Owner-occupied | Renter-occupied |
| Less than $5,000 | 36 (2.9%) | 15 (11.5%) |
| $5,000 to $9,999 | 26 (2.1%) | 9 (6.9%) |
| $10,000 to $14,999 | 12 (1.0%) | 0 (0.0%) |
| $15,000 to $19,999 | 110 (8.8%) | 0 (0.0%) |
| $20,000 to $24,999 | 0 (0.0%) | 5 (3.8%) |
| $25,000 to $34,999 | 84 (6.8%) | 17 (13.1%) |
| $35,000 to $49,999 | 41 (3.3%) | 0 (0.0%) |
| $50,000 to $74,999 | 75 (6.0%) | 8 (6.1%) |
| $75,000 to $99,999 | 36 (2.9%) | 15 (11.5%) |
| $100,000 to $149,999 | 165 (13.3%) | 29 (22.3%) |
| $150,000 or more | 658 (52.9%) | 32 (24.6%) |
| Total | 1,243 (100.0%) | 130 (100.0%) |
Monthly Housing Cost Tiers in Orange
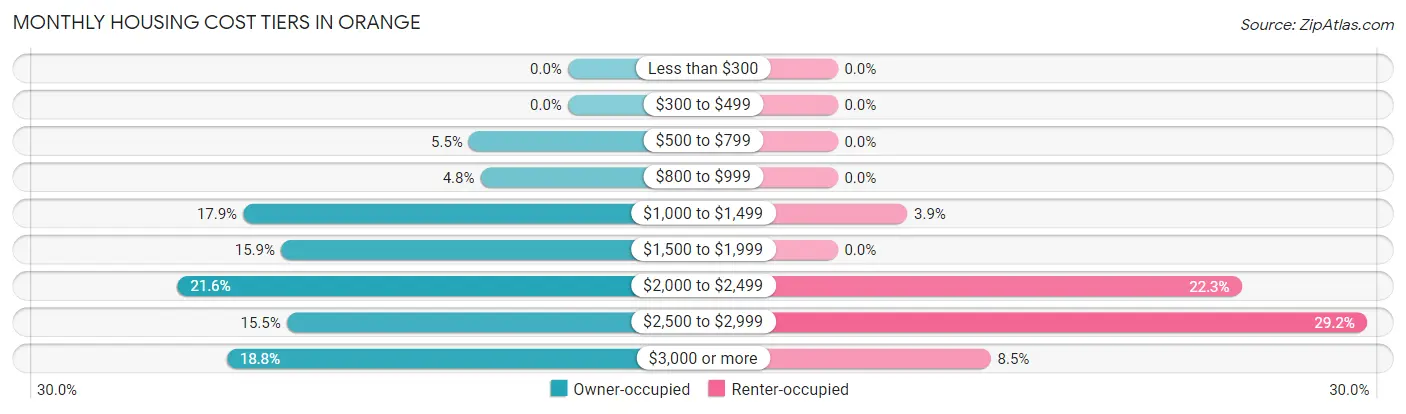
| Monthly Cost | Owner-occupied | Renter-occupied |
| Less than $300 | 0 (0.0%) | 0 (0.0%) |
| $300 to $499 | 0 (0.0%) | 0 (0.0%) |
| $500 to $799 | 68 (5.5%) | 0 (0.0%) |
| $800 to $999 | 60 (4.8%) | 0 (0.0%) |
| $1,000 to $1,499 | 223 (17.9%) | 5 (3.8%) |
| $1,500 to $1,999 | 197 (15.9%) | 0 (0.0%) |
| $2,000 to $2,499 | 268 (21.6%) | 29 (22.3%) |
| $2,500 to $2,999 | 193 (15.5%) | 38 (29.2%) |
| $3,000 or more | 234 (18.8%) | 11 (8.5%) |
| Total | 1,243 (100.0%) | 130 (100.0%) |
Physical Housing Characteristics in Orange
Housing Structures in Orange
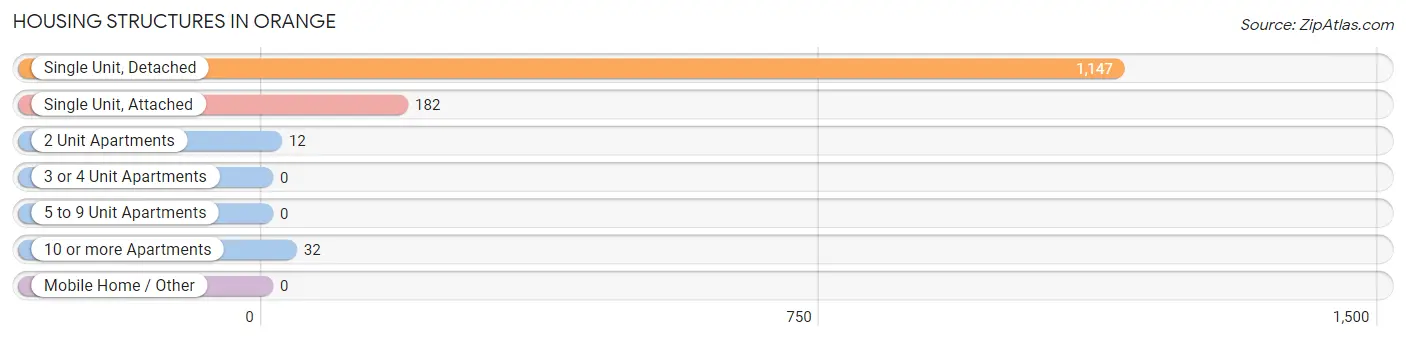
| Structure Type | # Housing Units | % Housing Units |
| Single Unit, Detached | 1,147 | 83.5% |
| Single Unit, Attached | 182 | 13.3% |
| 2 Unit Apartments | 12 | 0.9% |
| 3 or 4 Unit Apartments | 0 | 0.0% |
| 5 to 9 Unit Apartments | 0 | 0.0% |
| 10 or more Apartments | 32 | 2.3% |
| Mobile Home / Other | 0 | 0.0% |
| Total | 1,373 | 100.0% |
Housing Structures by Occupancy in Orange
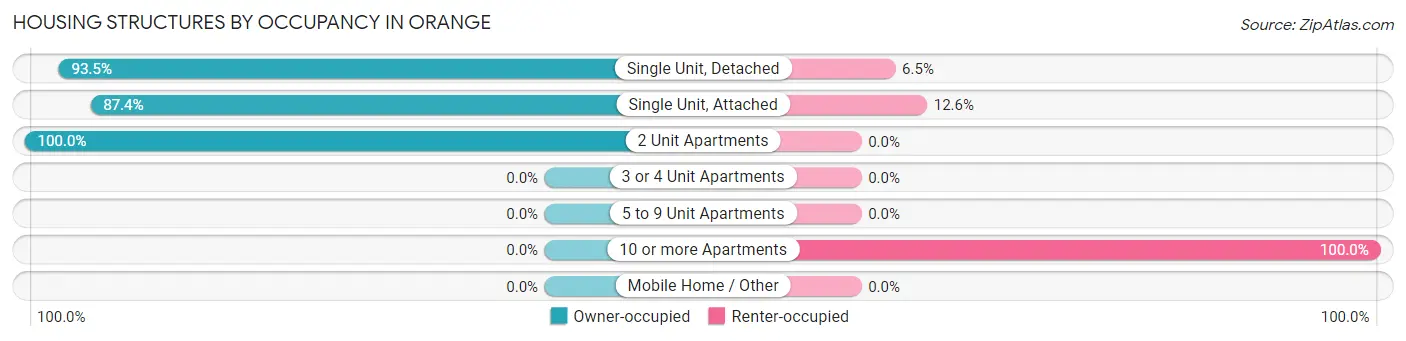
| Structure Type | Owner-occupied | Renter-occupied |
| Single Unit, Detached | 1,072 (93.5%) | 75 (6.5%) |
| Single Unit, Attached | 159 (87.4%) | 23 (12.6%) |
| 2 Unit Apartments | 12 (100.0%) | 0 (0.0%) |
| 3 or 4 Unit Apartments | 0 (0.0%) | 0 (0.0%) |
| 5 to 9 Unit Apartments | 0 (0.0%) | 0 (0.0%) |
| 10 or more Apartments | 0 (0.0%) | 32 (100.0%) |
| Mobile Home / Other | 0 (0.0%) | 0 (0.0%) |
| Total | 1,243 (90.5%) | 130 (9.5%) |
Housing Structures by Number of Rooms in Orange
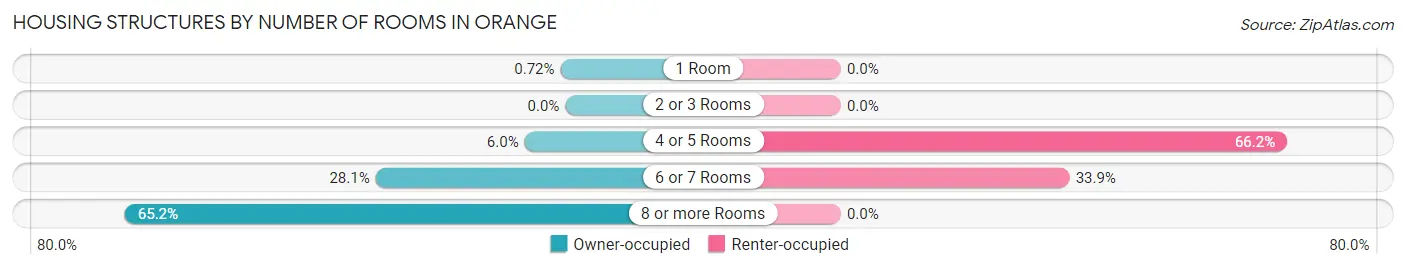
| Number of Rooms | Owner-occupied | Renter-occupied |
| 1 Room | 9 (0.7%) | 0 (0.0%) |
| 2 or 3 Rooms | 0 (0.0%) | 0 (0.0%) |
| 4 or 5 Rooms | 75 (6.0%) | 86 (66.1%) |
| 6 or 7 Rooms | 349 (28.1%) | 44 (33.9%) |
| 8 or more Rooms | 810 (65.2%) | 0 (0.0%) |
| Total | 1,243 (100.0%) | 130 (100.0%) |
Housing Structure by Heating Type in Orange
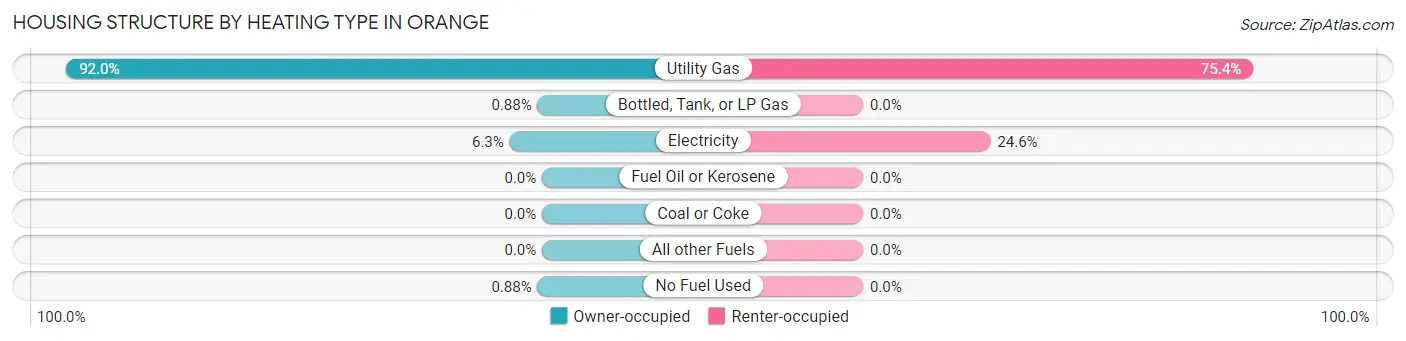
| Heating Type | Owner-occupied | Renter-occupied |
| Utility Gas | 1,143 (91.9%) | 98 (75.4%) |
| Bottled, Tank, or LP Gas | 11 (0.9%) | 0 (0.0%) |
| Electricity | 78 (6.3%) | 32 (24.6%) |
| Fuel Oil or Kerosene | 0 (0.0%) | 0 (0.0%) |
| Coal or Coke | 0 (0.0%) | 0 (0.0%) |
| All other Fuels | 0 (0.0%) | 0 (0.0%) |
| No Fuel Used | 11 (0.9%) | 0 (0.0%) |
| Total | 1,243 (100.0%) | 130 (100.0%) |
Household Vehicle Usage in Orange
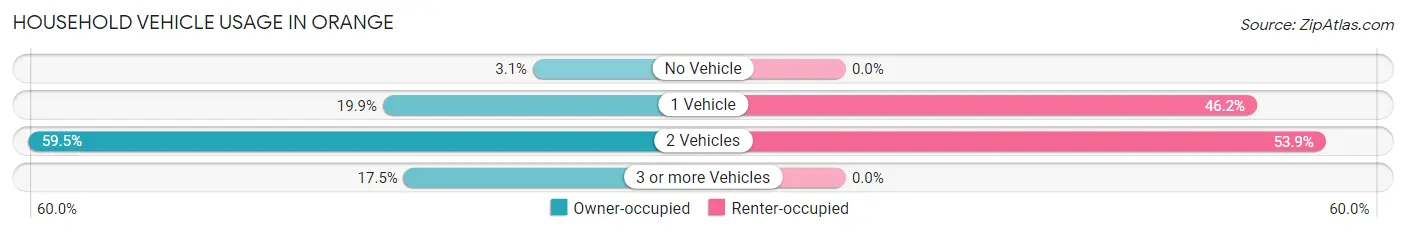
| Vehicles per Household | Owner-occupied | Renter-occupied |
| No Vehicle | 38 (3.1%) | 0 (0.0%) |
| 1 Vehicle | 247 (19.9%) | 60 (46.2%) |
| 2 Vehicles | 740 (59.5%) | 70 (53.8%) |
| 3 or more Vehicles | 218 (17.5%) | 0 (0.0%) |
| Total | 1,243 (100.0%) | 130 (100.0%) |
Real Estate & Mortgages in Orange
Real Estate and Mortgage Overview in Orange
| Characteristic | Without Mortgage | With Mortgage |
| Housing Units | 393 | 850 |
| Median Property Value | $382,900 | $427,400 |
| Median Household Income | $141,583 | $467 |
| Monthly Housing Costs | $1,233 | $211 |
| Real Estate Taxes | $7,512 | $0 |
Property Value by Mortgage Status in Orange
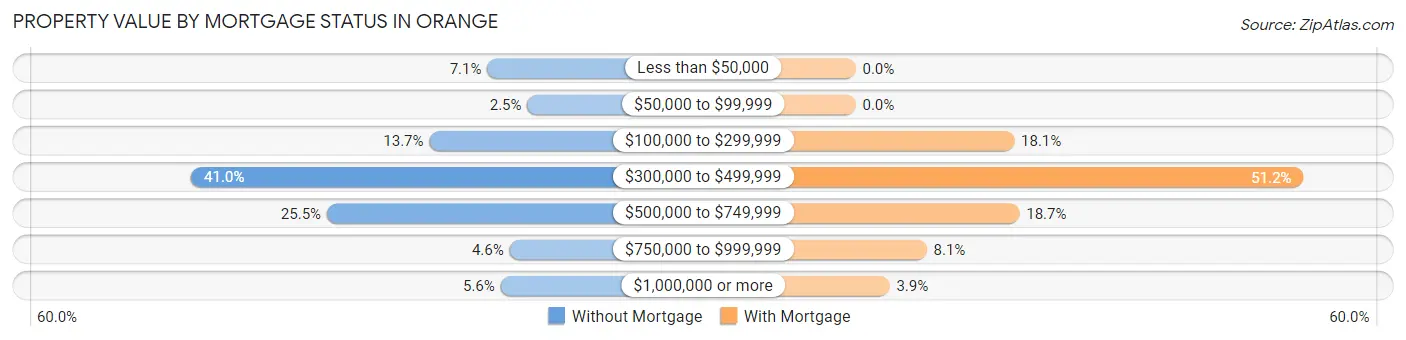
| Property Value | Without Mortgage | With Mortgage |
| Less than $50,000 | 28 (7.1%) | 0 (0.0%) |
| $50,000 to $99,999 | 10 (2.5%) | 0 (0.0%) |
| $100,000 to $299,999 | 54 (13.7%) | 154 (18.1%) |
| $300,000 to $499,999 | 161 (41.0%) | 435 (51.2%) |
| $500,000 to $749,999 | 100 (25.5%) | 159 (18.7%) |
| $750,000 to $999,999 | 18 (4.6%) | 69 (8.1%) |
| $1,000,000 or more | 22 (5.6%) | 33 (3.9%) |
| Total | 393 (100.0%) | 850 (100.0%) |
Household Income by Mortgage Status in Orange
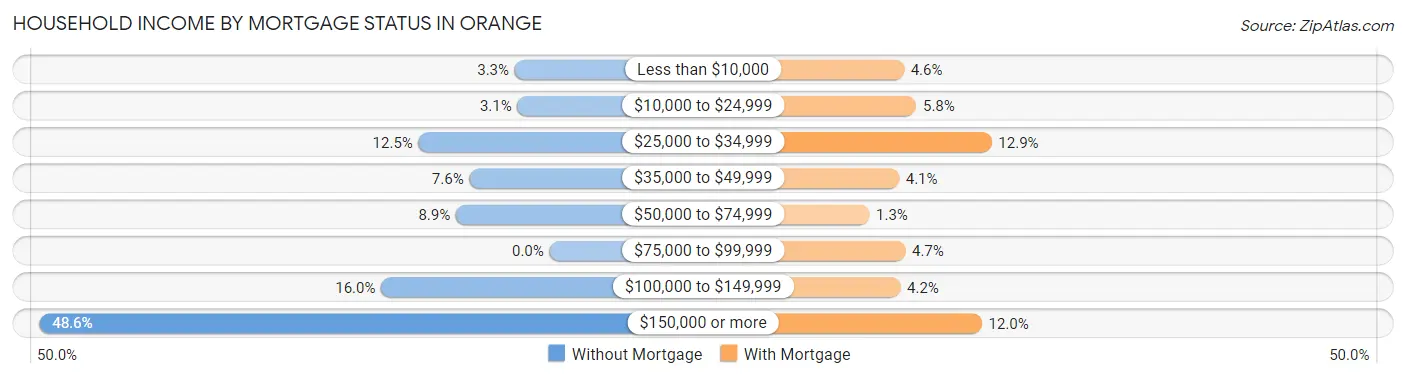
| Household Income | Without Mortgage | With Mortgage |
| Less than $10,000 | 13 (3.3%) | 39 (4.6%) |
| $10,000 to $24,999 | 12 (3.0%) | 49 (5.8%) |
| $25,000 to $34,999 | 49 (12.5%) | 110 (12.9%) |
| $35,000 to $49,999 | 30 (7.6%) | 35 (4.1%) |
| $50,000 to $74,999 | 35 (8.9%) | 11 (1.3%) |
| $75,000 to $99,999 | 0 (0.0%) | 40 (4.7%) |
| $100,000 to $149,999 | 63 (16.0%) | 36 (4.2%) |
| $150,000 or more | 191 (48.6%) | 102 (12.0%) |
| Total | 393 (100.0%) | 850 (100.0%) |
Property Value to Household Income Ratio in Orange
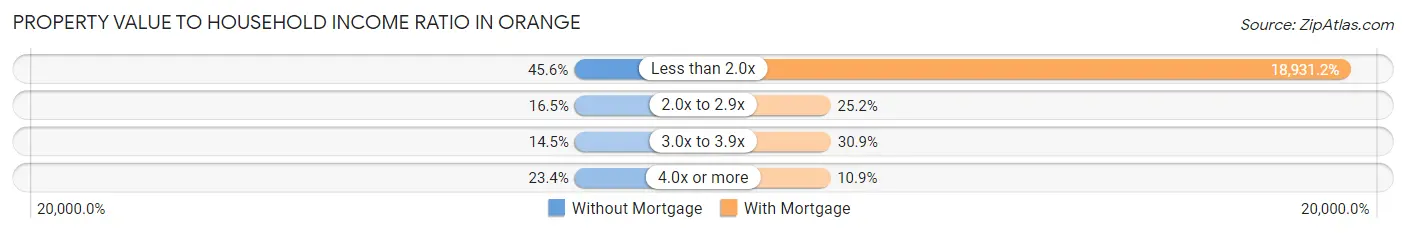
| Value-to-Income Ratio | Without Mortgage | With Mortgage |
| Less than 2.0x | 179 (45.6%) | 160,915 (18,931.2%) |
| 2.0x to 2.9x | 65 (16.5%) | 214 (25.2%) |
| 3.0x to 3.9x | 57 (14.5%) | 263 (30.9%) |
| 4.0x or more | 92 (23.4%) | 93 (10.9%) |
| Total | 393 (100.0%) | 850 (100.0%) |
Real Estate Taxes by Mortgage Status in Orange
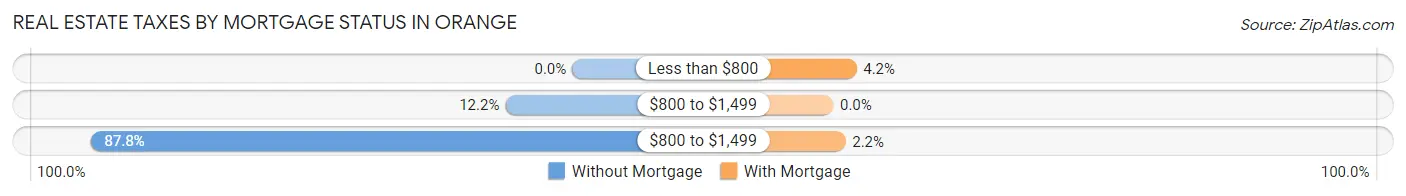
| Property Taxes | Without Mortgage | With Mortgage |
| Less than $800 | 0 (0.0%) | 36 (4.2%) |
| $800 to $1,499 | 48 (12.2%) | 0 (0.0%) |
| $800 to $1,499 | 345 (87.8%) | 19 (2.2%) |
| Total | 393 (100.0%) | 850 (100.0%) |
Health & Disability in Orange
Health Insurance Coverage by Age in Orange
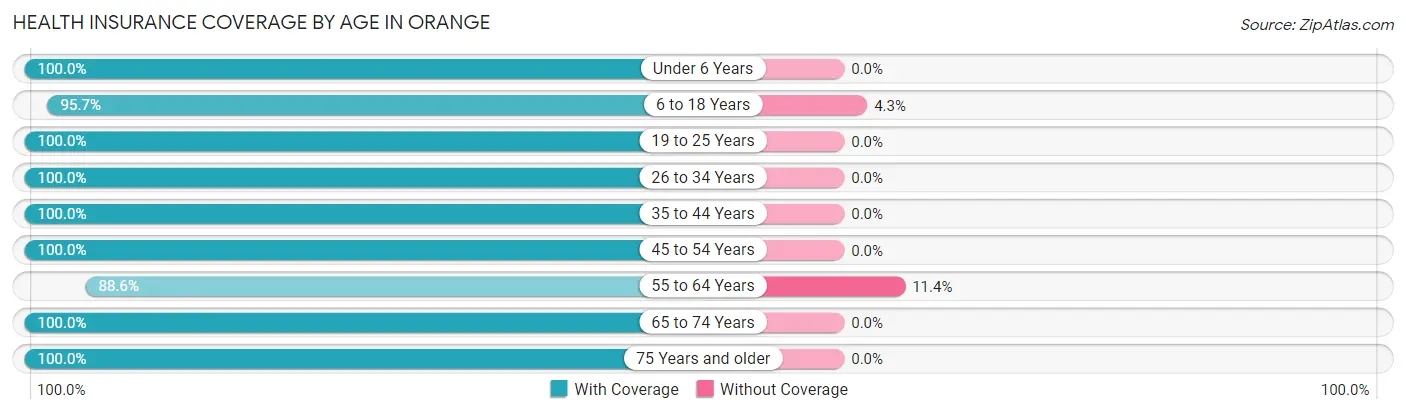
| Age Bracket | With Coverage | Without Coverage |
| Under 6 Years | 188 (100.0%) | 0 (0.0%) |
| 6 to 18 Years | 650 (95.7%) | 29 (4.3%) |
| 19 to 25 Years | 114 (100.0%) | 0 (0.0%) |
| 26 to 34 Years | 124 (100.0%) | 0 (0.0%) |
| 35 to 44 Years | 464 (100.0%) | 0 (0.0%) |
| 45 to 54 Years | 409 (100.0%) | 0 (0.0%) |
| 55 to 64 Years | 523 (88.6%) | 67 (11.4%) |
| 65 to 74 Years | 539 (100.0%) | 0 (0.0%) |
| 75 Years and older | 325 (100.0%) | 0 (0.0%) |
| Total | 3,336 (97.2%) | 96 (2.8%) |
Health Insurance Coverage by Citizenship Status in Orange
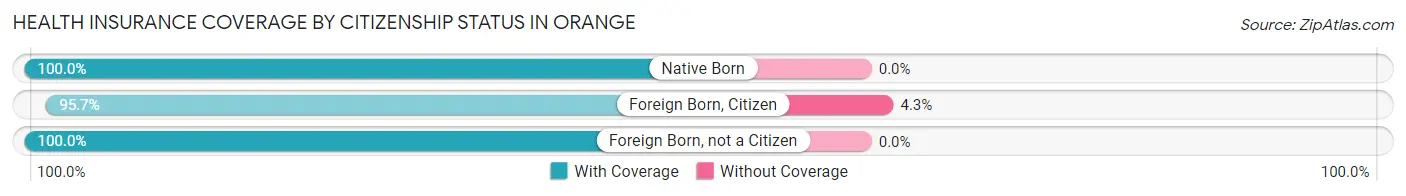
| Citizenship Status | With Coverage | Without Coverage |
| Native Born | 188 (100.0%) | 0 (0.0%) |
| Foreign Born, Citizen | 650 (95.7%) | 29 (4.3%) |
| Foreign Born, not a Citizen | 114 (100.0%) | 0 (0.0%) |
Health Insurance Coverage by Household Income in Orange
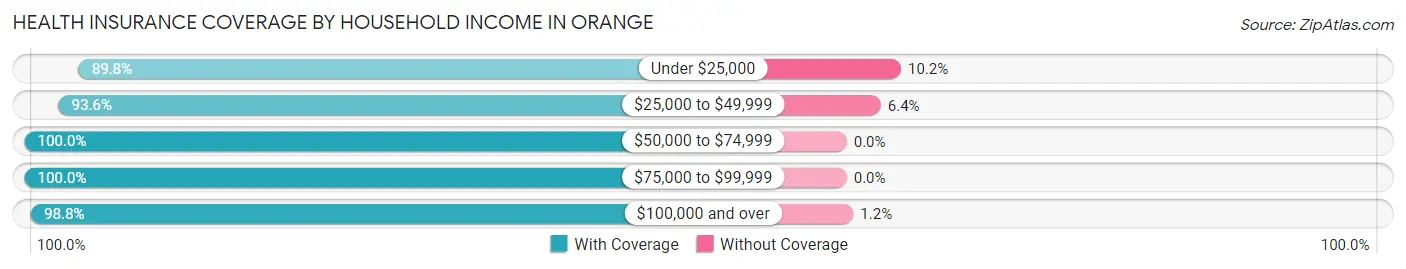
| Household Income | With Coverage | Without Coverage |
| Under $25,000 | 451 (89.8%) | 51 (10.2%) |
| $25,000 to $49,999 | 220 (93.6%) | 15 (6.4%) |
| $50,000 to $74,999 | 250 (100.0%) | 0 (0.0%) |
| $75,000 to $99,999 | 100 (100.0%) | 0 (0.0%) |
| $100,000 and over | 2,303 (98.8%) | 29 (1.2%) |
Public vs Private Health Insurance Coverage by Age in Orange
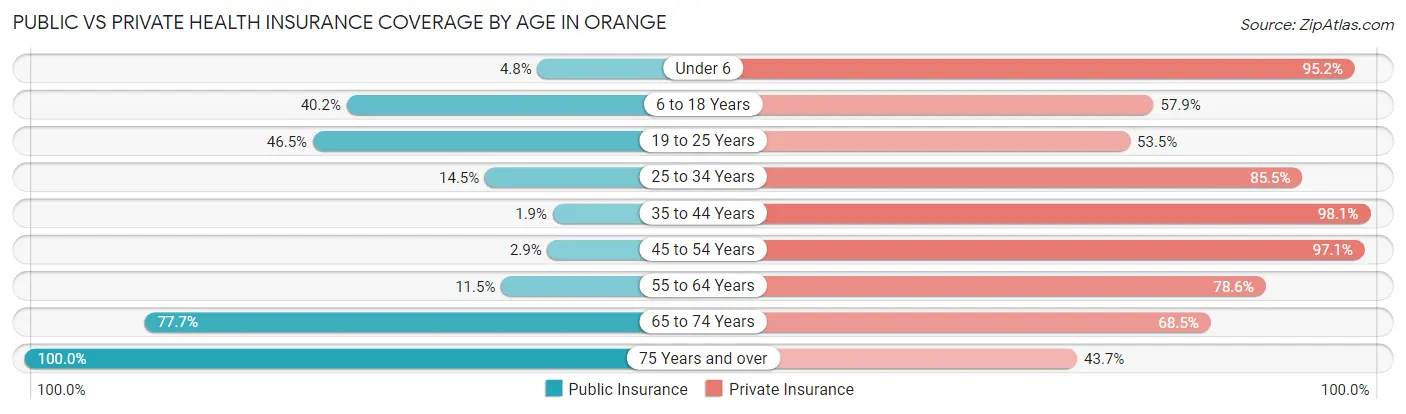
| Age Bracket | Public Insurance | Private Insurance |
| Under 6 | 9 (4.8%) | 179 (95.2%) |
| 6 to 18 Years | 273 (40.2%) | 393 (57.9%) |
| 19 to 25 Years | 53 (46.5%) | 61 (53.5%) |
| 25 to 34 Years | 18 (14.5%) | 106 (85.5%) |
| 35 to 44 Years | 9 (1.9%) | 455 (98.1%) |
| 45 to 54 Years | 12 (2.9%) | 397 (97.1%) |
| 55 to 64 Years | 68 (11.5%) | 464 (78.6%) |
| 65 to 74 Years | 419 (77.7%) | 369 (68.5%) |
| 75 Years and over | 325 (100.0%) | 142 (43.7%) |
| Total | 1,186 (34.6%) | 2,566 (74.8%) |
Disability Status by Sex by Age in Orange
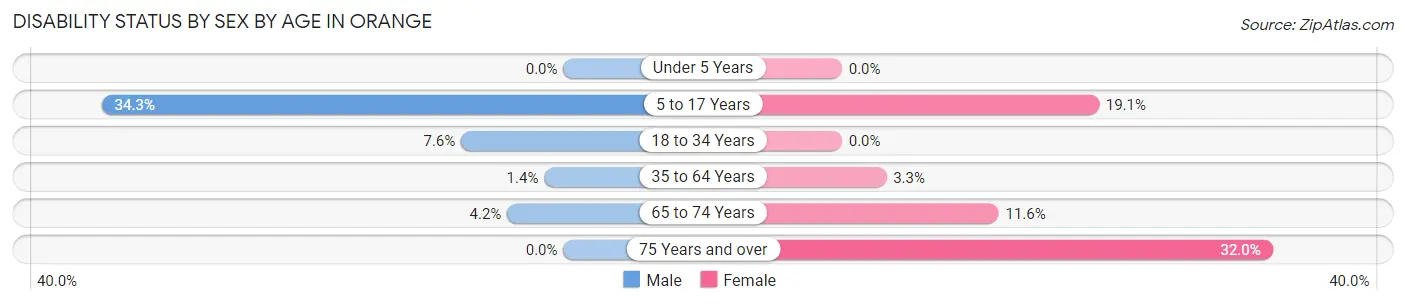
| Age Bracket | Male | Female |
| Under 5 Years | 0 (0.0%) | 0 (0.0%) |
| 5 to 17 Years | 133 (34.3%) | 58 (19.1%) |
| 18 to 34 Years | 12 (7.6%) | 0 (0.0%) |
| 35 to 64 Years | 10 (1.4%) | 25 (3.3%) |
| 65 to 74 Years | 11 (4.2%) | 32 (11.6%) |
| 75 Years and over | 0 (0.0%) | 63 (32.0%) |
Disability Class by Sex by Age in Orange
Disability Class: Hearing Difficulty
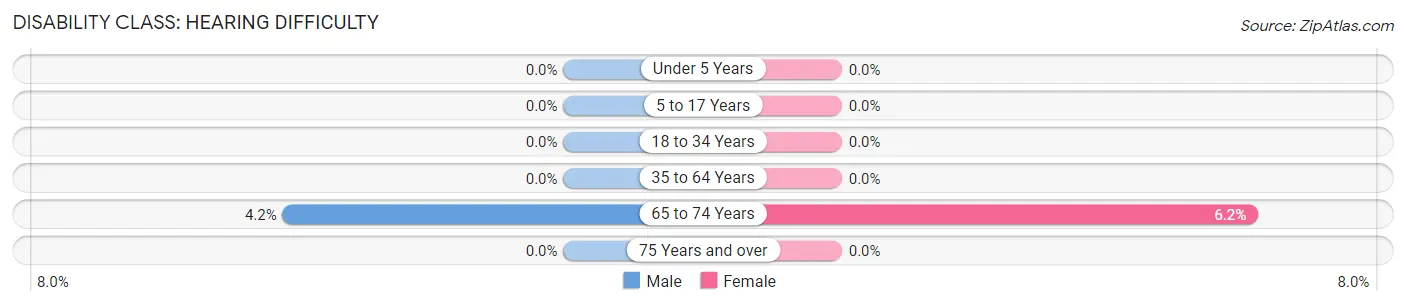
| Age Bracket | Male | Female |
| Under 5 Years | 0 (0.0%) | 0 (0.0%) |
| 5 to 17 Years | 0 (0.0%) | 0 (0.0%) |
| 18 to 34 Years | 0 (0.0%) | 0 (0.0%) |
| 35 to 64 Years | 0 (0.0%) | 0 (0.0%) |
| 65 to 74 Years | 11 (4.2%) | 17 (6.2%) |
| 75 Years and over | 0 (0.0%) | 0 (0.0%) |
Disability Class: Vision Difficulty
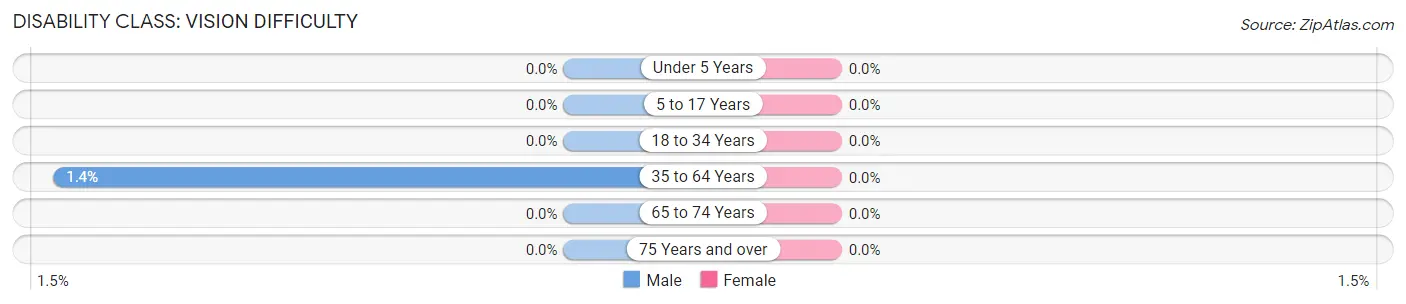
| Age Bracket | Male | Female |
| Under 5 Years | 0 (0.0%) | 0 (0.0%) |
| 5 to 17 Years | 0 (0.0%) | 0 (0.0%) |
| 18 to 34 Years | 0 (0.0%) | 0 (0.0%) |
| 35 to 64 Years | 10 (1.4%) | 0 (0.0%) |
| 65 to 74 Years | 0 (0.0%) | 0 (0.0%) |
| 75 Years and over | 0 (0.0%) | 0 (0.0%) |
Disability Class: Cognitive Difficulty
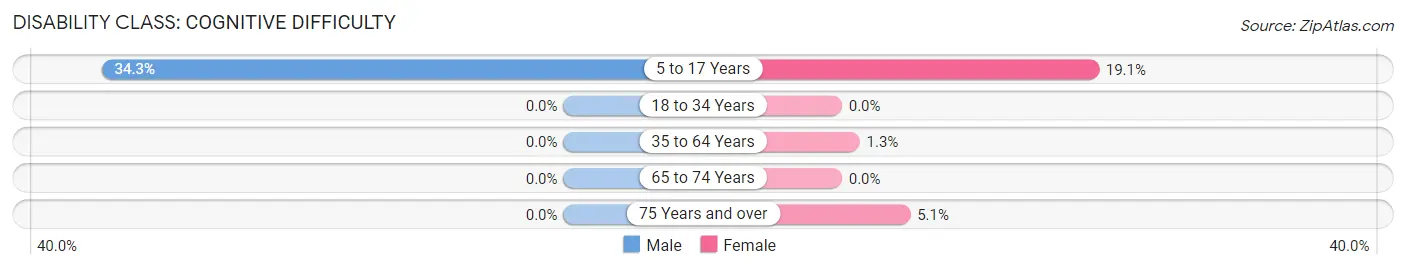
| Age Bracket | Male | Female |
| 5 to 17 Years | 133 (34.3%) | 58 (19.1%) |
| 18 to 34 Years | 0 (0.0%) | 0 (0.0%) |
| 35 to 64 Years | 0 (0.0%) | 10 (1.3%) |
| 65 to 74 Years | 0 (0.0%) | 0 (0.0%) |
| 75 Years and over | 0 (0.0%) | 10 (5.1%) |
Disability Class: Ambulatory Difficulty
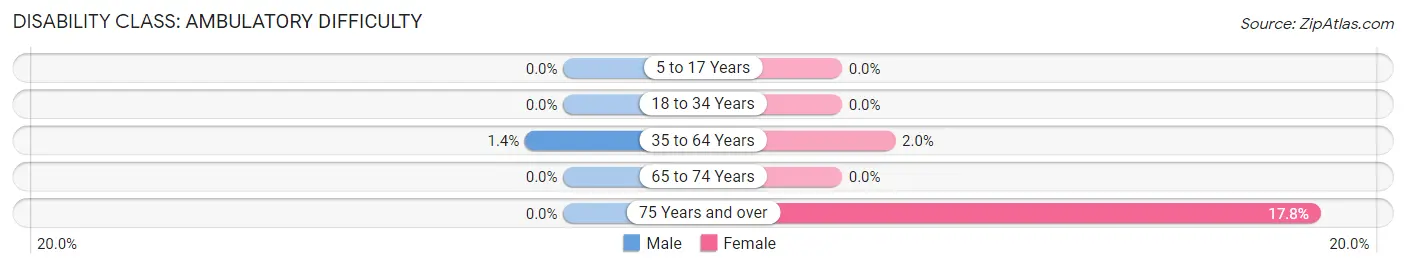
| Age Bracket | Male | Female |
| 5 to 17 Years | 0 (0.0%) | 0 (0.0%) |
| 18 to 34 Years | 0 (0.0%) | 0 (0.0%) |
| 35 to 64 Years | 10 (1.4%) | 15 (2.0%) |
| 65 to 74 Years | 0 (0.0%) | 0 (0.0%) |
| 75 Years and over | 0 (0.0%) | 35 (17.8%) |
Disability Class: Self-Care Difficulty
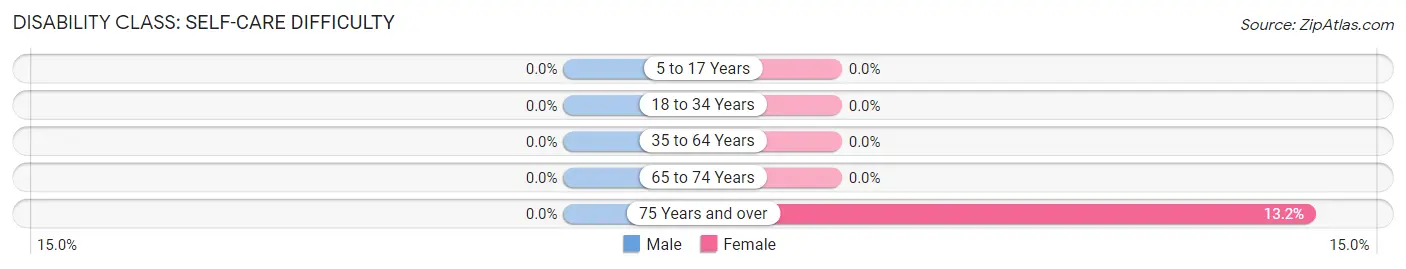
| Age Bracket | Male | Female |
| 5 to 17 Years | 0 (0.0%) | 0 (0.0%) |
| 18 to 34 Years | 0 (0.0%) | 0 (0.0%) |
| 35 to 64 Years | 0 (0.0%) | 0 (0.0%) |
| 65 to 74 Years | 0 (0.0%) | 0 (0.0%) |
| 75 Years and over | 0 (0.0%) | 26 (13.2%) |
Technology Access in Orange
Computing Device Access in Orange
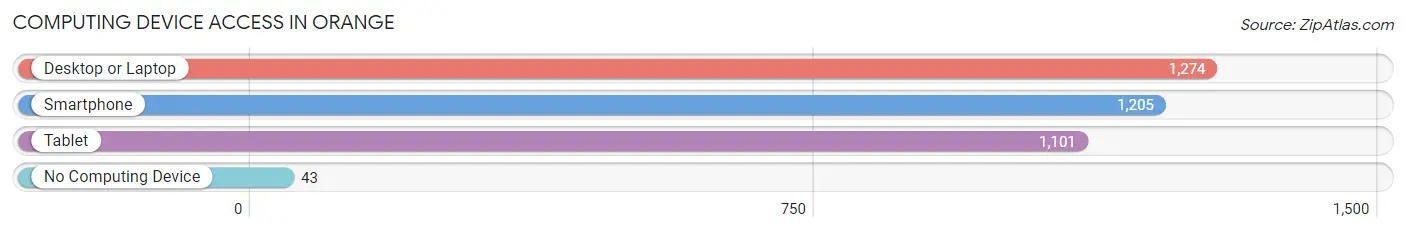
| Device Type | # Households | % Households |
| Desktop or Laptop | 1,274 | 92.8% |
| Smartphone | 1,205 | 87.8% |
| Tablet | 1,101 | 80.2% |
| No Computing Device | 43 | 3.1% |
| Total | 1,373 | 100.0% |
Internet Access in Orange
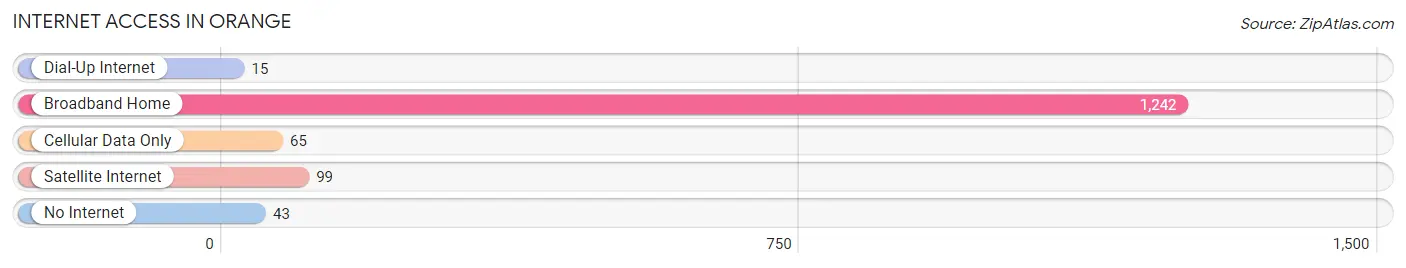
| Internet Type | # Households | % Households |
| Dial-Up Internet | 15 | 1.1% |
| Broadband Home | 1,242 | 90.5% |
| Cellular Data Only | 65 | 4.7% |
| Satellite Internet | 99 | 7.2% |
| No Internet | 43 | 3.1% |
| Total | 1,373 | 100.0% |
Orange Summary
Orange, Ohio is a city located in Cuyahoga County, Ohio, United States. It is a suburb of Cleveland and is located approximately 10 miles east of downtown Cleveland. The population of Orange was estimated to be 3,719 in 2019.
Geography
Orange is located at 41°25'25" North, 81°30'45" West (41.423, -81.512). According to the United States Census Bureau, the city has a total area of 2.2 square miles, all of it land.
History
Orange was first settled in 1820 by a group of settlers from Connecticut. The town was originally known as "Orangeville" and was later changed to "Orange" in 1832. The town was officially incorporated in 1867.
In the late 19th century, Orange was a popular summer resort for wealthy Clevelanders. The town was home to several large estates, including the estate of John D. Rockefeller.
Economy
Orange is home to several businesses, including a number of restaurants, retail stores, and professional services. The city is also home to a number of manufacturing companies, including a plastics manufacturer and a metal fabrication company.
Demographics
As of the 2010 census, the population of Orange was 3,719. The racial makeup of the city was 87.3% White, 8.2% African American, 0.3% Native American, 0.7% Asian, 0.1% Pacific Islander, 0.7% from other races, and 2.1% from two or more races. Hispanic or Latino of any race were 2.2% of the population.
The median income for a household in Orange was $50,938, and the median income for a family was $60,938. The per capita income for the city was $25,938. About 5.2% of families and 6.3% of the population were below the poverty line, including 8.2% of those under age 18 and 4.2% of those age 65 or over.
Education
Orange is served by the Orange City School District. The district consists of two elementary schools, one middle school, and one high school. The district also operates a preschool and an alternative school.
Orange is also home to a branch of Cuyahoga Community College. The college offers a variety of degree and certificate programs, as well as continuing education courses.
Conclusion
Orange, Ohio is a small city located in Cuyahoga County, Ohio, United States. It is a suburb of Cleveland and is located approximately 10 miles east of downtown Cleveland. The population of Orange was estimated to be 3,719 in 2019. The city is home to a variety of businesses, including restaurants, retail stores, and professional services. The city is also served by the Orange City School District, which consists of two elementary schools, one middle school, and one high school. Cuyahoga Community College also has a branch in Orange.
Common Questions
What is Per Capita Income in Orange?
Per Capita income in Orange is $78,936.
What is the Median Family Income in Orange?
Median Family Income in Orange is $165,625.
What is the Median Household income in Orange?
Median Household Income in Orange is $150,729.
What is Income or Wage Gap in Orange?
Income or Wage Gap in Orange is 57.6%.
Women in Orange earn 42.4 cents for every dollar earned by a man.
What is Inequality or Gini Index in Orange?
Inequality or Gini Index in Orange is 0.51.
What is the Total Population of Orange?
Total Population of Orange is 3,432.
What is the Total Male Population of Orange?
Total Male Population of Orange is 1,736.
What is the Total Female Population of Orange?
Total Female Population of Orange is 1,696.
What is the Ratio of Males per 100 Females in Orange?
There are 102.36 Males per 100 Females in Orange.
What is the Ratio of Females per 100 Males in Orange?
There are 97.70 Females per 100 Males in Orange.
What is the Median Population Age in Orange?
Median Population Age in Orange is 47.4 Years.
What is the Average Family Size in Orange
Average Family Size in Orange is 2.8 People.
What is the Average Household Size in Orange
Average Household Size in Orange is 2.5 People.
How Large is the Labor Force in Orange?
There are 1,656 People in the Labor Forcein in Orange.
What is the Percentage of People in the Labor Force in Orange?
60.9% of People are in the Labor Force in Orange.
What is the Unemployment Rate in Orange?
Unemployment Rate in Orange is 9.3%.