Boston Heights, OH Map & Demographics
Boston Heights Map
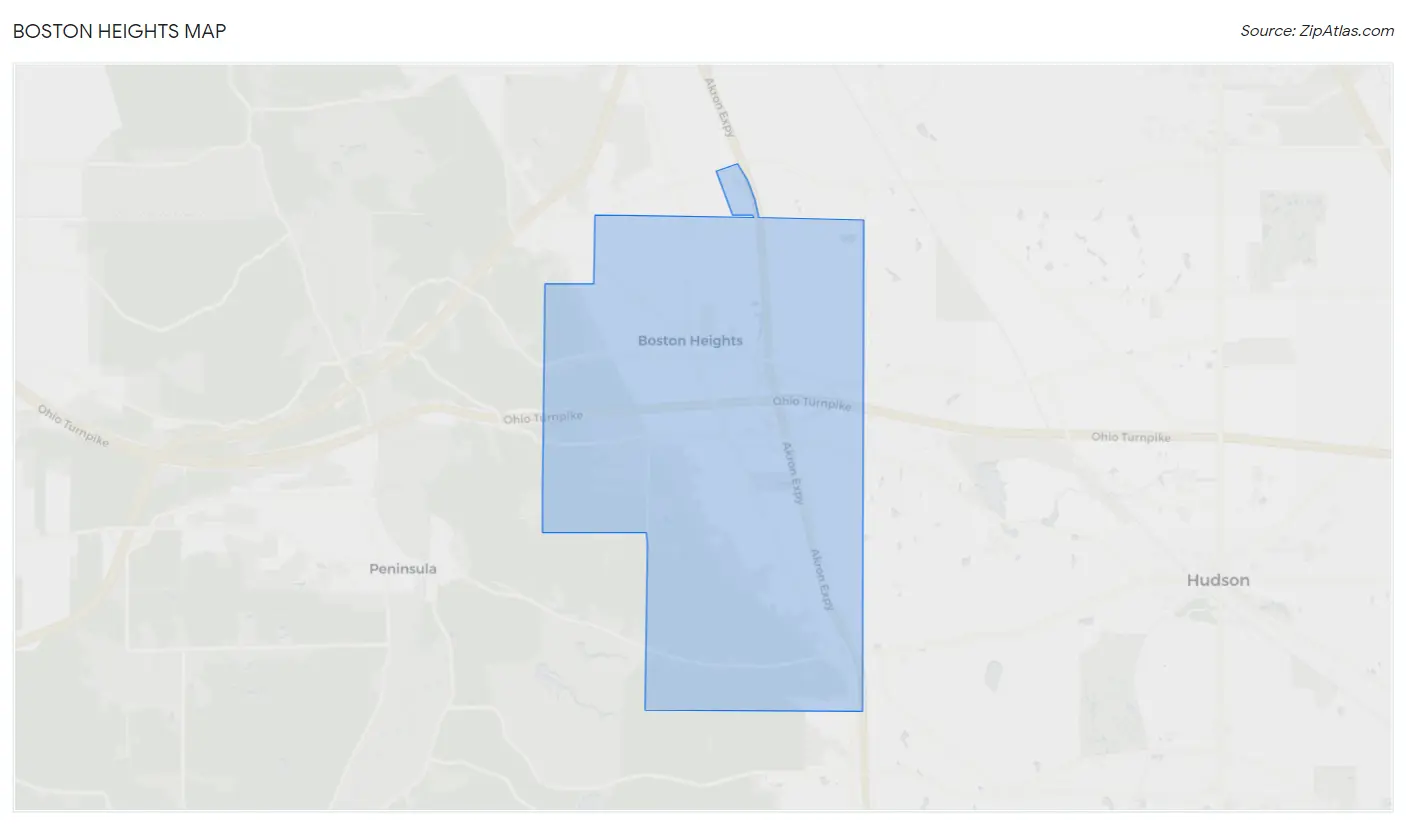
Boston Heights Overview
$84,236
PER CAPITA INCOME
$150,673
AVG FAMILY INCOME
$109,545
AVG HOUSEHOLD INCOME
48.2%
WAGE / INCOME GAP [ % ]
51.8¢/ $1
WAGE / INCOME GAP [ $ ]
0.55
INEQUALITY / GINI INDEX
1,242
TOTAL POPULATION
661
MALE POPULATION
581
FEMALE POPULATION
113.77
MALES / 100 FEMALES
87.90
FEMALES / 100 MALES
51.7
MEDIAN AGE
2.8
AVG FAMILY SIZE
2.4
AVG HOUSEHOLD SIZE
613
LABOR FORCE [ PEOPLE ]
59.0%
PERCENT IN LABOR FORCE
4.6%
UNEMPLOYMENT RATE
Income in Boston Heights
Income Overview in Boston Heights
Per Capita Income in Boston Heights is $84,236, while median incomes of families and households are $150,673 and $109,545 respectively.
| Characteristic | Number | Measure |
| Per Capita Income | 1,242 | $84,236 |
| Median Family Income | 367 | $150,673 |
| Mean Family Income | 367 | $252,999 |
| Median Household Income | 520 | $109,545 |
| Mean Household Income | 520 | $204,602 |
| Income Deficit | 367 | $0 |
| Wage / Income Gap (%) | 1,242 | 48.18% |
| Wage / Income Gap ($) | 1,242 | 51.82¢ per $1 |
| Gini / Inequality Index | 1,242 | 0.55 |
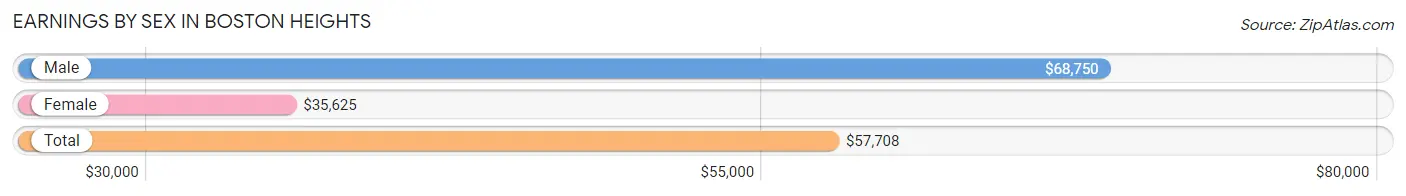
Earnings by Sex in Boston Heights
Average Earnings in Boston Heights are $57,708, $68,750 for men and $35,625 for women, a difference of 48.2%.
| Sex | Number | Average Earnings |
| Male | 389 (58.4%) | $68,750 |
| Female | 277 (41.6%) | $35,625 |
| Total | 666 (100.0%) | $57,708 |
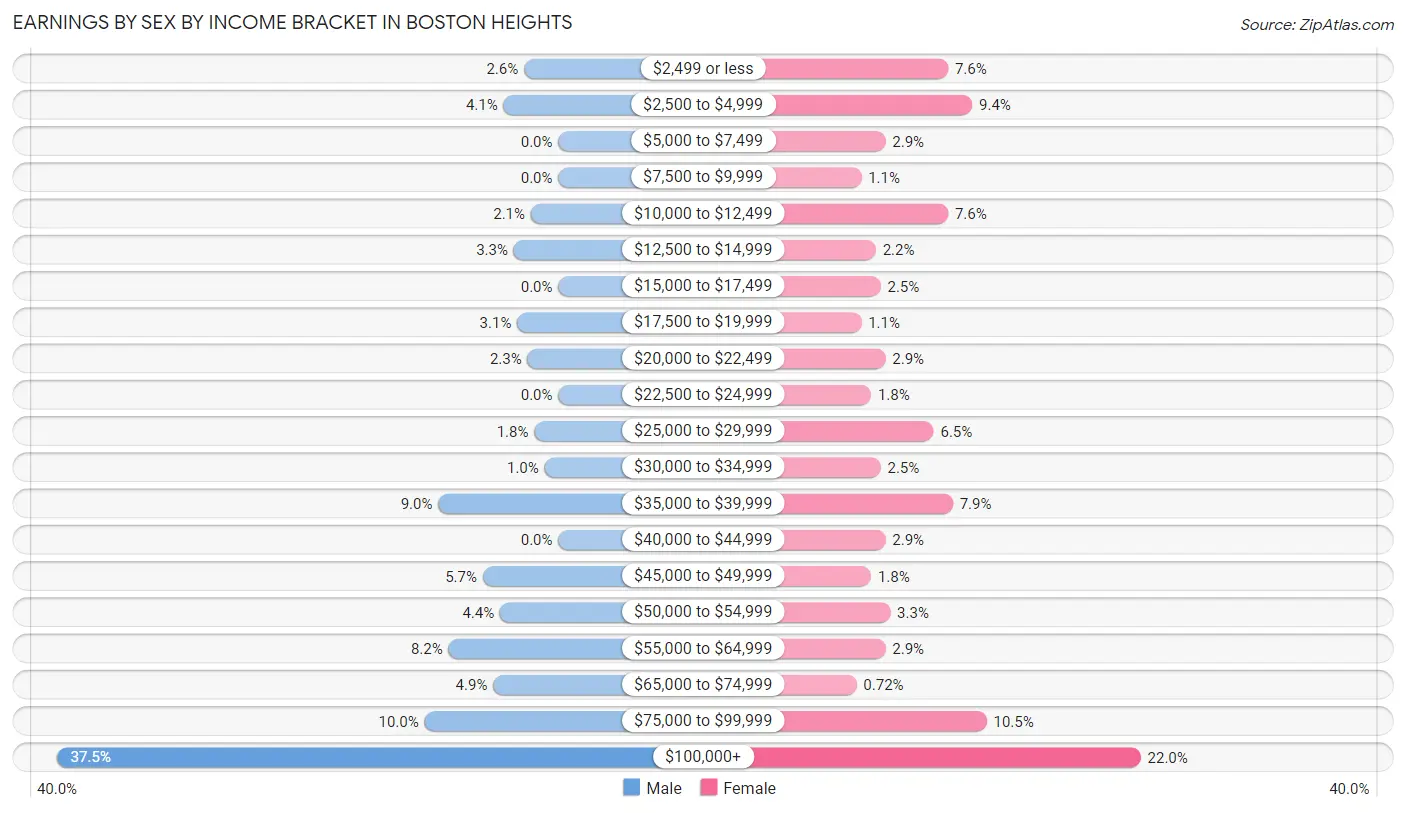
Earnings by Sex by Income Bracket in Boston Heights
The most common earnings brackets in Boston Heights are $100,000+ for men (146 | 37.5%) and $100,000+ for women (61 | 22.0%).
| Income | Male | Female |
| $2,499 or less | 10 (2.6%) | 21 (7.6%) |
| $2,500 to $4,999 | 16 (4.1%) | 26 (9.4%) |
| $5,000 to $7,499 | 0 (0.0%) | 8 (2.9%) |
| $7,500 to $9,999 | 0 (0.0%) | 3 (1.1%) |
| $10,000 to $12,499 | 8 (2.1%) | 21 (7.6%) |
| $12,500 to $14,999 | 13 (3.3%) | 6 (2.2%) |
| $15,000 to $17,499 | 0 (0.0%) | 7 (2.5%) |
| $17,500 to $19,999 | 12 (3.1%) | 3 (1.1%) |
| $20,000 to $22,499 | 9 (2.3%) | 8 (2.9%) |
| $22,500 to $24,999 | 0 (0.0%) | 5 (1.8%) |
| $25,000 to $29,999 | 7 (1.8%) | 18 (6.5%) |
| $30,000 to $34,999 | 4 (1.0%) | 7 (2.5%) |
| $35,000 to $39,999 | 35 (9.0%) | 22 (7.9%) |
| $40,000 to $44,999 | 0 (0.0%) | 8 (2.9%) |
| $45,000 to $49,999 | 22 (5.7%) | 5 (1.8%) |
| $50,000 to $54,999 | 17 (4.4%) | 9 (3.3%) |
| $55,000 to $64,999 | 32 (8.2%) | 8 (2.9%) |
| $65,000 to $74,999 | 19 (4.9%) | 2 (0.7%) |
| $75,000 to $99,999 | 39 (10.0%) | 29 (10.5%) |
| $100,000+ | 146 (37.5%) | 61 (22.0%) |
| Total | 389 (100.0%) | 277 (100.0%) |
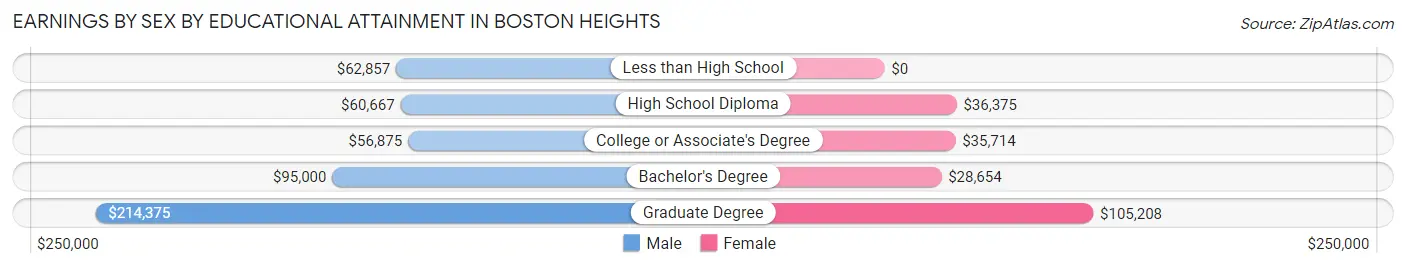
Earnings by Sex by Educational Attainment in Boston Heights
Average earnings in Boston Heights are $87,083 for men and $44,063 for women, a difference of 49.4%. Men with an educational attainment of graduate degree enjoy the highest average annual earnings of $214,375, while those with college or associate's degree education earn the least with $56,875. Women with an educational attainment of graduate degree earn the most with the average annual earnings of $105,208, while those with bachelor's degree education have the smallest earnings of $28,654.
| Educational Attainment | Male Income | Female Income |
| Less than High School | $62,857 | $0 |
| High School Diploma | $60,667 | $36,375 |
| College or Associate's Degree | $56,875 | $35,714 |
| Bachelor's Degree | $95,000 | $28,654 |
| Graduate Degree | $214,375 | $105,208 |
| Total | $87,083 | $44,063 |
Family Income in Boston Heights
Family Income Brackets in Boston Heights
According to the Boston Heights family income data, there are 148 families falling into the $200,000+ income range, which is the most common income bracket and makes up 40.3% of all families.
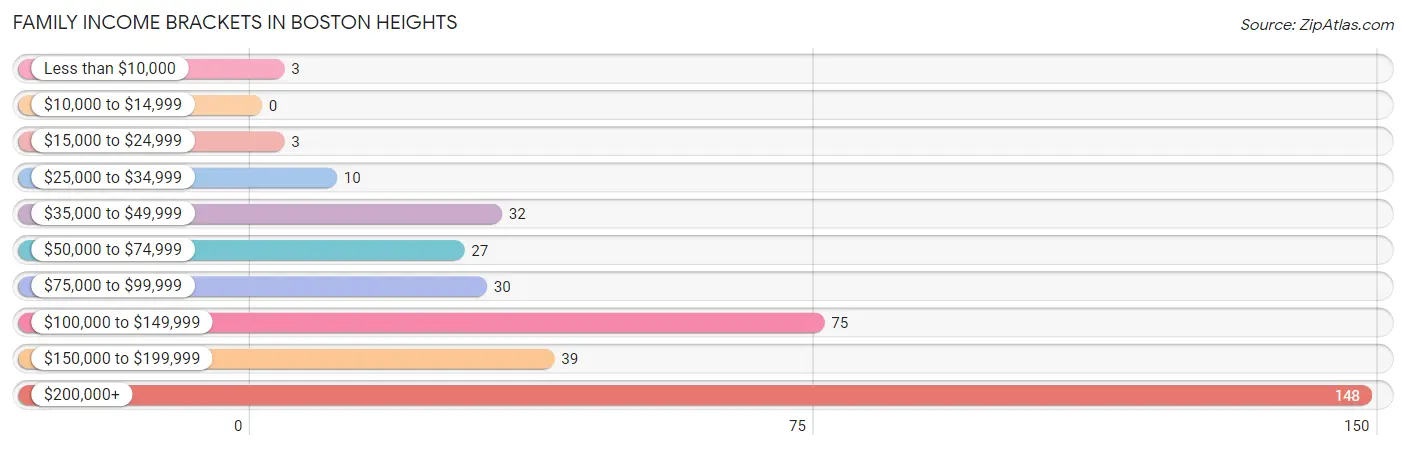
| Income Bracket | # Families | % Families |
| Less than $10,000 | 3 | 0.8% |
| $10,000 to $14,999 | 0 | 0.0% |
| $15,000 to $24,999 | 3 | 0.8% |
| $25,000 to $34,999 | 10 | 2.7% |
| $35,000 to $49,999 | 32 | 8.7% |
| $50,000 to $74,999 | 27 | 7.4% |
| $75,000 to $99,999 | 30 | 8.2% |
| $100,000 to $149,999 | 75 | 20.4% |
| $150,000 to $199,999 | 39 | 10.6% |
| $200,000+ | 148 | 40.3% |
Family Income by Famaliy Size in Boston Heights
5-person families (36 | 9.8%) account for the highest median family income in Boston Heights with $250,001 per family, while 4-person families (47 | 12.8%) have the highest median income of $61,406 per family member.
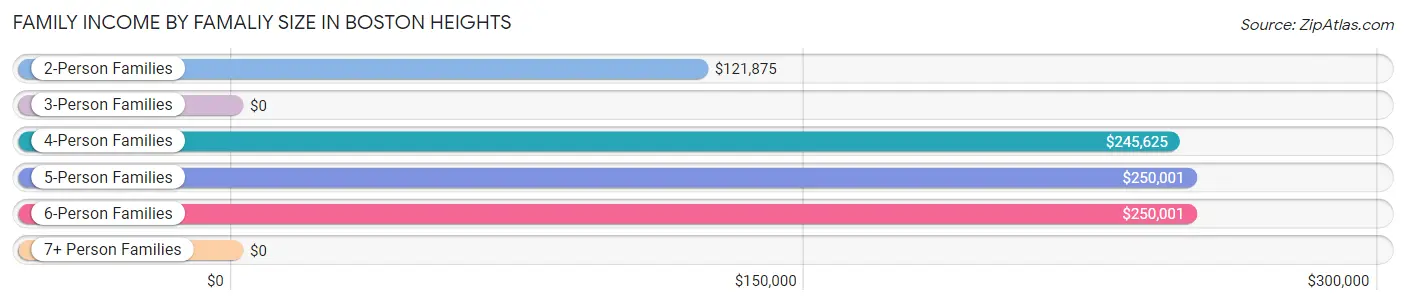
| Income Bracket | # Families | Median Income |
| 2-Person Families | 216 (58.9%) | $121,875 |
| 3-Person Families | 58 (15.8%) | $0 |
| 4-Person Families | 47 (12.8%) | $245,625 |
| 5-Person Families | 36 (9.8%) | $250,001 |
| 6-Person Families | 9 (2.5%) | $250,001 |
| 7+ Person Families | 1 (0.3%) | $0 |
| Total | 367 (100.0%) | $150,673 |
Family Income by Number of Earners in Boston Heights
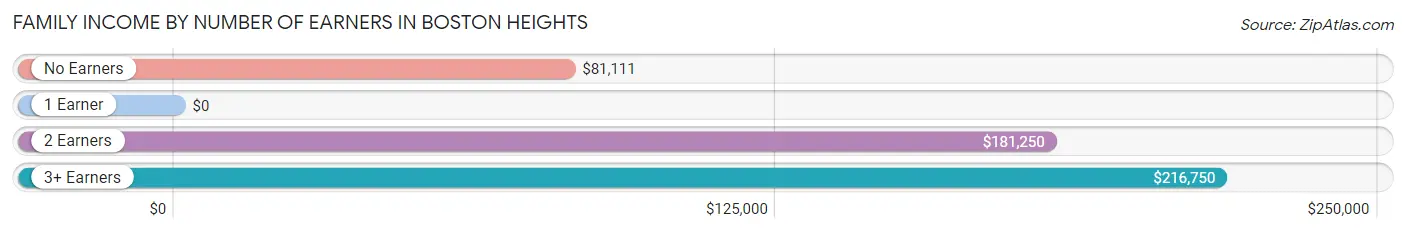
| Number of Earners | # Families | Median Income |
| No Earners | 80 (21.8%) | $81,111 |
| 1 Earner | 80 (21.8%) | $0 |
| 2 Earners | 154 (42.0%) | $181,250 |
| 3+ Earners | 53 (14.4%) | $216,750 |
| Total | 367 (100.0%) | $150,673 |
Household Income in Boston Heights
Household Income Brackets in Boston Heights
With 152 households falling in the category, the $200,000+ income range is the most frequent in Boston Heights, accounting for 29.2% of all households.
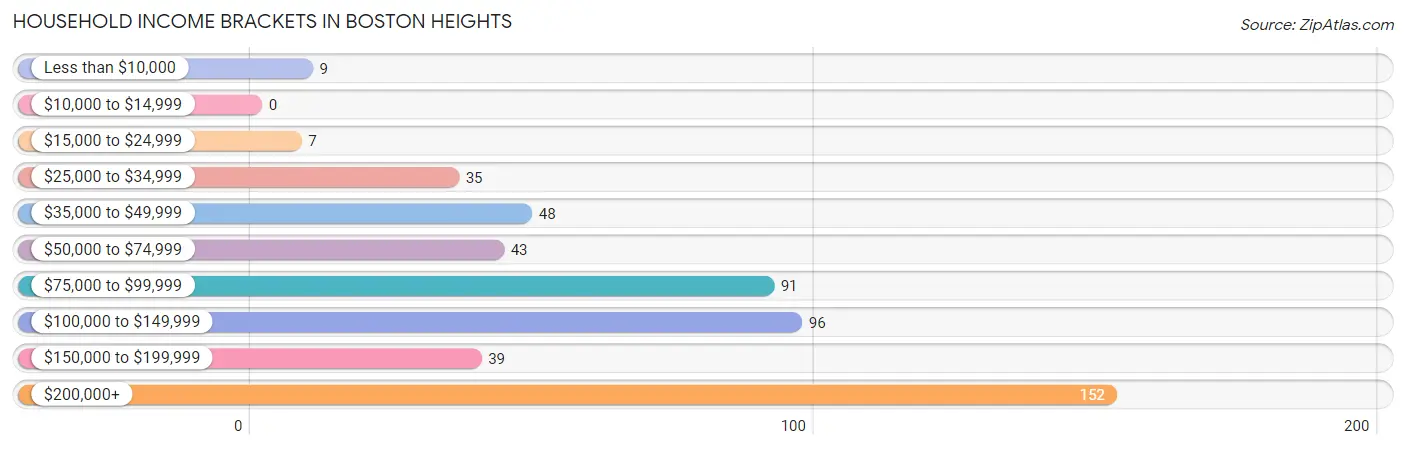
| Income Bracket | # Households | % Households |
| Less than $10,000 | 9 | 1.7% |
| $10,000 to $14,999 | 0 | 0.0% |
| $15,000 to $24,999 | 7 | 1.3% |
| $25,000 to $34,999 | 35 | 6.7% |
| $35,000 to $49,999 | 48 | 9.2% |
| $50,000 to $74,999 | 43 | 8.3% |
| $75,000 to $99,999 | 91 | 17.5% |
| $100,000 to $149,999 | 96 | 18.5% |
| $150,000 to $199,999 | 39 | 7.5% |
| $200,000+ | 152 | 29.2% |
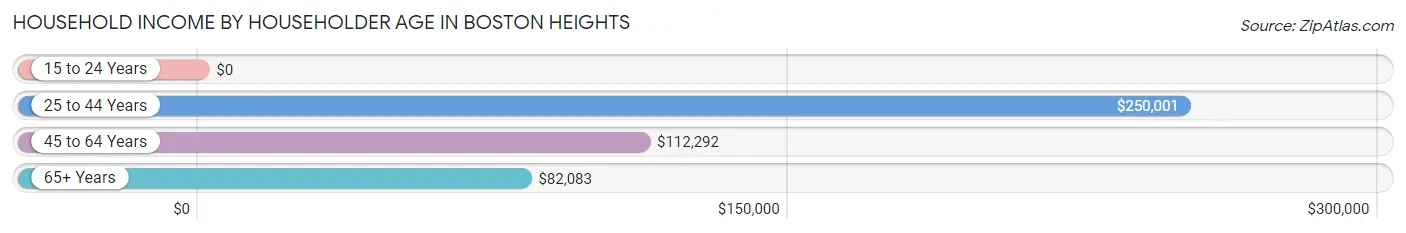
Household Income by Householder Age in Boston Heights
The median household income in Boston Heights is $109,545, with the highest median household income of $250,001 found in the 25 to 44 years age bracket for the primary householder. A total of 81 households (15.6%) fall into this category.
| Income Bracket | # Households | Median Income |
| 15 to 24 Years | 0 (0.0%) | $0 |
| 25 to 44 Years | 81 (15.6%) | $250,001 |
| 45 to 64 Years | 275 (52.9%) | $112,292 |
| 65+ Years | 164 (31.5%) | $82,083 |
| Total | 520 (100.0%) | $109,545 |
Poverty in Boston Heights
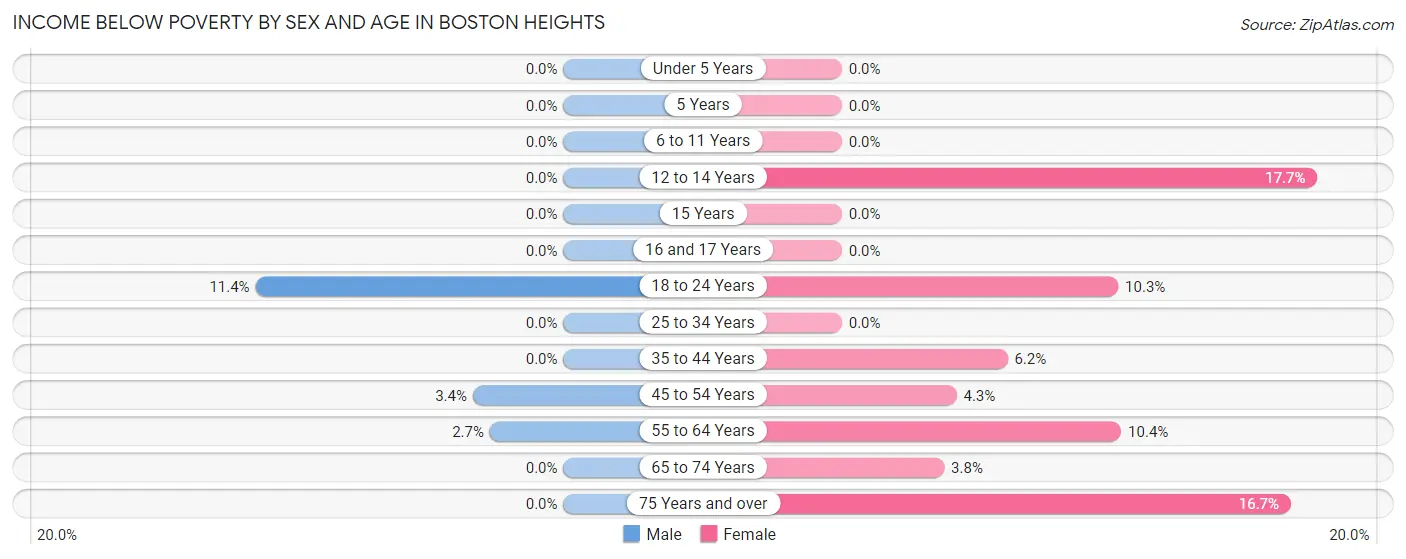
Income Below Poverty by Sex and Age in Boston Heights
With 1.7% poverty level for males and 7.1% for females among the residents of Boston Heights, 18 to 24 year old males and 12 to 14 year old females are the most vulnerable to poverty, with 4 males (11.4%) and 3 females (17.6%) in their respective age groups living below the poverty level.
| Age Bracket | Male | Female |
| Under 5 Years | 0 (0.0%) | 0 (0.0%) |
| 5 Years | 0 (0.0%) | 0 (0.0%) |
| 6 to 11 Years | 0 (0.0%) | 0 (0.0%) |
| 12 to 14 Years | 0 (0.0%) | 3 (17.6%) |
| 15 Years | 0 (0.0%) | 0 (0.0%) |
| 16 and 17 Years | 0 (0.0%) | 0 (0.0%) |
| 18 to 24 Years | 4 (11.4%) | 4 (10.3%) |
| 25 to 34 Years | 0 (0.0%) | 0 (0.0%) |
| 35 to 44 Years | 0 (0.0%) | 4 (6.1%) |
| 45 to 54 Years | 4 (3.4%) | 4 (4.3%) |
| 55 to 64 Years | 3 (2.7%) | 14 (10.4%) |
| 65 to 74 Years | 0 (0.0%) | 3 (3.8%) |
| 75 Years and over | 0 (0.0%) | 9 (16.7%) |
| Total | 11 (1.7%) | 41 (7.1%) |
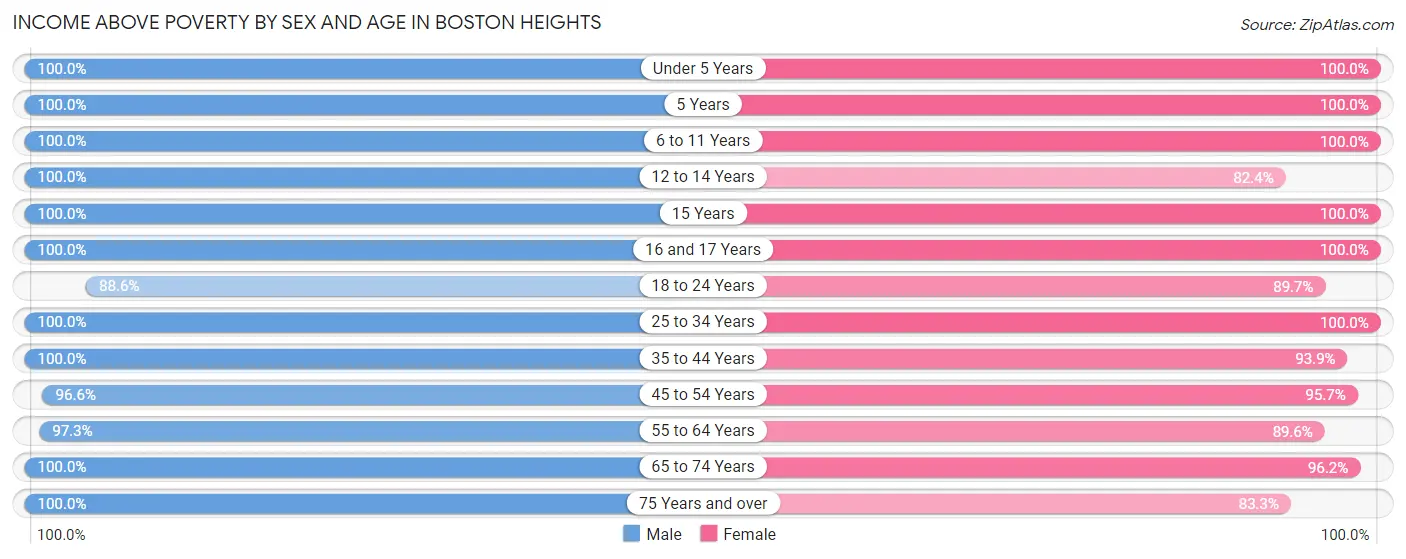
Income Above Poverty by Sex and Age in Boston Heights
According to the poverty statistics in Boston Heights, males aged under 5 years and females aged under 5 years are the age groups that are most secure financially, with 100.0% of males and 100.0% of females in these age groups living above the poverty line.
| Age Bracket | Male | Female |
| Under 5 Years | 32 (100.0%) | 26 (100.0%) |
| 5 Years | 20 (100.0%) | 4 (100.0%) |
| 6 to 11 Years | 34 (100.0%) | 23 (100.0%) |
| 12 to 14 Years | 23 (100.0%) | 14 (82.4%) |
| 15 Years | 8 (100.0%) | 16 (100.0%) |
| 16 and 17 Years | 9 (100.0%) | 12 (100.0%) |
| 18 to 24 Years | 31 (88.6%) | 35 (89.7%) |
| 25 to 34 Years | 42 (100.0%) | 17 (100.0%) |
| 35 to 44 Years | 75 (100.0%) | 61 (93.9%) |
| 45 to 54 Years | 115 (96.6%) | 90 (95.7%) |
| 55 to 64 Years | 107 (97.3%) | 121 (89.6%) |
| 65 to 74 Years | 91 (100.0%) | 76 (96.2%) |
| 75 Years and over | 63 (100.0%) | 45 (83.3%) |
| Total | 650 (98.3%) | 540 (92.9%) |
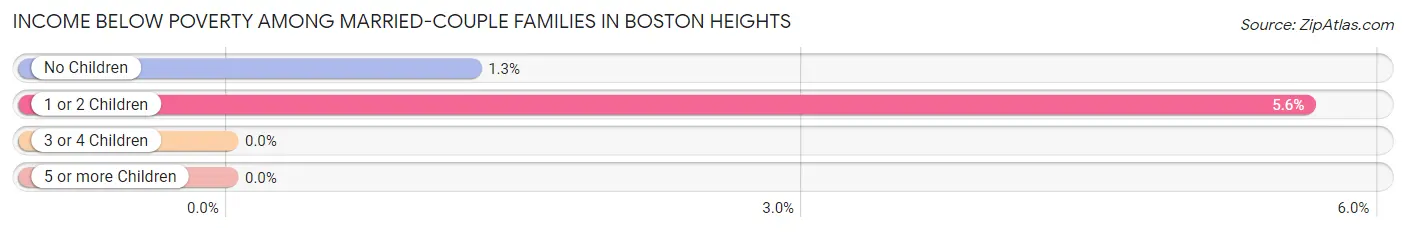
Income Below Poverty Among Married-Couple Families in Boston Heights
The poverty statistics for married-couple families in Boston Heights show that 2.1% or 7 of the total 342 families live below the poverty line. Families with 1 or 2 children have the highest poverty rate of 5.6%, comprising of 4 families. On the other hand, families with 3 or 4 children have the lowest poverty rate of 0.0%, which includes 0 families.
| Children | Above Poverty | Below Poverty |
| No Children | 233 (98.7%) | 3 (1.3%) |
| 1 or 2 Children | 67 (94.4%) | 4 (5.6%) |
| 3 or 4 Children | 35 (100.0%) | 0 (0.0%) |
| 5 or more Children | 0 (0.0%) | 0 (0.0%) |
| Total | 335 (98.0%) | 7 (2.1%) |
Income Below Poverty Among Single-Parent Households in Boston Heights
| Children | Single Father | Single Mother |
| No Children | 0 (0.0%) | 0 (0.0%) |
| 1 or 2 Children | 0 (0.0%) | 0 (0.0%) |
| 3 or 4 Children | 0 (0.0%) | 0 (0.0%) |
| 5 or more Children | 0 (0.0%) | 0 (0.0%) |
| Total | 0 (0.0%) | 0 (0.0%) |
Income Below Poverty Among Married-Couple vs Single-Parent Households in Boston Heights
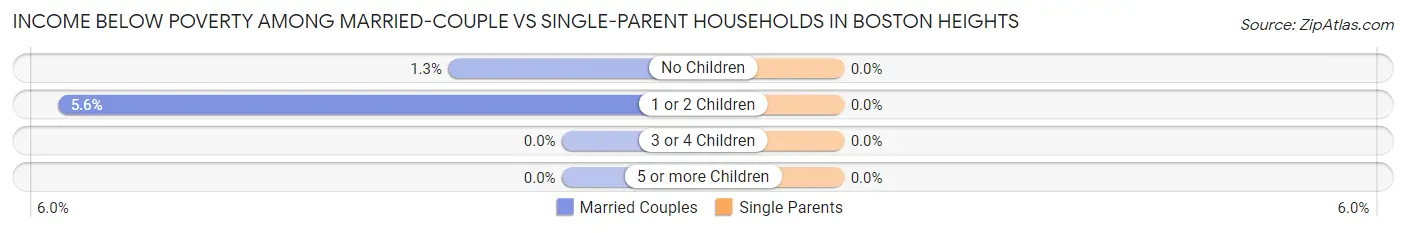
| Children | Married-Couple Families | Single-Parent Households |
| No Children | 3 (1.3%) | 0 (0.0%) |
| 1 or 2 Children | 4 (5.6%) | 0 (0.0%) |
| 3 or 4 Children | 0 (0.0%) | 0 (0.0%) |
| 5 or more Children | 0 (0.0%) | 0 (0.0%) |
| Total | 7 (2.1%) | 0 (0.0%) |
Race in Boston Heights
The most populous races in Boston Heights are White / Caucasian (1,180 | 95.0%), Two or more Races (26 | 2.1%), and Asian (22 | 1.8%).
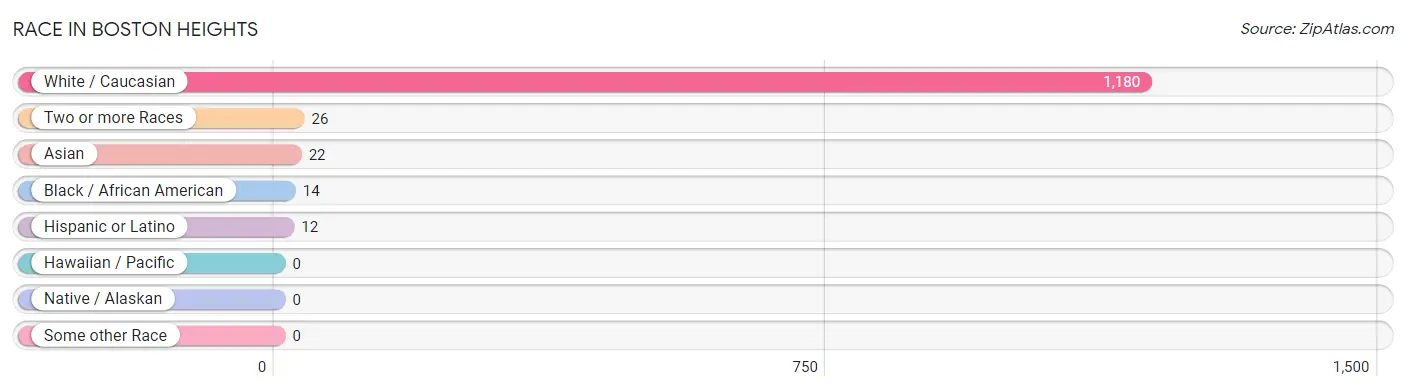
| Race | # Population | % Population |
| Asian | 22 | 1.8% |
| Black / African American | 14 | 1.1% |
| Hawaiian / Pacific | 0 | 0.0% |
| Hispanic or Latino | 12 | 1.0% |
| Native / Alaskan | 0 | 0.0% |
| White / Caucasian | 1,180 | 95.0% |
| Two or more Races | 26 | 2.1% |
| Some other Race | 0 | 0.0% |
| Total | 1,242 | 100.0% |
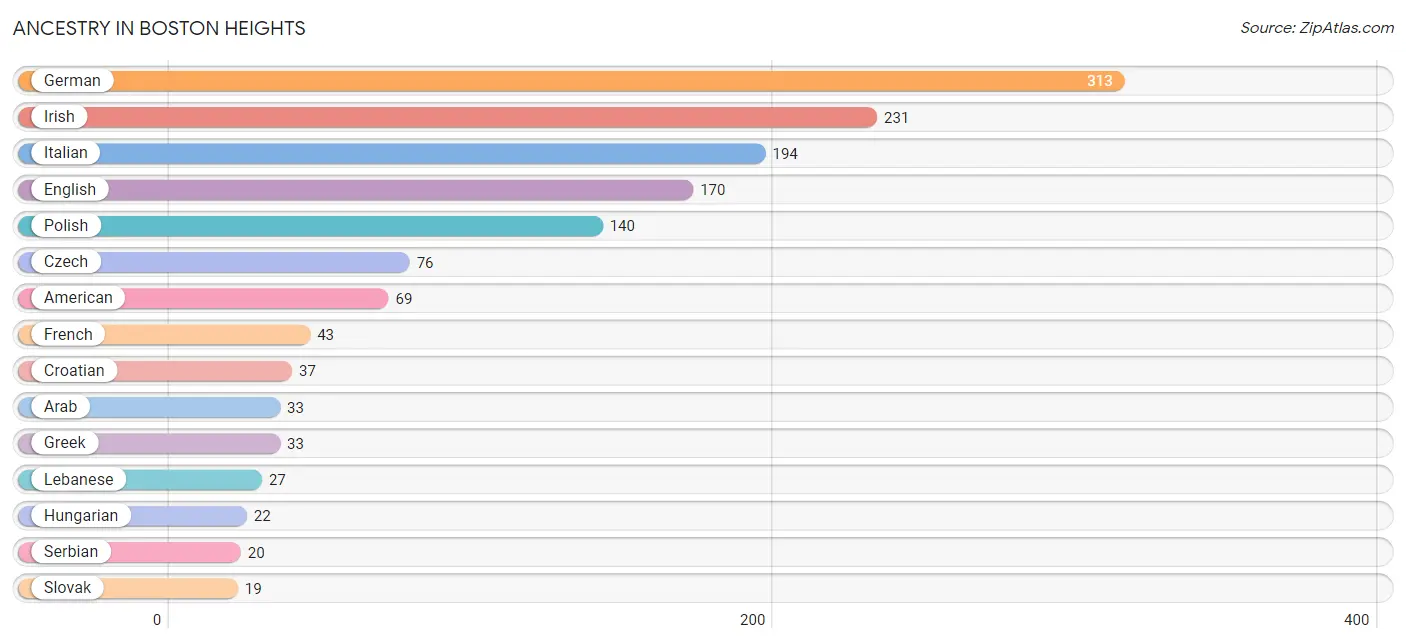
Ancestry in Boston Heights
The most populous ancestries reported in Boston Heights are German (313 | 25.2%), Irish (231 | 18.6%), Italian (194 | 15.6%), English (170 | 13.7%), and Polish (140 | 11.3%), together accounting for 84.4% of all Boston Heights residents.
| Ancestry | # Population | % Population |
| American | 69 | 5.6% |
| Arab | 33 | 2.7% |
| Austrian | 3 | 0.2% |
| British | 4 | 0.3% |
| Burmese | 10 | 0.8% |
| Canadian | 4 | 0.3% |
| Carpatho Rusyn | 2 | 0.2% |
| Central American | 2 | 0.2% |
| Croatian | 37 | 3.0% |
| Czech | 76 | 6.1% |
| Czechoslovakian | 1 | 0.1% |
| Dutch | 18 | 1.5% |
| Eastern European | 6 | 0.5% |
| English | 170 | 13.7% |
| European | 15 | 1.2% |
| French | 43 | 3.5% |
| French Canadian | 3 | 0.2% |
| German | 313 | 25.2% |
| Greek | 33 | 2.7% |
| Hungarian | 22 | 1.8% |
| Indian (Asian) | 13 | 1.1% |
| Irish | 231 | 18.6% |
| Italian | 194 | 15.6% |
| Korean | 7 | 0.6% |
| Latvian | 1 | 0.1% |
| Lebanese | 27 | 2.2% |
| Lithuanian | 6 | 0.5% |
| Moroccan | 3 | 0.2% |
| Nicaraguan | 2 | 0.2% |
| Norwegian | 9 | 0.7% |
| Polish | 140 | 11.3% |
| Russian | 9 | 0.7% |
| Scandinavian | 3 | 0.2% |
| Scotch-Irish | 12 | 1.0% |
| Scottish | 17 | 1.4% |
| Serbian | 20 | 1.6% |
| Slovak | 19 | 1.5% |
| Slovene | 3 | 0.2% |
| Spanish | 10 | 0.8% |
| Swedish | 3 | 0.2% |
| Thai | 2 | 0.2% |
| Ukrainian | 13 | 1.1% |
| Welsh | 6 | 0.5% | View All 43 Rows |
Immigrants in Boston Heights
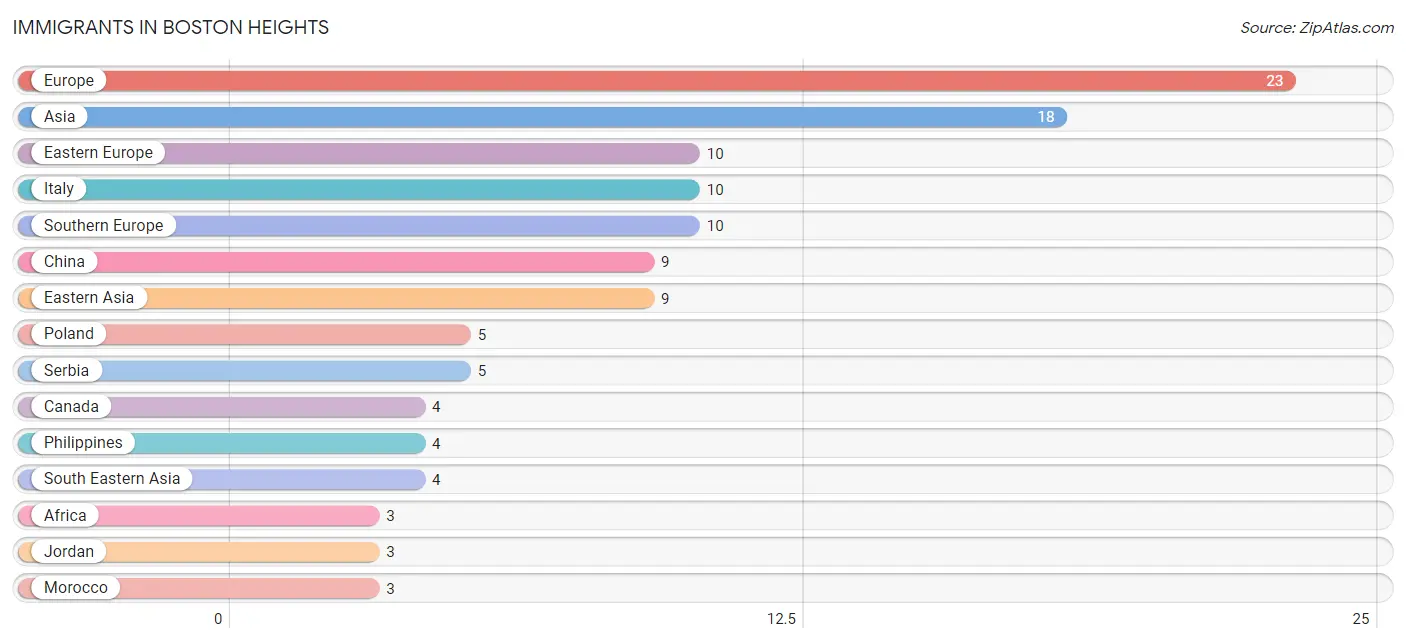
The most numerous immigrant groups reported in Boston Heights came from Europe (23 | 1.8%), Asia (18 | 1.5%), Eastern Europe (10 | 0.8%), Italy (10 | 0.8%), and Southern Europe (10 | 0.8%), together accounting for 5.7% of all Boston Heights residents.
| Immigration Origin | # Population | % Population |
| Africa | 3 | 0.2% |
| Asia | 18 | 1.5% |
| Bangladesh | 2 | 0.2% |
| Canada | 4 | 0.3% |
| Central America | 2 | 0.2% |
| China | 9 | 0.7% |
| Eastern Asia | 9 | 0.7% |
| Eastern Europe | 10 | 0.8% |
| Europe | 23 | 1.8% |
| Hong Kong | 2 | 0.2% |
| Italy | 10 | 0.8% |
| Jordan | 3 | 0.2% |
| Latin America | 2 | 0.2% |
| Morocco | 3 | 0.2% |
| Netherlands | 3 | 0.2% |
| Nicaragua | 2 | 0.2% |
| Northern Africa | 3 | 0.2% |
| Philippines | 4 | 0.3% |
| Poland | 5 | 0.4% |
| Serbia | 5 | 0.4% |
| South Central Asia | 2 | 0.2% |
| South Eastern Asia | 4 | 0.3% |
| Southern Europe | 10 | 0.8% |
| Western Asia | 3 | 0.2% |
| Western Europe | 3 | 0.2% | View All 25 Rows |
Sex and Age in Boston Heights
Sex and Age in Boston Heights
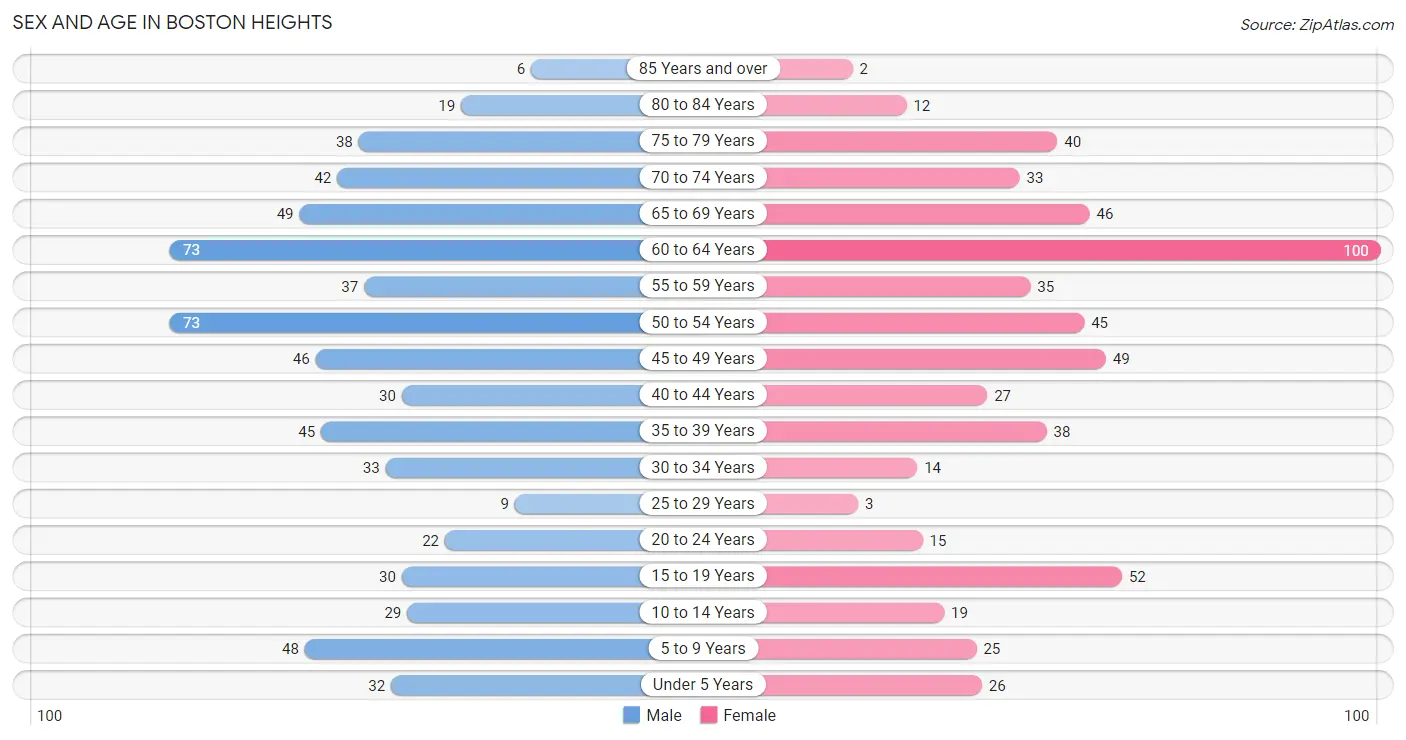
The most populous age groups in Boston Heights are 50 to 54 Years (73 | 11.0%) for men and 60 to 64 Years (100 | 17.2%) for women.
| Age Bracket | Male | Female |
| Under 5 Years | 32 (4.8%) | 26 (4.5%) |
| 5 to 9 Years | 48 (7.3%) | 25 (4.3%) |
| 10 to 14 Years | 29 (4.4%) | 19 (3.3%) |
| 15 to 19 Years | 30 (4.5%) | 52 (8.9%) |
| 20 to 24 Years | 22 (3.3%) | 15 (2.6%) |
| 25 to 29 Years | 9 (1.4%) | 3 (0.5%) |
| 30 to 34 Years | 33 (5.0%) | 14 (2.4%) |
| 35 to 39 Years | 45 (6.8%) | 38 (6.5%) |
| 40 to 44 Years | 30 (4.5%) | 27 (4.6%) |
| 45 to 49 Years | 46 (7.0%) | 49 (8.4%) |
| 50 to 54 Years | 73 (11.0%) | 45 (7.7%) |
| 55 to 59 Years | 37 (5.6%) | 35 (6.0%) |
| 60 to 64 Years | 73 (11.0%) | 100 (17.2%) |
| 65 to 69 Years | 49 (7.4%) | 46 (7.9%) |
| 70 to 74 Years | 42 (6.4%) | 33 (5.7%) |
| 75 to 79 Years | 38 (5.8%) | 40 (6.9%) |
| 80 to 84 Years | 19 (2.9%) | 12 (2.1%) |
| 85 Years and over | 6 (0.9%) | 2 (0.3%) |
| Total | 661 (100.0%) | 581 (100.0%) |
Families and Households in Boston Heights
Median Family Size in Boston Heights
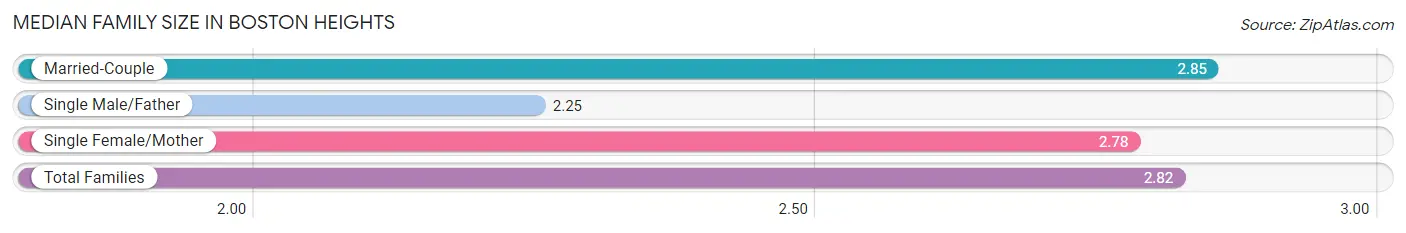
The median family size in Boston Heights is 2.82 persons per family, with married-couple families (342 | 93.2%) accounting for the largest median family size of 2.85 persons per family. On the other hand, single male/father families (16 | 4.4%) represent the smallest median family size with 2.25 persons per family.
| Family Type | # Families | Family Size |
| Married-Couple | 342 (93.2%) | 2.85 |
| Single Male/Father | 16 (4.4%) | 2.25 |
| Single Female/Mother | 9 (2.5%) | 2.78 |
| Total Families | 367 (100.0%) | 2.82 |
Median Household Size in Boston Heights
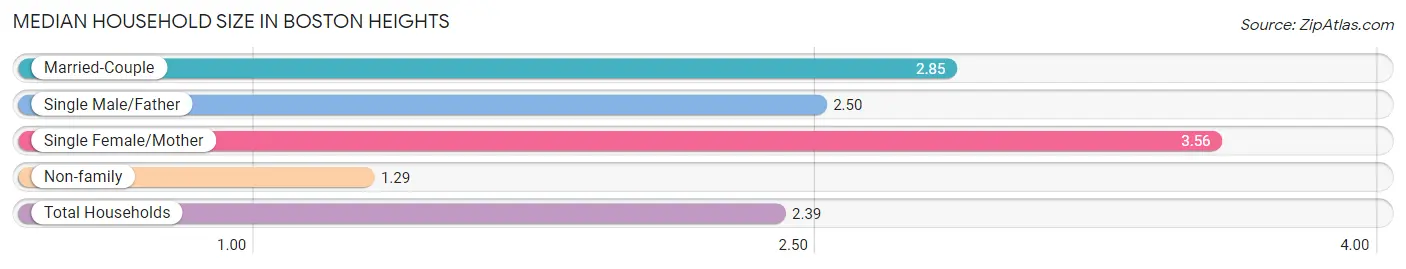
The median household size in Boston Heights is 2.39 persons per household, with single female/mother households (9 | 1.7%) accounting for the largest median household size of 3.56 persons per household. non-family households (153 | 29.4%) represent the smallest median household size with 1.29 persons per household.
| Household Type | # Households | Household Size |
| Married-Couple | 342 (65.8%) | 2.85 |
| Single Male/Father | 16 (3.1%) | 2.50 |
| Single Female/Mother | 9 (1.7%) | 3.56 |
| Non-family | 153 (29.4%) | 1.29 |
| Total Households | 520 (100.0%) | 2.39 |
Household Size by Marriage Status in Boston Heights
Out of a total of 520 households in Boston Heights, 367 (70.6%) are family households, while 153 (29.4%) are nonfamily households. The most numerous type of family households are 2-person households, comprising 212, and the most common type of nonfamily households are 1-person households, comprising 95.
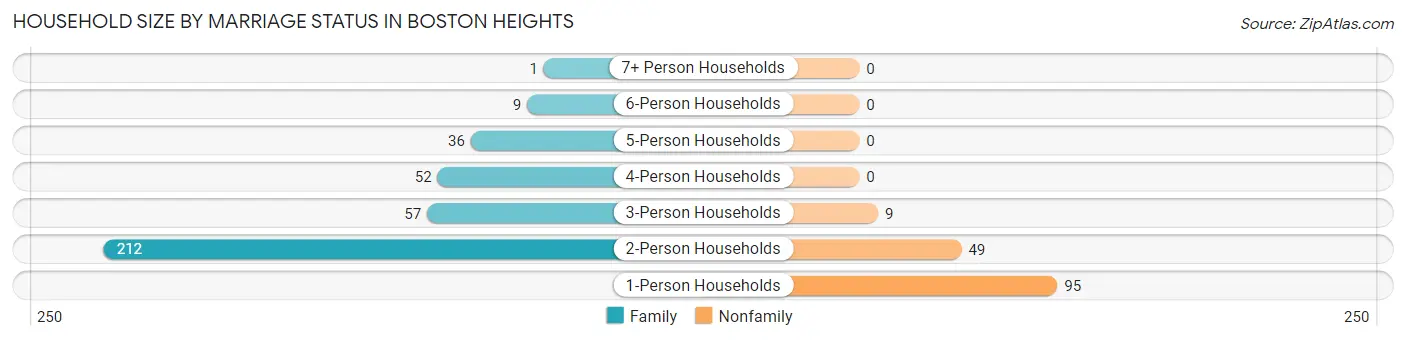
| Household Size | Family Households | Nonfamily Households |
| 1-Person Households | - | 95 (18.3%) |
| 2-Person Households | 212 (40.8%) | 49 (9.4%) |
| 3-Person Households | 57 (11.0%) | 9 (1.7%) |
| 4-Person Households | 52 (10.0%) | 0 (0.0%) |
| 5-Person Households | 36 (6.9%) | 0 (0.0%) |
| 6-Person Households | 9 (1.7%) | 0 (0.0%) |
| 7+ Person Households | 1 (0.2%) | 0 (0.0%) |
| Total | 367 (70.6%) | 153 (29.4%) |
Female Fertility in Boston Heights
Fertility by Age in Boston Heights
Average fertility rate in Boston Heights is 28.0 births per 1,000 women. Women in the age bracket of 20 to 34 years have the highest fertility rate with 94.0 births per 1,000 women. Women in the age bracket of 20 to 34 years acount for 50.0% of all women with births.
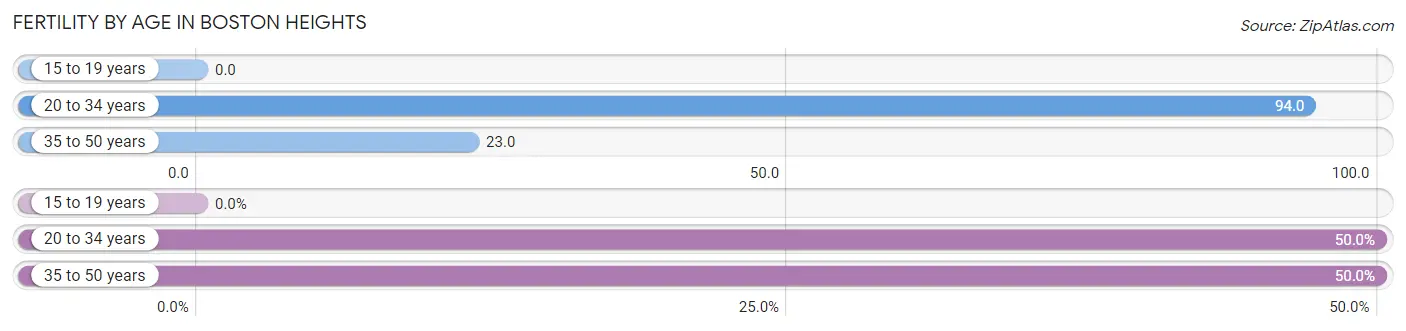
| Age Bracket | Women with Births | Births / 1,000 Women |
| 15 to 19 years | 0 (0.0%) | 0.0 |
| 20 to 34 years | 3 (50.0%) | 94.0 |
| 35 to 50 years | 3 (50.0%) | 23.0 |
| Total | 6 (100.0%) | 28.0 |
Fertility by Age by Marriage Status in Boston Heights
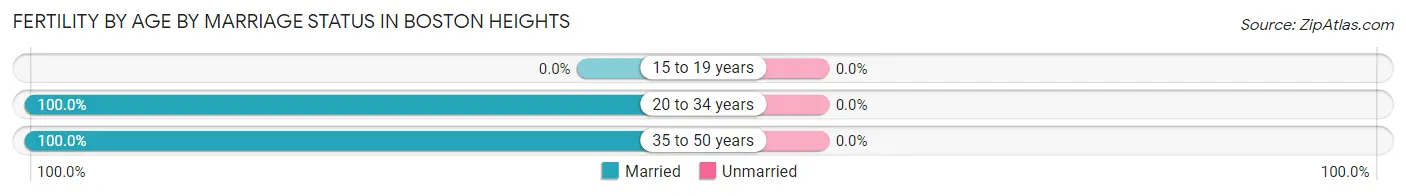
| Age Bracket | Married | Unmarried |
| 15 to 19 years | 0 (0.0%) | 0 (0.0%) |
| 20 to 34 years | 3 (100.0%) | 0 (0.0%) |
| 35 to 50 years | 3 (100.0%) | 0 (0.0%) |
| Total | 6 (100.0%) | 0 (0.0%) |
Fertility by Education in Boston Heights
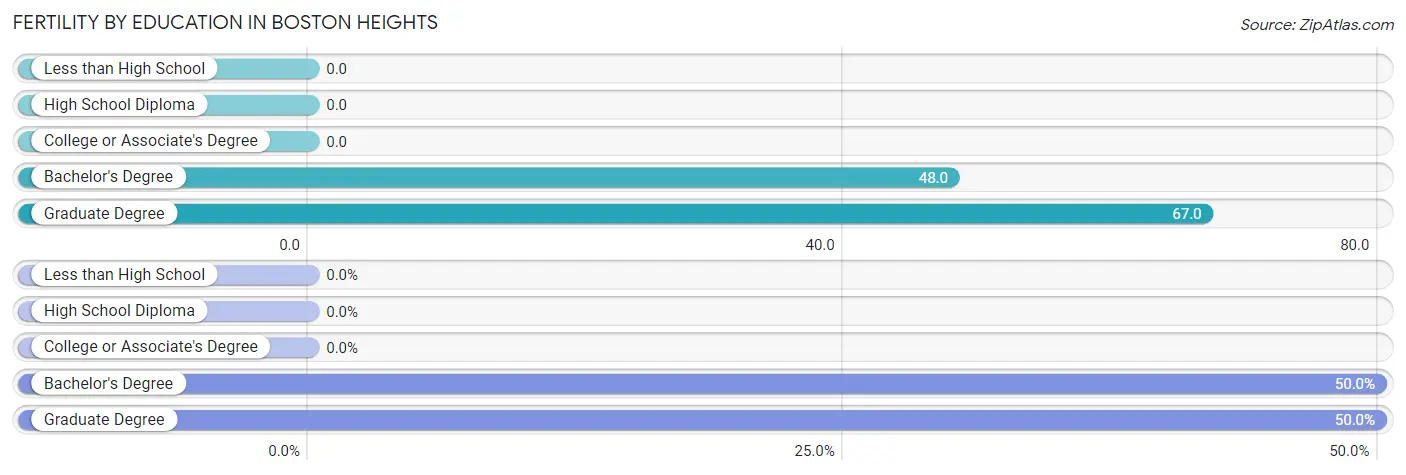
| Educational Attainment | Women with Births | Births / 1,000 Women |
| Less than High School | 0 (0.0%) | 0.0 |
| High School Diploma | 0 (0.0%) | 0.0 |
| College or Associate's Degree | 0 (0.0%) | 0.0 |
| Bachelor's Degree | 3 (50.0%) | 48.0 |
| Graduate Degree | 3 (50.0%) | 67.0 |
| Total | 6 (100.0%) | 28.0 |
Fertility by Education by Marriage Status in Boston Heights
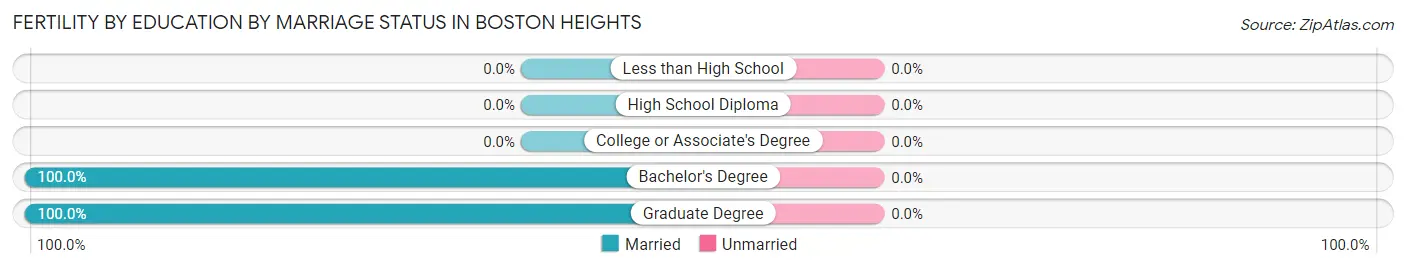
| Educational Attainment | Married | Unmarried |
| Less than High School | 0 (0.0%) | 0 (0.0%) |
| High School Diploma | 0 (0.0%) | 0 (0.0%) |
| College or Associate's Degree | 0 (0.0%) | 0 (0.0%) |
| Bachelor's Degree | 3 (100.0%) | 0 (0.0%) |
| Graduate Degree | 3 (100.0%) | 0 (0.0%) |
| Total | 6 (100.0%) | 0 (0.0%) |
Employment Characteristics in Boston Heights
Employment by Class of Employer in Boston Heights
Among the 567 employed individuals in Boston Heights, private company employees (394 | 69.5%), not-for-profit organizations (60 | 10.6%), and self-employed (incorporated) (46 | 8.1%) make up the most common classes of employment.
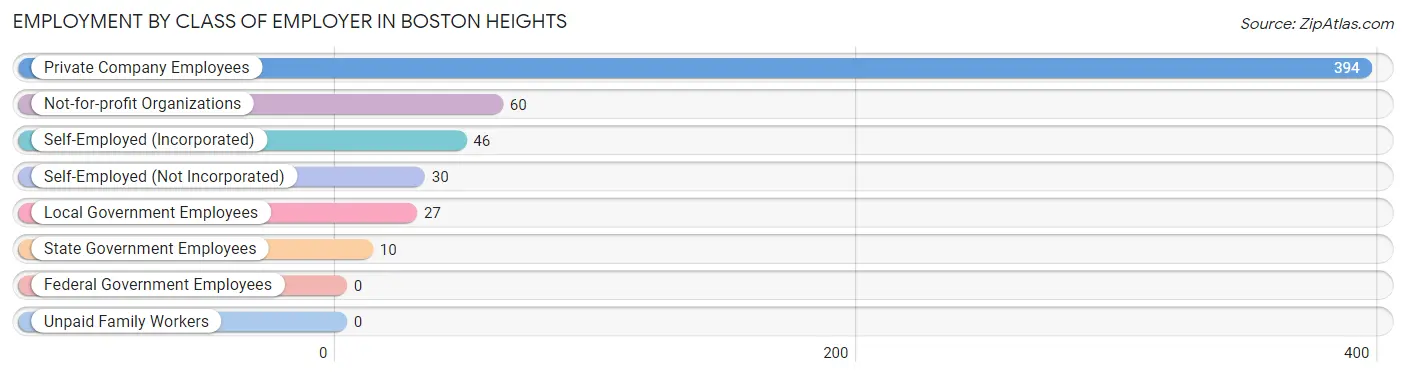
| Employer Class | # Employees | % Employees |
| Private Company Employees | 394 | 69.5% |
| Self-Employed (Incorporated) | 46 | 8.1% |
| Self-Employed (Not Incorporated) | 30 | 5.3% |
| Not-for-profit Organizations | 60 | 10.6% |
| Local Government Employees | 27 | 4.8% |
| State Government Employees | 10 | 1.8% |
| Federal Government Employees | 0 | 0.0% |
| Unpaid Family Workers | 0 | 0.0% |
| Total | 567 | 100.0% |
Employment Status by Age in Boston Heights
According to the labor force statistics for Boston Heights, out of the total population over 16 years of age (1,039), 59.0% or 613 individuals are in the labor force, with 4.6% or 28 of them unemployed. The age group with the highest labor force participation rate is 45 to 54 years, with 93.9% or 200 individuals in the labor force. Within the labor force, the 20 to 24 years age range has the highest percentage of unemployed individuals, with 11.8% or 4 of them being unemployed.
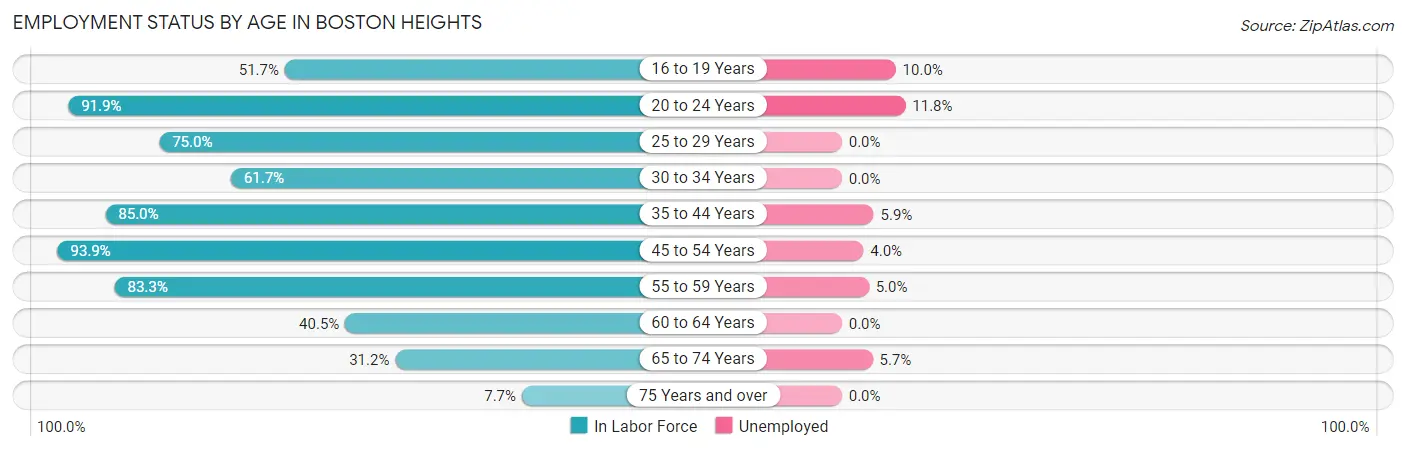
| Age Bracket | In Labor Force | Unemployed |
| 16 to 19 Years | 30 (51.7%) | 3 (10.0%) |
| 20 to 24 Years | 34 (91.9%) | 4 (11.8%) |
| 25 to 29 Years | 9 (75.0%) | 0 (0.0%) |
| 30 to 34 Years | 29 (61.7%) | 0 (0.0%) |
| 35 to 44 Years | 119 (85.0%) | 7 (5.9%) |
| 45 to 54 Years | 200 (93.9%) | 8 (4.0%) |
| 55 to 59 Years | 60 (83.3%) | 3 (5.0%) |
| 60 to 64 Years | 70 (40.5%) | 0 (0.0%) |
| 65 to 74 Years | 53 (31.2%) | 3 (5.7%) |
| 75 Years and over | 9 (7.7%) | 0 (0.0%) |
| Total | 613 (59.0%) | 28 (4.6%) |
Employment Status by Educational Attainment in Boston Heights
According to labor force statistics for Boston Heights, 74.1% of individuals (487) out of the total population between 25 and 64 years of age (657) are in the labor force, with 3.7% or 18 of them being unemployed. The group with the highest labor force participation rate are those with the educational attainment of bachelor's degree or higher, with 81.9% or 316 individuals in the labor force. Within the labor force, individuals with college / associate degree education have the highest percentage of unemployment, with 8.8% or 7 of them being unemployed.
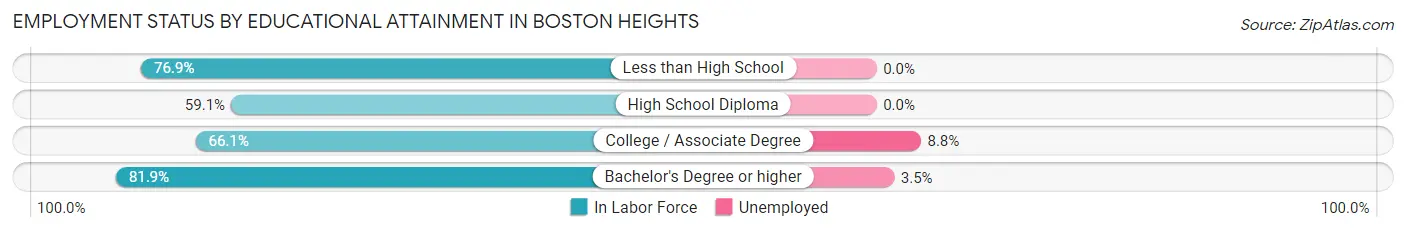
| Educational Attainment | In Labor Force | Unemployed |
| Less than High School | 10 (76.9%) | 0 (0.0%) |
| High School Diploma | 81 (59.1%) | 0 (0.0%) |
| College / Associate Degree | 80 (66.1%) | 11 (8.8%) |
| Bachelor's Degree or higher | 316 (81.9%) | 14 (3.5%) |
| Total | 487 (74.1%) | 24 (3.7%) |
Employment Occupations by Sex in Boston Heights
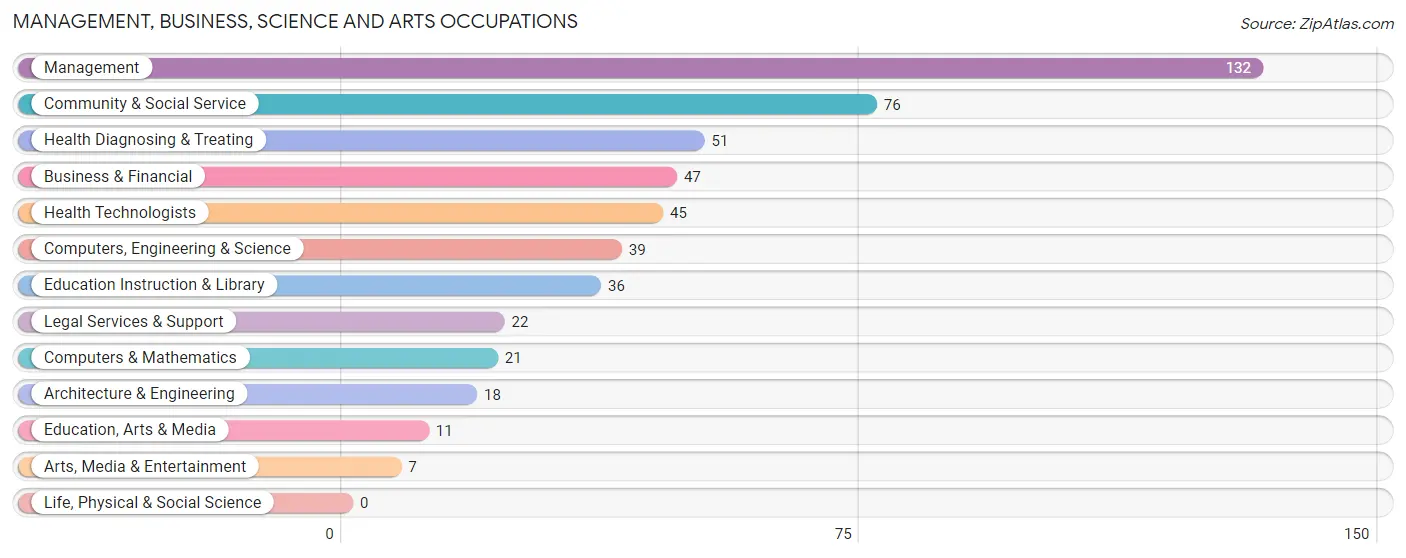
Management, Business, Science and Arts Occupations
The most common Management, Business, Science and Arts occupations in Boston Heights are Management (132 | 22.6%), Community & Social Service (76 | 13.0%), Health Diagnosing & Treating (51 | 8.7%), Business & Financial (47 | 8.0%), and Health Technologists (45 | 7.7%).
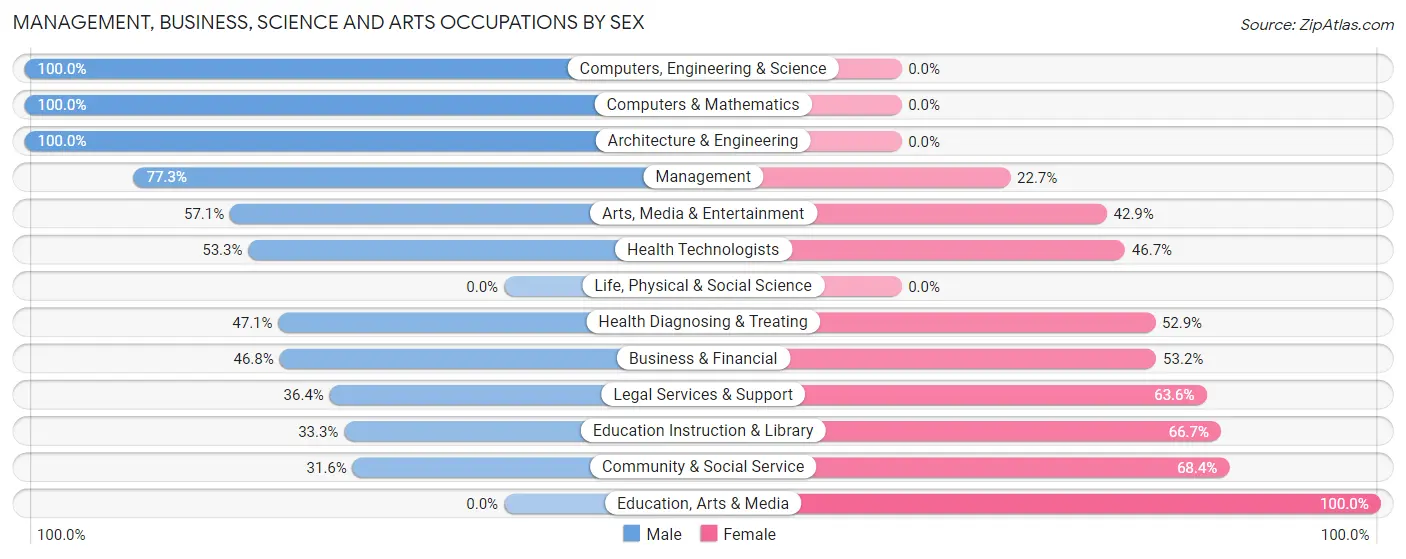
Management, Business, Science and Arts Occupations by Sex
Within the Management, Business, Science and Arts occupations in Boston Heights, the most male-oriented occupations are Computers, Engineering & Science (100.0%), Computers & Mathematics (100.0%), and Architecture & Engineering (100.0%), while the most female-oriented occupations are Education, Arts & Media (100.0%), Community & Social Service (68.4%), and Education Instruction & Library (66.7%).
| Occupation | Male | Female |
| Management | 102 (77.3%) | 30 (22.7%) |
| Business & Financial | 22 (46.8%) | 25 (53.2%) |
| Computers, Engineering & Science | 39 (100.0%) | 0 (0.0%) |
| Computers & Mathematics | 21 (100.0%) | 0 (0.0%) |
| Architecture & Engineering | 18 (100.0%) | 0 (0.0%) |
| Life, Physical & Social Science | 0 (0.0%) | 0 (0.0%) |
| Community & Social Service | 24 (31.6%) | 52 (68.4%) |
| Education, Arts & Media | 0 (0.0%) | 11 (100.0%) |
| Legal Services & Support | 8 (36.4%) | 14 (63.6%) |
| Education Instruction & Library | 12 (33.3%) | 24 (66.7%) |
| Arts, Media & Entertainment | 4 (57.1%) | 3 (42.9%) |
| Health Diagnosing & Treating | 24 (47.1%) | 27 (52.9%) |
| Health Technologists | 24 (53.3%) | 21 (46.7%) |
| Total (Category) | 211 (61.2%) | 134 (38.8%) |
| Total (Overall) | 352 (60.2%) | 233 (39.8%) |
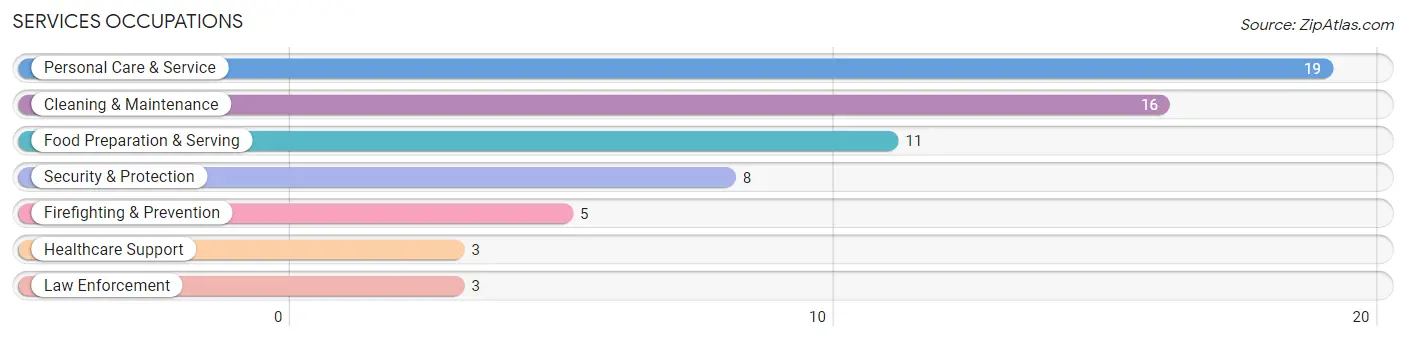
Services Occupations
The most common Services occupations in Boston Heights are Personal Care & Service (19 | 3.3%), Cleaning & Maintenance (16 | 2.7%), Food Preparation & Serving (11 | 1.9%), Security & Protection (8 | 1.4%), and Firefighting & Prevention (5 | 0.9%).
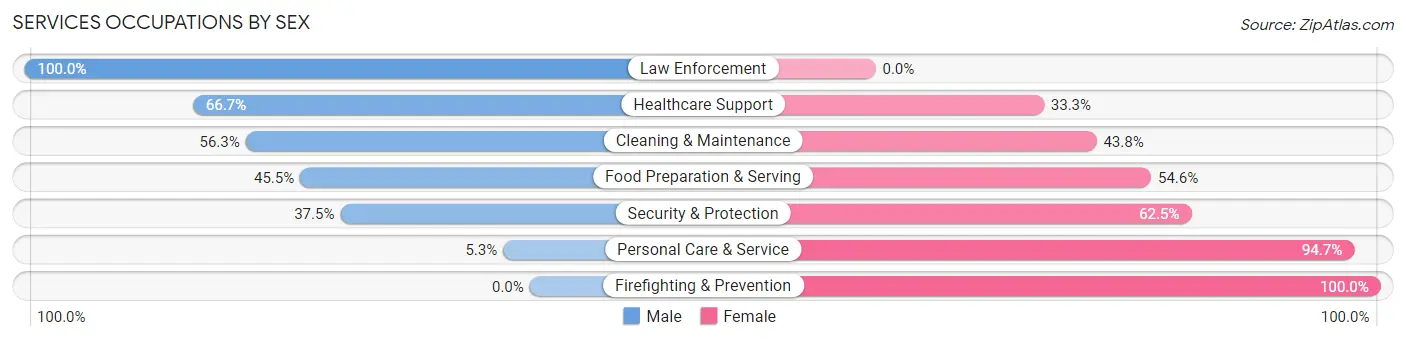
Services Occupations by Sex
Within the Services occupations in Boston Heights, the most male-oriented occupations are Law Enforcement (100.0%), Healthcare Support (66.7%), and Cleaning & Maintenance (56.2%), while the most female-oriented occupations are Firefighting & Prevention (100.0%), Personal Care & Service (94.7%), and Security & Protection (62.5%).
| Occupation | Male | Female |
| Healthcare Support | 2 (66.7%) | 1 (33.3%) |
| Security & Protection | 3 (37.5%) | 5 (62.5%) |
| Firefighting & Prevention | 0 (0.0%) | 5 (100.0%) |
| Law Enforcement | 3 (100.0%) | 0 (0.0%) |
| Food Preparation & Serving | 5 (45.5%) | 6 (54.5%) |
| Cleaning & Maintenance | 9 (56.2%) | 7 (43.8%) |
| Personal Care & Service | 1 (5.3%) | 18 (94.7%) |
| Total (Category) | 20 (35.1%) | 37 (64.9%) |
| Total (Overall) | 352 (60.2%) | 233 (39.8%) |
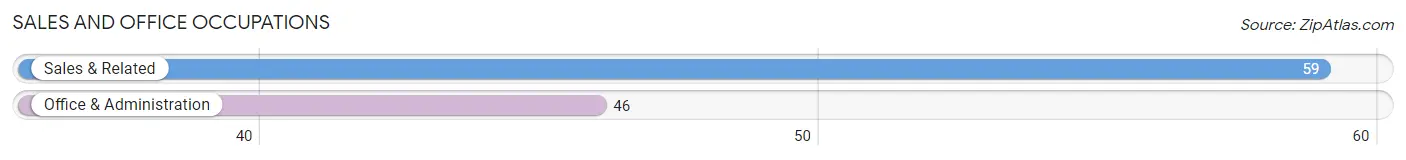
Sales and Office Occupations
The most common Sales and Office occupations in Boston Heights are Sales & Related (59 | 10.1%), and Office & Administration (46 | 7.9%).
Sales and Office Occupations by Sex
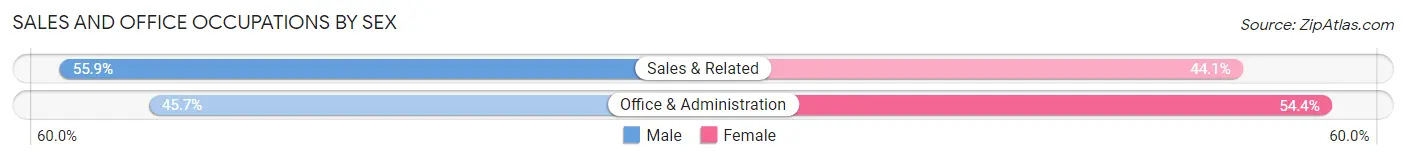
| Occupation | Male | Female |
| Sales & Related | 33 (55.9%) | 26 (44.1%) |
| Office & Administration | 21 (45.7%) | 25 (54.3%) |
| Total (Category) | 54 (51.4%) | 51 (48.6%) |
| Total (Overall) | 352 (60.2%) | 233 (39.8%) |
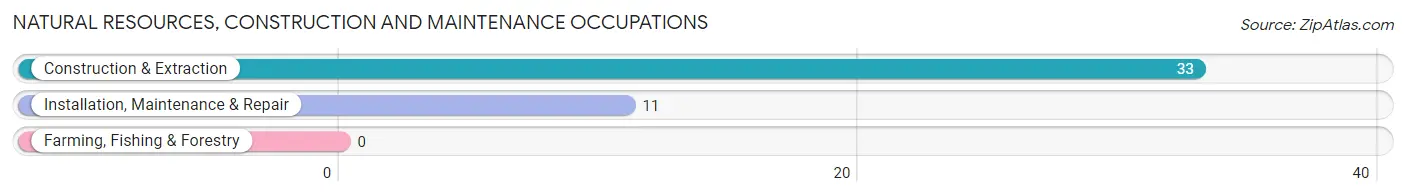
Natural Resources, Construction and Maintenance Occupations
The most common Natural Resources, Construction and Maintenance occupations in Boston Heights are Construction & Extraction (33 | 5.6%), and Installation, Maintenance & Repair (11 | 1.9%).
Natural Resources, Construction and Maintenance Occupations by Sex
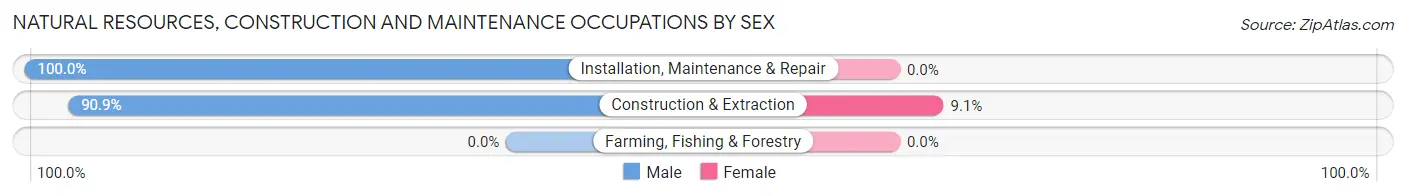
| Occupation | Male | Female |
| Farming, Fishing & Forestry | 0 (0.0%) | 0 (0.0%) |
| Construction & Extraction | 30 (90.9%) | 3 (9.1%) |
| Installation, Maintenance & Repair | 11 (100.0%) | 0 (0.0%) |
| Total (Category) | 41 (93.2%) | 3 (6.8%) |
| Total (Overall) | 352 (60.2%) | 233 (39.8%) |
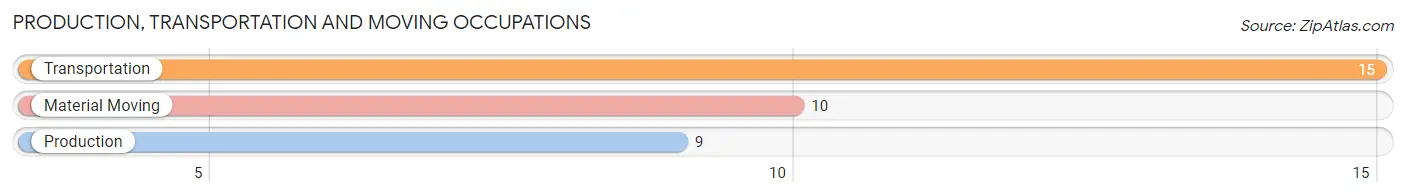
Production, Transportation and Moving Occupations
The most common Production, Transportation and Moving occupations in Boston Heights are Transportation (15 | 2.6%), Material Moving (10 | 1.7%), and Production (9 | 1.5%).
Production, Transportation and Moving Occupations by Sex
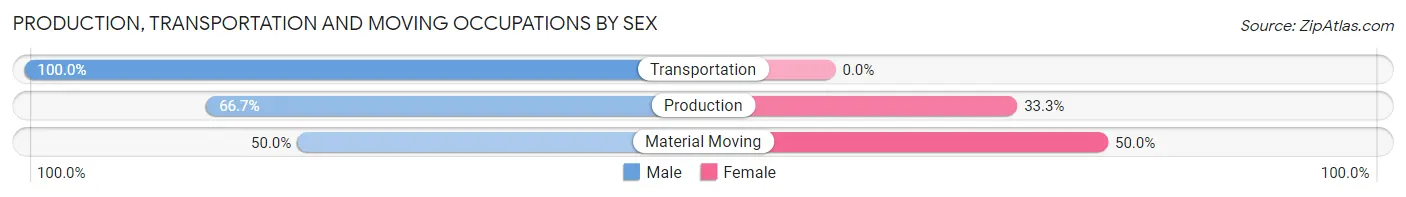
| Occupation | Male | Female |
| Production | 6 (66.7%) | 3 (33.3%) |
| Transportation | 15 (100.0%) | 0 (0.0%) |
| Material Moving | 5 (50.0%) | 5 (50.0%) |
| Total (Category) | 26 (76.5%) | 8 (23.5%) |
| Total (Overall) | 352 (60.2%) | 233 (39.8%) |
Employment Industries by Sex in Boston Heights
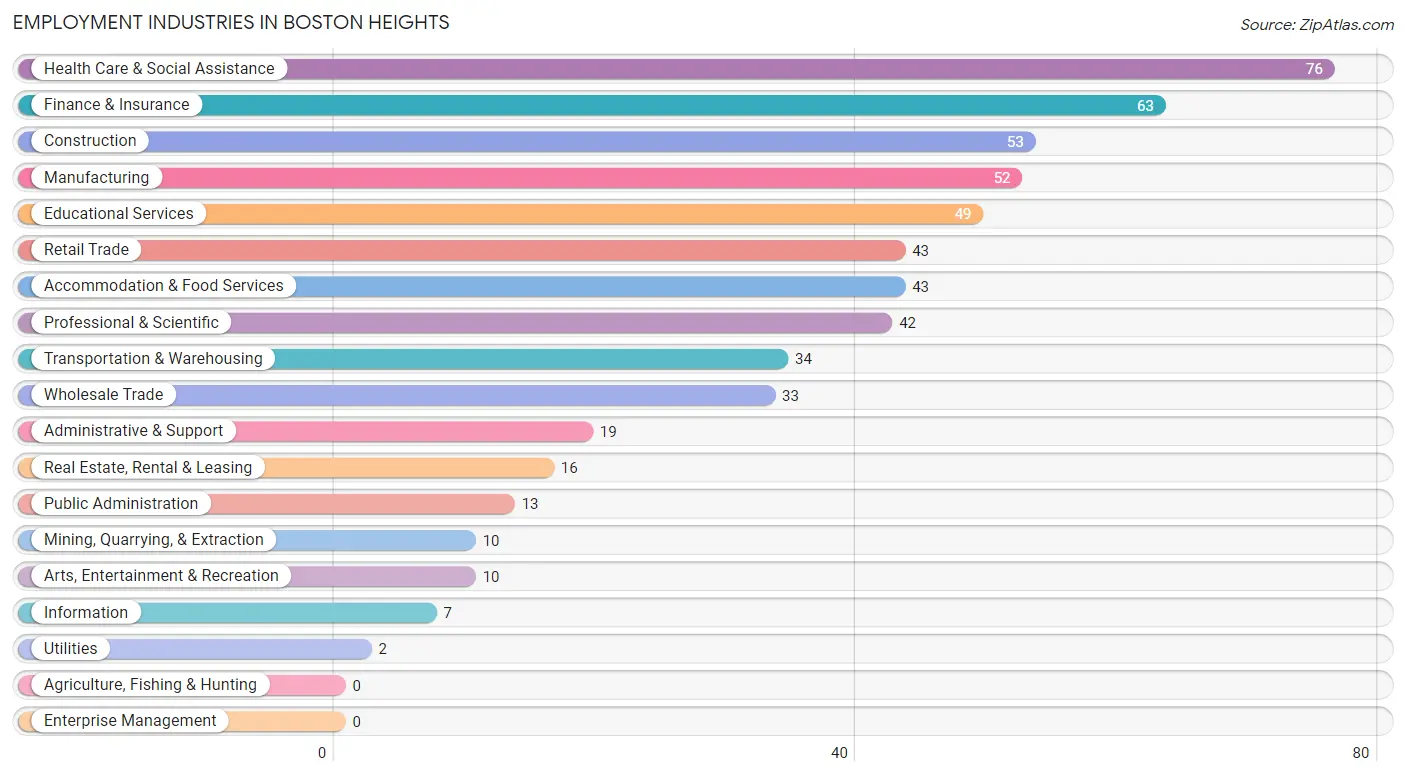
Employment Industries in Boston Heights
The major employment industries in Boston Heights include Health Care & Social Assistance (76 | 13.0%), Finance & Insurance (63 | 10.8%), Construction (53 | 9.1%), Manufacturing (52 | 8.9%), and Educational Services (49 | 8.4%).
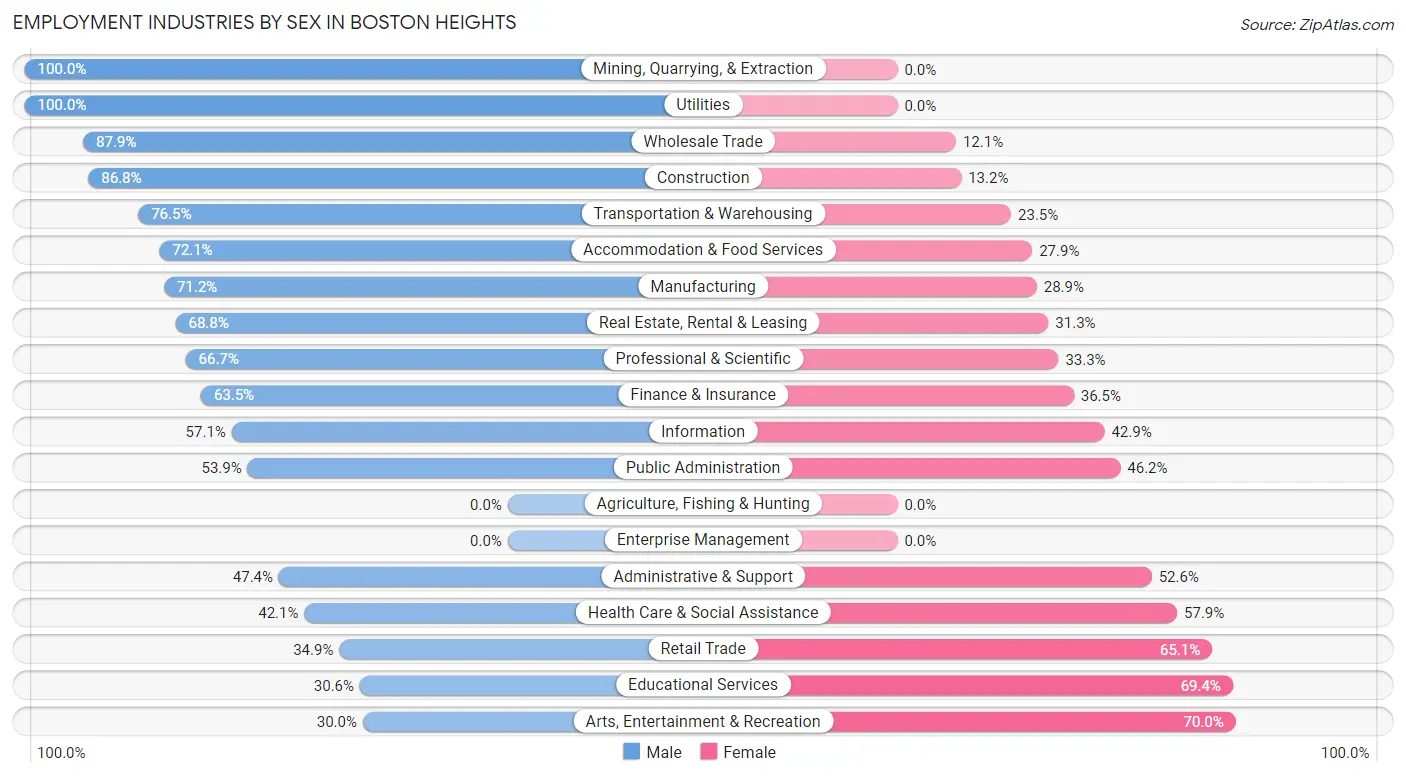
Employment Industries by Sex in Boston Heights
The Boston Heights industries that see more men than women are Mining, Quarrying, & Extraction (100.0%), Utilities (100.0%), and Wholesale Trade (87.9%), whereas the industries that tend to have a higher number of women are Arts, Entertainment & Recreation (70.0%), Educational Services (69.4%), and Retail Trade (65.1%).
| Industry | Male | Female |
| Agriculture, Fishing & Hunting | 0 (0.0%) | 0 (0.0%) |
| Mining, Quarrying, & Extraction | 10 (100.0%) | 0 (0.0%) |
| Construction | 46 (86.8%) | 7 (13.2%) |
| Manufacturing | 37 (71.2%) | 15 (28.8%) |
| Wholesale Trade | 29 (87.9%) | 4 (12.1%) |
| Retail Trade | 15 (34.9%) | 28 (65.1%) |
| Transportation & Warehousing | 26 (76.5%) | 8 (23.5%) |
| Utilities | 2 (100.0%) | 0 (0.0%) |
| Information | 4 (57.1%) | 3 (42.9%) |
| Finance & Insurance | 40 (63.5%) | 23 (36.5%) |
| Real Estate, Rental & Leasing | 11 (68.8%) | 5 (31.2%) |
| Professional & Scientific | 28 (66.7%) | 14 (33.3%) |
| Enterprise Management | 0 (0.0%) | 0 (0.0%) |
| Administrative & Support | 9 (47.4%) | 10 (52.6%) |
| Educational Services | 15 (30.6%) | 34 (69.4%) |
| Health Care & Social Assistance | 32 (42.1%) | 44 (57.9%) |
| Arts, Entertainment & Recreation | 3 (30.0%) | 7 (70.0%) |
| Accommodation & Food Services | 31 (72.1%) | 12 (27.9%) |
| Public Administration | 7 (53.8%) | 6 (46.2%) |
| Total | 352 (60.2%) | 233 (39.8%) |
Education in Boston Heights
School Enrollment in Boston Heights
The most common levels of schooling among the 216 students in Boston Heights are high school (63 | 29.2%), elementary school (51 | 23.6%), and middle school (40 | 18.5%).
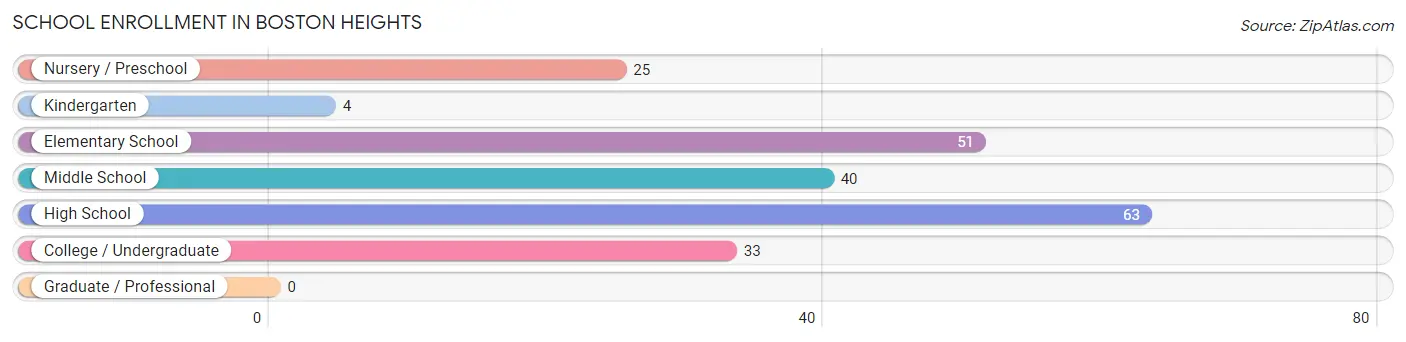
| School Level | # Students | % Students |
| Nursery / Preschool | 25 | 11.6% |
| Kindergarten | 4 | 1.8% |
| Elementary School | 51 | 23.6% |
| Middle School | 40 | 18.5% |
| High School | 63 | 29.2% |
| College / Undergraduate | 33 | 15.3% |
| Graduate / Professional | 0 | 0.0% |
| Total | 216 | 100.0% |
School Enrollment by Age by Funding Source in Boston Heights
Out of a total of 216 students who are enrolled in schools in Boston Heights, 74 (34.3%) attend a private institution, while the remaining 142 (65.7%) are enrolled in public schools. The age group of 3 to 4 year olds has the highest likelihood of being enrolled in private schools, with 14 (66.7% in the age bracket) enrolled. Conversely, the age group of 35 years and over has the lowest likelihood of being enrolled in a private school, with 3 (100.0% in the age bracket) attending a public institution.
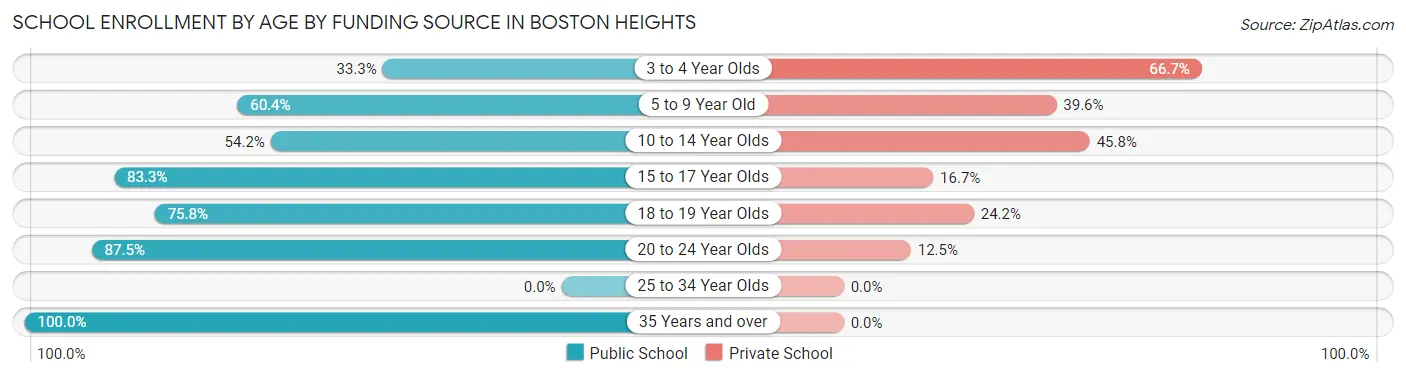
| Age Bracket | Public School | Private School |
| 3 to 4 Year Olds | 7 (33.3%) | 14 (66.7%) |
| 5 to 9 Year Old | 32 (60.4%) | 21 (39.6%) |
| 10 to 14 Year Olds | 26 (54.2%) | 22 (45.8%) |
| 15 to 17 Year Olds | 35 (83.3%) | 7 (16.7%) |
| 18 to 19 Year Olds | 25 (75.8%) | 8 (24.2%) |
| 20 to 24 Year Olds | 14 (87.5%) | 2 (12.5%) |
| 25 to 34 Year Olds | 0 (0.0%) | 0 (0.0%) |
| 35 Years and over | 3 (100.0%) | 0 (0.0%) |
| Total | 142 (65.7%) | 74 (34.3%) |
Educational Attainment by Field of Study in Boston Heights
Business (166 | 31.3%), science & technology (63 | 11.9%), education (47 | 8.9%), bio, nature & agricultural (40 | 7.5%), and engineering (36 | 6.8%) are the most common fields of study among 530 individuals in Boston Heights who have obtained a bachelor's degree or higher.

| Field of Study | # Graduates | % Graduates |
| Computers & Mathematics | 11 | 2.1% |
| Bio, Nature & Agricultural | 40 | 7.5% |
| Physical & Health Sciences | 25 | 4.7% |
| Psychology | 9 | 1.7% |
| Social Sciences | 13 | 2.5% |
| Engineering | 36 | 6.8% |
| Multidisciplinary Studies | 0 | 0.0% |
| Science & Technology | 63 | 11.9% |
| Business | 166 | 31.3% |
| Education | 47 | 8.9% |
| Literature & Languages | 33 | 6.2% |
| Liberal Arts & History | 21 | 4.0% |
| Visual & Performing Arts | 23 | 4.3% |
| Communications | 31 | 5.9% |
| Arts & Humanities | 12 | 2.3% |
| Total | 530 | 100.0% |
Transportation & Commute in Boston Heights
Vehicle Availability by Sex in Boston Heights
The most prevalent vehicle ownership categories in Boston Heights are males with 2 vehicles (181, accounting for 52.0%) and females with 2 vehicles (94, making up 82.7%).
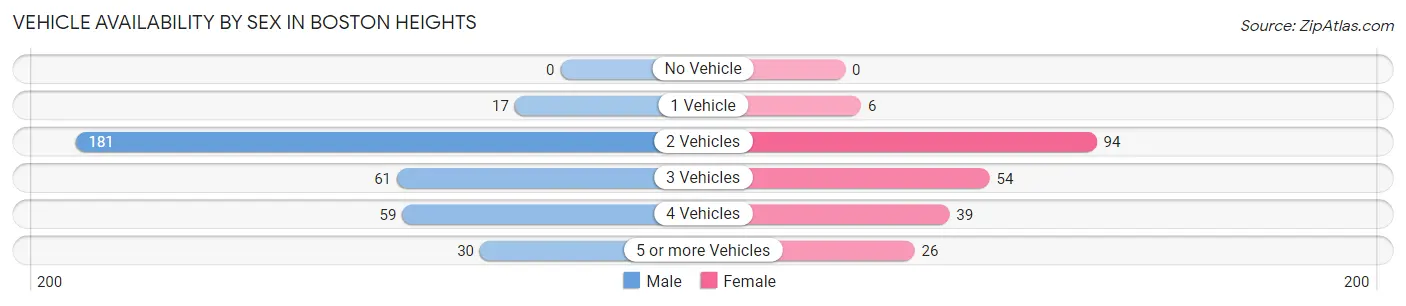
| Vehicles Available | Male | Female |
| No Vehicle | 0 (0.0%) | 0 (0.0%) |
| 1 Vehicle | 17 (4.9%) | 6 (2.7%) |
| 2 Vehicles | 181 (52.0%) | 94 (42.9%) |
| 3 Vehicles | 61 (17.5%) | 54 (24.7%) |
| 4 Vehicles | 59 (17.0%) | 39 (17.8%) |
| 5 or more Vehicles | 30 (8.6%) | 26 (11.9%) |
| Total | 348 (100.0%) | 219 (100.0%) |
Commute Time in Boston Heights
The most frequently occuring commute durations in Boston Heights are 10 to 14 minutes (111 commuters, 23.4%), 20 to 24 minutes (79 commuters, 16.6%), and 30 to 34 minutes (65 commuters, 13.7%).
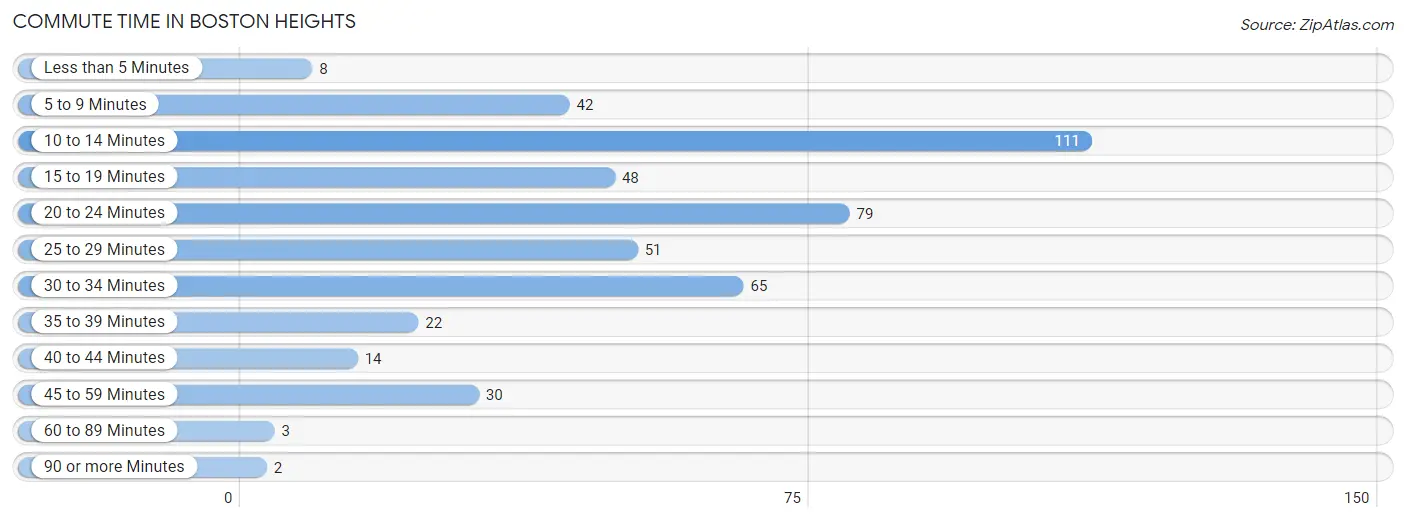
| Commute Time | # Commuters | % Commuters |
| Less than 5 Minutes | 8 | 1.7% |
| 5 to 9 Minutes | 42 | 8.8% |
| 10 to 14 Minutes | 111 | 23.4% |
| 15 to 19 Minutes | 48 | 10.1% |
| 20 to 24 Minutes | 79 | 16.6% |
| 25 to 29 Minutes | 51 | 10.7% |
| 30 to 34 Minutes | 65 | 13.7% |
| 35 to 39 Minutes | 22 | 4.6% |
| 40 to 44 Minutes | 14 | 2.9% |
| 45 to 59 Minutes | 30 | 6.3% |
| 60 to 89 Minutes | 3 | 0.6% |
| 90 or more Minutes | 2 | 0.4% |
Commute Time by Sex in Boston Heights
The most common commute times in Boston Heights are 10 to 14 minutes (62 commuters, 20.9%) for males and 10 to 14 minutes (49 commuters, 27.4%) for females.
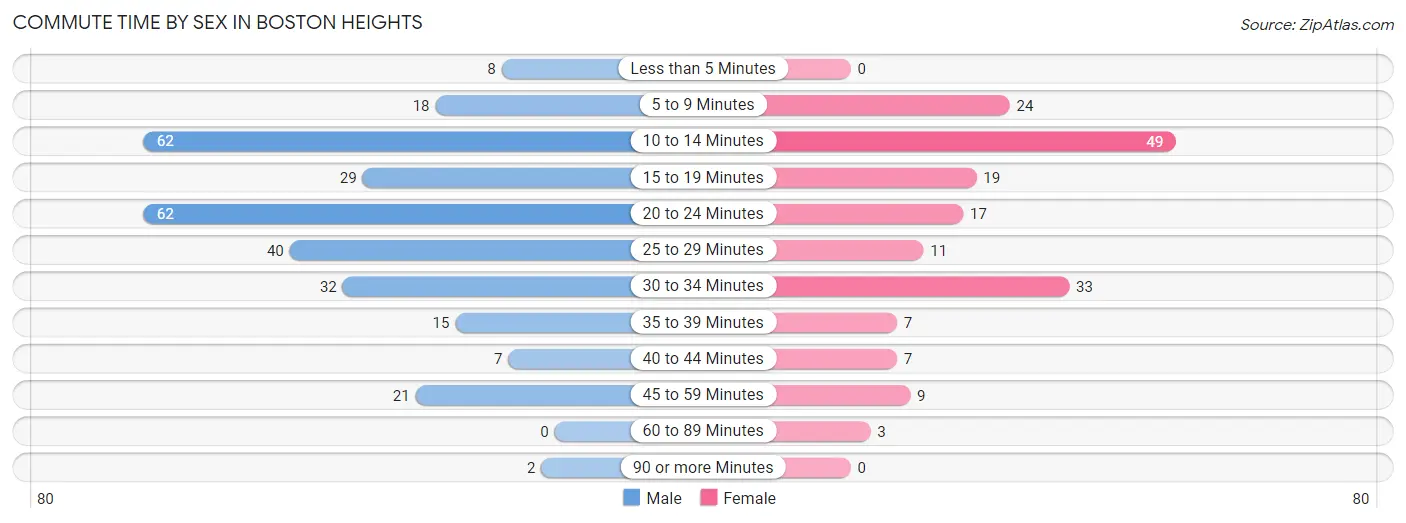
| Commute Time | Male | Female |
| Less than 5 Minutes | 8 (2.7%) | 0 (0.0%) |
| 5 to 9 Minutes | 18 (6.1%) | 24 (13.4%) |
| 10 to 14 Minutes | 62 (20.9%) | 49 (27.4%) |
| 15 to 19 Minutes | 29 (9.8%) | 19 (10.6%) |
| 20 to 24 Minutes | 62 (20.9%) | 17 (9.5%) |
| 25 to 29 Minutes | 40 (13.5%) | 11 (6.1%) |
| 30 to 34 Minutes | 32 (10.8%) | 33 (18.4%) |
| 35 to 39 Minutes | 15 (5.1%) | 7 (3.9%) |
| 40 to 44 Minutes | 7 (2.4%) | 7 (3.9%) |
| 45 to 59 Minutes | 21 (7.1%) | 9 (5.0%) |
| 60 to 89 Minutes | 0 (0.0%) | 3 (1.7%) |
| 90 or more Minutes | 2 (0.7%) | 0 (0.0%) |
Time of Departure to Work by Sex in Boston Heights
The most frequent times of departure to work in Boston Heights are 8:00 AM to 8:29 AM (60, 20.3%) for males and 7:30 AM to 7:59 AM (28, 15.6%) for females.
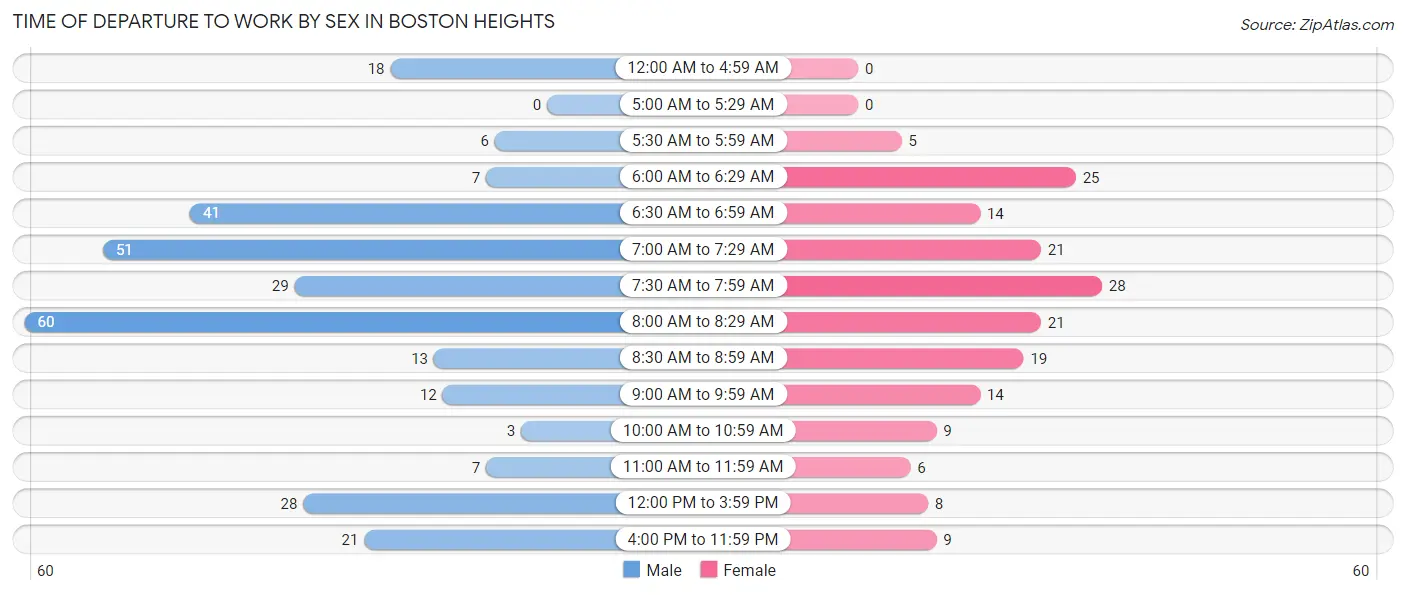
| Time of Departure | Male | Female |
| 12:00 AM to 4:59 AM | 18 (6.1%) | 0 (0.0%) |
| 5:00 AM to 5:29 AM | 0 (0.0%) | 0 (0.0%) |
| 5:30 AM to 5:59 AM | 6 (2.0%) | 5 (2.8%) |
| 6:00 AM to 6:29 AM | 7 (2.4%) | 25 (14.0%) |
| 6:30 AM to 6:59 AM | 41 (13.9%) | 14 (7.8%) |
| 7:00 AM to 7:29 AM | 51 (17.2%) | 21 (11.7%) |
| 7:30 AM to 7:59 AM | 29 (9.8%) | 28 (15.6%) |
| 8:00 AM to 8:29 AM | 60 (20.3%) | 21 (11.7%) |
| 8:30 AM to 8:59 AM | 13 (4.4%) | 19 (10.6%) |
| 9:00 AM to 9:59 AM | 12 (4.1%) | 14 (7.8%) |
| 10:00 AM to 10:59 AM | 3 (1.0%) | 9 (5.0%) |
| 11:00 AM to 11:59 AM | 7 (2.4%) | 6 (3.4%) |
| 12:00 PM to 3:59 PM | 28 (9.5%) | 8 (4.5%) |
| 4:00 PM to 11:59 PM | 21 (7.1%) | 9 (5.0%) |
| Total | 296 (100.0%) | 179 (100.0%) |
Housing Occupancy in Boston Heights
Occupancy by Ownership in Boston Heights
Of the total 520 dwellings in Boston Heights, owner-occupied units account for 482 (92.7%), while renter-occupied units make up 38 (7.3%).
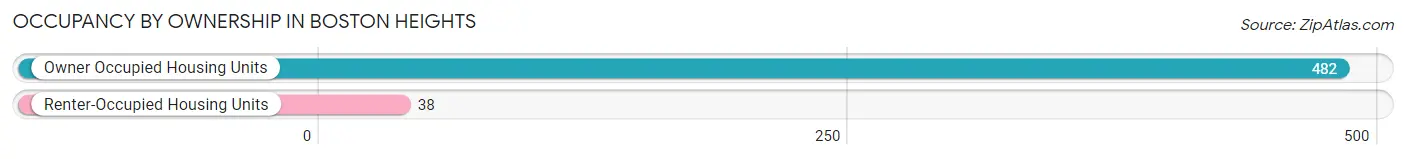
| Occupancy | # Housing Units | % Housing Units |
| Owner Occupied Housing Units | 482 | 92.7% |
| Renter-Occupied Housing Units | 38 | 7.3% |
| Total Occupied Housing Units | 520 | 100.0% |
Occupancy by Household Size in Boston Heights
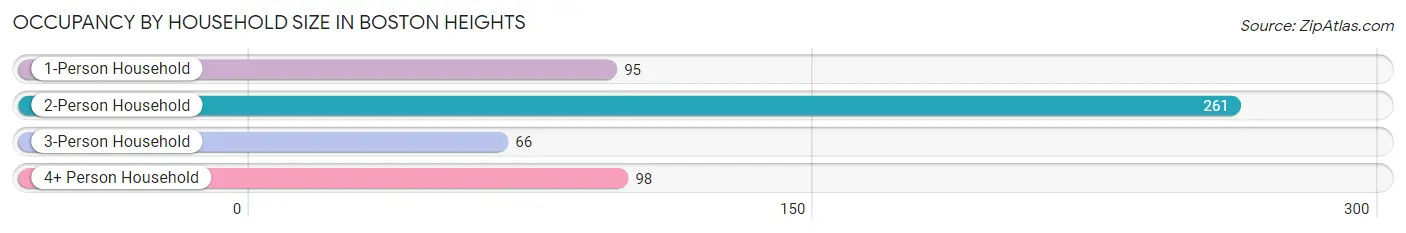
| Household Size | # Housing Units | % Housing Units |
| 1-Person Household | 95 | 18.3% |
| 2-Person Household | 261 | 50.2% |
| 3-Person Household | 66 | 12.7% |
| 4+ Person Household | 98 | 18.9% |
| Total Housing Units | 520 | 100.0% |
Occupancy by Ownership by Household Size in Boston Heights
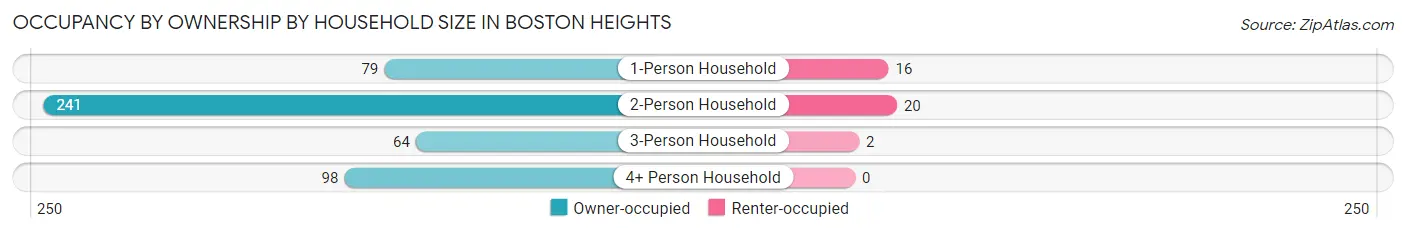
| Household Size | Owner-occupied | Renter-occupied |
| 1-Person Household | 79 (83.2%) | 16 (16.8%) |
| 2-Person Household | 241 (92.3%) | 20 (7.7%) |
| 3-Person Household | 64 (97.0%) | 2 (3.0%) |
| 4+ Person Household | 98 (100.0%) | 0 (0.0%) |
| Total Housing Units | 482 (92.7%) | 38 (7.3%) |
Occupancy by Educational Attainment in Boston Heights
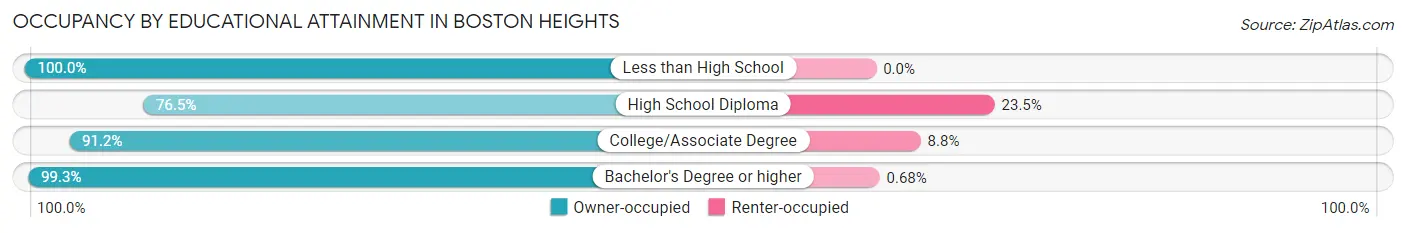
| Household Size | Owner-occupied | Renter-occupied |
| Less than High School | 11 (100.0%) | 0 (0.0%) |
| High School Diploma | 88 (76.5%) | 27 (23.5%) |
| College/Associate Degree | 93 (91.2%) | 9 (8.8%) |
| Bachelor's Degree or higher | 290 (99.3%) | 2 (0.7%) |
Occupancy by Age of Householder in Boston Heights
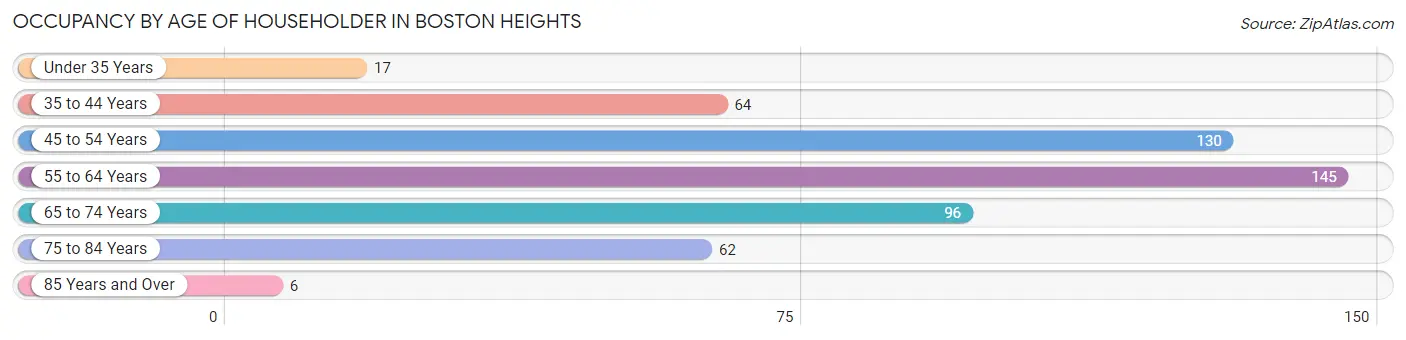
| Age Bracket | # Households | % Households |
| Under 35 Years | 17 | 3.3% |
| 35 to 44 Years | 64 | 12.3% |
| 45 to 54 Years | 130 | 25.0% |
| 55 to 64 Years | 145 | 27.9% |
| 65 to 74 Years | 96 | 18.5% |
| 75 to 84 Years | 62 | 11.9% |
| 85 Years and Over | 6 | 1.1% |
| Total | 520 | 100.0% |
Housing Finances in Boston Heights
Median Income by Occupancy in Boston Heights
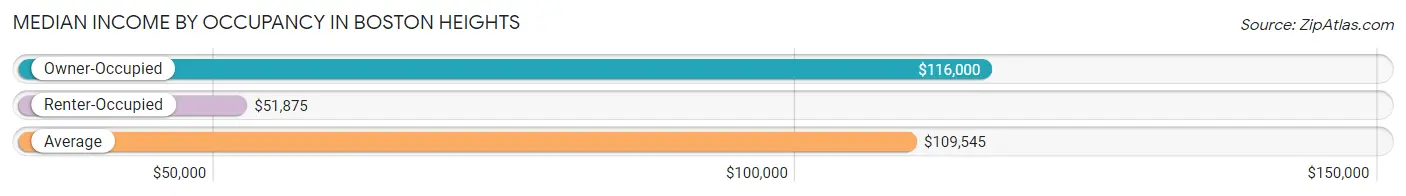
| Occupancy Type | # Households | Median Income |
| Owner-Occupied | 482 (92.7%) | $116,000 |
| Renter-Occupied | 38 (7.3%) | $51,875 |
| Average | 520 (100.0%) | $109,545 |
Occupancy by Householder Income Bracket in Boston Heights
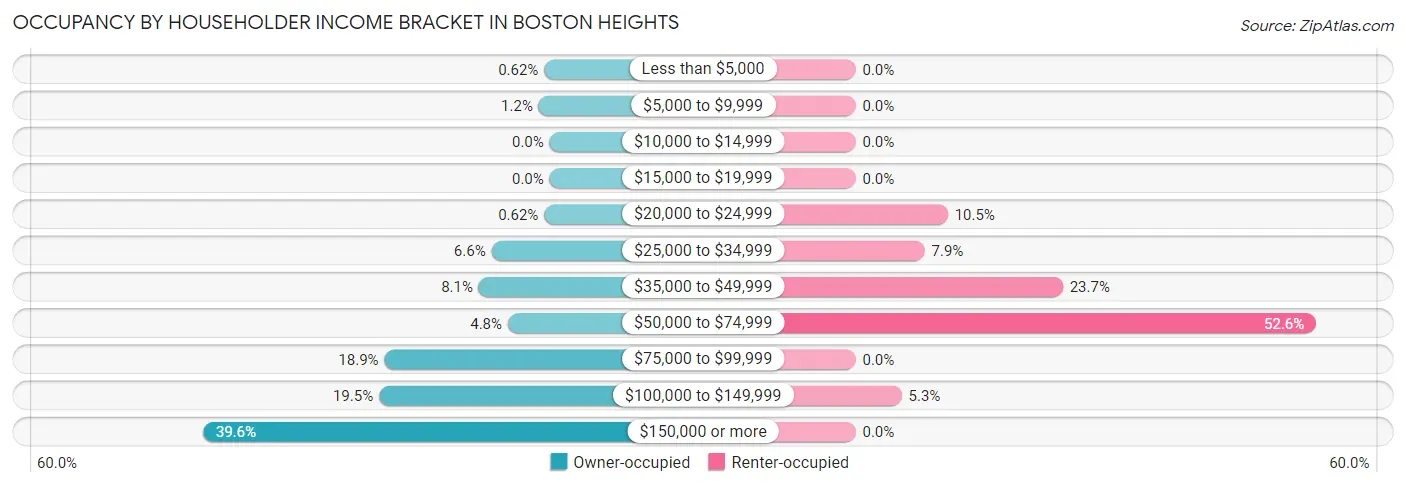
| Income Bracket | Owner-occupied | Renter-occupied |
| Less than $5,000 | 3 (0.6%) | 0 (0.0%) |
| $5,000 to $9,999 | 6 (1.2%) | 0 (0.0%) |
| $10,000 to $14,999 | 0 (0.0%) | 0 (0.0%) |
| $15,000 to $19,999 | 0 (0.0%) | 0 (0.0%) |
| $20,000 to $24,999 | 3 (0.6%) | 4 (10.5%) |
| $25,000 to $34,999 | 32 (6.6%) | 3 (7.9%) |
| $35,000 to $49,999 | 39 (8.1%) | 9 (23.7%) |
| $50,000 to $74,999 | 23 (4.8%) | 20 (52.6%) |
| $75,000 to $99,999 | 91 (18.9%) | 0 (0.0%) |
| $100,000 to $149,999 | 94 (19.5%) | 2 (5.3%) |
| $150,000 or more | 191 (39.6%) | 0 (0.0%) |
| Total | 482 (100.0%) | 38 (100.0%) |
Monthly Housing Cost Tiers in Boston Heights
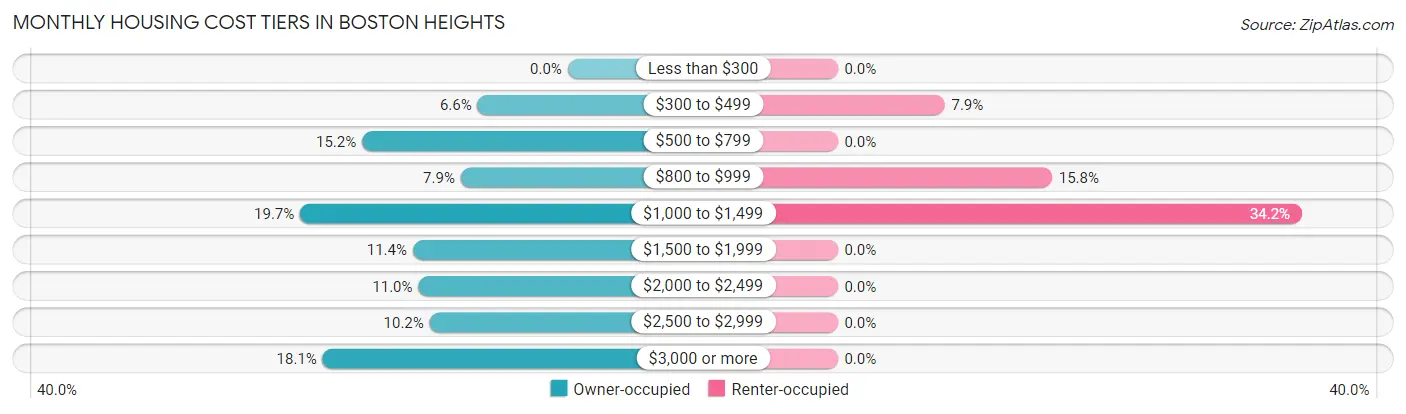
| Monthly Cost | Owner-occupied | Renter-occupied |
| Less than $300 | 0 (0.0%) | 0 (0.0%) |
| $300 to $499 | 32 (6.6%) | 3 (7.9%) |
| $500 to $799 | 73 (15.1%) | 0 (0.0%) |
| $800 to $999 | 38 (7.9%) | 6 (15.8%) |
| $1,000 to $1,499 | 95 (19.7%) | 13 (34.2%) |
| $1,500 to $1,999 | 55 (11.4%) | 0 (0.0%) |
| $2,000 to $2,499 | 53 (11.0%) | 0 (0.0%) |
| $2,500 to $2,999 | 49 (10.2%) | 0 (0.0%) |
| $3,000 or more | 87 (18.0%) | 0 (0.0%) |
| Total | 482 (100.0%) | 38 (100.0%) |
Physical Housing Characteristics in Boston Heights
Housing Structures in Boston Heights
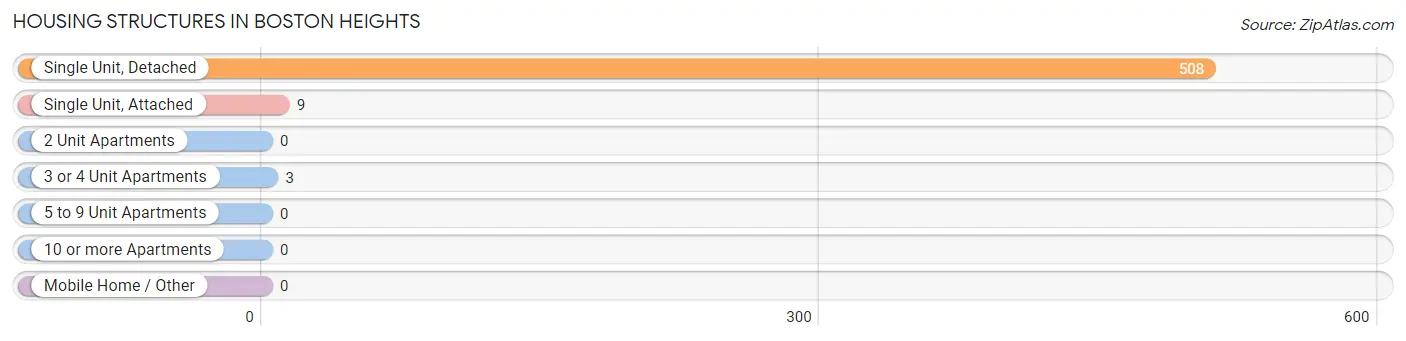
| Structure Type | # Housing Units | % Housing Units |
| Single Unit, Detached | 508 | 97.7% |
| Single Unit, Attached | 9 | 1.7% |
| 2 Unit Apartments | 0 | 0.0% |
| 3 or 4 Unit Apartments | 3 | 0.6% |
| 5 to 9 Unit Apartments | 0 | 0.0% |
| 10 or more Apartments | 0 | 0.0% |
| Mobile Home / Other | 0 | 0.0% |
| Total | 520 | 100.0% |
Housing Structures by Occupancy in Boston Heights
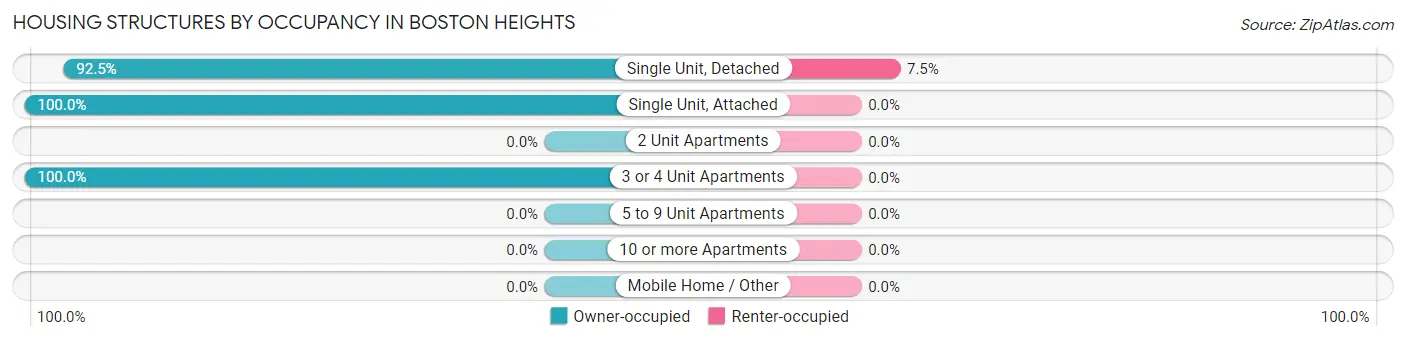
| Structure Type | Owner-occupied | Renter-occupied |
| Single Unit, Detached | 470 (92.5%) | 38 (7.5%) |
| Single Unit, Attached | 9 (100.0%) | 0 (0.0%) |
| 2 Unit Apartments | 0 (0.0%) | 0 (0.0%) |
| 3 or 4 Unit Apartments | 3 (100.0%) | 0 (0.0%) |
| 5 to 9 Unit Apartments | 0 (0.0%) | 0 (0.0%) |
| 10 or more Apartments | 0 (0.0%) | 0 (0.0%) |
| Mobile Home / Other | 0 (0.0%) | 0 (0.0%) |
| Total | 482 (92.7%) | 38 (7.3%) |
Housing Structures by Number of Rooms in Boston Heights
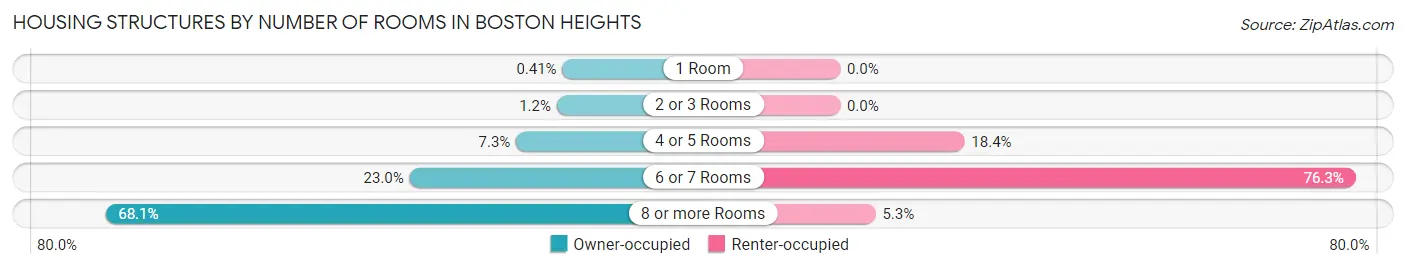
| Number of Rooms | Owner-occupied | Renter-occupied |
| 1 Room | 2 (0.4%) | 0 (0.0%) |
| 2 or 3 Rooms | 6 (1.2%) | 0 (0.0%) |
| 4 or 5 Rooms | 35 (7.3%) | 7 (18.4%) |
| 6 or 7 Rooms | 111 (23.0%) | 29 (76.3%) |
| 8 or more Rooms | 328 (68.0%) | 2 (5.3%) |
| Total | 482 (100.0%) | 38 (100.0%) |
Housing Structure by Heating Type in Boston Heights
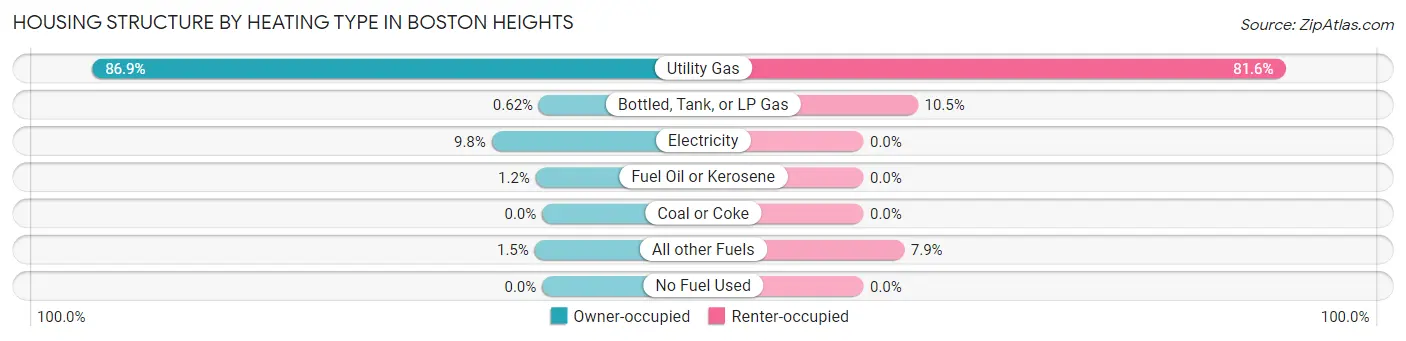
| Heating Type | Owner-occupied | Renter-occupied |
| Utility Gas | 419 (86.9%) | 31 (81.6%) |
| Bottled, Tank, or LP Gas | 3 (0.6%) | 4 (10.5%) |
| Electricity | 47 (9.8%) | 0 (0.0%) |
| Fuel Oil or Kerosene | 6 (1.2%) | 0 (0.0%) |
| Coal or Coke | 0 (0.0%) | 0 (0.0%) |
| All other Fuels | 7 (1.5%) | 3 (7.9%) |
| No Fuel Used | 0 (0.0%) | 0 (0.0%) |
| Total | 482 (100.0%) | 38 (100.0%) |
Household Vehicle Usage in Boston Heights
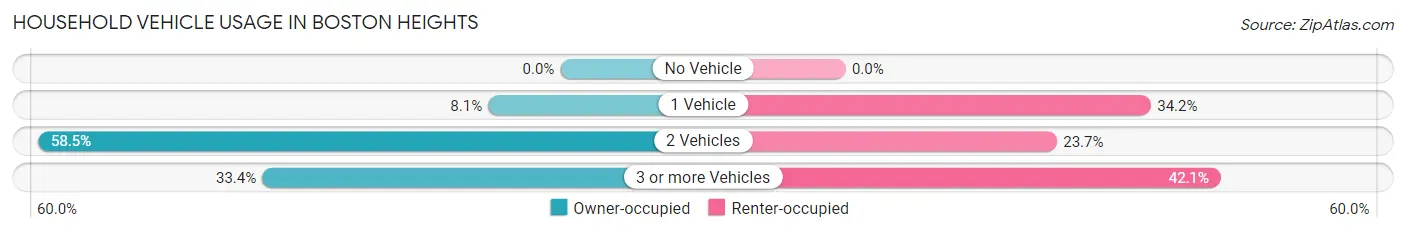
| Vehicles per Household | Owner-occupied | Renter-occupied |
| No Vehicle | 0 (0.0%) | 0 (0.0%) |
| 1 Vehicle | 39 (8.1%) | 13 (34.2%) |
| 2 Vehicles | 282 (58.5%) | 9 (23.7%) |
| 3 or more Vehicles | 161 (33.4%) | 16 (42.1%) |
| Total | 482 (100.0%) | 38 (100.0%) |
Real Estate & Mortgages in Boston Heights
Real Estate and Mortgage Overview in Boston Heights
| Characteristic | Without Mortgage | With Mortgage |
| Housing Units | 169 | 313 |
| Median Property Value | $465,600 | $393,500 |
| Median Household Income | $118,125 | $117 |
| Monthly Housing Costs | $946 | $84 |
| Real Estate Taxes | $6,344 | $5 |
Property Value by Mortgage Status in Boston Heights
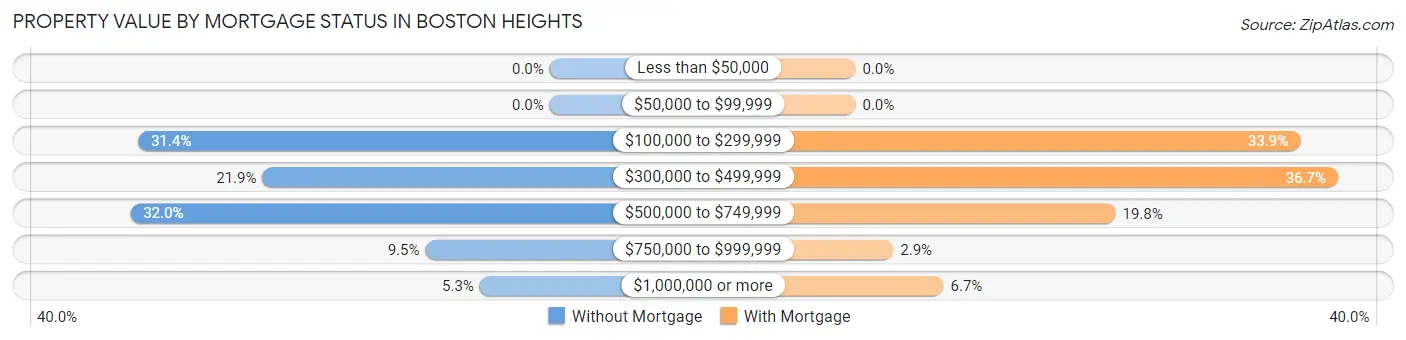
| Property Value | Without Mortgage | With Mortgage |
| Less than $50,000 | 0 (0.0%) | 0 (0.0%) |
| $50,000 to $99,999 | 0 (0.0%) | 0 (0.0%) |
| $100,000 to $299,999 | 53 (31.4%) | 106 (33.9%) |
| $300,000 to $499,999 | 37 (21.9%) | 115 (36.7%) |
| $500,000 to $749,999 | 54 (32.0%) | 62 (19.8%) |
| $750,000 to $999,999 | 16 (9.5%) | 9 (2.9%) |
| $1,000,000 or more | 9 (5.3%) | 21 (6.7%) |
| Total | 169 (100.0%) | 313 (100.0%) |
Household Income by Mortgage Status in Boston Heights
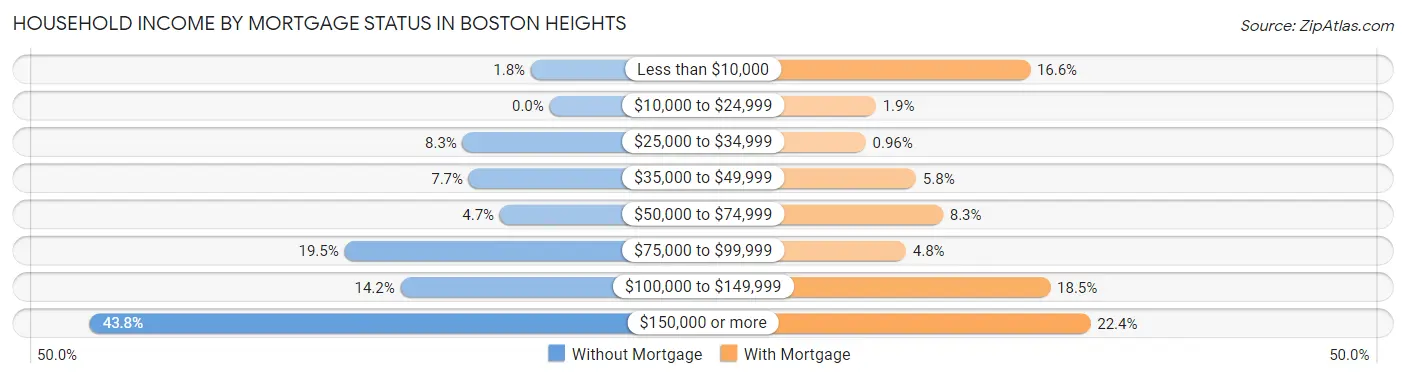
| Household Income | Without Mortgage | With Mortgage |
| Less than $10,000 | 3 (1.8%) | 52 (16.6%) |
| $10,000 to $24,999 | 0 (0.0%) | 6 (1.9%) |
| $25,000 to $34,999 | 14 (8.3%) | 3 (1.0%) |
| $35,000 to $49,999 | 13 (7.7%) | 18 (5.8%) |
| $50,000 to $74,999 | 8 (4.7%) | 26 (8.3%) |
| $75,000 to $99,999 | 33 (19.5%) | 15 (4.8%) |
| $100,000 to $149,999 | 24 (14.2%) | 58 (18.5%) |
| $150,000 or more | 74 (43.8%) | 70 (22.4%) |
| Total | 169 (100.0%) | 313 (100.0%) |
Property Value to Household Income Ratio in Boston Heights
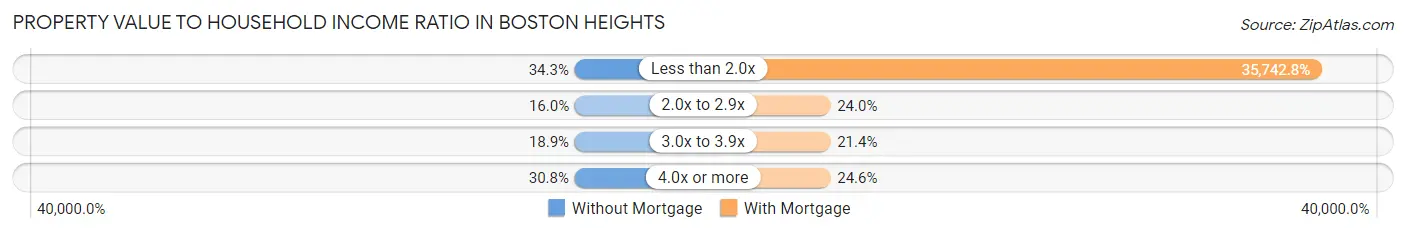
| Value-to-Income Ratio | Without Mortgage | With Mortgage |
| Less than 2.0x | 58 (34.3%) | 111,875 (35,742.8%) |
| 2.0x to 2.9x | 27 (16.0%) | 75 (24.0%) |
| 3.0x to 3.9x | 32 (18.9%) | 67 (21.4%) |
| 4.0x or more | 52 (30.8%) | 77 (24.6%) |
| Total | 169 (100.0%) | 313 (100.0%) |
Real Estate Taxes by Mortgage Status in Boston Heights
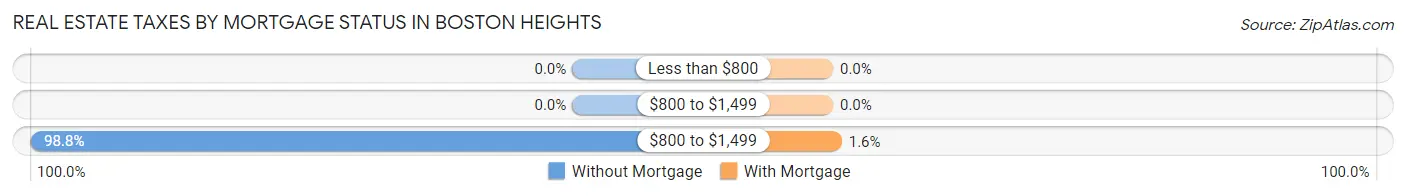
| Property Taxes | Without Mortgage | With Mortgage |
| Less than $800 | 0 (0.0%) | 0 (0.0%) |
| $800 to $1,499 | 0 (0.0%) | 0 (0.0%) |
| $800 to $1,499 | 167 (98.8%) | 5 (1.6%) |
| Total | 169 (100.0%) | 313 (100.0%) |
Health & Disability in Boston Heights
Health Insurance Coverage by Age in Boston Heights
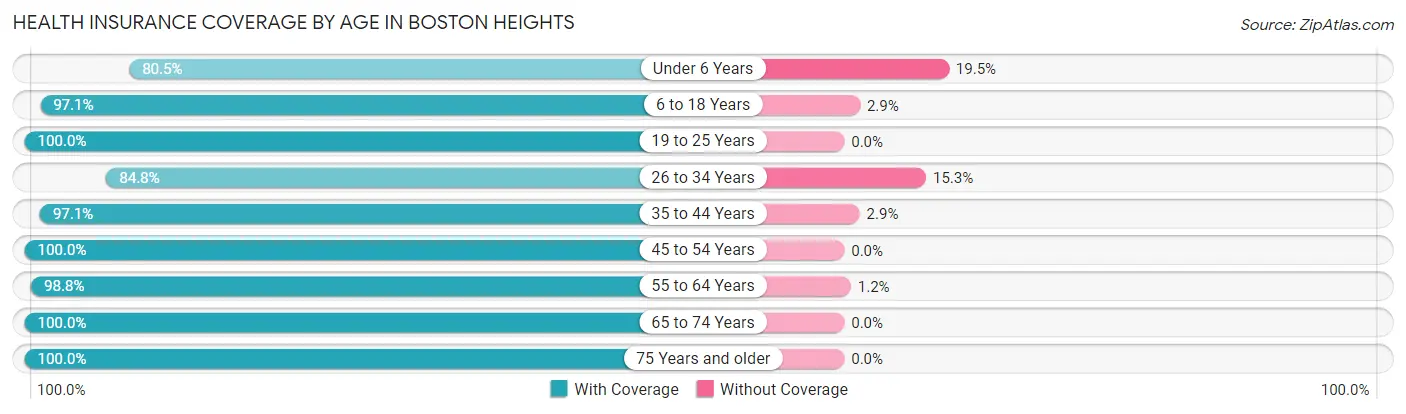
| Age Bracket | With Coverage | Without Coverage |
| Under 6 Years | 66 (80.5%) | 16 (19.5%) |
| 6 to 18 Years | 166 (97.1%) | 5 (2.9%) |
| 19 to 25 Years | 45 (100.0%) | 0 (0.0%) |
| 26 to 34 Years | 50 (84.8%) | 9 (15.2%) |
| 35 to 44 Years | 136 (97.1%) | 4 (2.9%) |
| 45 to 54 Years | 213 (100.0%) | 0 (0.0%) |
| 55 to 64 Years | 242 (98.8%) | 3 (1.2%) |
| 65 to 74 Years | 170 (100.0%) | 0 (0.0%) |
| 75 Years and older | 117 (100.0%) | 0 (0.0%) |
| Total | 1,205 (97.0%) | 37 (3.0%) |
Health Insurance Coverage by Citizenship Status in Boston Heights
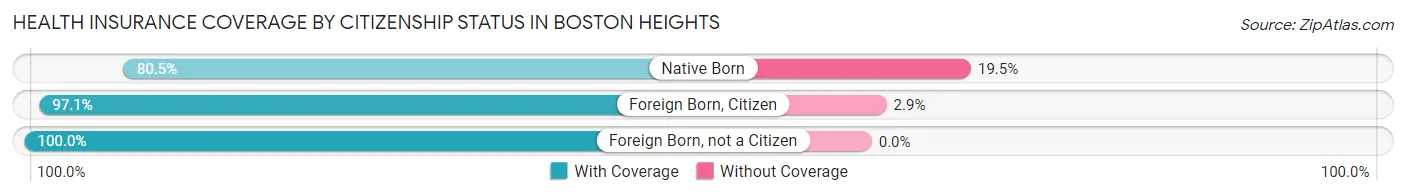
| Citizenship Status | With Coverage | Without Coverage |
| Native Born | 66 (80.5%) | 16 (19.5%) |
| Foreign Born, Citizen | 166 (97.1%) | 5 (2.9%) |
| Foreign Born, not a Citizen | 45 (100.0%) | 0 (0.0%) |
Health Insurance Coverage by Household Income in Boston Heights
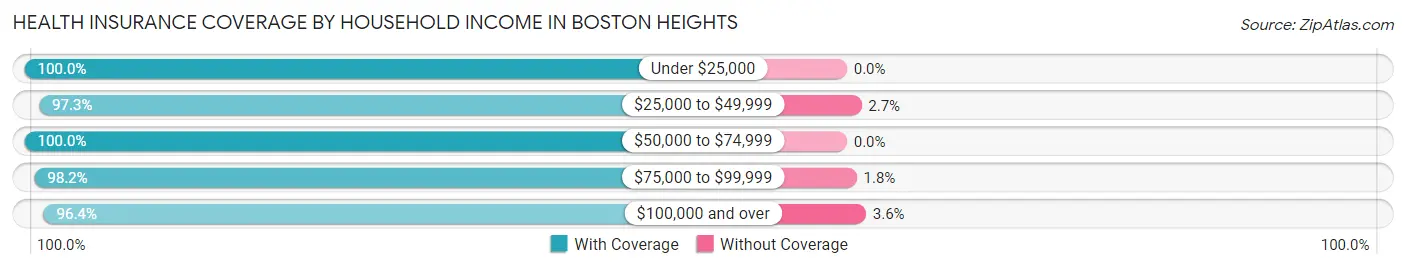
| Household Income | With Coverage | Without Coverage |
| Under $25,000 | 25 (100.0%) | 0 (0.0%) |
| $25,000 to $49,999 | 143 (97.3%) | 4 (2.7%) |
| $50,000 to $74,999 | 66 (100.0%) | 0 (0.0%) |
| $75,000 to $99,999 | 161 (98.2%) | 3 (1.8%) |
| $100,000 and over | 810 (96.4%) | 30 (3.6%) |
Public vs Private Health Insurance Coverage by Age in Boston Heights
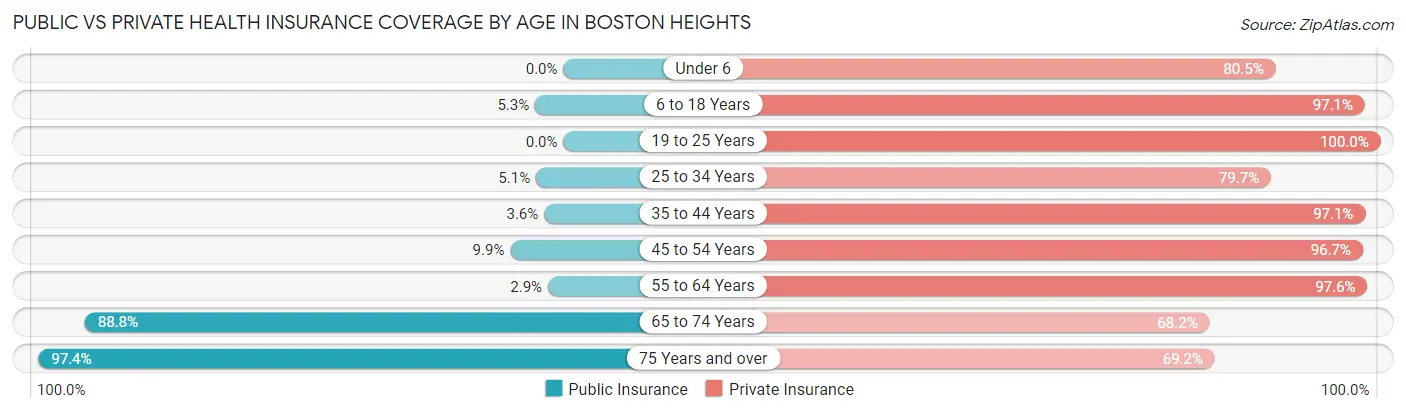
| Age Bracket | Public Insurance | Private Insurance |
| Under 6 | 0 (0.0%) | 66 (80.5%) |
| 6 to 18 Years | 9 (5.3%) | 166 (97.1%) |
| 19 to 25 Years | 0 (0.0%) | 45 (100.0%) |
| 25 to 34 Years | 3 (5.1%) | 47 (79.7%) |
| 35 to 44 Years | 5 (3.6%) | 136 (97.1%) |
| 45 to 54 Years | 21 (9.9%) | 206 (96.7%) |
| 55 to 64 Years | 7 (2.9%) | 239 (97.6%) |
| 65 to 74 Years | 151 (88.8%) | 116 (68.2%) |
| 75 Years and over | 114 (97.4%) | 81 (69.2%) |
| Total | 310 (25.0%) | 1,102 (88.7%) |
Disability Status by Sex by Age in Boston Heights
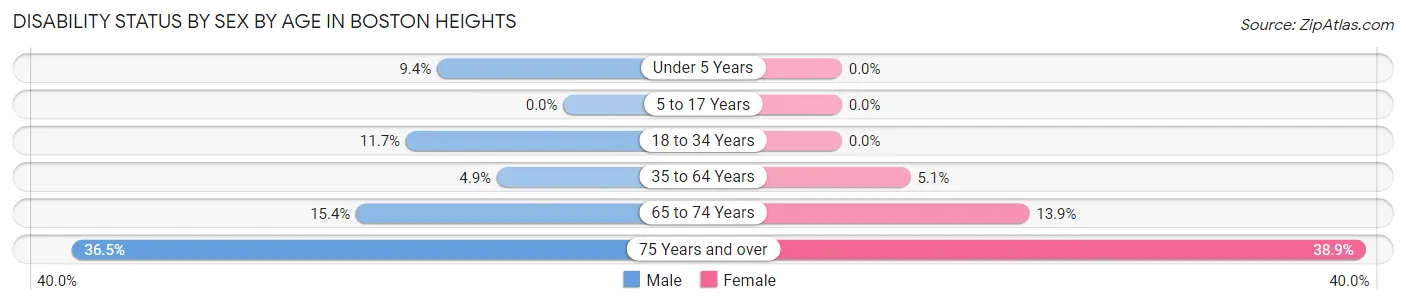
| Age Bracket | Male | Female |
| Under 5 Years | 3 (9.4%) | 0 (0.0%) |
| 5 to 17 Years | 0 (0.0%) | 0 (0.0%) |
| 18 to 34 Years | 9 (11.7%) | 0 (0.0%) |
| 35 to 64 Years | 15 (4.9%) | 15 (5.1%) |
| 65 to 74 Years | 14 (15.4%) | 11 (13.9%) |
| 75 Years and over | 23 (36.5%) | 21 (38.9%) |
Disability Class by Sex by Age in Boston Heights
Disability Class: Hearing Difficulty
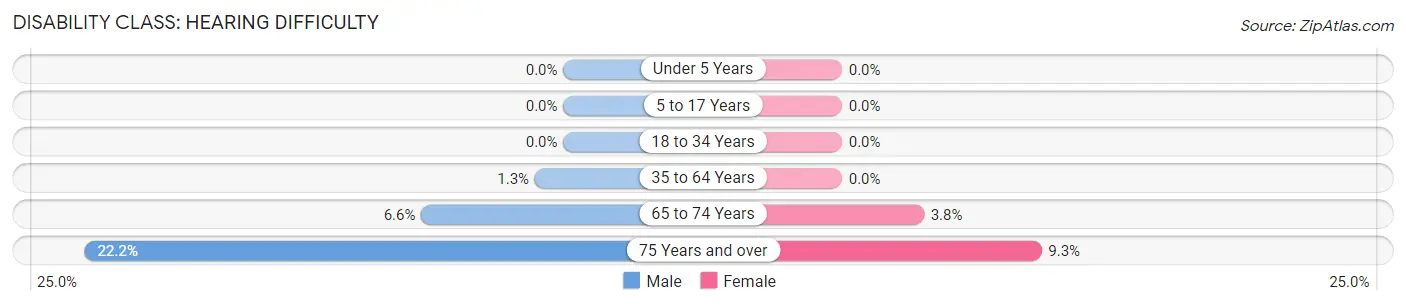
| Age Bracket | Male | Female |
| Under 5 Years | 0 (0.0%) | 0 (0.0%) |
| 5 to 17 Years | 0 (0.0%) | 0 (0.0%) |
| 18 to 34 Years | 0 (0.0%) | 0 (0.0%) |
| 35 to 64 Years | 4 (1.3%) | 0 (0.0%) |
| 65 to 74 Years | 6 (6.6%) | 3 (3.8%) |
| 75 Years and over | 14 (22.2%) | 5 (9.3%) |
Disability Class: Vision Difficulty
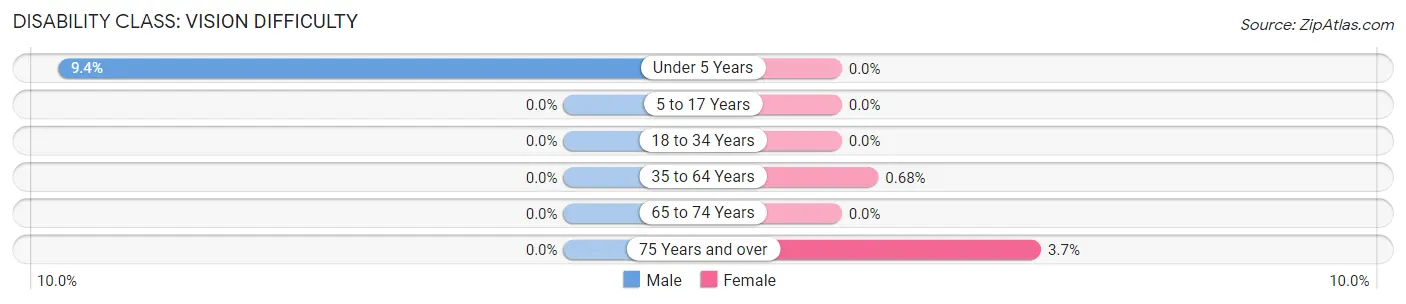
| Age Bracket | Male | Female |
| Under 5 Years | 3 (9.4%) | 0 (0.0%) |
| 5 to 17 Years | 0 (0.0%) | 0 (0.0%) |
| 18 to 34 Years | 0 (0.0%) | 0 (0.0%) |
| 35 to 64 Years | 0 (0.0%) | 2 (0.7%) |
| 65 to 74 Years | 0 (0.0%) | 0 (0.0%) |
| 75 Years and over | 0 (0.0%) | 2 (3.7%) |
Disability Class: Cognitive Difficulty
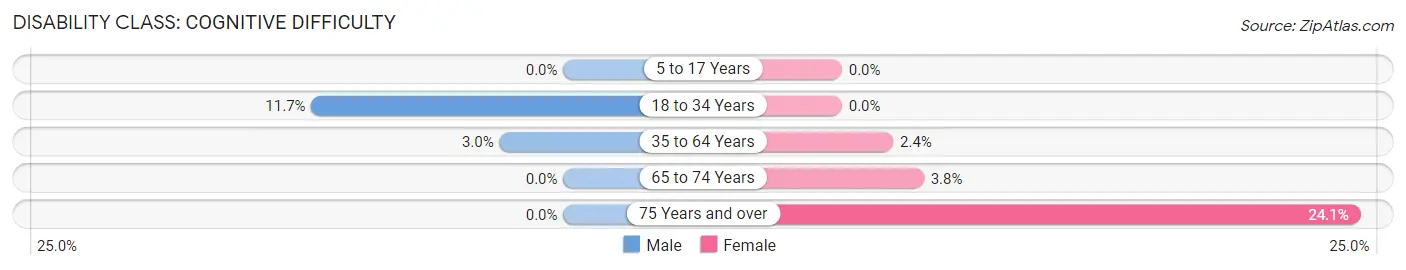
| Age Bracket | Male | Female |
| 5 to 17 Years | 0 (0.0%) | 0 (0.0%) |
| 18 to 34 Years | 9 (11.7%) | 0 (0.0%) |
| 35 to 64 Years | 9 (3.0%) | 7 (2.4%) |
| 65 to 74 Years | 0 (0.0%) | 3 (3.8%) |
| 75 Years and over | 0 (0.0%) | 13 (24.1%) |
Disability Class: Ambulatory Difficulty
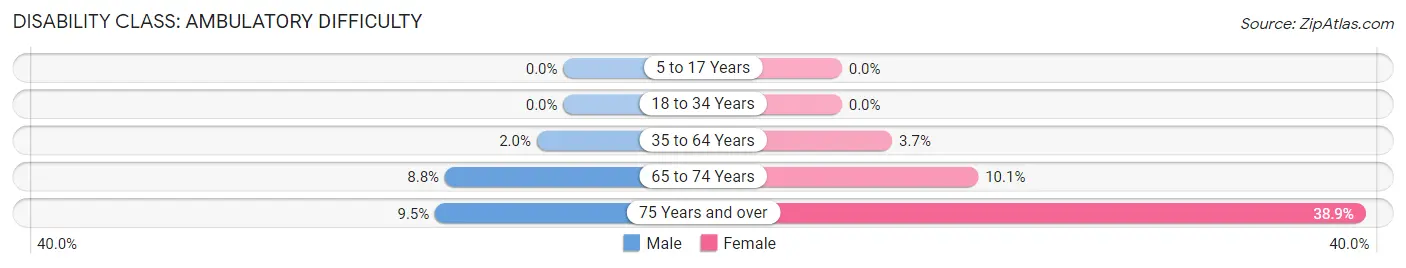
| Age Bracket | Male | Female |
| 5 to 17 Years | 0 (0.0%) | 0 (0.0%) |
| 18 to 34 Years | 0 (0.0%) | 0 (0.0%) |
| 35 to 64 Years | 6 (2.0%) | 11 (3.7%) |
| 65 to 74 Years | 8 (8.8%) | 8 (10.1%) |
| 75 Years and over | 6 (9.5%) | 21 (38.9%) |
Disability Class: Self-Care Difficulty
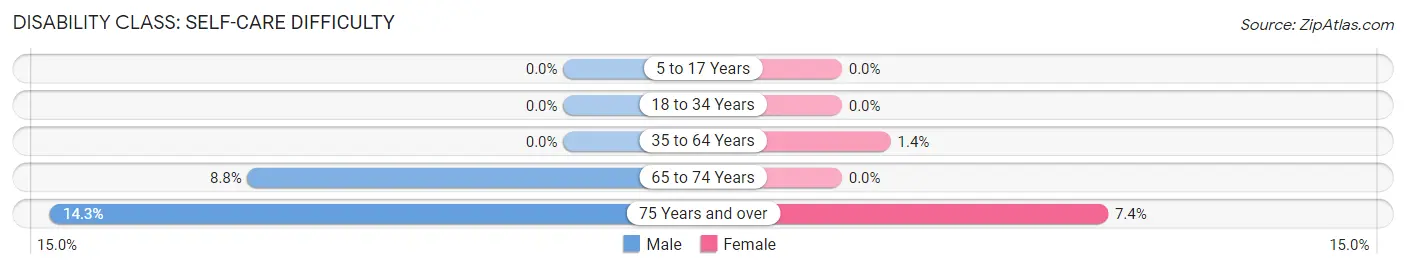
| Age Bracket | Male | Female |
| 5 to 17 Years | 0 (0.0%) | 0 (0.0%) |
| 18 to 34 Years | 0 (0.0%) | 0 (0.0%) |
| 35 to 64 Years | 0 (0.0%) | 4 (1.4%) |
| 65 to 74 Years | 8 (8.8%) | 0 (0.0%) |
| 75 Years and over | 9 (14.3%) | 4 (7.4%) |
Technology Access in Boston Heights
Computing Device Access in Boston Heights
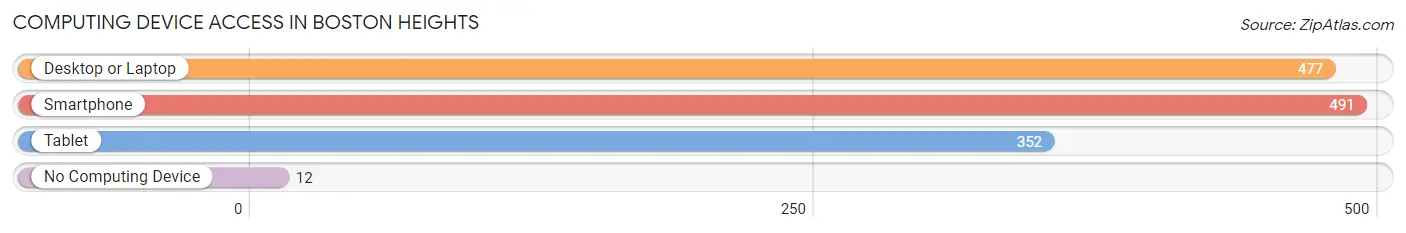
| Device Type | # Households | % Households |
| Desktop or Laptop | 477 | 91.7% |
| Smartphone | 491 | 94.4% |
| Tablet | 352 | 67.7% |
| No Computing Device | 12 | 2.3% |
| Total | 520 | 100.0% |
Internet Access in Boston Heights
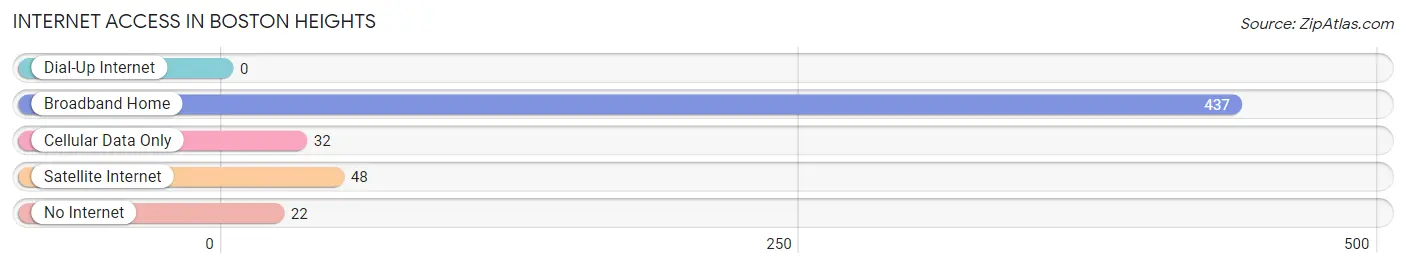
| Internet Type | # Households | % Households |
| Dial-Up Internet | 0 | 0.0% |
| Broadband Home | 437 | 84.0% |
| Cellular Data Only | 32 | 6.1% |
| Satellite Internet | 48 | 9.2% |
| No Internet | 22 | 4.2% |
| Total | 520 | 100.0% |
Boston Heights Summary
History
The history of Boston Heights, Ohio dates back to the early 1800s when the area was first settled by a group of German immigrants. The area was originally known as “Boston Township” and was part of the Connecticut Western Reserve. The first settlers arrived in 1810 and the township was officially established in 1818.
The area was named after the city of Boston, Massachusetts, which was the hometown of many of the settlers. The first post office was established in 1820 and the first school was built in 1825.
The area grew slowly but steadily over the years and by the late 1800s, the population had grown to over 500 people. The village of Boston Heights was officially incorporated in 1908.
The village was primarily an agricultural community until the 1950s when the population began to grow rapidly due to the construction of the Ohio Turnpike and the development of the nearby Akron-Cleveland metropolitan area.
The population of Boston Heights has continued to grow since then and as of the 2010 census, the population was 3,945.
Geography
Boston Heights is located in northern Summit County, Ohio, approximately 20 miles south of Cleveland and 30 miles north of Akron. The village is situated on the western edge of the Cuyahoga Valley National Park and is bordered by the cities of Hudson, Stow, and Twinsburg.
The village covers a total area of 4.2 square miles, all of which is land. The terrain is mostly flat with some rolling hills. The village is located in the Great Lakes region and is part of the Western Reserve.
Economy
The economy of Boston Heights is primarily based on the service industry. The village is home to several small businesses, including restaurants, retail stores, and professional services. The village is also home to several large employers, including the Cleveland Clinic, Summa Health System, and the University of Akron.
The village is also home to several industrial parks, which provide employment opportunities for many of the residents.
Demographics
As of the 2010 census, the population of Boston Heights was 3,945. The racial makeup of the village was 94.3% White, 1.7% African American, 0.2% Native American, 1.2% Asian, 0.1% Pacific Islander, 0.7% from other races, and 1.9% from two or more races. Hispanic or Latino of any race were 2.2% of the population.
The median income for a household in the village was $63,958 and the median income for a family was $76,958. The per capita income for the village was $30,958. About 4.2% of families and 5.3% of the population were below the poverty line, including 6.2% of those under age 18 and 4.2% of those age 65 or over.
Common Questions
What is Per Capita Income in Boston Heights?
Per Capita income in Boston Heights is $84,236.
What is the Median Family Income in Boston Heights?
Median Family Income in Boston Heights is $150,673.
What is the Median Household income in Boston Heights?
Median Household Income in Boston Heights is $109,545.
What is Income or Wage Gap in Boston Heights?
Income or Wage Gap in Boston Heights is 48.2%.
Women in Boston Heights earn 51.8 cents for every dollar earned by a man.
What is Inequality or Gini Index in Boston Heights?
Inequality or Gini Index in Boston Heights is 0.55.
What is the Total Population of Boston Heights?
Total Population of Boston Heights is 1,242.
What is the Total Male Population of Boston Heights?
Total Male Population of Boston Heights is 661.
What is the Total Female Population of Boston Heights?
Total Female Population of Boston Heights is 581.
What is the Ratio of Males per 100 Females in Boston Heights?
There are 113.77 Males per 100 Females in Boston Heights.
What is the Ratio of Females per 100 Males in Boston Heights?
There are 87.90 Females per 100 Males in Boston Heights.
What is the Median Population Age in Boston Heights?
Median Population Age in Boston Heights is 51.7 Years.
What is the Average Family Size in Boston Heights
Average Family Size in Boston Heights is 2.8 People.
What is the Average Household Size in Boston Heights
Average Household Size in Boston Heights is 2.4 People.
How Large is the Labor Force in Boston Heights?
There are 613 People in the Labor Forcein in Boston Heights.
What is the Percentage of People in the Labor Force in Boston Heights?
59.0% of People are in the Labor Force in Boston Heights.
What is the Unemployment Rate in Boston Heights?
Unemployment Rate in Boston Heights is 4.6%.