Bratenahl, OH Map & Demographics
Bratenahl Map
Bratenahl Overview
$121,440
PER CAPITA INCOME
$194,844
AVG FAMILY INCOME
$162,625
AVG HOUSEHOLD INCOME
39.2%
WAGE / INCOME GAP [ % ]
60.8¢/ $1
WAGE / INCOME GAP [ $ ]
0.50
INEQUALITY / GINI INDEX
1,422
TOTAL POPULATION
626
MALE POPULATION
796
FEMALE POPULATION
78.64
MALES / 100 FEMALES
127.16
FEMALES / 100 MALES
60.7
MEDIAN AGE
2.7
AVG FAMILY SIZE
2.0
AVG HOUSEHOLD SIZE
799
LABOR FORCE [ PEOPLE ]
60.1%
PERCENT IN LABOR FORCE
1.4%
UNEMPLOYMENT RATE
Bratenahl Area Codes
Income in Bratenahl
Income Overview in Bratenahl
Per Capita Income in Bratenahl is $121,440, while median incomes of families and households are $194,844 and $162,625 respectively.
| Characteristic | Number | Measure |
| Per Capita Income | 1,422 | $121,440 |
| Median Family Income | 407 | $194,844 |
| Mean Family Income | 407 | $284,161 |
| Median Household Income | 689 | $162,625 |
| Mean Household Income | 689 | $240,730 |
| Income Deficit | 407 | $0 |
| Wage / Income Gap (%) | 1,422 | 39.20% |
| Wage / Income Gap ($) | 1,422 | 60.80¢ per $1 |
| Gini / Inequality Index | 1,422 | 0.50 |
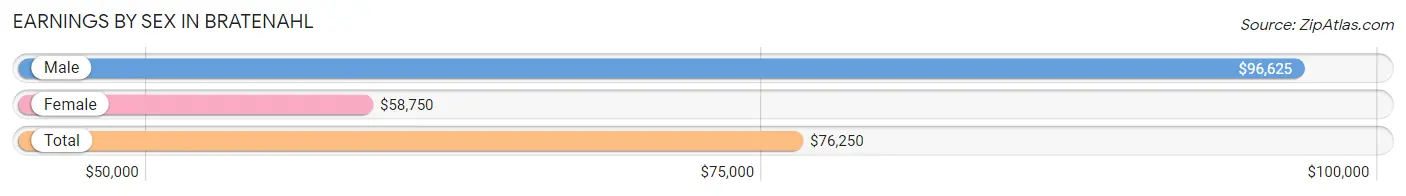
Earnings by Sex in Bratenahl
Average Earnings in Bratenahl are $76,250, $96,625 for men and $58,750 for women, a difference of 39.2%.
| Sex | Number | Average Earnings |
| Male | 441 (47.3%) | $96,625 |
| Female | 491 (52.7%) | $58,750 |
| Total | 932 (100.0%) | $76,250 |
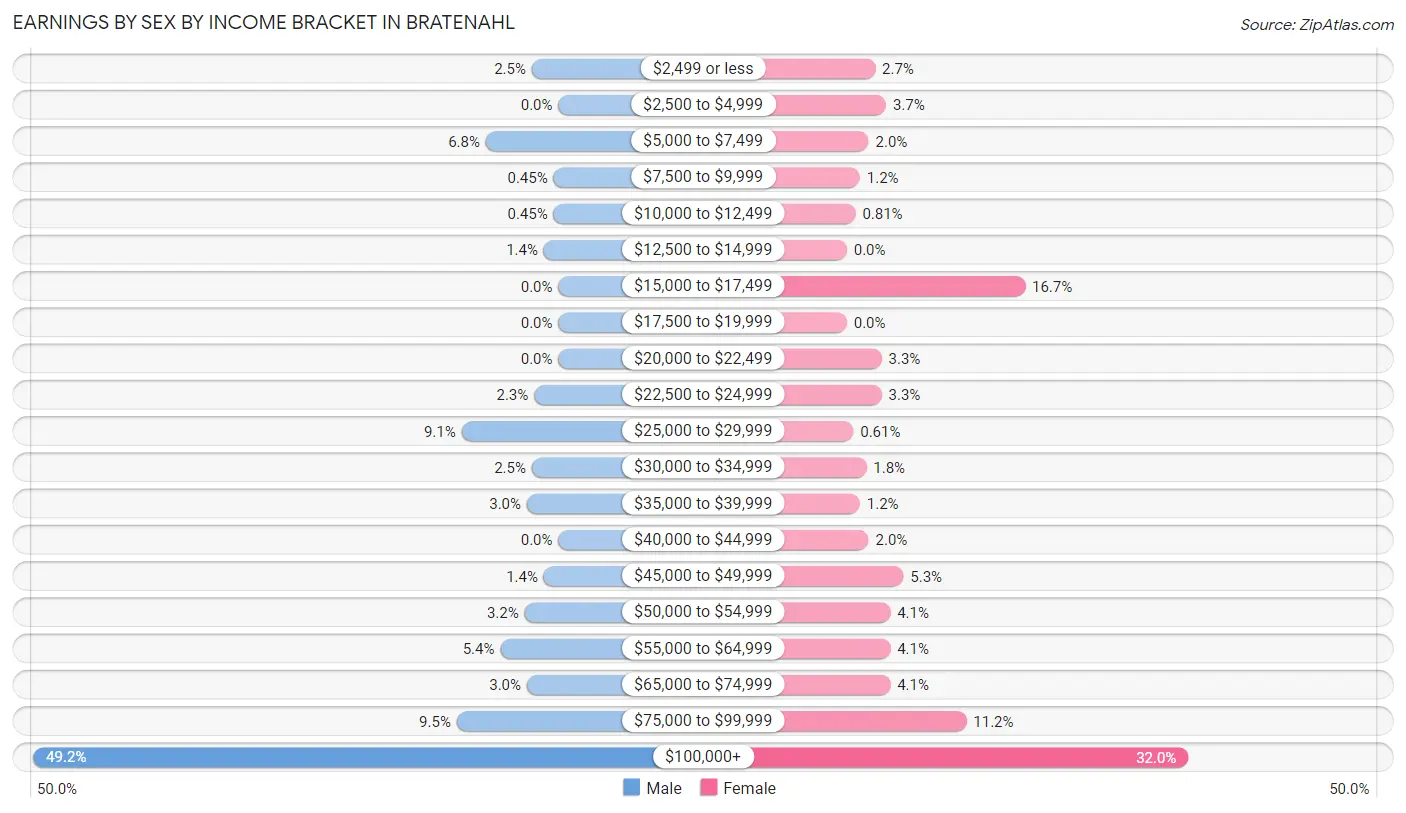
Earnings by Sex by Income Bracket in Bratenahl
The most common earnings brackets in Bratenahl are $100,000+ for men (217 | 49.2%) and $100,000+ for women (157 | 32.0%).
| Income | Male | Female |
| $2,499 or less | 11 (2.5%) | 13 (2.6%) |
| $2,500 to $4,999 | 0 (0.0%) | 18 (3.7%) |
| $5,000 to $7,499 | 30 (6.8%) | 10 (2.0%) |
| $7,500 to $9,999 | 2 (0.4%) | 6 (1.2%) |
| $10,000 to $12,499 | 2 (0.4%) | 4 (0.8%) |
| $12,500 to $14,999 | 6 (1.4%) | 0 (0.0%) |
| $15,000 to $17,499 | 0 (0.0%) | 82 (16.7%) |
| $17,500 to $19,999 | 0 (0.0%) | 0 (0.0%) |
| $20,000 to $22,499 | 0 (0.0%) | 16 (3.3%) |
| $22,500 to $24,999 | 10 (2.3%) | 16 (3.3%) |
| $25,000 to $29,999 | 40 (9.1%) | 3 (0.6%) |
| $30,000 to $34,999 | 11 (2.5%) | 9 (1.8%) |
| $35,000 to $39,999 | 13 (2.9%) | 6 (1.2%) |
| $40,000 to $44,999 | 0 (0.0%) | 10 (2.0%) |
| $45,000 to $49,999 | 6 (1.4%) | 26 (5.3%) |
| $50,000 to $54,999 | 14 (3.2%) | 20 (4.1%) |
| $55,000 to $64,999 | 24 (5.4%) | 20 (4.1%) |
| $65,000 to $74,999 | 13 (2.9%) | 20 (4.1%) |
| $75,000 to $99,999 | 42 (9.5%) | 55 (11.2%) |
| $100,000+ | 217 (49.2%) | 157 (32.0%) |
| Total | 441 (100.0%) | 491 (100.0%) |
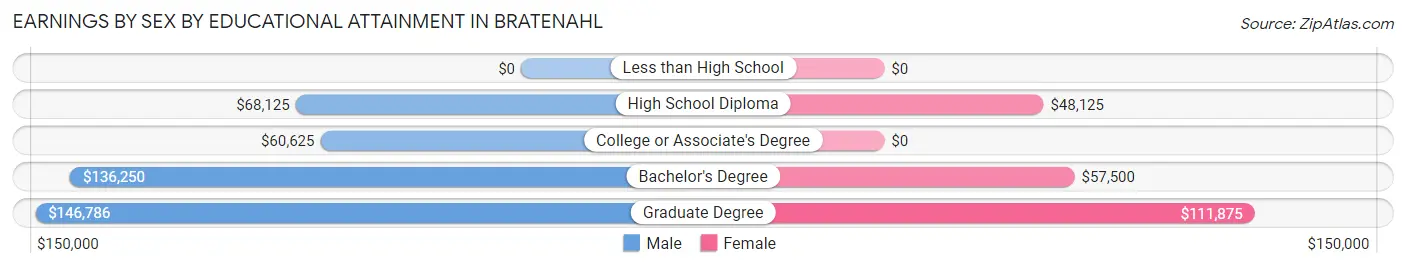
Earnings by Sex by Educational Attainment in Bratenahl
Average earnings in Bratenahl are $104,500 for men and $63,214 for women, a difference of 39.5%. Men with an educational attainment of graduate degree enjoy the highest average annual earnings of $146,786, while those with college or associate's degree education earn the least with $60,625. Women with an educational attainment of graduate degree earn the most with the average annual earnings of $111,875, while those with high school diploma education have the smallest earnings of $48,125.
| Educational Attainment | Male Income | Female Income |
| Less than High School | - | - |
| High School Diploma | $68,125 | $48,125 |
| College or Associate's Degree | $60,625 | $0 |
| Bachelor's Degree | $136,250 | $57,500 |
| Graduate Degree | $146,786 | $111,875 |
| Total | $104,500 | $63,214 |
Family Income in Bratenahl
Family Income Brackets in Bratenahl
According to the Bratenahl family income data, there are 200 families falling into the $200,000+ income range, which is the most common income bracket and makes up 49.1% of all families.
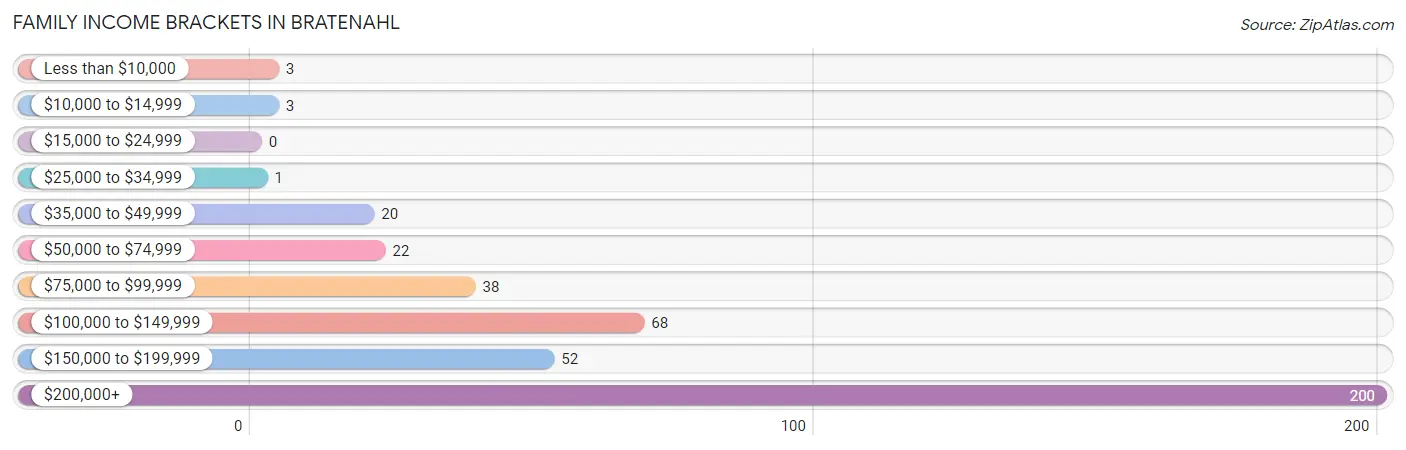
| Income Bracket | # Families | % Families |
| Less than $10,000 | 3 | 0.7% |
| $10,000 to $14,999 | 3 | 0.7% |
| $15,000 to $24,999 | 0 | 0.0% |
| $25,000 to $34,999 | 1 | 0.2% |
| $35,000 to $49,999 | 20 | 4.9% |
| $50,000 to $74,999 | 22 | 5.4% |
| $75,000 to $99,999 | 38 | 9.3% |
| $100,000 to $149,999 | 68 | 16.7% |
| $150,000 to $199,999 | 52 | 12.8% |
| $200,000+ | 200 | 49.1% |
Family Income by Famaliy Size in Bratenahl
6-person families (10 | 2.5%) account for the highest median family income in Bratenahl with $250,001 per family, while 2-person families (302 | 74.2%) have the highest median income of $101,666 per family member.
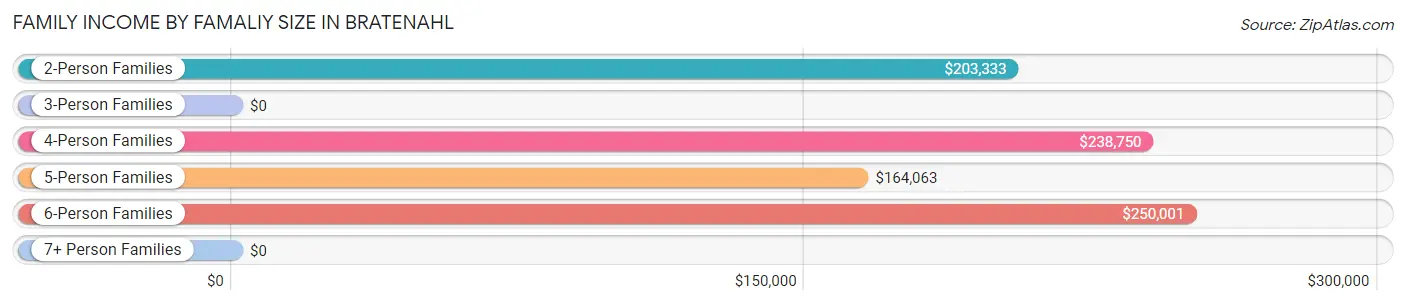
| Income Bracket | # Families | Median Income |
| 2-Person Families | 302 (74.2%) | $203,333 |
| 3-Person Families | 68 (16.7%) | $0 |
| 4-Person Families | 18 (4.4%) | $238,750 |
| 5-Person Families | 9 (2.2%) | $164,063 |
| 6-Person Families | 10 (2.5%) | $250,001 |
| 7+ Person Families | 0 (0.0%) | $0 |
| Total | 407 (100.0%) | $194,844 |
Family Income by Number of Earners in Bratenahl
The median family income in Bratenahl is $194,844, with families comprising 3+ earners (21) having the highest median family income of $250,001, while families with no earners (57) have the lowest median family income of $150,417, accounting for 5.2% and 14.0% of families, respectively.
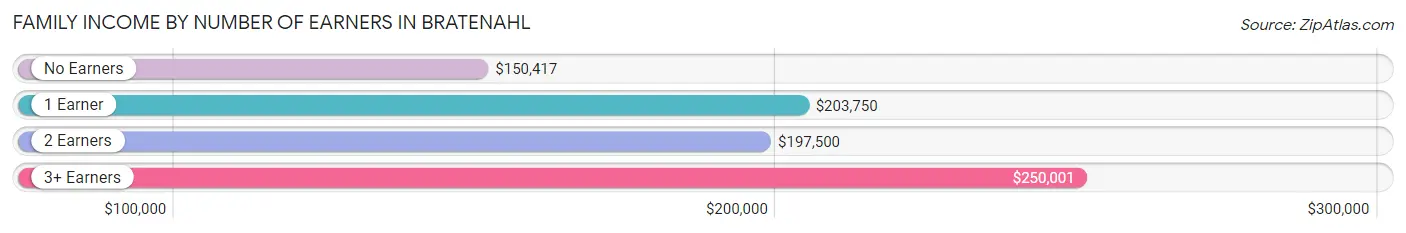
| Number of Earners | # Families | Median Income |
| No Earners | 57 (14.0%) | $150,417 |
| 1 Earner | 139 (34.2%) | $203,750 |
| 2 Earners | 190 (46.7%) | $197,500 |
| 3+ Earners | 21 (5.2%) | $250,001 |
| Total | 407 (100.0%) | $194,844 |
Household Income in Bratenahl
Household Income Brackets in Bratenahl
With 292 households falling in the category, the $200,000+ income range is the most frequent in Bratenahl, accounting for 42.4% of all households.
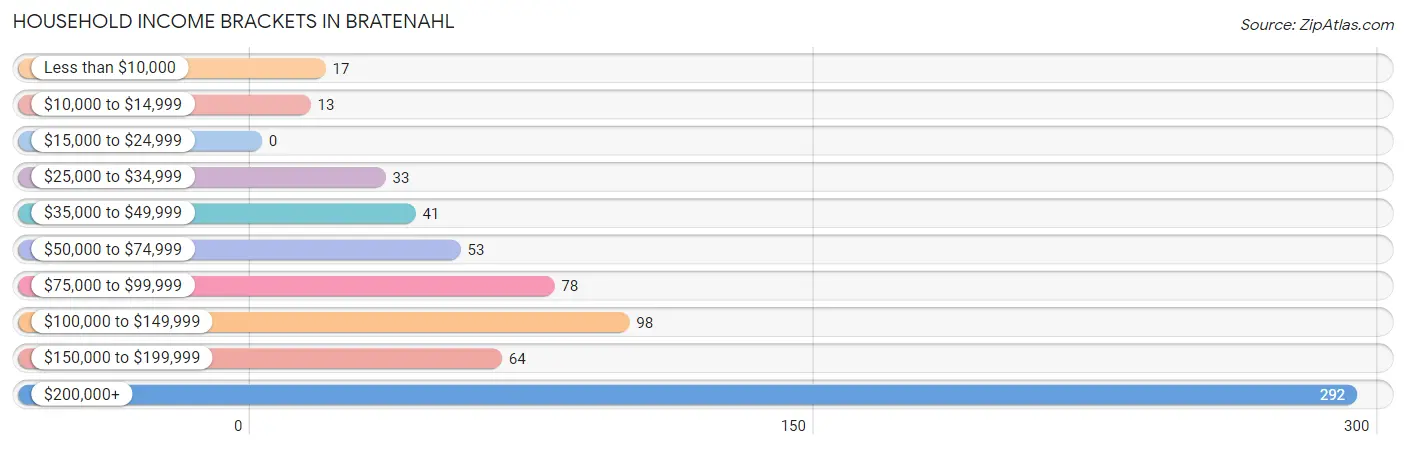
| Income Bracket | # Households | % Households |
| Less than $10,000 | 17 | 2.5% |
| $10,000 to $14,999 | 13 | 1.9% |
| $15,000 to $24,999 | 0 | 0.0% |
| $25,000 to $34,999 | 33 | 4.8% |
| $35,000 to $49,999 | 41 | 6.0% |
| $50,000 to $74,999 | 53 | 7.7% |
| $75,000 to $99,999 | 78 | 11.3% |
| $100,000 to $149,999 | 98 | 14.2% |
| $150,000 to $199,999 | 64 | 9.3% |
| $200,000+ | 292 | 42.4% |
Household Income by Householder Age in Bratenahl
The median household income in Bratenahl is $162,625, with the highest median household income of $192,083 found in the 45 to 64 years age bracket for the primary householder. A total of 255 households (37.0%) fall into this category.
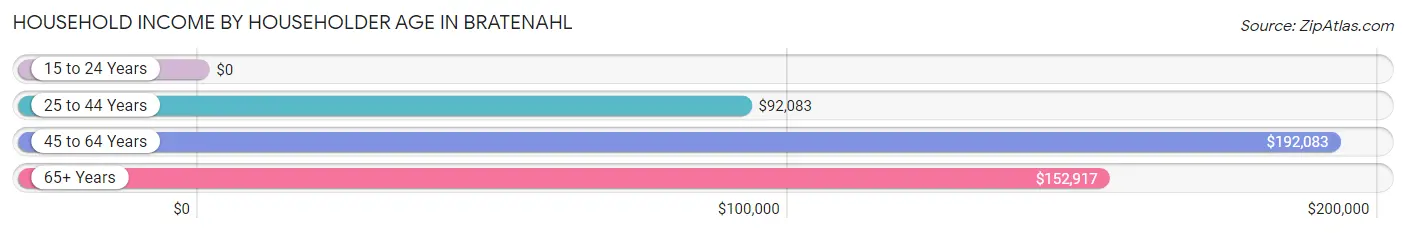
| Income Bracket | # Households | Median Income |
| 15 to 24 Years | 0 (0.0%) | $0 |
| 25 to 44 Years | 115 (16.7%) | $92,083 |
| 45 to 64 Years | 255 (37.0%) | $192,083 |
| 65+ Years | 319 (46.3%) | $152,917 |
| Total | 689 (100.0%) | $162,625 |
Poverty in Bratenahl
Income Below Poverty by Sex and Age in Bratenahl
With 2.7% poverty level for males and 4.5% for females among the residents of Bratenahl, 35 to 44 year old males and 55 to 64 year old females are the most vulnerable to poverty, with 9 males (14.3%) and 23 females (13.2%) in their respective age groups living below the poverty level.
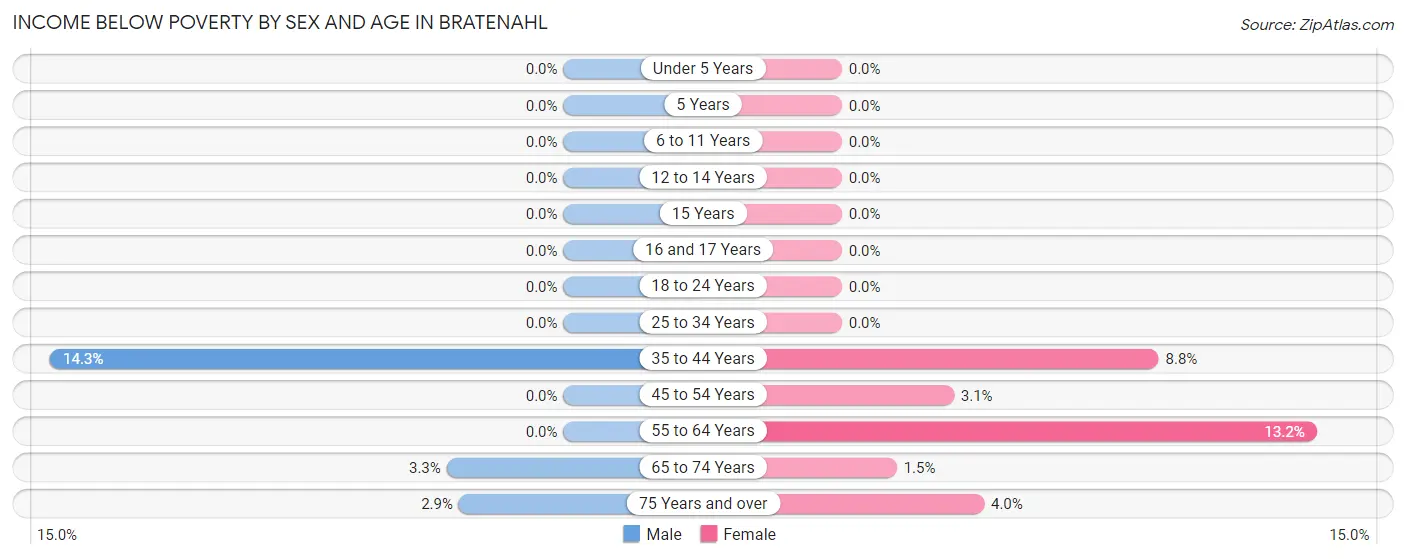
| Age Bracket | Male | Female |
| Under 5 Years | 0 (0.0%) | 0 (0.0%) |
| 5 Years | 0 (0.0%) | 0 (0.0%) |
| 6 to 11 Years | 0 (0.0%) | 0 (0.0%) |
| 12 to 14 Years | 0 (0.0%) | 0 (0.0%) |
| 15 Years | 0 (0.0%) | 0 (0.0%) |
| 16 and 17 Years | 0 (0.0%) | 0 (0.0%) |
| 18 to 24 Years | 0 (0.0%) | 0 (0.0%) |
| 25 to 34 Years | 0 (0.0%) | 0 (0.0%) |
| 35 to 44 Years | 9 (14.3%) | 3 (8.8%) |
| 45 to 54 Years | 0 (0.0%) | 3 (3.1%) |
| 55 to 64 Years | 0 (0.0%) | 23 (13.2%) |
| 65 to 74 Years | 5 (3.3%) | 3 (1.5%) |
| 75 Years and over | 3 (2.9%) | 4 (4.0%) |
| Total | 17 (2.7%) | 36 (4.5%) |
Income Above Poverty by Sex and Age in Bratenahl
According to the poverty statistics in Bratenahl, males aged under 5 years and females aged under 5 years are the age groups that are most secure financially, with 100.0% of males and 100.0% of females in these age groups living above the poverty line.
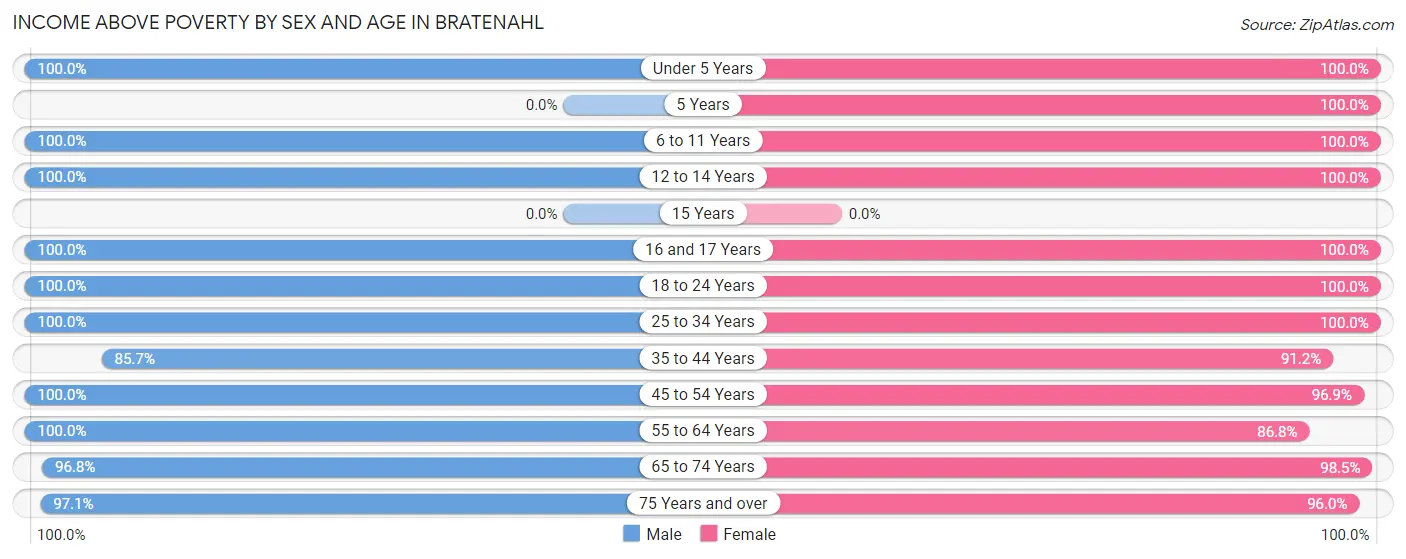
| Age Bracket | Male | Female |
| Under 5 Years | 31 (100.0%) | 6 (100.0%) |
| 5 Years | 0 (0.0%) | 3 (100.0%) |
| 6 to 11 Years | 22 (100.0%) | 22 (100.0%) |
| 12 to 14 Years | 2 (100.0%) | 7 (100.0%) |
| 15 Years | 0 (0.0%) | 0 (0.0%) |
| 16 and 17 Years | 4 (100.0%) | 3 (100.0%) |
| 18 to 24 Years | 13 (100.0%) | 14 (100.0%) |
| 25 to 34 Years | 41 (100.0%) | 140 (100.0%) |
| 35 to 44 Years | 54 (85.7%) | 31 (91.2%) |
| 45 to 54 Years | 63 (100.0%) | 93 (96.9%) |
| 55 to 64 Years | 130 (100.0%) | 151 (86.8%) |
| 65 to 74 Years | 149 (96.8%) | 193 (98.5%) |
| 75 Years and over | 100 (97.1%) | 97 (96.0%) |
| Total | 609 (97.3%) | 760 (95.5%) |
Income Below Poverty Among Married-Couple Families in Bratenahl
The poverty statistics for married-couple families in Bratenahl show that 1.6% or 6 of the total 365 families live below the poverty line. Families with no children have the highest poverty rate of 1.9%, comprising of 6 families. On the other hand, families with 1 or 2 children have the lowest poverty rate of 0.0%, which includes 0 families.
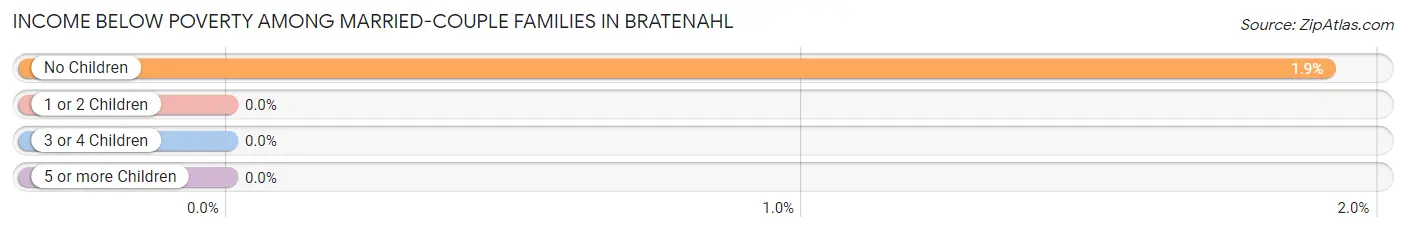
| Children | Above Poverty | Below Poverty |
| No Children | 308 (98.1%) | 6 (1.9%) |
| 1 or 2 Children | 42 (100.0%) | 0 (0.0%) |
| 3 or 4 Children | 9 (100.0%) | 0 (0.0%) |
| 5 or more Children | 0 (0.0%) | 0 (0.0%) |
| Total | 359 (98.4%) | 6 (1.6%) |
Income Below Poverty Among Single-Parent Households in Bratenahl
| Children | Single Father | Single Mother |
| No Children | 0 (0.0%) | 0 (0.0%) |
| 1 or 2 Children | 0 (0.0%) | 0 (0.0%) |
| 3 or 4 Children | 0 (0.0%) | 0 (0.0%) |
| 5 or more Children | 0 (0.0%) | 0 (0.0%) |
| Total | 0 (0.0%) | 0 (0.0%) |
Income Below Poverty Among Married-Couple vs Single-Parent Households in Bratenahl
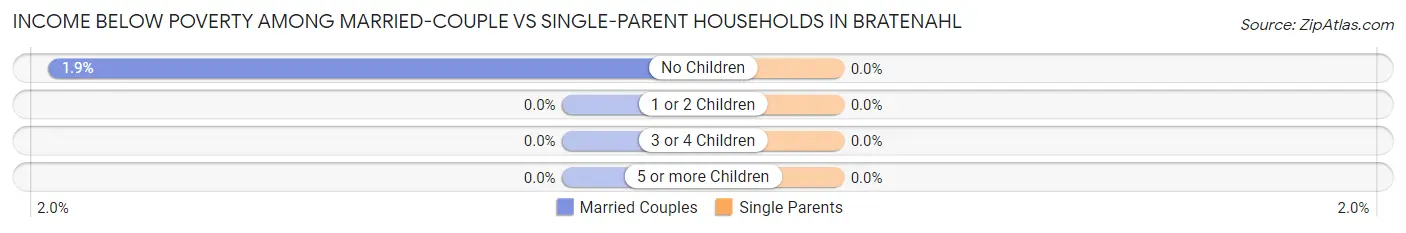
| Children | Married-Couple Families | Single-Parent Households |
| No Children | 6 (1.9%) | 0 (0.0%) |
| 1 or 2 Children | 0 (0.0%) | 0 (0.0%) |
| 3 or 4 Children | 0 (0.0%) | 0 (0.0%) |
| 5 or more Children | 0 (0.0%) | 0 (0.0%) |
| Total | 6 (1.6%) | 0 (0.0%) |
Race in Bratenahl
The most populous races in Bratenahl are White / Caucasian (998 | 70.2%), Black / African American (235 | 16.5%), and Two or more Races (131 | 9.2%).
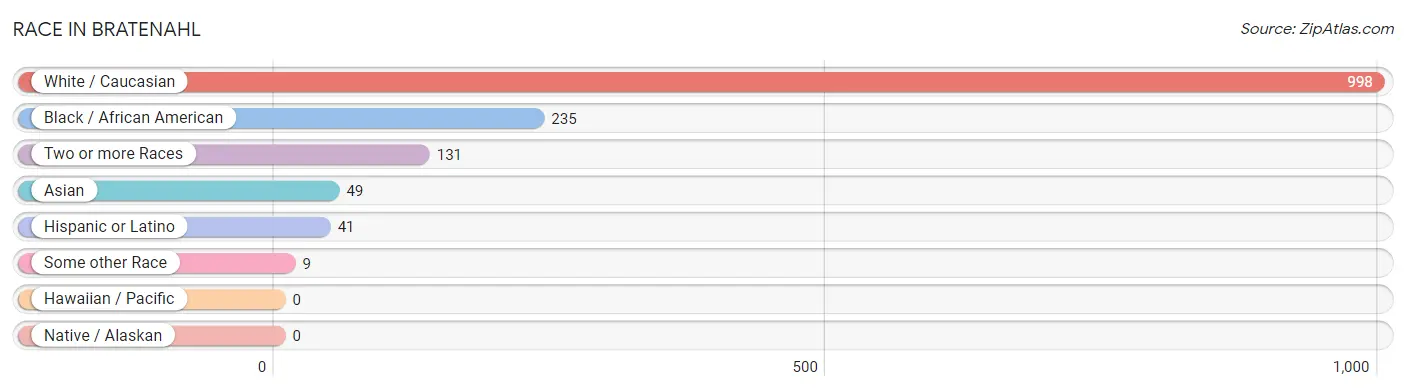
| Race | # Population | % Population |
| Asian | 49 | 3.5% |
| Black / African American | 235 | 16.5% |
| Hawaiian / Pacific | 0 | 0.0% |
| Hispanic or Latino | 41 | 2.9% |
| Native / Alaskan | 0 | 0.0% |
| White / Caucasian | 998 | 70.2% |
| Two or more Races | 131 | 9.2% |
| Some other Race | 9 | 0.6% |
| Total | 1,422 | 100.0% |
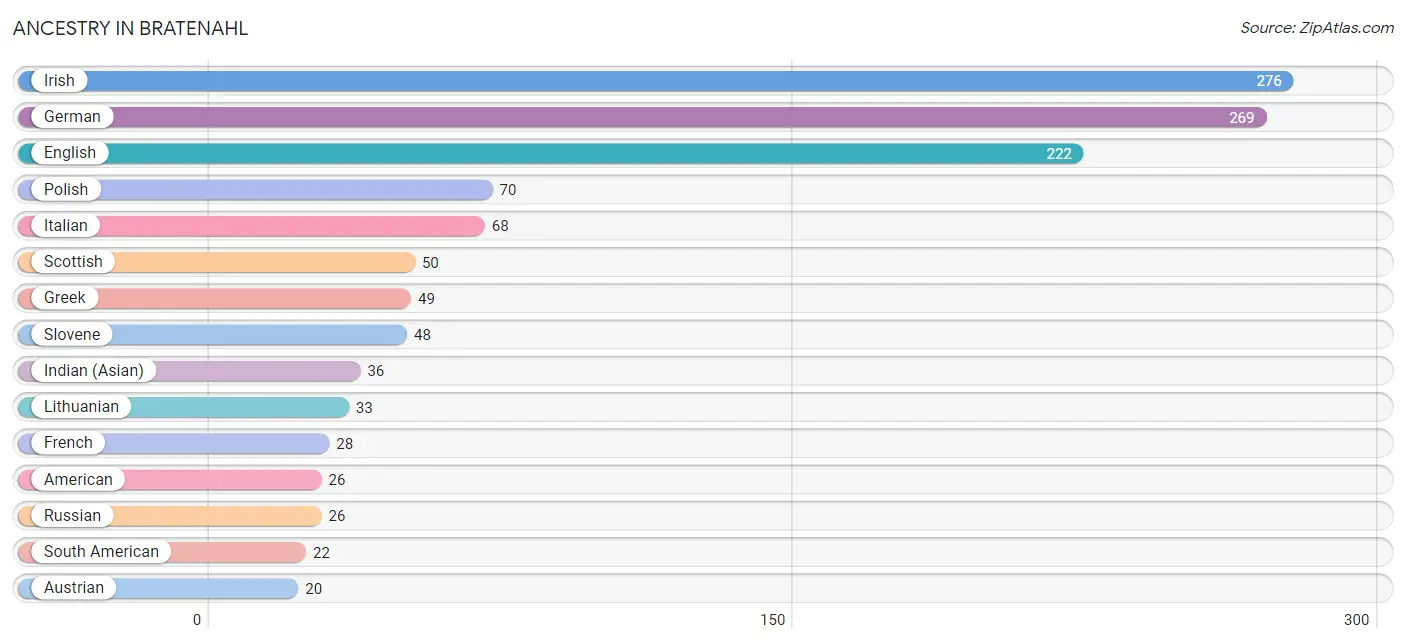
Ancestry in Bratenahl
The most populous ancestries reported in Bratenahl are Irish (276 | 19.4%), German (269 | 18.9%), English (222 | 15.6%), Polish (70 | 4.9%), and Italian (68 | 4.8%), together accounting for 63.6% of all Bratenahl residents.
| Ancestry | # Population | % Population |
| African | 11 | 0.8% |
| American | 26 | 1.8% |
| Arab | 19 | 1.3% |
| Argentinean | 18 | 1.3% |
| Austrian | 20 | 1.4% |
| British | 13 | 0.9% |
| Burmese | 9 | 0.6% |
| Canadian | 4 | 0.3% |
| Colombian | 4 | 0.3% |
| Czech | 12 | 0.8% |
| Danish | 3 | 0.2% |
| Dutch | 8 | 0.6% |
| Egyptian | 6 | 0.4% |
| English | 222 | 15.6% |
| European | 9 | 0.6% |
| Finnish | 9 | 0.6% |
| French | 28 | 2.0% |
| German | 269 | 18.9% |
| Greek | 49 | 3.5% |
| Hungarian | 10 | 0.7% |
| Indian (Asian) | 36 | 2.5% |
| Irish | 276 | 19.4% |
| Italian | 68 | 4.8% |
| Laotian | 3 | 0.2% |
| Latvian | 2 | 0.1% |
| Lebanese | 16 | 1.1% |
| Lithuanian | 33 | 2.3% |
| Mexican | 10 | 0.7% |
| Nigerian | 4 | 0.3% |
| Northern European | 11 | 0.8% |
| Norwegian | 8 | 0.6% |
| Polish | 70 | 4.9% |
| Portuguese | 16 | 1.1% |
| Puerto Rican | 4 | 0.3% |
| Romanian | 6 | 0.4% |
| Russian | 26 | 1.8% |
| Scotch-Irish | 15 | 1.1% |
| Scottish | 50 | 3.5% |
| Serbian | 3 | 0.2% |
| Slovak | 18 | 1.3% |
| Slovene | 48 | 3.4% |
| South American | 22 | 1.5% |
| Spaniard | 3 | 0.2% |
| Subsaharan African | 15 | 1.1% |
| Swedish | 9 | 0.6% |
| Swiss | 12 | 0.8% |
| Thai | 3 | 0.2% |
| Turkish | 9 | 0.6% |
| Ukrainian | 13 | 0.9% |
| Welsh | 12 | 0.8% |
| West Indian | 3 | 0.2% | View All 51 Rows |
Immigrants in Bratenahl
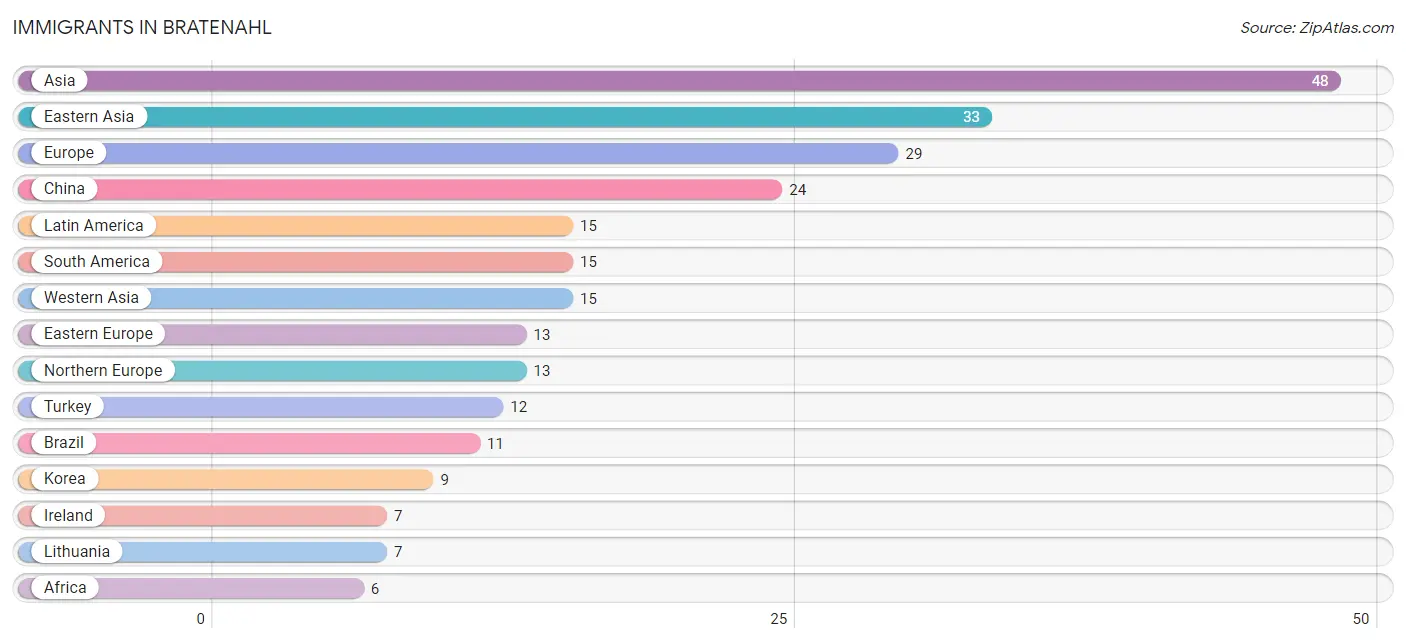
The most numerous immigrant groups reported in Bratenahl came from Asia (48 | 3.4%), Eastern Asia (33 | 2.3%), Europe (29 | 2.0%), China (24 | 1.7%), and Latin America (15 | 1.1%), together accounting for 10.5% of all Bratenahl residents.
| Immigration Origin | # Population | % Population |
| Africa | 6 | 0.4% |
| Asia | 48 | 3.4% |
| Brazil | 11 | 0.8% |
| Canada | 3 | 0.2% |
| China | 24 | 1.7% |
| Colombia | 4 | 0.3% |
| Eastern Asia | 33 | 2.3% |
| Eastern Europe | 13 | 0.9% |
| Egypt | 6 | 0.4% |
| England | 3 | 0.2% |
| Europe | 29 | 2.0% |
| Germany | 3 | 0.2% |
| Ireland | 7 | 0.5% |
| Korea | 9 | 0.6% |
| Latin America | 15 | 1.1% |
| Latvia | 2 | 0.1% |
| Lebanon | 3 | 0.2% |
| Lithuania | 7 | 0.5% |
| Northern Africa | 6 | 0.4% |
| Northern Europe | 13 | 0.9% |
| Scotland | 3 | 0.2% |
| South America | 15 | 1.1% |
| Turkey | 12 | 0.8% |
| Ukraine | 4 | 0.3% |
| Western Asia | 15 | 1.1% |
| Western Europe | 3 | 0.2% | View All 26 Rows |
Sex and Age in Bratenahl
Sex and Age in Bratenahl
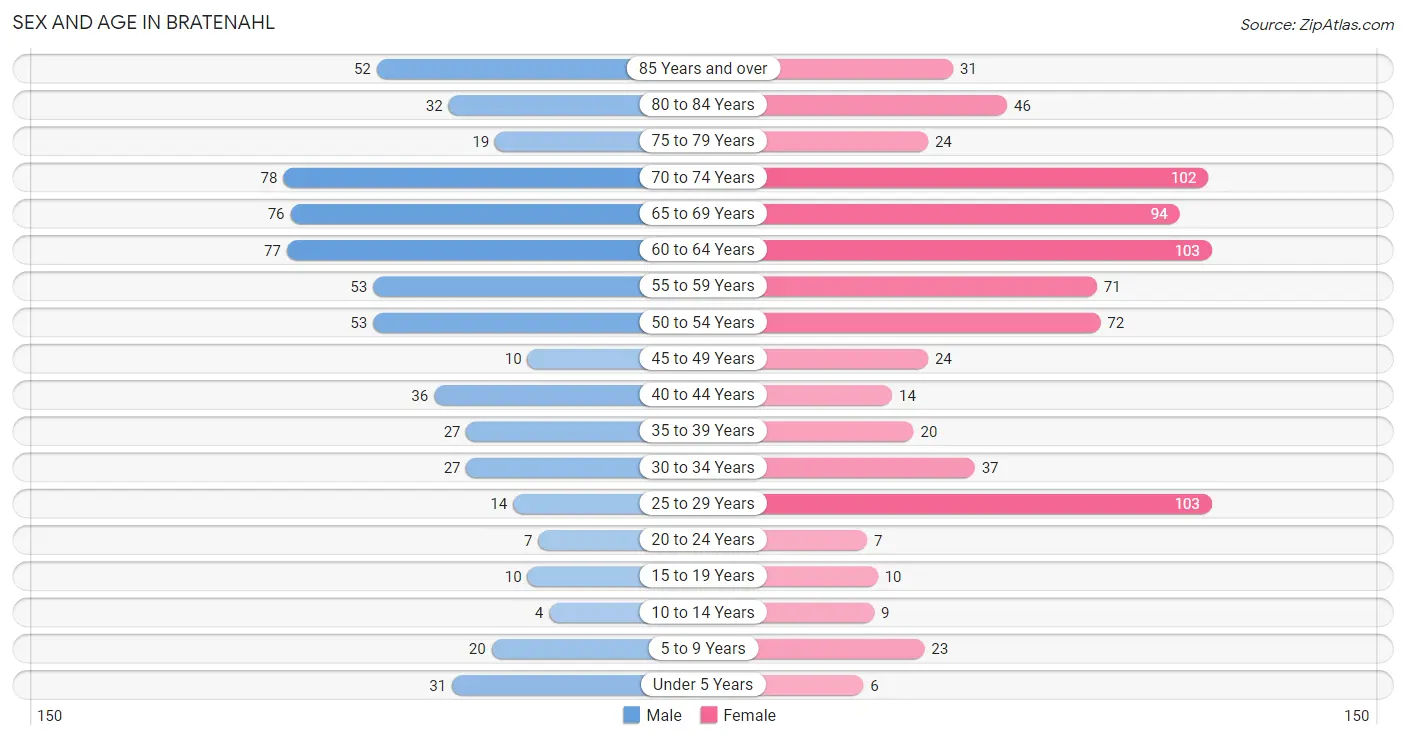
The most populous age groups in Bratenahl are 70 to 74 Years (78 | 12.5%) for men and 25 to 29 Years (103 | 12.9%) for women.
| Age Bracket | Male | Female |
| Under 5 Years | 31 (5.0%) | 6 (0.7%) |
| 5 to 9 Years | 20 (3.2%) | 23 (2.9%) |
| 10 to 14 Years | 4 (0.6%) | 9 (1.1%) |
| 15 to 19 Years | 10 (1.6%) | 10 (1.3%) |
| 20 to 24 Years | 7 (1.1%) | 7 (0.9%) |
| 25 to 29 Years | 14 (2.2%) | 103 (12.9%) |
| 30 to 34 Years | 27 (4.3%) | 37 (4.6%) |
| 35 to 39 Years | 27 (4.3%) | 20 (2.5%) |
| 40 to 44 Years | 36 (5.8%) | 14 (1.8%) |
| 45 to 49 Years | 10 (1.6%) | 24 (3.0%) |
| 50 to 54 Years | 53 (8.5%) | 72 (9.0%) |
| 55 to 59 Years | 53 (8.5%) | 71 (8.9%) |
| 60 to 64 Years | 77 (12.3%) | 103 (12.9%) |
| 65 to 69 Years | 76 (12.1%) | 94 (11.8%) |
| 70 to 74 Years | 78 (12.5%) | 102 (12.8%) |
| 75 to 79 Years | 19 (3.0%) | 24 (3.0%) |
| 80 to 84 Years | 32 (5.1%) | 46 (5.8%) |
| 85 Years and over | 52 (8.3%) | 31 (3.9%) |
| Total | 626 (100.0%) | 796 (100.0%) |
Families and Households in Bratenahl
Median Family Size in Bratenahl
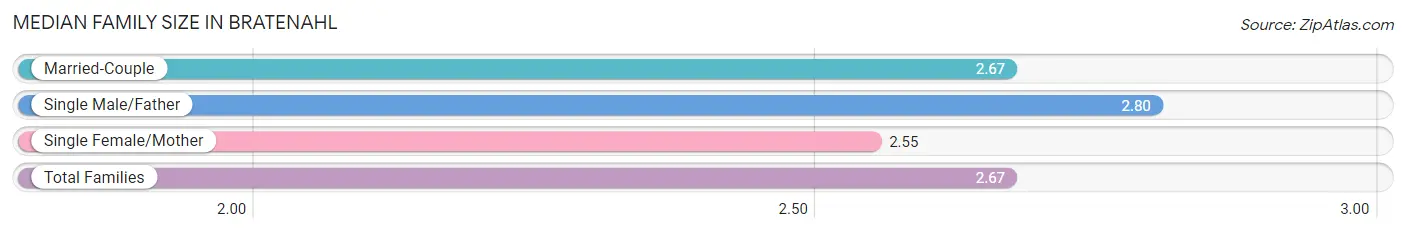
The median family size in Bratenahl is 2.67 persons per family, with single male/father families (20 | 4.9%) accounting for the largest median family size of 2.8 persons per family. On the other hand, single female/mother families (22 | 5.4%) represent the smallest median family size with 2.55 persons per family.
| Family Type | # Families | Family Size |
| Married-Couple | 365 (89.7%) | 2.67 |
| Single Male/Father | 20 (4.9%) | 2.80 |
| Single Female/Mother | 22 (5.4%) | 2.55 |
| Total Families | 407 (100.0%) | 2.67 |
Median Household Size in Bratenahl
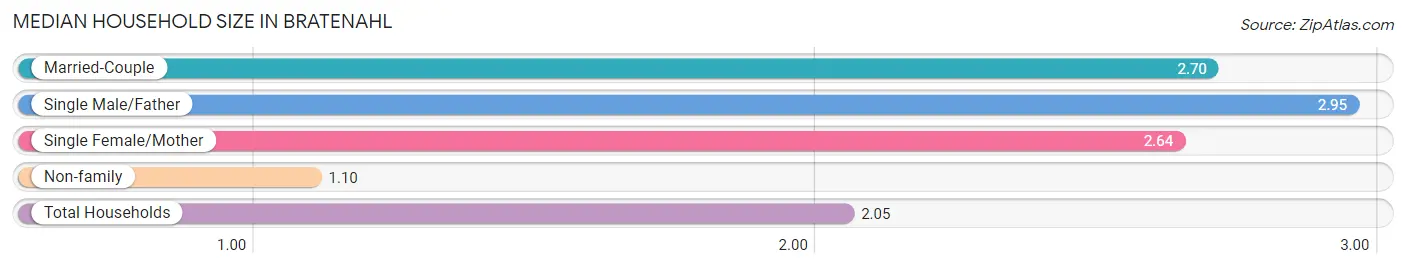
The median household size in Bratenahl is 2.05 persons per household, with single male/father households (20 | 2.9%) accounting for the largest median household size of 2.95 persons per household. non-family households (282 | 40.9%) represent the smallest median household size with 1.10 persons per household.
| Household Type | # Households | Household Size |
| Married-Couple | 365 (53.0%) | 2.70 |
| Single Male/Father | 20 (2.9%) | 2.95 |
| Single Female/Mother | 22 (3.2%) | 2.64 |
| Non-family | 282 (40.9%) | 1.10 |
| Total Households | 689 (100.0%) | 2.05 |
Household Size by Marriage Status in Bratenahl
Out of a total of 689 households in Bratenahl, 407 (59.1%) are family households, while 282 (40.9%) are nonfamily households. The most numerous type of family households are 2-person households, comprising 294, and the most common type of nonfamily households are 1-person households, comprising 258.
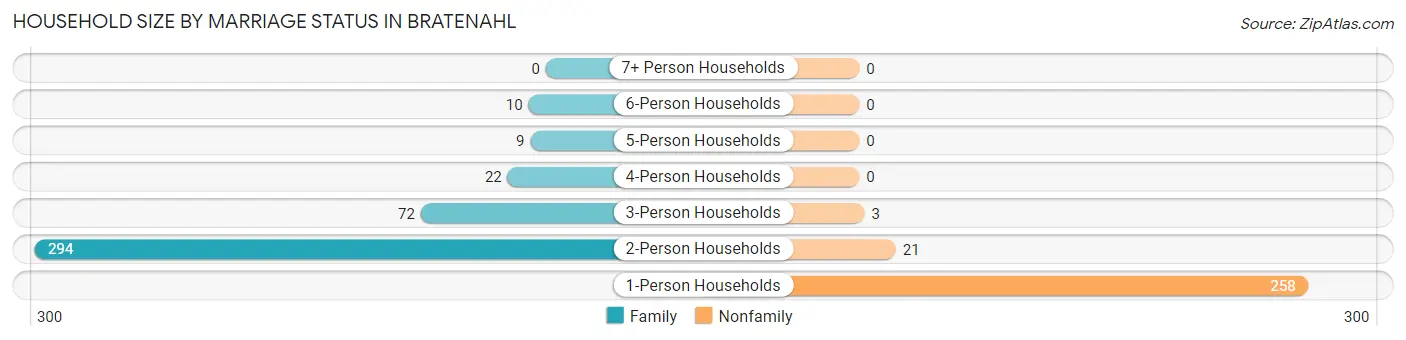
| Household Size | Family Households | Nonfamily Households |
| 1-Person Households | - | 258 (37.4%) |
| 2-Person Households | 294 (42.7%) | 21 (3.0%) |
| 3-Person Households | 72 (10.4%) | 3 (0.4%) |
| 4-Person Households | 22 (3.2%) | 0 (0.0%) |
| 5-Person Households | 9 (1.3%) | 0 (0.0%) |
| 6-Person Households | 10 (1.5%) | 0 (0.0%) |
| 7+ Person Households | 0 (0.0%) | 0 (0.0%) |
| Total | 407 (59.1%) | 282 (40.9%) |
Female Fertility in Bratenahl
Fertility by Age in Bratenahl
Average fertility rate in Bratenahl is 9.0 births per 1,000 women. Women in the age bracket of 35 to 50 years have the highest fertility rate with 31.0 births per 1,000 women. Women in the age bracket of 35 to 50 years acount for 100.0% of all women with births.

| Age Bracket | Women with Births | Births / 1,000 Women |
| 15 to 19 years | 0 (0.0%) | 0.0 |
| 20 to 34 years | 0 (0.0%) | 0.0 |
| 35 to 50 years | 2 (100.0%) | 31.0 |
| Total | 2 (100.0%) | 9.0 |
Fertility by Age by Marriage Status in Bratenahl
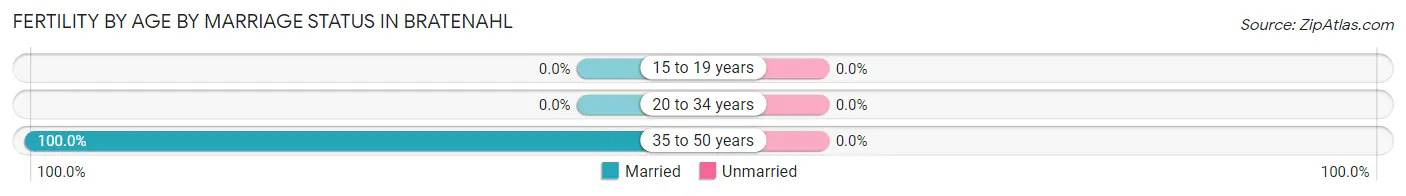
| Age Bracket | Married | Unmarried |
| 15 to 19 years | 0 (0.0%) | 0 (0.0%) |
| 20 to 34 years | 0 (0.0%) | 0 (0.0%) |
| 35 to 50 years | 2 (100.0%) | 0 (0.0%) |
| Total | 2 (100.0%) | 0 (0.0%) |
Fertility by Education in Bratenahl
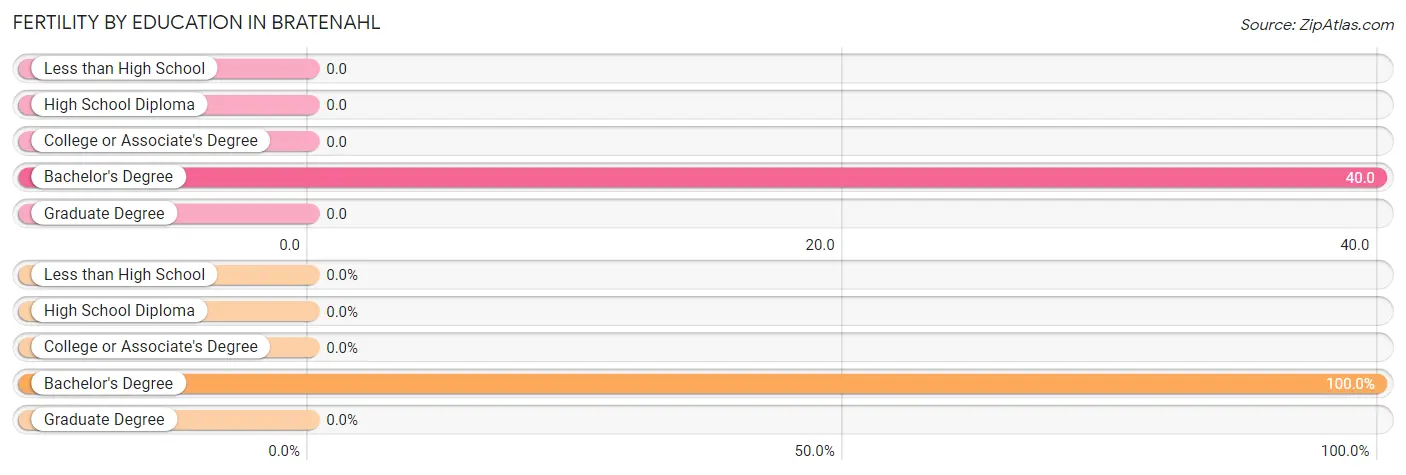
| Educational Attainment | Women with Births | Births / 1,000 Women |
| Less than High School | 0 (0.0%) | 0.0 |
| High School Diploma | 0 (0.0%) | 0.0 |
| College or Associate's Degree | 0 (0.0%) | 0.0 |
| Bachelor's Degree | 2 (100.0%) | 40.0 |
| Graduate Degree | 0 (0.0%) | 0.0 |
| Total | 2 (100.0%) | 9.0 |
Fertility by Education by Marriage Status in Bratenahl
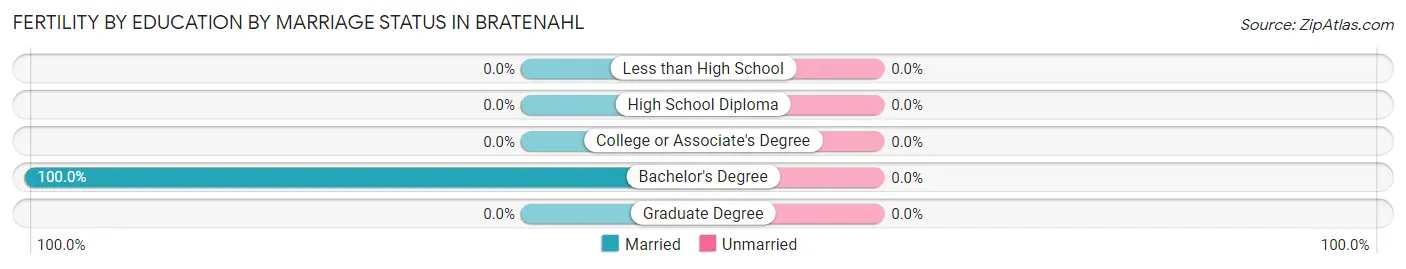
| Educational Attainment | Married | Unmarried |
| Less than High School | 0 (0.0%) | 0 (0.0%) |
| High School Diploma | 0 (0.0%) | 0 (0.0%) |
| College or Associate's Degree | 0 (0.0%) | 0 (0.0%) |
| Bachelor's Degree | 2 (100.0%) | 0 (0.0%) |
| Graduate Degree | 0 (0.0%) | 0 (0.0%) |
| Total | 2 (100.0%) | 0 (0.0%) |
Employment Characteristics in Bratenahl
Employment by Class of Employer in Bratenahl
Among the 769 employed individuals in Bratenahl, private company employees (366 | 47.6%), not-for-profit organizations (159 | 20.7%), and self-employed (not incorporated) (69 | 9.0%) make up the most common classes of employment.
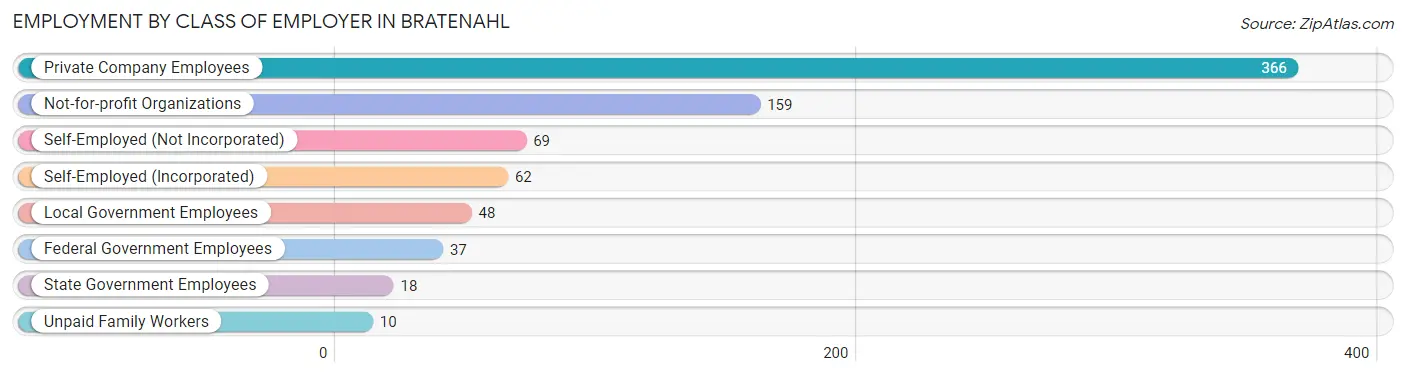
| Employer Class | # Employees | % Employees |
| Private Company Employees | 366 | 47.6% |
| Self-Employed (Incorporated) | 62 | 8.1% |
| Self-Employed (Not Incorporated) | 69 | 9.0% |
| Not-for-profit Organizations | 159 | 20.7% |
| Local Government Employees | 48 | 6.2% |
| State Government Employees | 18 | 2.3% |
| Federal Government Employees | 37 | 4.8% |
| Unpaid Family Workers | 10 | 1.3% |
| Total | 769 | 100.0% |
Employment Status by Age in Bratenahl
According to the labor force statistics for Bratenahl, out of the total population over 16 years of age (1,329), 60.1% or 799 individuals are in the labor force, with 1.4% or 11 of them unemployed. The age group with the highest labor force participation rate is 20 to 24 years, with 100.0% or 14 individuals in the labor force. Within the labor force, the 60 to 64 years age range has the highest percentage of unemployed individuals, with 7.8% or 9 of them being unemployed.
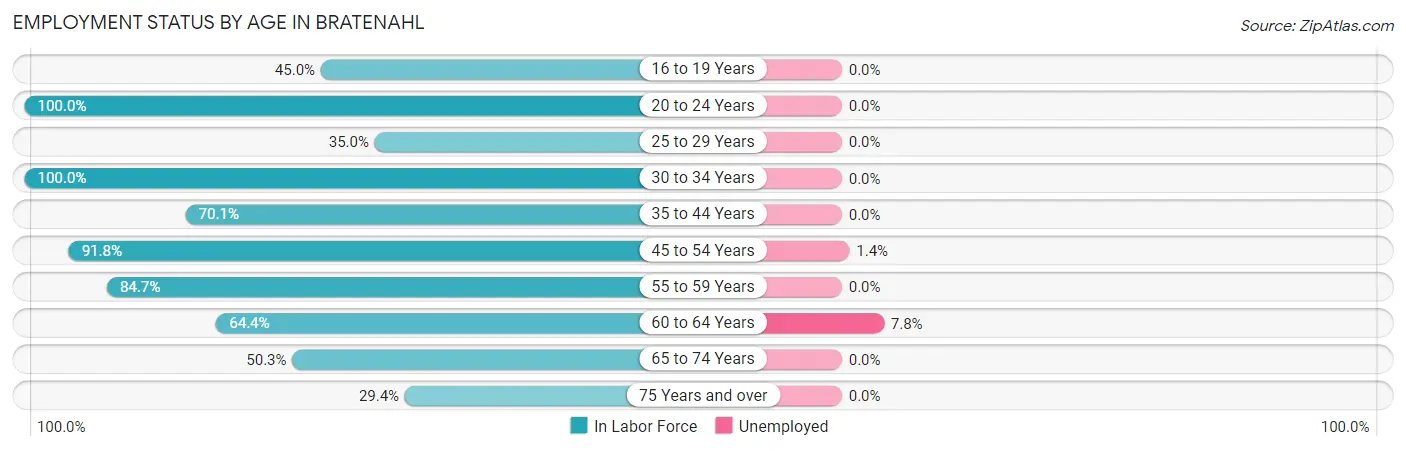
| Age Bracket | In Labor Force | Unemployed |
| 16 to 19 Years | 9 (45.0%) | 0 (0.0%) |
| 20 to 24 Years | 14 (100.0%) | 0 (0.0%) |
| 25 to 29 Years | 41 (35.0%) | 0 (0.0%) |
| 30 to 34 Years | 64 (100.0%) | 0 (0.0%) |
| 35 to 44 Years | 68 (70.1%) | 0 (0.0%) |
| 45 to 54 Years | 146 (91.8%) | 2 (1.4%) |
| 55 to 59 Years | 105 (84.7%) | 0 (0.0%) |
| 60 to 64 Years | 116 (64.4%) | 9 (7.8%) |
| 65 to 74 Years | 176 (50.3%) | 0 (0.0%) |
| 75 Years and over | 60 (29.4%) | 0 (0.0%) |
| Total | 799 (60.1%) | 11 (1.4%) |
Employment Status by Educational Attainment in Bratenahl
According to labor force statistics for Bratenahl, 72.9% of individuals (540) out of the total population between 25 and 64 years of age (741) are in the labor force, with 2.0% or 11 of them being unemployed. The group with the highest labor force participation rate are those with the educational attainment of bachelor's degree or higher, with 82.0% or 374 individuals in the labor force. Within the labor force, individuals with college / associate degree education have the highest percentage of unemployment, with 10.2% or 11 of them being unemployed.
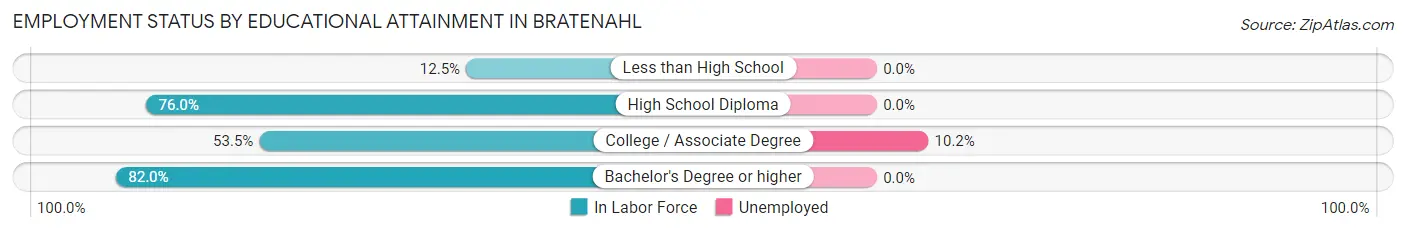
| Educational Attainment | In Labor Force | Unemployed |
| Less than High School | 1 (12.5%) | 0 (0.0%) |
| High School Diploma | 57 (76.0%) | 0 (0.0%) |
| College / Associate Degree | 108 (53.5%) | 21 (10.2%) |
| Bachelor's Degree or higher | 374 (82.0%) | 0 (0.0%) |
| Total | 540 (72.9%) | 15 (2.0%) |
Employment Occupations by Sex in Bratenahl
Management, Business, Science and Arts Occupations
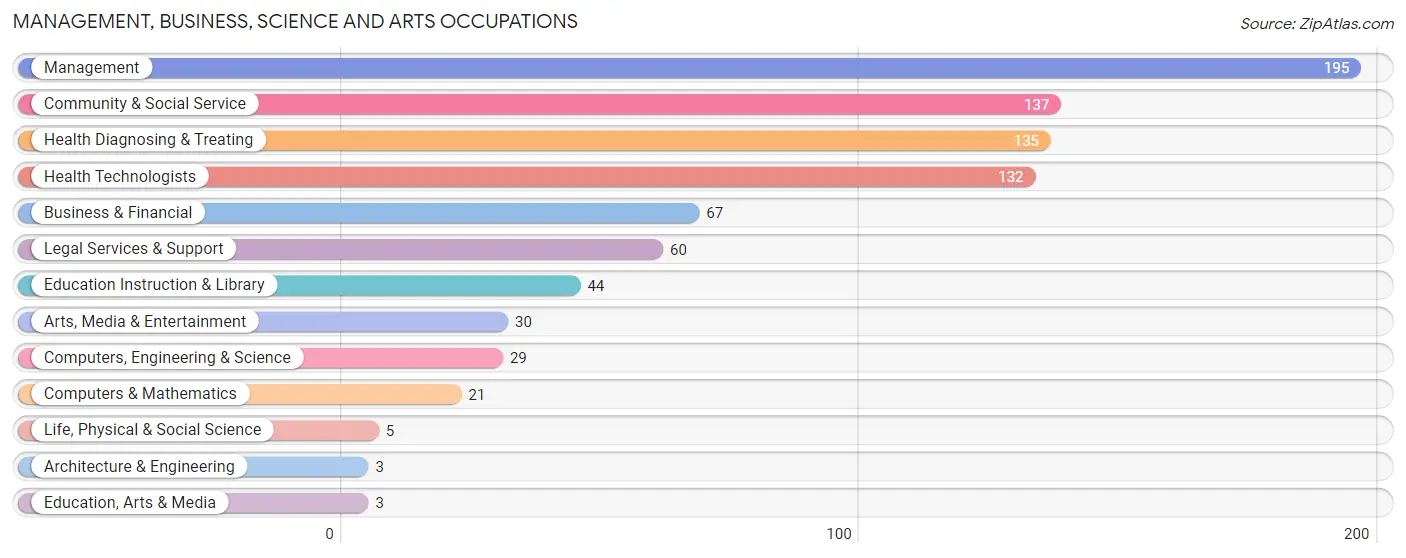
The most common Management, Business, Science and Arts occupations in Bratenahl are Management (195 | 24.7%), Community & Social Service (137 | 17.4%), Health Diagnosing & Treating (135 | 17.1%), Health Technologists (132 | 16.8%), and Business & Financial (67 | 8.5%).
Management, Business, Science and Arts Occupations by Sex
Within the Management, Business, Science and Arts occupations in Bratenahl, the most male-oriented occupations are Architecture & Engineering (100.0%), Legal Services & Support (93.3%), and Computers & Mathematics (66.7%), while the most female-oriented occupations are Life, Physical & Social Science (100.0%), Education, Arts & Media (100.0%), and Education Instruction & Library (86.4%).
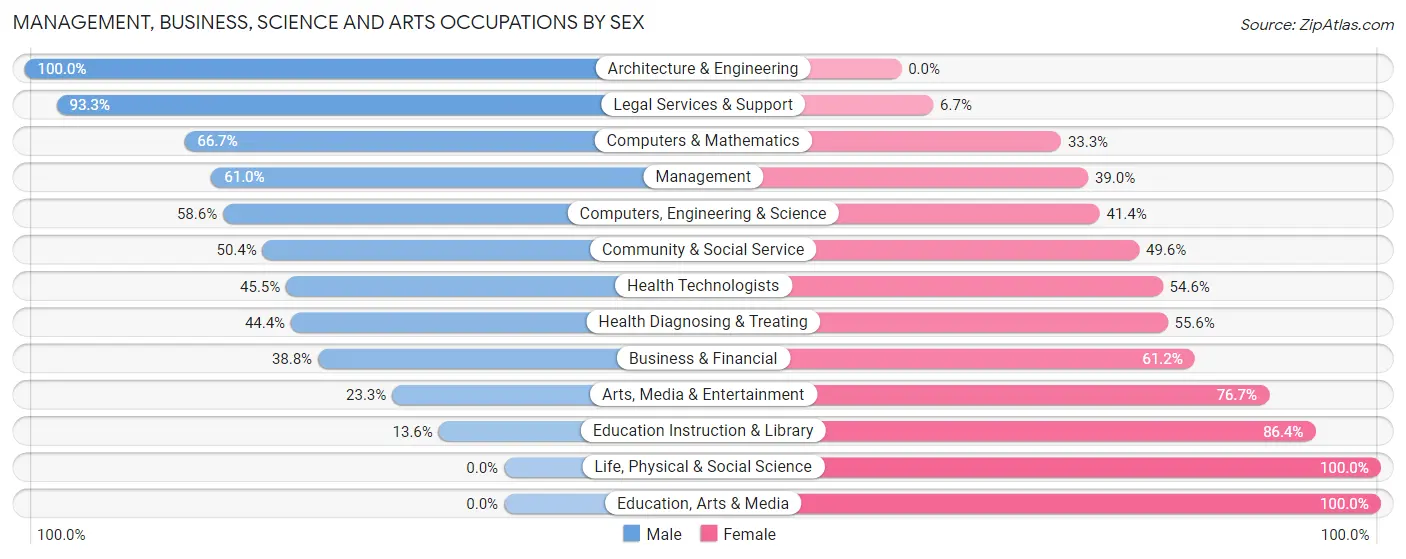
| Occupation | Male | Female |
| Management | 119 (61.0%) | 76 (39.0%) |
| Business & Financial | 26 (38.8%) | 41 (61.2%) |
| Computers, Engineering & Science | 17 (58.6%) | 12 (41.4%) |
| Computers & Mathematics | 14 (66.7%) | 7 (33.3%) |
| Architecture & Engineering | 3 (100.0%) | 0 (0.0%) |
| Life, Physical & Social Science | 0 (0.0%) | 5 (100.0%) |
| Community & Social Service | 69 (50.4%) | 68 (49.6%) |
| Education, Arts & Media | 0 (0.0%) | 3 (100.0%) |
| Legal Services & Support | 56 (93.3%) | 4 (6.7%) |
| Education Instruction & Library | 6 (13.6%) | 38 (86.4%) |
| Arts, Media & Entertainment | 7 (23.3%) | 23 (76.7%) |
| Health Diagnosing & Treating | 60 (44.4%) | 75 (55.6%) |
| Health Technologists | 60 (45.5%) | 72 (54.5%) |
| Total (Category) | 291 (51.7%) | 272 (48.3%) |
| Total (Overall) | 412 (52.3%) | 376 (47.7%) |
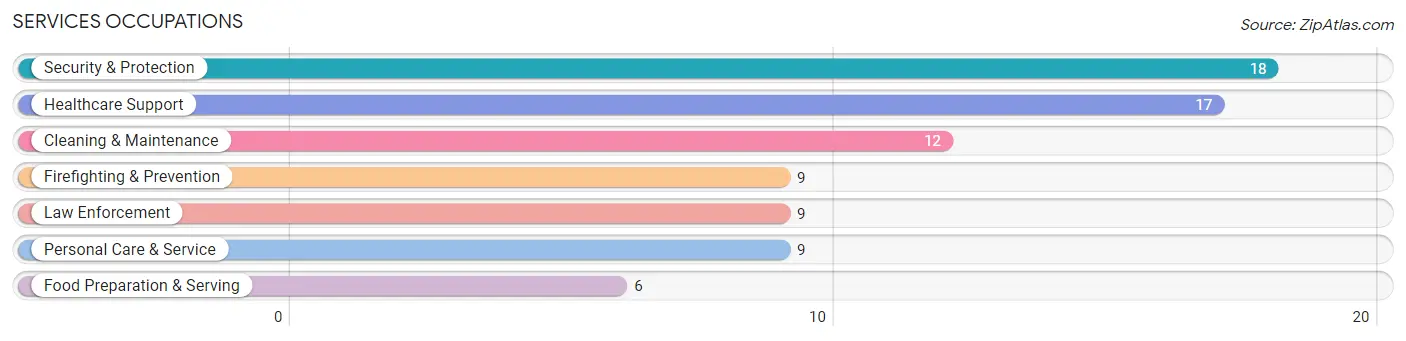
Services Occupations
The most common Services occupations in Bratenahl are Security & Protection (18 | 2.3%), Healthcare Support (17 | 2.2%), Cleaning & Maintenance (12 | 1.5%), Firefighting & Prevention (9 | 1.1%), and Law Enforcement (9 | 1.1%).
Services Occupations by Sex
Within the Services occupations in Bratenahl, the most male-oriented occupations are Law Enforcement (100.0%), Security & Protection (83.3%), and Healthcare Support (70.6%), while the most female-oriented occupations are Food Preparation & Serving (100.0%), Personal Care & Service (66.7%), and Firefighting & Prevention (33.3%).
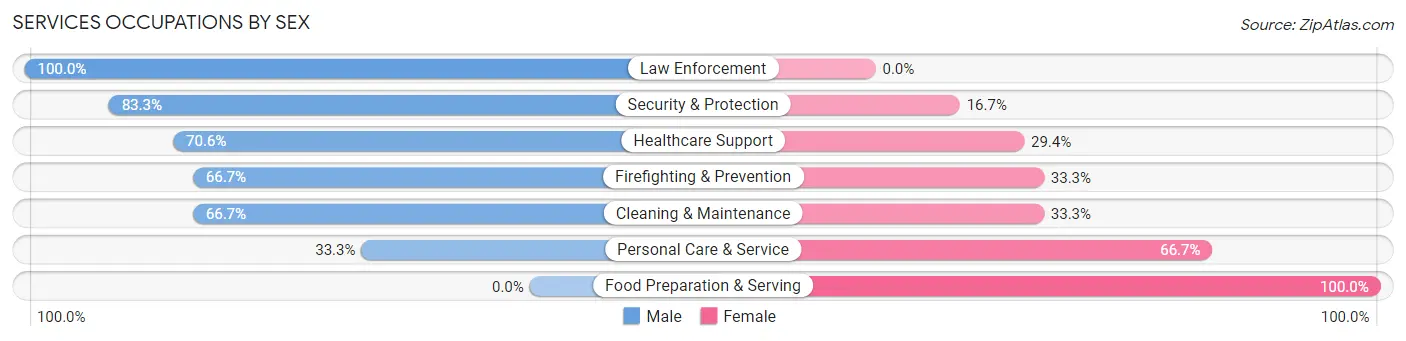
| Occupation | Male | Female |
| Healthcare Support | 12 (70.6%) | 5 (29.4%) |
| Security & Protection | 15 (83.3%) | 3 (16.7%) |
| Firefighting & Prevention | 6 (66.7%) | 3 (33.3%) |
| Law Enforcement | 9 (100.0%) | 0 (0.0%) |
| Food Preparation & Serving | 0 (0.0%) | 6 (100.0%) |
| Cleaning & Maintenance | 8 (66.7%) | 4 (33.3%) |
| Personal Care & Service | 3 (33.3%) | 6 (66.7%) |
| Total (Category) | 38 (61.3%) | 24 (38.7%) |
| Total (Overall) | 412 (52.3%) | 376 (47.7%) |
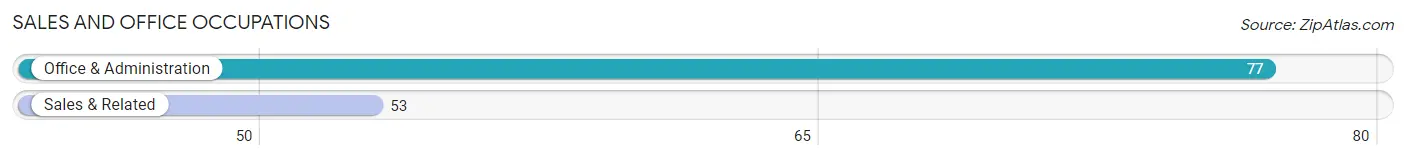
Sales and Office Occupations
The most common Sales and Office occupations in Bratenahl are Office & Administration (77 | 9.8%), and Sales & Related (53 | 6.7%).
Sales and Office Occupations by Sex
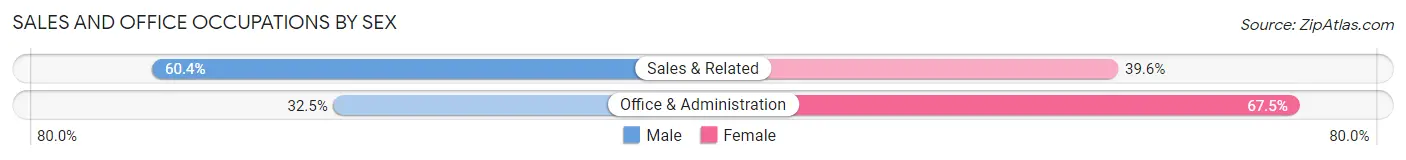
| Occupation | Male | Female |
| Sales & Related | 32 (60.4%) | 21 (39.6%) |
| Office & Administration | 25 (32.5%) | 52 (67.5%) |
| Total (Category) | 57 (43.9%) | 73 (56.1%) |
| Total (Overall) | 412 (52.3%) | 376 (47.7%) |
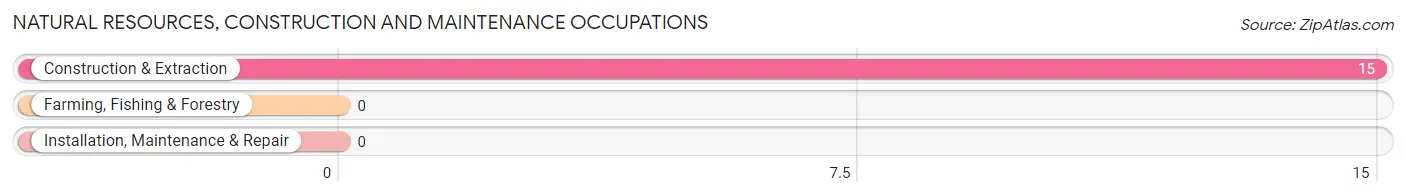
Natural Resources, Construction and Maintenance Occupations
The most common Natural Resources, Construction and Maintenance occupations in Bratenahl are , and Construction & Extraction (15 | 1.9%).
Natural Resources, Construction and Maintenance Occupations by Sex
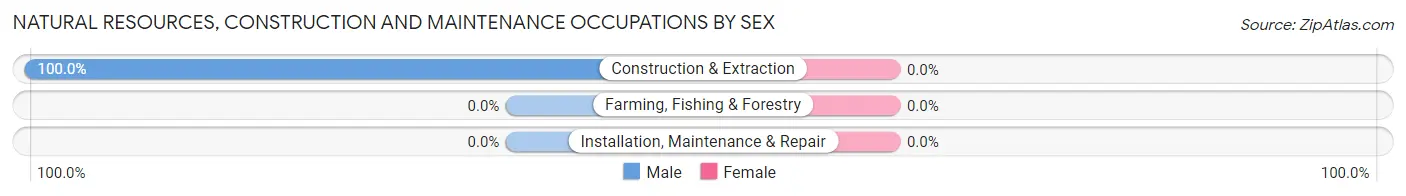
| Occupation | Male | Female |
| Farming, Fishing & Forestry | 0 (0.0%) | 0 (0.0%) |
| Construction & Extraction | 15 (100.0%) | 0 (0.0%) |
| Installation, Maintenance & Repair | 0 (0.0%) | 0 (0.0%) |
| Total (Category) | 15 (100.0%) | 0 (0.0%) |
| Total (Overall) | 412 (52.3%) | 376 (47.7%) |
Production, Transportation and Moving Occupations
The most common Production, Transportation and Moving occupations in Bratenahl are Production (13 | 1.7%), Transportation (3 | 0.4%), and Material Moving (2 | 0.3%).
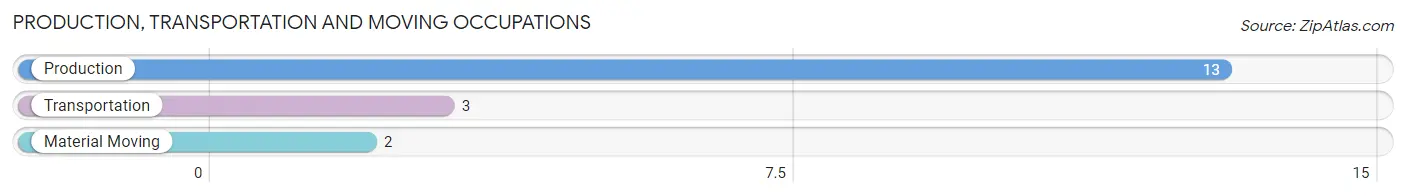
Production, Transportation and Moving Occupations by Sex
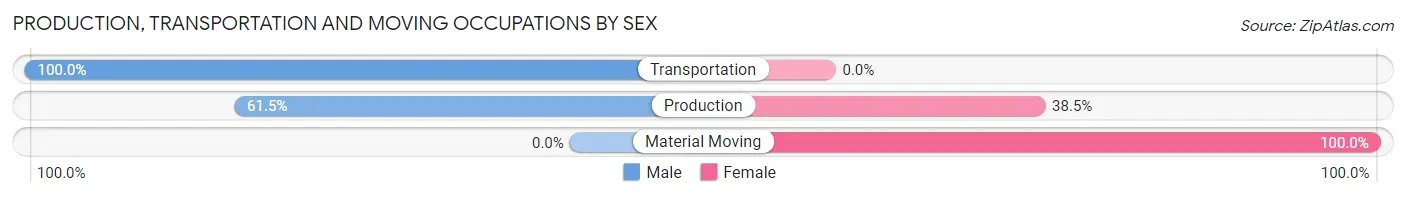
| Occupation | Male | Female |
| Production | 8 (61.5%) | 5 (38.5%) |
| Transportation | 3 (100.0%) | 0 (0.0%) |
| Material Moving | 0 (0.0%) | 2 (100.0%) |
| Total (Category) | 11 (61.1%) | 7 (38.9%) |
| Total (Overall) | 412 (52.3%) | 376 (47.7%) |
Employment Industries by Sex in Bratenahl
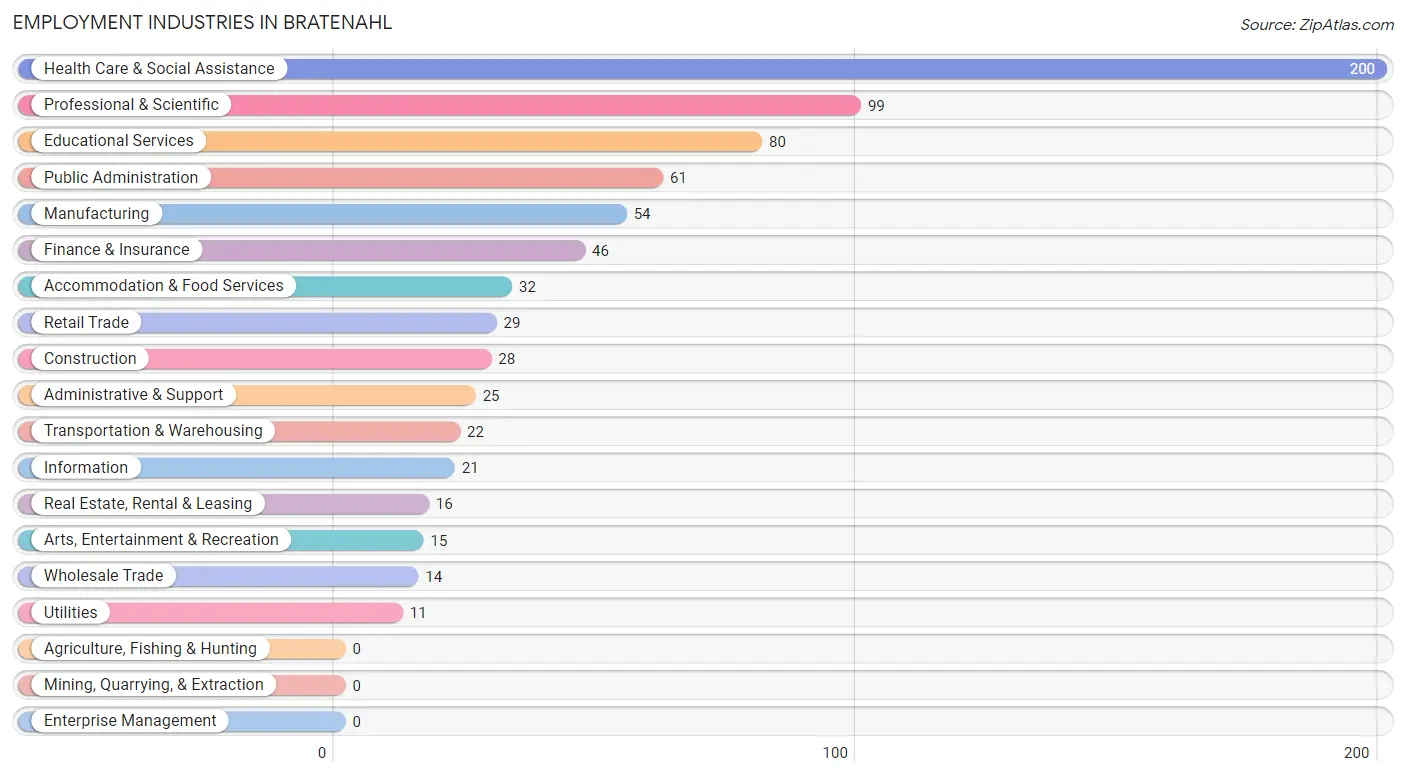
Employment Industries in Bratenahl
The major employment industries in Bratenahl include Health Care & Social Assistance (200 | 25.4%), Professional & Scientific (99 | 12.6%), Educational Services (80 | 10.2%), Public Administration (61 | 7.7%), and Manufacturing (54 | 6.9%).
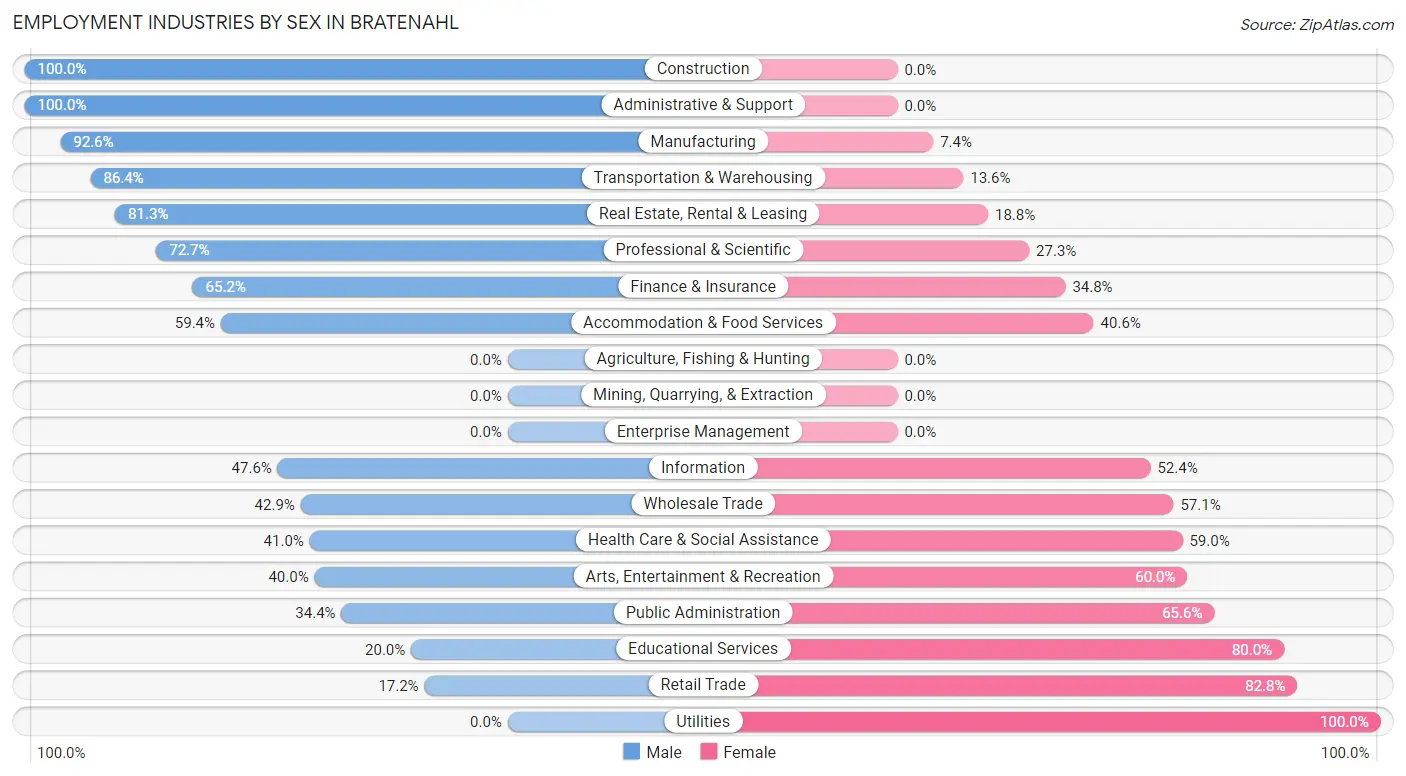
Employment Industries by Sex in Bratenahl
The Bratenahl industries that see more men than women are Construction (100.0%), Administrative & Support (100.0%), and Manufacturing (92.6%), whereas the industries that tend to have a higher number of women are Utilities (100.0%), Retail Trade (82.8%), and Educational Services (80.0%).
| Industry | Male | Female |
| Agriculture, Fishing & Hunting | 0 (0.0%) | 0 (0.0%) |
| Mining, Quarrying, & Extraction | 0 (0.0%) | 0 (0.0%) |
| Construction | 28 (100.0%) | 0 (0.0%) |
| Manufacturing | 50 (92.6%) | 4 (7.4%) |
| Wholesale Trade | 6 (42.9%) | 8 (57.1%) |
| Retail Trade | 5 (17.2%) | 24 (82.8%) |
| Transportation & Warehousing | 19 (86.4%) | 3 (13.6%) |
| Utilities | 0 (0.0%) | 11 (100.0%) |
| Information | 10 (47.6%) | 11 (52.4%) |
| Finance & Insurance | 30 (65.2%) | 16 (34.8%) |
| Real Estate, Rental & Leasing | 13 (81.2%) | 3 (18.8%) |
| Professional & Scientific | 72 (72.7%) | 27 (27.3%) |
| Enterprise Management | 0 (0.0%) | 0 (0.0%) |
| Administrative & Support | 25 (100.0%) | 0 (0.0%) |
| Educational Services | 16 (20.0%) | 64 (80.0%) |
| Health Care & Social Assistance | 82 (41.0%) | 118 (59.0%) |
| Arts, Entertainment & Recreation | 6 (40.0%) | 9 (60.0%) |
| Accommodation & Food Services | 19 (59.4%) | 13 (40.6%) |
| Public Administration | 21 (34.4%) | 40 (65.6%) |
| Total | 412 (52.3%) | 376 (47.7%) |
Education in Bratenahl
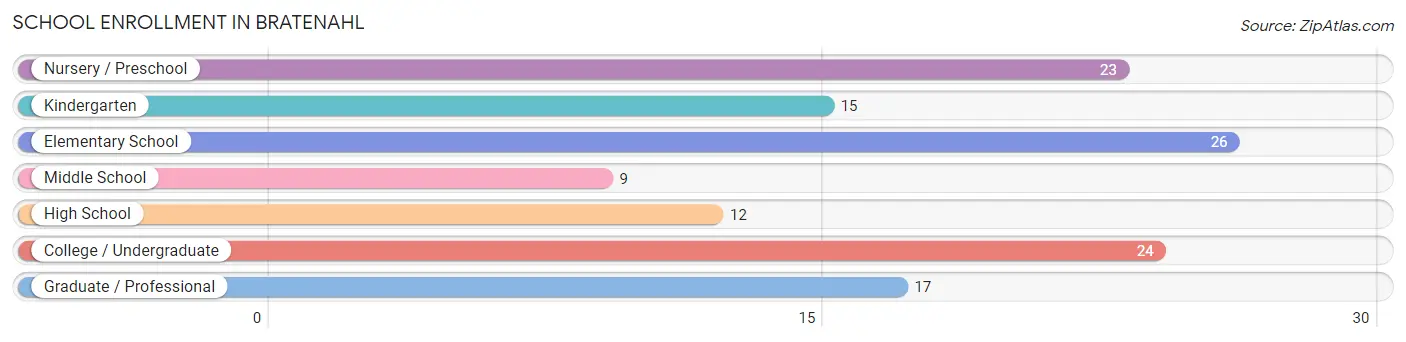
School Enrollment in Bratenahl
The most common levels of schooling among the 126 students in Bratenahl are elementary school (26 | 20.6%), college / undergraduate (24 | 19.1%), and nursery / preschool (23 | 18.2%).
| School Level | # Students | % Students |
| Nursery / Preschool | 23 | 18.2% |
| Kindergarten | 15 | 11.9% |
| Elementary School | 26 | 20.6% |
| Middle School | 9 | 7.1% |
| High School | 12 | 9.5% |
| College / Undergraduate | 24 | 19.1% |
| Graduate / Professional | 17 | 13.5% |
| Total | 126 | 100.0% |
School Enrollment by Age by Funding Source in Bratenahl
Out of a total of 126 students who are enrolled in schools in Bratenahl, 66 (52.4%) attend a private institution, while the remaining 60 (47.6%) are enrolled in public schools. The age group of 10 to 14 year olds has the highest likelihood of being enrolled in private schools, with 11 (84.6% in the age bracket) enrolled. Conversely, the age group of 20 to 24 year olds has the lowest likelihood of being enrolled in a private school, with 8 (100.0% in the age bracket) attending a public institution.
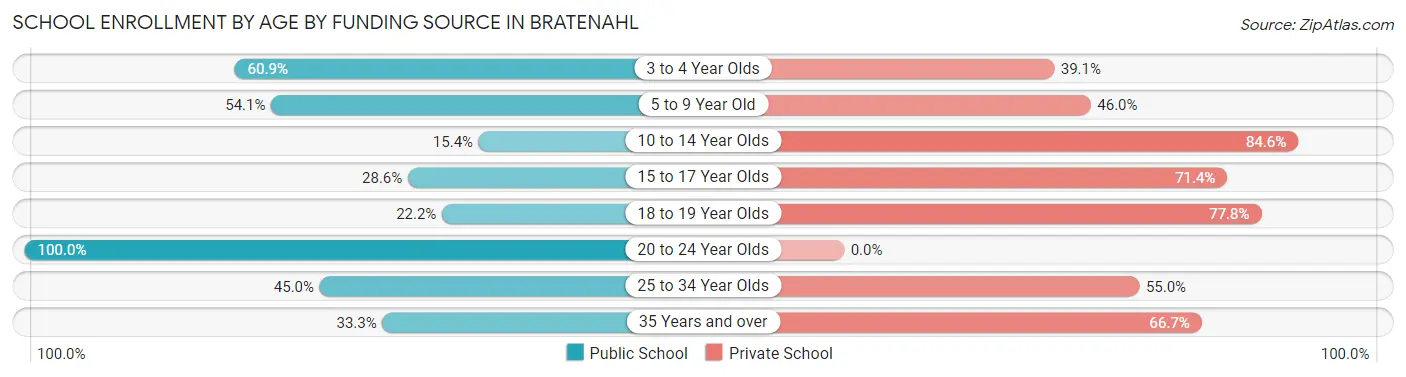
| Age Bracket | Public School | Private School |
| 3 to 4 Year Olds | 14 (60.9%) | 9 (39.1%) |
| 5 to 9 Year Old | 20 (54.0%) | 17 (46.0%) |
| 10 to 14 Year Olds | 2 (15.4%) | 11 (84.6%) |
| 15 to 17 Year Olds | 2 (28.6%) | 5 (71.4%) |
| 18 to 19 Year Olds | 2 (22.2%) | 7 (77.8%) |
| 20 to 24 Year Olds | 8 (100.0%) | 0 (0.0%) |
| 25 to 34 Year Olds | 9 (45.0%) | 11 (55.0%) |
| 35 Years and over | 3 (33.3%) | 6 (66.7%) |
| Total | 60 (47.6%) | 66 (52.4%) |
Educational Attainment by Field of Study in Bratenahl
Business (133 | 14.0%), social sciences (104 | 11.0%), science & technology (94 | 9.9%), visual & performing arts (84 | 8.9%), and liberal arts & history (78 | 8.2%) are the most common fields of study among 947 individuals in Bratenahl who have obtained a bachelor's degree or higher.
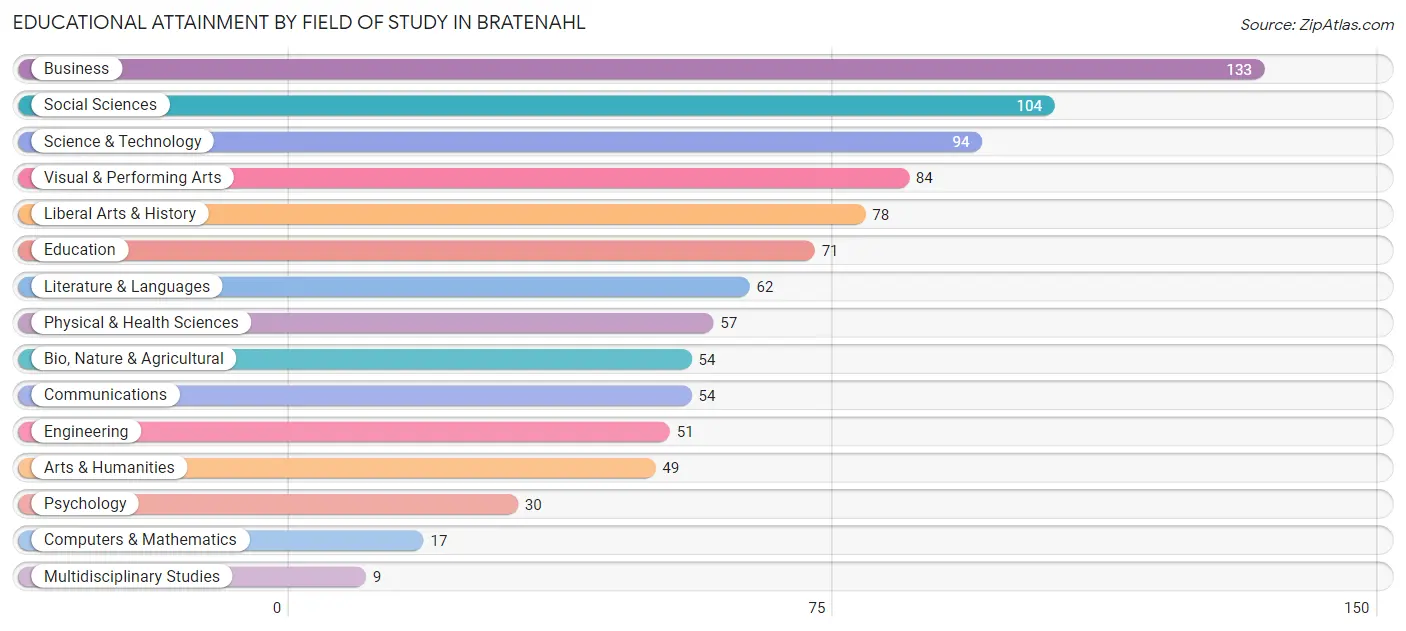
| Field of Study | # Graduates | % Graduates |
| Computers & Mathematics | 17 | 1.8% |
| Bio, Nature & Agricultural | 54 | 5.7% |
| Physical & Health Sciences | 57 | 6.0% |
| Psychology | 30 | 3.2% |
| Social Sciences | 104 | 11.0% |
| Engineering | 51 | 5.4% |
| Multidisciplinary Studies | 9 | 0.9% |
| Science & Technology | 94 | 9.9% |
| Business | 133 | 14.0% |
| Education | 71 | 7.5% |
| Literature & Languages | 62 | 6.6% |
| Liberal Arts & History | 78 | 8.2% |
| Visual & Performing Arts | 84 | 8.9% |
| Communications | 54 | 5.7% |
| Arts & Humanities | 49 | 5.2% |
| Total | 947 | 100.0% |
Transportation & Commute in Bratenahl
Vehicle Availability by Sex in Bratenahl
The most prevalent vehicle ownership categories in Bratenahl are males with 2 vehicles (200, accounting for 50.1%) and females with 2 vehicles (183, making up 54.6%).
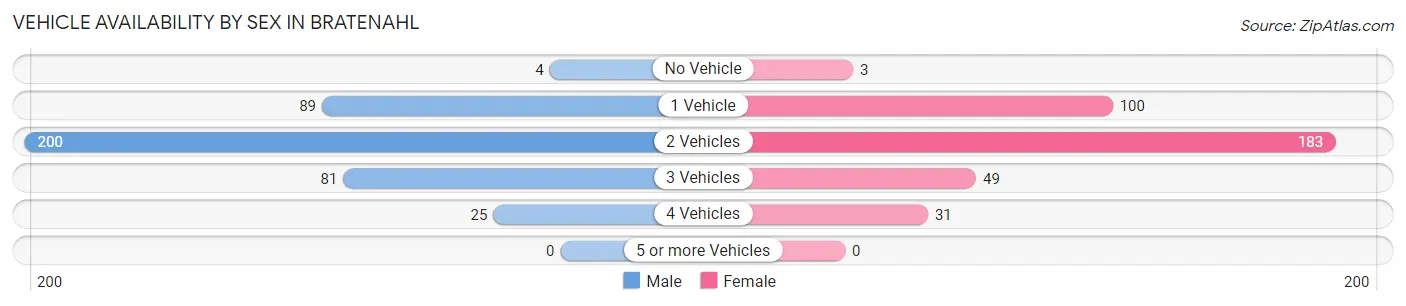
| Vehicles Available | Male | Female |
| No Vehicle | 4 (1.0%) | 3 (0.8%) |
| 1 Vehicle | 89 (22.3%) | 100 (27.3%) |
| 2 Vehicles | 200 (50.1%) | 183 (50.0%) |
| 3 Vehicles | 81 (20.3%) | 49 (13.4%) |
| 4 Vehicles | 25 (6.3%) | 31 (8.5%) |
| 5 or more Vehicles | 0 (0.0%) | 0 (0.0%) |
| Total | 399 (100.0%) | 366 (100.0%) |
Commute Time in Bratenahl
The most frequently occuring commute durations in Bratenahl are 15 to 19 minutes (134 commuters, 21.5%), 20 to 24 minutes (104 commuters, 16.7%), and 25 to 29 minutes (90 commuters, 14.5%).
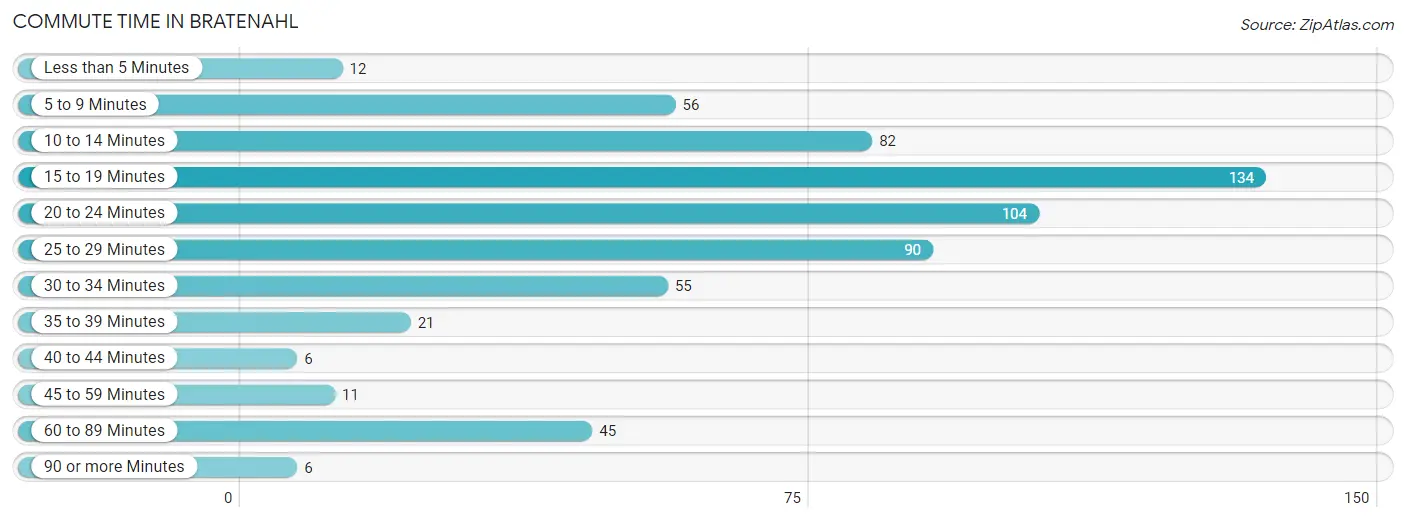
| Commute Time | # Commuters | % Commuters |
| Less than 5 Minutes | 12 | 1.9% |
| 5 to 9 Minutes | 56 | 9.0% |
| 10 to 14 Minutes | 82 | 13.2% |
| 15 to 19 Minutes | 134 | 21.5% |
| 20 to 24 Minutes | 104 | 16.7% |
| 25 to 29 Minutes | 90 | 14.5% |
| 30 to 34 Minutes | 55 | 8.8% |
| 35 to 39 Minutes | 21 | 3.4% |
| 40 to 44 Minutes | 6 | 1.0% |
| 45 to 59 Minutes | 11 | 1.8% |
| 60 to 89 Minutes | 45 | 7.2% |
| 90 or more Minutes | 6 | 1.0% |
Commute Time by Sex in Bratenahl
The most common commute times in Bratenahl are 15 to 19 minutes (81 commuters, 25.6%) for males and 25 to 29 minutes (61 commuters, 20.0%) for females.
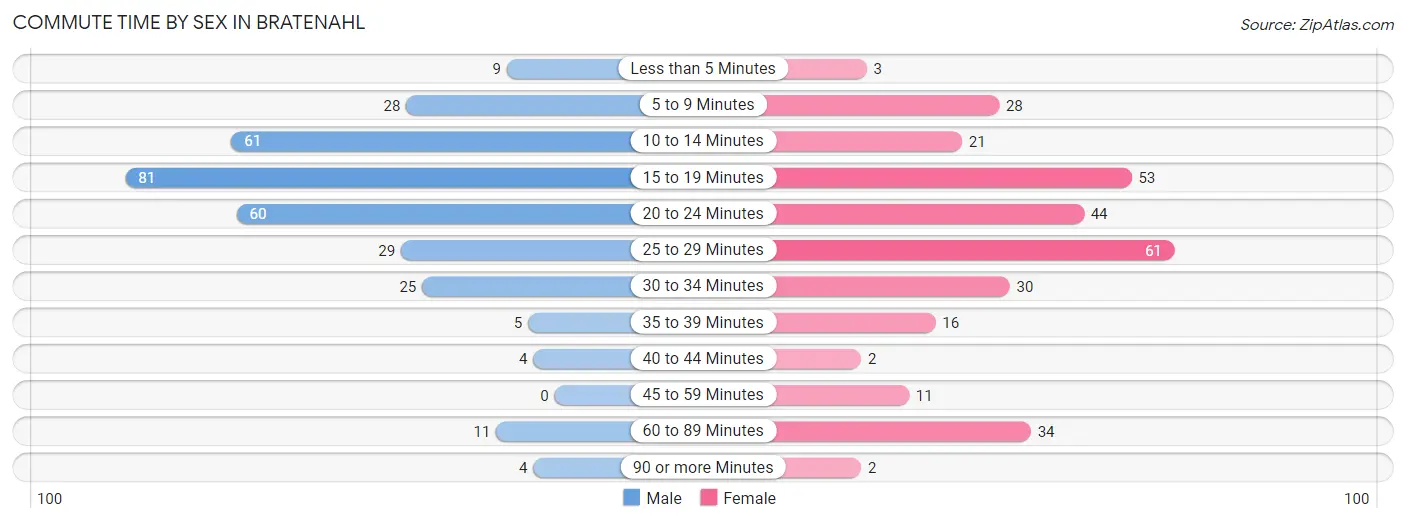
| Commute Time | Male | Female |
| Less than 5 Minutes | 9 (2.8%) | 3 (1.0%) |
| 5 to 9 Minutes | 28 (8.8%) | 28 (9.2%) |
| 10 to 14 Minutes | 61 (19.2%) | 21 (6.9%) |
| 15 to 19 Minutes | 81 (25.6%) | 53 (17.4%) |
| 20 to 24 Minutes | 60 (18.9%) | 44 (14.4%) |
| 25 to 29 Minutes | 29 (9.1%) | 61 (20.0%) |
| 30 to 34 Minutes | 25 (7.9%) | 30 (9.8%) |
| 35 to 39 Minutes | 5 (1.6%) | 16 (5.2%) |
| 40 to 44 Minutes | 4 (1.3%) | 2 (0.7%) |
| 45 to 59 Minutes | 0 (0.0%) | 11 (3.6%) |
| 60 to 89 Minutes | 11 (3.5%) | 34 (11.2%) |
| 90 or more Minutes | 4 (1.3%) | 2 (0.7%) |
Time of Departure to Work by Sex in Bratenahl
The most frequent times of departure to work in Bratenahl are 8:00 AM to 8:29 AM (66, 20.8%) for males and 7:00 AM to 7:29 AM (58, 19.0%) for females.
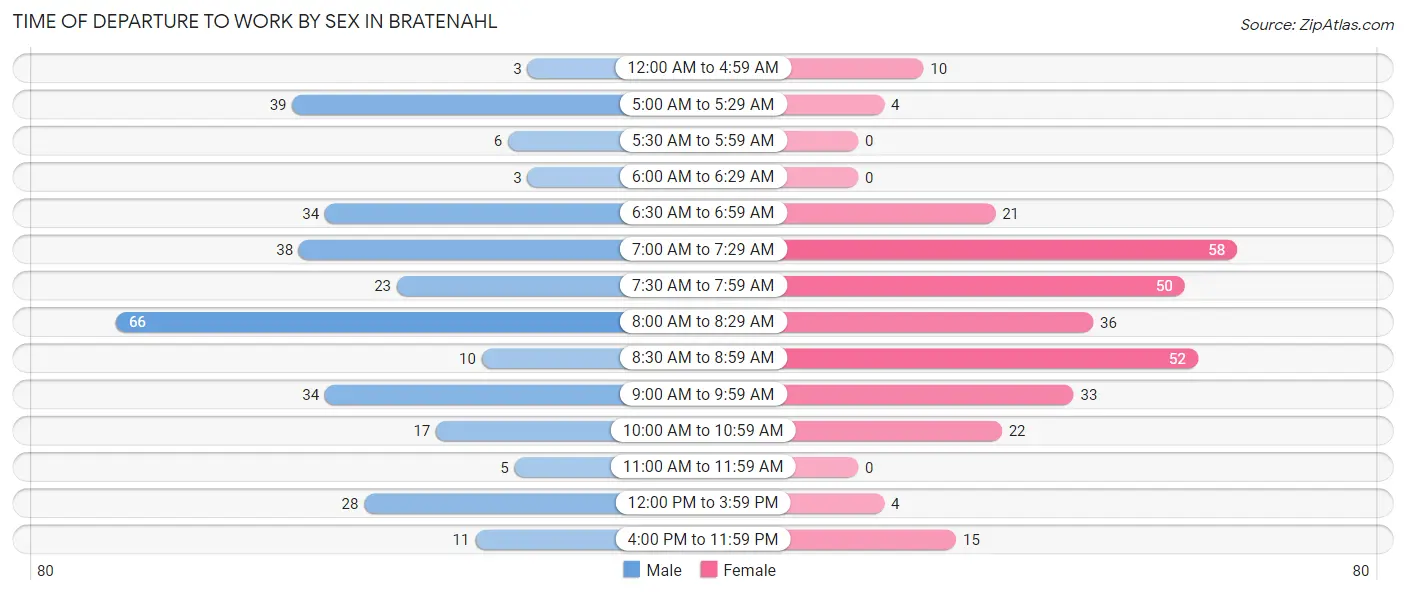
| Time of Departure | Male | Female |
| 12:00 AM to 4:59 AM | 3 (0.9%) | 10 (3.3%) |
| 5:00 AM to 5:29 AM | 39 (12.3%) | 4 (1.3%) |
| 5:30 AM to 5:59 AM | 6 (1.9%) | 0 (0.0%) |
| 6:00 AM to 6:29 AM | 3 (0.9%) | 0 (0.0%) |
| 6:30 AM to 6:59 AM | 34 (10.7%) | 21 (6.9%) |
| 7:00 AM to 7:29 AM | 38 (12.0%) | 58 (19.0%) |
| 7:30 AM to 7:59 AM | 23 (7.3%) | 50 (16.4%) |
| 8:00 AM to 8:29 AM | 66 (20.8%) | 36 (11.8%) |
| 8:30 AM to 8:59 AM | 10 (3.2%) | 52 (17.1%) |
| 9:00 AM to 9:59 AM | 34 (10.7%) | 33 (10.8%) |
| 10:00 AM to 10:59 AM | 17 (5.4%) | 22 (7.2%) |
| 11:00 AM to 11:59 AM | 5 (1.6%) | 0 (0.0%) |
| 12:00 PM to 3:59 PM | 28 (8.8%) | 4 (1.3%) |
| 4:00 PM to 11:59 PM | 11 (3.5%) | 15 (4.9%) |
| Total | 317 (100.0%) | 305 (100.0%) |
Housing Occupancy in Bratenahl
Occupancy by Ownership in Bratenahl
Of the total 689 dwellings in Bratenahl, owner-occupied units account for 563 (81.7%), while renter-occupied units make up 126 (18.3%).
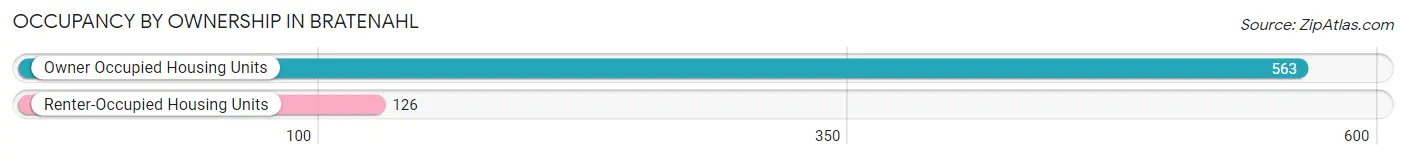
| Occupancy | # Housing Units | % Housing Units |
| Owner Occupied Housing Units | 563 | 81.7% |
| Renter-Occupied Housing Units | 126 | 18.3% |
| Total Occupied Housing Units | 689 | 100.0% |
Occupancy by Household Size in Bratenahl
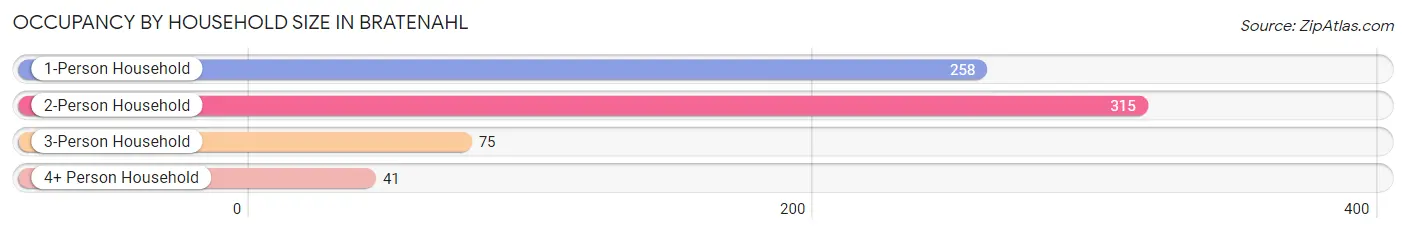
| Household Size | # Housing Units | % Housing Units |
| 1-Person Household | 258 | 37.4% |
| 2-Person Household | 315 | 45.7% |
| 3-Person Household | 75 | 10.9% |
| 4+ Person Household | 41 | 5.9% |
| Total Housing Units | 689 | 100.0% |
Occupancy by Ownership by Household Size in Bratenahl
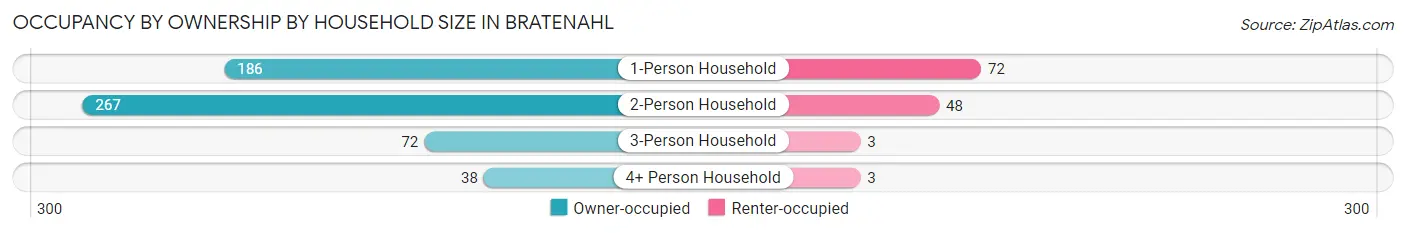
| Household Size | Owner-occupied | Renter-occupied |
| 1-Person Household | 186 (72.1%) | 72 (27.9%) |
| 2-Person Household | 267 (84.8%) | 48 (15.2%) |
| 3-Person Household | 72 (96.0%) | 3 (4.0%) |
| 4+ Person Household | 38 (92.7%) | 3 (7.3%) |
| Total Housing Units | 563 (81.7%) | 126 (18.3%) |
Occupancy by Educational Attainment in Bratenahl
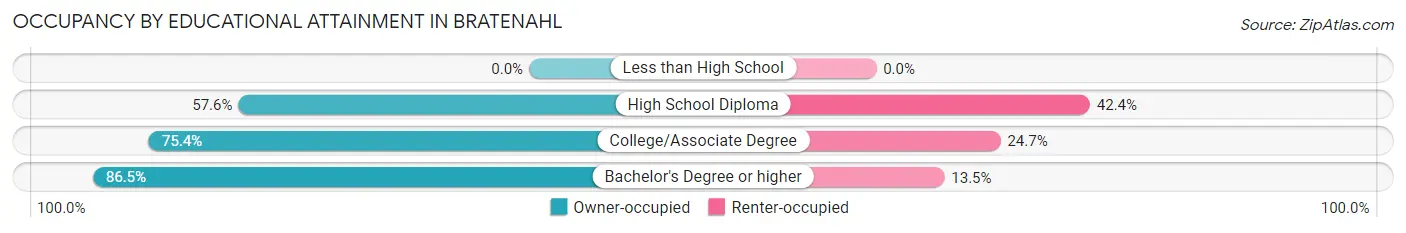
| Household Size | Owner-occupied | Renter-occupied |
| Less than High School | 0 (0.0%) | 0 (0.0%) |
| High School Diploma | 34 (57.6%) | 25 (42.4%) |
| College/Associate Degree | 107 (75.3%) | 35 (24.6%) |
| Bachelor's Degree or higher | 422 (86.5%) | 66 (13.5%) |
Occupancy by Age of Householder in Bratenahl
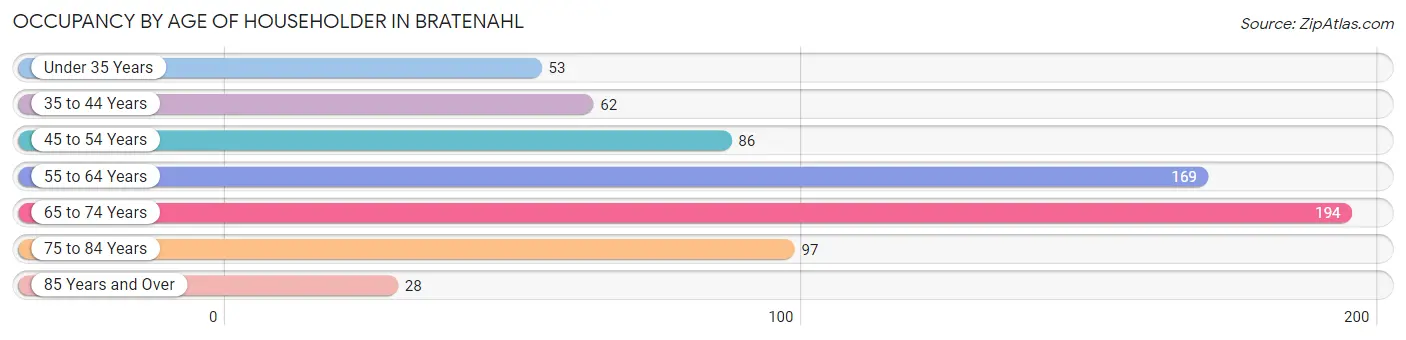
| Age Bracket | # Households | % Households |
| Under 35 Years | 53 | 7.7% |
| 35 to 44 Years | 62 | 9.0% |
| 45 to 54 Years | 86 | 12.5% |
| 55 to 64 Years | 169 | 24.5% |
| 65 to 74 Years | 194 | 28.2% |
| 75 to 84 Years | 97 | 14.1% |
| 85 Years and Over | 28 | 4.1% |
| Total | 689 | 100.0% |
Housing Finances in Bratenahl
Median Income by Occupancy in Bratenahl
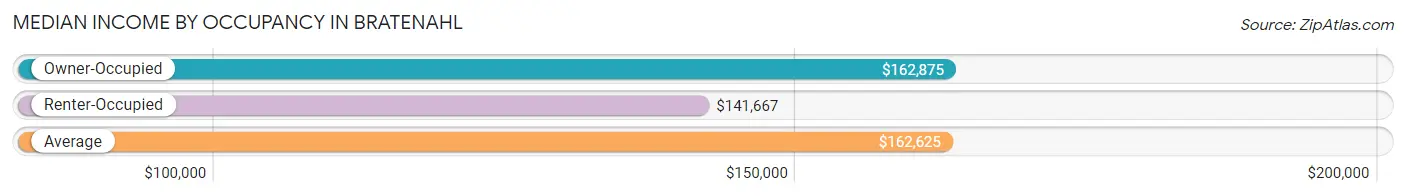
| Occupancy Type | # Households | Median Income |
| Owner-Occupied | 563 (81.7%) | $162,875 |
| Renter-Occupied | 126 (18.3%) | $141,667 |
| Average | 689 (100.0%) | $162,625 |
Occupancy by Householder Income Bracket in Bratenahl
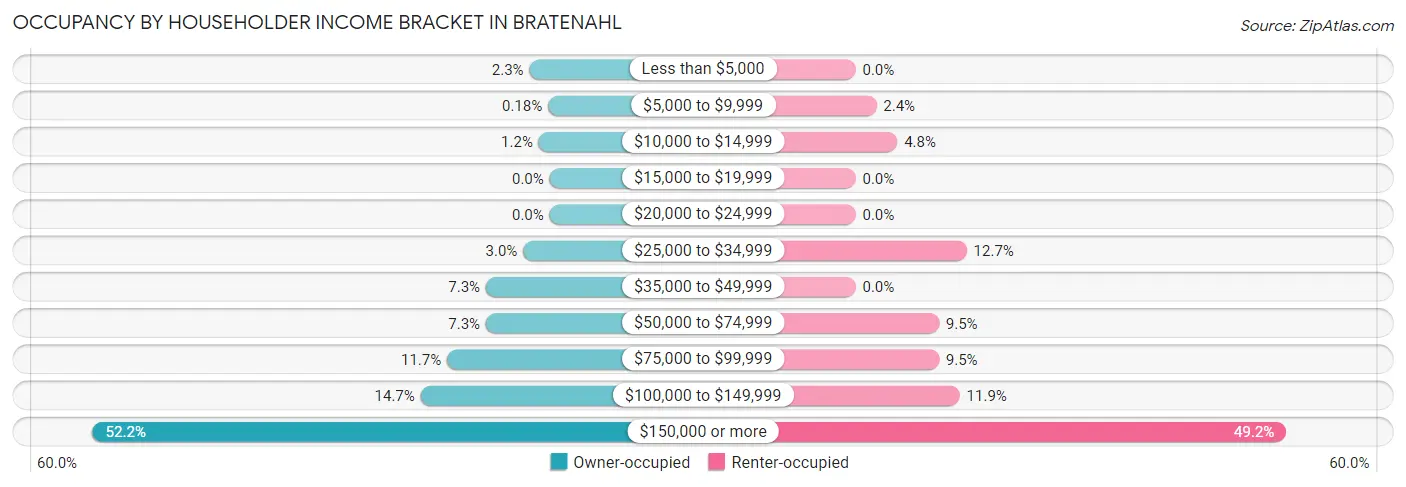
| Income Bracket | Owner-occupied | Renter-occupied |
| Less than $5,000 | 13 (2.3%) | 0 (0.0%) |
| $5,000 to $9,999 | 1 (0.2%) | 3 (2.4%) |
| $10,000 to $14,999 | 7 (1.2%) | 6 (4.8%) |
| $15,000 to $19,999 | 0 (0.0%) | 0 (0.0%) |
| $20,000 to $24,999 | 0 (0.0%) | 0 (0.0%) |
| $25,000 to $34,999 | 17 (3.0%) | 16 (12.7%) |
| $35,000 to $49,999 | 41 (7.3%) | 0 (0.0%) |
| $50,000 to $74,999 | 41 (7.3%) | 12 (9.5%) |
| $75,000 to $99,999 | 66 (11.7%) | 12 (9.5%) |
| $100,000 to $149,999 | 83 (14.7%) | 15 (11.9%) |
| $150,000 or more | 294 (52.2%) | 62 (49.2%) |
| Total | 563 (100.0%) | 126 (100.0%) |
Monthly Housing Cost Tiers in Bratenahl
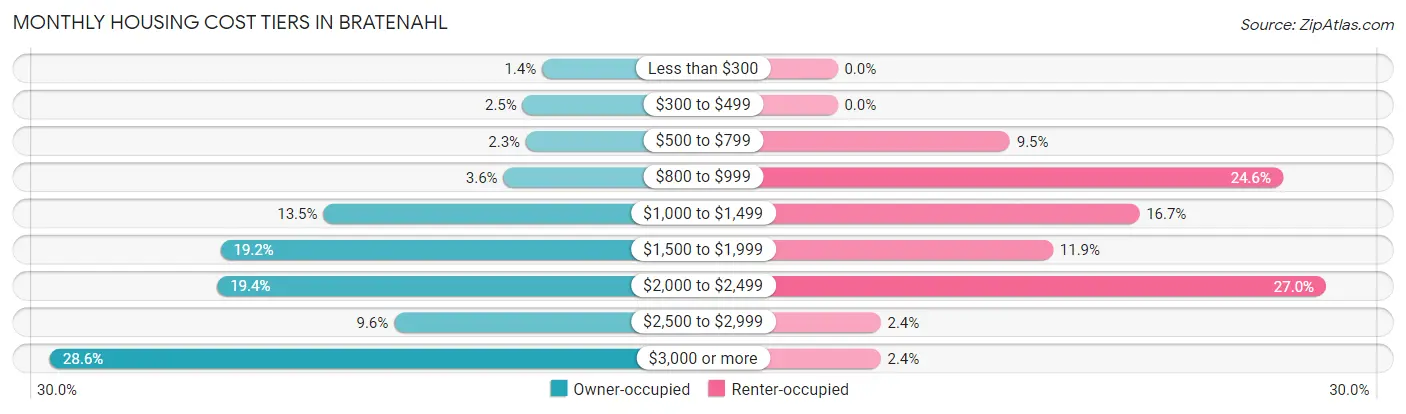
| Monthly Cost | Owner-occupied | Renter-occupied |
| Less than $300 | 8 (1.4%) | 0 (0.0%) |
| $300 to $499 | 14 (2.5%) | 0 (0.0%) |
| $500 to $799 | 13 (2.3%) | 12 (9.5%) |
| $800 to $999 | 20 (3.5%) | 31 (24.6%) |
| $1,000 to $1,499 | 76 (13.5%) | 21 (16.7%) |
| $1,500 to $1,999 | 108 (19.2%) | 15 (11.9%) |
| $2,000 to $2,499 | 109 (19.4%) | 34 (27.0%) |
| $2,500 to $2,999 | 54 (9.6%) | 3 (2.4%) |
| $3,000 or more | 161 (28.6%) | 3 (2.4%) |
| Total | 563 (100.0%) | 126 (100.0%) |
Physical Housing Characteristics in Bratenahl
Housing Structures in Bratenahl
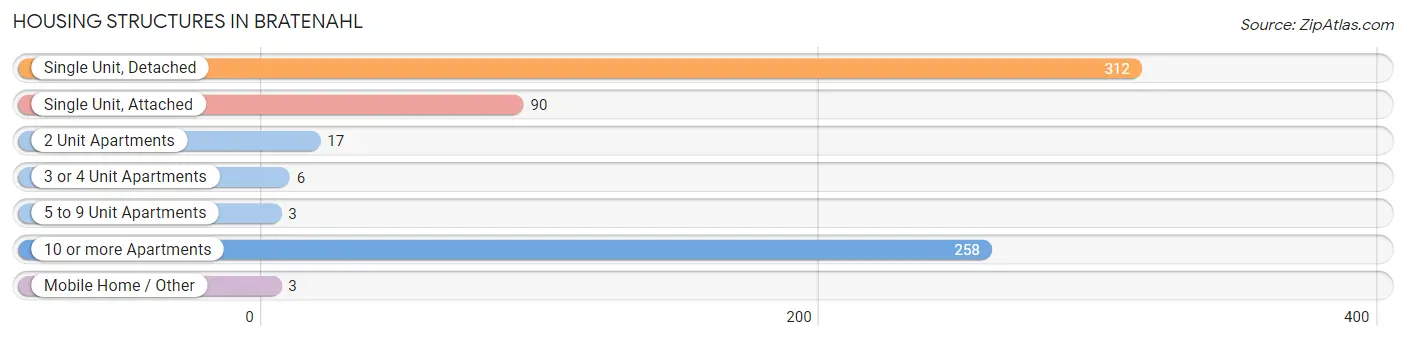
| Structure Type | # Housing Units | % Housing Units |
| Single Unit, Detached | 312 | 45.3% |
| Single Unit, Attached | 90 | 13.1% |
| 2 Unit Apartments | 17 | 2.5% |
| 3 or 4 Unit Apartments | 6 | 0.9% |
| 5 to 9 Unit Apartments | 3 | 0.4% |
| 10 or more Apartments | 258 | 37.4% |
| Mobile Home / Other | 3 | 0.4% |
| Total | 689 | 100.0% |
Housing Structures by Occupancy in Bratenahl
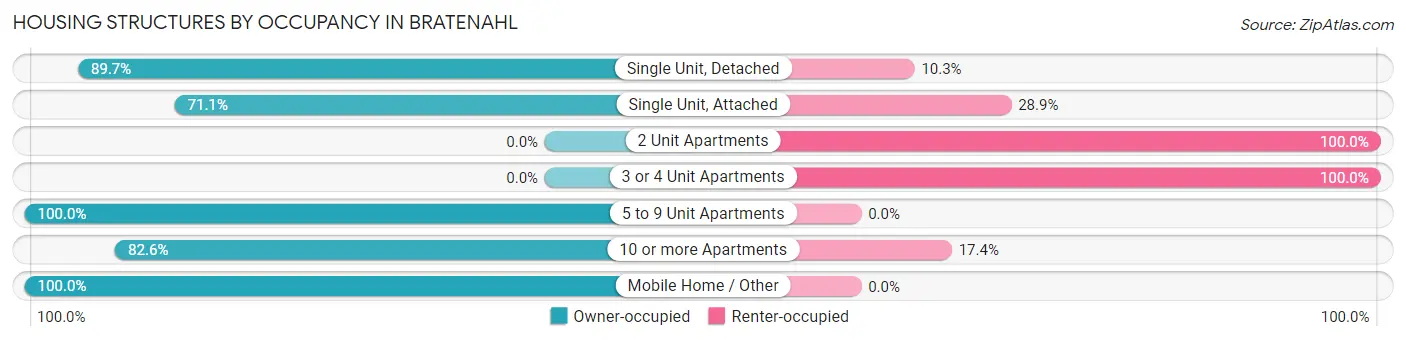
| Structure Type | Owner-occupied | Renter-occupied |
| Single Unit, Detached | 280 (89.7%) | 32 (10.3%) |
| Single Unit, Attached | 64 (71.1%) | 26 (28.9%) |
| 2 Unit Apartments | 0 (0.0%) | 17 (100.0%) |
| 3 or 4 Unit Apartments | 0 (0.0%) | 6 (100.0%) |
| 5 to 9 Unit Apartments | 3 (100.0%) | 0 (0.0%) |
| 10 or more Apartments | 213 (82.6%) | 45 (17.4%) |
| Mobile Home / Other | 3 (100.0%) | 0 (0.0%) |
| Total | 563 (81.7%) | 126 (18.3%) |
Housing Structures by Number of Rooms in Bratenahl
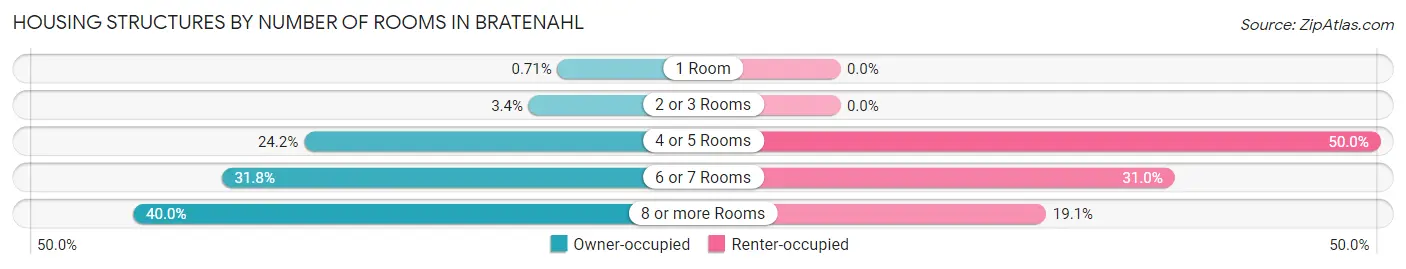
| Number of Rooms | Owner-occupied | Renter-occupied |
| 1 Room | 4 (0.7%) | 0 (0.0%) |
| 2 or 3 Rooms | 19 (3.4%) | 0 (0.0%) |
| 4 or 5 Rooms | 136 (24.2%) | 63 (50.0%) |
| 6 or 7 Rooms | 179 (31.8%) | 39 (30.9%) |
| 8 or more Rooms | 225 (40.0%) | 24 (19.1%) |
| Total | 563 (100.0%) | 126 (100.0%) |
Housing Structure by Heating Type in Bratenahl
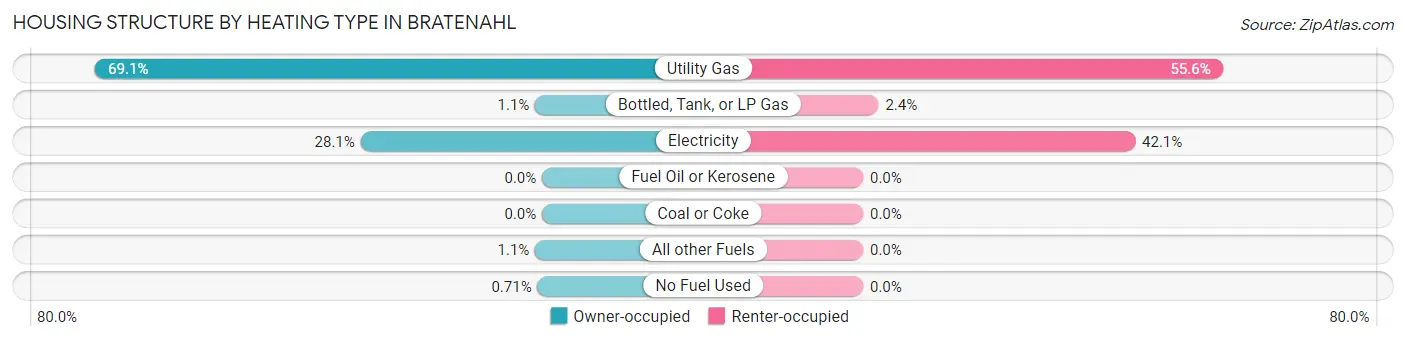
| Heating Type | Owner-occupied | Renter-occupied |
| Utility Gas | 389 (69.1%) | 70 (55.6%) |
| Bottled, Tank, or LP Gas | 6 (1.1%) | 3 (2.4%) |
| Electricity | 158 (28.1%) | 53 (42.1%) |
| Fuel Oil or Kerosene | 0 (0.0%) | 0 (0.0%) |
| Coal or Coke | 0 (0.0%) | 0 (0.0%) |
| All other Fuels | 6 (1.1%) | 0 (0.0%) |
| No Fuel Used | 4 (0.7%) | 0 (0.0%) |
| Total | 563 (100.0%) | 126 (100.0%) |
Household Vehicle Usage in Bratenahl
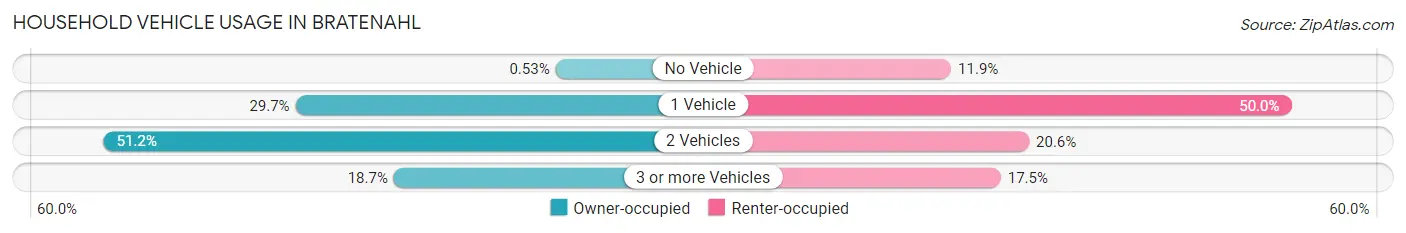
| Vehicles per Household | Owner-occupied | Renter-occupied |
| No Vehicle | 3 (0.5%) | 15 (11.9%) |
| 1 Vehicle | 167 (29.7%) | 63 (50.0%) |
| 2 Vehicles | 288 (51.1%) | 26 (20.6%) |
| 3 or more Vehicles | 105 (18.6%) | 22 (17.5%) |
| Total | 563 (100.0%) | 126 (100.0%) |
Real Estate & Mortgages in Bratenahl
Real Estate and Mortgage Overview in Bratenahl
| Characteristic | Without Mortgage | With Mortgage |
| Housing Units | 296 | 267 |
| Median Property Value | $330,600 | $356,500 |
| Median Household Income | $188,750 | $122 |
| Monthly Housing Costs | $1,501 | $117 |
| Real Estate Taxes | $6,675 | $1 |
Property Value by Mortgage Status in Bratenahl
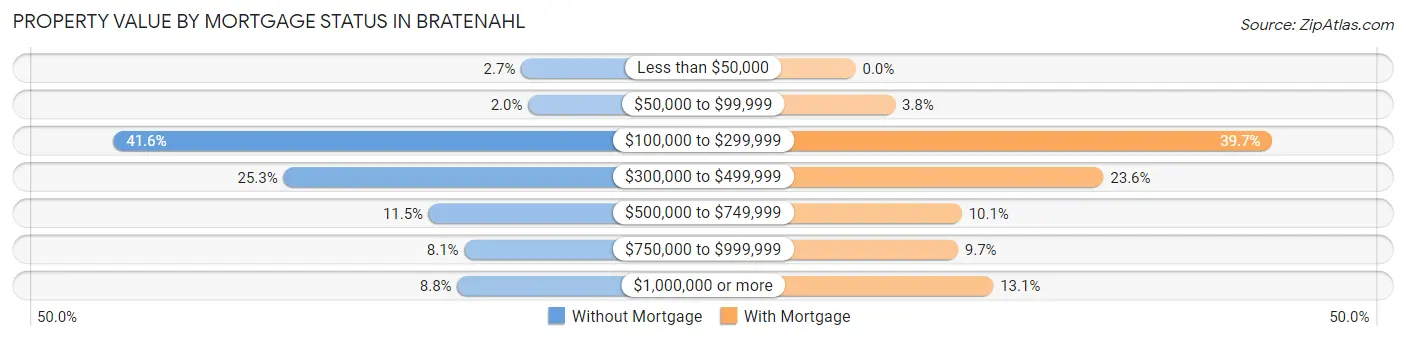
| Property Value | Without Mortgage | With Mortgage |
| Less than $50,000 | 8 (2.7%) | 0 (0.0%) |
| $50,000 to $99,999 | 6 (2.0%) | 10 (3.7%) |
| $100,000 to $299,999 | 123 (41.5%) | 106 (39.7%) |
| $300,000 to $499,999 | 75 (25.3%) | 63 (23.6%) |
| $500,000 to $749,999 | 34 (11.5%) | 27 (10.1%) |
| $750,000 to $999,999 | 24 (8.1%) | 26 (9.7%) |
| $1,000,000 or more | 26 (8.8%) | 35 (13.1%) |
| Total | 296 (100.0%) | 267 (100.0%) |
Household Income by Mortgage Status in Bratenahl
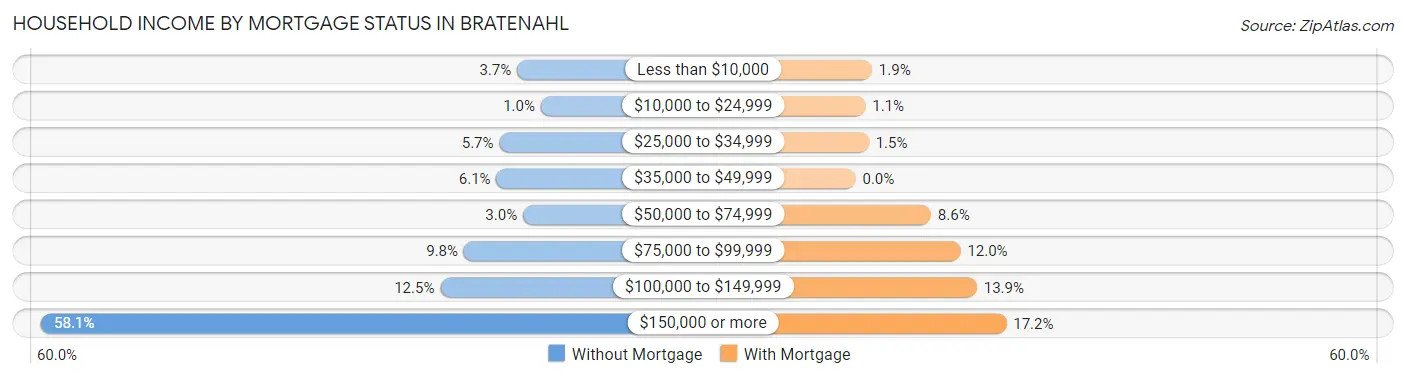
| Household Income | Without Mortgage | With Mortgage |
| Less than $10,000 | 11 (3.7%) | 5 (1.9%) |
| $10,000 to $24,999 | 3 (1.0%) | 3 (1.1%) |
| $25,000 to $34,999 | 17 (5.7%) | 4 (1.5%) |
| $35,000 to $49,999 | 18 (6.1%) | 0 (0.0%) |
| $50,000 to $74,999 | 9 (3.0%) | 23 (8.6%) |
| $75,000 to $99,999 | 29 (9.8%) | 32 (12.0%) |
| $100,000 to $149,999 | 37 (12.5%) | 37 (13.9%) |
| $150,000 or more | 172 (58.1%) | 46 (17.2%) |
| Total | 296 (100.0%) | 267 (100.0%) |
Property Value to Household Income Ratio in Bratenahl
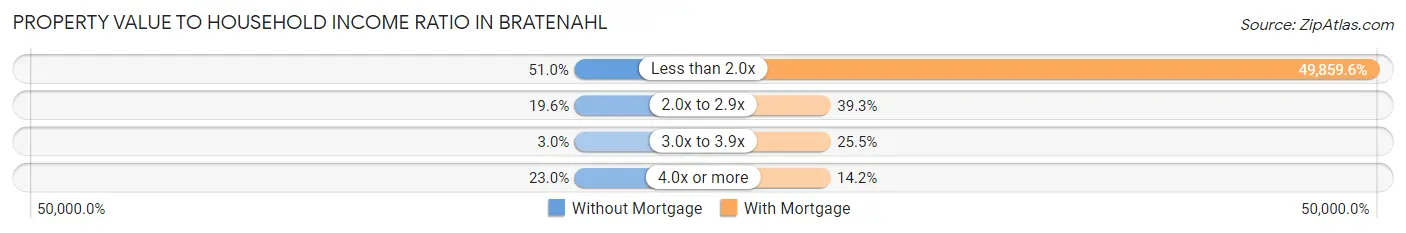
| Value-to-Income Ratio | Without Mortgage | With Mortgage |
| Less than 2.0x | 151 (51.0%) | 133,125 (49,859.6%) |
| 2.0x to 2.9x | 58 (19.6%) | 105 (39.3%) |
| 3.0x to 3.9x | 9 (3.0%) | 68 (25.5%) |
| 4.0x or more | 68 (23.0%) | 38 (14.2%) |
| Total | 296 (100.0%) | 267 (100.0%) |
Real Estate Taxes by Mortgage Status in Bratenahl
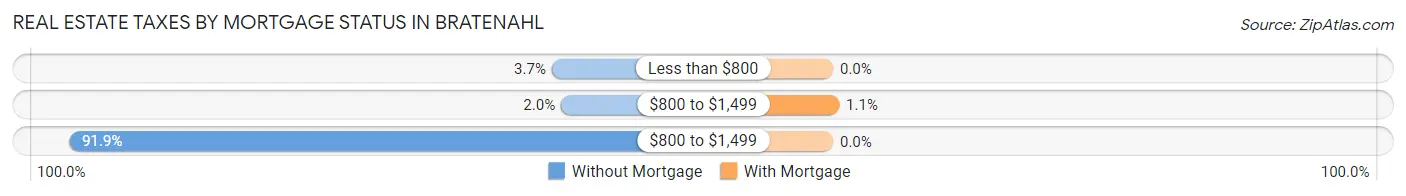
| Property Taxes | Without Mortgage | With Mortgage |
| Less than $800 | 11 (3.7%) | 0 (0.0%) |
| $800 to $1,499 | 6 (2.0%) | 3 (1.1%) |
| $800 to $1,499 | 272 (91.9%) | 0 (0.0%) |
| Total | 296 (100.0%) | 267 (100.0%) |
Health & Disability in Bratenahl
Health Insurance Coverage by Age in Bratenahl
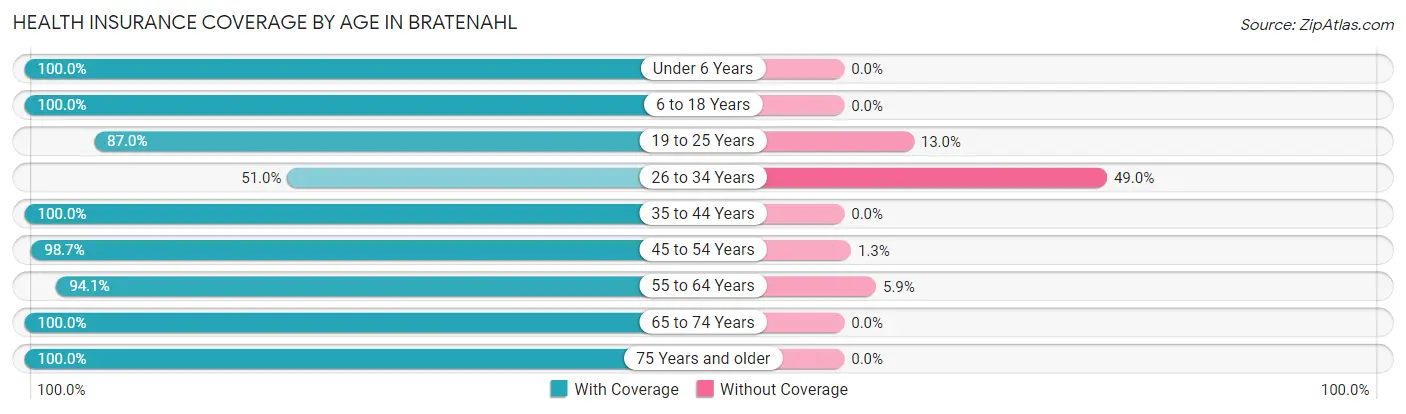
| Age Bracket | With Coverage | Without Coverage |
| Under 6 Years | 40 (100.0%) | 0 (0.0%) |
| 6 to 18 Years | 65 (100.0%) | 0 (0.0%) |
| 19 to 25 Years | 47 (87.0%) | 7 (13.0%) |
| 26 to 34 Years | 76 (51.0%) | 73 (49.0%) |
| 35 to 44 Years | 97 (100.0%) | 0 (0.0%) |
| 45 to 54 Years | 157 (98.7%) | 2 (1.3%) |
| 55 to 64 Years | 286 (94.1%) | 18 (5.9%) |
| 65 to 74 Years | 350 (100.0%) | 0 (0.0%) |
| 75 Years and older | 204 (100.0%) | 0 (0.0%) |
| Total | 1,322 (93.0%) | 100 (7.0%) |
Health Insurance Coverage by Citizenship Status in Bratenahl
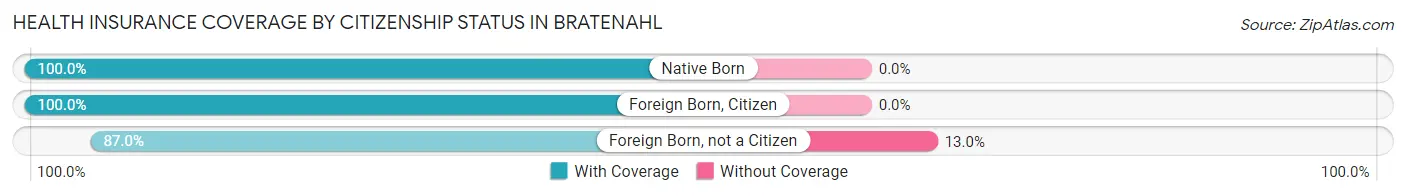
| Citizenship Status | With Coverage | Without Coverage |
| Native Born | 40 (100.0%) | 0 (0.0%) |
| Foreign Born, Citizen | 65 (100.0%) | 0 (0.0%) |
| Foreign Born, not a Citizen | 47 (87.0%) | 7 (13.0%) |
Health Insurance Coverage by Household Income in Bratenahl
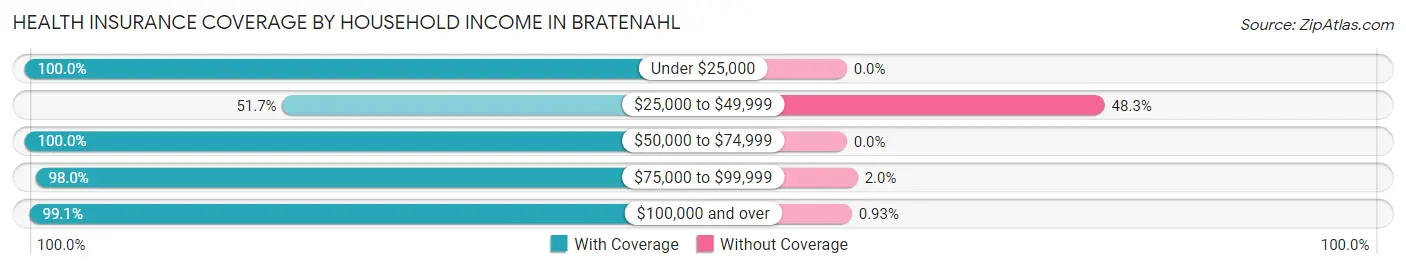
| Household Income | With Coverage | Without Coverage |
| Under $25,000 | 35 (100.0%) | 0 (0.0%) |
| $25,000 to $49,999 | 92 (51.7%) | 86 (48.3%) |
| $50,000 to $74,999 | 79 (100.0%) | 0 (0.0%) |
| $75,000 to $99,999 | 144 (98.0%) | 3 (2.0%) |
| $100,000 and over | 962 (99.1%) | 9 (0.9%) |
Public vs Private Health Insurance Coverage by Age in Bratenahl
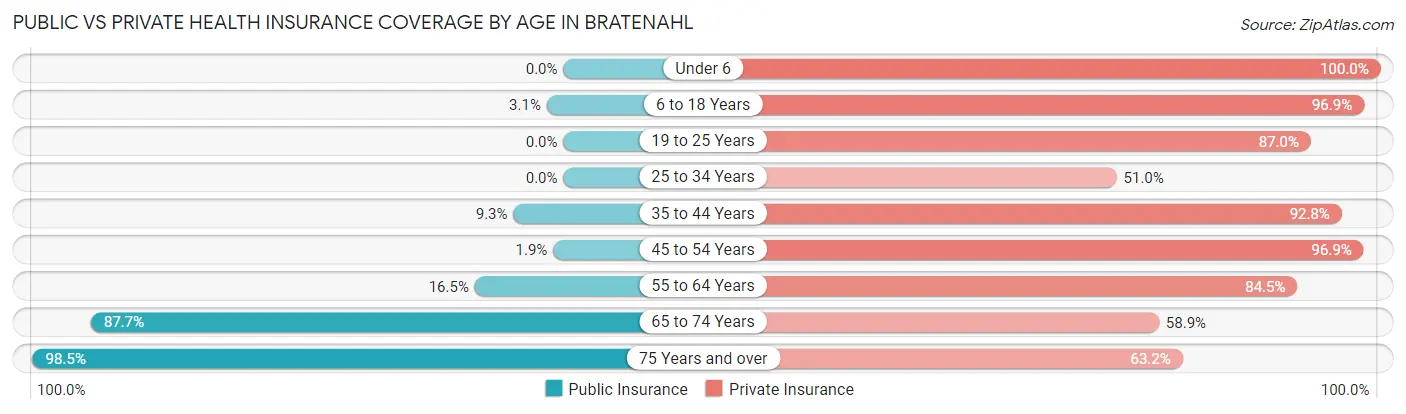
| Age Bracket | Public Insurance | Private Insurance |
| Under 6 | 0 (0.0%) | 40 (100.0%) |
| 6 to 18 Years | 2 (3.1%) | 63 (96.9%) |
| 19 to 25 Years | 0 (0.0%) | 47 (87.0%) |
| 25 to 34 Years | 0 (0.0%) | 76 (51.0%) |
| 35 to 44 Years | 9 (9.3%) | 90 (92.8%) |
| 45 to 54 Years | 3 (1.9%) | 154 (96.9%) |
| 55 to 64 Years | 50 (16.5%) | 257 (84.5%) |
| 65 to 74 Years | 307 (87.7%) | 206 (58.9%) |
| 75 Years and over | 201 (98.5%) | 129 (63.2%) |
| Total | 572 (40.2%) | 1,062 (74.7%) |
Disability Status by Sex by Age in Bratenahl
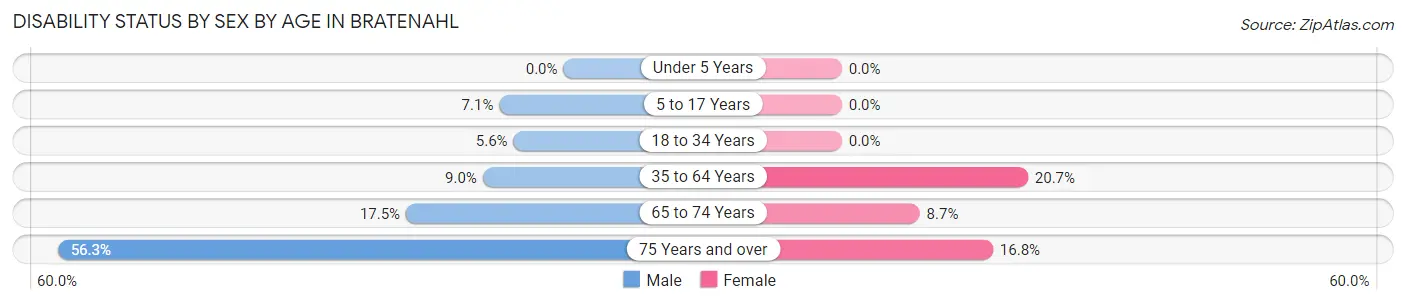
| Age Bracket | Male | Female |
| Under 5 Years | 0 (0.0%) | 0 (0.0%) |
| 5 to 17 Years | 2 (7.1%) | 0 (0.0%) |
| 18 to 34 Years | 3 (5.6%) | 0 (0.0%) |
| 35 to 64 Years | 23 (9.0%) | 63 (20.7%) |
| 65 to 74 Years | 27 (17.5%) | 17 (8.7%) |
| 75 Years and over | 58 (56.3%) | 17 (16.8%) |
Disability Class by Sex by Age in Bratenahl
Disability Class: Hearing Difficulty
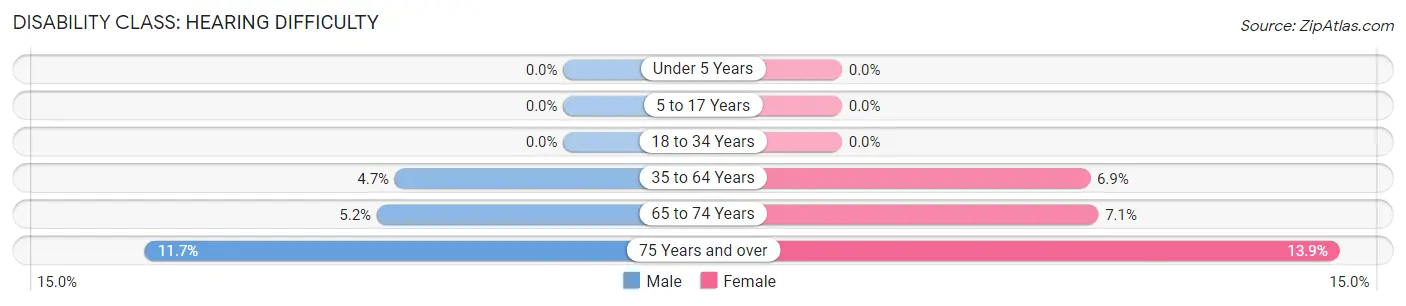
| Age Bracket | Male | Female |
| Under 5 Years | 0 (0.0%) | 0 (0.0%) |
| 5 to 17 Years | 0 (0.0%) | 0 (0.0%) |
| 18 to 34 Years | 0 (0.0%) | 0 (0.0%) |
| 35 to 64 Years | 12 (4.7%) | 21 (6.9%) |
| 65 to 74 Years | 8 (5.2%) | 14 (7.1%) |
| 75 Years and over | 12 (11.7%) | 14 (13.9%) |
Disability Class: Vision Difficulty
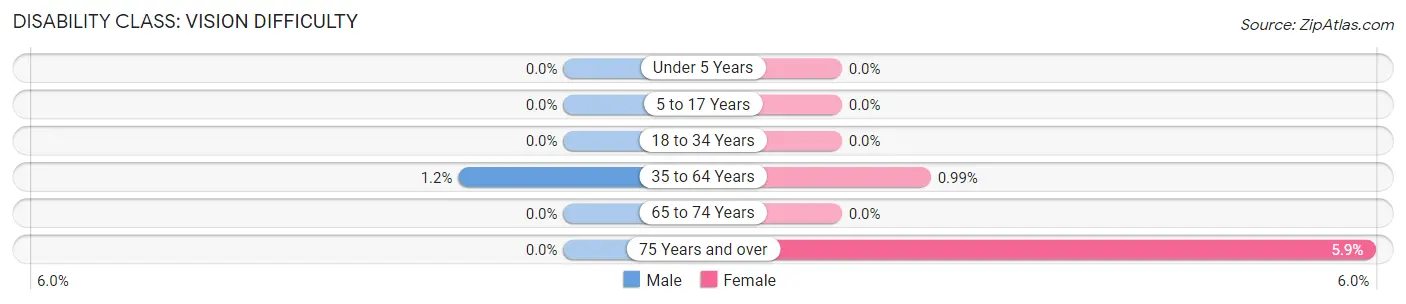
| Age Bracket | Male | Female |
| Under 5 Years | 0 (0.0%) | 0 (0.0%) |
| 5 to 17 Years | 0 (0.0%) | 0 (0.0%) |
| 18 to 34 Years | 0 (0.0%) | 0 (0.0%) |
| 35 to 64 Years | 3 (1.2%) | 3 (1.0%) |
| 65 to 74 Years | 0 (0.0%) | 0 (0.0%) |
| 75 Years and over | 0 (0.0%) | 6 (5.9%) |
Disability Class: Cognitive Difficulty
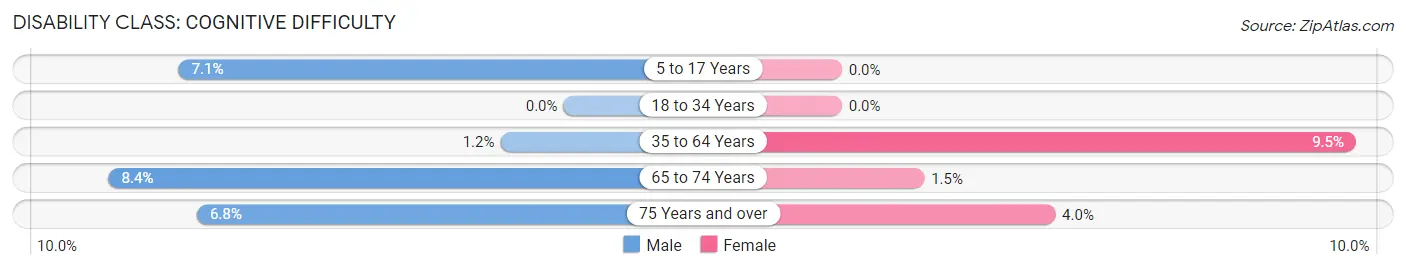
| Age Bracket | Male | Female |
| 5 to 17 Years | 2 (7.1%) | 0 (0.0%) |
| 18 to 34 Years | 0 (0.0%) | 0 (0.0%) |
| 35 to 64 Years | 3 (1.2%) | 29 (9.5%) |
| 65 to 74 Years | 13 (8.4%) | 3 (1.5%) |
| 75 Years and over | 7 (6.8%) | 4 (4.0%) |
Disability Class: Ambulatory Difficulty
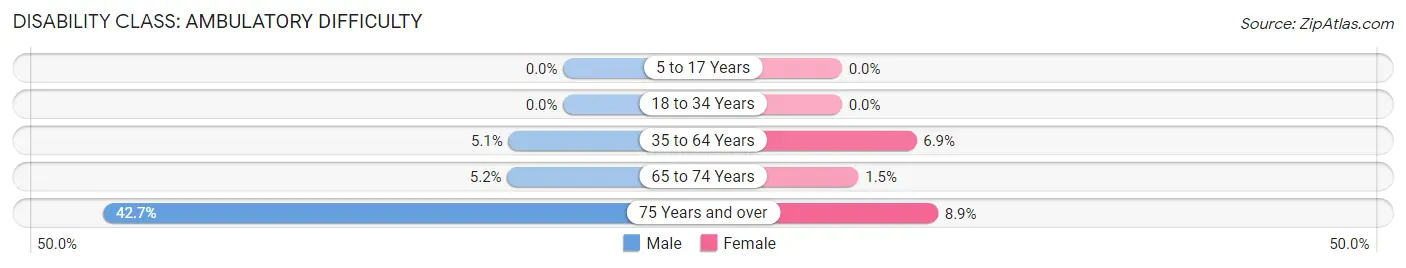
| Age Bracket | Male | Female |
| 5 to 17 Years | 0 (0.0%) | 0 (0.0%) |
| 18 to 34 Years | 0 (0.0%) | 0 (0.0%) |
| 35 to 64 Years | 13 (5.1%) | 21 (6.9%) |
| 65 to 74 Years | 8 (5.2%) | 3 (1.5%) |
| 75 Years and over | 44 (42.7%) | 9 (8.9%) |
Disability Class: Self-Care Difficulty
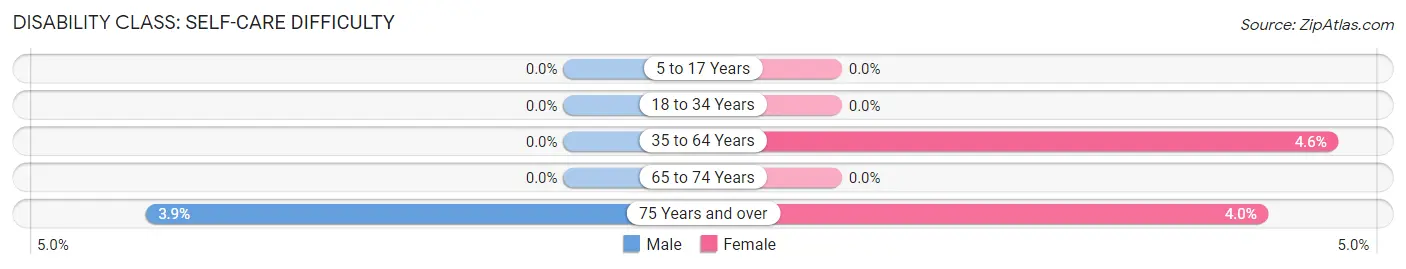
| Age Bracket | Male | Female |
| 5 to 17 Years | 0 (0.0%) | 0 (0.0%) |
| 18 to 34 Years | 0 (0.0%) | 0 (0.0%) |
| 35 to 64 Years | 0 (0.0%) | 14 (4.6%) |
| 65 to 74 Years | 0 (0.0%) | 0 (0.0%) |
| 75 Years and over | 4 (3.9%) | 4 (4.0%) |
Technology Access in Bratenahl
Computing Device Access in Bratenahl
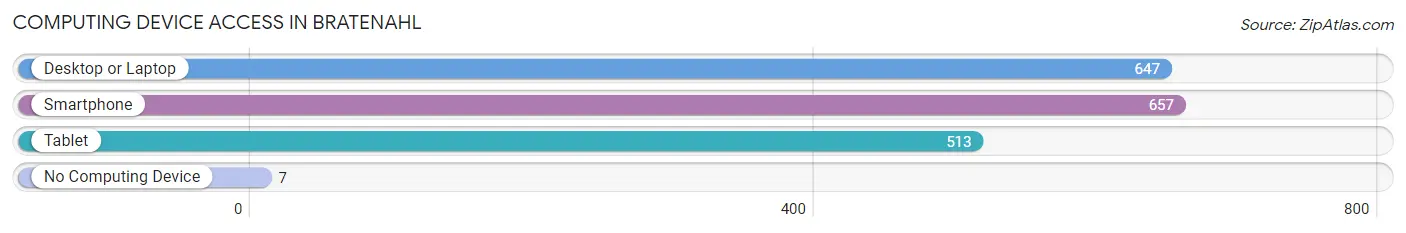
| Device Type | # Households | % Households |
| Desktop or Laptop | 647 | 93.9% |
| Smartphone | 657 | 95.4% |
| Tablet | 513 | 74.5% |
| No Computing Device | 7 | 1.0% |
| Total | 689 | 100.0% |
Internet Access in Bratenahl
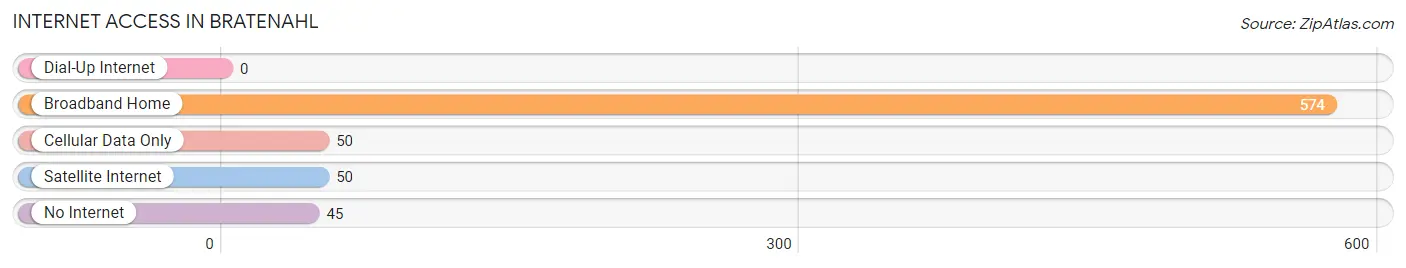
| Internet Type | # Households | % Households |
| Dial-Up Internet | 0 | 0.0% |
| Broadband Home | 574 | 83.3% |
| Cellular Data Only | 50 | 7.3% |
| Satellite Internet | 50 | 7.3% |
| No Internet | 45 | 6.5% |
| Total | 689 | 100.0% |
Bratenahl Summary
Bratenahl is a village located in Cuyahoga County, Ohio, United States. It is situated on the southern shore of Lake Erie, just east of Cleveland. The population was 1,197 at the 2010 census.
History
Bratenahl was founded in 1845 by John Bratenahl, a German immigrant who purchased the land from the Connecticut Land Company. He named the area after himself and began to develop it as a summer resort for wealthy Clevelanders. The village was incorporated in 1910 and has remained a small, exclusive community ever since.
The village was home to the Bratenahl Country Club, which was founded in 1895 and was the first country club in the state of Ohio. The club was a popular destination for Cleveland's elite and hosted many famous guests, including President William Howard Taft. The club closed in the 1950s and the land was sold to developers.
Geography
Bratenahl is located at 41°31'25" North, 81°35'17" West (41.523750, -81.588139). According to the United States Census Bureau, the village has a total area of 1.2 square miles (3.1 km2), all land.
Economy
Bratenahl is a small, exclusive community and does not have a large commercial presence. The village is home to several small businesses, including a few restaurants, a grocery store, and a few professional offices. The village is also home to the Bratenahl Place, a luxury condominium complex.
Demographics
As of the census of 2010, there were 1,197 people, 545 households, and 327 families residing in the village. The population density was 997.5 people per square mile (385.7/km2). There were 590 housing units at an average density of 491.7 per square mile (189.9/km2). The racial makeup of the village was 91.2% White, 4.2% African American, 0.3% Native American, 1.3% Asian, 0.1% Pacific Islander, 0.8% from other races, and 2.2% from two or more races. Hispanic or Latino of any race were 2.3% of the population.
There were 545 households, out of which 22.2% had children under the age of 18 living with them, 48.3% were married couples living together, 8.2% had a female householder with no husband present, and 40.2% were non-families. 34.2% of all households were made up of individuals, and 11.2% had someone living alone who was 65 years of age or older. The average household size was 2.19 and the average family size was 2.83.
In the village, the population was spread out, with 19.2% under the age of 18, 4.2% from 18 to 24, 24.2% from 25 to 44, 33.2% from 45 to 64, and 19.2% who were 65 years of age or older. The median age was 46 years. For every 100 females, there were 91.2 males. For every 100 females age 18 and over, there were 88.2 males.
The median income for a household in the village was $90,938, and the median income for a family was $118,938. Males had a median income of $76,250 versus $50,000 for females. The per capita income for the village was $58,938. About 2.2% of families and 3.2% of the population were below the poverty line, including 4.2% of those under age 18 and none of those age 65 or over.
Common Questions
What is Per Capita Income in Bratenahl?
Per Capita income in Bratenahl is $121,440.
What is the Median Family Income in Bratenahl?
Median Family Income in Bratenahl is $194,844.
What is the Median Household income in Bratenahl?
Median Household Income in Bratenahl is $162,625.
What is Income or Wage Gap in Bratenahl?
Income or Wage Gap in Bratenahl is 39.2%.
Women in Bratenahl earn 60.8 cents for every dollar earned by a man.
What is Inequality or Gini Index in Bratenahl?
Inequality or Gini Index in Bratenahl is 0.50.
What is the Total Population of Bratenahl?
Total Population of Bratenahl is 1,422.
What is the Total Male Population of Bratenahl?
Total Male Population of Bratenahl is 626.
What is the Total Female Population of Bratenahl?
Total Female Population of Bratenahl is 796.
What is the Ratio of Males per 100 Females in Bratenahl?
There are 78.64 Males per 100 Females in Bratenahl.
What is the Ratio of Females per 100 Males in Bratenahl?
There are 127.16 Females per 100 Males in Bratenahl.
What is the Median Population Age in Bratenahl?
Median Population Age in Bratenahl is 60.7 Years.
What is the Average Family Size in Bratenahl
Average Family Size in Bratenahl is 2.7 People.
What is the Average Household Size in Bratenahl
Average Household Size in Bratenahl is 2.0 People.
How Large is the Labor Force in Bratenahl?
There are 799 People in the Labor Forcein in Bratenahl.
What is the Percentage of People in the Labor Force in Bratenahl?
60.1% of People are in the Labor Force in Bratenahl.
What is the Unemployment Rate in Bratenahl?
Unemployment Rate in Bratenahl is 1.4%.