Miamiville, OH Map & Demographics
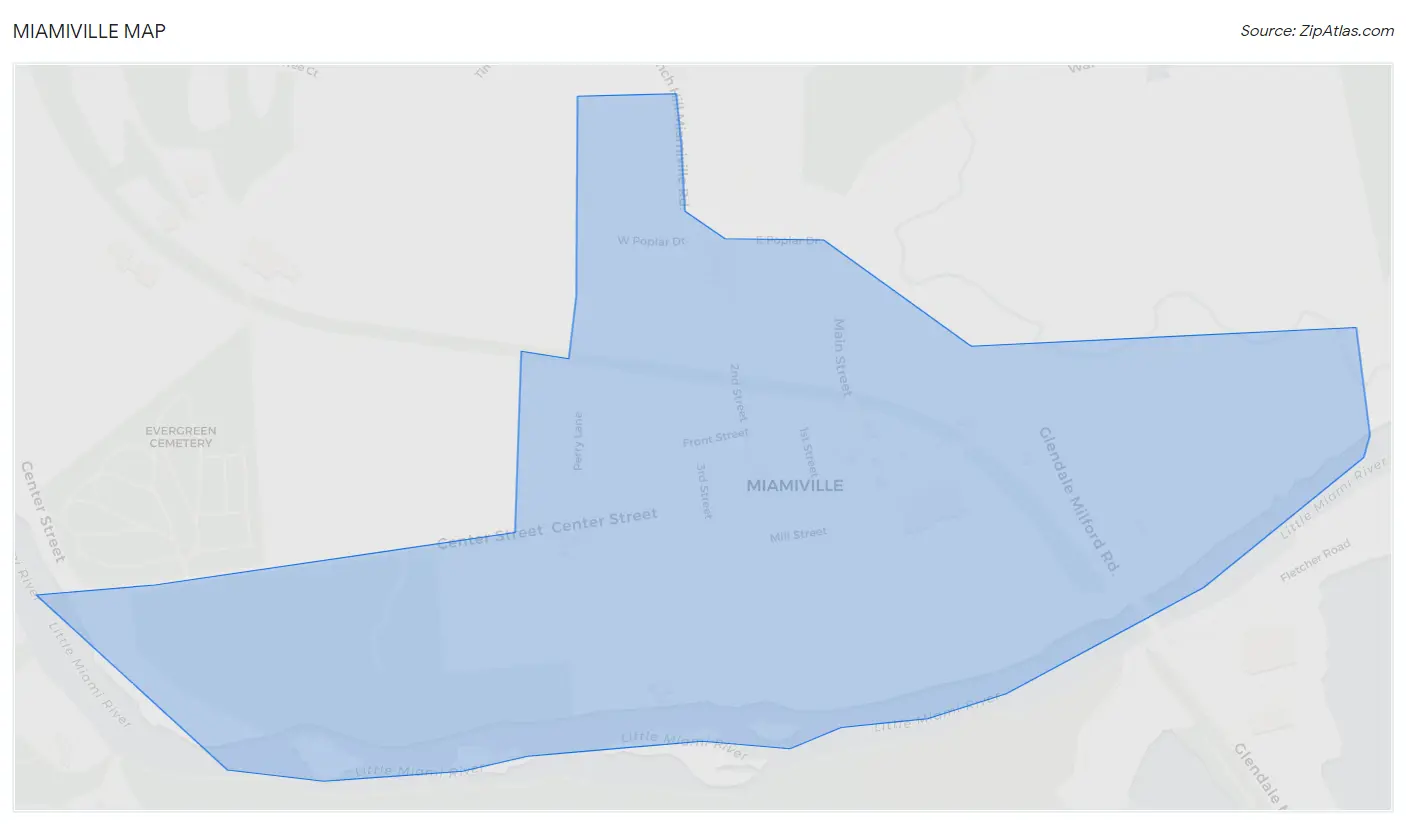
Miamiville Map
Miamiville Overview
$41,179
PER CAPITA INCOME
0.45
INEQUALITY / GINI INDEX
155
TOTAL POPULATION
76
MALE POPULATION
79
FEMALE POPULATION
96.20
MALES / 100 FEMALES
103.95
FEMALES / 100 MALES
61.0
MEDIAN AGE
3.7
AVG FAMILY SIZE
2.8
AVG HOUSEHOLD SIZE
143
LABOR FORCE [ PEOPLE ]
92.3%
PERCENT IN LABOR FORCE
11.9%
UNEMPLOYMENT RATE
Miamiville Zip Codes
Miamiville Area Codes
Income in Miamiville
Income Overview in Miamiville
| Characteristic | Number | Measure |
| Per Capita Income | 155 | $41,179 |
| Median Family Income | 30 | $0 |
| Mean Family Income | 30 | $0 |
| Median Household Income | 56 | $0 |
| Mean Household Income | 56 | $84,436 |
| Income Deficit | 30 | $0 |
| Wage / Income Gap (%) | 155 | 0.00% |
| Wage / Income Gap ($) | 155 | 100.00¢ per $1 |
| Gini / Inequality Index | 155 | 0.45 |
Earnings by Sex in Miamiville
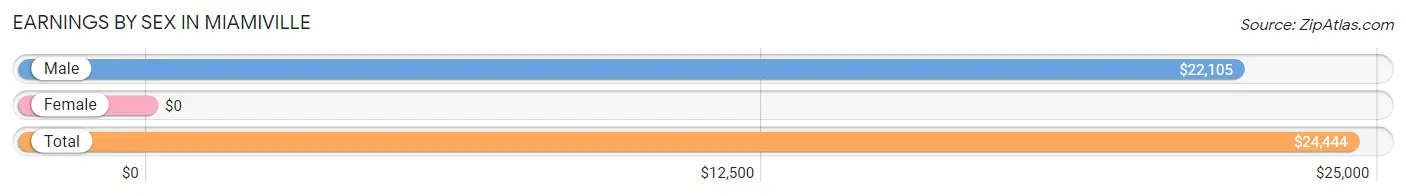
| Sex | Number | Average Earnings |
| Male | 64 (50.8%) | $22,105 |
| Female | 62 (49.2%) | $0 |
| Total | 126 (100.0%) | $24,444 |
Earnings by Sex by Income Bracket in Miamiville
The most common earnings brackets in Miamiville are $20,000 to $22,499 for men (38 | 59.4%) and $40,000 to $44,999 for women (26 | 41.9%).
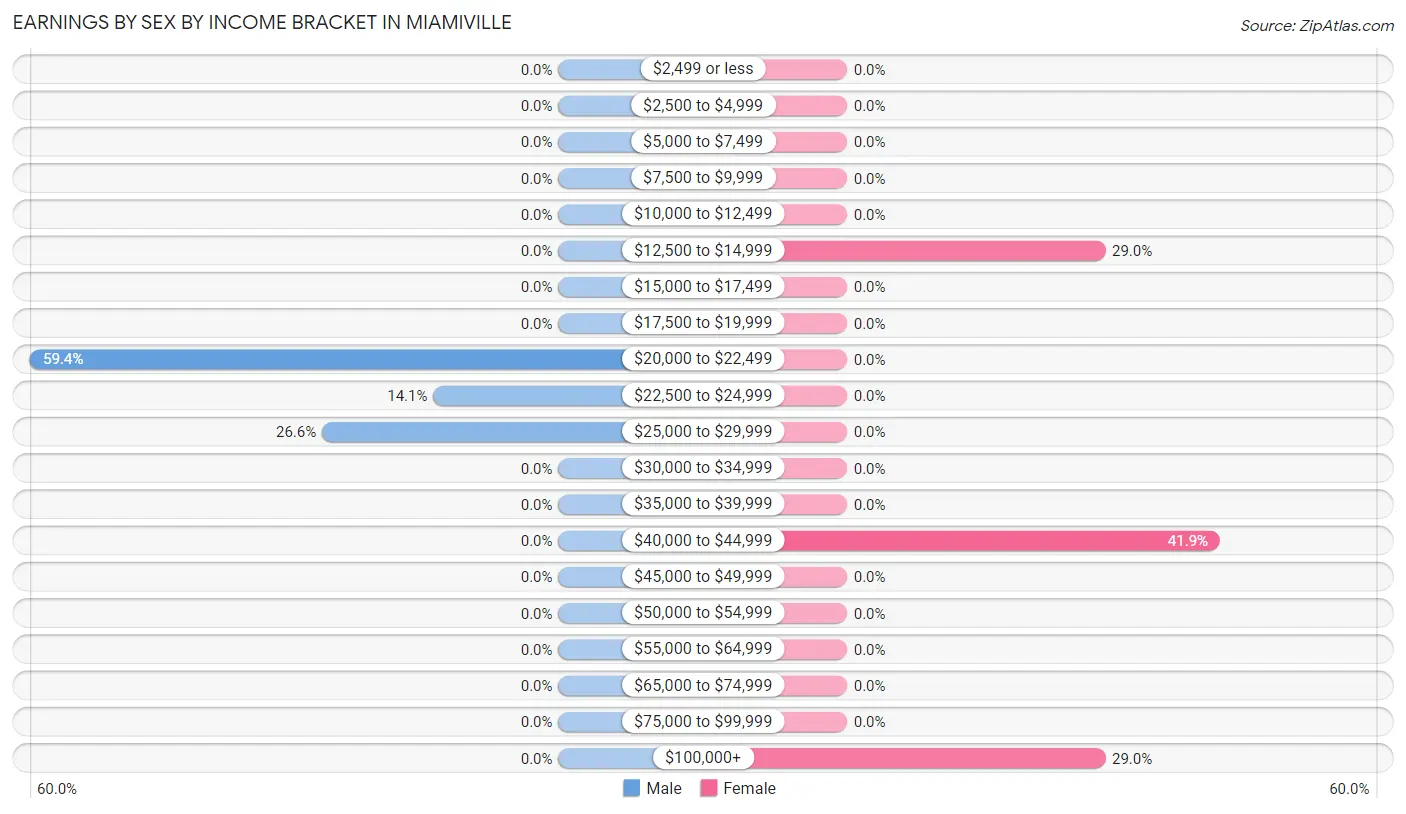
| Income | Male | Female |
| $2,499 or less | 0 (0.0%) | 0 (0.0%) |
| $2,500 to $4,999 | 0 (0.0%) | 0 (0.0%) |
| $5,000 to $7,499 | 0 (0.0%) | 0 (0.0%) |
| $7,500 to $9,999 | 0 (0.0%) | 0 (0.0%) |
| $10,000 to $12,499 | 0 (0.0%) | 0 (0.0%) |
| $12,500 to $14,999 | 0 (0.0%) | 18 (29.0%) |
| $15,000 to $17,499 | 0 (0.0%) | 0 (0.0%) |
| $17,500 to $19,999 | 0 (0.0%) | 0 (0.0%) |
| $20,000 to $22,499 | 38 (59.4%) | 0 (0.0%) |
| $22,500 to $24,999 | 9 (14.1%) | 0 (0.0%) |
| $25,000 to $29,999 | 17 (26.6%) | 0 (0.0%) |
| $30,000 to $34,999 | 0 (0.0%) | 0 (0.0%) |
| $35,000 to $39,999 | 0 (0.0%) | 0 (0.0%) |
| $40,000 to $44,999 | 0 (0.0%) | 26 (41.9%) |
| $45,000 to $49,999 | 0 (0.0%) | 0 (0.0%) |
| $50,000 to $54,999 | 0 (0.0%) | 0 (0.0%) |
| $55,000 to $64,999 | 0 (0.0%) | 0 (0.0%) |
| $65,000 to $74,999 | 0 (0.0%) | 0 (0.0%) |
| $75,000 to $99,999 | 0 (0.0%) | 0 (0.0%) |
| $100,000+ | 0 (0.0%) | 18 (29.0%) |
| Total | 64 (100.0%) | 62 (100.0%) |
Earnings by Sex by Educational Attainment in Miamiville
| Educational Attainment | Male Income | Female Income |
| Less than High School | - | - |
| High School Diploma | - | - |
| College or Associate's Degree | - | - |
| Bachelor's Degree | - | - |
| Graduate Degree | - | - |
| Total | $22,105 | $0 |
Family Income in Miamiville
Family Income Brackets in Miamiville
According to the Miamiville family income data, there are 18 families falling into the $75,000 to $99,999 income range, which is the most common income bracket and makes up 60.0% of all families.
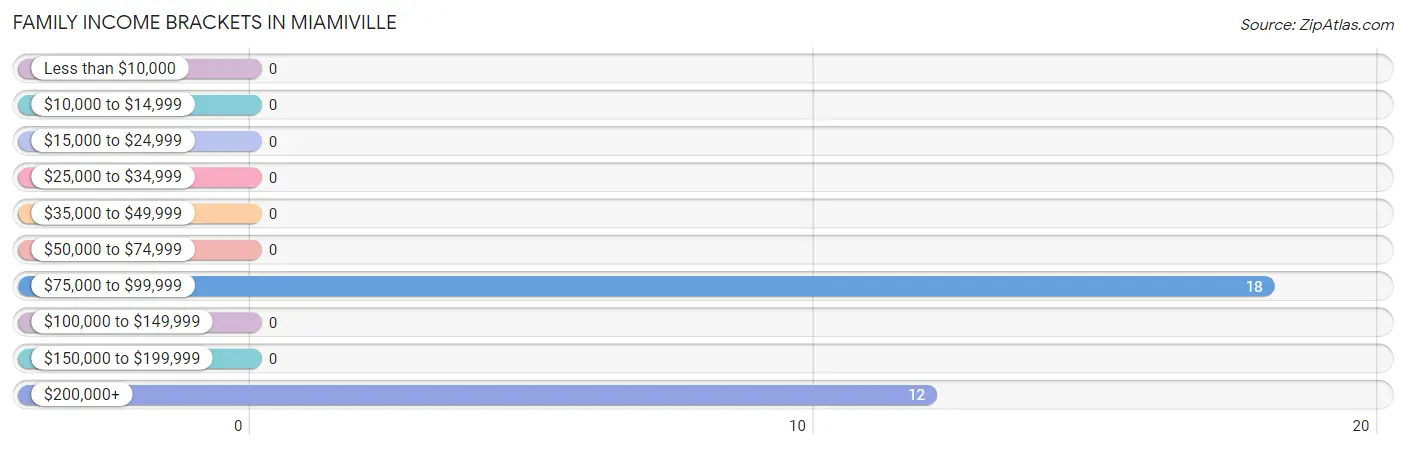
| Income Bracket | # Families | % Families |
| Less than $10,000 | 0 | 0.0% |
| $10,000 to $14,999 | 0 | 0.0% |
| $15,000 to $24,999 | 0 | 0.0% |
| $25,000 to $34,999 | 0 | 0.0% |
| $35,000 to $49,999 | 0 | 0.0% |
| $50,000 to $74,999 | 0 | 0.0% |
| $75,000 to $99,999 | 18 | 60.0% |
| $100,000 to $149,999 | 0 | 0.0% |
| $150,000 to $199,999 | 0 | 0.0% |
| $200,000+ | 12 | 40.0% |
Family Income by Famaliy Size in Miamiville
| Income Bracket | # Families | Median Income |
| 2-Person Families | 12 (40.0%) | $0 |
| 3-Person Families | 18 (60.0%) | $0 |
| 4-Person Families | 0 (0.0%) | $0 |
| 5-Person Families | 0 (0.0%) | $0 |
| 6-Person Families | 0 (0.0%) | $0 |
| 7+ Person Families | 0 (0.0%) | $0 |
| Total | 30 (100.0%) | $0 |
Family Income by Number of Earners in Miamiville
| Number of Earners | # Families | Median Income |
| No Earners | 0 (0.0%) | $0 |
| 1 Earner | 12 (40.0%) | $0 |
| 2 Earners | 0 (0.0%) | $0 |
| 3+ Earners | 18 (60.0%) | $0 |
| Total | 30 (100.0%) | $0 |
Household Income in Miamiville
Household Income Brackets in Miamiville
With 18 households falling in the category, the $75,000 to $99,999 income range is the most frequent in Miamiville, accounting for 32.1% of all households.
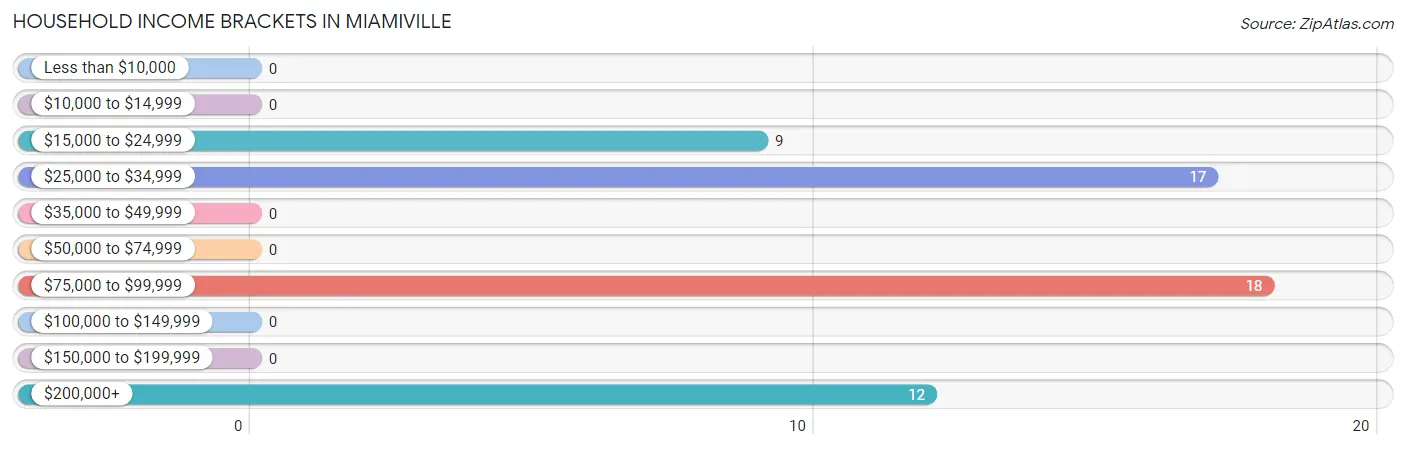
| Income Bracket | # Households | % Households |
| Less than $10,000 | 0 | 0.0% |
| $10,000 to $14,999 | 0 | 0.0% |
| $15,000 to $24,999 | 9 | 16.1% |
| $25,000 to $34,999 | 17 | 30.4% |
| $35,000 to $49,999 | 0 | 0.0% |
| $50,000 to $74,999 | 0 | 0.0% |
| $75,000 to $99,999 | 18 | 32.1% |
| $100,000 to $149,999 | 0 | 0.0% |
| $150,000 to $199,999 | 0 | 0.0% |
| $200,000+ | 12 | 21.4% |
Household Income by Householder Age in Miamiville
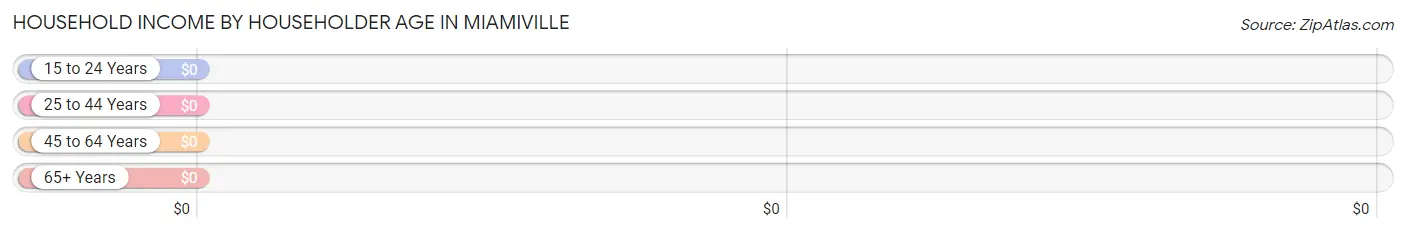
| Income Bracket | # Households | Median Income |
| 15 to 24 Years | 0 (0.0%) | $0 |
| 25 to 44 Years | 17 (30.4%) | $0 |
| 45 to 64 Years | 27 (48.2%) | $0 |
| 65+ Years | 12 (21.4%) | $0 |
| Total | 56 (100.0%) | $0 |
Poverty in Miamiville
Income Below Poverty by Sex and Age in Miamiville
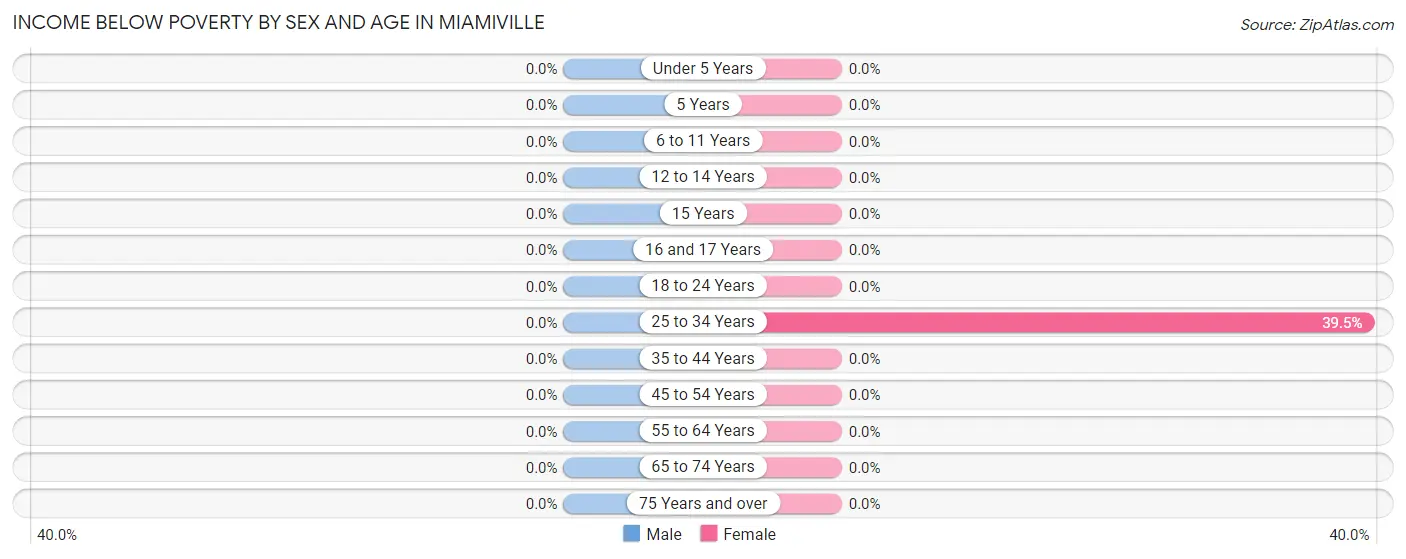
| Age Bracket | Male | Female |
| Under 5 Years | 0 (0.0%) | 0 (0.0%) |
| 5 Years | 0 (0.0%) | 0 (0.0%) |
| 6 to 11 Years | 0 (0.0%) | 0 (0.0%) |
| 12 to 14 Years | 0 (0.0%) | 0 (0.0%) |
| 15 Years | 0 (0.0%) | 0 (0.0%) |
| 16 and 17 Years | 0 (0.0%) | 0 (0.0%) |
| 18 to 24 Years | 0 (0.0%) | 0 (0.0%) |
| 25 to 34 Years | 0 (0.0%) | 17 (39.5%) |
| 35 to 44 Years | 0 (0.0%) | 0 (0.0%) |
| 45 to 54 Years | 0 (0.0%) | 0 (0.0%) |
| 55 to 64 Years | 0 (0.0%) | 0 (0.0%) |
| 65 to 74 Years | 0 (0.0%) | 0 (0.0%) |
| 75 Years and over | 0 (0.0%) | 0 (0.0%) |
| Total | 0 (0.0%) | 17 (21.5%) |
Income Above Poverty by Sex and Age in Miamiville
According to the poverty statistics in Miamiville, males aged 55 to 64 years and females aged 55 to 64 years are the age groups that are most secure financially, with 100.0% of males and 100.0% of females in these age groups living above the poverty line.
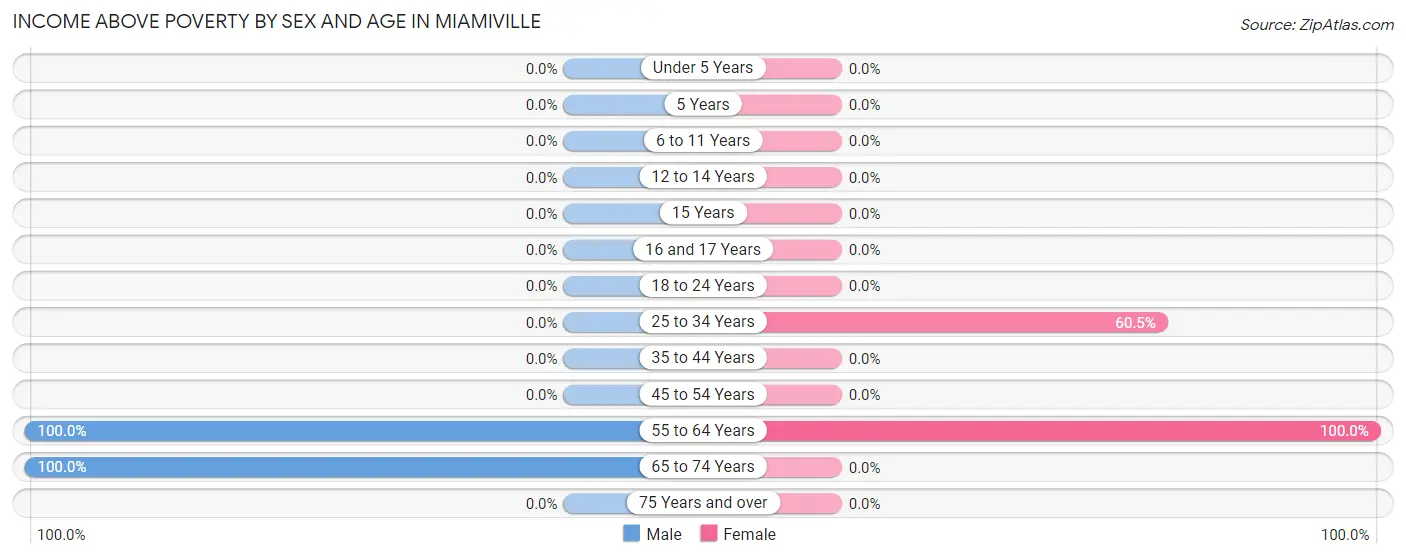
| Age Bracket | Male | Female |
| Under 5 Years | 0 (0.0%) | 0 (0.0%) |
| 5 Years | 0 (0.0%) | 0 (0.0%) |
| 6 to 11 Years | 0 (0.0%) | 0 (0.0%) |
| 12 to 14 Years | 0 (0.0%) | 0 (0.0%) |
| 15 Years | 0 (0.0%) | 0 (0.0%) |
| 16 and 17 Years | 0 (0.0%) | 0 (0.0%) |
| 18 to 24 Years | 0 (0.0%) | 0 (0.0%) |
| 25 to 34 Years | 0 (0.0%) | 26 (60.5%) |
| 35 to 44 Years | 0 (0.0%) | 0 (0.0%) |
| 45 to 54 Years | 0 (0.0%) | 0 (0.0%) |
| 55 to 64 Years | 26 (100.0%) | 36 (100.0%) |
| 65 to 74 Years | 50 (100.0%) | 0 (0.0%) |
| 75 Years and over | 0 (0.0%) | 0 (0.0%) |
| Total | 76 (100.0%) | 62 (78.5%) |
Income Below Poverty Among Married-Couple Families in Miamiville
| Children | Above Poverty | Below Poverty |
| No Children | 18 (100.0%) | 0 (0.0%) |
| 1 or 2 Children | 0 (0.0%) | 0 (0.0%) |
| 3 or 4 Children | 0 (0.0%) | 0 (0.0%) |
| 5 or more Children | 0 (0.0%) | 0 (0.0%) |
| Total | 18 (100.0%) | 0 (0.0%) |
Income Below Poverty Among Single-Parent Households in Miamiville
| Children | Single Father | Single Mother |
| No Children | 0 (0.0%) | 0 (0.0%) |
| 1 or 2 Children | 0 (0.0%) | 0 (0.0%) |
| 3 or 4 Children | 0 (0.0%) | 0 (0.0%) |
| 5 or more Children | 0 (0.0%) | 0 (0.0%) |
| Total | 0 (0.0%) | 0 (0.0%) |
Income Below Poverty Among Married-Couple vs Single-Parent Households in Miamiville
| Children | Married-Couple Families | Single-Parent Households |
| No Children | 0 (0.0%) | 0 (0.0%) |
| 1 or 2 Children | 0 (0.0%) | 0 (0.0%) |
| 3 or 4 Children | 0 (0.0%) | 0 (0.0%) |
| 5 or more Children | 0 (0.0%) | 0 (0.0%) |
| Total | 0 (0.0%) | 0 (0.0%) |
Race in Miamiville
The most populous races in Miamiville are White / Caucasian (111 | 71.6%), and Two or more Races (44 | 28.4%).
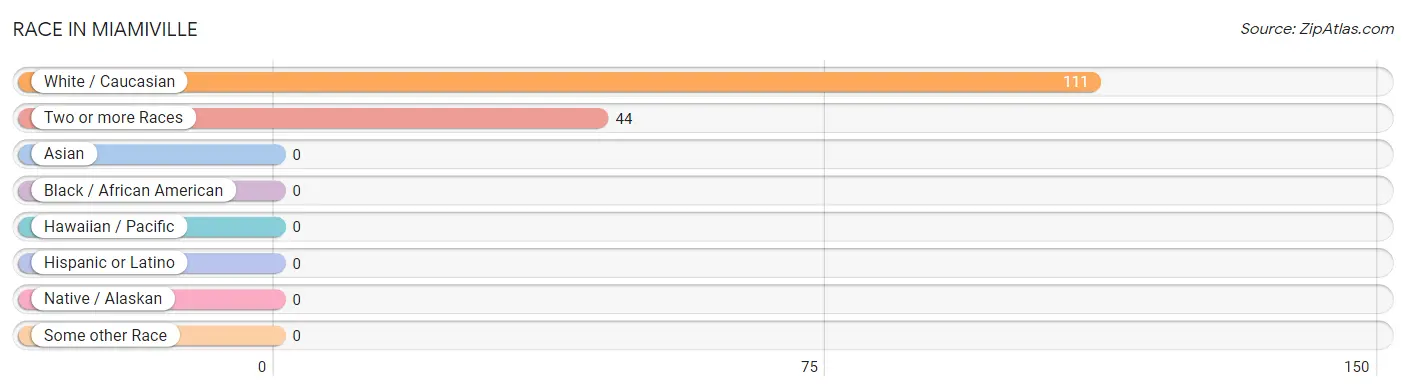
| Race | # Population | % Population |
| Asian | 0 | 0.0% |
| Black / African American | 0 | 0.0% |
| Hawaiian / Pacific | 0 | 0.0% |
| Hispanic or Latino | 0 | 0.0% |
| Native / Alaskan | 0 | 0.0% |
| White / Caucasian | 111 | 71.6% |
| Two or more Races | 44 | 28.4% |
| Some other Race | 0 | 0.0% |
| Total | 155 | 100.0% |
Ancestry in Miamiville
The most populous ancestries reported in Miamiville are German (94 | 60.7%), English (44 | 28.4%), and Australian (9 | 5.8%), together accounting for 94.9% of all Miamiville residents.
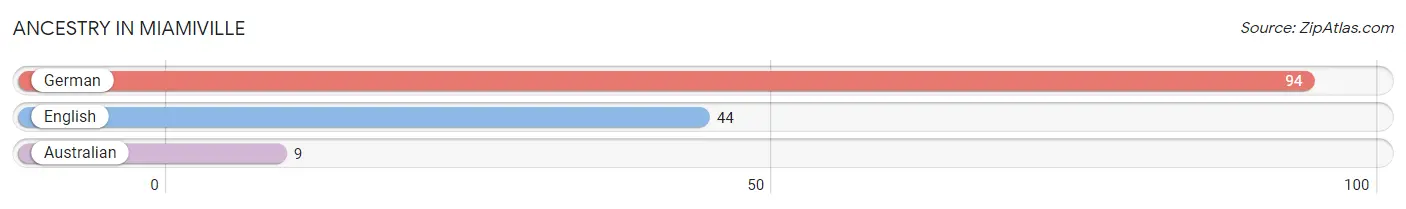
| Ancestry | # Population | % Population |
| Australian | 9 | 5.8% |
| English | 44 | 28.4% |
| German | 94 | 60.7% | View All 3 Rows |
Immigrants in Miamiville
The most numerous immigrant groups reported in Miamiville came from Australia (9 | 5.8%), and Oceania (9 | 5.8%), together accounting for 11.6% of all Miamiville residents.
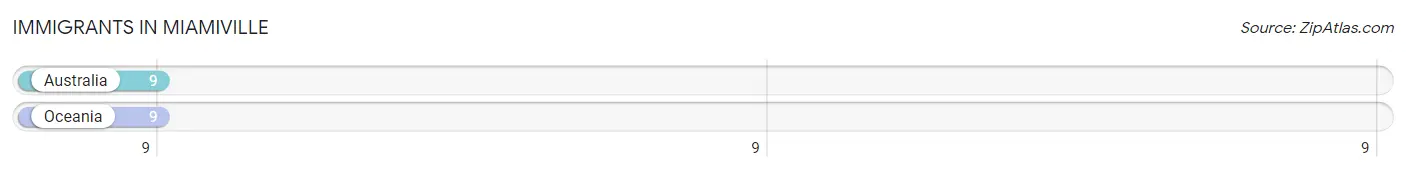
| Immigration Origin | # Population | % Population |
| Australia | 9 | 5.8% |
| Oceania | 9 | 5.8% | View All 2 Rows |
Sex and Age in Miamiville
Sex and Age in Miamiville
The most populous age groups in Miamiville are 65 to 69 Years (50 | 65.8%) for men and 60 to 64 Years (36 | 45.6%) for women.
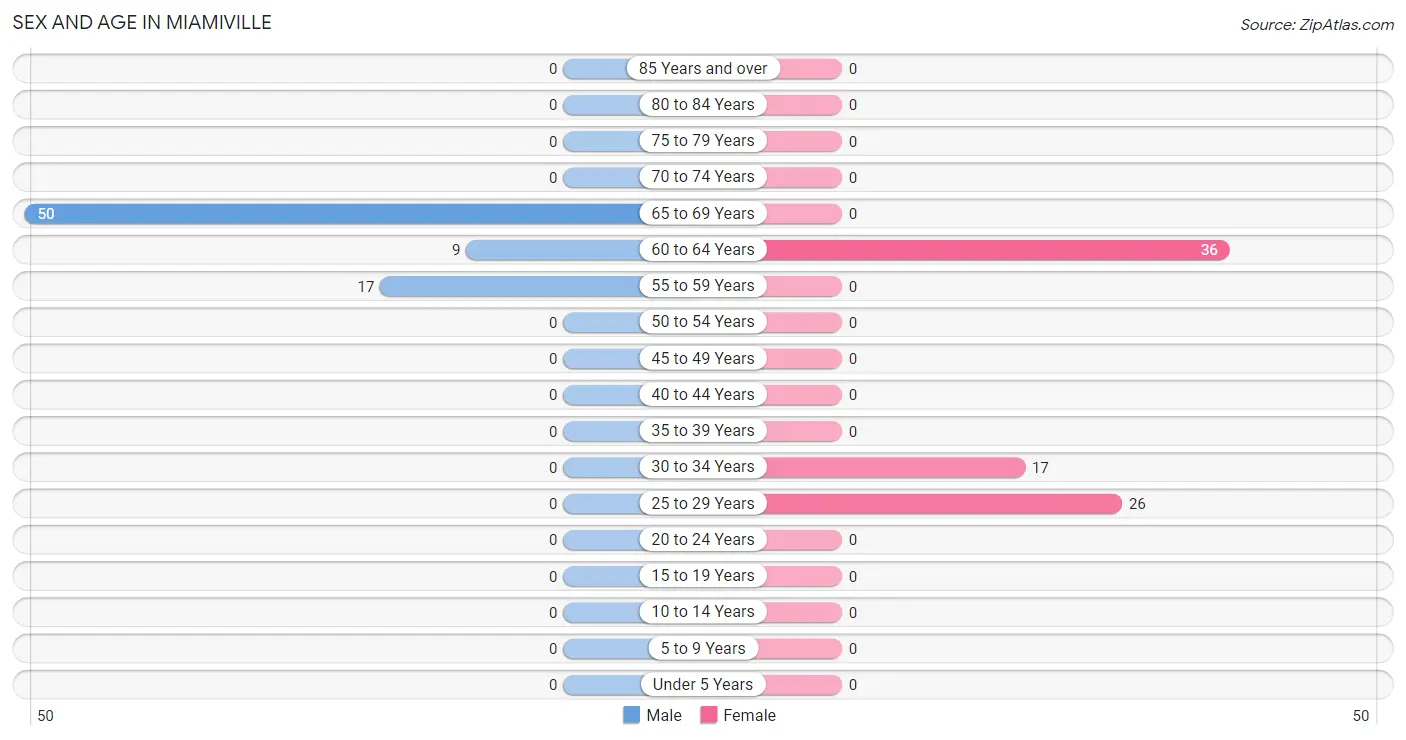
| Age Bracket | Male | Female |
| Under 5 Years | 0 (0.0%) | 0 (0.0%) |
| 5 to 9 Years | 0 (0.0%) | 0 (0.0%) |
| 10 to 14 Years | 0 (0.0%) | 0 (0.0%) |
| 15 to 19 Years | 0 (0.0%) | 0 (0.0%) |
| 20 to 24 Years | 0 (0.0%) | 0 (0.0%) |
| 25 to 29 Years | 0 (0.0%) | 26 (32.9%) |
| 30 to 34 Years | 0 (0.0%) | 17 (21.5%) |
| 35 to 39 Years | 0 (0.0%) | 0 (0.0%) |
| 40 to 44 Years | 0 (0.0%) | 0 (0.0%) |
| 45 to 49 Years | 0 (0.0%) | 0 (0.0%) |
| 50 to 54 Years | 0 (0.0%) | 0 (0.0%) |
| 55 to 59 Years | 17 (22.4%) | 0 (0.0%) |
| 60 to 64 Years | 9 (11.8%) | 36 (45.6%) |
| 65 to 69 Years | 50 (65.8%) | 0 (0.0%) |
| 70 to 74 Years | 0 (0.0%) | 0 (0.0%) |
| 75 to 79 Years | 0 (0.0%) | 0 (0.0%) |
| 80 to 84 Years | 0 (0.0%) | 0 (0.0%) |
| 85 Years and over | 0 (0.0%) | 0 (0.0%) |
| Total | 76 (100.0%) | 79 (100.0%) |
Families and Households in Miamiville
Median Family Size in Miamiville
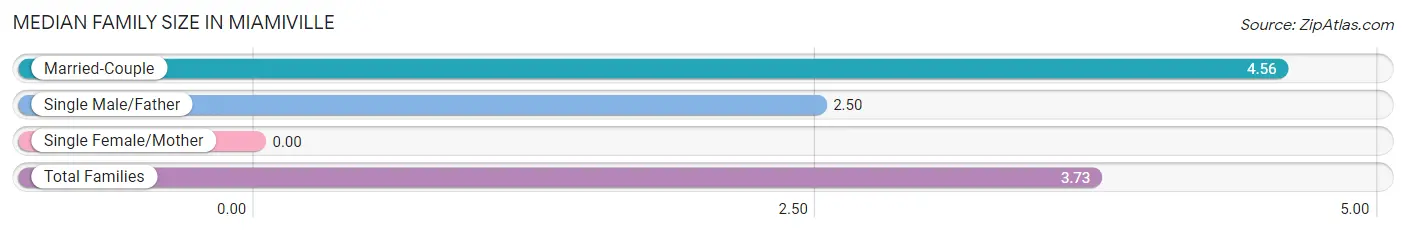
| Family Type | # Families | Family Size |
| Married-Couple | 18 (60.0%) | 4.56 |
| Single Male/Father | 12 (40.0%) | 2.50 |
| Single Female/Mother | 0 (0.0%) | - |
| Total Families | 30 (100.0%) | 3.73 |
Median Household Size in Miamiville
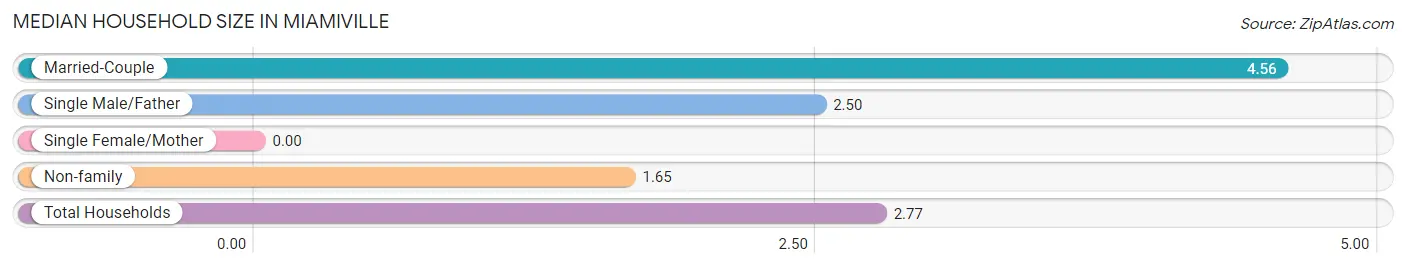
| Household Type | # Households | Household Size |
| Married-Couple | 18 (32.1%) | 4.56 |
| Single Male/Father | 12 (21.4%) | 2.50 |
| Single Female/Mother | 0 (0.0%) | - |
| Non-family | 26 (46.4%) | 1.65 |
| Total Households | 56 (100.0%) | 2.77 |
Household Size by Marriage Status in Miamiville
Out of a total of 56 households in Miamiville, 30 (53.6%) are family households, while 26 (46.4%) are nonfamily households. The most numerous type of family households are 3-person households, comprising 18, and the most common type of nonfamily households are 2-person households, comprising 17.
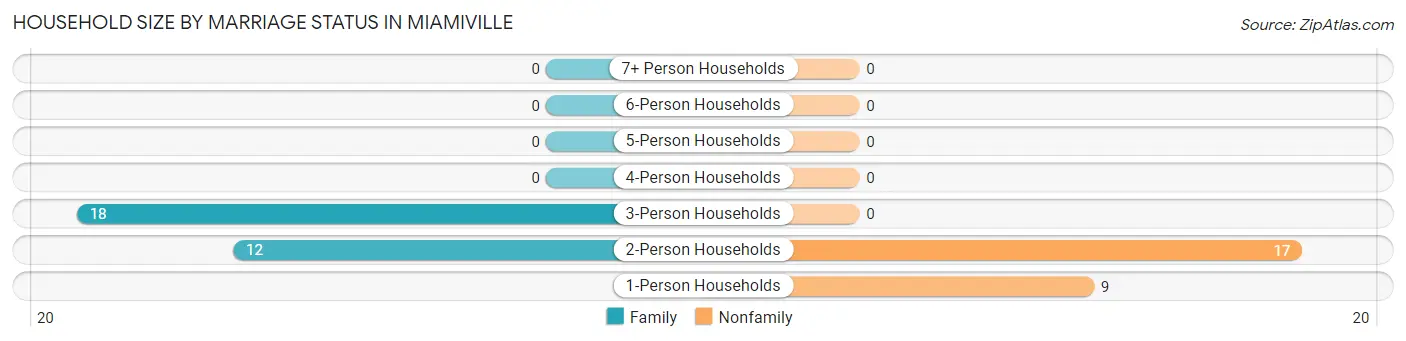
| Household Size | Family Households | Nonfamily Households |
| 1-Person Households | - | 9 (16.1%) |
| 2-Person Households | 12 (21.4%) | 17 (30.4%) |
| 3-Person Households | 18 (32.1%) | 0 (0.0%) |
| 4-Person Households | 0 (0.0%) | 0 (0.0%) |
| 5-Person Households | 0 (0.0%) | 0 (0.0%) |
| 6-Person Households | 0 (0.0%) | 0 (0.0%) |
| 7+ Person Households | 0 (0.0%) | 0 (0.0%) |
| Total | 30 (53.6%) | 26 (46.4%) |
Female Fertility in Miamiville
Fertility by Age in Miamiville
| Age Bracket | Women with Births | Births / 1,000 Women |
| 15 to 19 years | 0 (0.0%) | 0.0 |
| 20 to 34 years | 0 (0.0%) | 0.0 |
| 35 to 50 years | 0 (0.0%) | 0.0 |
| Total | 0 (0.0%) | 0.0 |
Fertility by Age by Marriage Status in Miamiville
| Age Bracket | Married | Unmarried |
| 15 to 19 years | 0 (0.0%) | 0 (0.0%) |
| 20 to 34 years | 0 (0.0%) | 0 (0.0%) |
| 35 to 50 years | 0 (0.0%) | 0 (0.0%) |
| Total | 0 (0.0%) | 0 (0.0%) |
Fertility by Education in Miamiville
| Educational Attainment | Women with Births | Births / 1,000 Women |
| Less than High School | 0 (0.0%) | 0.0 |
| High School Diploma | 0 (0.0%) | 0.0 |
| College or Associate's Degree | 0 (0.0%) | 0.0 |
| Bachelor's Degree | 0 (0.0%) | 0.0 |
| Graduate Degree | 0 (0.0%) | 0.0 |
| Total | 0 (0.0%) | 0.0 |
Fertility by Education by Marriage Status in Miamiville
| Educational Attainment | Married | Unmarried |
| Less than High School | 0 (0.0%) | 0 (0.0%) |
| High School Diploma | 0 (0.0%) | 0 (0.0%) |
| College or Associate's Degree | 0 (0.0%) | 0 (0.0%) |
| Bachelor's Degree | 0 (0.0%) | 0 (0.0%) |
| Graduate Degree | 0 (0.0%) | 0 (0.0%) |
| Total | 0 (0.0%) | 0 (0.0%) |
Employment Characteristics in Miamiville
Employment by Class of Employer in Miamiville
Among the 108 employed individuals in Miamiville, self-employed (not incorporated) (38 | 35.2%), self-employed (incorporated) (26 | 24.1%), and state government employees (26 | 24.1%) make up the most common classes of employment.
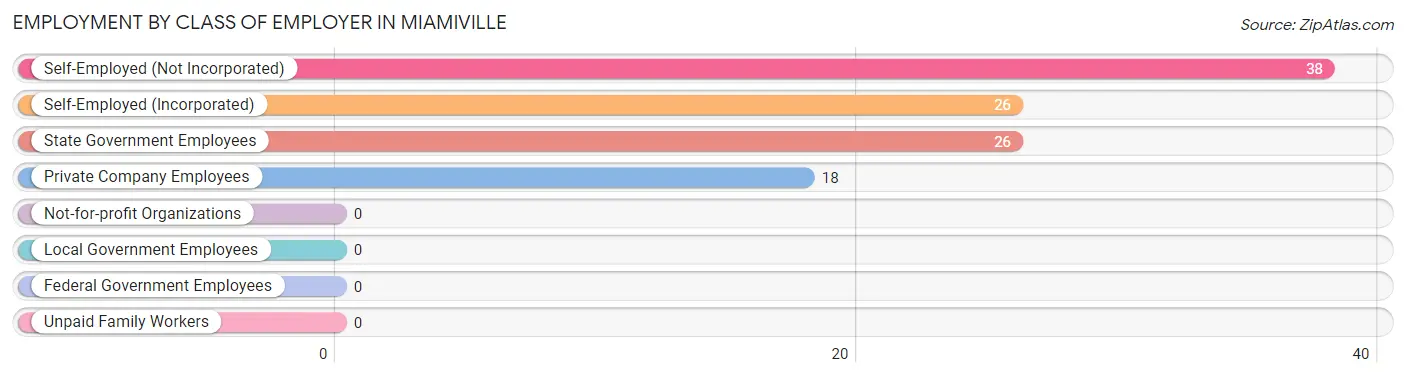
| Employer Class | # Employees | % Employees |
| Private Company Employees | 18 | 16.7% |
| Self-Employed (Incorporated) | 26 | 24.1% |
| Self-Employed (Not Incorporated) | 38 | 35.2% |
| Not-for-profit Organizations | 0 | 0.0% |
| Local Government Employees | 0 | 0.0% |
| State Government Employees | 26 | 24.1% |
| Federal Government Employees | 0 | 0.0% |
| Unpaid Family Workers | 0 | 0.0% |
| Total | 108 | 100.0% |
Employment Status by Age in Miamiville
According to the labor force statistics for Miamiville, out of the total population over 16 years of age (155), 92.3% or 143 individuals are in the labor force, with 11.9% or 17 of them unemployed. The age group with the highest labor force participation rate is 25 to 29 years, with 100.0% or 26 individuals in the labor force. Within the labor force, the 30 to 34 years age range has the highest percentage of unemployed individuals, with 100.0% or 17 of them being unemployed.
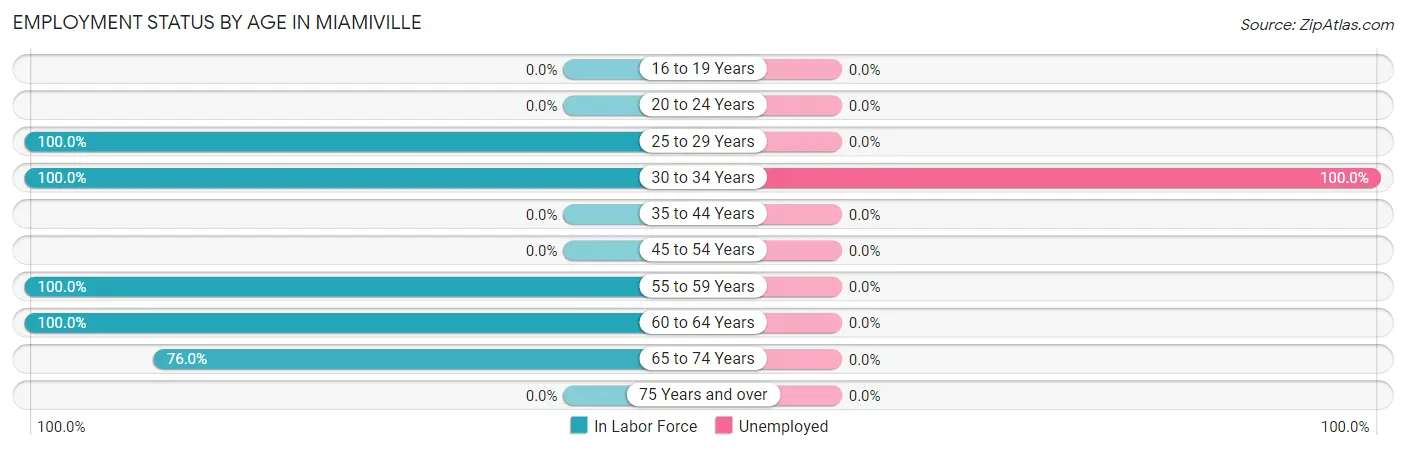
| Age Bracket | In Labor Force | Unemployed |
| 16 to 19 Years | 0 (0.0%) | 0 (0.0%) |
| 20 to 24 Years | 0 (0.0%) | 0 (0.0%) |
| 25 to 29 Years | 26 (100.0%) | 0 (0.0%) |
| 30 to 34 Years | 17 (100.0%) | 17 (100.0%) |
| 35 to 44 Years | 0 (0.0%) | 0 (0.0%) |
| 45 to 54 Years | 0 (0.0%) | 0 (0.0%) |
| 55 to 59 Years | 17 (100.0%) | 0 (0.0%) |
| 60 to 64 Years | 45 (100.0%) | 0 (0.0%) |
| 65 to 74 Years | 38 (76.0%) | 0 (0.0%) |
| 75 Years and over | 0 (0.0%) | 0 (0.0%) |
| Total | 143 (92.3%) | 17 (11.9%) |
Employment Status by Educational Attainment in Miamiville
According to labor force statistics for Miamiville, 100.0% of individuals (105) out of the total population between 25 and 64 years of age (105) are in the labor force, with 16.2% or 17 of them being unemployed. The group with the highest labor force participation rate are those with the educational attainment of high school diploma, with 100.0% or 34 individuals in the labor force. Within the labor force, individuals with high school diploma education have the highest percentage of unemployment, with 50.0% or 17 of them being unemployed.
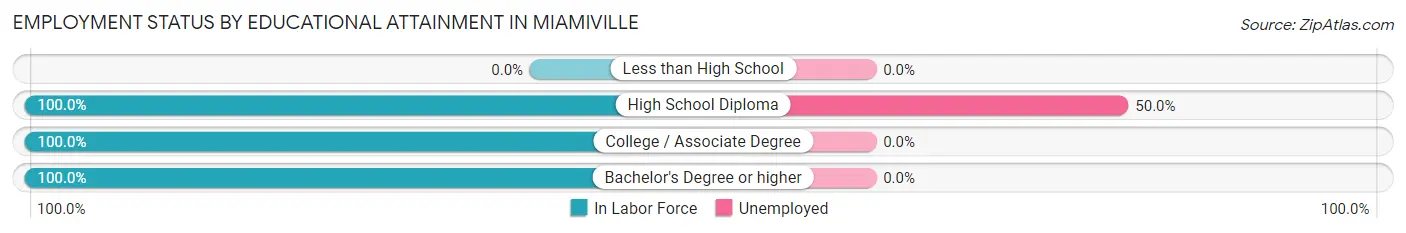
| Educational Attainment | In Labor Force | Unemployed |
| Less than High School | 0 (0.0%) | 0 (0.0%) |
| High School Diploma | 34 (100.0%) | 17 (50.0%) |
| College / Associate Degree | 18 (100.0%) | 0 (0.0%) |
| Bachelor's Degree or higher | 53 (100.0%) | 0 (0.0%) |
| Total | 105 (100.0%) | 17 (16.2%) |
Employment Occupations by Sex in Miamiville
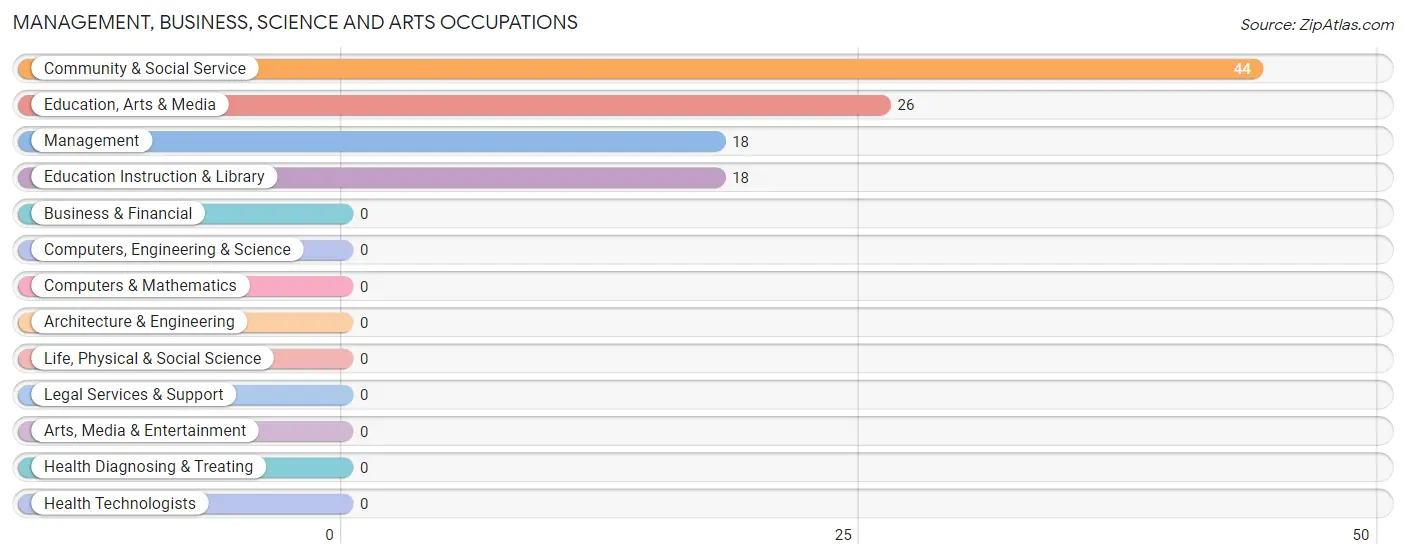
Management, Business, Science and Arts Occupations
The most common Management, Business, Science and Arts occupations in Miamiville are Community & Social Service (44 | 34.9%), Education, Arts & Media (26 | 20.6%), Management (18 | 14.3%), and Education Instruction & Library (18 | 14.3%).
Management, Business, Science and Arts Occupations by Sex
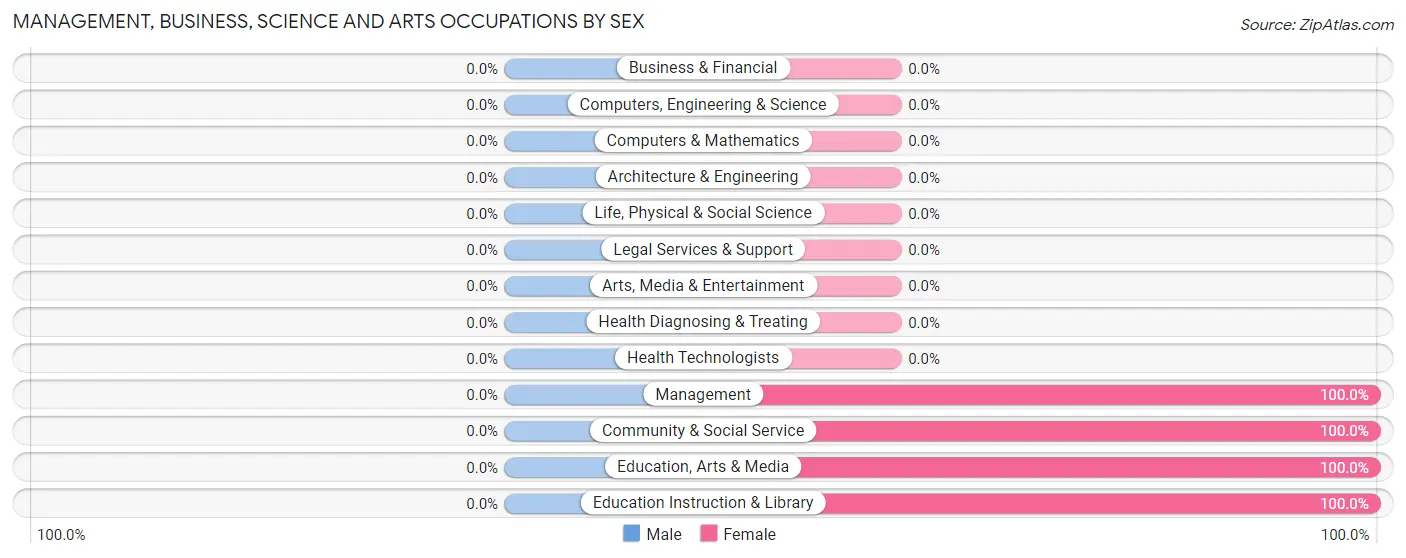
| Occupation | Male | Female |
| Management | 0 (0.0%) | 18 (100.0%) |
| Business & Financial | 0 (0.0%) | 0 (0.0%) |
| Computers, Engineering & Science | 0 (0.0%) | 0 (0.0%) |
| Computers & Mathematics | 0 (0.0%) | 0 (0.0%) |
| Architecture & Engineering | 0 (0.0%) | 0 (0.0%) |
| Life, Physical & Social Science | 0 (0.0%) | 0 (0.0%) |
| Community & Social Service | 0 (0.0%) | 44 (100.0%) |
| Education, Arts & Media | 0 (0.0%) | 26 (100.0%) |
| Legal Services & Support | 0 (0.0%) | 0 (0.0%) |
| Education Instruction & Library | 0 (0.0%) | 18 (100.0%) |
| Arts, Media & Entertainment | 0 (0.0%) | 0 (0.0%) |
| Health Diagnosing & Treating | 0 (0.0%) | 0 (0.0%) |
| Health Technologists | 0 (0.0%) | 0 (0.0%) |
| Total (Category) | 0 (0.0%) | 62 (100.0%) |
| Total (Overall) | 64 (50.8%) | 62 (49.2%) |
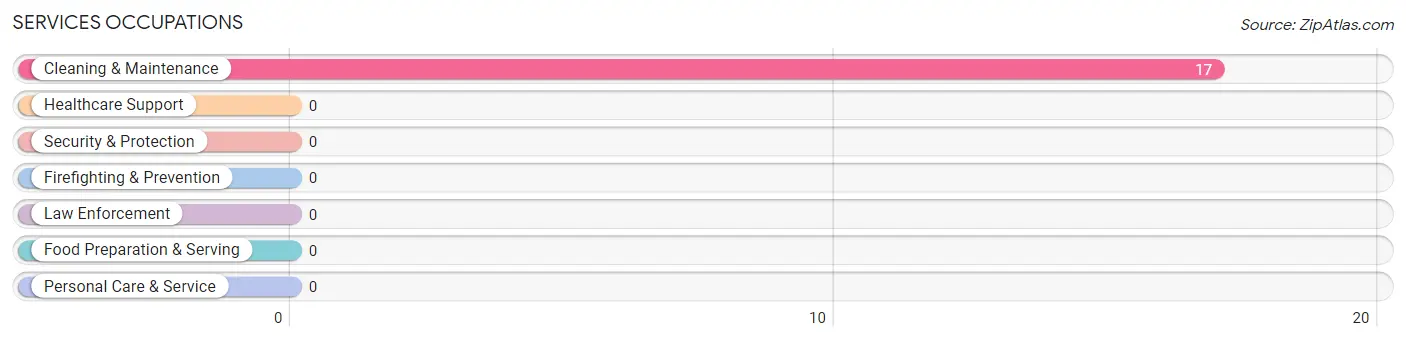
Services Occupations
The most common Services occupations in Miamiville are , and Cleaning & Maintenance (17 | 13.5%).
Services Occupations by Sex
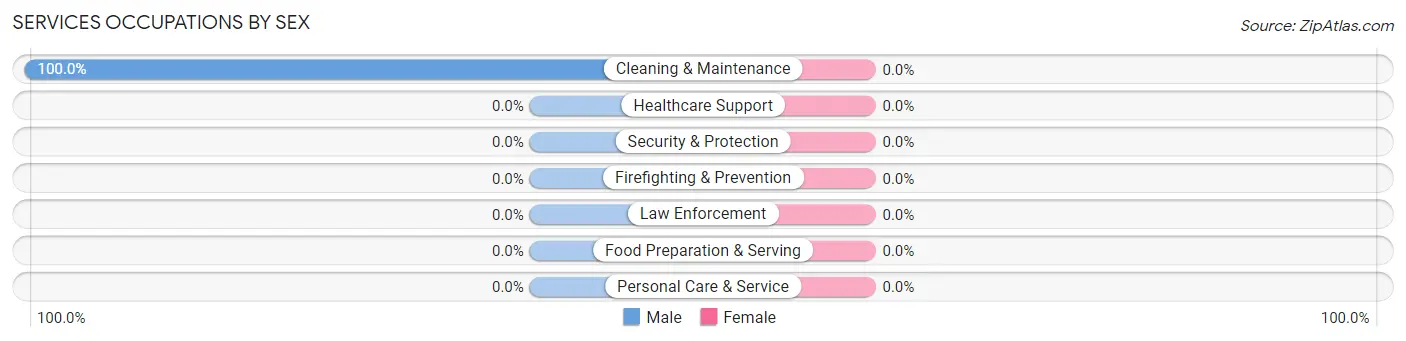
| Occupation | Male | Female |
| Healthcare Support | 0 (0.0%) | 0 (0.0%) |
| Security & Protection | 0 (0.0%) | 0 (0.0%) |
| Firefighting & Prevention | 0 (0.0%) | 0 (0.0%) |
| Law Enforcement | 0 (0.0%) | 0 (0.0%) |
| Food Preparation & Serving | 0 (0.0%) | 0 (0.0%) |
| Cleaning & Maintenance | 17 (100.0%) | 0 (0.0%) |
| Personal Care & Service | 0 (0.0%) | 0 (0.0%) |
| Total (Category) | 17 (100.0%) | 0 (0.0%) |
| Total (Overall) | 64 (50.8%) | 62 (49.2%) |
Sales and Office Occupations
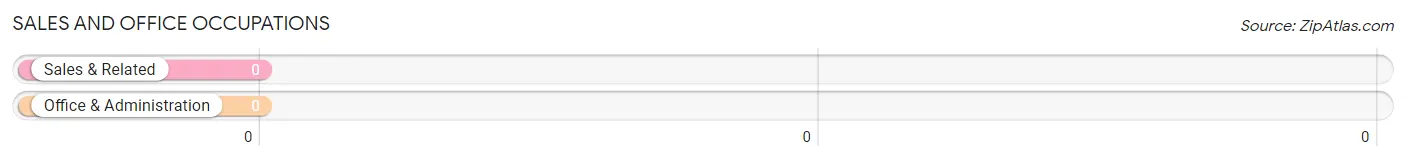
Sales and Office Occupations by Sex
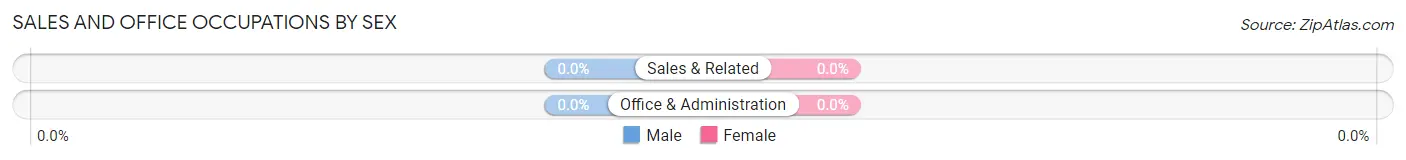
| Occupation | Male | Female |
| Sales & Related | 0 (0.0%) | 0 (0.0%) |
| Office & Administration | 0 (0.0%) | 0 (0.0%) |
| Total (Category) | 0 (0.0%) | 0 (0.0%) |
| Total (Overall) | 64 (50.8%) | 62 (49.2%) |
Natural Resources, Construction and Maintenance Occupations
The most common Natural Resources, Construction and Maintenance occupations in Miamiville are , and Construction & Extraction (38 | 30.2%).
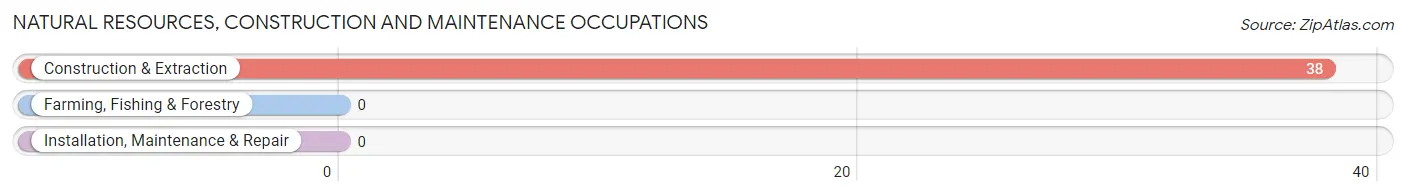
Natural Resources, Construction and Maintenance Occupations by Sex
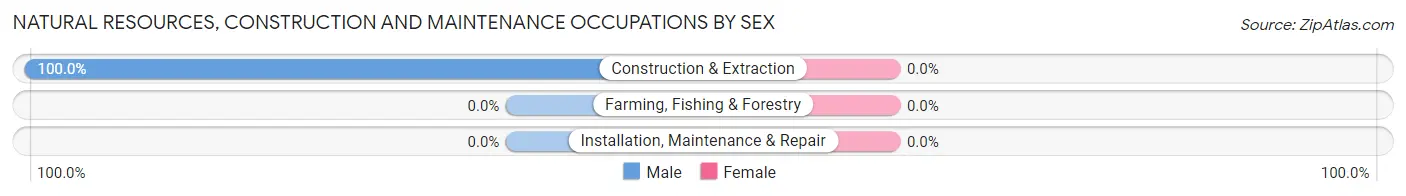
| Occupation | Male | Female |
| Farming, Fishing & Forestry | 0 (0.0%) | 0 (0.0%) |
| Construction & Extraction | 38 (100.0%) | 0 (0.0%) |
| Installation, Maintenance & Repair | 0 (0.0%) | 0 (0.0%) |
| Total (Category) | 38 (100.0%) | 0 (0.0%) |
| Total (Overall) | 64 (50.8%) | 62 (49.2%) |
Production, Transportation and Moving Occupations
The most common Production, Transportation and Moving occupations in Miamiville are , and Production (9 | 7.1%).
Production, Transportation and Moving Occupations by Sex
| Occupation | Male | Female |
| Production | 9 (100.0%) | 0 (0.0%) |
| Transportation | 0 (0.0%) | 0 (0.0%) |
| Material Moving | 0 (0.0%) | 0 (0.0%) |
| Total (Category) | 9 (100.0%) | 0 (0.0%) |
| Total (Overall) | 64 (50.8%) | 62 (49.2%) |
Employment Industries by Sex in Miamiville
Employment Industries in Miamiville
The major employment industries in Miamiville include Construction (38 | 30.2%), Public Administration (26 | 20.6%), Professional & Scientific (18 | 14.3%), Educational Services (18 | 14.3%), and Administrative & Support (17 | 13.5%).
Employment Industries by Sex in Miamiville
The Miamiville industries that see more men than women are Construction (100.0%), Manufacturing (100.0%), and Administrative & Support (100.0%), whereas the industries that tend to have a higher number of women are Professional & Scientific (100.0%), Educational Services (100.0%), and Public Administration (100.0%).
| Industry | Male | Female |
| Agriculture, Fishing & Hunting | 0 (0.0%) | 0 (0.0%) |
| Mining, Quarrying, & Extraction | 0 (0.0%) | 0 (0.0%) |
| Construction | 38 (100.0%) | 0 (0.0%) |
| Manufacturing | 9 (100.0%) | 0 (0.0%) |
| Wholesale Trade | 0 (0.0%) | 0 (0.0%) |
| Retail Trade | 0 (0.0%) | 0 (0.0%) |
| Transportation & Warehousing | 0 (0.0%) | 0 (0.0%) |
| Utilities | 0 (0.0%) | 0 (0.0%) |
| Information | 0 (0.0%) | 0 (0.0%) |
| Finance & Insurance | 0 (0.0%) | 0 (0.0%) |
| Real Estate, Rental & Leasing | 0 (0.0%) | 0 (0.0%) |
| Professional & Scientific | 0 (0.0%) | 18 (100.0%) |
| Enterprise Management | 0 (0.0%) | 0 (0.0%) |
| Administrative & Support | 17 (100.0%) | 0 (0.0%) |
| Educational Services | 0 (0.0%) | 18 (100.0%) |
| Health Care & Social Assistance | 0 (0.0%) | 0 (0.0%) |
| Arts, Entertainment & Recreation | 0 (0.0%) | 0 (0.0%) |
| Accommodation & Food Services | 0 (0.0%) | 0 (0.0%) |
| Public Administration | 0 (0.0%) | 26 (100.0%) |
| Total | 64 (50.8%) | 62 (49.2%) |
Education in Miamiville
School Enrollment in Miamiville
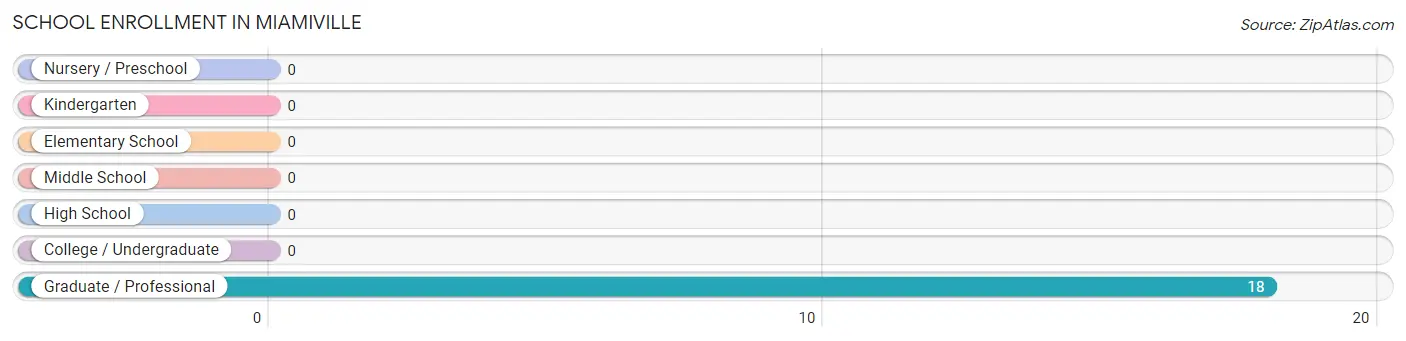
| School Level | # Students | % Students |
| Nursery / Preschool | 0 | 0.0% |
| Kindergarten | 0 | 0.0% |
| Elementary School | 0 | 0.0% |
| Middle School | 0 | 0.0% |
| High School | 0 | 0.0% |
| College / Undergraduate | 0 | 0.0% |
| Graduate / Professional | 18 | 100.0% |
| Total | 18 | 100.0% |
School Enrollment by Age by Funding Source in Miamiville
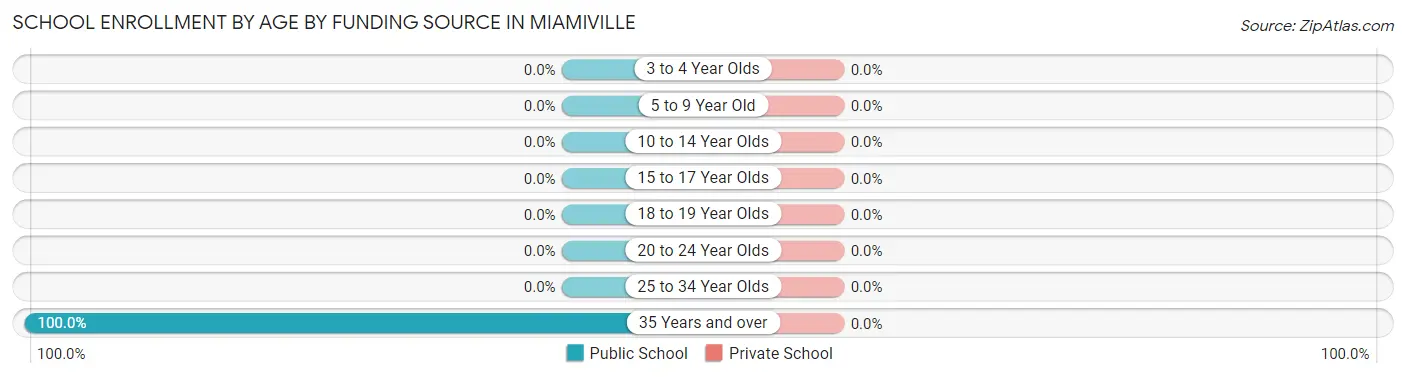
| Age Bracket | Public School | Private School |
| 3 to 4 Year Olds | 0 (0.0%) | 0 (0.0%) |
| 5 to 9 Year Old | 0 (0.0%) | 0 (0.0%) |
| 10 to 14 Year Olds | 0 (0.0%) | 0 (0.0%) |
| 15 to 17 Year Olds | 0 (0.0%) | 0 (0.0%) |
| 18 to 19 Year Olds | 0 (0.0%) | 0 (0.0%) |
| 20 to 24 Year Olds | 0 (0.0%) | 0 (0.0%) |
| 25 to 34 Year Olds | 0 (0.0%) | 0 (0.0%) |
| 35 Years and over | 18 (100.0%) | 0 (0.0%) |
| Total | 18 (100.0%) | 0 (0.0%) |
Educational Attainment by Field of Study in Miamiville
Arts & humanities (44 | 67.7%), business (12 | 18.5%), and social sciences (9 | 13.9%) are the most common fields of study among 65 individuals in Miamiville who have obtained a bachelor's degree or higher.
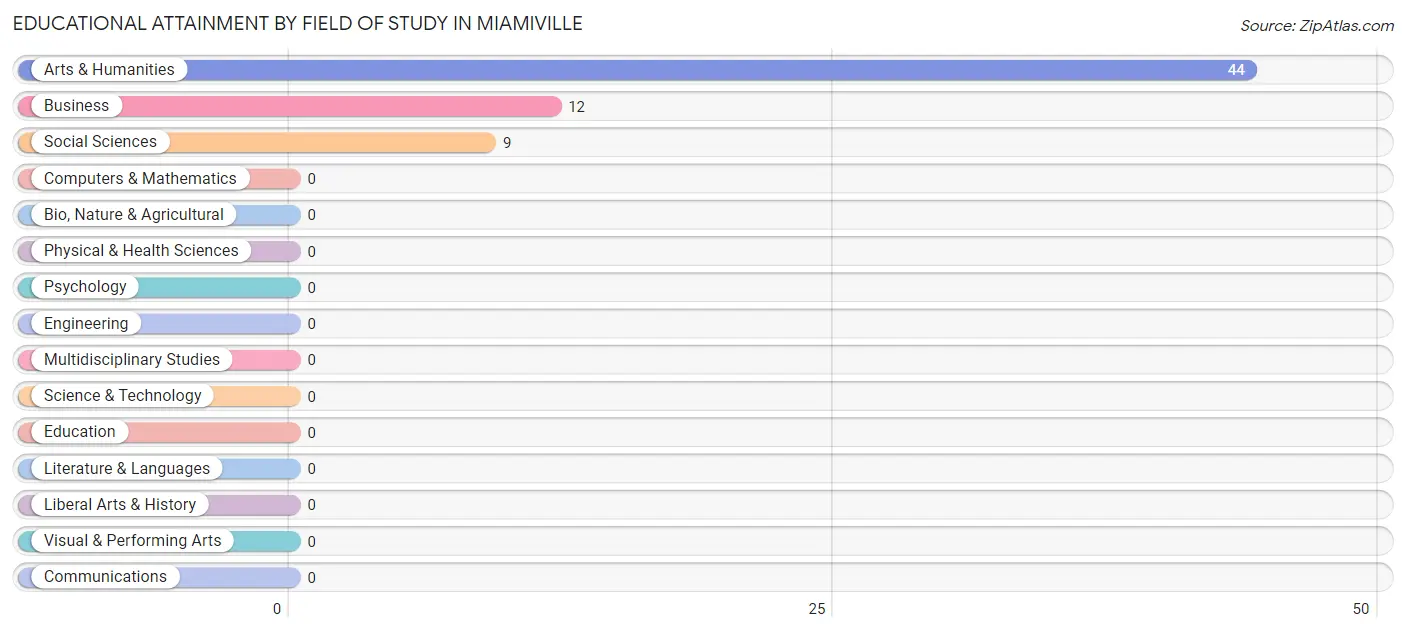
| Field of Study | # Graduates | % Graduates |
| Computers & Mathematics | 0 | 0.0% |
| Bio, Nature & Agricultural | 0 | 0.0% |
| Physical & Health Sciences | 0 | 0.0% |
| Psychology | 0 | 0.0% |
| Social Sciences | 9 | 13.9% |
| Engineering | 0 | 0.0% |
| Multidisciplinary Studies | 0 | 0.0% |
| Science & Technology | 0 | 0.0% |
| Business | 12 | 18.5% |
| Education | 0 | 0.0% |
| Literature & Languages | 0 | 0.0% |
| Liberal Arts & History | 0 | 0.0% |
| Visual & Performing Arts | 0 | 0.0% |
| Communications | 0 | 0.0% |
| Arts & Humanities | 44 | 67.7% |
| Total | 65 | 100.0% |
Transportation & Commute in Miamiville
Vehicle Availability by Sex in Miamiville
The most prevalent vehicle ownership categories in Miamiville are males with 3 vehicles (38, accounting for 59.4%) and females with 3 vehicles (26, making up 86.4%).
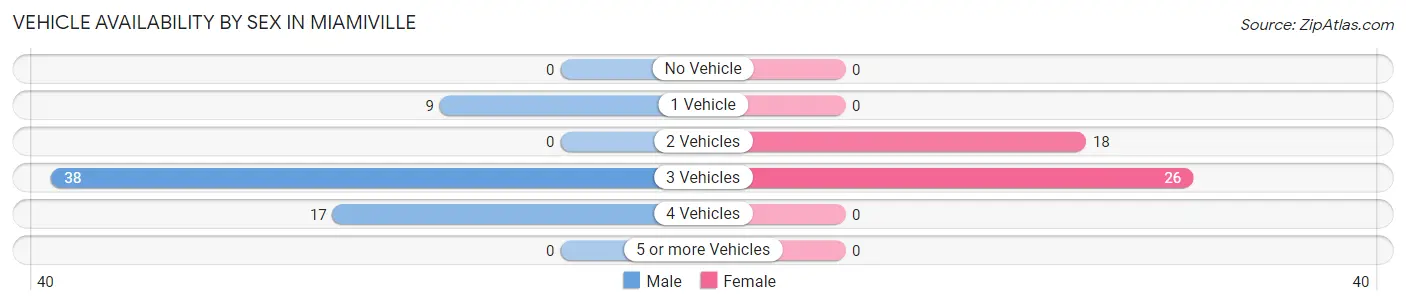
| Vehicles Available | Male | Female |
| No Vehicle | 0 (0.0%) | 0 (0.0%) |
| 1 Vehicle | 9 (14.1%) | 0 (0.0%) |
| 2 Vehicles | 0 (0.0%) | 18 (40.9%) |
| 3 Vehicles | 38 (59.4%) | 26 (59.1%) |
| 4 Vehicles | 17 (26.6%) | 0 (0.0%) |
| 5 or more Vehicles | 0 (0.0%) | 0 (0.0%) |
| Total | 64 (100.0%) | 44 (100.0%) |
Commute Time in Miamiville
The most frequently occuring commute durations in Miamiville are 20 to 24 minutes (44 commuters, 62.9%), 45 to 59 minutes (17 commuters, 24.3%), and 5 to 9 minutes (9 commuters, 12.9%).
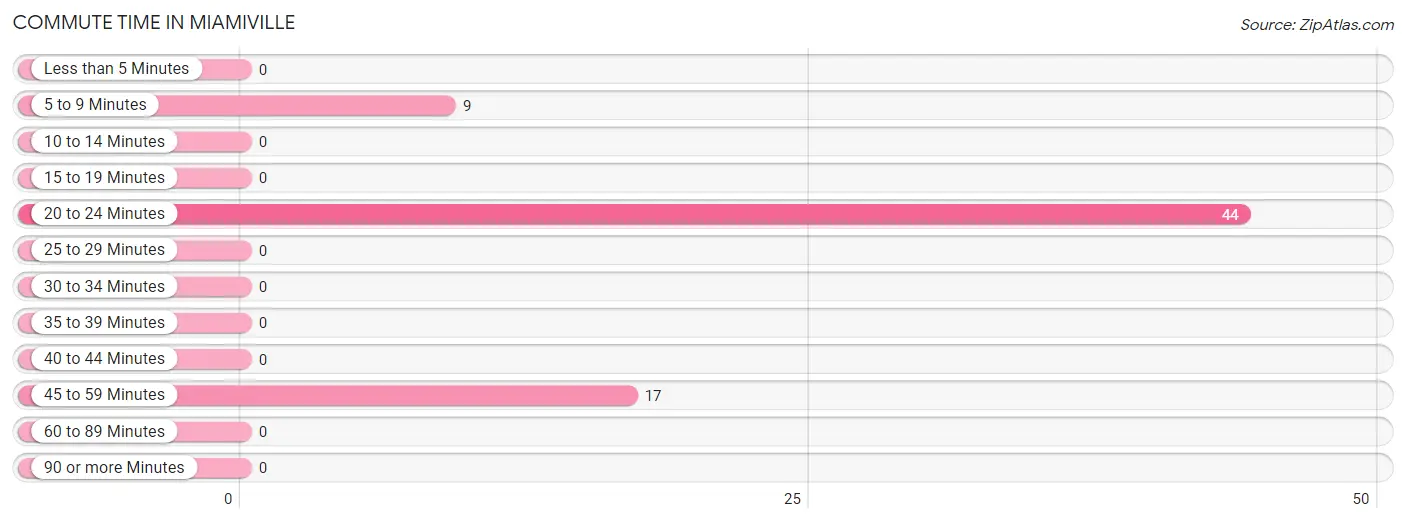
| Commute Time | # Commuters | % Commuters |
| Less than 5 Minutes | 0 | 0.0% |
| 5 to 9 Minutes | 9 | 12.9% |
| 10 to 14 Minutes | 0 | 0.0% |
| 15 to 19 Minutes | 0 | 0.0% |
| 20 to 24 Minutes | 44 | 62.9% |
| 25 to 29 Minutes | 0 | 0.0% |
| 30 to 34 Minutes | 0 | 0.0% |
| 35 to 39 Minutes | 0 | 0.0% |
| 40 to 44 Minutes | 0 | 0.0% |
| 45 to 59 Minutes | 17 | 24.3% |
| 60 to 89 Minutes | 0 | 0.0% |
| 90 or more Minutes | 0 | 0.0% |
Commute Time by Sex in Miamiville
The most common commute times in Miamiville are 45 to 59 minutes (17 commuters, 65.4%) for males and 20 to 24 minutes (44 commuters, 100.0%) for females.
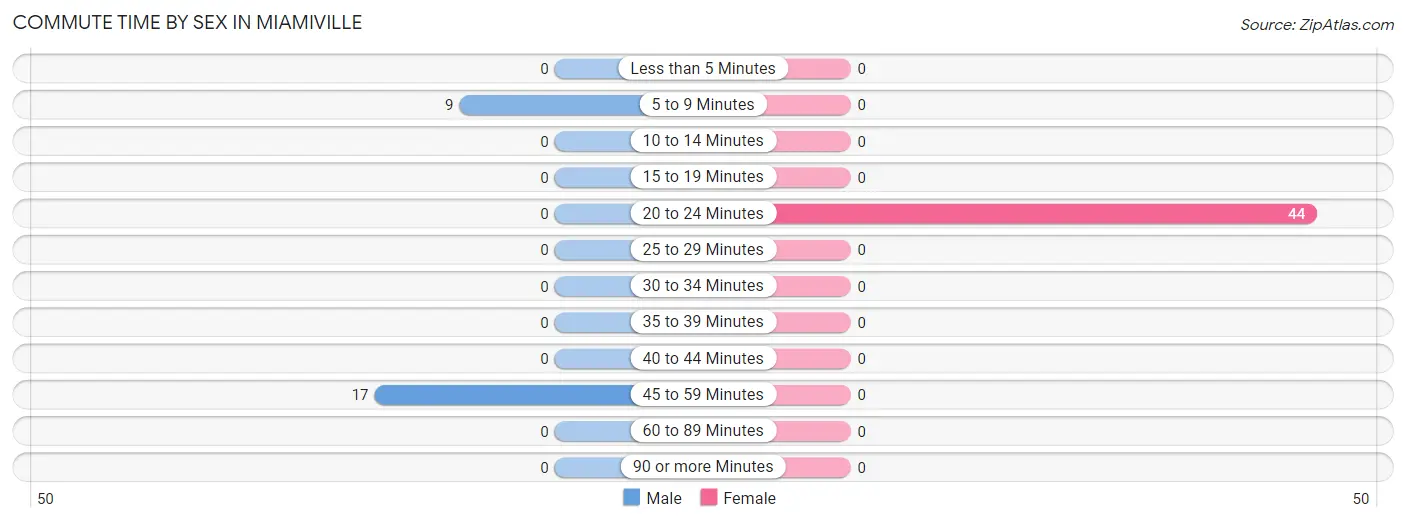
| Commute Time | Male | Female |
| Less than 5 Minutes | 0 (0.0%) | 0 (0.0%) |
| 5 to 9 Minutes | 9 (34.6%) | 0 (0.0%) |
| 10 to 14 Minutes | 0 (0.0%) | 0 (0.0%) |
| 15 to 19 Minutes | 0 (0.0%) | 0 (0.0%) |
| 20 to 24 Minutes | 0 (0.0%) | 44 (100.0%) |
| 25 to 29 Minutes | 0 (0.0%) | 0 (0.0%) |
| 30 to 34 Minutes | 0 (0.0%) | 0 (0.0%) |
| 35 to 39 Minutes | 0 (0.0%) | 0 (0.0%) |
| 40 to 44 Minutes | 0 (0.0%) | 0 (0.0%) |
| 45 to 59 Minutes | 17 (65.4%) | 0 (0.0%) |
| 60 to 89 Minutes | 0 (0.0%) | 0 (0.0%) |
| 90 or more Minutes | 0 (0.0%) | 0 (0.0%) |
Time of Departure to Work by Sex in Miamiville
The most frequent times of departure to work in Miamiville are 8:00 AM to 8:29 AM (17, 65.4%) for males and 8:00 AM to 8:29 AM (44, 100.0%) for females.
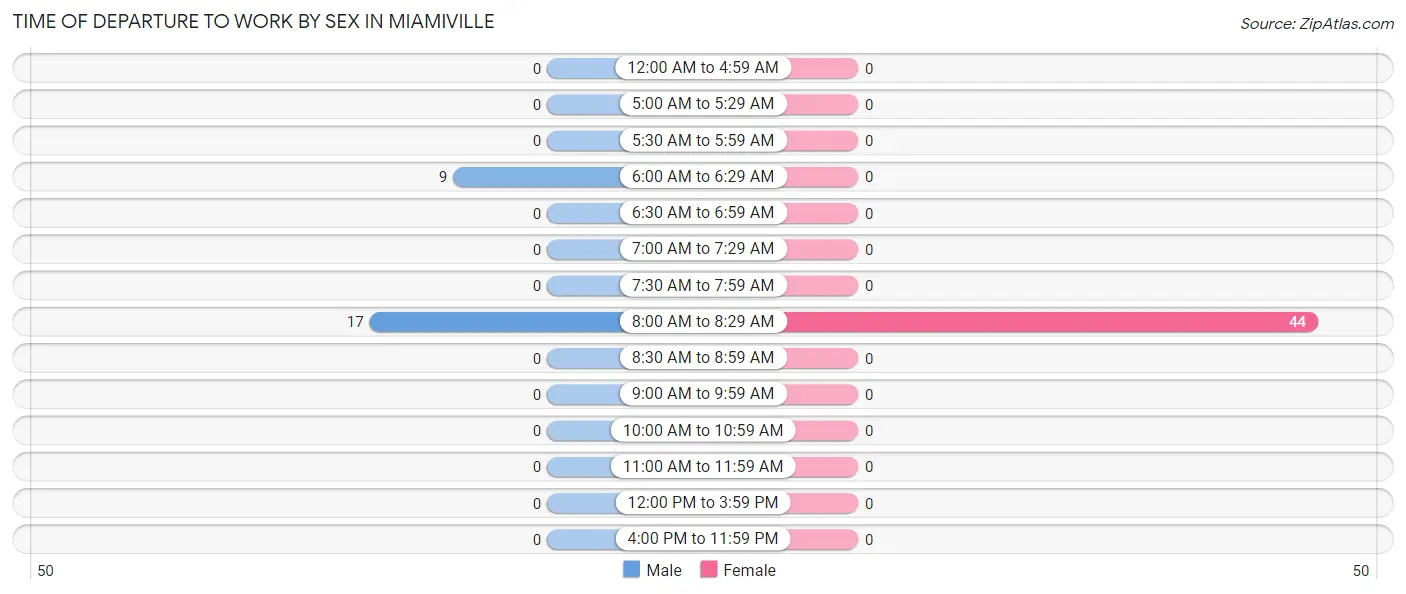
| Time of Departure | Male | Female |
| 12:00 AM to 4:59 AM | 0 (0.0%) | 0 (0.0%) |
| 5:00 AM to 5:29 AM | 0 (0.0%) | 0 (0.0%) |
| 5:30 AM to 5:59 AM | 0 (0.0%) | 0 (0.0%) |
| 6:00 AM to 6:29 AM | 9 (34.6%) | 0 (0.0%) |
| 6:30 AM to 6:59 AM | 0 (0.0%) | 0 (0.0%) |
| 7:00 AM to 7:29 AM | 0 (0.0%) | 0 (0.0%) |
| 7:30 AM to 7:59 AM | 0 (0.0%) | 0 (0.0%) |
| 8:00 AM to 8:29 AM | 17 (65.4%) | 44 (100.0%) |
| 8:30 AM to 8:59 AM | 0 (0.0%) | 0 (0.0%) |
| 9:00 AM to 9:59 AM | 0 (0.0%) | 0 (0.0%) |
| 10:00 AM to 10:59 AM | 0 (0.0%) | 0 (0.0%) |
| 11:00 AM to 11:59 AM | 0 (0.0%) | 0 (0.0%) |
| 12:00 PM to 3:59 PM | 0 (0.0%) | 0 (0.0%) |
| 4:00 PM to 11:59 PM | 0 (0.0%) | 0 (0.0%) |
| Total | 26 (100.0%) | 44 (100.0%) |
Housing Occupancy in Miamiville
Occupancy by Ownership in Miamiville
Of the total 56 dwellings in Miamiville, owner-occupied units account for 30 (53.6%), while renter-occupied units make up 26 (46.4%).
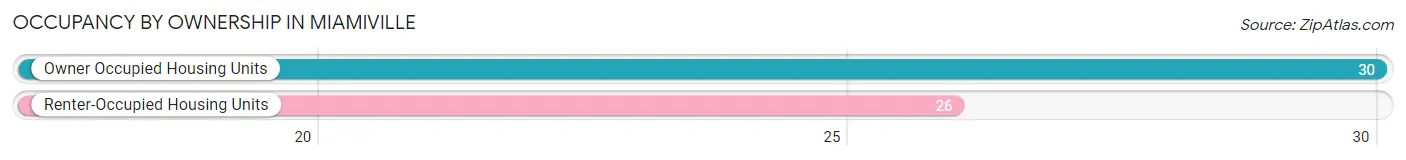
| Occupancy | # Housing Units | % Housing Units |
| Owner Occupied Housing Units | 30 | 53.6% |
| Renter-Occupied Housing Units | 26 | 46.4% |
| Total Occupied Housing Units | 56 | 100.0% |
Occupancy by Household Size in Miamiville
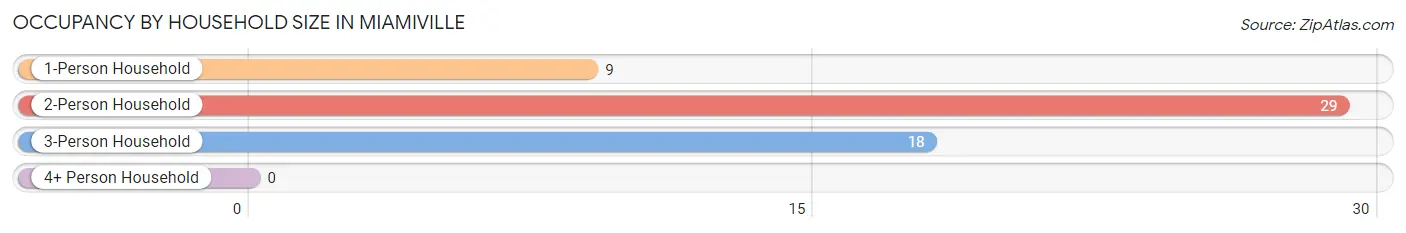
| Household Size | # Housing Units | % Housing Units |
| 1-Person Household | 9 | 16.1% |
| 2-Person Household | 29 | 51.8% |
| 3-Person Household | 18 | 32.1% |
| 4+ Person Household | 0 | 0.0% |
| Total Housing Units | 56 | 100.0% |
Occupancy by Ownership by Household Size in Miamiville
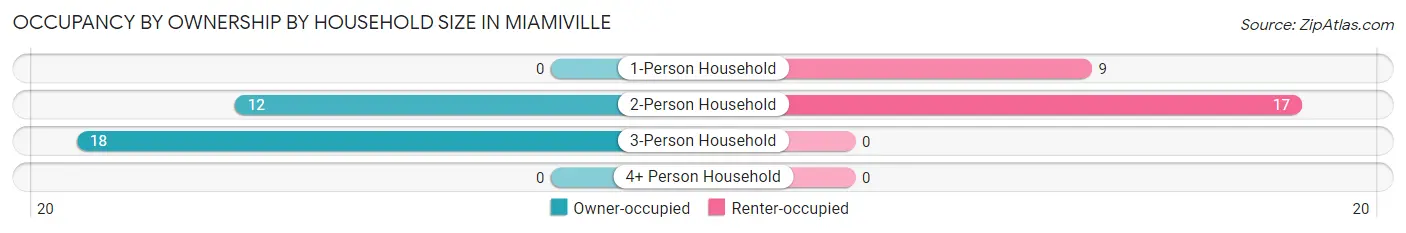
| Household Size | Owner-occupied | Renter-occupied |
| 1-Person Household | 0 (0.0%) | 9 (100.0%) |
| 2-Person Household | 12 (41.4%) | 17 (58.6%) |
| 3-Person Household | 18 (100.0%) | 0 (0.0%) |
| 4+ Person Household | 0 (0.0%) | 0 (0.0%) |
| Total Housing Units | 30 (53.6%) | 26 (46.4%) |
Occupancy by Educational Attainment in Miamiville
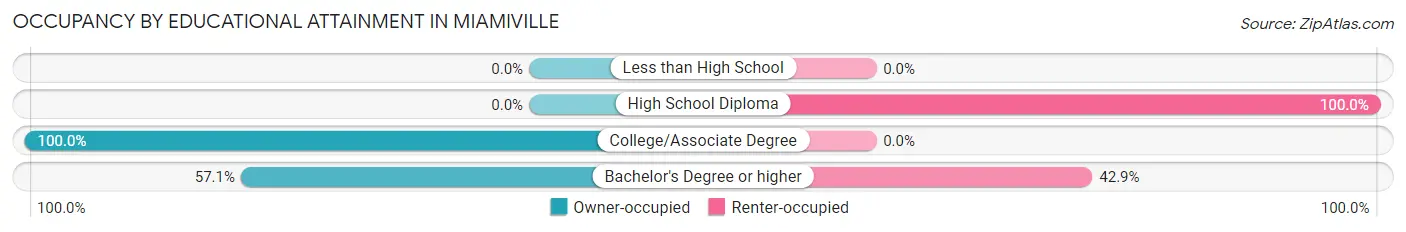
| Household Size | Owner-occupied | Renter-occupied |
| Less than High School | 0 (0.0%) | 0 (0.0%) |
| High School Diploma | 0 (0.0%) | 17 (100.0%) |
| College/Associate Degree | 18 (100.0%) | 0 (0.0%) |
| Bachelor's Degree or higher | 12 (57.1%) | 9 (42.9%) |
Occupancy by Age of Householder in Miamiville
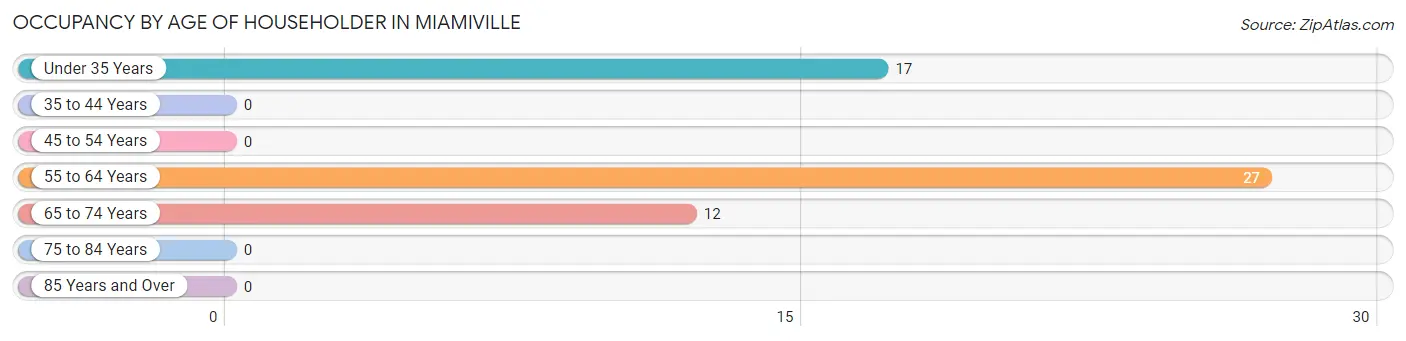
| Age Bracket | # Households | % Households |
| Under 35 Years | 17 | 30.4% |
| 35 to 44 Years | 0 | 0.0% |
| 45 to 54 Years | 0 | 0.0% |
| 55 to 64 Years | 27 | 48.2% |
| 65 to 74 Years | 12 | 21.4% |
| 75 to 84 Years | 0 | 0.0% |
| 85 Years and Over | 0 | 0.0% |
| Total | 56 | 100.0% |
Housing Finances in Miamiville
Median Income by Occupancy in Miamiville
| Occupancy Type | # Households | Median Income |
| Owner-Occupied | 30 (53.6%) | $0 |
| Renter-Occupied | 26 (46.4%) | $0 |
| Average | 56 (100.0%) | $0 |
Occupancy by Householder Income Bracket in Miamiville
| Income Bracket | Owner-occupied | Renter-occupied |
| Less than $5,000 | 0 (0.0%) | 0 (0.0%) |
| $5,000 to $9,999 | 0 (0.0%) | 0 (0.0%) |
| $10,000 to $14,999 | 0 (0.0%) | 0 (0.0%) |
| $15,000 to $19,999 | 0 (0.0%) | 0 (0.0%) |
| $20,000 to $24,999 | 0 (0.0%) | 9 (34.6%) |
| $25,000 to $34,999 | 0 (0.0%) | 17 (65.4%) |
| $35,000 to $49,999 | 0 (0.0%) | 0 (0.0%) |
| $50,000 to $74,999 | 0 (0.0%) | 0 (0.0%) |
| $75,000 to $99,999 | 18 (60.0%) | 0 (0.0%) |
| $100,000 to $149,999 | 0 (0.0%) | 0 (0.0%) |
| $150,000 or more | 12 (40.0%) | 0 (0.0%) |
| Total | 30 (100.0%) | 26 (100.0%) |
Monthly Housing Cost Tiers in Miamiville
| Monthly Cost | Owner-occupied | Renter-occupied |
| Less than $300 | 0 (0.0%) | 0 (0.0%) |
| $300 to $499 | 18 (60.0%) | 0 (0.0%) |
| $500 to $799 | 0 (0.0%) | 9 (34.6%) |
| $800 to $999 | 12 (40.0%) | 17 (65.4%) |
| $1,000 to $1,499 | 0 (0.0%) | 0 (0.0%) |
| $1,500 to $1,999 | 0 (0.0%) | 0 (0.0%) |
| $2,000 to $2,499 | 0 (0.0%) | 0 (0.0%) |
| $2,500 to $2,999 | 0 (0.0%) | 0 (0.0%) |
| $3,000 or more | 0 (0.0%) | 0 (0.0%) |
| Total | 30 (100.0%) | 26 (100.0%) |
Physical Housing Characteristics in Miamiville
Housing Structures in Miamiville
| Structure Type | # Housing Units | % Housing Units |
| Single Unit, Detached | 44 | 78.6% |
| Single Unit, Attached | 0 | 0.0% |
| 2 Unit Apartments | 12 | 21.4% |
| 3 or 4 Unit Apartments | 0 | 0.0% |
| 5 to 9 Unit Apartments | 0 | 0.0% |
| 10 or more Apartments | 0 | 0.0% |
| Mobile Home / Other | 0 | 0.0% |
| Total | 56 | 100.0% |
Housing Structures by Occupancy in Miamiville
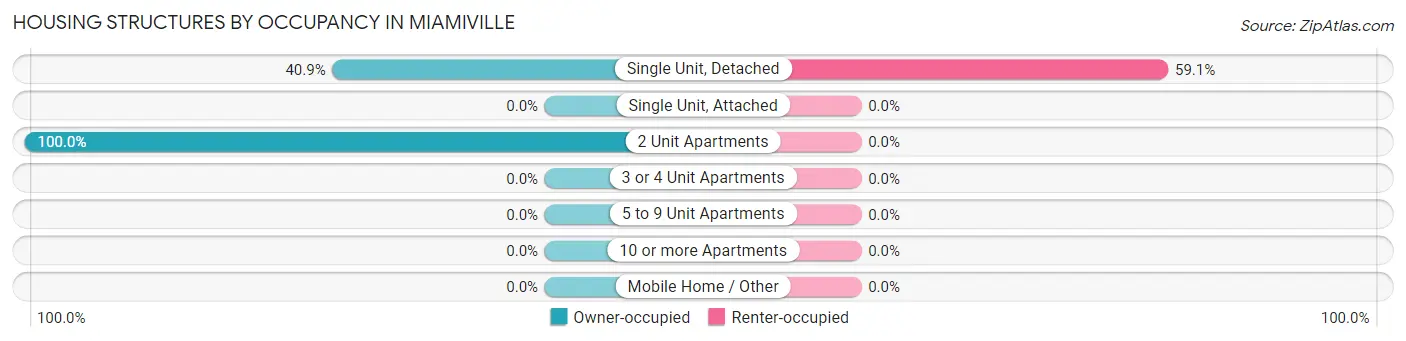
| Structure Type | Owner-occupied | Renter-occupied |
| Single Unit, Detached | 18 (40.9%) | 26 (59.1%) |
| Single Unit, Attached | 0 (0.0%) | 0 (0.0%) |
| 2 Unit Apartments | 12 (100.0%) | 0 (0.0%) |
| 3 or 4 Unit Apartments | 0 (0.0%) | 0 (0.0%) |
| 5 to 9 Unit Apartments | 0 (0.0%) | 0 (0.0%) |
| 10 or more Apartments | 0 (0.0%) | 0 (0.0%) |
| Mobile Home / Other | 0 (0.0%) | 0 (0.0%) |
| Total | 30 (53.6%) | 26 (46.4%) |
Housing Structures by Number of Rooms in Miamiville
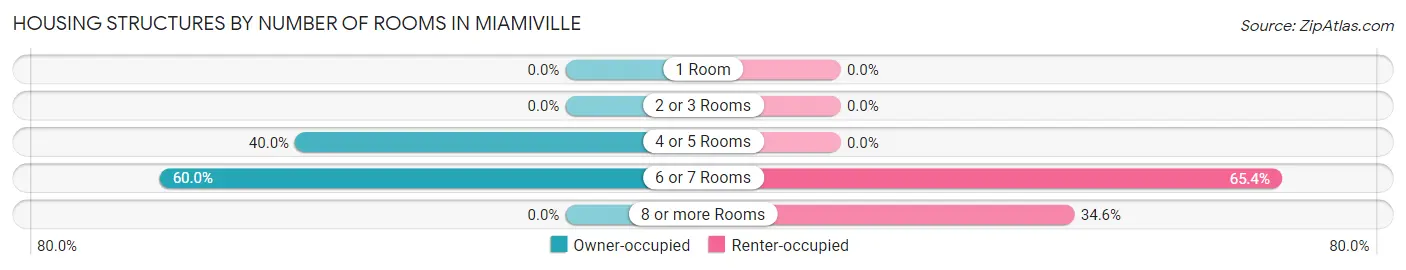
| Number of Rooms | Owner-occupied | Renter-occupied |
| 1 Room | 0 (0.0%) | 0 (0.0%) |
| 2 or 3 Rooms | 0 (0.0%) | 0 (0.0%) |
| 4 or 5 Rooms | 12 (40.0%) | 0 (0.0%) |
| 6 or 7 Rooms | 18 (60.0%) | 17 (65.4%) |
| 8 or more Rooms | 0 (0.0%) | 9 (34.6%) |
| Total | 30 (100.0%) | 26 (100.0%) |
Housing Structure by Heating Type in Miamiville
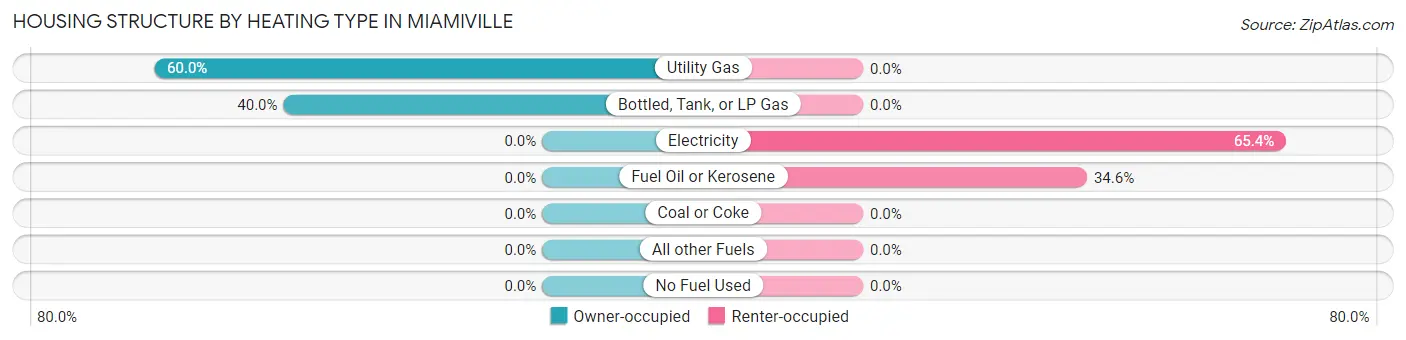
| Heating Type | Owner-occupied | Renter-occupied |
| Utility Gas | 18 (60.0%) | 0 (0.0%) |
| Bottled, Tank, or LP Gas | 12 (40.0%) | 0 (0.0%) |
| Electricity | 0 (0.0%) | 17 (65.4%) |
| Fuel Oil or Kerosene | 0 (0.0%) | 9 (34.6%) |
| Coal or Coke | 0 (0.0%) | 0 (0.0%) |
| All other Fuels | 0 (0.0%) | 0 (0.0%) |
| No Fuel Used | 0 (0.0%) | 0 (0.0%) |
| Total | 30 (100.0%) | 26 (100.0%) |
Household Vehicle Usage in Miamiville
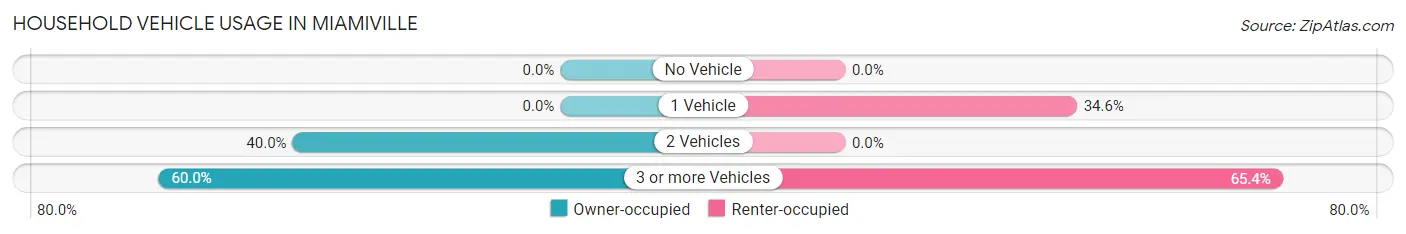
| Vehicles per Household | Owner-occupied | Renter-occupied |
| No Vehicle | 0 (0.0%) | 0 (0.0%) |
| 1 Vehicle | 0 (0.0%) | 9 (34.6%) |
| 2 Vehicles | 12 (40.0%) | 0 (0.0%) |
| 3 or more Vehicles | 18 (60.0%) | 17 (65.4%) |
| Total | 30 (100.0%) | 26 (100.0%) |
Real Estate & Mortgages in Miamiville
Real Estate and Mortgage Overview in Miamiville
| Characteristic | Without Mortgage | With Mortgage |
| Housing Units | 18 | 12 |
| Median Property Value | - | - |
| Median Household Income | - | - |
| Monthly Housing Costs | - | - |
| Real Estate Taxes | - | - |
Property Value by Mortgage Status in Miamiville
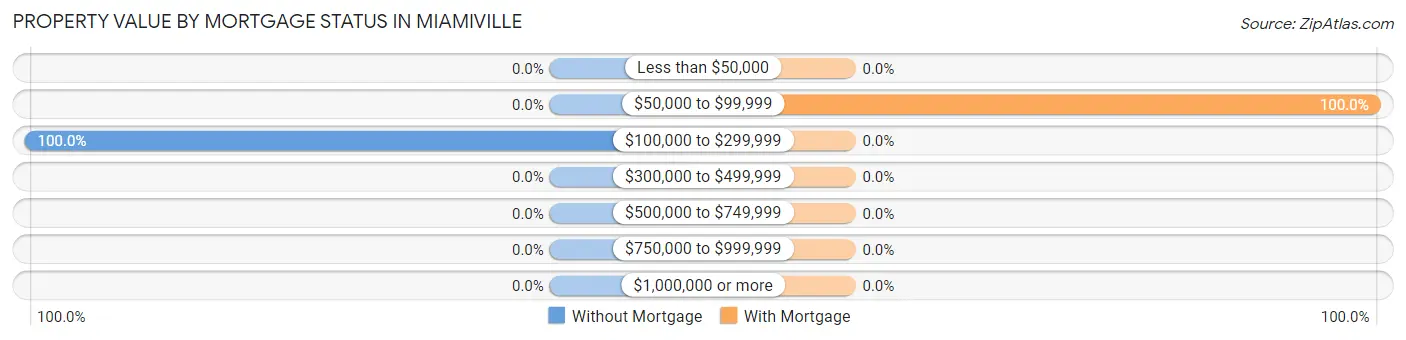
| Property Value | Without Mortgage | With Mortgage |
| Less than $50,000 | 0 (0.0%) | 0 (0.0%) |
| $50,000 to $99,999 | 0 (0.0%) | 12 (100.0%) |
| $100,000 to $299,999 | 18 (100.0%) | 0 (0.0%) |
| $300,000 to $499,999 | 0 (0.0%) | 0 (0.0%) |
| $500,000 to $749,999 | 0 (0.0%) | 0 (0.0%) |
| $750,000 to $999,999 | 0 (0.0%) | 0 (0.0%) |
| $1,000,000 or more | 0 (0.0%) | 0 (0.0%) |
| Total | 18 (100.0%) | 12 (100.0%) |
Household Income by Mortgage Status in Miamiville
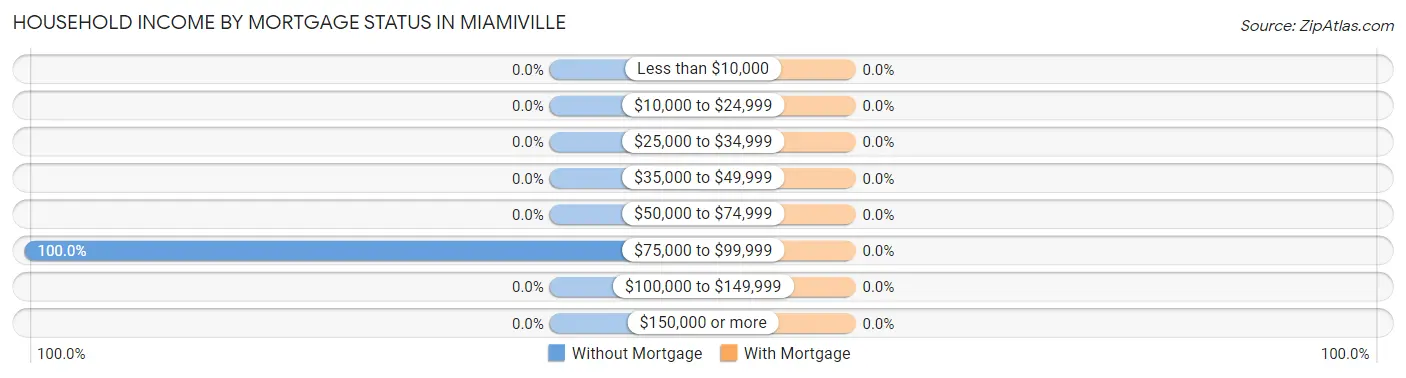
| Household Income | Without Mortgage | With Mortgage |
| Less than $10,000 | 0 (0.0%) | 0 (0.0%) |
| $10,000 to $24,999 | 0 (0.0%) | 0 (0.0%) |
| $25,000 to $34,999 | 0 (0.0%) | 0 (0.0%) |
| $35,000 to $49,999 | 0 (0.0%) | 0 (0.0%) |
| $50,000 to $74,999 | 0 (0.0%) | 0 (0.0%) |
| $75,000 to $99,999 | 18 (100.0%) | 0 (0.0%) |
| $100,000 to $149,999 | 0 (0.0%) | 0 (0.0%) |
| $150,000 or more | 0 (0.0%) | 0 (0.0%) |
| Total | 18 (100.0%) | 12 (100.0%) |
Property Value to Household Income Ratio in Miamiville
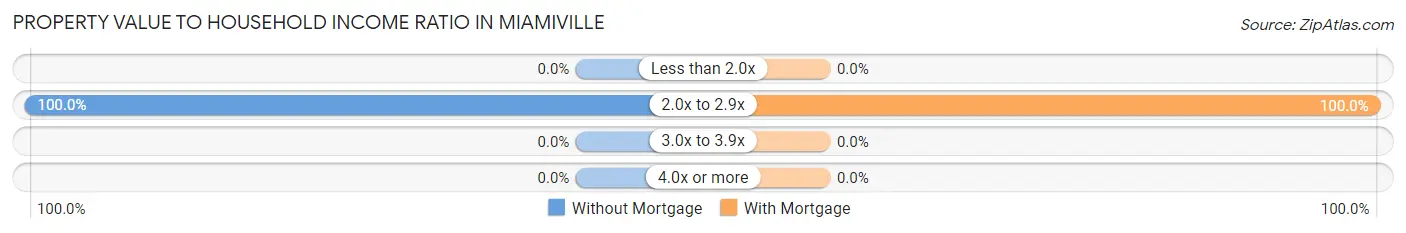
| Value-to-Income Ratio | Without Mortgage | With Mortgage |
| Less than 2.0x | 0 (0.0%) | 0 (0.0%) |
| 2.0x to 2.9x | 18 (100.0%) | 12 (100.0%) |
| 3.0x to 3.9x | 0 (0.0%) | 0 (0.0%) |
| 4.0x or more | 0 (0.0%) | 0 (0.0%) |
| Total | 18 (100.0%) | 12 (100.0%) |
Real Estate Taxes by Mortgage Status in Miamiville
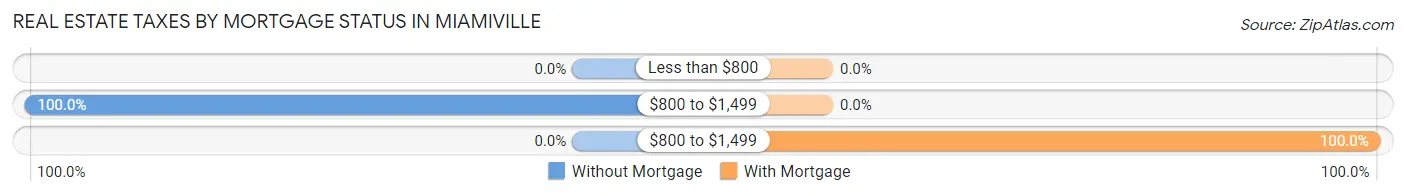
| Property Taxes | Without Mortgage | With Mortgage |
| Less than $800 | 0 (0.0%) | 0 (0.0%) |
| $800 to $1,499 | 18 (100.0%) | 0 (0.0%) |
| $800 to $1,499 | 0 (0.0%) | 12 (100.0%) |
| Total | 18 (100.0%) | 12 (100.0%) |
Health & Disability in Miamiville
Health Insurance Coverage by Age in Miamiville
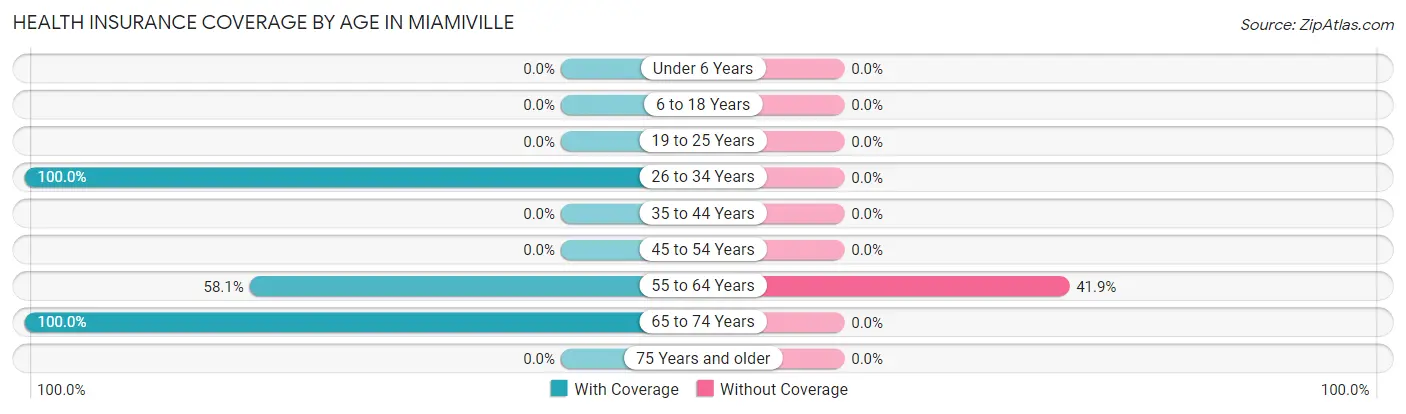
| Age Bracket | With Coverage | Without Coverage |
| Under 6 Years | 0 (0.0%) | 0 (0.0%) |
| 6 to 18 Years | 0 (0.0%) | 0 (0.0%) |
| 19 to 25 Years | 0 (0.0%) | 0 (0.0%) |
| 26 to 34 Years | 43 (100.0%) | 0 (0.0%) |
| 35 to 44 Years | 0 (0.0%) | 0 (0.0%) |
| 45 to 54 Years | 0 (0.0%) | 0 (0.0%) |
| 55 to 64 Years | 36 (58.1%) | 26 (41.9%) |
| 65 to 74 Years | 50 (100.0%) | 0 (0.0%) |
| 75 Years and older | 0 (0.0%) | 0 (0.0%) |
| Total | 129 (83.2%) | 26 (16.8%) |
Health Insurance Coverage by Citizenship Status in Miamiville
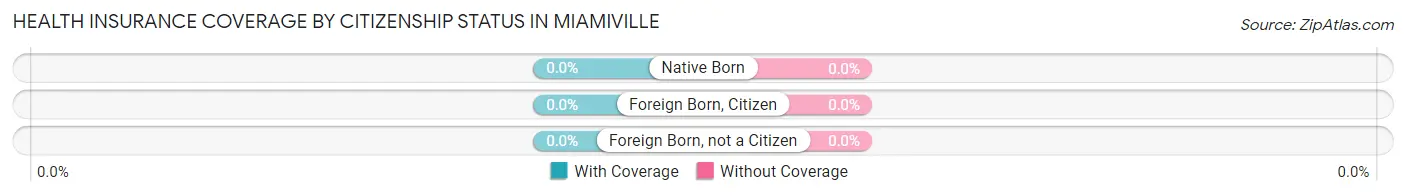
| Citizenship Status | With Coverage | Without Coverage |
| Native Born | 0 (0.0%) | 0 (0.0%) |
| Foreign Born, Citizen | 0 (0.0%) | 0 (0.0%) |
| Foreign Born, not a Citizen | 0 (0.0%) | 0 (0.0%) |
Health Insurance Coverage by Household Income in Miamiville
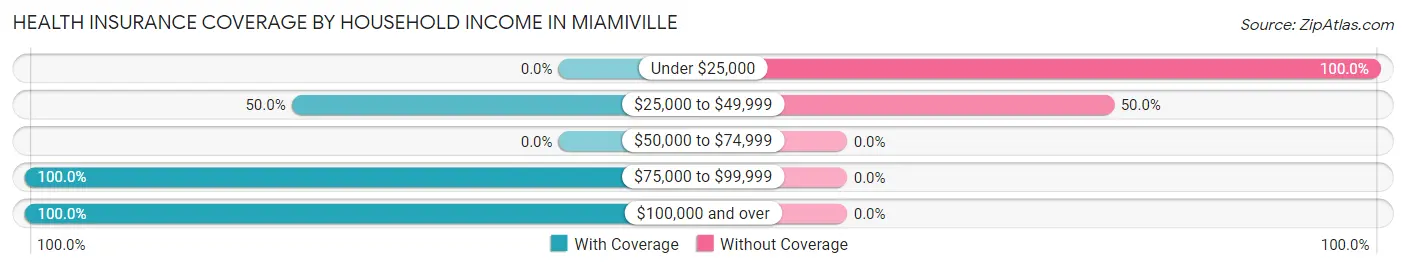
| Household Income | With Coverage | Without Coverage |
| Under $25,000 | 0 (0.0%) | 9 (100.0%) |
| $25,000 to $49,999 | 17 (50.0%) | 17 (50.0%) |
| $50,000 to $74,999 | 0 (0.0%) | 0 (0.0%) |
| $75,000 to $99,999 | 82 (100.0%) | 0 (0.0%) |
| $100,000 and over | 30 (100.0%) | 0 (0.0%) |
Public vs Private Health Insurance Coverage by Age in Miamiville
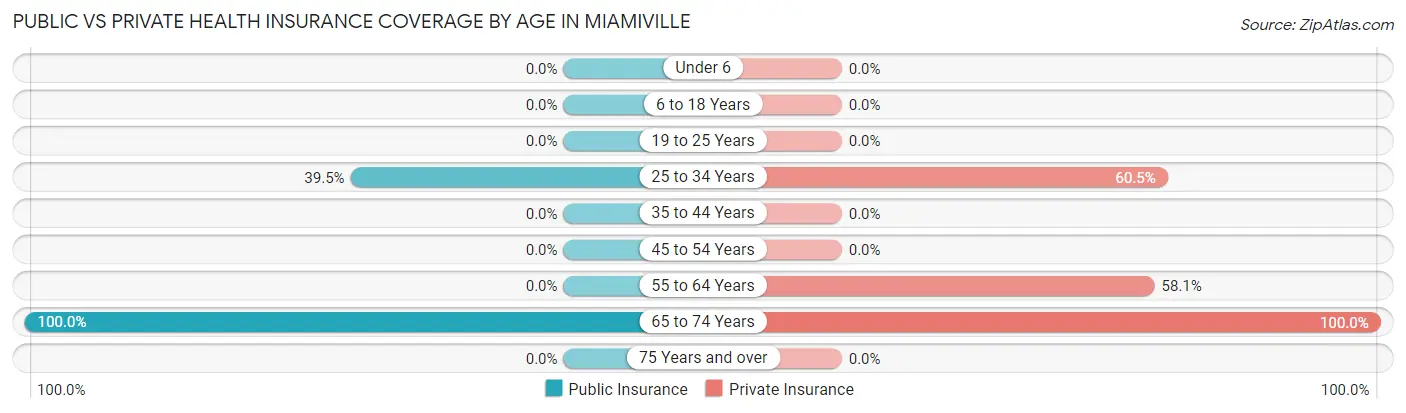
| Age Bracket | Public Insurance | Private Insurance |
| Under 6 | 0 (0.0%) | 0 (0.0%) |
| 6 to 18 Years | 0 (0.0%) | 0 (0.0%) |
| 19 to 25 Years | 0 (0.0%) | 0 (0.0%) |
| 25 to 34 Years | 17 (39.5%) | 26 (60.5%) |
| 35 to 44 Years | 0 (0.0%) | 0 (0.0%) |
| 45 to 54 Years | 0 (0.0%) | 0 (0.0%) |
| 55 to 64 Years | 0 (0.0%) | 36 (58.1%) |
| 65 to 74 Years | 50 (100.0%) | 50 (100.0%) |
| 75 Years and over | 0 (0.0%) | 0 (0.0%) |
| Total | 67 (43.2%) | 112 (72.3%) |
Disability Status by Sex by Age in Miamiville
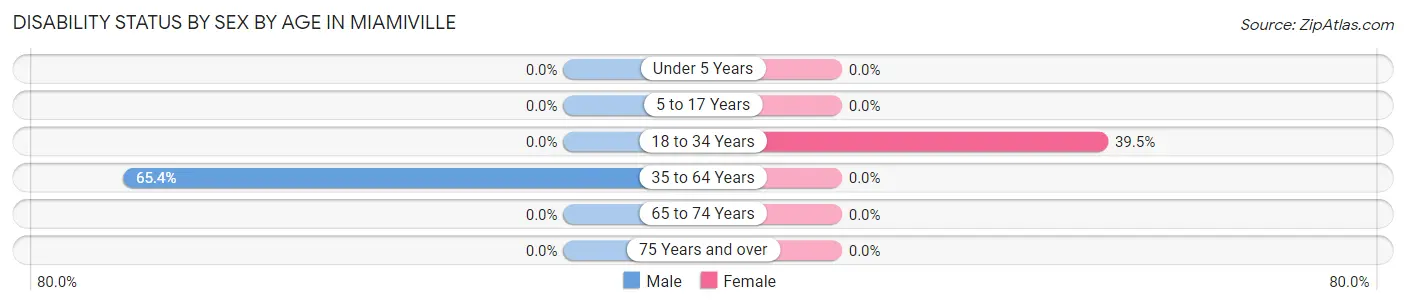
| Age Bracket | Male | Female |
| Under 5 Years | 0 (0.0%) | 0 (0.0%) |
| 5 to 17 Years | 0 (0.0%) | 0 (0.0%) |
| 18 to 34 Years | 0 (0.0%) | 17 (39.5%) |
| 35 to 64 Years | 17 (65.4%) | 0 (0.0%) |
| 65 to 74 Years | 0 (0.0%) | 0 (0.0%) |
| 75 Years and over | 0 (0.0%) | 0 (0.0%) |
Disability Class by Sex by Age in Miamiville
Disability Class: Hearing Difficulty
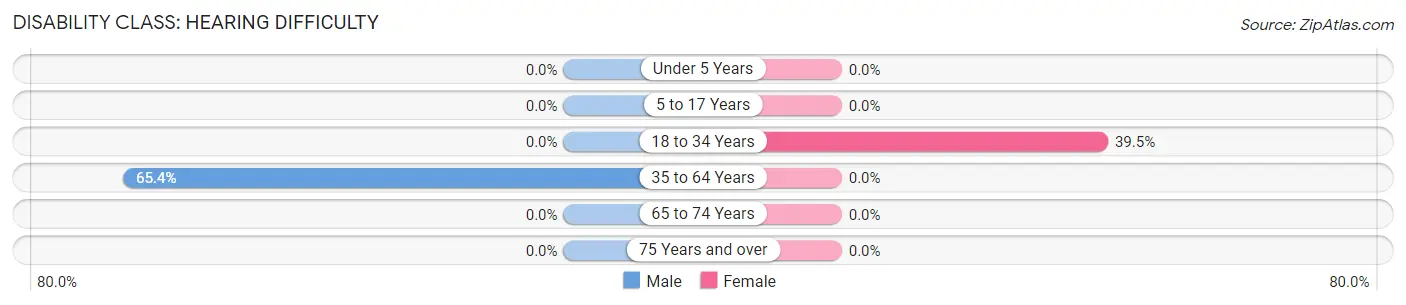
| Age Bracket | Male | Female |
| Under 5 Years | 0 (0.0%) | 0 (0.0%) |
| 5 to 17 Years | 0 (0.0%) | 0 (0.0%) |
| 18 to 34 Years | 0 (0.0%) | 17 (39.5%) |
| 35 to 64 Years | 17 (65.4%) | 0 (0.0%) |
| 65 to 74 Years | 0 (0.0%) | 0 (0.0%) |
| 75 Years and over | 0 (0.0%) | 0 (0.0%) |
Disability Class: Vision Difficulty
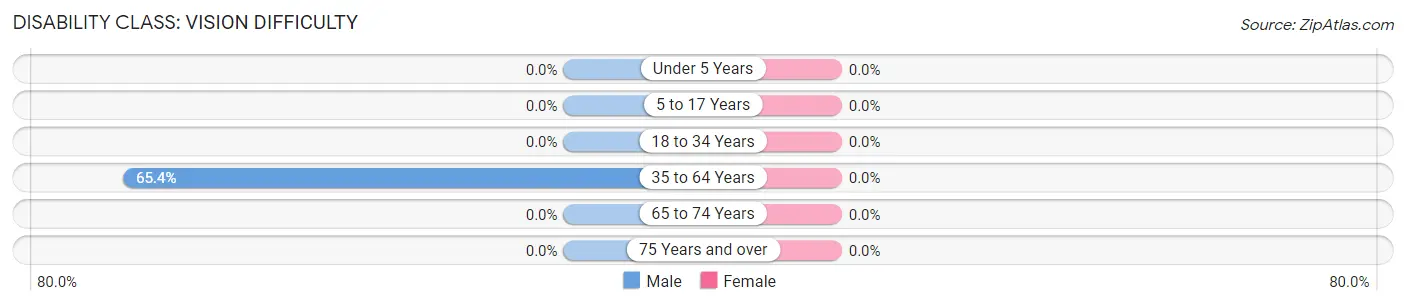
| Age Bracket | Male | Female |
| Under 5 Years | 0 (0.0%) | 0 (0.0%) |
| 5 to 17 Years | 0 (0.0%) | 0 (0.0%) |
| 18 to 34 Years | 0 (0.0%) | 0 (0.0%) |
| 35 to 64 Years | 17 (65.4%) | 0 (0.0%) |
| 65 to 74 Years | 0 (0.0%) | 0 (0.0%) |
| 75 Years and over | 0 (0.0%) | 0 (0.0%) |
Disability Class: Cognitive Difficulty
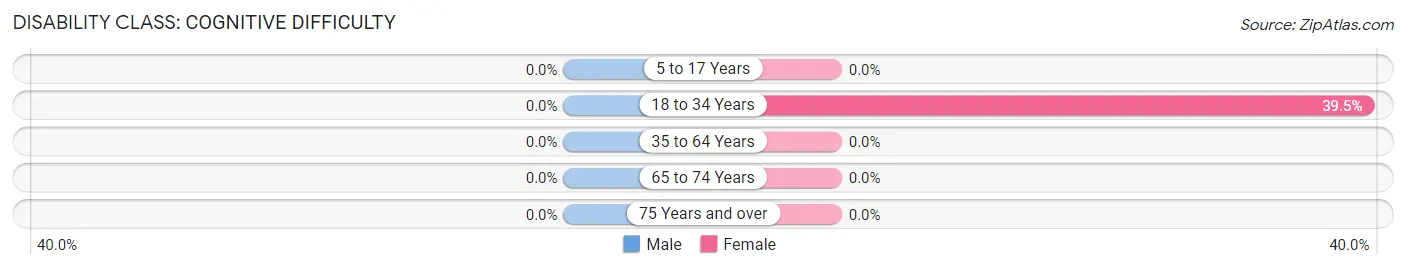
| Age Bracket | Male | Female |
| 5 to 17 Years | 0 (0.0%) | 0 (0.0%) |
| 18 to 34 Years | 0 (0.0%) | 17 (39.5%) |
| 35 to 64 Years | 0 (0.0%) | 0 (0.0%) |
| 65 to 74 Years | 0 (0.0%) | 0 (0.0%) |
| 75 Years and over | 0 (0.0%) | 0 (0.0%) |
Disability Class: Ambulatory Difficulty
| Age Bracket | Male | Female |
| 5 to 17 Years | 0 (0.0%) | 0 (0.0%) |
| 18 to 34 Years | 0 (0.0%) | 0 (0.0%) |
| 35 to 64 Years | 0 (0.0%) | 0 (0.0%) |
| 65 to 74 Years | 0 (0.0%) | 0 (0.0%) |
| 75 Years and over | 0 (0.0%) | 0 (0.0%) |
Disability Class: Self-Care Difficulty
| Age Bracket | Male | Female |
| 5 to 17 Years | 0 (0.0%) | 0 (0.0%) |
| 18 to 34 Years | 0 (0.0%) | 0 (0.0%) |
| 35 to 64 Years | 0 (0.0%) | 0 (0.0%) |
| 65 to 74 Years | 0 (0.0%) | 0 (0.0%) |
| 75 Years and over | 0 (0.0%) | 0 (0.0%) |
Technology Access in Miamiville
Computing Device Access in Miamiville
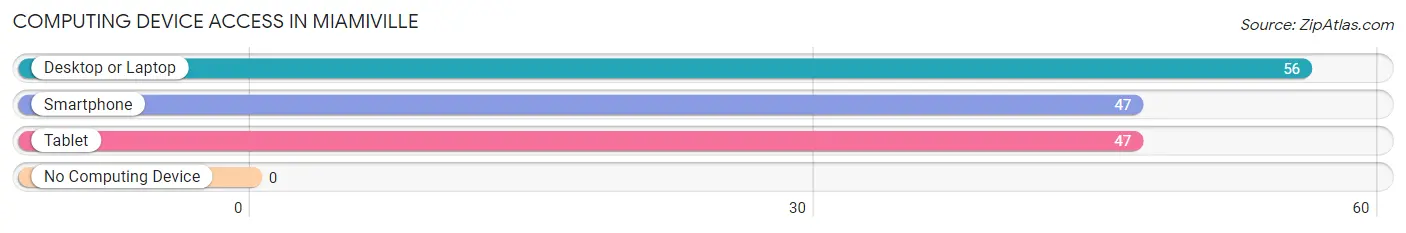
| Device Type | # Households | % Households |
| Desktop or Laptop | 56 | 100.0% |
| Smartphone | 47 | 83.9% |
| Tablet | 47 | 83.9% |
| No Computing Device | 0 | 0.0% |
| Total | 56 | 100.0% |
Internet Access in Miamiville
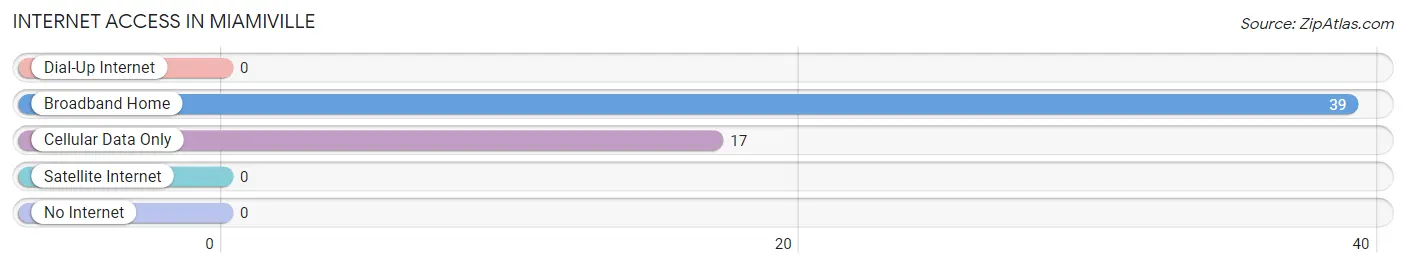
| Internet Type | # Households | % Households |
| Dial-Up Internet | 0 | 0.0% |
| Broadband Home | 39 | 69.6% |
| Cellular Data Only | 17 | 30.4% |
| Satellite Internet | 0 | 0.0% |
| No Internet | 0 | 0.0% |
| Total | 56 | 100.0% |
Miamiville Summary
Miamiville, Ohio is a small village located in Clermont County, Ohio. It is situated on the east side of the Little Miami River, approximately 20 miles east of Cincinnati. The village was founded in 1817 and is home to approximately 1,500 people.
Geography
Miamiville is located in the southwestern corner of Clermont County, Ohio. It is situated on the east side of the Little Miami River, approximately 20 miles east of Cincinnati. The village is bordered by the townships of Miami, Wayne, and Union. The terrain is mostly flat, with some rolling hills in the area. The village is located in the Little Miami River Valley, which is part of the larger Ohio River Valley. The climate is humid continental, with hot summers and cold winters.
Demographics
As of the 2010 census, Miamiville had a population of 1,521. The racial makeup of the village was 97.2% White, 0.7% African American, 0.3% Native American, 0.3% Asian, 0.2% from other races, and 1.5% from two or more races. Hispanic or Latino of any race were 0.7% of the population.
Economy
Miamiville’s economy is largely based on agriculture and small businesses. The village is home to several small businesses, including a grocery store, a hardware store, a pharmacy, and a few restaurants. The village also has a few manufacturing companies, including a plastics manufacturer and a metal fabrication company. The village is also home to a few farms, which produce corn, soybeans, and hay.
History
Miamiville was founded in 1817 by a group of settlers from Pennsylvania. The village was named after the Little Miami River, which runs through the area. The village was originally a farming community, and the settlers built a gristmill and a sawmill to process the grain and lumber. The village grew slowly over the years, and by the late 19th century, it had become a small but thriving community.
In the early 20th century, the village began to expand, and several new businesses were established. The village also became a popular tourist destination, and several hotels and resorts were built in the area. The village continued to grow throughout the 20th century, and by the 2000s, it had become a small but vibrant community.
Today, Miamiville is a small but vibrant village. The village is home to several small businesses, and it is a popular tourist destination. The village is also home to several farms, which produce corn, soybeans, and hay. The village is also home to a few manufacturing companies, which produce plastics and metal products. The village is also home to a few schools, including a public elementary school and a private high school.
Common Questions
What is Per Capita Income in Miamiville?
Per Capita income in Miamiville is $41,179.
What is Inequality or Gini Index in Miamiville?
Inequality or Gini Index in Miamiville is 0.45.
What is the Total Population of Miamiville?
Total Population of Miamiville is 155.
What is the Total Male Population of Miamiville?
Total Male Population of Miamiville is 76.
What is the Total Female Population of Miamiville?
Total Female Population of Miamiville is 79.
What is the Ratio of Males per 100 Females in Miamiville?
There are 96.20 Males per 100 Females in Miamiville.
What is the Ratio of Females per 100 Males in Miamiville?
There are 103.95 Females per 100 Males in Miamiville.
What is the Median Population Age in Miamiville?
Median Population Age in Miamiville is 61.0 Years.
What is the Average Family Size in Miamiville
Average Family Size in Miamiville is 3.7 People.
What is the Average Household Size in Miamiville
Average Household Size in Miamiville is 2.8 People.
How Large is the Labor Force in Miamiville?
There are 143 People in the Labor Forcein in Miamiville.
What is the Percentage of People in the Labor Force in Miamiville?
92.3% of People are in the Labor Force in Miamiville.
What is the Unemployment Rate in Miamiville?
Unemployment Rate in Miamiville is 11.9%.