Dublin, OH Map & Demographics
Dublin Map
Dublin Overview
$71,551
PER CAPITA INCOME
$175,250
AVG FAMILY INCOME
$158,363
AVG HOUSEHOLD INCOME
45.9%
WAGE / INCOME GAP [ % ]
54.1¢/ $1
WAGE / INCOME GAP [ $ ]
0.41
INEQUALITY / GINI INDEX
48,893
TOTAL POPULATION
25,182
MALE POPULATION
23,711
FEMALE POPULATION
106.20
MALES / 100 FEMALES
94.16
FEMALES / 100 MALES
41.0
MEDIAN AGE
3.2
AVG FAMILY SIZE
2.8
AVG HOUSEHOLD SIZE
25,716
LABOR FORCE [ PEOPLE ]
69.4%
PERCENT IN LABOR FORCE
2.9%
UNEMPLOYMENT RATE
Income in Dublin
Income Overview in Dublin
Per Capita Income in Dublin is $71,551, while median incomes of families and households are $175,250 and $158,363 respectively.
| Characteristic | Number | Measure |
| Per Capita Income | 48,893 | $71,551 |
| Median Family Income | 13,995 | $175,250 |
| Mean Family Income | 13,995 | $216,219 |
| Median Household Income | 17,697 | $158,363 |
| Mean Household Income | 17,697 | $195,453 |
| Income Deficit | 13,995 | $0 |
| Wage / Income Gap (%) | 48,893 | 45.92% |
| Wage / Income Gap ($) | 48,893 | 54.08¢ per $1 |
| Gini / Inequality Index | 48,893 | 0.41 |
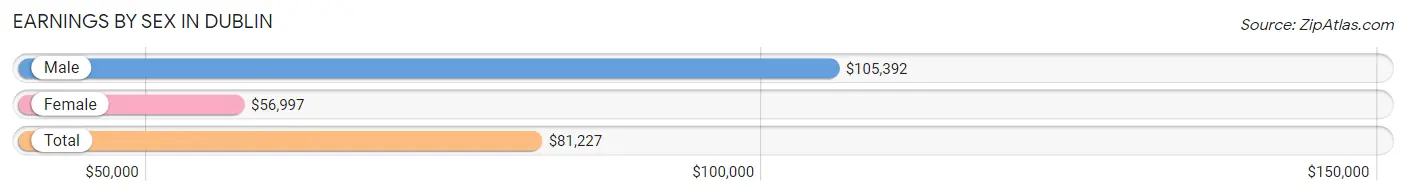
Earnings by Sex in Dublin
Average Earnings in Dublin are $81,227, $105,392 for men and $56,997 for women, a difference of 45.9%.
| Sex | Number | Average Earnings |
| Male | 15,457 (57.1%) | $105,392 |
| Female | 11,627 (42.9%) | $56,997 |
| Total | 27,084 (100.0%) | $81,227 |
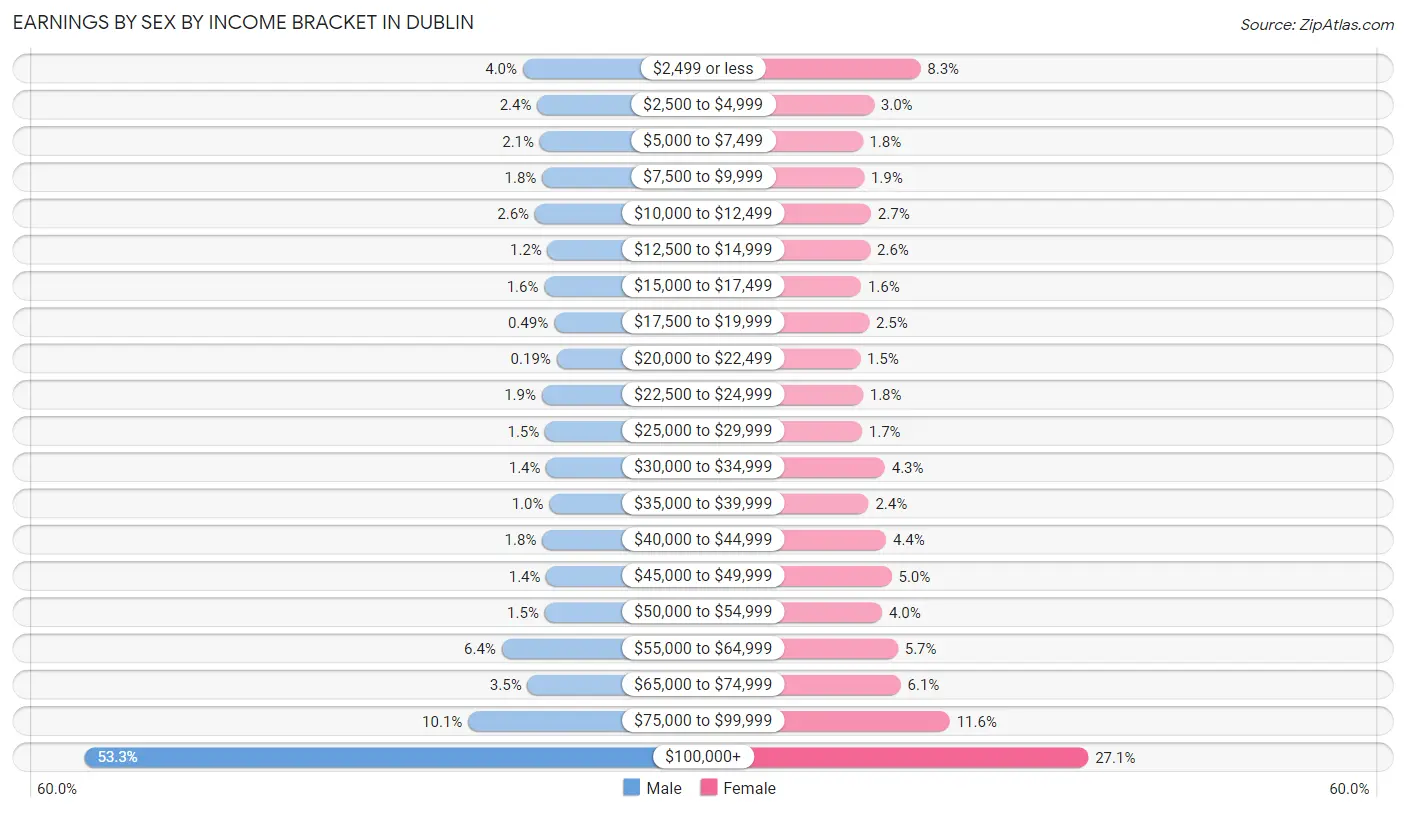
Earnings by Sex by Income Bracket in Dublin
The most common earnings brackets in Dublin are $100,000+ for men (8,234 | 53.3%) and $100,000+ for women (3,156 | 27.1%).
| Income | Male | Female |
| $2,499 or less | 617 (4.0%) | 961 (8.3%) |
| $2,500 to $4,999 | 367 (2.4%) | 353 (3.0%) |
| $5,000 to $7,499 | 322 (2.1%) | 205 (1.8%) |
| $7,500 to $9,999 | 281 (1.8%) | 224 (1.9%) |
| $10,000 to $12,499 | 406 (2.6%) | 315 (2.7%) |
| $12,500 to $14,999 | 186 (1.2%) | 305 (2.6%) |
| $15,000 to $17,499 | 244 (1.6%) | 185 (1.6%) |
| $17,500 to $19,999 | 76 (0.5%) | 291 (2.5%) |
| $20,000 to $22,499 | 29 (0.2%) | 173 (1.5%) |
| $22,500 to $24,999 | 288 (1.9%) | 209 (1.8%) |
| $25,000 to $29,999 | 230 (1.5%) | 197 (1.7%) |
| $30,000 to $34,999 | 208 (1.3%) | 496 (4.3%) |
| $35,000 to $39,999 | 157 (1.0%) | 284 (2.4%) |
| $40,000 to $44,999 | 279 (1.8%) | 513 (4.4%) |
| $45,000 to $49,999 | 209 (1.3%) | 585 (5.0%) |
| $50,000 to $54,999 | 237 (1.5%) | 460 (4.0%) |
| $55,000 to $64,999 | 984 (6.4%) | 666 (5.7%) |
| $65,000 to $74,999 | 536 (3.5%) | 704 (6.0%) |
| $75,000 to $99,999 | 1,567 (10.1%) | 1,345 (11.6%) |
| $100,000+ | 8,234 (53.3%) | 3,156 (27.1%) |
| Total | 15,457 (100.0%) | 11,627 (100.0%) |
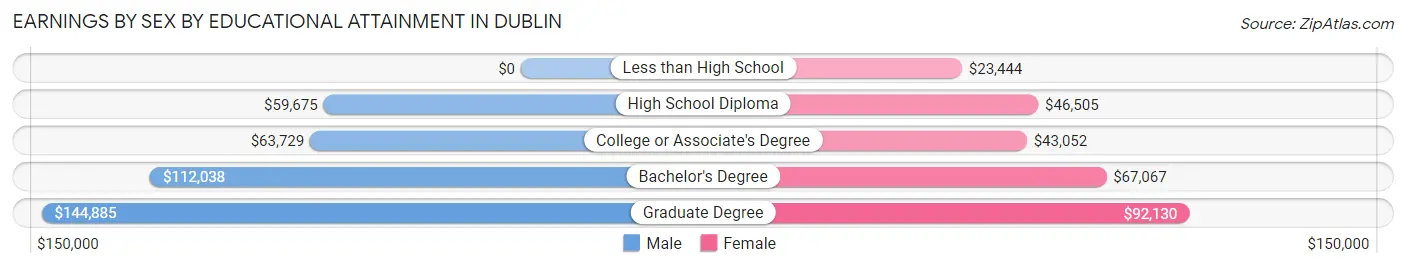
Earnings by Sex by Educational Attainment in Dublin
Average earnings in Dublin are $112,967 for men and $64,150 for women, a difference of 43.2%. Men with an educational attainment of graduate degree enjoy the highest average annual earnings of $144,885, while those with high school diploma education earn the least with $59,675. Women with an educational attainment of graduate degree earn the most with the average annual earnings of $92,130, while those with less than high school education have the smallest earnings of $23,444.
| Educational Attainment | Male Income | Female Income |
| Less than High School | - | - |
| High School Diploma | $59,675 | $46,505 |
| College or Associate's Degree | $63,729 | $43,052 |
| Bachelor's Degree | $112,038 | $67,067 |
| Graduate Degree | $144,885 | $92,130 |
| Total | $112,967 | $64,150 |
Family Income in Dublin
Family Income Brackets in Dublin
According to the Dublin family income data, there are 6,004 families falling into the $200,000+ income range, which is the most common income bracket and makes up 42.9% of all families.
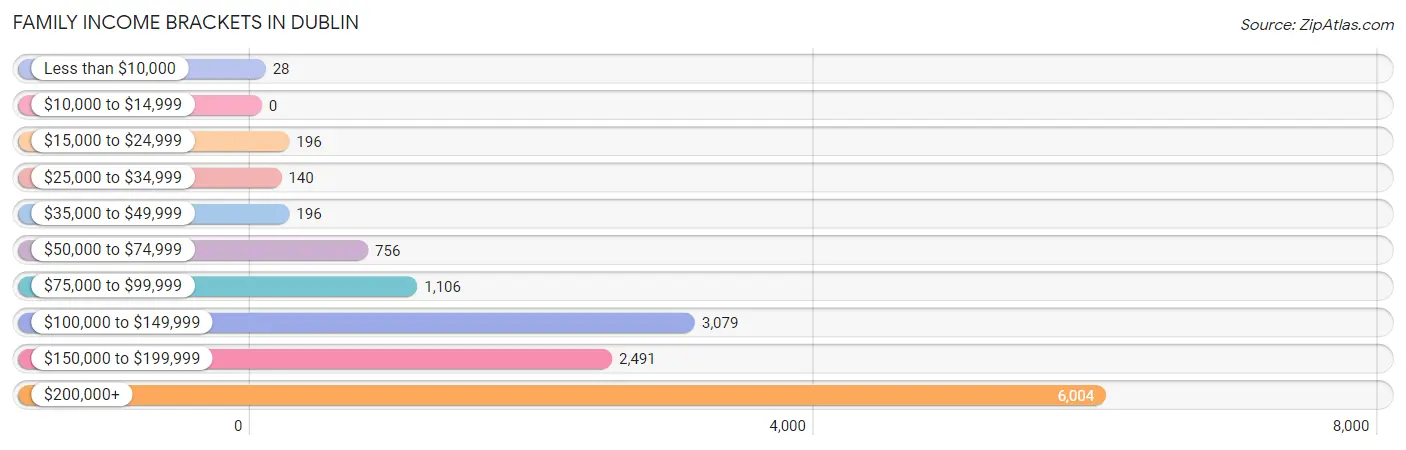
| Income Bracket | # Families | % Families |
| Less than $10,000 | 28 | 0.2% |
| $10,000 to $14,999 | 0 | 0.0% |
| $15,000 to $24,999 | 196 | 1.4% |
| $25,000 to $34,999 | 140 | 1.0% |
| $35,000 to $49,999 | 196 | 1.4% |
| $50,000 to $74,999 | 756 | 5.4% |
| $75,000 to $99,999 | 1,106 | 7.9% |
| $100,000 to $149,999 | 3,079 | 22.0% |
| $150,000 to $199,999 | 2,491 | 17.8% |
| $200,000+ | 6,004 | 42.9% |
Family Income by Famaliy Size in Dublin
6-person families (322 | 2.3%) account for the highest median family income in Dublin with $237,500 per family, while 2-person families (5,253 | 37.5%) have the highest median income of $72,520 per family member.
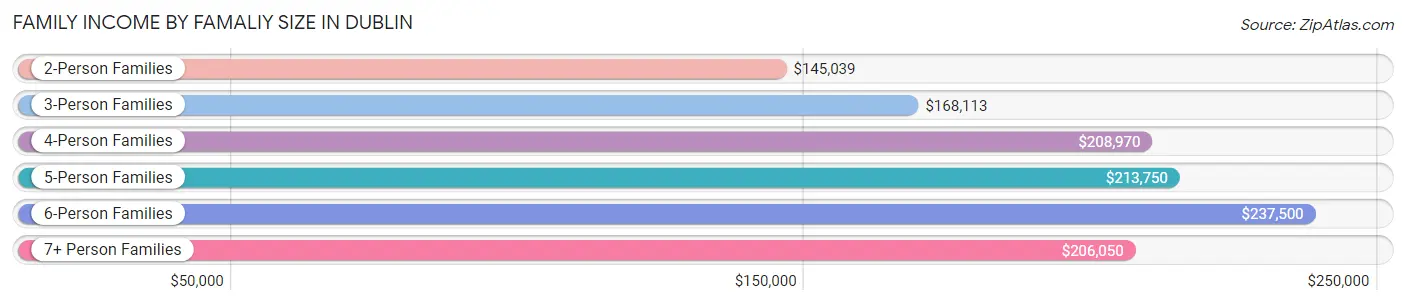
| Income Bracket | # Families | Median Income |
| 2-Person Families | 5,253 (37.5%) | $145,039 |
| 3-Person Families | 3,503 (25.0%) | $168,113 |
| 4-Person Families | 3,525 (25.2%) | $208,970 |
| 5-Person Families | 1,343 (9.6%) | $213,750 |
| 6-Person Families | 322 (2.3%) | $237,500 |
| 7+ Person Families | 49 (0.4%) | $206,050 |
| Total | 13,995 (100.0%) | $175,250 |
Family Income by Number of Earners in Dublin
The median family income in Dublin is $175,250, with families comprising 2 earners (6,722) having the highest median family income of $211,667, while families with no earners (1,140) have the lowest median family income of $97,813, accounting for 48.0% and 8.2% of families, respectively.
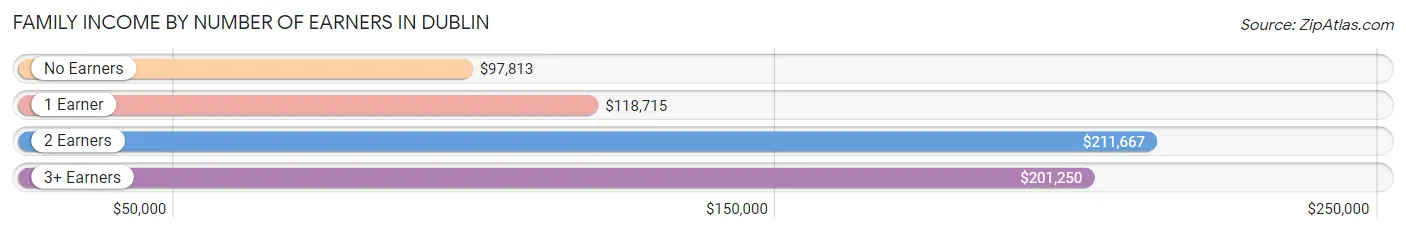
| Number of Earners | # Families | Median Income |
| No Earners | 1,140 (8.2%) | $97,813 |
| 1 Earner | 4,076 (29.1%) | $118,715 |
| 2 Earners | 6,722 (48.0%) | $211,667 |
| 3+ Earners | 2,057 (14.7%) | $201,250 |
| Total | 13,995 (100.0%) | $175,250 |
Household Income in Dublin
Household Income Brackets in Dublin
With 6,406 households falling in the category, the $200,000+ income range is the most frequent in Dublin, accounting for 36.2% of all households. In contrast, only 212 households (1.2%) fall into the less than $10,000 income bracket, making it the least populous group.
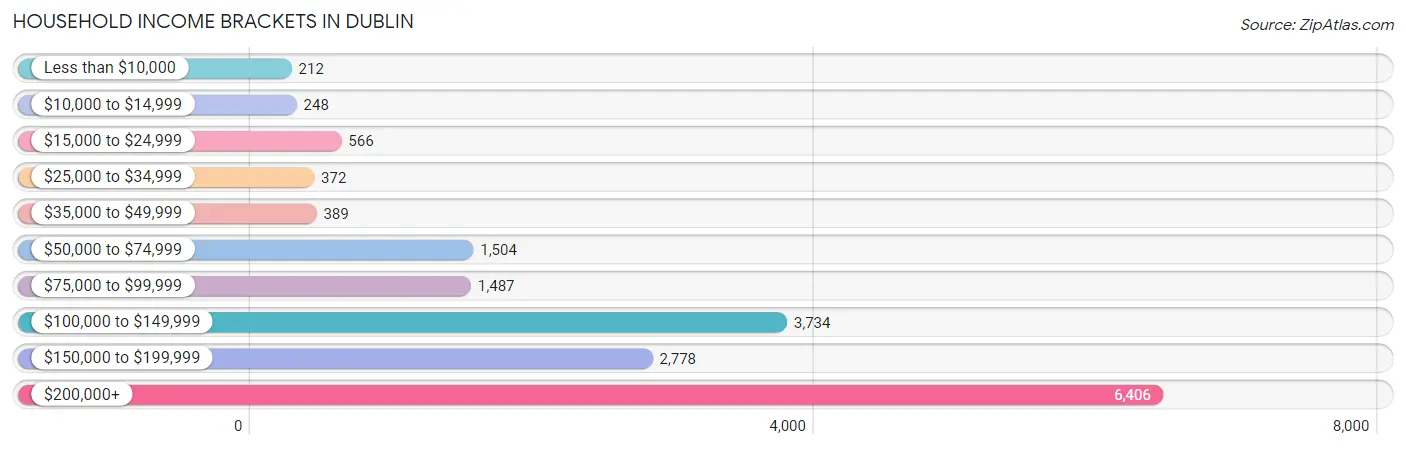
| Income Bracket | # Households | % Households |
| Less than $10,000 | 212 | 1.2% |
| $10,000 to $14,999 | 248 | 1.4% |
| $15,000 to $24,999 | 566 | 3.2% |
| $25,000 to $34,999 | 372 | 2.1% |
| $35,000 to $49,999 | 389 | 2.2% |
| $50,000 to $74,999 | 1,504 | 8.5% |
| $75,000 to $99,999 | 1,487 | 8.4% |
| $100,000 to $149,999 | 3,734 | 21.1% |
| $150,000 to $199,999 | 2,778 | 15.7% |
| $200,000+ | 6,406 | 36.2% |
Household Income by Householder Age in Dublin
The median household income in Dublin is $158,363, with the highest median household income of $180,917 found in the 45 to 64 years age bracket for the primary householder. A total of 8,067 households (45.6%) fall into this category. Meanwhile, the 15 to 24 years age bracket for the primary householder has the lowest median household income of $0, with 107 households (0.6%) in this group.
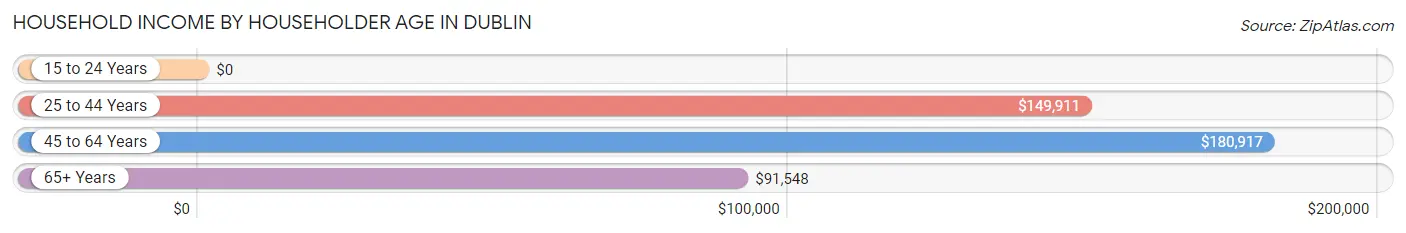
| Income Bracket | # Households | Median Income |
| 15 to 24 Years | 107 (0.6%) | $0 |
| 25 to 44 Years | 5,799 (32.8%) | $149,911 |
| 45 to 64 Years | 8,067 (45.6%) | $180,917 |
| 65+ Years | 3,724 (21.0%) | $91,548 |
| Total | 17,697 (100.0%) | $158,363 |
Poverty in Dublin
Income Below Poverty by Sex and Age in Dublin
With 1.8% poverty level for males and 2.5% for females among the residents of Dublin, 12 to 14 year old males and 65 to 74 year old females are the most vulnerable to poverty, with 55 males (4.4%) and 216 females (10.1%) in their respective age groups living below the poverty level.
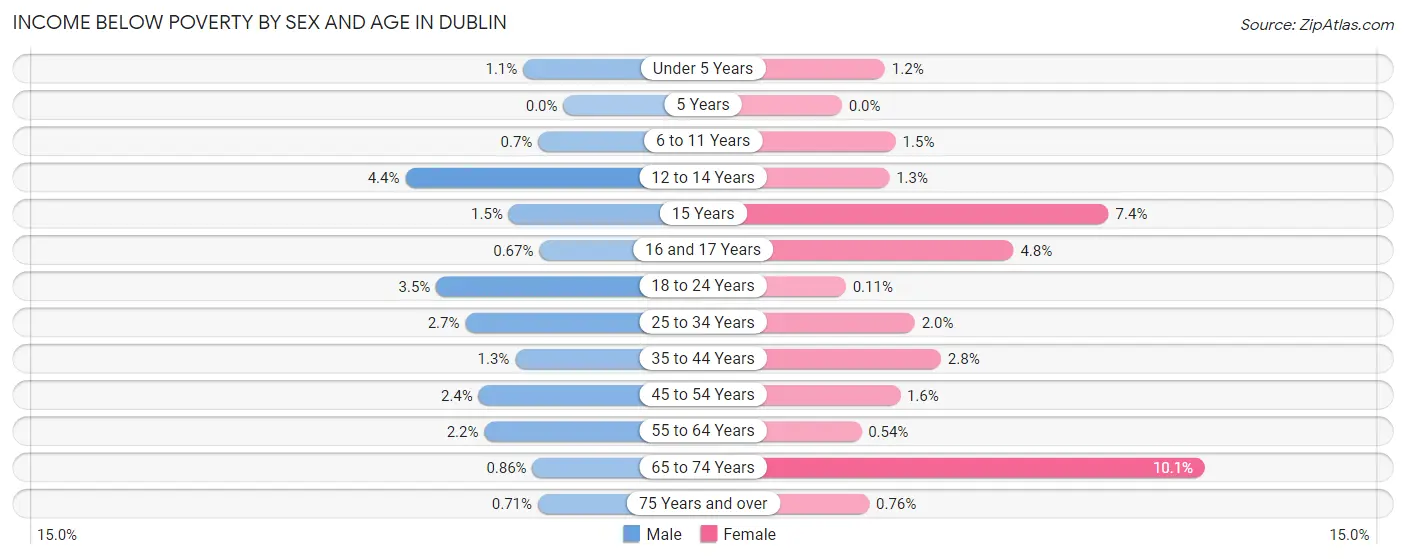
| Age Bracket | Male | Female |
| Under 5 Years | 13 (1.1%) | 15 (1.2%) |
| 5 Years | 0 (0.0%) | 0 (0.0%) |
| 6 to 11 Years | 20 (0.7%) | 30 (1.5%) |
| 12 to 14 Years | 55 (4.4%) | 22 (1.3%) |
| 15 Years | 7 (1.5%) | 28 (7.4%) |
| 16 and 17 Years | 7 (0.7%) | 33 (4.8%) |
| 18 to 24 Years | 53 (3.5%) | 1 (0.1%) |
| 25 to 34 Years | 53 (2.7%) | 37 (2.0%) |
| 35 to 44 Years | 50 (1.3%) | 115 (2.8%) |
| 45 to 54 Years | 104 (2.4%) | 61 (1.6%) |
| 55 to 64 Years | 71 (2.2%) | 17 (0.5%) |
| 65 to 74 Years | 18 (0.9%) | 216 (10.1%) |
| 75 Years and over | 8 (0.7%) | 8 (0.8%) |
| Total | 459 (1.8%) | 583 (2.5%) |
Income Above Poverty by Sex and Age in Dublin
According to the poverty statistics in Dublin, males aged 5 years and females aged 5 years are the age groups that are most secure financially, with 100.0% of males and 100.0% of females in these age groups living above the poverty line.
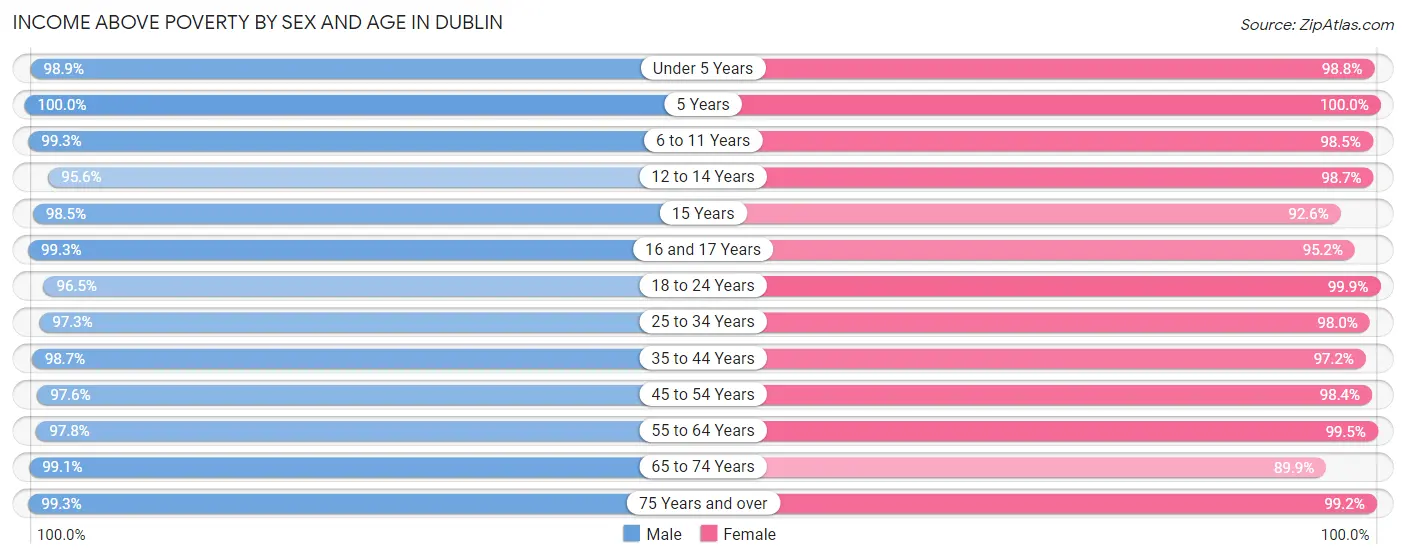
| Age Bracket | Male | Female |
| Under 5 Years | 1,147 (98.9%) | 1,232 (98.8%) |
| 5 Years | 333 (100.0%) | 383 (100.0%) |
| 6 to 11 Years | 2,852 (99.3%) | 1,974 (98.5%) |
| 12 to 14 Years | 1,196 (95.6%) | 1,645 (98.7%) |
| 15 Years | 455 (98.5%) | 349 (92.6%) |
| 16 and 17 Years | 1,039 (99.3%) | 657 (95.2%) |
| 18 to 24 Years | 1,445 (96.5%) | 950 (99.9%) |
| 25 to 34 Years | 1,890 (97.3%) | 1,785 (98.0%) |
| 35 to 44 Years | 3,668 (98.7%) | 4,047 (97.2%) |
| 45 to 54 Years | 4,311 (97.6%) | 3,708 (98.4%) |
| 55 to 64 Years | 3,163 (97.8%) | 3,123 (99.5%) |
| 65 to 74 Years | 2,063 (99.1%) | 1,921 (89.9%) |
| 75 Years and over | 1,113 (99.3%) | 1,048 (99.2%) |
| Total | 24,675 (98.2%) | 22,822 (97.5%) |
Income Below Poverty Among Married-Couple Families in Dublin
The poverty statistics for married-couple families in Dublin show that 0.4% or 53 of the total 12,610 families live below the poverty line. Families with 3 or 4 children have the highest poverty rate of 1.6%, comprising of 13 families. On the other hand, families with 1 or 2 children have the lowest poverty rate of 0.3%, which includes 15 families.
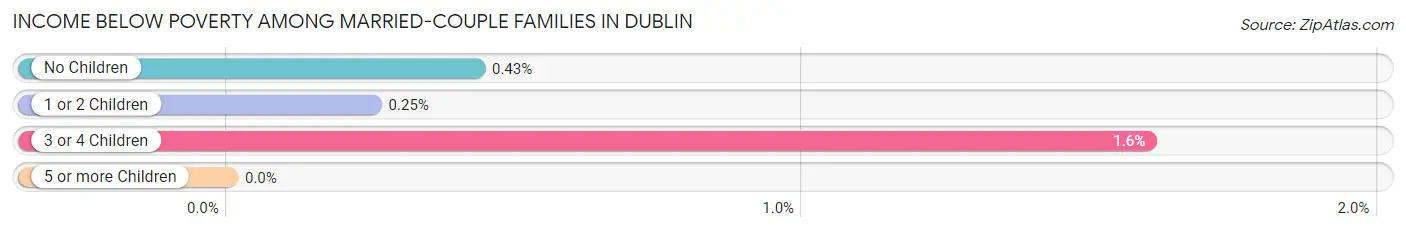
| Children | Above Poverty | Below Poverty |
| No Children | 5,737 (99.6%) | 25 (0.4%) |
| 1 or 2 Children | 6,019 (99.8%) | 15 (0.3%) |
| 3 or 4 Children | 801 (98.4%) | 13 (1.6%) |
| 5 or more Children | 0 (0.0%) | 0 (0.0%) |
| Total | 12,557 (99.6%) | 53 (0.4%) |
Income Below Poverty Among Single-Parent Households in Dublin
According to the poverty data in Dublin, 2.2% or 13 single-father households and 10.0% or 78 single-mother households are living below the poverty line. Among single-father households, those with 1 or 2 children have the highest poverty rate, with 13 households (2.5%) experiencing poverty. Likewise, among single-mother households, those with 1 or 2 children have the highest poverty rate, with 78 households (15.5%) falling below the poverty line.
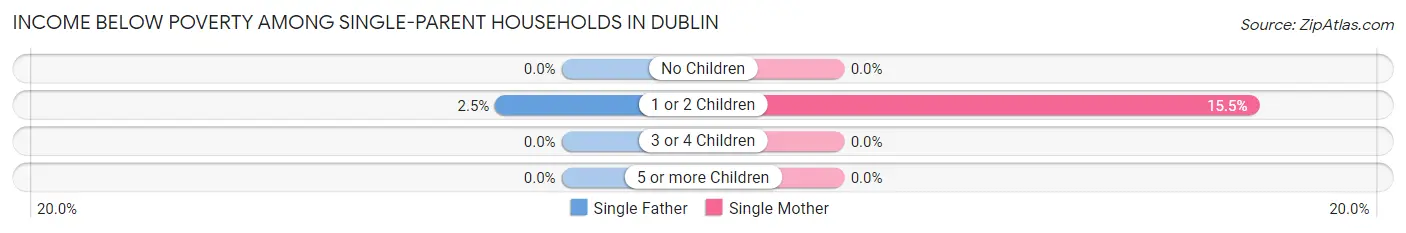
| Children | Single Father | Single Mother |
| No Children | 0 (0.0%) | 0 (0.0%) |
| 1 or 2 Children | 13 (2.5%) | 78 (15.5%) |
| 3 or 4 Children | 0 (0.0%) | 0 (0.0%) |
| 5 or more Children | 0 (0.0%) | 0 (0.0%) |
| Total | 13 (2.2%) | 78 (10.0%) |
Income Below Poverty Among Married-Couple vs Single-Parent Households in Dublin
The poverty data for Dublin shows that 53 of the married-couple family households (0.4%) and 91 of the single-parent households (6.6%) are living below the poverty level. Within the married-couple family households, those with 3 or 4 children have the highest poverty rate, with 13 households (1.6%) falling below the poverty line. Among the single-parent households, those with 1 or 2 children have the highest poverty rate, with 91 household (8.8%) living below poverty.
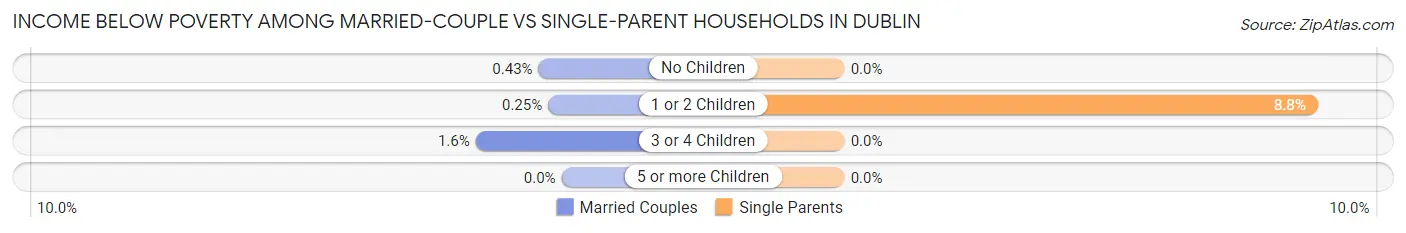
| Children | Married-Couple Families | Single-Parent Households |
| No Children | 25 (0.4%) | 0 (0.0%) |
| 1 or 2 Children | 15 (0.3%) | 91 (8.8%) |
| 3 or 4 Children | 13 (1.6%) | 0 (0.0%) |
| 5 or more Children | 0 (0.0%) | 0 (0.0%) |
| Total | 53 (0.4%) | 91 (6.6%) |
Race in Dublin
The most populous races in Dublin are White / Caucasian (36,283 | 74.2%), Asian (9,311 | 19.0%), and Hispanic or Latino (2,078 | 4.3%).
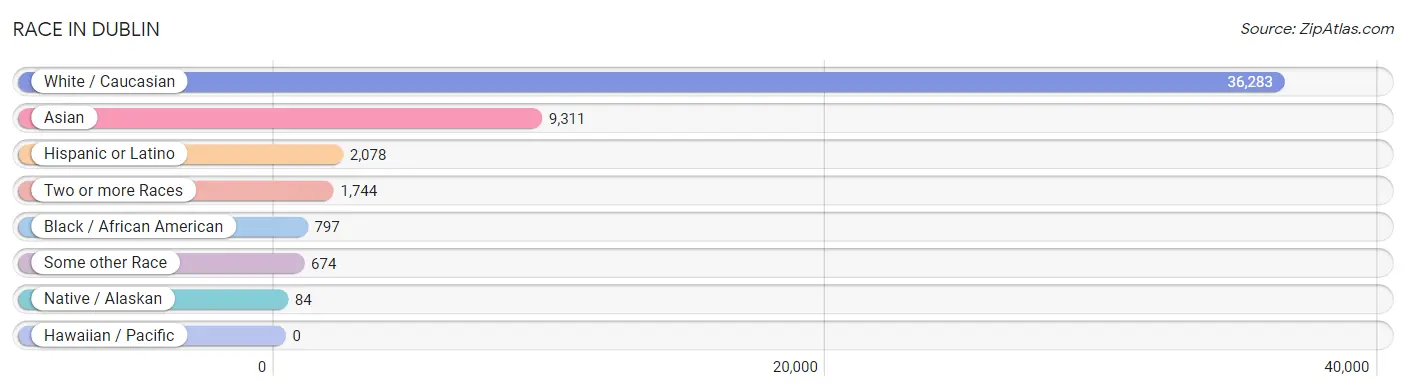
| Race | # Population | % Population |
| Asian | 9,311 | 19.0% |
| Black / African American | 797 | 1.6% |
| Hawaiian / Pacific | 0 | 0.0% |
| Hispanic or Latino | 2,078 | 4.3% |
| Native / Alaskan | 84 | 0.2% |
| White / Caucasian | 36,283 | 74.2% |
| Two or more Races | 1,744 | 3.6% |
| Some other Race | 674 | 1.4% |
| Total | 48,893 | 100.0% |
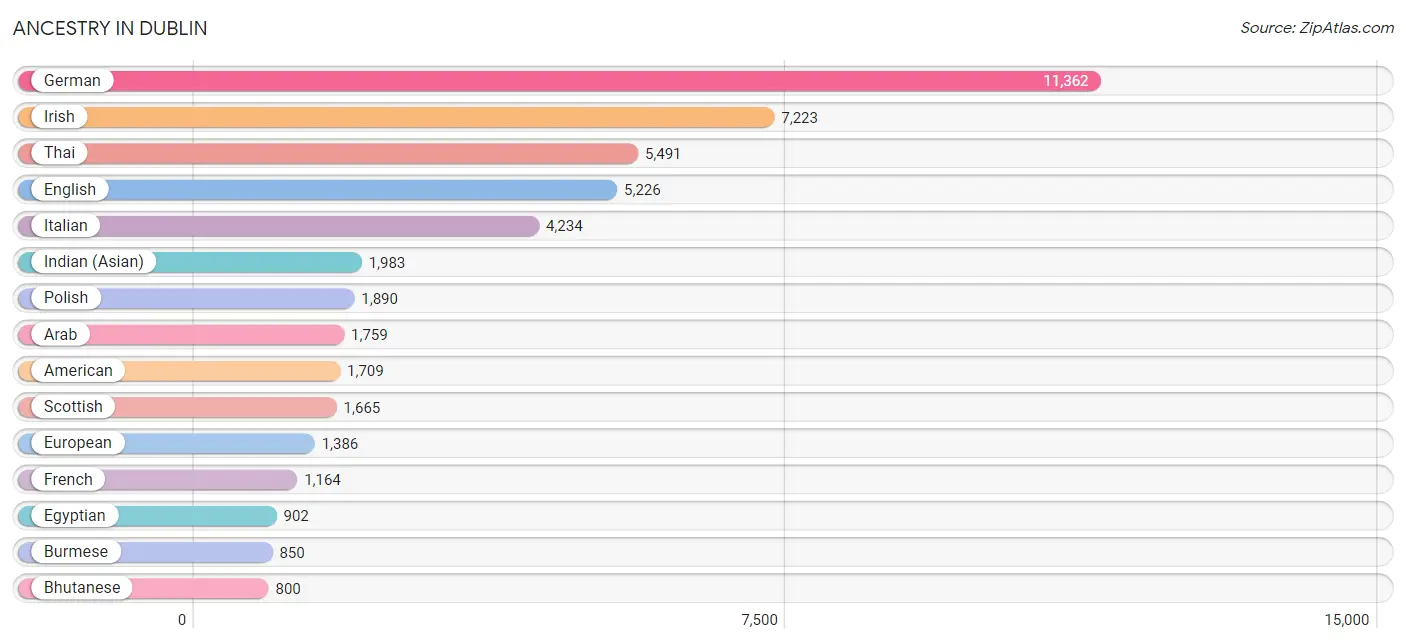
Ancestry in Dublin
The most populous ancestries reported in Dublin are German (11,362 | 23.2%), Irish (7,223 | 14.8%), Thai (5,491 | 11.2%), English (5,226 | 10.7%), and Italian (4,234 | 8.7%), together accounting for 68.6% of all Dublin residents.
| Ancestry | # Population | % Population |
| African | 3 | 0.0% |
| Alsatian | 12 | 0.0% |
| American | 1,709 | 3.5% |
| Arab | 1,759 | 3.6% |
| Australian | 14 | 0.0% |
| Austrian | 74 | 0.2% |
| Belgian | 47 | 0.1% |
| Bhutanese | 800 | 1.6% |
| Blackfeet | 27 | 0.1% |
| Brazilian | 53 | 0.1% |
| British | 336 | 0.7% |
| Burmese | 850 | 1.7% |
| Canadian | 143 | 0.3% |
| Celtic | 19 | 0.0% |
| Central American | 40 | 0.1% |
| Central American Indian | 31 | 0.1% |
| Cherokee | 22 | 0.0% |
| Chilean | 28 | 0.1% |
| Colombian | 201 | 0.4% |
| Croatian | 62 | 0.1% |
| Cuban | 33 | 0.1% |
| Czech | 223 | 0.5% |
| Czechoslovakian | 51 | 0.1% |
| Danish | 134 | 0.3% |
| Dominican | 33 | 0.1% |
| Dutch | 567 | 1.2% |
| Eastern European | 102 | 0.2% |
| Egyptian | 902 | 1.8% |
| English | 5,226 | 10.7% |
| Estonian | 7 | 0.0% |
| European | 1,386 | 2.8% |
| Filipino | 214 | 0.4% |
| Finnish | 81 | 0.2% |
| French | 1,164 | 2.4% |
| French Canadian | 237 | 0.5% |
| German | 11,362 | 23.2% |
| Ghanaian | 46 | 0.1% |
| Greek | 387 | 0.8% |
| Guatemalan | 40 | 0.1% |
| Hungarian | 316 | 0.6% |
| Indian (Asian) | 1,983 | 4.1% |
| Iranian | 104 | 0.2% |
| Irish | 7,223 | 14.8% |
| Italian | 4,234 | 8.7% |
| Jamaican | 35 | 0.1% |
| Japanese | 63 | 0.1% |
| Jordanian | 187 | 0.4% |
| Korean | 183 | 0.4% |
| Laotian | 14 | 0.0% |
| Latvian | 59 | 0.1% |
| Lebanese | 167 | 0.3% |
| Lithuanian | 56 | 0.1% |
| Lumbee | 57 | 0.1% |
| Luxembourger | 28 | 0.1% |
| Macedonian | 17 | 0.0% |
| Malaysian | 10 | 0.0% |
| Maltese | 10 | 0.0% |
| Mexican | 763 | 1.6% |
| Native Hawaiian | 8 | 0.0% |
| Nigerian | 99 | 0.2% |
| Northern European | 150 | 0.3% |
| Norwegian | 349 | 0.7% |
| Palestinian | 53 | 0.1% |
| Pennsylvania German | 13 | 0.0% |
| Peruvian | 170 | 0.4% |
| Polish | 1,890 | 3.9% |
| Portuguese | 80 | 0.2% |
| Puerto Rican | 597 | 1.2% |
| Puget Sound Salish | 12 | 0.0% |
| Romanian | 130 | 0.3% |
| Russian | 435 | 0.9% |
| Samoan | 46 | 0.1% |
| Scandinavian | 169 | 0.4% |
| Scotch-Irish | 300 | 0.6% |
| Scottish | 1,665 | 3.4% |
| Serbian | 9 | 0.0% |
| Sierra Leonean | 42 | 0.1% |
| Sioux | 1 | 0.0% |
| Slavic | 12 | 0.0% |
| Slovak | 198 | 0.4% |
| Slovene | 113 | 0.2% |
| South American | 483 | 1.0% |
| Spaniard | 25 | 0.1% |
| Spanish | 44 | 0.1% |
| Spanish American | 46 | 0.1% |
| Sri Lankan | 88 | 0.2% |
| Subsaharan African | 190 | 0.4% |
| Swedish | 529 | 1.1% |
| Swiss | 547 | 1.1% |
| Syrian | 381 | 0.8% |
| Thai | 5,491 | 11.2% |
| Tongan | 46 | 0.1% |
| Trinidadian and Tobagonian | 39 | 0.1% |
| Turkish | 121 | 0.3% |
| Ukrainian | 213 | 0.4% |
| Venezuelan | 84 | 0.2% |
| Vietnamese | 68 | 0.1% |
| Welsh | 623 | 1.3% | View All 98 Rows |
Immigrants in Dublin
The most numerous immigrant groups reported in Dublin came from Asia (7,316 | 15.0%), South Central Asia (4,076 | 8.3%), India (3,544 | 7.2%), Eastern Asia (2,556 | 5.2%), and China (1,420 | 2.9%), together accounting for 38.7% of all Dublin residents.
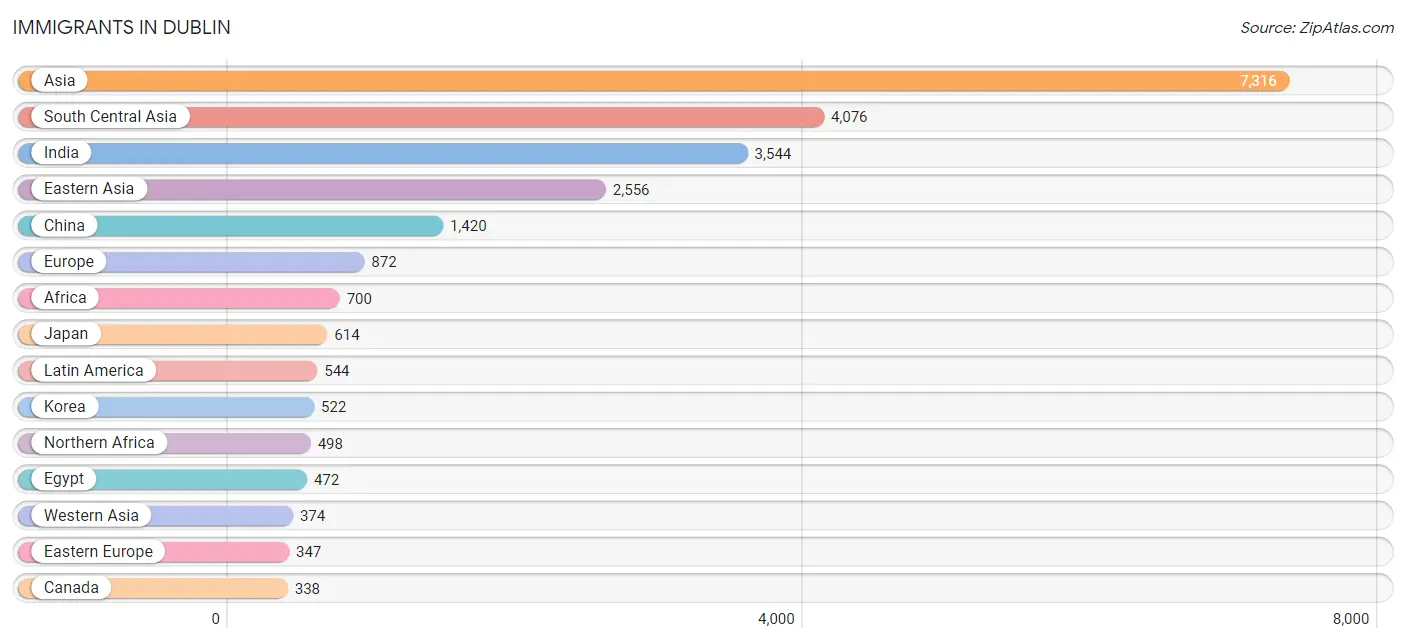
| Immigration Origin | # Population | % Population |
| Africa | 700 | 1.4% |
| Asia | 7,316 | 15.0% |
| Australia | 25 | 0.1% |
| Austria | 7 | 0.0% |
| Bangladesh | 52 | 0.1% |
| Belarus | 12 | 0.0% |
| Belgium | 34 | 0.1% |
| Brazil | 53 | 0.1% |
| Cambodia | 13 | 0.0% |
| Canada | 338 | 0.7% |
| Caribbean | 46 | 0.1% |
| Central America | 311 | 0.6% |
| Chile | 28 | 0.1% |
| China | 1,420 | 2.9% |
| Colombia | 39 | 0.1% |
| Czechoslovakia | 20 | 0.0% |
| Eastern Africa | 83 | 0.2% |
| Eastern Asia | 2,556 | 5.2% |
| Eastern Europe | 347 | 0.7% |
| Egypt | 472 | 1.0% |
| England | 33 | 0.1% |
| Europe | 872 | 1.8% |
| France | 12 | 0.0% |
| Germany | 62 | 0.1% |
| Ghana | 24 | 0.1% |
| Greece | 22 | 0.0% |
| Hong Kong | 26 | 0.1% |
| India | 3,544 | 7.2% |
| Indonesia | 14 | 0.0% |
| Iran | 37 | 0.1% |
| Italy | 118 | 0.2% |
| Japan | 614 | 1.3% |
| Jordan | 66 | 0.1% |
| Kenya | 31 | 0.1% |
| Korea | 522 | 1.1% |
| Latin America | 544 | 1.1% |
| Latvia | 44 | 0.1% |
| Lebanon | 64 | 0.1% |
| Malaysia | 25 | 0.1% |
| Mexico | 311 | 0.6% |
| Morocco | 17 | 0.0% |
| Nepal | 168 | 0.3% |
| Netherlands | 33 | 0.1% |
| Nigeria | 65 | 0.1% |
| Northern Africa | 498 | 1.0% |
| Northern Europe | 211 | 0.4% |
| Norway | 14 | 0.0% |
| Oceania | 25 | 0.1% |
| Pakistan | 249 | 0.5% |
| Peru | 52 | 0.1% |
| Philippines | 102 | 0.2% |
| Poland | 39 | 0.1% |
| Romania | 9 | 0.0% |
| Russia | 223 | 0.5% |
| Sierra Leone | 19 | 0.0% |
| Singapore | 52 | 0.1% |
| South Africa | 11 | 0.0% |
| South America | 187 | 0.4% |
| South Central Asia | 4,076 | 8.3% |
| South Eastern Asia | 310 | 0.6% |
| Southern Europe | 140 | 0.3% |
| Sri Lanka | 26 | 0.1% |
| Switzerland | 26 | 0.1% |
| Syria | 91 | 0.2% |
| Taiwan | 211 | 0.4% |
| Thailand | 59 | 0.1% |
| Trinidad and Tobago | 46 | 0.1% |
| Turkey | 101 | 0.2% |
| Uganda | 9 | 0.0% |
| Venezuela | 15 | 0.0% |
| Vietnam | 45 | 0.1% |
| Western Africa | 108 | 0.2% |
| Western Asia | 374 | 0.8% |
| Western Europe | 174 | 0.4% | View All 74 Rows |
Sex and Age in Dublin
Sex and Age in Dublin
The most populous age groups in Dublin are 45 to 49 Years (2,629 | 10.4%) for men and 10 to 14 Years (2,477 | 10.4%) for women.
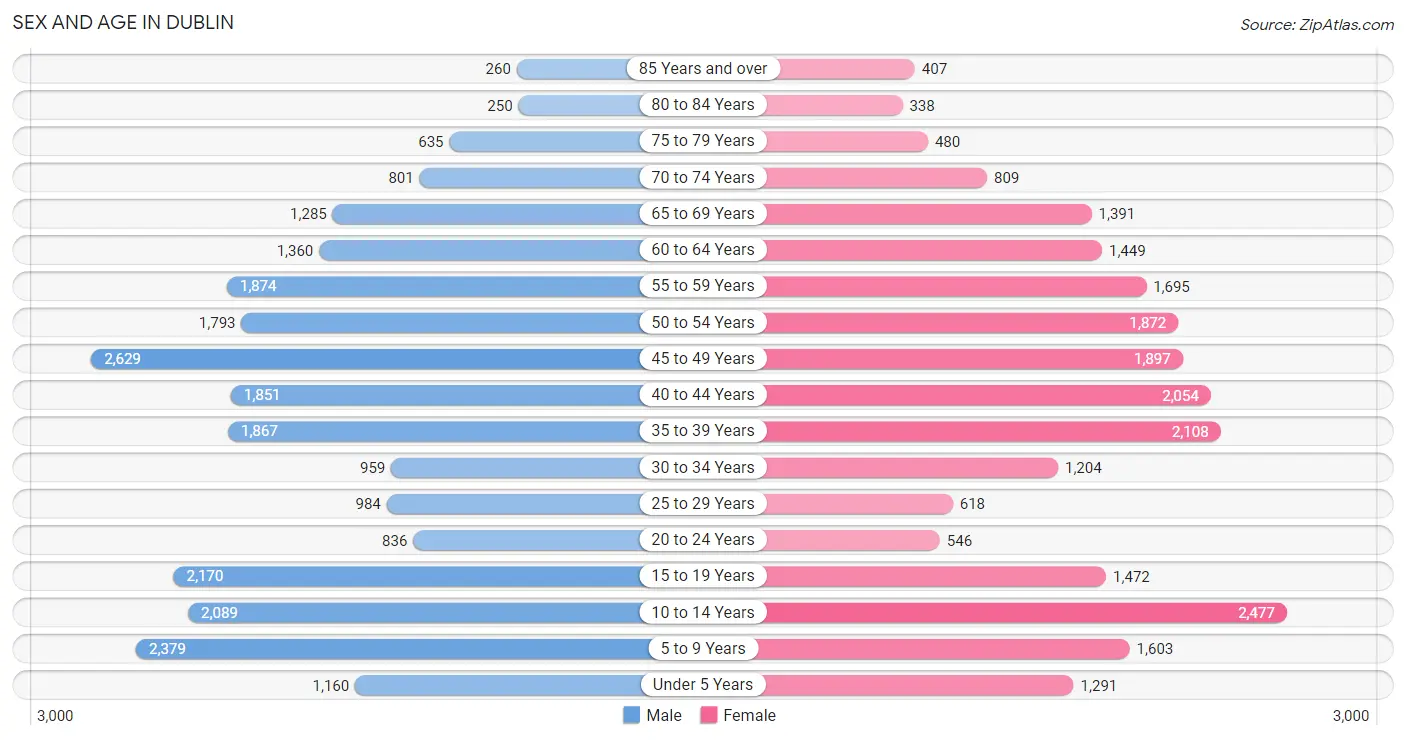
| Age Bracket | Male | Female |
| Under 5 Years | 1,160 (4.6%) | 1,291 (5.4%) |
| 5 to 9 Years | 2,379 (9.5%) | 1,603 (6.8%) |
| 10 to 14 Years | 2,089 (8.3%) | 2,477 (10.4%) |
| 15 to 19 Years | 2,170 (8.6%) | 1,472 (6.2%) |
| 20 to 24 Years | 836 (3.3%) | 546 (2.3%) |
| 25 to 29 Years | 984 (3.9%) | 618 (2.6%) |
| 30 to 34 Years | 959 (3.8%) | 1,204 (5.1%) |
| 35 to 39 Years | 1,867 (7.4%) | 2,108 (8.9%) |
| 40 to 44 Years | 1,851 (7.3%) | 2,054 (8.7%) |
| 45 to 49 Years | 2,629 (10.4%) | 1,897 (8.0%) |
| 50 to 54 Years | 1,793 (7.1%) | 1,872 (7.9%) |
| 55 to 59 Years | 1,874 (7.4%) | 1,695 (7.1%) |
| 60 to 64 Years | 1,360 (5.4%) | 1,449 (6.1%) |
| 65 to 69 Years | 1,285 (5.1%) | 1,391 (5.9%) |
| 70 to 74 Years | 801 (3.2%) | 809 (3.4%) |
| 75 to 79 Years | 635 (2.5%) | 480 (2.0%) |
| 80 to 84 Years | 250 (1.0%) | 338 (1.4%) |
| 85 Years and over | 260 (1.0%) | 407 (1.7%) |
| Total | 25,182 (100.0%) | 23,711 (100.0%) |
Families and Households in Dublin
Median Family Size in Dublin
The median family size in Dublin is 3.17 persons per family, with married-couple families (12,610 | 90.1%) accounting for the largest median family size of 3.24 persons per family. On the other hand, single female/mother families (782 | 5.6%) represent the smallest median family size with 2.52 persons per family.
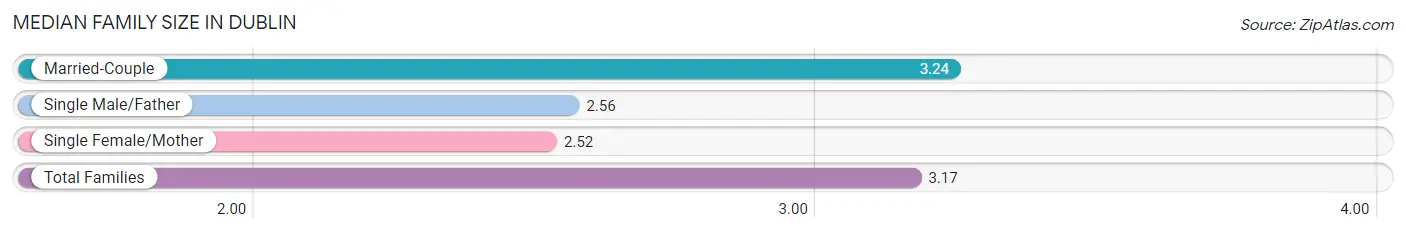
| Family Type | # Families | Family Size |
| Married-Couple | 12,610 (90.1%) | 3.24 |
| Single Male/Father | 603 (4.3%) | 2.56 |
| Single Female/Mother | 782 (5.6%) | 2.52 |
| Total Families | 13,995 (100.0%) | 3.17 |
Median Household Size in Dublin
The median household size in Dublin is 2.75 persons per household, with married-couple households (12,610 | 71.3%) accounting for the largest median household size of 3.24 persons per household. non-family households (3,702 | 20.9%) represent the smallest median household size with 1.09 persons per household.
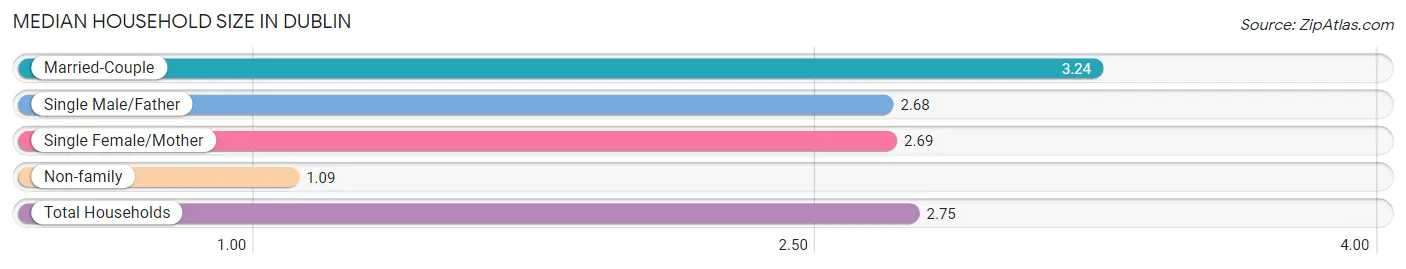
| Household Type | # Households | Household Size |
| Married-Couple | 12,610 (71.3%) | 3.24 |
| Single Male/Father | 603 (3.4%) | 2.68 |
| Single Female/Mother | 782 (4.4%) | 2.69 |
| Non-family | 3,702 (20.9%) | 1.09 |
| Total Households | 17,697 (100.0%) | 2.75 |
Household Size by Marriage Status in Dublin
Out of a total of 17,697 households in Dublin, 13,995 (79.1%) are family households, while 3,702 (20.9%) are nonfamily households. The most numerous type of family households are 2-person households, comprising 5,174, and the most common type of nonfamily households are 1-person households, comprising 3,401.
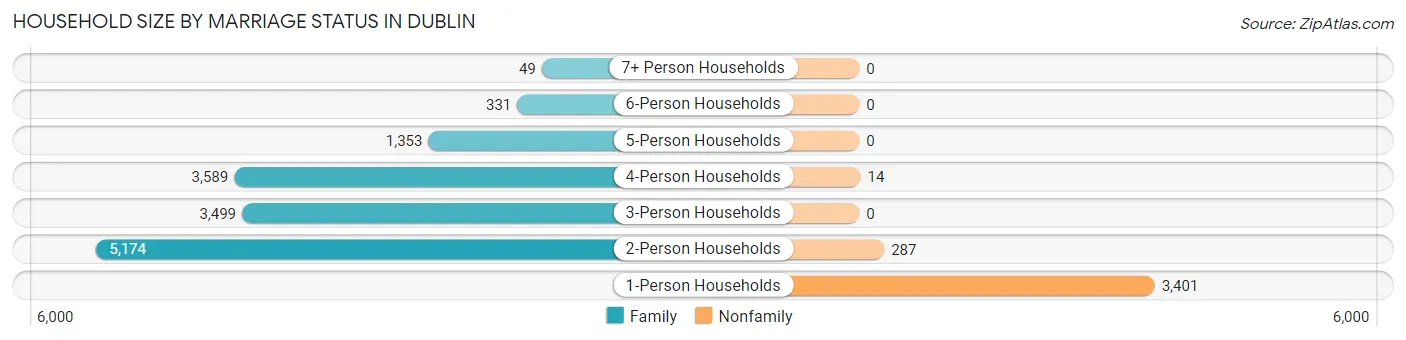
| Household Size | Family Households | Nonfamily Households |
| 1-Person Households | - | 3,401 (19.2%) |
| 2-Person Households | 5,174 (29.2%) | 287 (1.6%) |
| 3-Person Households | 3,499 (19.8%) | 0 (0.0%) |
| 4-Person Households | 3,589 (20.3%) | 14 (0.1%) |
| 5-Person Households | 1,353 (7.6%) | 0 (0.0%) |
| 6-Person Households | 331 (1.9%) | 0 (0.0%) |
| 7+ Person Households | 49 (0.3%) | 0 (0.0%) |
| Total | 13,995 (79.1%) | 3,702 (20.9%) |
Female Fertility in Dublin
Fertility by Age in Dublin
Average fertility rate in Dublin is 55.0 births per 1,000 women. Women in the age bracket of 20 to 34 years have the highest fertility rate with 141.0 births per 1,000 women. Women in the age bracket of 20 to 34 years acount for 58.7% of all women with births.
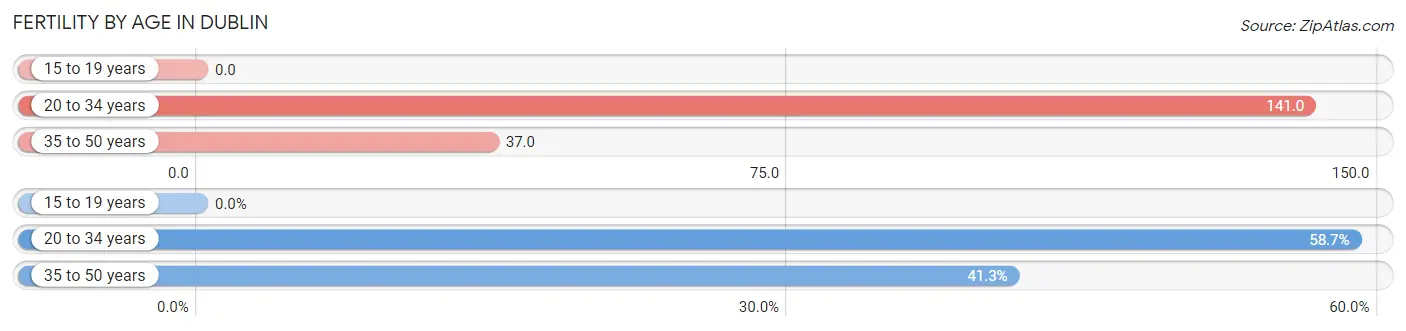
| Age Bracket | Women with Births | Births / 1,000 Women |
| 15 to 19 years | 0 (0.0%) | 0.0 |
| 20 to 34 years | 334 (58.7%) | 141.0 |
| 35 to 50 years | 235 (41.3%) | 37.0 |
| Total | 569 (100.0%) | 55.0 |
Fertility by Age by Marriage Status in Dublin
97.9% of women with births (569) in Dublin are married. The highest percentage of unmarried women with births falls into 35 to 50 years age bracket with 4.3% of them unmarried at the time of birth, while the lowest percentage of unmarried women with births belong to 20 to 34 years age bracket with 0.6% of them unmarried.
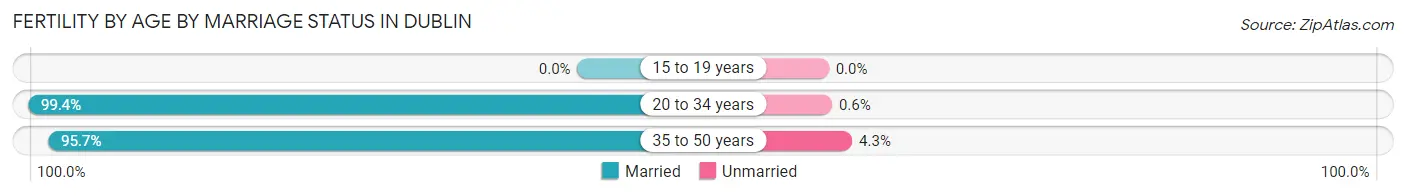
| Age Bracket | Married | Unmarried |
| 15 to 19 years | 0 (0.0%) | 0 (0.0%) |
| 20 to 34 years | 332 (99.4%) | 2 (0.6%) |
| 35 to 50 years | 225 (95.7%) | 10 (4.3%) |
| Total | 557 (97.9%) | 12 (2.1%) |
Fertility by Education in Dublin
Average fertility rate in Dublin is 55.0 births per 1,000 women. Women with the education attainment of graduate degree have the highest fertility rate of 110.0 births per 1,000 women, while women with the education attainment of high school diploma have the lowest fertility at 18.0 births per 1,000 women. Women with the education attainment of graduate degree represent 58.2% of all women with births.
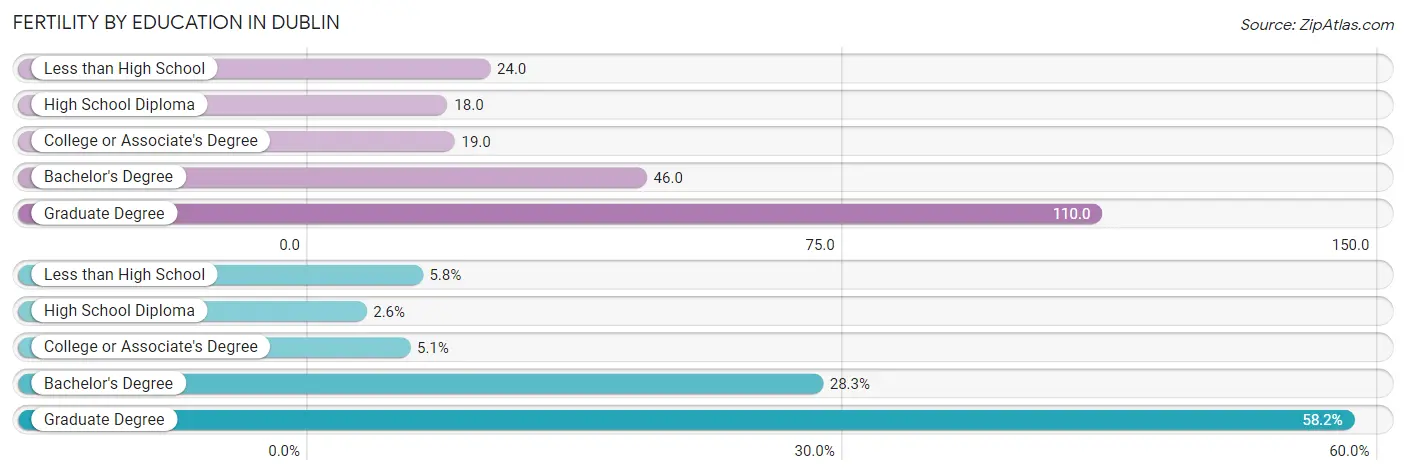
| Educational Attainment | Women with Births | Births / 1,000 Women |
| Less than High School | 33 (5.8%) | 24.0 |
| High School Diploma | 15 (2.6%) | 18.0 |
| College or Associate's Degree | 29 (5.1%) | 19.0 |
| Bachelor's Degree | 161 (28.3%) | 46.0 |
| Graduate Degree | 331 (58.2%) | 110.0 |
| Total | 569 (100.0%) | 55.0 |
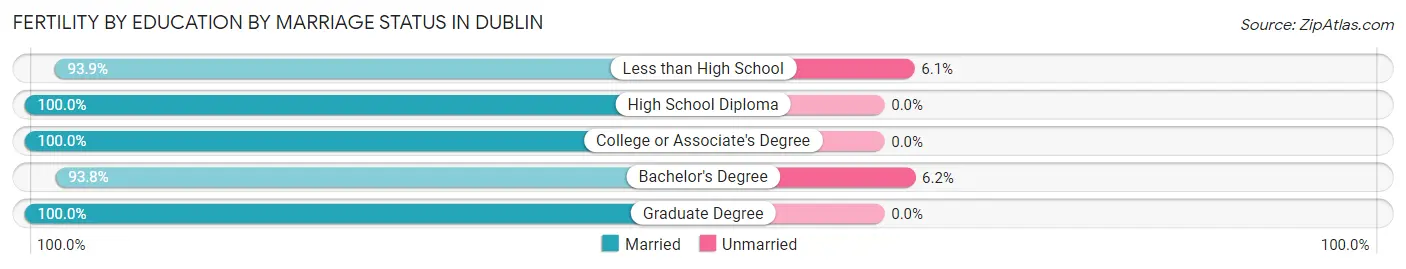
Fertility by Education by Marriage Status in Dublin
2.1% of women with births in Dublin are unmarried. Women with the educational attainment of high school diploma are most likely to be married with 100.0% of them married at childbirth, while women with the educational attainment of bachelor's degree are least likely to be married with 6.2% of them unmarried at childbirth.
| Educational Attainment | Married | Unmarried |
| Less than High School | 31 (93.9%) | 2 (6.1%) |
| High School Diploma | 15 (100.0%) | 0 (0.0%) |
| College or Associate's Degree | 29 (100.0%) | 0 (0.0%) |
| Bachelor's Degree | 151 (93.8%) | 10 (6.2%) |
| Graduate Degree | 331 (100.0%) | 0 (0.0%) |
| Total | 557 (97.9%) | 12 (2.1%) |
Employment Characteristics in Dublin
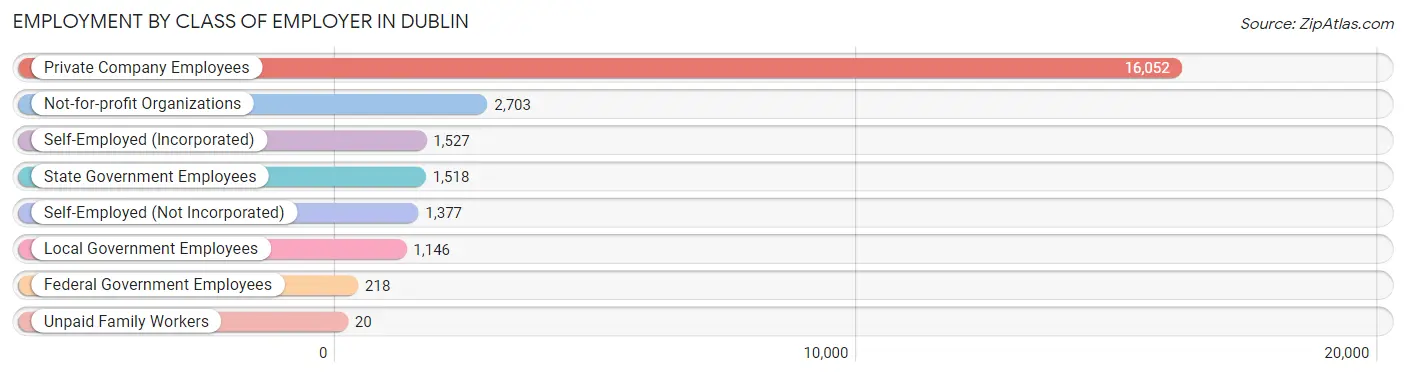
Employment by Class of Employer in Dublin
Among the 24,561 employed individuals in Dublin, private company employees (16,052 | 65.4%), not-for-profit organizations (2,703 | 11.0%), and self-employed (incorporated) (1,527 | 6.2%) make up the most common classes of employment.
| Employer Class | # Employees | % Employees |
| Private Company Employees | 16,052 | 65.4% |
| Self-Employed (Incorporated) | 1,527 | 6.2% |
| Self-Employed (Not Incorporated) | 1,377 | 5.6% |
| Not-for-profit Organizations | 2,703 | 11.0% |
| Local Government Employees | 1,146 | 4.7% |
| State Government Employees | 1,518 | 6.2% |
| Federal Government Employees | 218 | 0.9% |
| Unpaid Family Workers | 20 | 0.1% |
| Total | 24,561 | 100.0% |
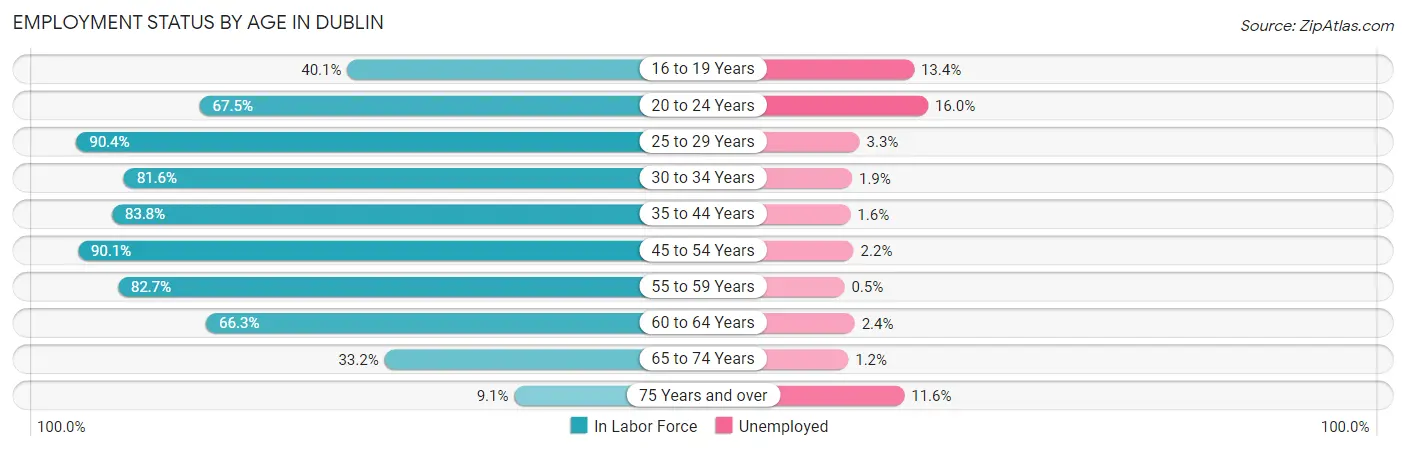
Employment Status by Age in Dublin
According to the labor force statistics for Dublin, out of the total population over 16 years of age (37,055), 69.4% or 25,716 individuals are in the labor force, with 2.9% or 746 of them unemployed. The age group with the highest labor force participation rate is 25 to 29 years, with 90.4% or 1,448 individuals in the labor force. Within the labor force, the 20 to 24 years age range has the highest percentage of unemployed individuals, with 16.0% or 149 of them being unemployed.
| Age Bracket | In Labor Force | Unemployed |
| 16 to 19 Years | 1,124 (40.1%) | 151 (13.4%) |
| 20 to 24 Years | 933 (67.5%) | 149 (16.0%) |
| 25 to 29 Years | 1,448 (90.4%) | 48 (3.3%) |
| 30 to 34 Years | 1,765 (81.6%) | 34 (1.9%) |
| 35 to 44 Years | 6,603 (83.8%) | 106 (1.6%) |
| 45 to 54 Years | 7,380 (90.1%) | 162 (2.2%) |
| 55 to 59 Years | 2,952 (82.7%) | 15 (0.5%) |
| 60 to 64 Years | 1,862 (66.3%) | 45 (2.4%) |
| 65 to 74 Years | 1,423 (33.2%) | 17 (1.2%) |
| 75 Years and over | 216 (9.1%) | 25 (11.6%) |
| Total | 25,716 (69.4%) | 746 (2.9%) |
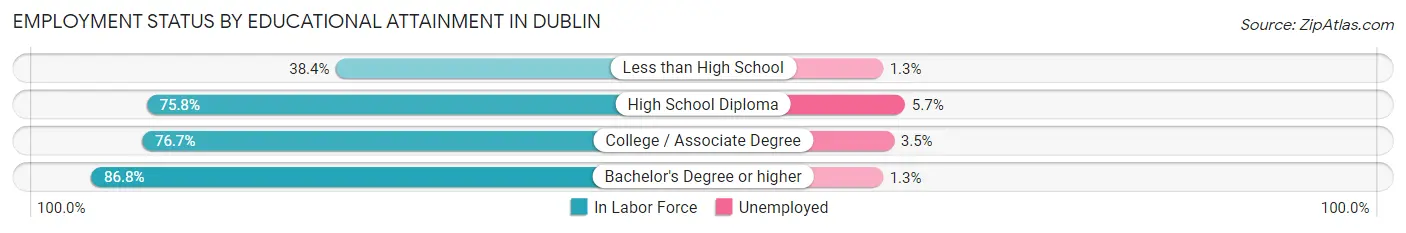
Employment Status by Educational Attainment in Dublin
According to labor force statistics for Dublin, 84.0% of individuals (22,020) out of the total population between 25 and 64 years of age (26,214) are in the labor force, with 1.9% or 418 of them being unemployed. The group with the highest labor force participation rate are those with the educational attainment of bachelor's degree or higher, with 86.8% or 17,817 individuals in the labor force. Within the labor force, individuals with high school diploma education have the highest percentage of unemployment, with 5.7% or 76 of them being unemployed.
| Educational Attainment | In Labor Force | Unemployed |
| Less than High School | 151 (38.4%) | 5 (1.3%) |
| High School Diploma | 1,326 (75.8%) | 100 (5.7%) |
| College / Associate Degree | 2,719 (76.7%) | 124 (3.5%) |
| Bachelor's Degree or higher | 17,817 (86.8%) | 267 (1.3%) |
| Total | 22,020 (84.0%) | 498 (1.9%) |
Employment Occupations by Sex in Dublin
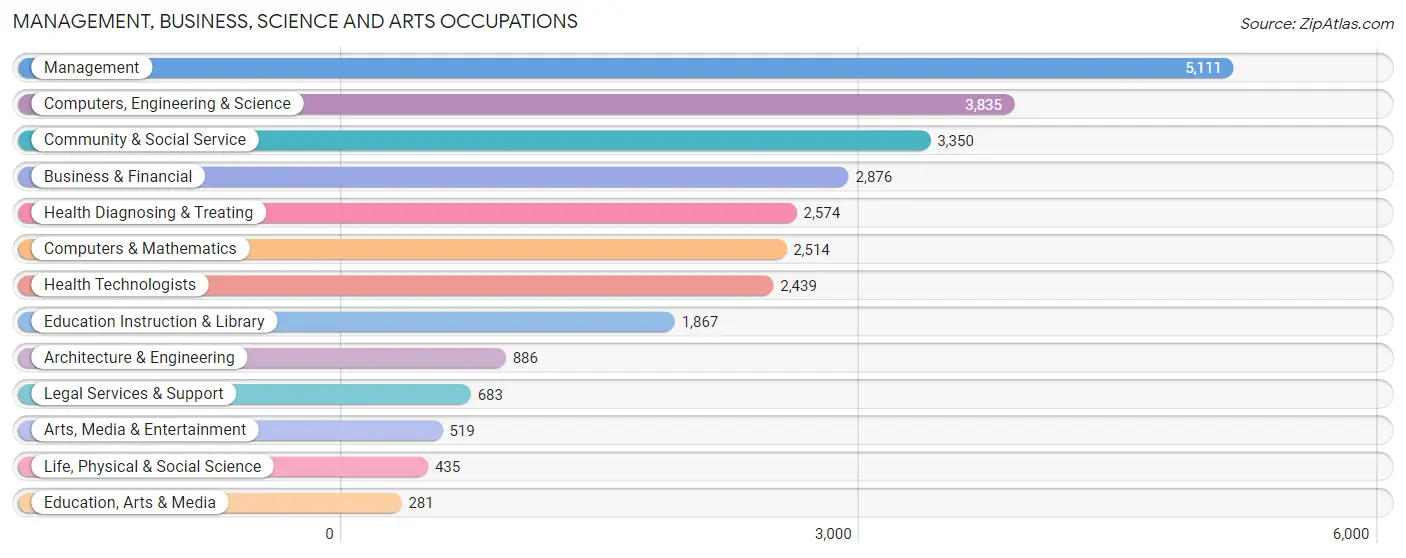
Management, Business, Science and Arts Occupations
The most common Management, Business, Science and Arts occupations in Dublin are Management (5,111 | 20.5%), Computers, Engineering & Science (3,835 | 15.4%), Community & Social Service (3,350 | 13.4%), Business & Financial (2,876 | 11.5%), and Health Diagnosing & Treating (2,574 | 10.3%).
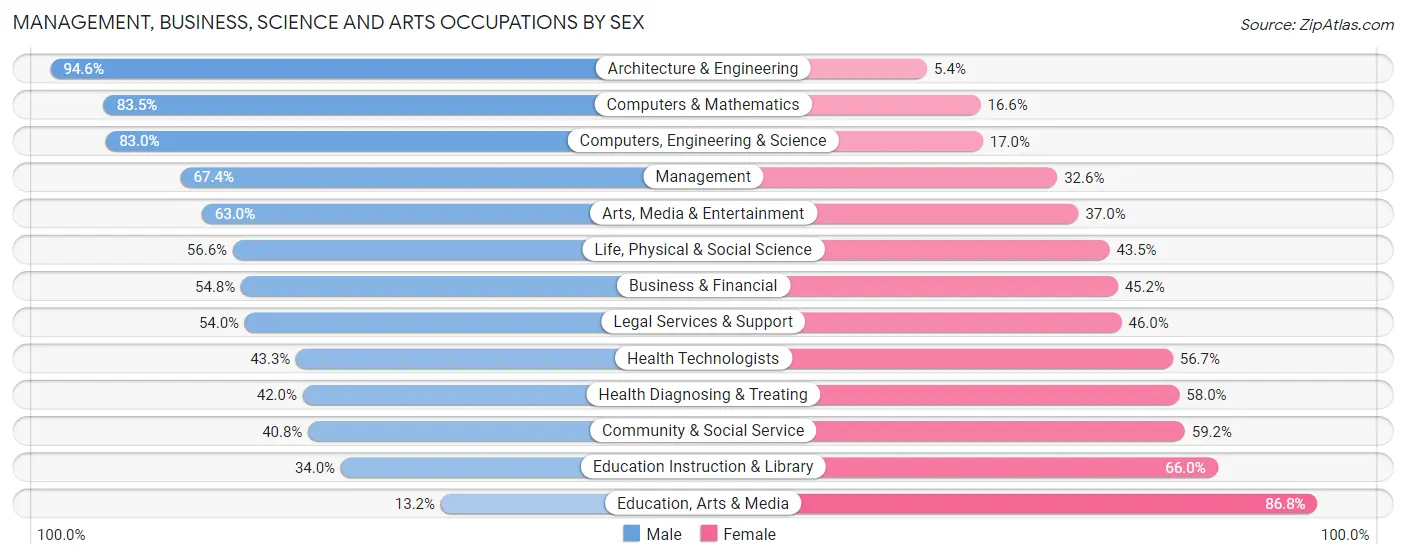
Management, Business, Science and Arts Occupations by Sex
Within the Management, Business, Science and Arts occupations in Dublin, the most male-oriented occupations are Architecture & Engineering (94.6%), Computers & Mathematics (83.5%), and Computers, Engineering & Science (83.0%), while the most female-oriented occupations are Education, Arts & Media (86.8%), Education Instruction & Library (66.0%), and Community & Social Service (59.2%).
| Occupation | Male | Female |
| Management | 3,447 (67.4%) | 1,664 (32.6%) |
| Business & Financial | 1,577 (54.8%) | 1,299 (45.2%) |
| Computers, Engineering & Science | 3,182 (83.0%) | 653 (17.0%) |
| Computers & Mathematics | 2,098 (83.5%) | 416 (16.6%) |
| Architecture & Engineering | 838 (94.6%) | 48 (5.4%) |
| Life, Physical & Social Science | 246 (56.6%) | 189 (43.4%) |
| Community & Social Service | 1,368 (40.8%) | 1,982 (59.2%) |
| Education, Arts & Media | 37 (13.2%) | 244 (86.8%) |
| Legal Services & Support | 369 (54.0%) | 314 (46.0%) |
| Education Instruction & Library | 635 (34.0%) | 1,232 (66.0%) |
| Arts, Media & Entertainment | 327 (63.0%) | 192 (37.0%) |
| Health Diagnosing & Treating | 1,080 (42.0%) | 1,494 (58.0%) |
| Health Technologists | 1,057 (43.3%) | 1,382 (56.7%) |
| Total (Category) | 10,654 (60.0%) | 7,092 (40.0%) |
| Total (Overall) | 14,434 (57.8%) | 10,519 (42.2%) |
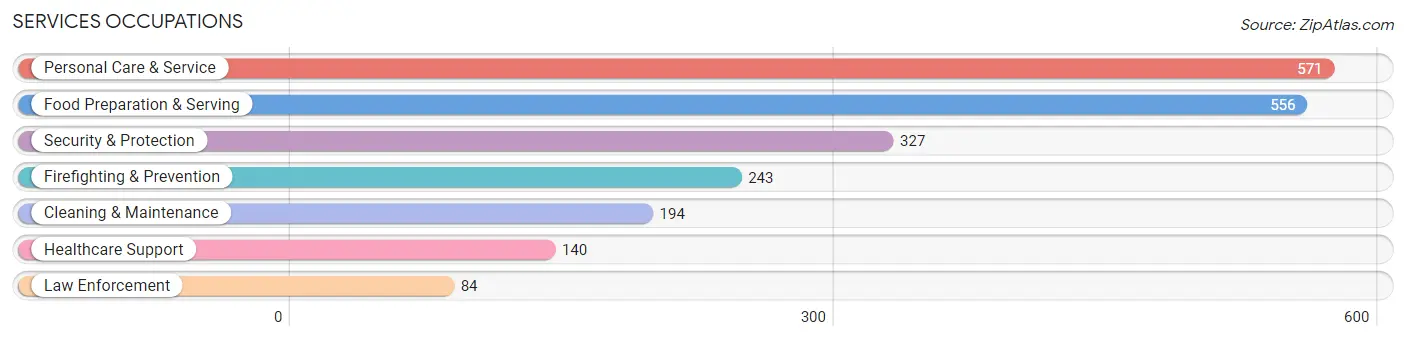
Services Occupations
The most common Services occupations in Dublin are Personal Care & Service (571 | 2.3%), Food Preparation & Serving (556 | 2.2%), Security & Protection (327 | 1.3%), Firefighting & Prevention (243 | 1.0%), and Cleaning & Maintenance (194 | 0.8%).
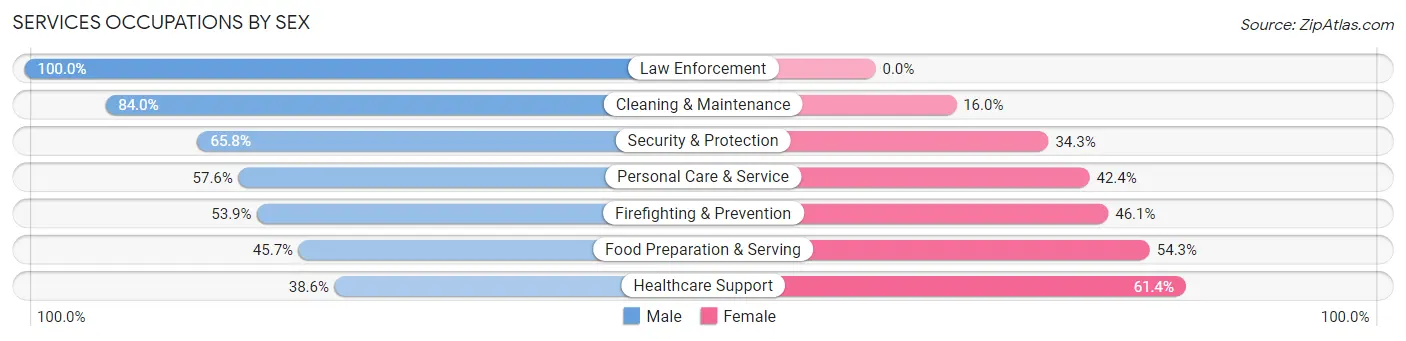
Services Occupations by Sex
Within the Services occupations in Dublin, the most male-oriented occupations are Law Enforcement (100.0%), Cleaning & Maintenance (84.0%), and Security & Protection (65.7%), while the most female-oriented occupations are Healthcare Support (61.4%), Food Preparation & Serving (54.3%), and Firefighting & Prevention (46.1%).
| Occupation | Male | Female |
| Healthcare Support | 54 (38.6%) | 86 (61.4%) |
| Security & Protection | 215 (65.7%) | 112 (34.3%) |
| Firefighting & Prevention | 131 (53.9%) | 112 (46.1%) |
| Law Enforcement | 84 (100.0%) | 0 (0.0%) |
| Food Preparation & Serving | 254 (45.7%) | 302 (54.3%) |
| Cleaning & Maintenance | 163 (84.0%) | 31 (16.0%) |
| Personal Care & Service | 329 (57.6%) | 242 (42.4%) |
| Total (Category) | 1,015 (56.8%) | 773 (43.2%) |
| Total (Overall) | 14,434 (57.8%) | 10,519 (42.2%) |
Sales and Office Occupations
The most common Sales and Office occupations in Dublin are Sales & Related (2,428 | 9.7%), and Office & Administration (1,875 | 7.5%).

Sales and Office Occupations by Sex

| Occupation | Male | Female |
| Sales & Related | 1,434 (59.1%) | 994 (40.9%) |
| Office & Administration | 455 (24.3%) | 1,420 (75.7%) |
| Total (Category) | 1,889 (43.9%) | 2,414 (56.1%) |
| Total (Overall) | 14,434 (57.8%) | 10,519 (42.2%) |
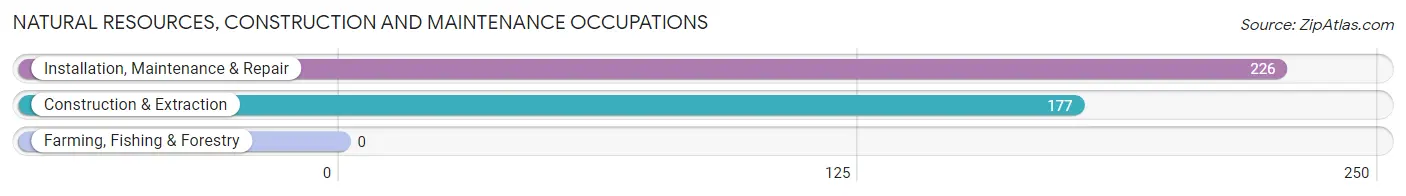
Natural Resources, Construction and Maintenance Occupations
The most common Natural Resources, Construction and Maintenance occupations in Dublin are Installation, Maintenance & Repair (226 | 0.9%), and Construction & Extraction (177 | 0.7%).
Natural Resources, Construction and Maintenance Occupations by Sex
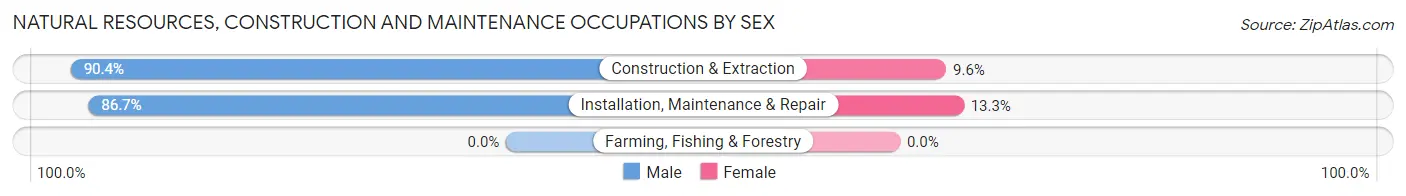
| Occupation | Male | Female |
| Farming, Fishing & Forestry | 0 (0.0%) | 0 (0.0%) |
| Construction & Extraction | 160 (90.4%) | 17 (9.6%) |
| Installation, Maintenance & Repair | 196 (86.7%) | 30 (13.3%) |
| Total (Category) | 356 (88.3%) | 47 (11.7%) |
| Total (Overall) | 14,434 (57.8%) | 10,519 (42.2%) |
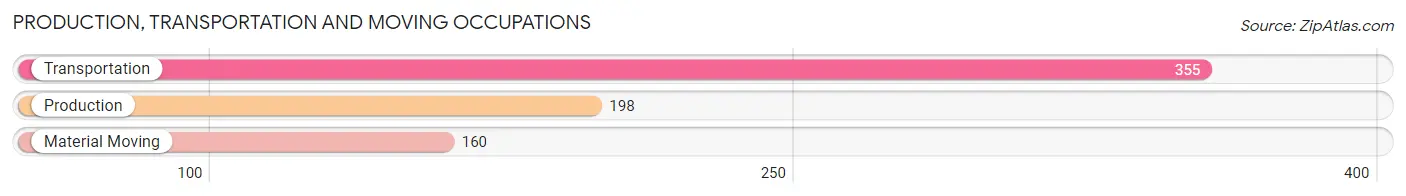
Production, Transportation and Moving Occupations
The most common Production, Transportation and Moving occupations in Dublin are Transportation (355 | 1.4%), Production (198 | 0.8%), and Material Moving (160 | 0.6%).
Production, Transportation and Moving Occupations by Sex
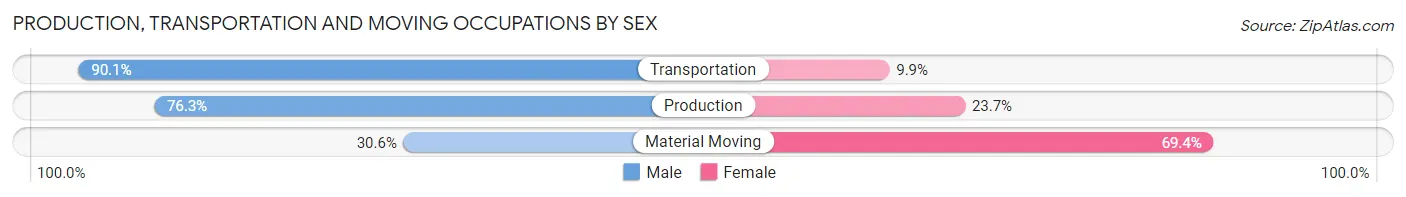
| Occupation | Male | Female |
| Production | 151 (76.3%) | 47 (23.7%) |
| Transportation | 320 (90.1%) | 35 (9.9%) |
| Material Moving | 49 (30.6%) | 111 (69.4%) |
| Total (Category) | 520 (72.9%) | 193 (27.1%) |
| Total (Overall) | 14,434 (57.8%) | 10,519 (42.2%) |
Employment Industries by Sex in Dublin
Employment Industries in Dublin
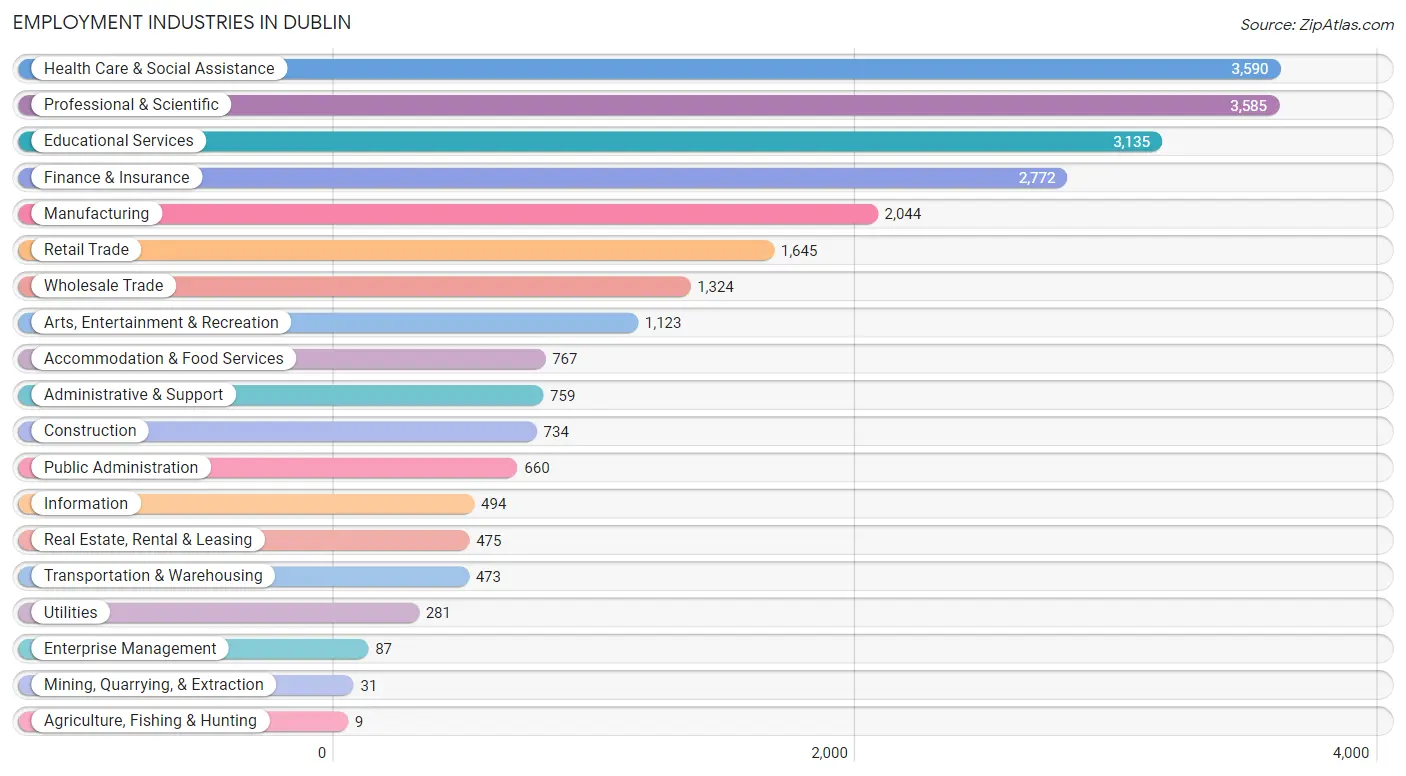
The major employment industries in Dublin include Health Care & Social Assistance (3,590 | 14.4%), Professional & Scientific (3,585 | 14.4%), Educational Services (3,135 | 12.6%), Finance & Insurance (2,772 | 11.1%), and Manufacturing (2,044 | 8.2%).
Employment Industries by Sex in Dublin
The Dublin industries that see more men than women are Agriculture, Fishing & Hunting (100.0%), Mining, Quarrying, & Extraction (100.0%), and Construction (93.9%), whereas the industries that tend to have a higher number of women are Educational Services (66.1%), Retail Trade (54.4%), and Health Care & Social Assistance (54.1%).
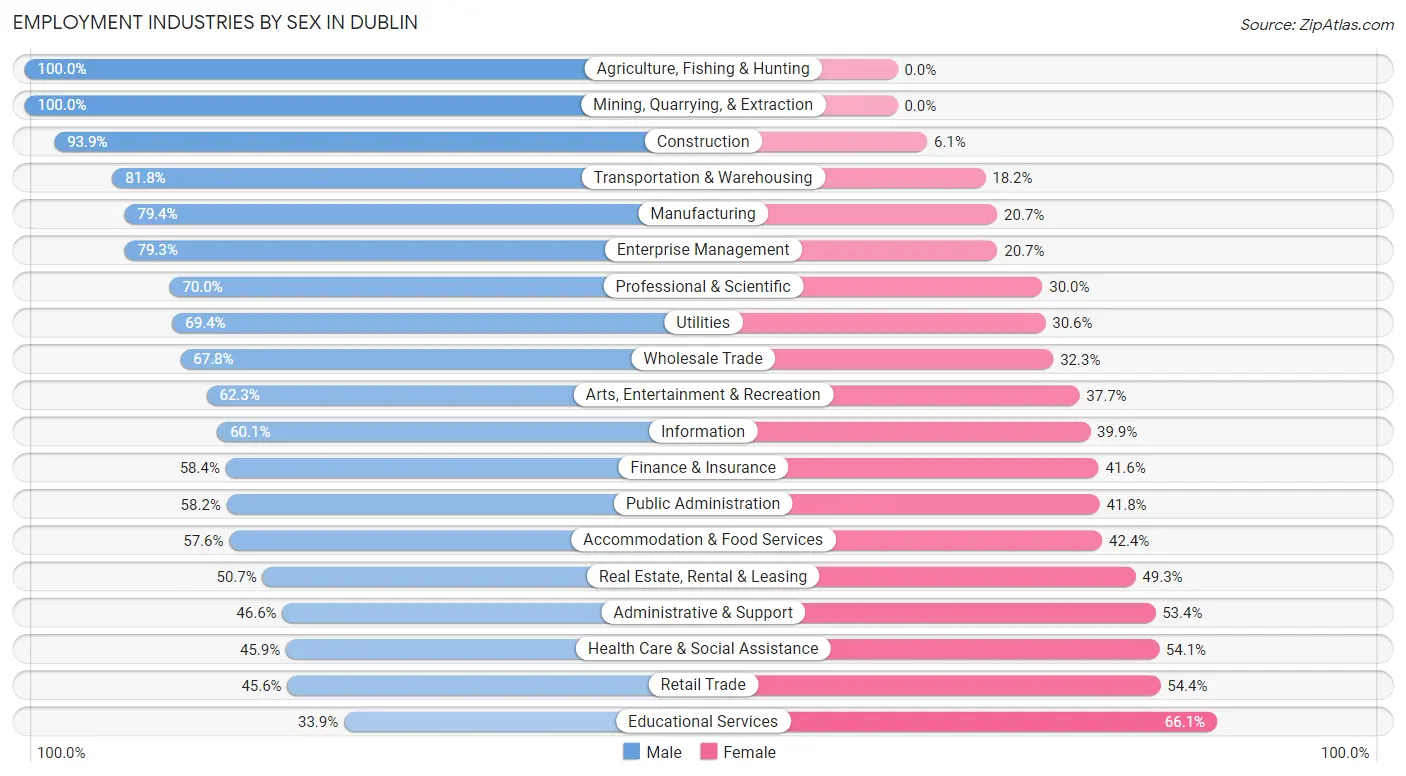
| Industry | Male | Female |
| Agriculture, Fishing & Hunting | 9 (100.0%) | 0 (0.0%) |
| Mining, Quarrying, & Extraction | 31 (100.0%) | 0 (0.0%) |
| Construction | 689 (93.9%) | 45 (6.1%) |
| Manufacturing | 1,622 (79.3%) | 422 (20.6%) |
| Wholesale Trade | 897 (67.7%) | 427 (32.3%) |
| Retail Trade | 750 (45.6%) | 895 (54.4%) |
| Transportation & Warehousing | 387 (81.8%) | 86 (18.2%) |
| Utilities | 195 (69.4%) | 86 (30.6%) |
| Information | 297 (60.1%) | 197 (39.9%) |
| Finance & Insurance | 1,618 (58.4%) | 1,154 (41.6%) |
| Real Estate, Rental & Leasing | 241 (50.7%) | 234 (49.3%) |
| Professional & Scientific | 2,510 (70.0%) | 1,075 (30.0%) |
| Enterprise Management | 69 (79.3%) | 18 (20.7%) |
| Administrative & Support | 354 (46.6%) | 405 (53.4%) |
| Educational Services | 1,062 (33.9%) | 2,073 (66.1%) |
| Health Care & Social Assistance | 1,647 (45.9%) | 1,943 (54.1%) |
| Arts, Entertainment & Recreation | 700 (62.3%) | 423 (37.7%) |
| Accommodation & Food Services | 442 (57.6%) | 325 (42.4%) |
| Public Administration | 384 (58.2%) | 276 (41.8%) |
| Total | 14,434 (57.8%) | 10,519 (42.2%) |
Education in Dublin
School Enrollment in Dublin
The most common levels of schooling among the 14,539 students in Dublin are high school (3,572 | 24.6%), middle school (3,445 | 23.7%), and elementary school (3,197 | 22.0%).
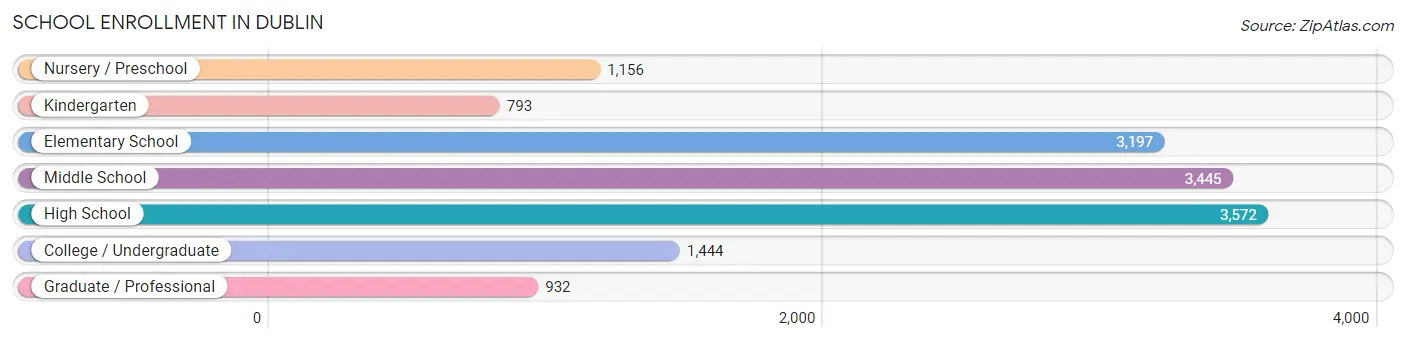
| School Level | # Students | % Students |
| Nursery / Preschool | 1,156 | 8.0% |
| Kindergarten | 793 | 5.4% |
| Elementary School | 3,197 | 22.0% |
| Middle School | 3,445 | 23.7% |
| High School | 3,572 | 24.6% |
| College / Undergraduate | 1,444 | 9.9% |
| Graduate / Professional | 932 | 6.4% |
| Total | 14,539 | 100.0% |
School Enrollment by Age by Funding Source in Dublin
Out of a total of 14,539 students who are enrolled in schools in Dublin, 2,661 (18.3%) attend a private institution, while the remaining 11,878 (81.7%) are enrolled in public schools. The age group of 3 to 4 year olds has the highest likelihood of being enrolled in private schools, with 541 (67.8% in the age bracket) enrolled. Conversely, the age group of 15 to 17 year olds has the lowest likelihood of being enrolled in a private school, with 2,421 (94.3% in the age bracket) attending a public institution.
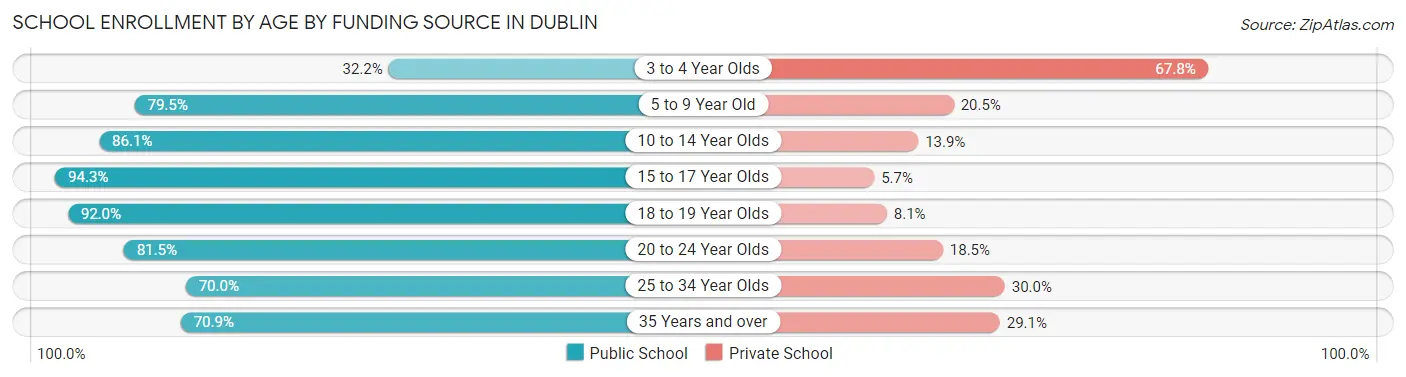
| Age Bracket | Public School | Private School |
| 3 to 4 Year Olds | 257 (32.2%) | 541 (67.8%) |
| 5 to 9 Year Old | 3,061 (79.5%) | 789 (20.5%) |
| 10 to 14 Year Olds | 3,864 (86.1%) | 623 (13.9%) |
| 15 to 17 Year Olds | 2,421 (94.3%) | 146 (5.7%) |
| 18 to 19 Year Olds | 879 (91.9%) | 77 (8.1%) |
| 20 to 24 Year Olds | 521 (81.5%) | 118 (18.5%) |
| 25 to 34 Year Olds | 282 (70.0%) | 121 (30.0%) |
| 35 Years and over | 595 (70.9%) | 244 (29.1%) |
| Total | 11,878 (81.7%) | 2,661 (18.3%) |
Educational Attainment by Field of Study in Dublin
Business (6,597 | 25.5%), engineering (2,942 | 11.4%), education (2,578 | 10.0%), science & technology (2,340 | 9.0%), and bio, nature & agricultural (1,882 | 7.3%) are the most common fields of study among 25,852 individuals in Dublin who have obtained a bachelor's degree or higher.
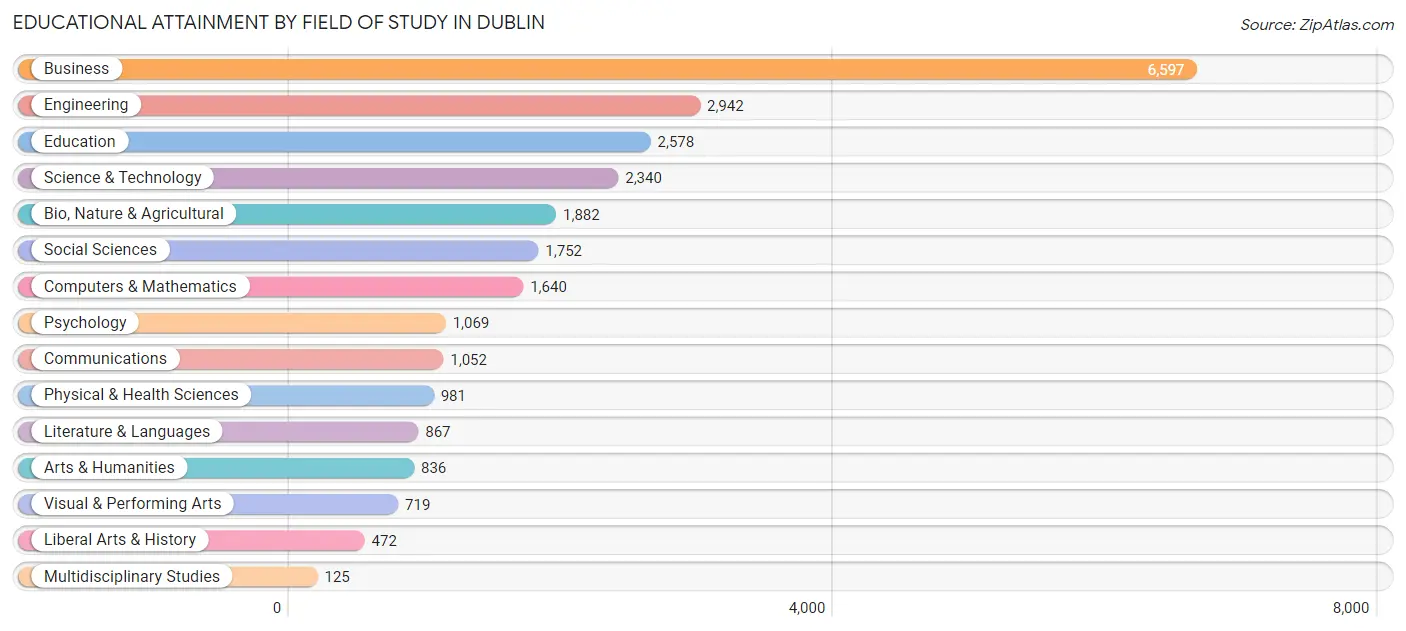
| Field of Study | # Graduates | % Graduates |
| Computers & Mathematics | 1,640 | 6.3% |
| Bio, Nature & Agricultural | 1,882 | 7.3% |
| Physical & Health Sciences | 981 | 3.8% |
| Psychology | 1,069 | 4.1% |
| Social Sciences | 1,752 | 6.8% |
| Engineering | 2,942 | 11.4% |
| Multidisciplinary Studies | 125 | 0.5% |
| Science & Technology | 2,340 | 9.0% |
| Business | 6,597 | 25.5% |
| Education | 2,578 | 10.0% |
| Literature & Languages | 867 | 3.4% |
| Liberal Arts & History | 472 | 1.8% |
| Visual & Performing Arts | 719 | 2.8% |
| Communications | 1,052 | 4.1% |
| Arts & Humanities | 836 | 3.2% |
| Total | 25,852 | 100.0% |
Transportation & Commute in Dublin
Vehicle Availability by Sex in Dublin
The most prevalent vehicle ownership categories in Dublin are males with 2 vehicles (7,171, accounting for 50.7%) and females with 2 vehicles (5,250, making up 68.8%).
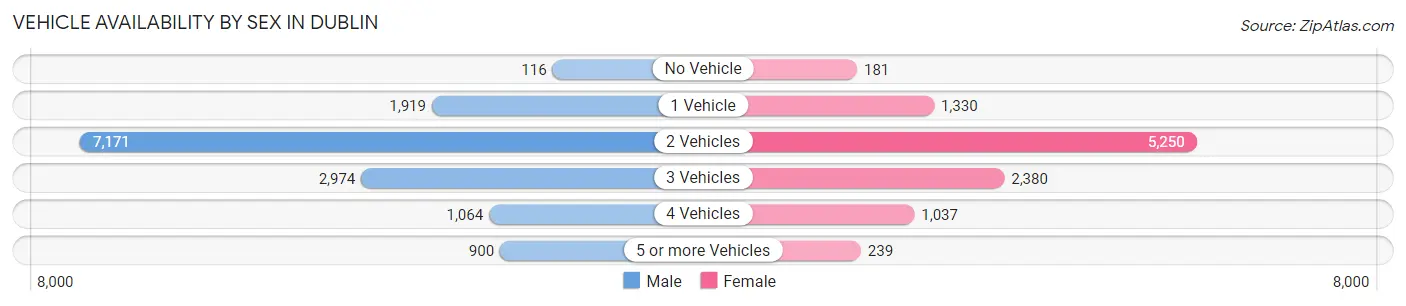
| Vehicles Available | Male | Female |
| No Vehicle | 116 (0.8%) | 181 (1.7%) |
| 1 Vehicle | 1,919 (13.6%) | 1,330 (12.8%) |
| 2 Vehicles | 7,171 (50.7%) | 5,250 (50.4%) |
| 3 Vehicles | 2,974 (21.0%) | 2,380 (22.9%) |
| 4 Vehicles | 1,064 (7.5%) | 1,037 (10.0%) |
| 5 or more Vehicles | 900 (6.4%) | 239 (2.3%) |
| Total | 14,144 (100.0%) | 10,417 (100.0%) |
Commute Time in Dublin
The most frequently occuring commute durations in Dublin are 30 to 34 minutes (3,389 commuters, 18.0%), 20 to 24 minutes (3,067 commuters, 16.3%), and 25 to 29 minutes (2,761 commuters, 14.7%).
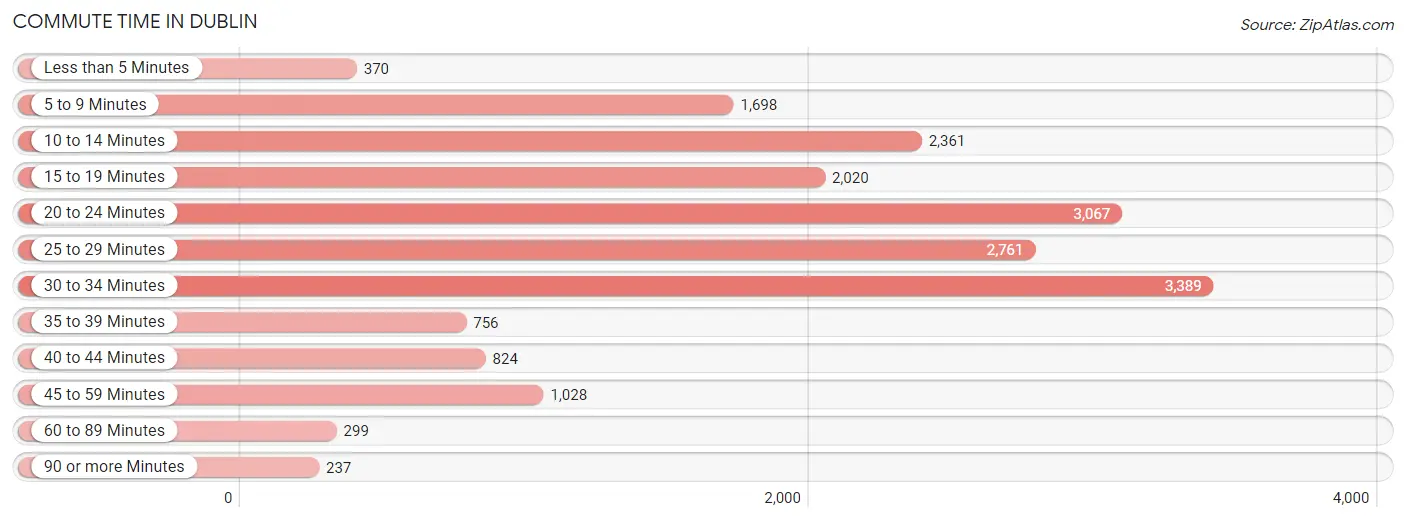
| Commute Time | # Commuters | % Commuters |
| Less than 5 Minutes | 370 | 2.0% |
| 5 to 9 Minutes | 1,698 | 9.0% |
| 10 to 14 Minutes | 2,361 | 12.6% |
| 15 to 19 Minutes | 2,020 | 10.7% |
| 20 to 24 Minutes | 3,067 | 16.3% |
| 25 to 29 Minutes | 2,761 | 14.7% |
| 30 to 34 Minutes | 3,389 | 18.0% |
| 35 to 39 Minutes | 756 | 4.0% |
| 40 to 44 Minutes | 824 | 4.4% |
| 45 to 59 Minutes | 1,028 | 5.5% |
| 60 to 89 Minutes | 299 | 1.6% |
| 90 or more Minutes | 237 | 1.3% |
Commute Time by Sex in Dublin
The most common commute times in Dublin are 30 to 34 minutes (2,187 commuters, 20.0%) for males and 20 to 24 minutes (1,313 commuters, 16.6%) for females.
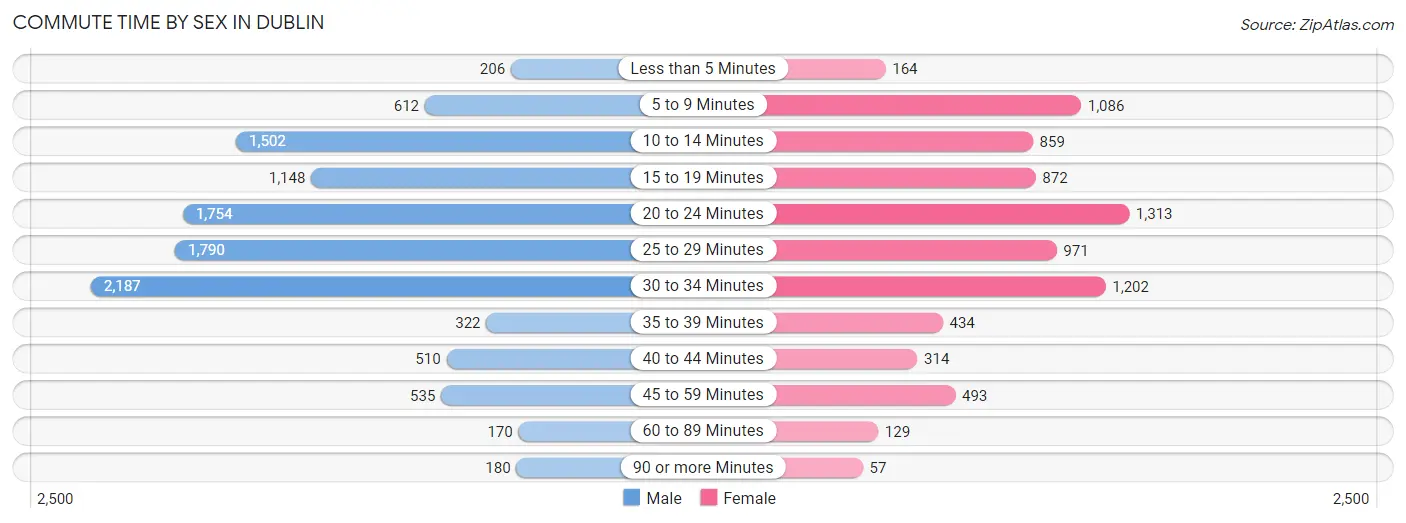
| Commute Time | Male | Female |
| Less than 5 Minutes | 206 (1.9%) | 164 (2.1%) |
| 5 to 9 Minutes | 612 (5.6%) | 1,086 (13.8%) |
| 10 to 14 Minutes | 1,502 (13.8%) | 859 (10.9%) |
| 15 to 19 Minutes | 1,148 (10.5%) | 872 (11.1%) |
| 20 to 24 Minutes | 1,754 (16.1%) | 1,313 (16.6%) |
| 25 to 29 Minutes | 1,790 (16.4%) | 971 (12.3%) |
| 30 to 34 Minutes | 2,187 (20.0%) | 1,202 (15.2%) |
| 35 to 39 Minutes | 322 (2.9%) | 434 (5.5%) |
| 40 to 44 Minutes | 510 (4.7%) | 314 (4.0%) |
| 45 to 59 Minutes | 535 (4.9%) | 493 (6.2%) |
| 60 to 89 Minutes | 170 (1.6%) | 129 (1.6%) |
| 90 or more Minutes | 180 (1.7%) | 57 (0.7%) |
Time of Departure to Work by Sex in Dublin
The most frequent times of departure to work in Dublin are 7:00 AM to 7:29 AM (1,934, 17.7%) for males and 7:00 AM to 7:29 AM (2,021, 25.6%) for females.
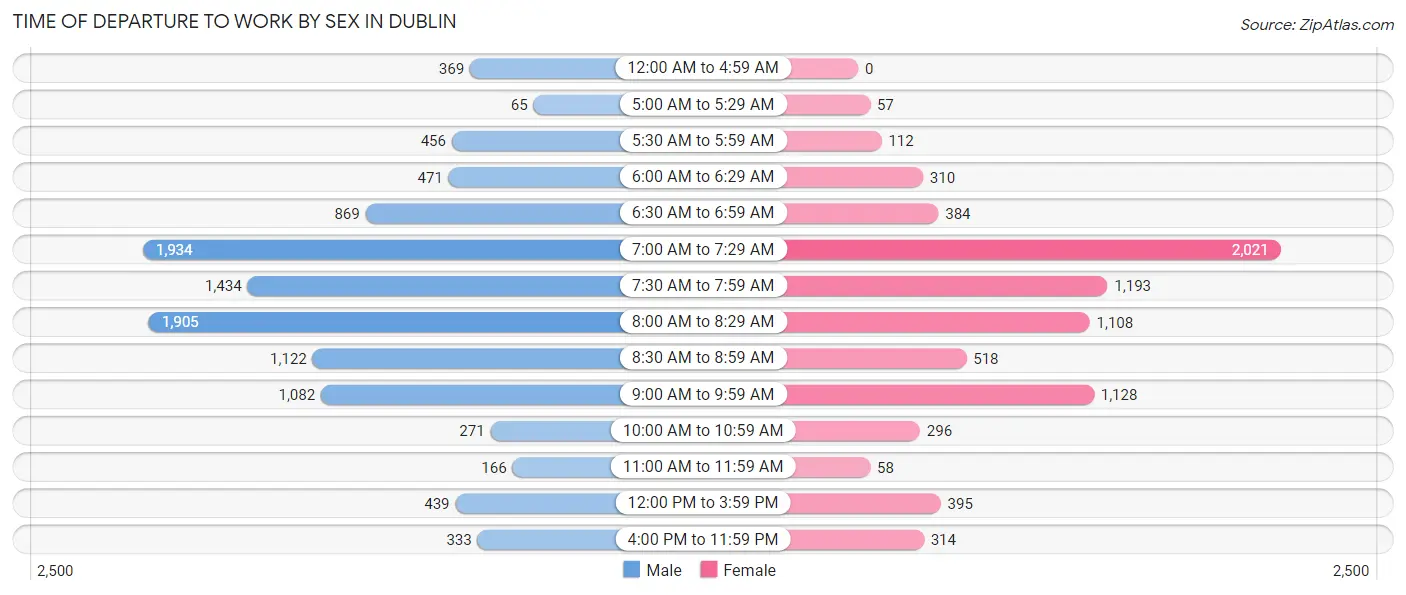
| Time of Departure | Male | Female |
| 12:00 AM to 4:59 AM | 369 (3.4%) | 0 (0.0%) |
| 5:00 AM to 5:29 AM | 65 (0.6%) | 57 (0.7%) |
| 5:30 AM to 5:59 AM | 456 (4.2%) | 112 (1.4%) |
| 6:00 AM to 6:29 AM | 471 (4.3%) | 310 (3.9%) |
| 6:30 AM to 6:59 AM | 869 (8.0%) | 384 (4.9%) |
| 7:00 AM to 7:29 AM | 1,934 (17.7%) | 2,021 (25.6%) |
| 7:30 AM to 7:59 AM | 1,434 (13.1%) | 1,193 (15.1%) |
| 8:00 AM to 8:29 AM | 1,905 (17.4%) | 1,108 (14.0%) |
| 8:30 AM to 8:59 AM | 1,122 (10.3%) | 518 (6.6%) |
| 9:00 AM to 9:59 AM | 1,082 (9.9%) | 1,128 (14.3%) |
| 10:00 AM to 10:59 AM | 271 (2.5%) | 296 (3.7%) |
| 11:00 AM to 11:59 AM | 166 (1.5%) | 58 (0.7%) |
| 12:00 PM to 3:59 PM | 439 (4.0%) | 395 (5.0%) |
| 4:00 PM to 11:59 PM | 333 (3.0%) | 314 (4.0%) |
| Total | 10,916 (100.0%) | 7,894 (100.0%) |
Housing Occupancy in Dublin
Occupancy by Ownership in Dublin
Of the total 17,697 dwellings in Dublin, owner-occupied units account for 13,598 (76.8%), while renter-occupied units make up 4,099 (23.2%).
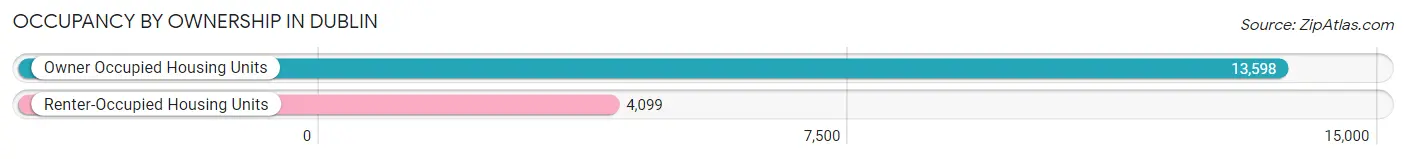
| Occupancy | # Housing Units | % Housing Units |
| Owner Occupied Housing Units | 13,598 | 76.8% |
| Renter-Occupied Housing Units | 4,099 | 23.2% |
| Total Occupied Housing Units | 17,697 | 100.0% |
Occupancy by Household Size in Dublin
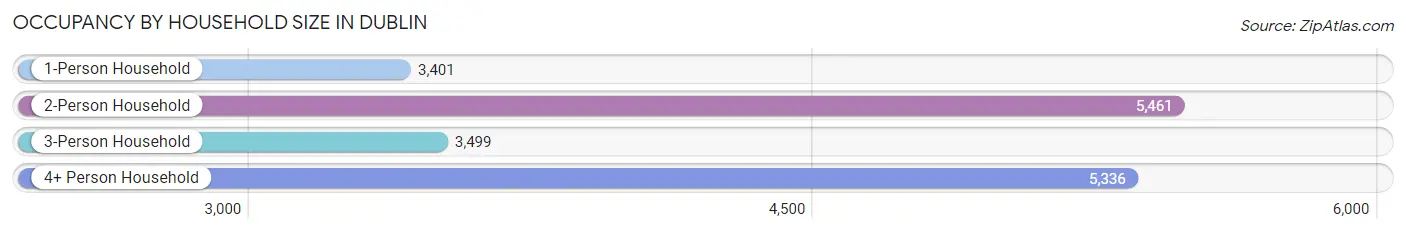
| Household Size | # Housing Units | % Housing Units |
| 1-Person Household | 3,401 | 19.2% |
| 2-Person Household | 5,461 | 30.9% |
| 3-Person Household | 3,499 | 19.8% |
| 4+ Person Household | 5,336 | 30.1% |
| Total Housing Units | 17,697 | 100.0% |
Occupancy by Ownership by Household Size in Dublin
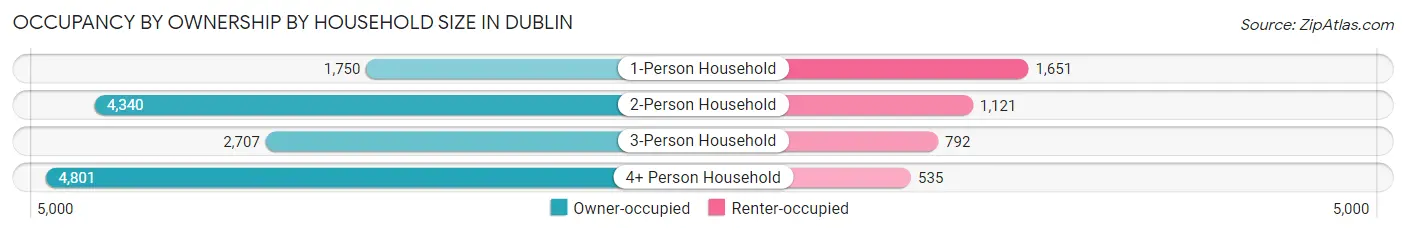
| Household Size | Owner-occupied | Renter-occupied |
| 1-Person Household | 1,750 (51.5%) | 1,651 (48.5%) |
| 2-Person Household | 4,340 (79.5%) | 1,121 (20.5%) |
| 3-Person Household | 2,707 (77.4%) | 792 (22.6%) |
| 4+ Person Household | 4,801 (90.0%) | 535 (10.0%) |
| Total Housing Units | 13,598 (76.8%) | 4,099 (23.2%) |
Occupancy by Educational Attainment in Dublin
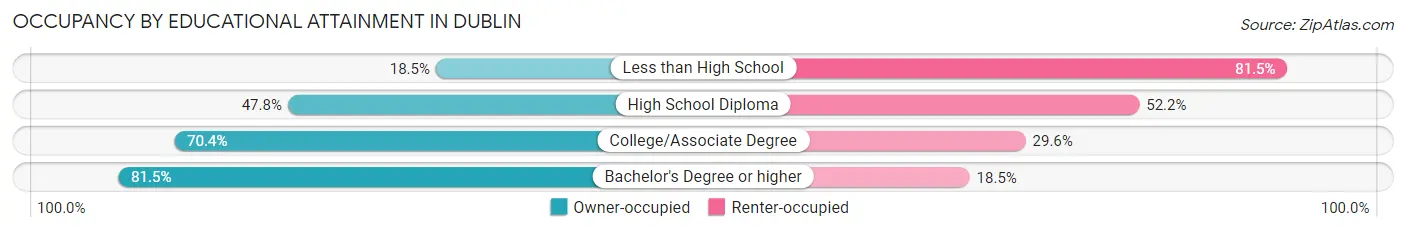
| Household Size | Owner-occupied | Renter-occupied |
| Less than High School | 61 (18.5%) | 269 (81.5%) |
| High School Diploma | 528 (47.8%) | 576 (52.2%) |
| College/Associate Degree | 1,515 (70.4%) | 638 (29.6%) |
| Bachelor's Degree or higher | 11,494 (81.5%) | 2,616 (18.5%) |
Occupancy by Age of Householder in Dublin
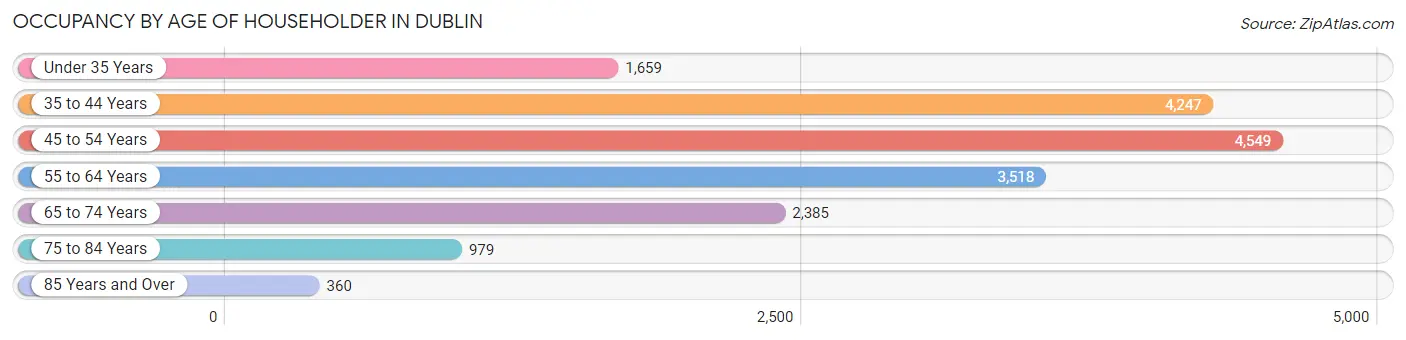
| Age Bracket | # Households | % Households |
| Under 35 Years | 1,659 | 9.4% |
| 35 to 44 Years | 4,247 | 24.0% |
| 45 to 54 Years | 4,549 | 25.7% |
| 55 to 64 Years | 3,518 | 19.9% |
| 65 to 74 Years | 2,385 | 13.5% |
| 75 to 84 Years | 979 | 5.5% |
| 85 Years and Over | 360 | 2.0% |
| Total | 17,697 | 100.0% |
Housing Finances in Dublin
Median Income by Occupancy in Dublin
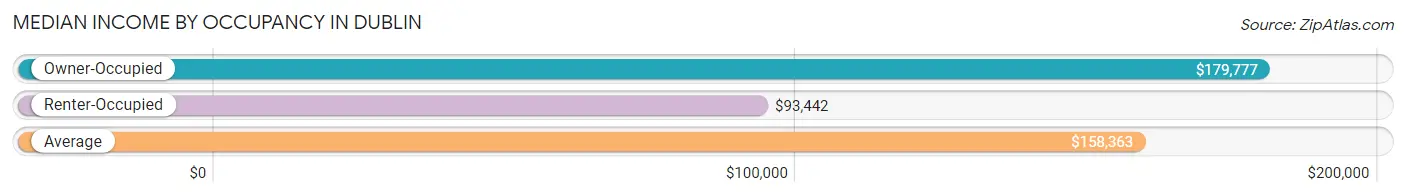
| Occupancy Type | # Households | Median Income |
| Owner-Occupied | 13,598 (76.8%) | $179,777 |
| Renter-Occupied | 4,099 (23.2%) | $93,442 |
| Average | 17,697 (100.0%) | $158,363 |
Occupancy by Householder Income Bracket in Dublin
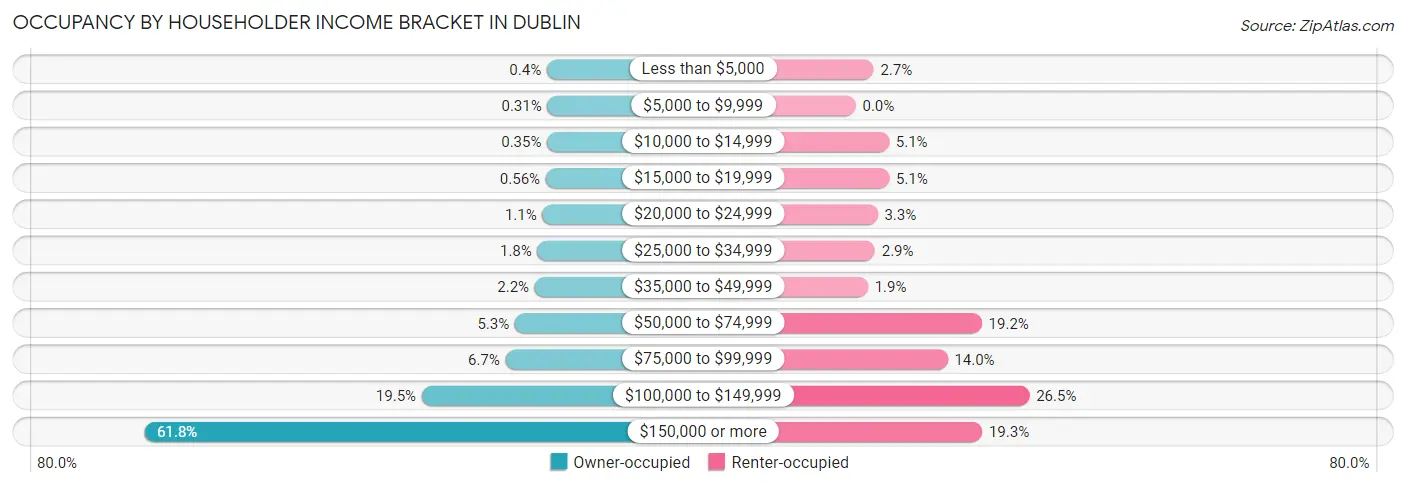
| Income Bracket | Owner-occupied | Renter-occupied |
| Less than $5,000 | 55 (0.4%) | 112 (2.7%) |
| $5,000 to $9,999 | 42 (0.3%) | 0 (0.0%) |
| $10,000 to $14,999 | 48 (0.4%) | 208 (5.1%) |
| $15,000 to $19,999 | 76 (0.6%) | 209 (5.1%) |
| $20,000 to $24,999 | 145 (1.1%) | 137 (3.3%) |
| $25,000 to $34,999 | 249 (1.8%) | 120 (2.9%) |
| $35,000 to $49,999 | 305 (2.2%) | 76 (1.8%) |
| $50,000 to $74,999 | 716 (5.3%) | 788 (19.2%) |
| $75,000 to $99,999 | 911 (6.7%) | 574 (14.0%) |
| $100,000 to $149,999 | 2,646 (19.5%) | 1,085 (26.5%) |
| $150,000 or more | 8,405 (61.8%) | 790 (19.3%) |
| Total | 13,598 (100.0%) | 4,099 (100.0%) |
Monthly Housing Cost Tiers in Dublin
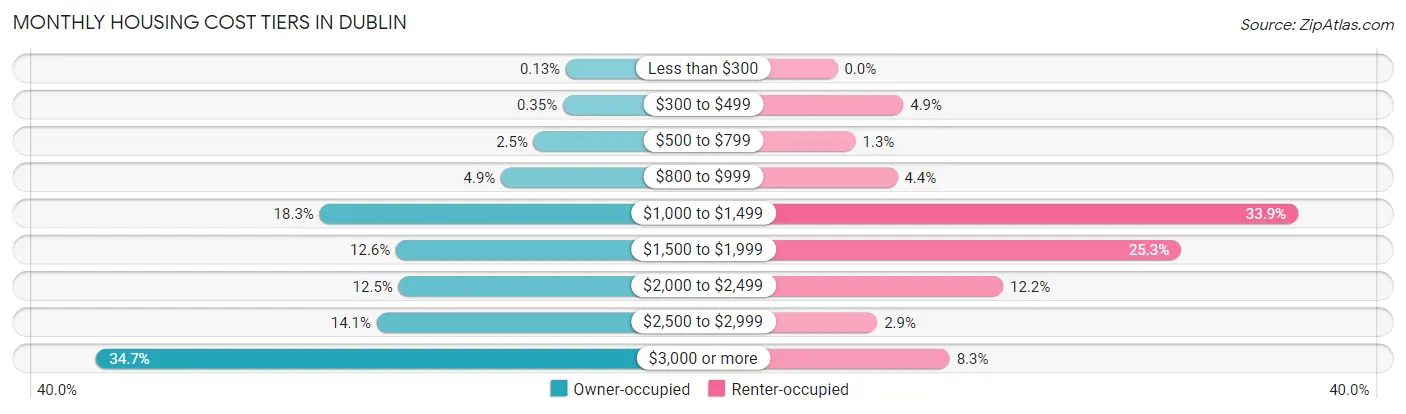
| Monthly Cost | Owner-occupied | Renter-occupied |
| Less than $300 | 17 (0.1%) | 0 (0.0%) |
| $300 to $499 | 47 (0.4%) | 199 (4.9%) |
| $500 to $799 | 340 (2.5%) | 55 (1.3%) |
| $800 to $999 | 666 (4.9%) | 181 (4.4%) |
| $1,000 to $1,499 | 2,484 (18.3%) | 1,390 (33.9%) |
| $1,500 to $1,999 | 1,719 (12.6%) | 1,037 (25.3%) |
| $2,000 to $2,499 | 1,693 (12.4%) | 500 (12.2%) |
| $2,500 to $2,999 | 1,912 (14.1%) | 120 (2.9%) |
| $3,000 or more | 4,720 (34.7%) | 339 (8.3%) |
| Total | 13,598 (100.0%) | 4,099 (100.0%) |
Physical Housing Characteristics in Dublin
Housing Structures in Dublin
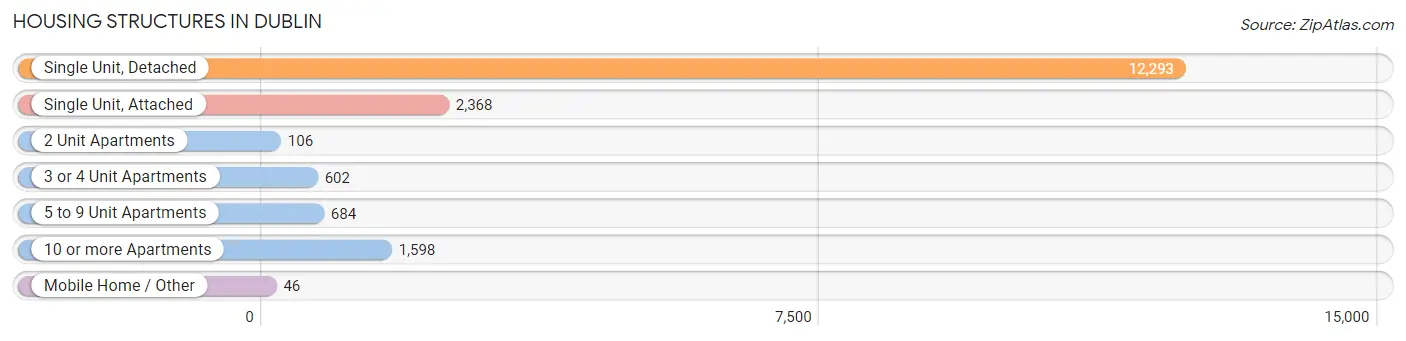
| Structure Type | # Housing Units | % Housing Units |
| Single Unit, Detached | 12,293 | 69.5% |
| Single Unit, Attached | 2,368 | 13.4% |
| 2 Unit Apartments | 106 | 0.6% |
| 3 or 4 Unit Apartments | 602 | 3.4% |
| 5 to 9 Unit Apartments | 684 | 3.9% |
| 10 or more Apartments | 1,598 | 9.0% |
| Mobile Home / Other | 46 | 0.3% |
| Total | 17,697 | 100.0% |
Housing Structures by Occupancy in Dublin
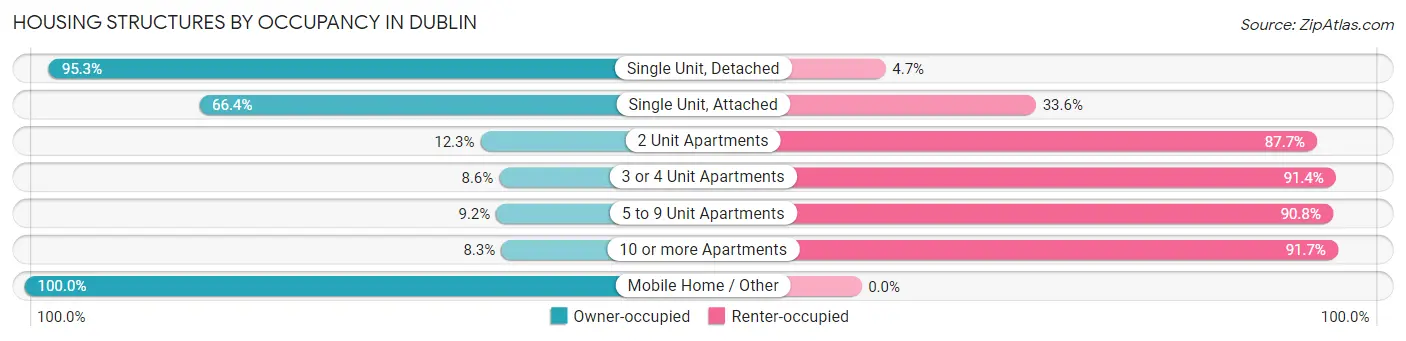
| Structure Type | Owner-occupied | Renter-occupied |
| Single Unit, Detached | 11,720 (95.3%) | 573 (4.7%) |
| Single Unit, Attached | 1,572 (66.4%) | 796 (33.6%) |
| 2 Unit Apartments | 13 (12.3%) | 93 (87.7%) |
| 3 or 4 Unit Apartments | 52 (8.6%) | 550 (91.4%) |
| 5 to 9 Unit Apartments | 63 (9.2%) | 621 (90.8%) |
| 10 or more Apartments | 132 (8.3%) | 1,466 (91.7%) |
| Mobile Home / Other | 46 (100.0%) | 0 (0.0%) |
| Total | 13,598 (76.8%) | 4,099 (23.2%) |
Housing Structures by Number of Rooms in Dublin
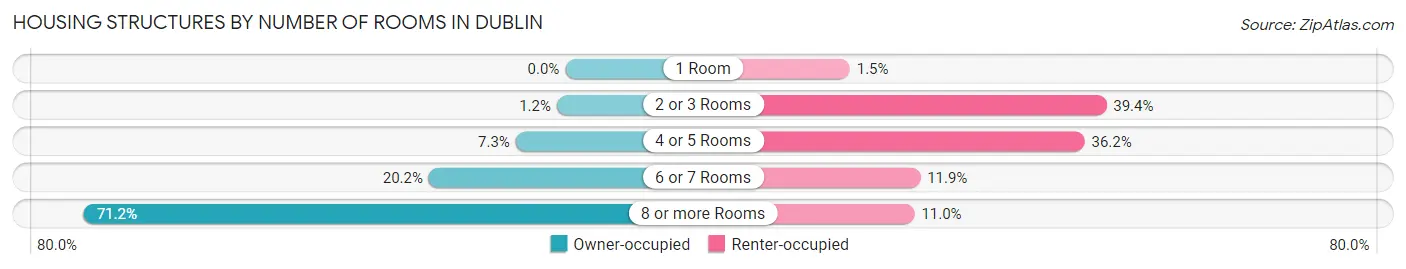
| Number of Rooms | Owner-occupied | Renter-occupied |
| 1 Room | 0 (0.0%) | 60 (1.5%) |
| 2 or 3 Rooms | 169 (1.2%) | 1,616 (39.4%) |
| 4 or 5 Rooms | 997 (7.3%) | 1,484 (36.2%) |
| 6 or 7 Rooms | 2,745 (20.2%) | 487 (11.9%) |
| 8 or more Rooms | 9,687 (71.2%) | 452 (11.0%) |
| Total | 13,598 (100.0%) | 4,099 (100.0%) |
Housing Structure by Heating Type in Dublin
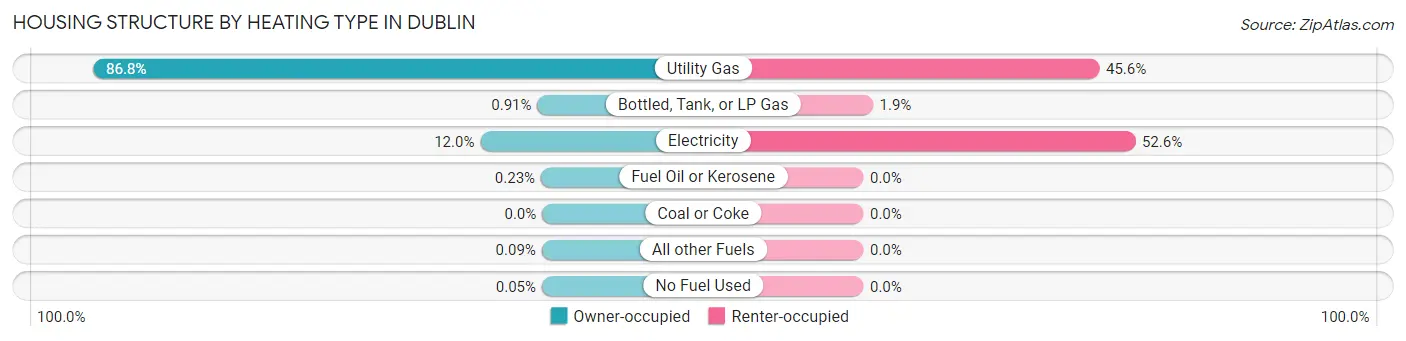
| Heating Type | Owner-occupied | Renter-occupied |
| Utility Gas | 11,797 (86.8%) | 1,869 (45.6%) |
| Bottled, Tank, or LP Gas | 124 (0.9%) | 76 (1.8%) |
| Electricity | 1,627 (12.0%) | 2,154 (52.5%) |
| Fuel Oil or Kerosene | 31 (0.2%) | 0 (0.0%) |
| Coal or Coke | 0 (0.0%) | 0 (0.0%) |
| All other Fuels | 12 (0.1%) | 0 (0.0%) |
| No Fuel Used | 7 (0.1%) | 0 (0.0%) |
| Total | 13,598 (100.0%) | 4,099 (100.0%) |
Household Vehicle Usage in Dublin
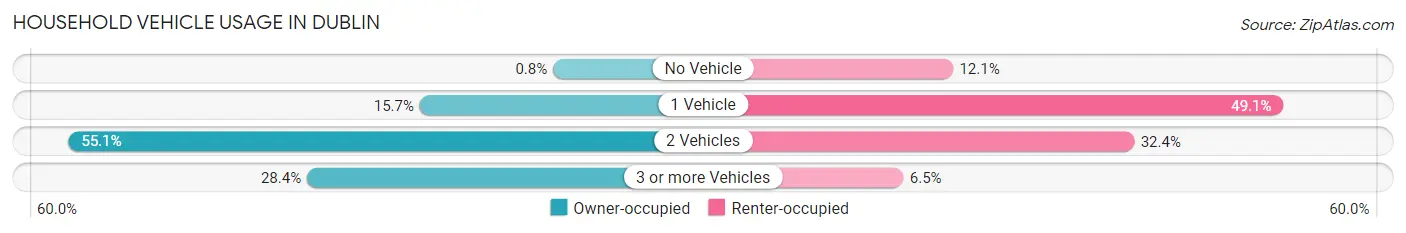
| Vehicles per Household | Owner-occupied | Renter-occupied |
| No Vehicle | 109 (0.8%) | 494 (12.0%) |
| 1 Vehicle | 2,139 (15.7%) | 2,013 (49.1%) |
| 2 Vehicles | 7,492 (55.1%) | 1,326 (32.4%) |
| 3 or more Vehicles | 3,858 (28.4%) | 266 (6.5%) |
| Total | 13,598 (100.0%) | 4,099 (100.0%) |
Real Estate & Mortgages in Dublin
Real Estate and Mortgage Overview in Dublin
| Characteristic | Without Mortgage | With Mortgage |
| Housing Units | 4,320 | 9,278 |
| Median Property Value | $460,500 | $486,800 |
| Median Household Income | $136,108 | $6,459 |
| Monthly Housing Costs | $1,281 | $4,644 |
| Real Estate Taxes | $9,458 | $26 |
Property Value by Mortgage Status in Dublin
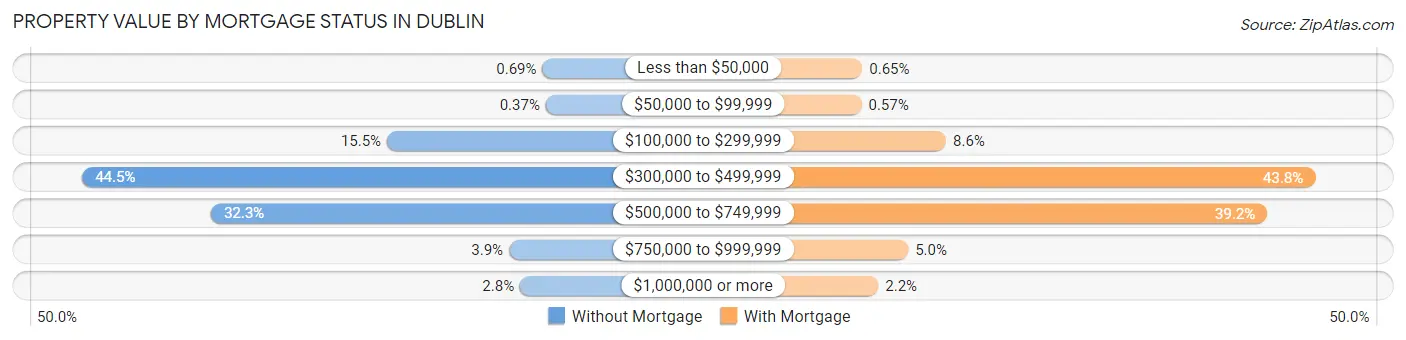
| Property Value | Without Mortgage | With Mortgage |
| Less than $50,000 | 30 (0.7%) | 60 (0.6%) |
| $50,000 to $99,999 | 16 (0.4%) | 53 (0.6%) |
| $100,000 to $299,999 | 669 (15.5%) | 800 (8.6%) |
| $300,000 to $499,999 | 1,923 (44.5%) | 4,061 (43.8%) |
| $500,000 to $749,999 | 1,393 (32.3%) | 3,637 (39.2%) |
| $750,000 to $999,999 | 167 (3.9%) | 466 (5.0%) |
| $1,000,000 or more | 122 (2.8%) | 201 (2.2%) |
| Total | 4,320 (100.0%) | 9,278 (100.0%) |
Household Income by Mortgage Status in Dublin
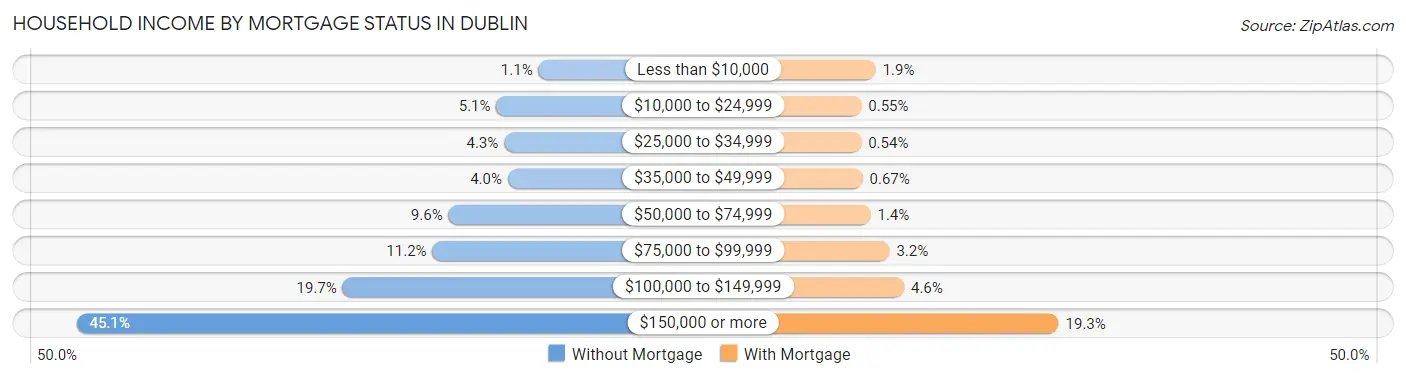
| Household Income | Without Mortgage | With Mortgage |
| Less than $10,000 | 46 (1.1%) | 178 (1.9%) |
| $10,000 to $24,999 | 219 (5.1%) | 51 (0.5%) |
| $25,000 to $34,999 | 187 (4.3%) | 50 (0.5%) |
| $35,000 to $49,999 | 172 (4.0%) | 62 (0.7%) |
| $50,000 to $74,999 | 416 (9.6%) | 133 (1.4%) |
| $75,000 to $99,999 | 482 (11.2%) | 300 (3.2%) |
| $100,000 to $149,999 | 852 (19.7%) | 429 (4.6%) |
| $150,000 or more | 1,946 (45.1%) | 1,794 (19.3%) |
| Total | 4,320 (100.0%) | 9,278 (100.0%) |
Property Value to Household Income Ratio in Dublin
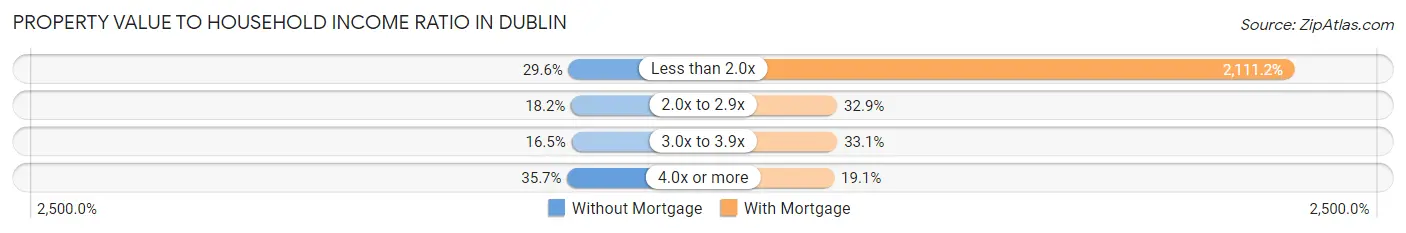
| Value-to-Income Ratio | Without Mortgage | With Mortgage |
| Less than 2.0x | 1,277 (29.6%) | 195,873 (2,111.2%) |
| 2.0x to 2.9x | 787 (18.2%) | 3,054 (32.9%) |
| 3.0x to 3.9x | 713 (16.5%) | 3,066 (33.1%) |
| 4.0x or more | 1,543 (35.7%) | 1,775 (19.1%) |
| Total | 4,320 (100.0%) | 9,278 (100.0%) |
Real Estate Taxes by Mortgage Status in Dublin

| Property Taxes | Without Mortgage | With Mortgage |
| Less than $800 | 46 (1.1%) | 0 (0.0%) |
| $800 to $1,499 | 33 (0.8%) | 62 (0.7%) |
| $800 to $1,499 | 4,224 (97.8%) | 136 (1.5%) |
| Total | 4,320 (100.0%) | 9,278 (100.0%) |
Health & Disability in Dublin
Health Insurance Coverage by Age in Dublin
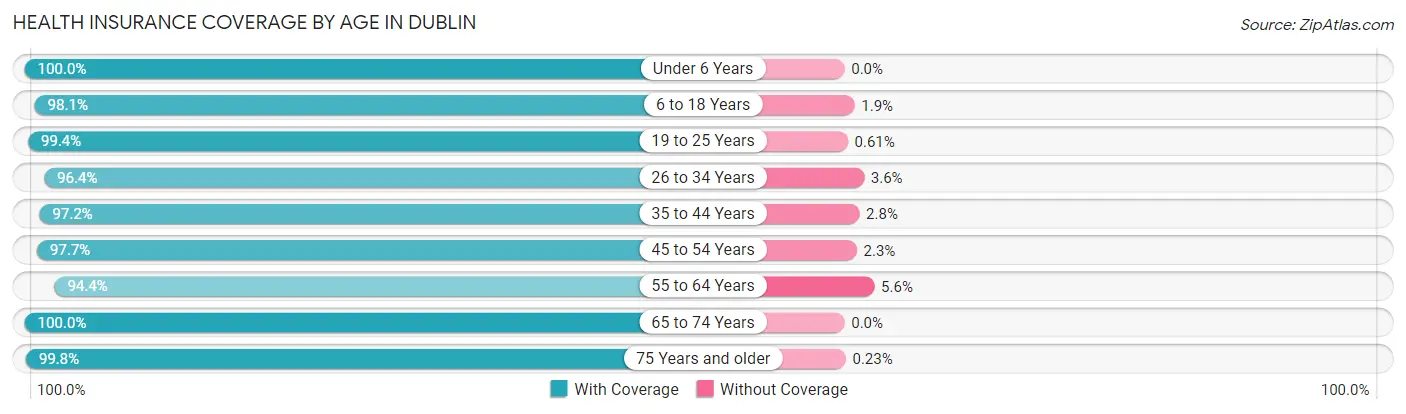
| Age Bracket | With Coverage | Without Coverage |
| Under 6 Years | 3,167 (100.0%) | 0 (0.0%) |
| 6 to 18 Years | 10,944 (98.1%) | 210 (1.9%) |
| 19 to 25 Years | 1,965 (99.4%) | 12 (0.6%) |
| 26 to 34 Years | 3,363 (96.4%) | 127 (3.6%) |
| 35 to 44 Years | 7,662 (97.2%) | 218 (2.8%) |
| 45 to 54 Years | 7,996 (97.7%) | 188 (2.3%) |
| 55 to 64 Years | 6,019 (94.4%) | 355 (5.6%) |
| 65 to 74 Years | 4,218 (100.0%) | 0 (0.0%) |
| 75 Years and older | 2,172 (99.8%) | 5 (0.2%) |
| Total | 47,506 (97.7%) | 1,115 (2.3%) |
Health Insurance Coverage by Citizenship Status in Dublin
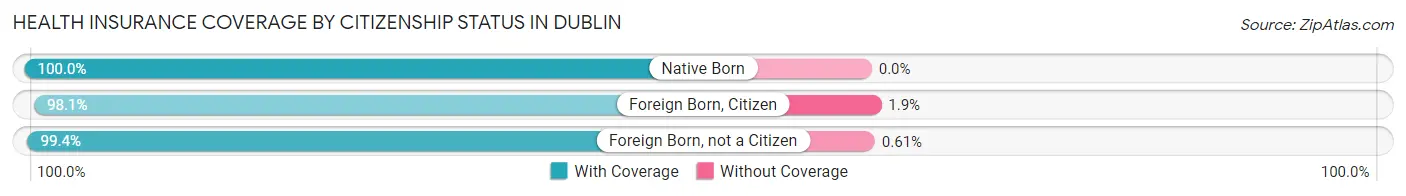
| Citizenship Status | With Coverage | Without Coverage |
| Native Born | 3,167 (100.0%) | 0 (0.0%) |
| Foreign Born, Citizen | 10,944 (98.1%) | 210 (1.9%) |
| Foreign Born, not a Citizen | 1,965 (99.4%) | 12 (0.6%) |
Health Insurance Coverage by Household Income in Dublin
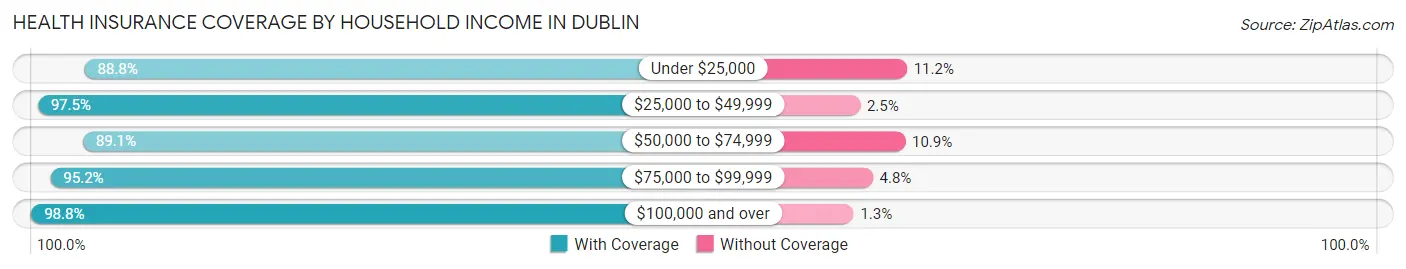
| Household Income | With Coverage | Without Coverage |
| Under $25,000 | 1,233 (88.8%) | 156 (11.2%) |
| $25,000 to $49,999 | 1,231 (97.5%) | 31 (2.5%) |
| $50,000 to $74,999 | 2,197 (89.1%) | 269 (10.9%) |
| $75,000 to $99,999 | 3,025 (95.2%) | 154 (4.8%) |
| $100,000 and over | 39,799 (98.8%) | 505 (1.3%) |
Public vs Private Health Insurance Coverage by Age in Dublin
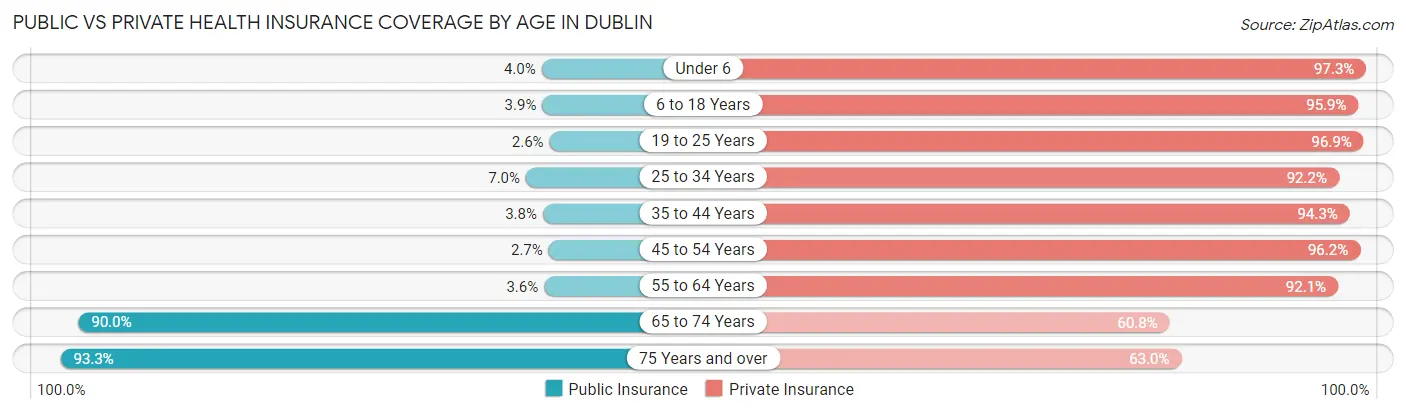
| Age Bracket | Public Insurance | Private Insurance |
| Under 6 | 128 (4.0%) | 3,082 (97.3%) |
| 6 to 18 Years | 437 (3.9%) | 10,692 (95.9%) |
| 19 to 25 Years | 51 (2.6%) | 1,915 (96.9%) |
| 25 to 34 Years | 243 (7.0%) | 3,219 (92.2%) |
| 35 to 44 Years | 300 (3.8%) | 7,428 (94.3%) |
| 45 to 54 Years | 224 (2.7%) | 7,871 (96.2%) |
| 55 to 64 Years | 228 (3.6%) | 5,869 (92.1%) |
| 65 to 74 Years | 3,797 (90.0%) | 2,566 (60.8%) |
| 75 Years and over | 2,032 (93.3%) | 1,372 (63.0%) |
| Total | 7,440 (15.3%) | 44,014 (90.5%) |
Disability Status by Sex by Age in Dublin
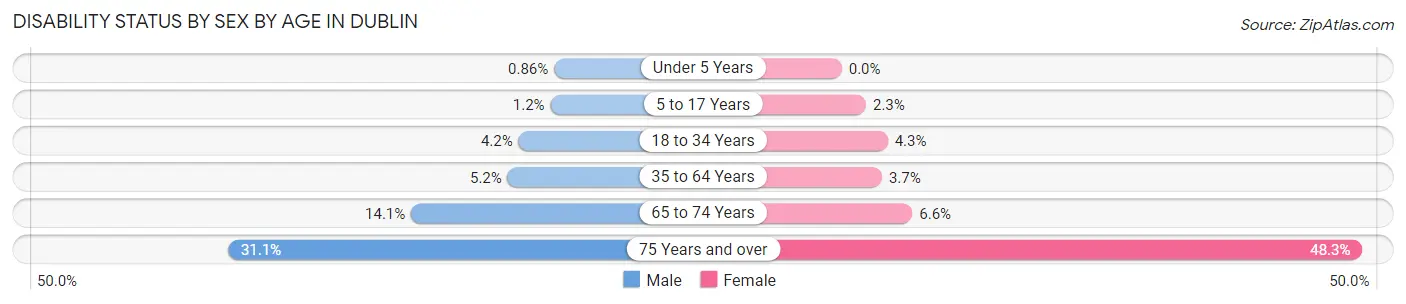
| Age Bracket | Male | Female |
| Under 5 Years | 10 (0.9%) | 0 (0.0%) |
| 5 to 17 Years | 72 (1.2%) | 116 (2.2%) |
| 18 to 34 Years | 143 (4.2%) | 118 (4.3%) |
| 35 to 64 Years | 588 (5.2%) | 413 (3.7%) |
| 65 to 74 Years | 294 (14.1%) | 140 (6.6%) |
| 75 Years and over | 349 (31.1%) | 510 (48.3%) |
Disability Class by Sex by Age in Dublin
Disability Class: Hearing Difficulty
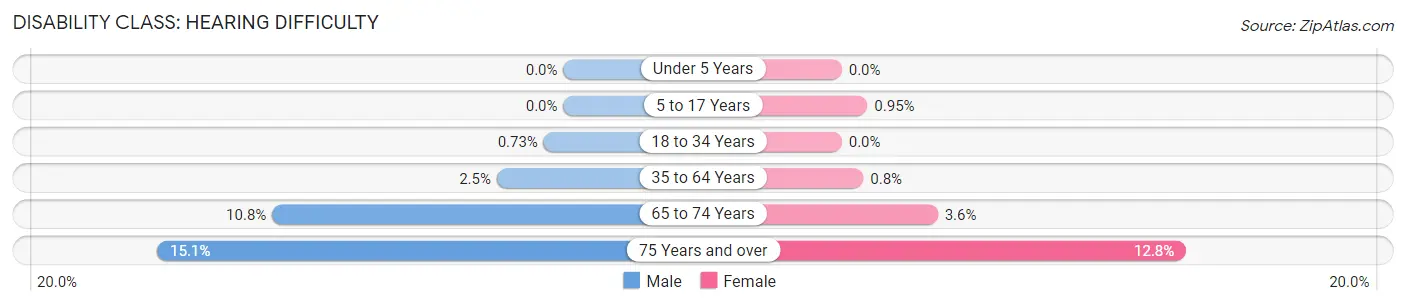
| Age Bracket | Male | Female |
| Under 5 Years | 0 (0.0%) | 0 (0.0%) |
| 5 to 17 Years | 0 (0.0%) | 49 (0.9%) |
| 18 to 34 Years | 25 (0.7%) | 0 (0.0%) |
| 35 to 64 Years | 281 (2.5%) | 89 (0.8%) |
| 65 to 74 Years | 225 (10.8%) | 76 (3.6%) |
| 75 Years and over | 169 (15.1%) | 135 (12.8%) |
Disability Class: Vision Difficulty
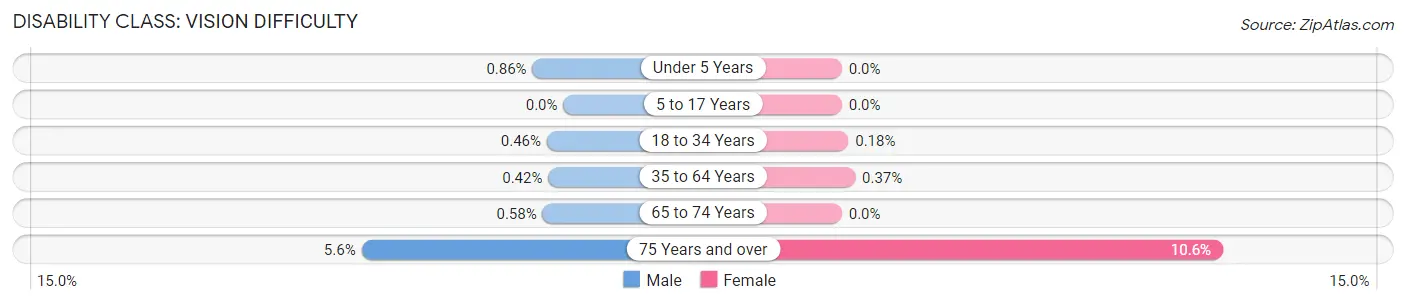
| Age Bracket | Male | Female |
| Under 5 Years | 10 (0.9%) | 0 (0.0%) |
| 5 to 17 Years | 0 (0.0%) | 0 (0.0%) |
| 18 to 34 Years | 16 (0.5%) | 5 (0.2%) |
| 35 to 64 Years | 48 (0.4%) | 41 (0.4%) |
| 65 to 74 Years | 12 (0.6%) | 0 (0.0%) |
| 75 Years and over | 63 (5.6%) | 112 (10.6%) |
Disability Class: Cognitive Difficulty
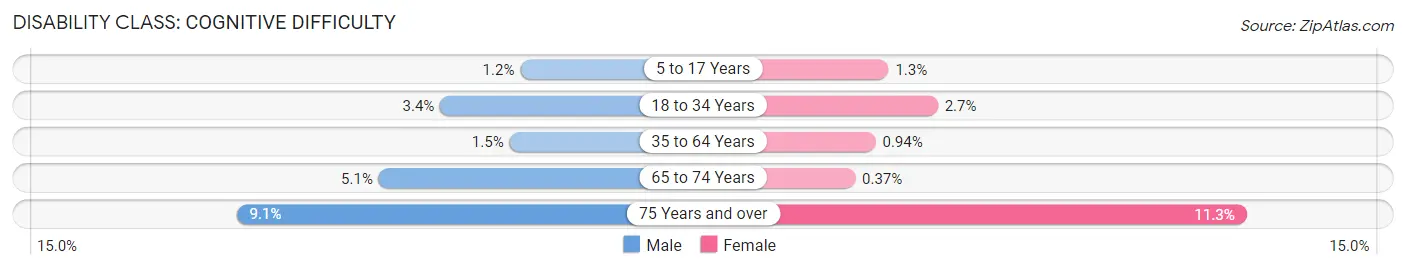
| Age Bracket | Male | Female |
| 5 to 17 Years | 72 (1.2%) | 67 (1.3%) |
| 18 to 34 Years | 118 (3.4%) | 74 (2.7%) |
| 35 to 64 Years | 170 (1.5%) | 104 (0.9%) |
| 65 to 74 Years | 107 (5.1%) | 8 (0.4%) |
| 75 Years and over | 102 (9.1%) | 119 (11.3%) |
Disability Class: Ambulatory Difficulty
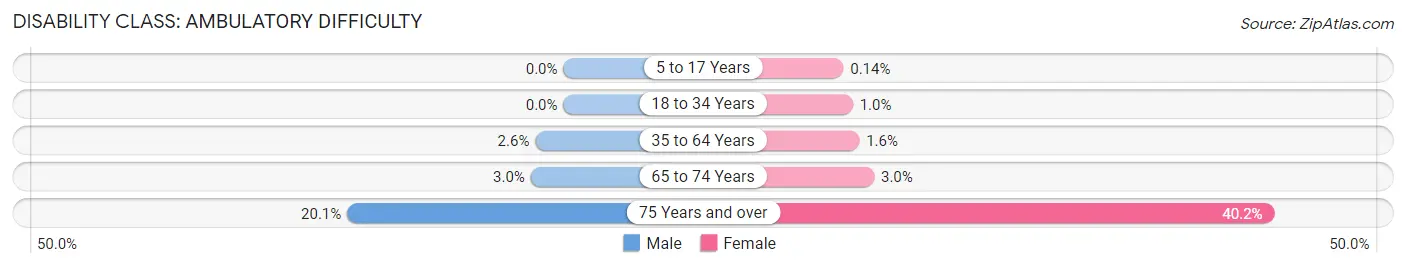
| Age Bracket | Male | Female |
| 5 to 17 Years | 0 (0.0%) | 7 (0.1%) |
| 18 to 34 Years | 0 (0.0%) | 28 (1.0%) |
| 35 to 64 Years | 297 (2.6%) | 179 (1.6%) |
| 65 to 74 Years | 63 (3.0%) | 64 (3.0%) |
| 75 Years and over | 225 (20.1%) | 424 (40.2%) |
Disability Class: Self-Care Difficulty
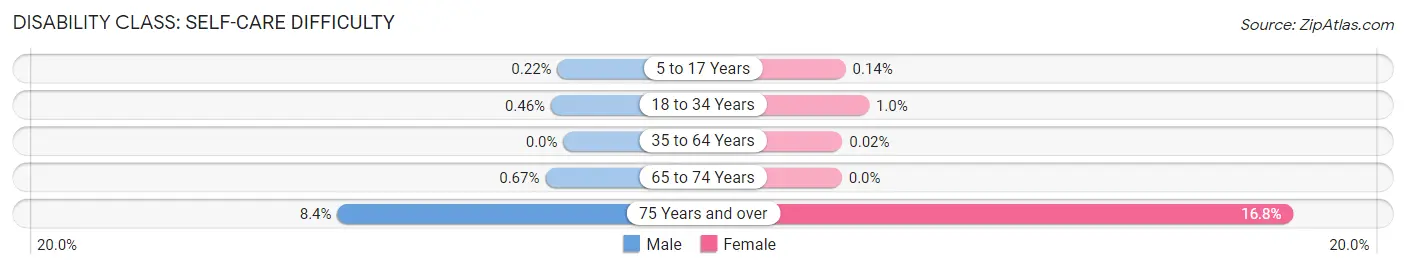
| Age Bracket | Male | Female |
| 5 to 17 Years | 13 (0.2%) | 7 (0.1%) |
| 18 to 34 Years | 16 (0.5%) | 28 (1.0%) |
| 35 to 64 Years | 0 (0.0%) | 2 (0.0%) |
| 65 to 74 Years | 14 (0.7%) | 0 (0.0%) |
| 75 Years and over | 94 (8.4%) | 177 (16.8%) |
Technology Access in Dublin
Computing Device Access in Dublin
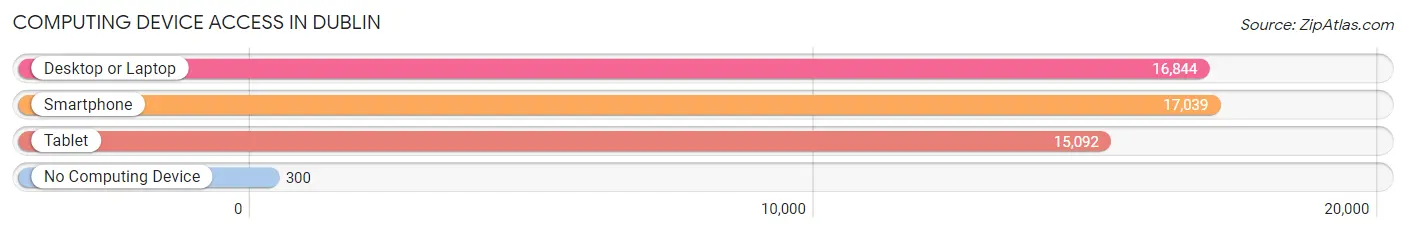
| Device Type | # Households | % Households |
| Desktop or Laptop | 16,844 | 95.2% |
| Smartphone | 17,039 | 96.3% |
| Tablet | 15,092 | 85.3% |
| No Computing Device | 300 | 1.7% |
| Total | 17,697 | 100.0% |
Internet Access in Dublin
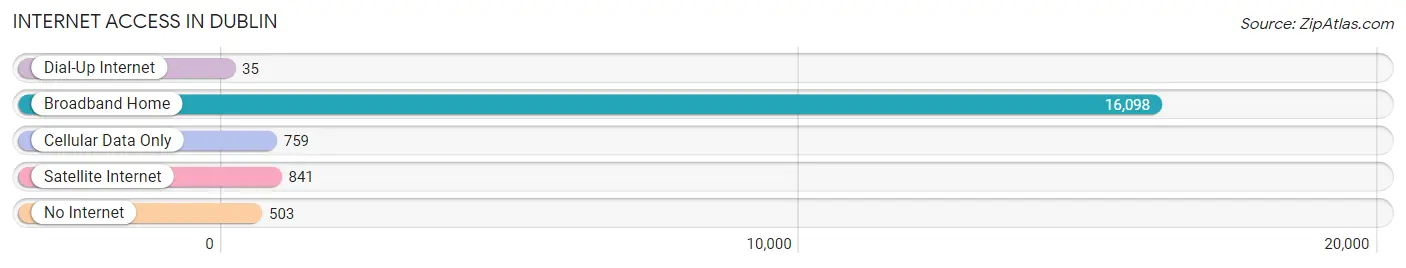
| Internet Type | # Households | % Households |
| Dial-Up Internet | 35 | 0.2% |
| Broadband Home | 16,098 | 91.0% |
| Cellular Data Only | 759 | 4.3% |
| Satellite Internet | 841 | 4.8% |
| No Internet | 503 | 2.8% |
| Total | 17,697 | 100.0% |
Dublin Summary
Dublin, Ohio is a city located in Franklin County, Ohio, United States. It is a suburb of Columbus, the state capital, and is situated along the Scioto River. The city has a population of 46,536 as of the 2010 census, making it the second largest city in Franklin County.
History
The area that is now Dublin was first settled in 1802 by John Shields and his family. The Shields family built a log cabin near the Scioto River, and the area became known as Shields Crossroads. In 1808, the Shields family built a grist mill, which was the first business in the area. The area was officially incorporated as the village of Dublin in 1810.
In 1833, the village of Dublin was incorporated as a city. The city was named after the Irish capital of Dublin, and the city's seal was designed to resemble the Irish flag.
In the late 19th century, Dublin began to grow rapidly. The city was connected to the railroad in 1891, and the population grew from 1,000 in 1890 to 4,000 in 1900. The city continued to grow in the 20th century, and the population reached 10,000 in 1950.
Geography
Dublin is located in central Ohio, approximately 20 miles northwest of Columbus. The city is situated along the Scioto River, and is bordered by the cities of Hilliard, Powell, and Worthington. The city has a total area of 24.3 square miles, of which 24.2 square miles is land and 0.1 square miles is water.
Economy
Dublin is home to a variety of businesses and industries. The city is home to several corporate headquarters, including Cardinal Health, Wendy's, and Ashland Inc. The city is also home to several technology companies, including Oracle, Infor, and Teradata.
The city is also home to several shopping centers, including the Mall at Tuttle Crossing, Bridge Park, and the Dublin Village Center. The city is also home to several golf courses, including the Dublin Country Club and the Muirfield Village Golf Club.
Demographics
As of the 2010 census, the population of Dublin was 46,536. The racial makeup of the city was 81.2% White, 8.2% Asian, 6.2% African American, and 4.4% Hispanic or Latino. The median household income was $97,817, and the median family income was $112,817.
The city is home to a variety of religious denominations, including Catholic, Protestant, Jewish, and Muslim. The city is also home to a variety of educational institutions, including Dublin City Schools, Ohio State University, and Columbus State Community College.
Conclusion
Dublin, Ohio is a city located in Franklin County, Ohio, United States. It is a suburb of Columbus, the state capital, and is situated along the Scioto River. The city has a population of 46,536 as of the 2010 census, making it the second largest city in Franklin County. The city is home to a variety of businesses and industries, and is home to several corporate headquarters, technology companies, shopping centers, and golf courses. The city is also home to a variety of religious denominations, and educational institutions.
Common Questions
What is Per Capita Income in Dublin?
Per Capita income in Dublin is $71,551.
What is the Median Family Income in Dublin?
Median Family Income in Dublin is $175,250.
What is the Median Household income in Dublin?
Median Household Income in Dublin is $158,363.
What is Income or Wage Gap in Dublin?
Income or Wage Gap in Dublin is 45.9%.
Women in Dublin earn 54.1 cents for every dollar earned by a man.
What is Inequality or Gini Index in Dublin?
Inequality or Gini Index in Dublin is 0.41.
What is the Total Population of Dublin?
Total Population of Dublin is 48,893.
What is the Total Male Population of Dublin?
Total Male Population of Dublin is 25,182.
What is the Total Female Population of Dublin?
Total Female Population of Dublin is 23,711.
What is the Ratio of Males per 100 Females in Dublin?
There are 106.20 Males per 100 Females in Dublin.
What is the Ratio of Females per 100 Males in Dublin?
There are 94.16 Females per 100 Males in Dublin.
What is the Median Population Age in Dublin?
Median Population Age in Dublin is 41.0 Years.
What is the Average Family Size in Dublin
Average Family Size in Dublin is 3.2 People.
What is the Average Household Size in Dublin
Average Household Size in Dublin is 2.8 People.
How Large is the Labor Force in Dublin?
There are 25,716 People in the Labor Forcein in Dublin.
What is the Percentage of People in the Labor Force in Dublin?
69.4% of People are in the Labor Force in Dublin.
What is the Unemployment Rate in Dublin?
Unemployment Rate in Dublin is 2.9%.