Pigeon Creek, OH Map & Demographics
Pigeon Creek Map
Pigeon Creek Overview
$56,921
PER CAPITA INCOME
$134,000
AVG FAMILY INCOME
$134,000
AVG HOUSEHOLD INCOME
44.3%
WAGE / INCOME GAP [ % ]
55.7¢/ $1
WAGE / INCOME GAP [ $ ]
0.45
INEQUALITY / GINI INDEX
811
TOTAL POPULATION
430
MALE POPULATION
381
FEMALE POPULATION
112.86
MALES / 100 FEMALES
88.60
FEMALES / 100 MALES
34.3
MEDIAN AGE
3.6
AVG FAMILY SIZE
3.3
AVG HOUSEHOLD SIZE
408
LABOR FORCE [ PEOPLE ]
77.1%
PERCENT IN LABOR FORCE
3.2%
UNEMPLOYMENT RATE
Income in Pigeon Creek
Income Overview in Pigeon Creek
Per Capita Income in Pigeon Creek is $56,921, while median incomes of families and households are $134,000 and $134,000 respectively.
| Characteristic | Number | Measure |
| Per Capita Income | 811 | $56,921 |
| Median Family Income | 208 | $134,000 |
| Mean Family Income | 208 | $186,274 |
| Median Household Income | 244 | $134,000 |
| Mean Household Income | 244 | $180,246 |
| Income Deficit | 208 | $0 |
| Wage / Income Gap (%) | 811 | 44.35% |
| Wage / Income Gap ($) | 811 | 55.65¢ per $1 |
| Gini / Inequality Index | 811 | 0.45 |
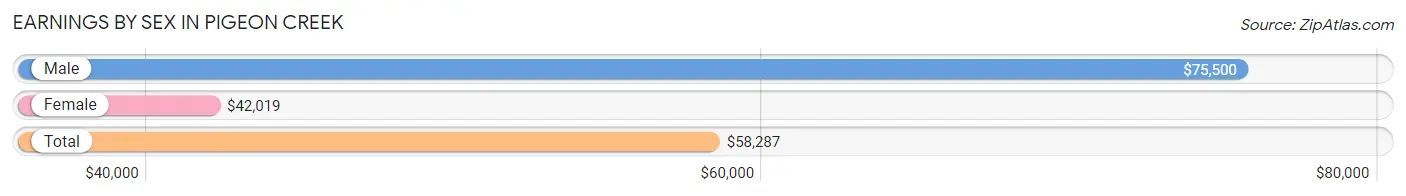
Earnings by Sex in Pigeon Creek
Average Earnings in Pigeon Creek are $58,287, $75,500 for men and $42,019 for women, a difference of 44.4%.
| Sex | Number | Average Earnings |
| Male | 246 (56.3%) | $75,500 |
| Female | 191 (43.7%) | $42,019 |
| Total | 437 (100.0%) | $58,287 |
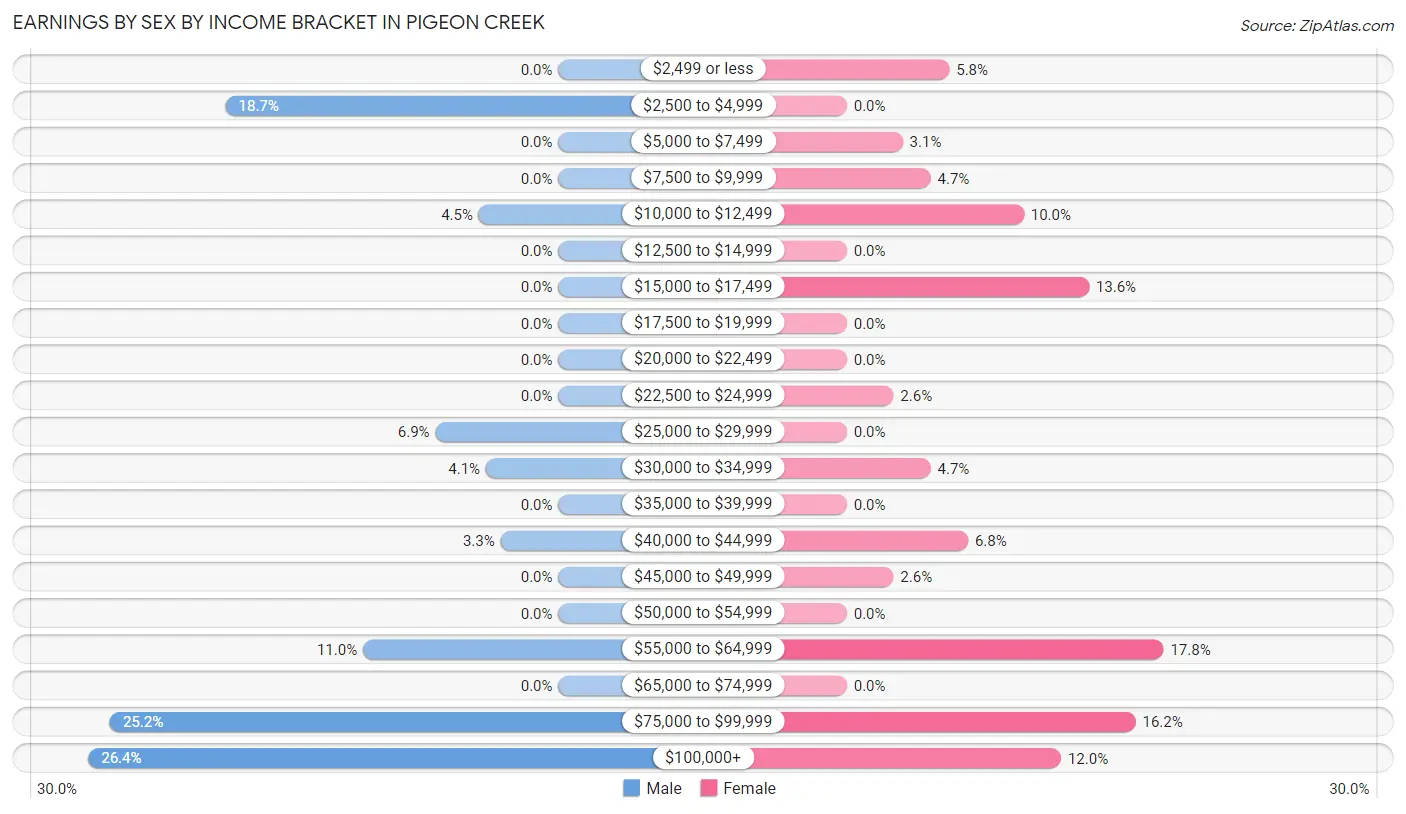
Earnings by Sex by Income Bracket in Pigeon Creek
The most common earnings brackets in Pigeon Creek are $100,000+ for men (65 | 26.4%) and $55,000 to $64,999 for women (34 | 17.8%).
| Income | Male | Female |
| $2,499 or less | 0 (0.0%) | 11 (5.8%) |
| $2,500 to $4,999 | 46 (18.7%) | 0 (0.0%) |
| $5,000 to $7,499 | 0 (0.0%) | 6 (3.1%) |
| $7,500 to $9,999 | 0 (0.0%) | 9 (4.7%) |
| $10,000 to $12,499 | 11 (4.5%) | 19 (10.0%) |
| $12,500 to $14,999 | 0 (0.0%) | 0 (0.0%) |
| $15,000 to $17,499 | 0 (0.0%) | 26 (13.6%) |
| $17,500 to $19,999 | 0 (0.0%) | 0 (0.0%) |
| $20,000 to $22,499 | 0 (0.0%) | 0 (0.0%) |
| $22,500 to $24,999 | 0 (0.0%) | 5 (2.6%) |
| $25,000 to $29,999 | 17 (6.9%) | 0 (0.0%) |
| $30,000 to $34,999 | 10 (4.1%) | 9 (4.7%) |
| $35,000 to $39,999 | 0 (0.0%) | 0 (0.0%) |
| $40,000 to $44,999 | 8 (3.3%) | 13 (6.8%) |
| $45,000 to $49,999 | 0 (0.0%) | 5 (2.6%) |
| $50,000 to $54,999 | 0 (0.0%) | 0 (0.0%) |
| $55,000 to $64,999 | 27 (11.0%) | 34 (17.8%) |
| $65,000 to $74,999 | 0 (0.0%) | 0 (0.0%) |
| $75,000 to $99,999 | 62 (25.2%) | 31 (16.2%) |
| $100,000+ | 65 (26.4%) | 23 (12.0%) |
| Total | 246 (100.0%) | 191 (100.0%) |
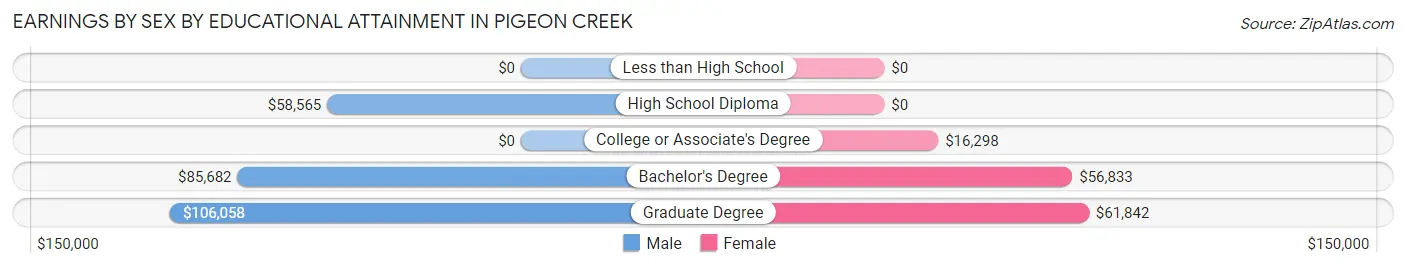
Earnings by Sex by Educational Attainment in Pigeon Creek
Average earnings in Pigeon Creek are $77,000 for men and $55,583 for women, a difference of 27.8%. Men with an educational attainment of graduate degree enjoy the highest average annual earnings of $106,058, while those with high school diploma education earn the least with $58,565. Women with an educational attainment of graduate degree earn the most with the average annual earnings of $61,842, while those with college or associate's degree education have the smallest earnings of $16,298.
| Educational Attainment | Male Income | Female Income |
| Less than High School | - | - |
| High School Diploma | $58,565 | $0 |
| College or Associate's Degree | - | - |
| Bachelor's Degree | $85,682 | $56,833 |
| Graduate Degree | $106,058 | $61,842 |
| Total | $77,000 | $55,583 |
Family Income in Pigeon Creek
Family Income Brackets in Pigeon Creek
According to the Pigeon Creek family income data, there are 57 families falling into the $75,000 to $99,999 income range, which is the most common income bracket and makes up 27.4% of all families.
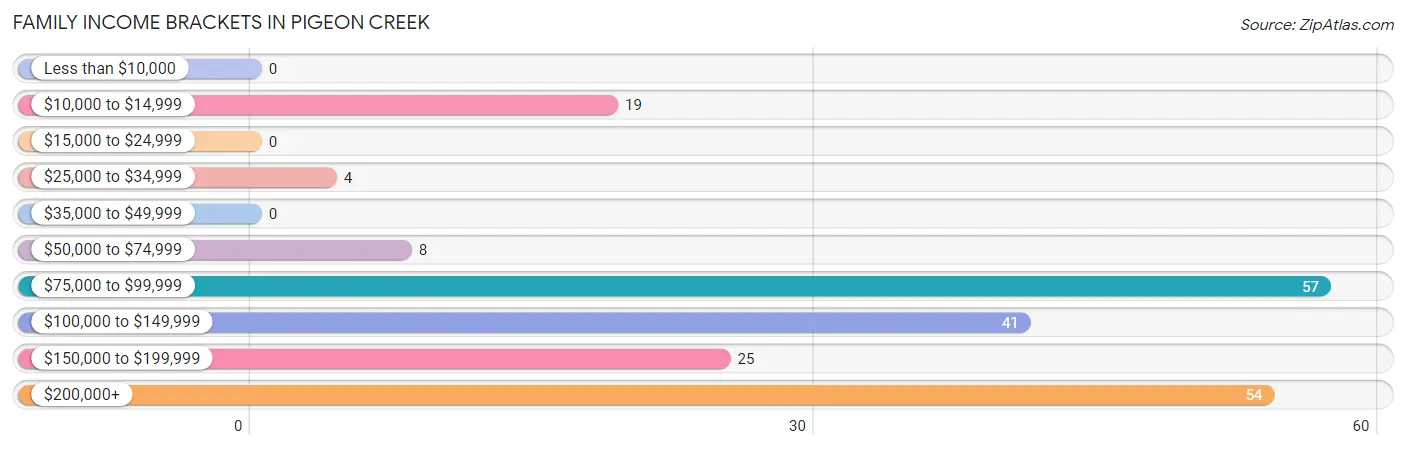
| Income Bracket | # Families | % Families |
| Less than $10,000 | 0 | 0.0% |
| $10,000 to $14,999 | 19 | 9.1% |
| $15,000 to $24,999 | 0 | 0.0% |
| $25,000 to $34,999 | 4 | 1.9% |
| $35,000 to $49,999 | 0 | 0.0% |
| $50,000 to $74,999 | 8 | 3.8% |
| $75,000 to $99,999 | 57 | 27.4% |
| $100,000 to $149,999 | 41 | 19.7% |
| $150,000 to $199,999 | 25 | 12.0% |
| $200,000+ | 54 | 26.0% |
Family Income by Famaliy Size in Pigeon Creek
4-person families (40 | 19.2%) account for the highest median family income in Pigeon Creek with $181,500 per family, while 2-person families (80 | 38.5%) have the highest median income of $55,178 per family member.
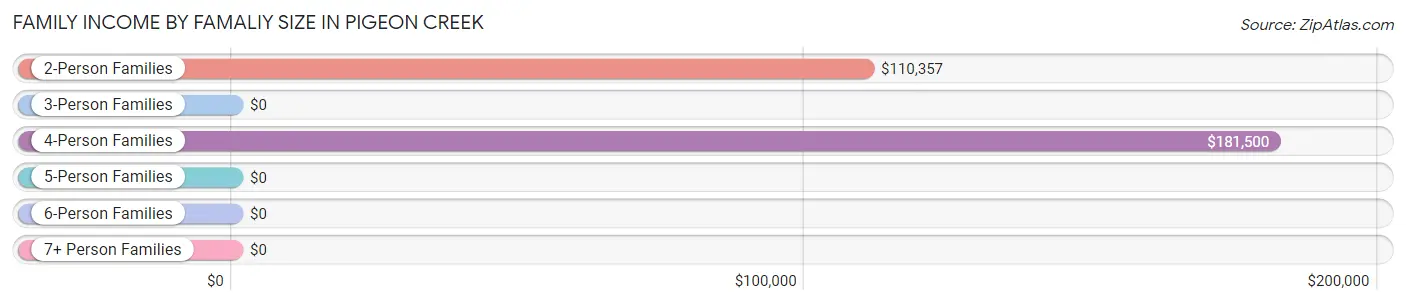
| Income Bracket | # Families | Median Income |
| 2-Person Families | 80 (38.5%) | $110,357 |
| 3-Person Families | 53 (25.5%) | $0 |
| 4-Person Families | 40 (19.2%) | $181,500 |
| 5-Person Families | 24 (11.5%) | $0 |
| 6-Person Families | 0 (0.0%) | $0 |
| 7+ Person Families | 11 (5.3%) | $0 |
| Total | 208 (100.0%) | $134,000 |
Family Income by Number of Earners in Pigeon Creek
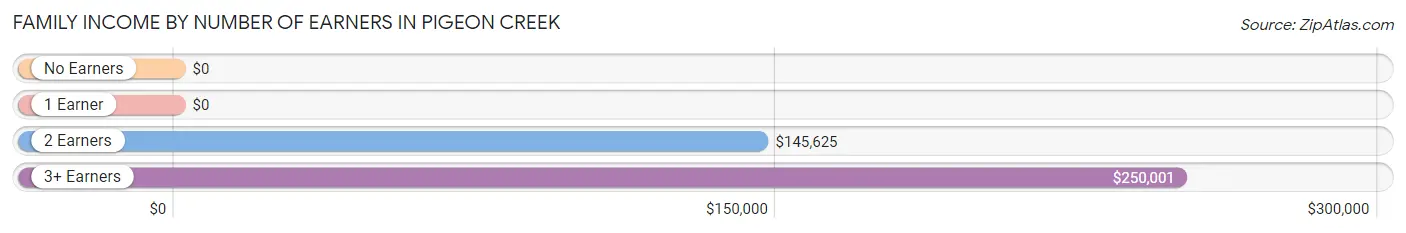
| Number of Earners | # Families | Median Income |
| No Earners | 8 (3.8%) | $0 |
| 1 Earner | 56 (26.9%) | $0 |
| 2 Earners | 123 (59.1%) | $145,625 |
| 3+ Earners | 21 (10.1%) | $250,001 |
| Total | 208 (100.0%) | $134,000 |
Household Income in Pigeon Creek
Household Income Brackets in Pigeon Creek
With 66 households falling in the category, the $75,000 to $99,999 income range is the most frequent in Pigeon Creek, accounting for 27.1% of all households.
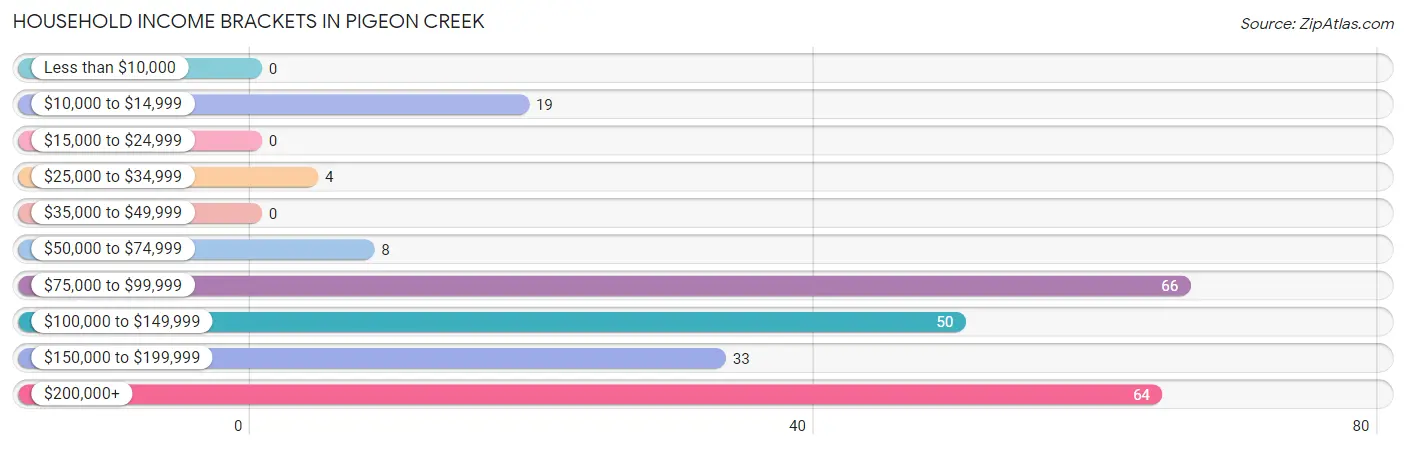
| Income Bracket | # Households | % Households |
| Less than $10,000 | 0 | 0.0% |
| $10,000 to $14,999 | 19 | 7.8% |
| $15,000 to $24,999 | 0 | 0.0% |
| $25,000 to $34,999 | 4 | 1.6% |
| $35,000 to $49,999 | 0 | 0.0% |
| $50,000 to $74,999 | 8 | 3.3% |
| $75,000 to $99,999 | 66 | 27.0% |
| $100,000 to $149,999 | 50 | 20.5% |
| $150,000 to $199,999 | 33 | 13.5% |
| $200,000+ | 64 | 26.2% |
Household Income by Householder Age in Pigeon Creek
The median household income in Pigeon Creek is $134,000, with the highest median household income of $223,462 found in the 45 to 64 years age bracket for the primary householder. A total of 58 households (23.8%) fall into this category.
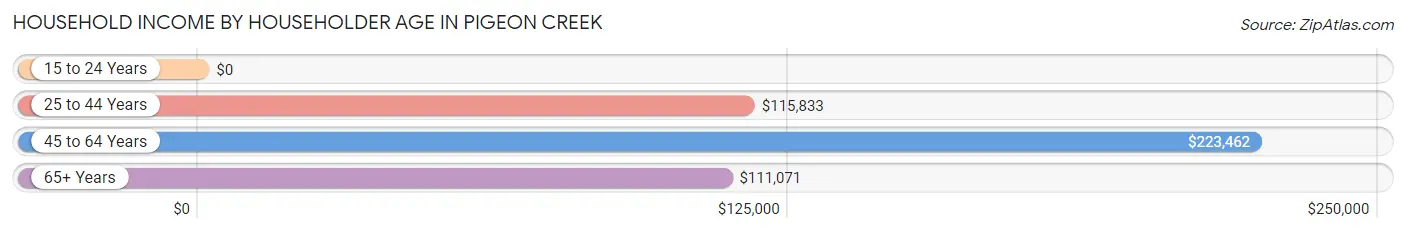
| Income Bracket | # Households | Median Income |
| 15 to 24 Years | 0 (0.0%) | $0 |
| 25 to 44 Years | 122 (50.0%) | $115,833 |
| 45 to 64 Years | 58 (23.8%) | $223,462 |
| 65+ Years | 64 (26.2%) | $111,071 |
| Total | 244 (100.0%) | $134,000 |
Poverty in Pigeon Creek
Income Below Poverty by Sex and Age in Pigeon Creek
With 1.2% poverty level for males and 21.8% for females among the residents of Pigeon Creek, 6 to 11 year old males and 6 to 11 year old females are the most vulnerable to poverty, with 5 males (4.9%) and 51 females (70.8%) in their respective age groups living below the poverty level.
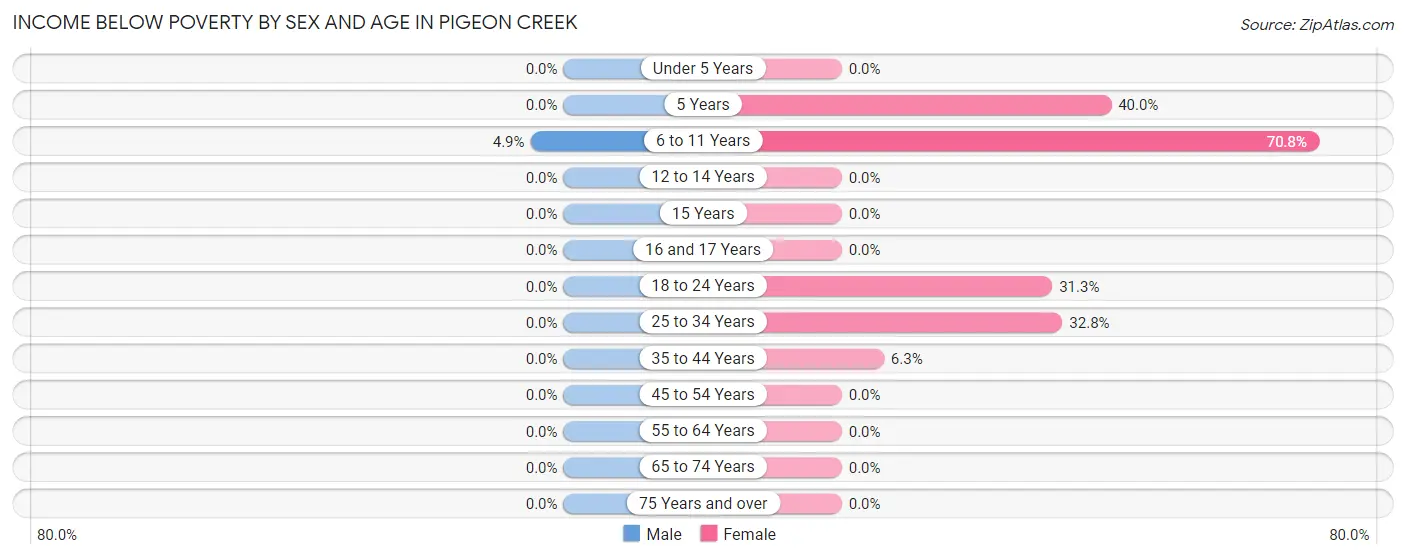
| Age Bracket | Male | Female |
| Under 5 Years | 0 (0.0%) | 0 (0.0%) |
| 5 Years | 0 (0.0%) | 4 (40.0%) |
| 6 to 11 Years | 5 (4.9%) | 51 (70.8%) |
| 12 to 14 Years | 0 (0.0%) | 0 (0.0%) |
| 15 Years | 0 (0.0%) | 0 (0.0%) |
| 16 and 17 Years | 0 (0.0%) | 0 (0.0%) |
| 18 to 24 Years | 0 (0.0%) | 5 (31.2%) |
| 25 to 34 Years | 0 (0.0%) | 19 (32.8%) |
| 35 to 44 Years | 0 (0.0%) | 4 (6.2%) |
| 45 to 54 Years | 0 (0.0%) | 0 (0.0%) |
| 55 to 64 Years | 0 (0.0%) | 0 (0.0%) |
| 65 to 74 Years | 0 (0.0%) | 0 (0.0%) |
| 75 Years and over | 0 (0.0%) | 0 (0.0%) |
| Total | 5 (1.2%) | 83 (21.8%) |
Income Above Poverty by Sex and Age in Pigeon Creek
According to the poverty statistics in Pigeon Creek, males aged under 5 years and females aged under 5 years are the age groups that are most secure financially, with 100.0% of males and 100.0% of females in these age groups living above the poverty line.
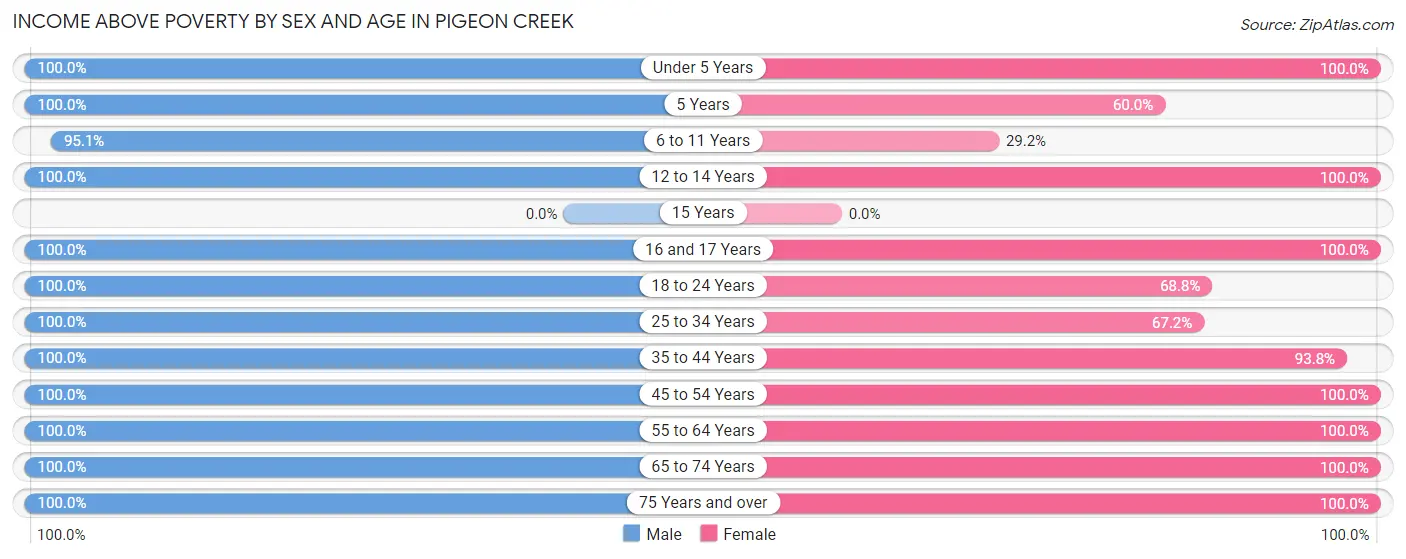
| Age Bracket | Male | Female |
| Under 5 Years | 33 (100.0%) | 13 (100.0%) |
| 5 Years | 22 (100.0%) | 6 (60.0%) |
| 6 to 11 Years | 97 (95.1%) | 21 (29.2%) |
| 12 to 14 Years | 12 (100.0%) | 18 (100.0%) |
| 15 Years | 0 (0.0%) | 0 (0.0%) |
| 16 and 17 Years | 13 (100.0%) | 6 (100.0%) |
| 18 to 24 Years | 11 (100.0%) | 11 (68.8%) |
| 25 to 34 Years | 42 (100.0%) | 39 (67.2%) |
| 35 to 44 Years | 65 (100.0%) | 60 (93.8%) |
| 45 to 54 Years | 40 (100.0%) | 33 (100.0%) |
| 55 to 64 Years | 35 (100.0%) | 43 (100.0%) |
| 65 to 74 Years | 39 (100.0%) | 26 (100.0%) |
| 75 Years and over | 16 (100.0%) | 22 (100.0%) |
| Total | 425 (98.8%) | 298 (78.2%) |
Income Below Poverty Among Married-Couple Families in Pigeon Creek
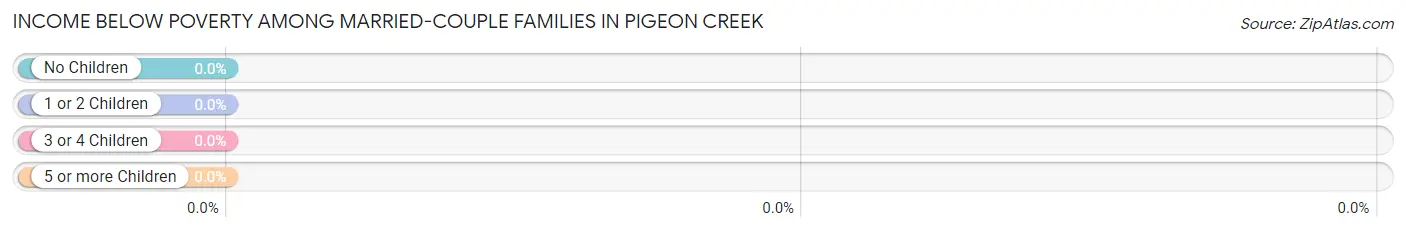
| Children | Above Poverty | Below Poverty |
| No Children | 81 (100.0%) | 0 (0.0%) |
| 1 or 2 Children | 52 (100.0%) | 0 (0.0%) |
| 3 or 4 Children | 24 (100.0%) | 0 (0.0%) |
| 5 or more Children | 11 (100.0%) | 0 (0.0%) |
| Total | 168 (100.0%) | 0 (0.0%) |
Income Below Poverty Among Single-Parent Households in Pigeon Creek
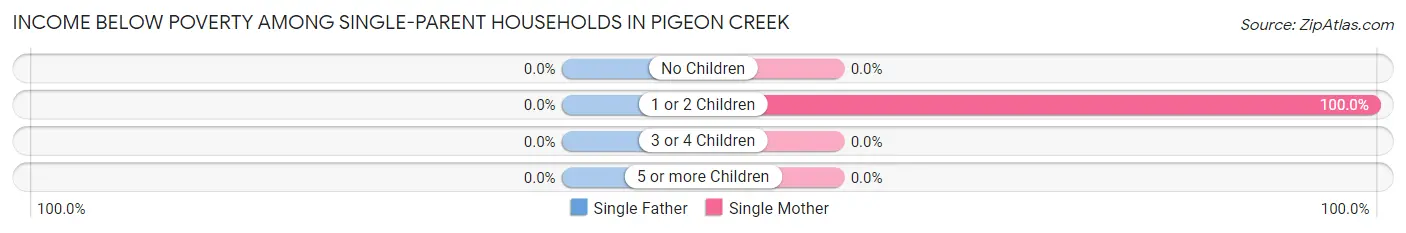
| Children | Single Father | Single Mother |
| No Children | 0 (0.0%) | 0 (0.0%) |
| 1 or 2 Children | 0 (0.0%) | 23 (100.0%) |
| 3 or 4 Children | 0 (0.0%) | 0 (0.0%) |
| 5 or more Children | 0 (0.0%) | 0 (0.0%) |
| Total | 0 (0.0%) | 23 (71.9%) |
Income Below Poverty Among Married-Couple vs Single-Parent Households in Pigeon Creek
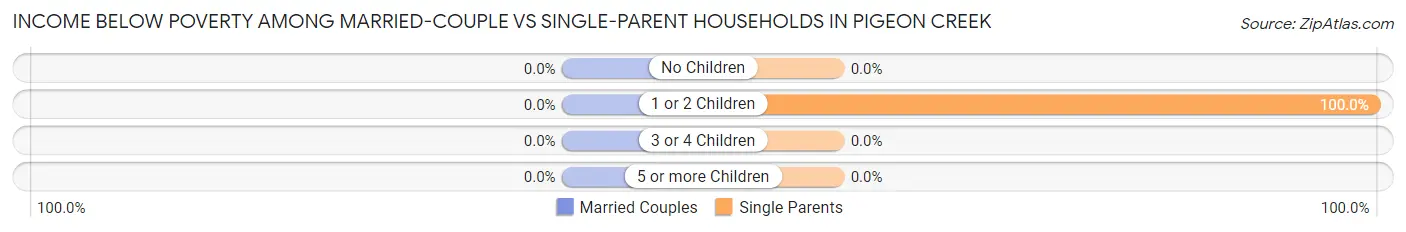
| Children | Married-Couple Families | Single-Parent Households |
| No Children | 0 (0.0%) | 0 (0.0%) |
| 1 or 2 Children | 0 (0.0%) | 23 (100.0%) |
| 3 or 4 Children | 0 (0.0%) | 0 (0.0%) |
| 5 or more Children | 0 (0.0%) | 0 (0.0%) |
| Total | 0 (0.0%) | 23 (57.5%) |
Race in Pigeon Creek
The most populous races in Pigeon Creek are White / Caucasian (661 | 81.5%), Two or more Races (80 | 9.9%), and Black / African American (70 | 8.6%).
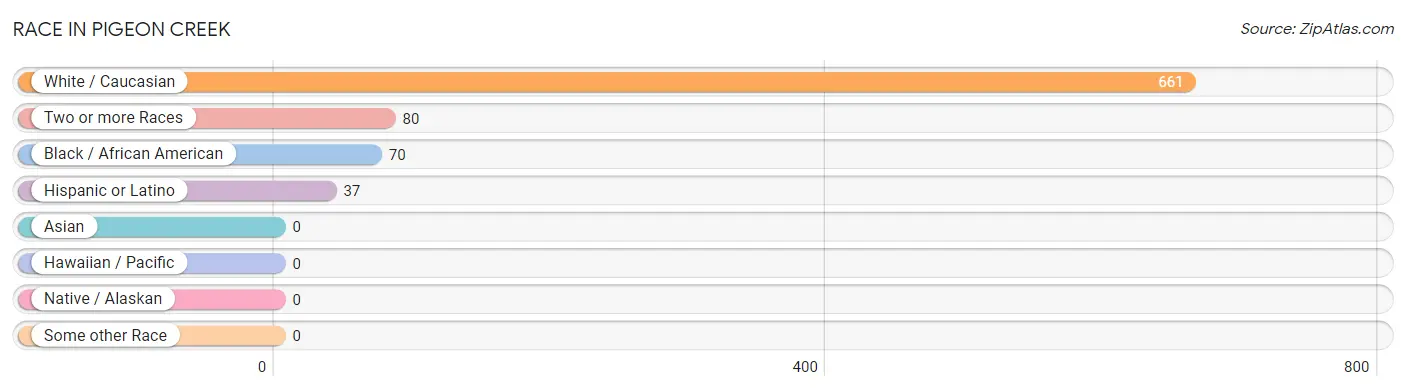
| Race | # Population | % Population |
| Asian | 0 | 0.0% |
| Black / African American | 70 | 8.6% |
| Hawaiian / Pacific | 0 | 0.0% |
| Hispanic or Latino | 37 | 4.6% |
| Native / Alaskan | 0 | 0.0% |
| White / Caucasian | 661 | 81.5% |
| Two or more Races | 80 | 9.9% |
| Some other Race | 0 | 0.0% |
| Total | 811 | 100.0% |
Ancestry in Pigeon Creek
The most populous ancestries reported in Pigeon Creek are German (198 | 24.4%), English (160 | 19.7%), Scottish (89 | 11.0%), French (75 | 9.2%), and Polish (66 | 8.1%), together accounting for 72.5% of all Pigeon Creek residents.
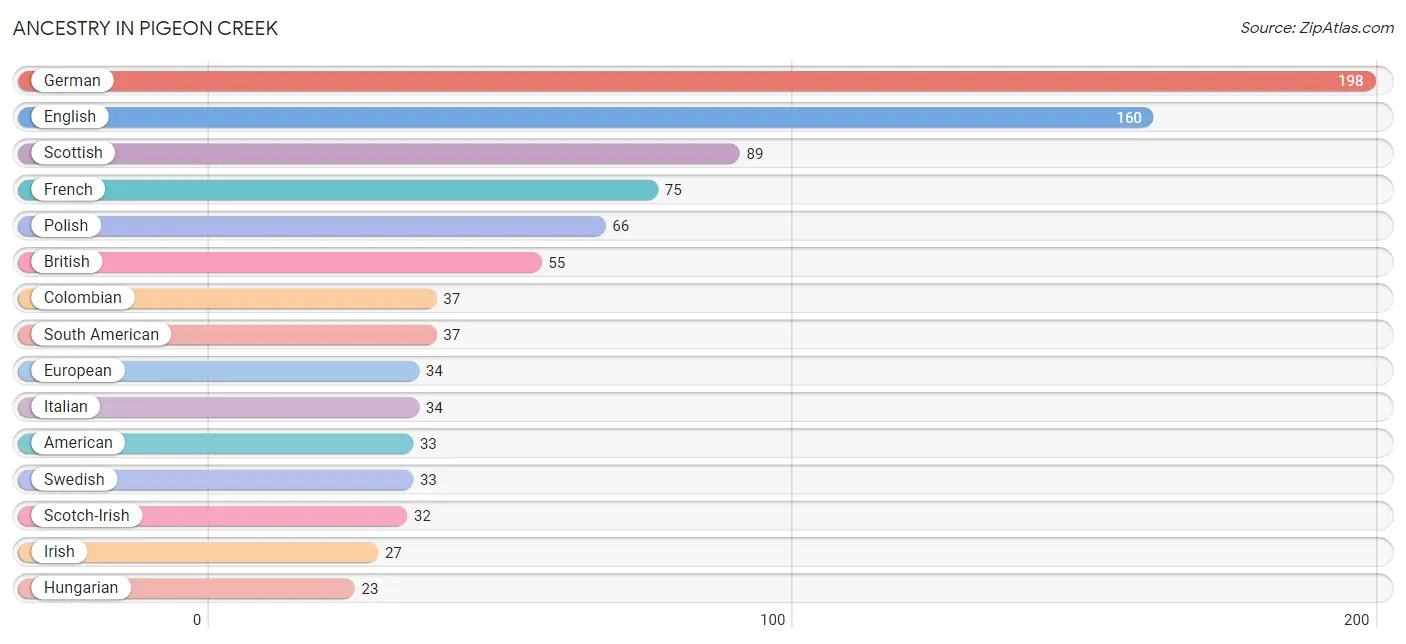
| Ancestry | # Population | % Population |
| American | 33 | 4.1% |
| British | 55 | 6.8% |
| Colombian | 37 | 4.6% |
| Eastern European | 8 | 1.0% |
| English | 160 | 19.7% |
| European | 34 | 4.2% |
| French | 75 | 9.2% |
| German | 198 | 24.4% |
| Hungarian | 23 | 2.8% |
| Irish | 27 | 3.3% |
| Italian | 34 | 4.2% |
| Northern European | 8 | 1.0% |
| Polish | 66 | 8.1% |
| Russian | 10 | 1.2% |
| Scotch-Irish | 32 | 4.0% |
| Scottish | 89 | 11.0% |
| Slovak | 9 | 1.1% |
| South American | 37 | 4.6% |
| Swedish | 33 | 4.1% | View All 19 Rows |
Immigrants in Pigeon Creek
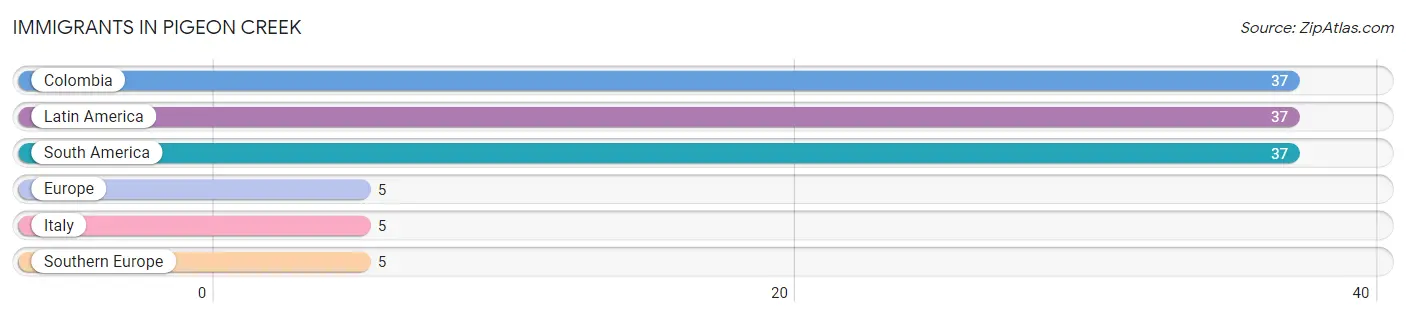
The most numerous immigrant groups reported in Pigeon Creek came from Colombia (37 | 4.6%), Latin America (37 | 4.6%), South America (37 | 4.6%), Europe (5 | 0.6%), and Italy (5 | 0.6%), together accounting for 14.9% of all Pigeon Creek residents.
| Immigration Origin | # Population | % Population |
| Colombia | 37 | 4.6% |
| Europe | 5 | 0.6% |
| Italy | 5 | 0.6% |
| Latin America | 37 | 4.6% |
| South America | 37 | 4.6% |
| Southern Europe | 5 | 0.6% | View All 6 Rows |
Sex and Age in Pigeon Creek
Sex and Age in Pigeon Creek
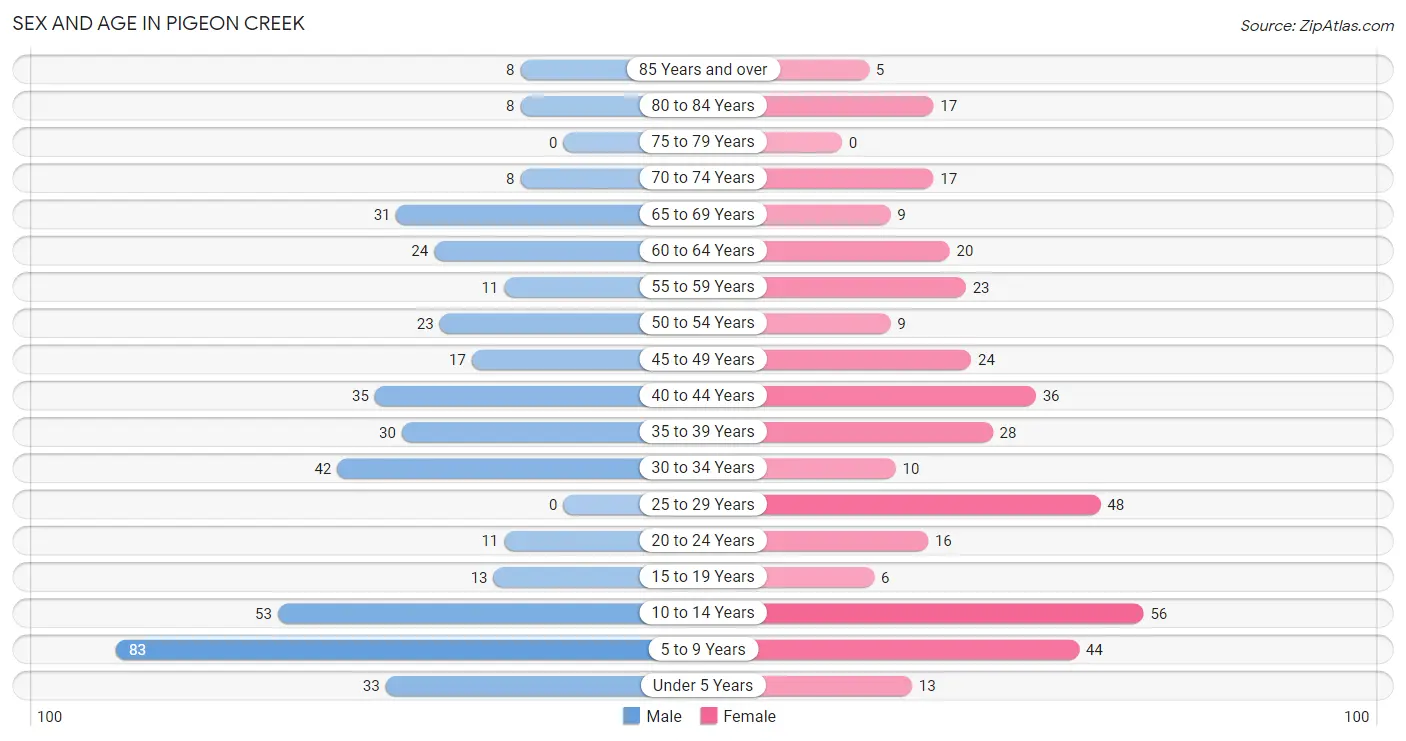
The most populous age groups in Pigeon Creek are 5 to 9 Years (83 | 19.3%) for men and 10 to 14 Years (56 | 14.7%) for women.
| Age Bracket | Male | Female |
| Under 5 Years | 33 (7.7%) | 13 (3.4%) |
| 5 to 9 Years | 83 (19.3%) | 44 (11.6%) |
| 10 to 14 Years | 53 (12.3%) | 56 (14.7%) |
| 15 to 19 Years | 13 (3.0%) | 6 (1.6%) |
| 20 to 24 Years | 11 (2.6%) | 16 (4.2%) |
| 25 to 29 Years | 0 (0.0%) | 48 (12.6%) |
| 30 to 34 Years | 42 (9.8%) | 10 (2.6%) |
| 35 to 39 Years | 30 (7.0%) | 28 (7.3%) |
| 40 to 44 Years | 35 (8.1%) | 36 (9.5%) |
| 45 to 49 Years | 17 (4.0%) | 24 (6.3%) |
| 50 to 54 Years | 23 (5.3%) | 9 (2.4%) |
| 55 to 59 Years | 11 (2.6%) | 23 (6.0%) |
| 60 to 64 Years | 24 (5.6%) | 20 (5.2%) |
| 65 to 69 Years | 31 (7.2%) | 9 (2.4%) |
| 70 to 74 Years | 8 (1.9%) | 17 (4.5%) |
| 75 to 79 Years | 0 (0.0%) | 0 (0.0%) |
| 80 to 84 Years | 8 (1.9%) | 17 (4.5%) |
| 85 Years and over | 8 (1.9%) | 5 (1.3%) |
| Total | 430 (100.0%) | 381 (100.0%) |
Families and Households in Pigeon Creek
Median Family Size in Pigeon Creek
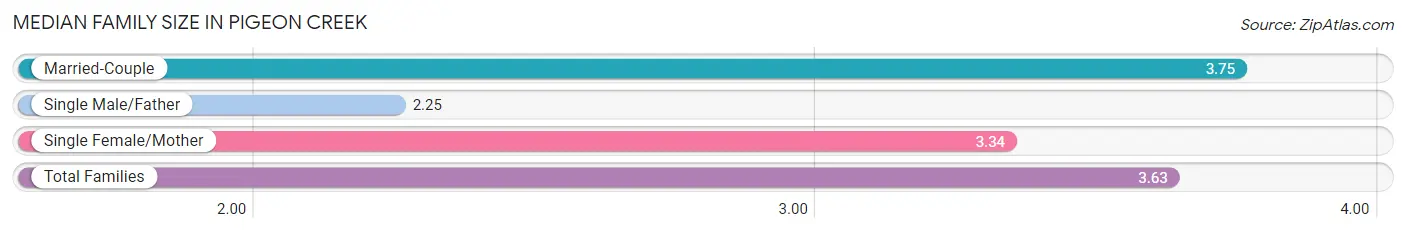
The median family size in Pigeon Creek is 3.63 persons per family, with married-couple families (168 | 80.8%) accounting for the largest median family size of 3.75 persons per family. On the other hand, single male/father families (8 | 3.8%) represent the smallest median family size with 2.25 persons per family.
| Family Type | # Families | Family Size |
| Married-Couple | 168 (80.8%) | 3.75 |
| Single Male/Father | 8 (3.8%) | 2.25 |
| Single Female/Mother | 32 (15.4%) | 3.34 |
| Total Families | 208 (100.0%) | 3.63 |
Median Household Size in Pigeon Creek
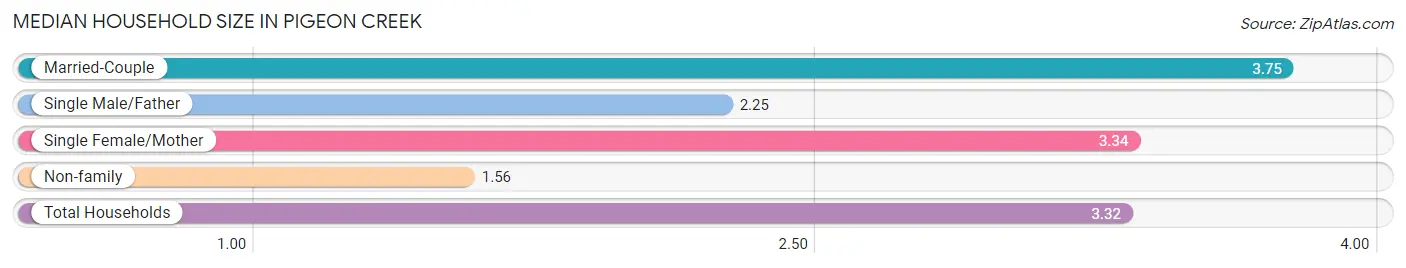
The median household size in Pigeon Creek is 3.32 persons per household, with married-couple households (168 | 68.9%) accounting for the largest median household size of 3.75 persons per household. non-family households (36 | 14.7%) represent the smallest median household size with 1.56 persons per household.
| Household Type | # Households | Household Size |
| Married-Couple | 168 (68.9%) | 3.75 |
| Single Male/Father | 8 (3.3%) | 2.25 |
| Single Female/Mother | 32 (13.1%) | 3.34 |
| Non-family | 36 (14.7%) | 1.56 |
| Total Households | 244 (100.0%) | 3.32 |
Household Size by Marriage Status in Pigeon Creek
Out of a total of 244 households in Pigeon Creek, 208 (85.3%) are family households, while 36 (14.7%) are nonfamily households. The most numerous type of family households are 2-person households, comprising 80, and the most common type of nonfamily households are 1-person households, comprising 18.
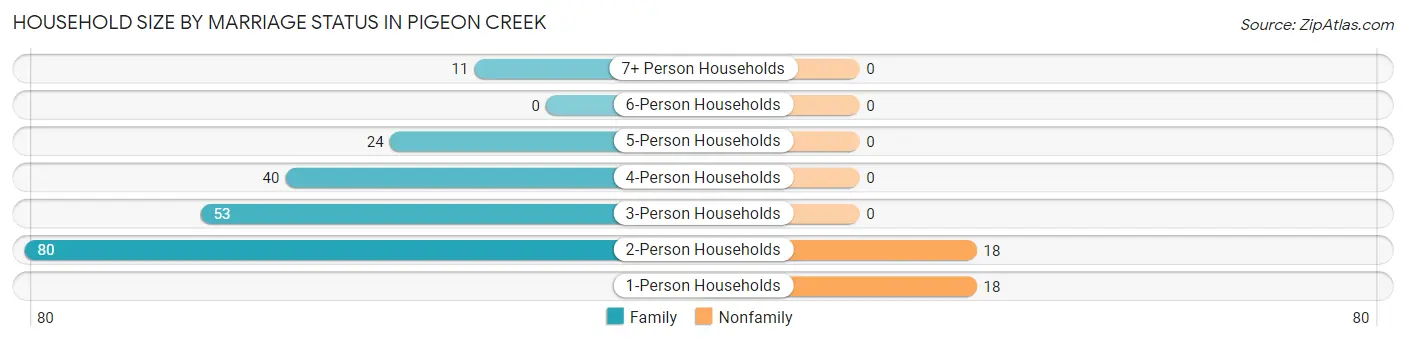
| Household Size | Family Households | Nonfamily Households |
| 1-Person Households | - | 18 (7.4%) |
| 2-Person Households | 80 (32.8%) | 18 (7.4%) |
| 3-Person Households | 53 (21.7%) | 0 (0.0%) |
| 4-Person Households | 40 (16.4%) | 0 (0.0%) |
| 5-Person Households | 24 (9.8%) | 0 (0.0%) |
| 6-Person Households | 0 (0.0%) | 0 (0.0%) |
| 7+ Person Households | 11 (4.5%) | 0 (0.0%) |
| Total | 208 (85.3%) | 36 (14.7%) |
Female Fertility in Pigeon Creek
Fertility by Age in Pigeon Creek
| Age Bracket | Women with Births | Births / 1,000 Women |
| 15 to 19 years | 0 (0.0%) | 0.0 |
| 20 to 34 years | 0 (0.0%) | 0.0 |
| 35 to 50 years | 0 (0.0%) | 0.0 |
| Total | 0 (0.0%) | 0.0 |
Fertility by Age by Marriage Status in Pigeon Creek
| Age Bracket | Married | Unmarried |
| 15 to 19 years | 0 (0.0%) | 0 (0.0%) |
| 20 to 34 years | 0 (0.0%) | 0 (0.0%) |
| 35 to 50 years | 0 (0.0%) | 0 (0.0%) |
| Total | 0 (0.0%) | 0 (0.0%) |
Fertility by Education in Pigeon Creek
| Educational Attainment | Women with Births | Births / 1,000 Women |
| Less than High School | 0 (0.0%) | 0.0 |
| High School Diploma | 0 (0.0%) | 0.0 |
| College or Associate's Degree | 0 (0.0%) | 0.0 |
| Bachelor's Degree | 0 (0.0%) | 0.0 |
| Graduate Degree | 0 (0.0%) | 0.0 |
| Total | 0 (0.0%) | 0.0 |
Fertility by Education by Marriage Status in Pigeon Creek
| Educational Attainment | Married | Unmarried |
| Less than High School | 0 (0.0%) | 0 (0.0%) |
| High School Diploma | 0 (0.0%) | 0 (0.0%) |
| College or Associate's Degree | 0 (0.0%) | 0 (0.0%) |
| Bachelor's Degree | 0 (0.0%) | 0 (0.0%) |
| Graduate Degree | 0 (0.0%) | 0 (0.0%) |
| Total | 0 (0.0%) | 0 (0.0%) |
Employment Characteristics in Pigeon Creek
Employment by Class of Employer in Pigeon Creek
Among the 389 employed individuals in Pigeon Creek, private company employees (232 | 59.6%), local government employees (91 | 23.4%), and self-employed (incorporated) (39 | 10.0%) make up the most common classes of employment.
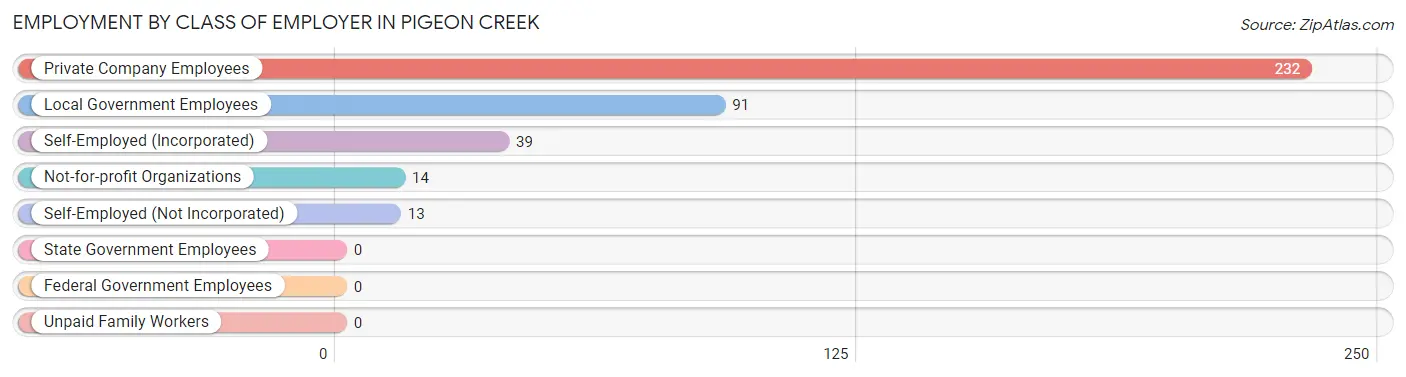
| Employer Class | # Employees | % Employees |
| Private Company Employees | 232 | 59.6% |
| Self-Employed (Incorporated) | 39 | 10.0% |
| Self-Employed (Not Incorporated) | 13 | 3.3% |
| Not-for-profit Organizations | 14 | 3.6% |
| Local Government Employees | 91 | 23.4% |
| State Government Employees | 0 | 0.0% |
| Federal Government Employees | 0 | 0.0% |
| Unpaid Family Workers | 0 | 0.0% |
| Total | 389 | 100.0% |
Employment Status by Age in Pigeon Creek
According to the labor force statistics for Pigeon Creek, out of the total population over 16 years of age (529), 77.1% or 408 individuals are in the labor force, with 3.2% or 13 of them unemployed. The age group with the highest labor force participation rate is 16 to 19 years, with 100.0% or 19 individuals in the labor force. Within the labor force, the 16 to 19 years age range has the highest percentage of unemployed individuals, with 68.4% or 13 of them being unemployed.
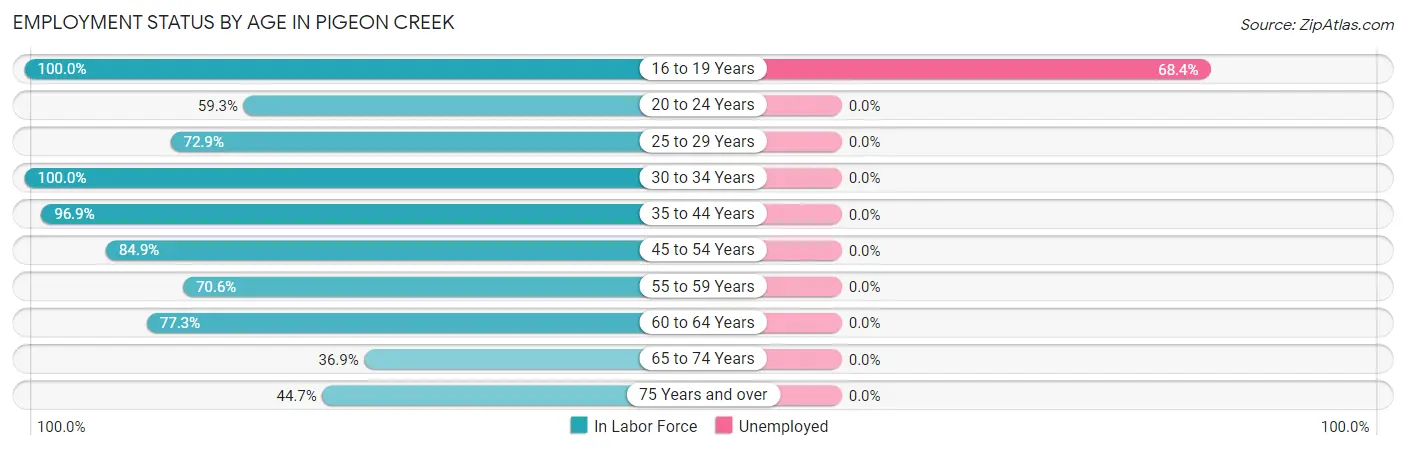
| Age Bracket | In Labor Force | Unemployed |
| 16 to 19 Years | 19 (100.0%) | 13 (68.4%) |
| 20 to 24 Years | 16 (59.3%) | 0 (0.0%) |
| 25 to 29 Years | 35 (72.9%) | 0 (0.0%) |
| 30 to 34 Years | 52 (100.0%) | 0 (0.0%) |
| 35 to 44 Years | 125 (96.9%) | 0 (0.0%) |
| 45 to 54 Years | 62 (84.9%) | 0 (0.0%) |
| 55 to 59 Years | 24 (70.6%) | 0 (0.0%) |
| 60 to 64 Years | 34 (77.3%) | 0 (0.0%) |
| 65 to 74 Years | 24 (36.9%) | 0 (0.0%) |
| 75 Years and over | 17 (44.7%) | 0 (0.0%) |
| Total | 408 (77.1%) | 13 (3.2%) |
Employment Status by Educational Attainment in Pigeon Creek
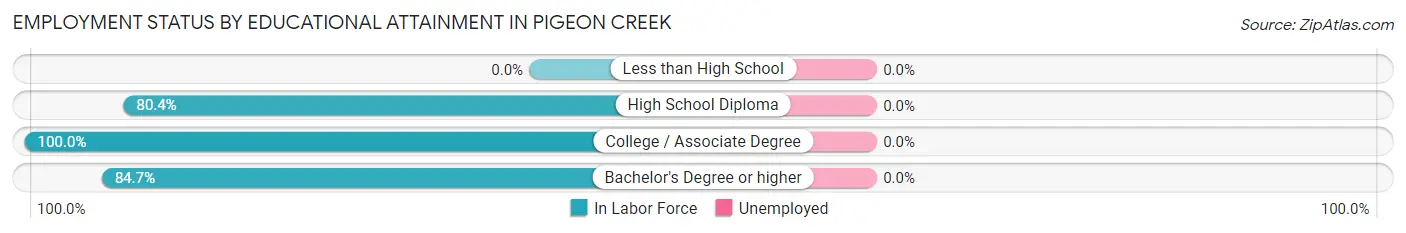
| Educational Attainment | In Labor Force | Unemployed |
| Less than High School | 0 (0.0%) | 0 (0.0%) |
| High School Diploma | 41 (80.4%) | 0 (0.0%) |
| College / Associate Degree | 81 (100.0%) | 0 (0.0%) |
| Bachelor's Degree or higher | 210 (84.7%) | 0 (0.0%) |
| Total | 332 (87.4%) | 0 (0.0%) |
Employment Occupations by Sex in Pigeon Creek
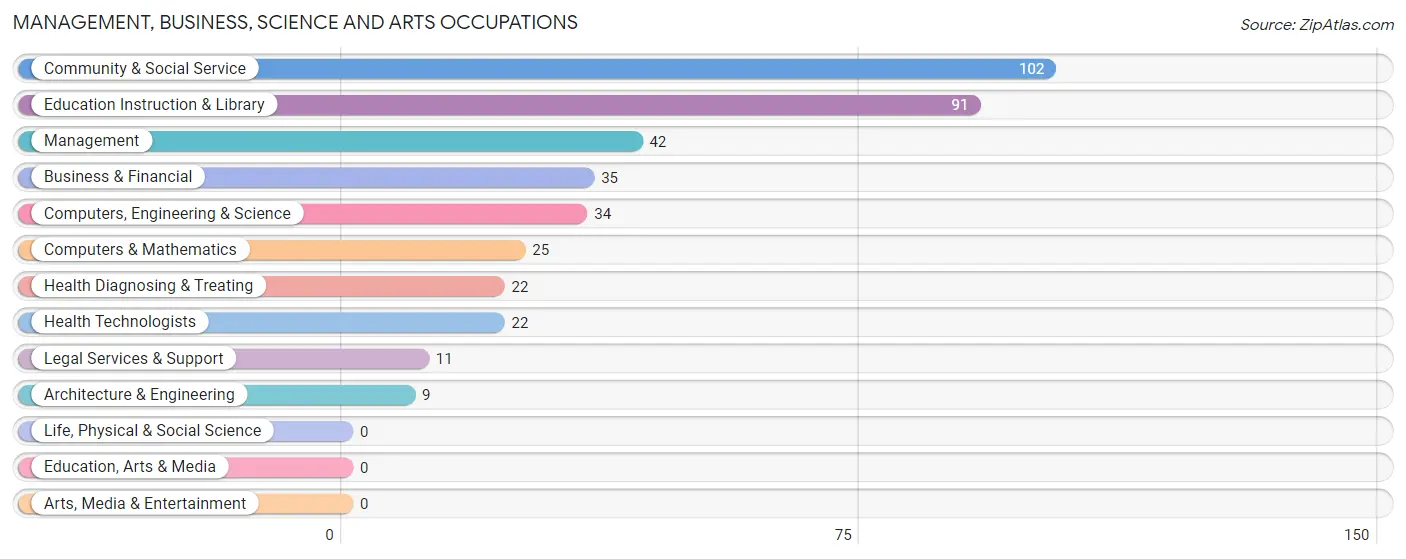
Management, Business, Science and Arts Occupations
The most common Management, Business, Science and Arts occupations in Pigeon Creek are Community & Social Service (102 | 25.8%), Education Instruction & Library (91 | 23.0%), Management (42 | 10.6%), Business & Financial (35 | 8.9%), and Computers, Engineering & Science (34 | 8.6%).
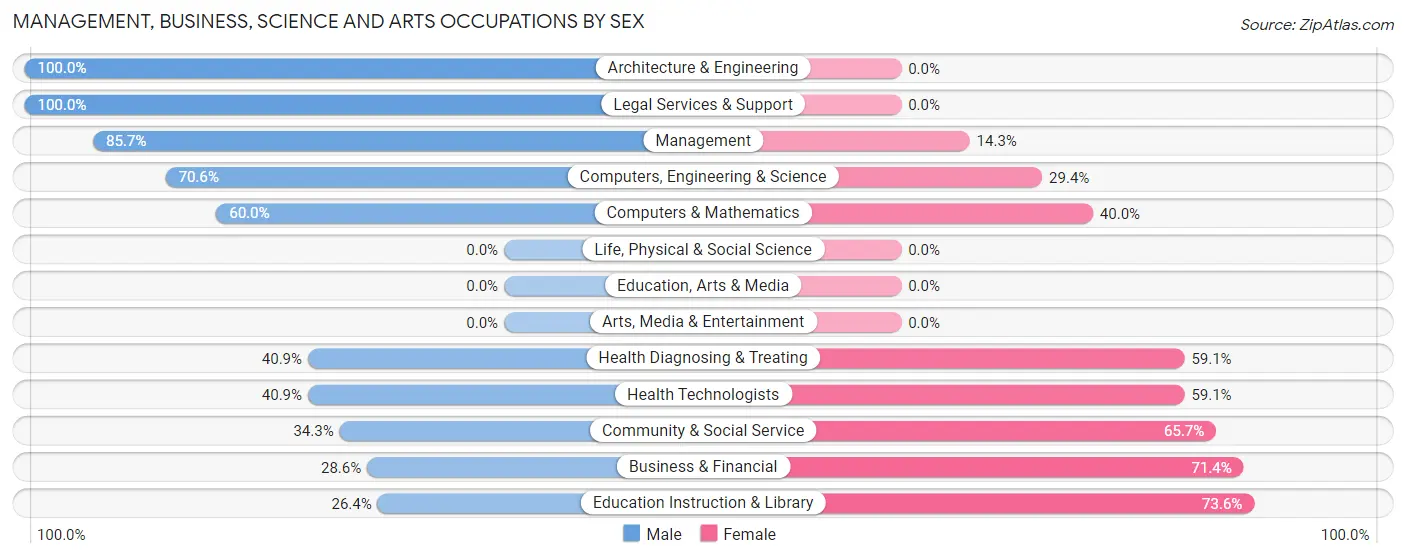
Management, Business, Science and Arts Occupations by Sex
Within the Management, Business, Science and Arts occupations in Pigeon Creek, the most male-oriented occupations are Architecture & Engineering (100.0%), Legal Services & Support (100.0%), and Management (85.7%), while the most female-oriented occupations are Education Instruction & Library (73.6%), Business & Financial (71.4%), and Community & Social Service (65.7%).
| Occupation | Male | Female |
| Management | 36 (85.7%) | 6 (14.3%) |
| Business & Financial | 10 (28.6%) | 25 (71.4%) |
| Computers, Engineering & Science | 24 (70.6%) | 10 (29.4%) |
| Computers & Mathematics | 15 (60.0%) | 10 (40.0%) |
| Architecture & Engineering | 9 (100.0%) | 0 (0.0%) |
| Life, Physical & Social Science | 0 (0.0%) | 0 (0.0%) |
| Community & Social Service | 35 (34.3%) | 67 (65.7%) |
| Education, Arts & Media | 0 (0.0%) | 0 (0.0%) |
| Legal Services & Support | 11 (100.0%) | 0 (0.0%) |
| Education Instruction & Library | 24 (26.4%) | 67 (73.6%) |
| Arts, Media & Entertainment | 0 (0.0%) | 0 (0.0%) |
| Health Diagnosing & Treating | 9 (40.9%) | 13 (59.1%) |
| Health Technologists | 9 (40.9%) | 13 (59.1%) |
| Total (Category) | 114 (48.5%) | 121 (51.5%) |
| Total (Overall) | 215 (54.4%) | 180 (45.6%) |
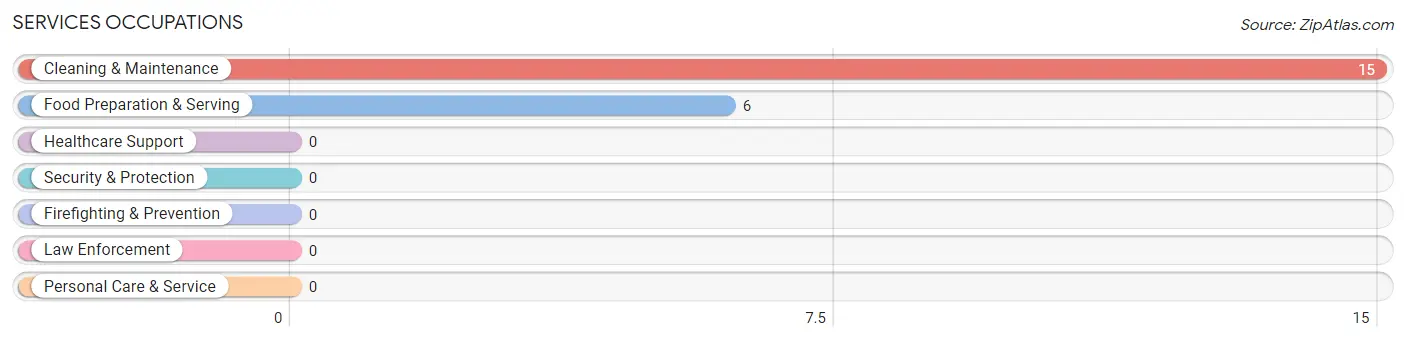
Services Occupations
The most common Services occupations in Pigeon Creek are Cleaning & Maintenance (15 | 3.8%), and Food Preparation & Serving (6 | 1.5%).
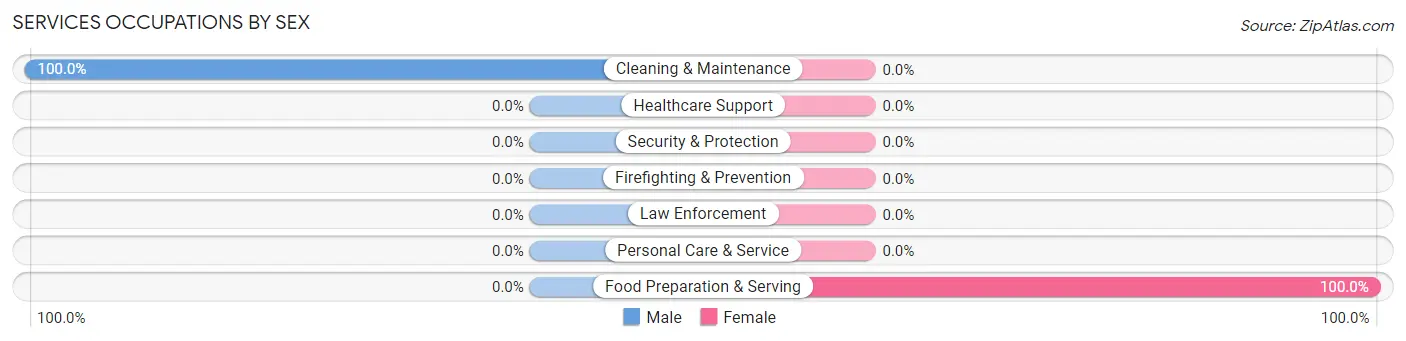
Services Occupations by Sex
| Occupation | Male | Female |
| Healthcare Support | 0 (0.0%) | 0 (0.0%) |
| Security & Protection | 0 (0.0%) | 0 (0.0%) |
| Firefighting & Prevention | 0 (0.0%) | 0 (0.0%) |
| Law Enforcement | 0 (0.0%) | 0 (0.0%) |
| Food Preparation & Serving | 0 (0.0%) | 6 (100.0%) |
| Cleaning & Maintenance | 15 (100.0%) | 0 (0.0%) |
| Personal Care & Service | 0 (0.0%) | 0 (0.0%) |
| Total (Category) | 15 (71.4%) | 6 (28.6%) |
| Total (Overall) | 215 (54.4%) | 180 (45.6%) |
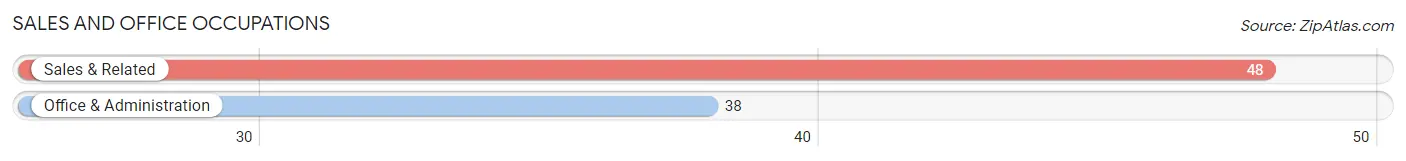
Sales and Office Occupations
The most common Sales and Office occupations in Pigeon Creek are Sales & Related (48 | 12.1%), and Office & Administration (38 | 9.6%).
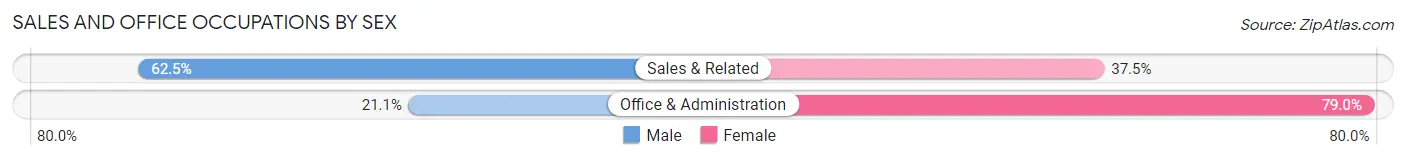
Sales and Office Occupations by Sex
| Occupation | Male | Female |
| Sales & Related | 30 (62.5%) | 18 (37.5%) |
| Office & Administration | 8 (21.0%) | 30 (78.9%) |
| Total (Category) | 38 (44.2%) | 48 (55.8%) |
| Total (Overall) | 215 (54.4%) | 180 (45.6%) |
Natural Resources, Construction and Maintenance Occupations

Natural Resources, Construction and Maintenance Occupations by Sex
| Occupation | Male | Female |
| Farming, Fishing & Forestry | 0 (0.0%) | 0 (0.0%) |
| Construction & Extraction | 0 (0.0%) | 0 (0.0%) |
| Installation, Maintenance & Repair | 0 (0.0%) | 0 (0.0%) |
| Total (Category) | 0 (0.0%) | 0 (0.0%) |
| Total (Overall) | 215 (54.4%) | 180 (45.6%) |
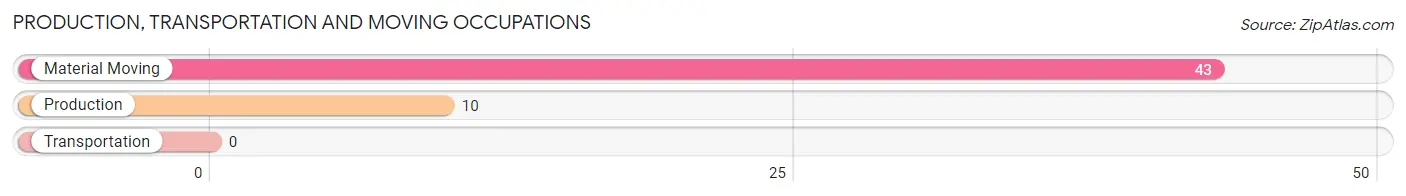
Production, Transportation and Moving Occupations
The most common Production, Transportation and Moving occupations in Pigeon Creek are Material Moving (43 | 10.9%), and Production (10 | 2.5%).
Production, Transportation and Moving Occupations by Sex
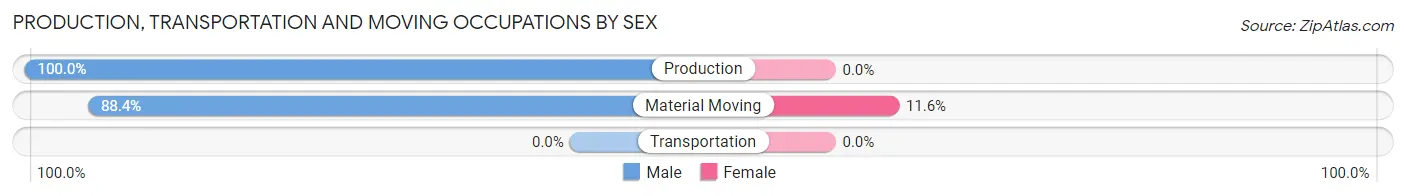
| Occupation | Male | Female |
| Production | 10 (100.0%) | 0 (0.0%) |
| Transportation | 0 (0.0%) | 0 (0.0%) |
| Material Moving | 38 (88.4%) | 5 (11.6%) |
| Total (Category) | 48 (90.6%) | 5 (9.4%) |
| Total (Overall) | 215 (54.4%) | 180 (45.6%) |
Employment Industries by Sex in Pigeon Creek
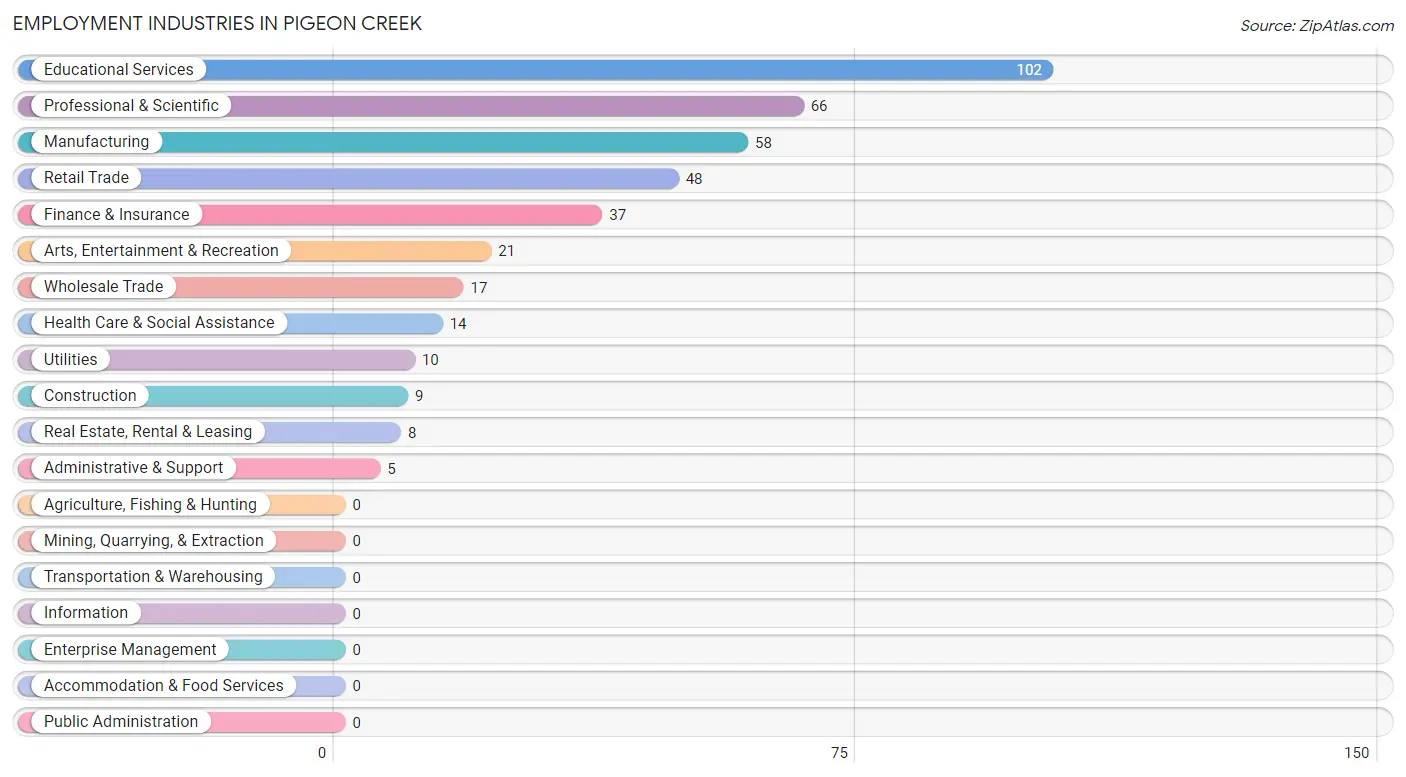
Employment Industries in Pigeon Creek
The major employment industries in Pigeon Creek include Educational Services (102 | 25.8%), Professional & Scientific (66 | 16.7%), Manufacturing (58 | 14.7%), Retail Trade (48 | 12.1%), and Finance & Insurance (37 | 9.4%).
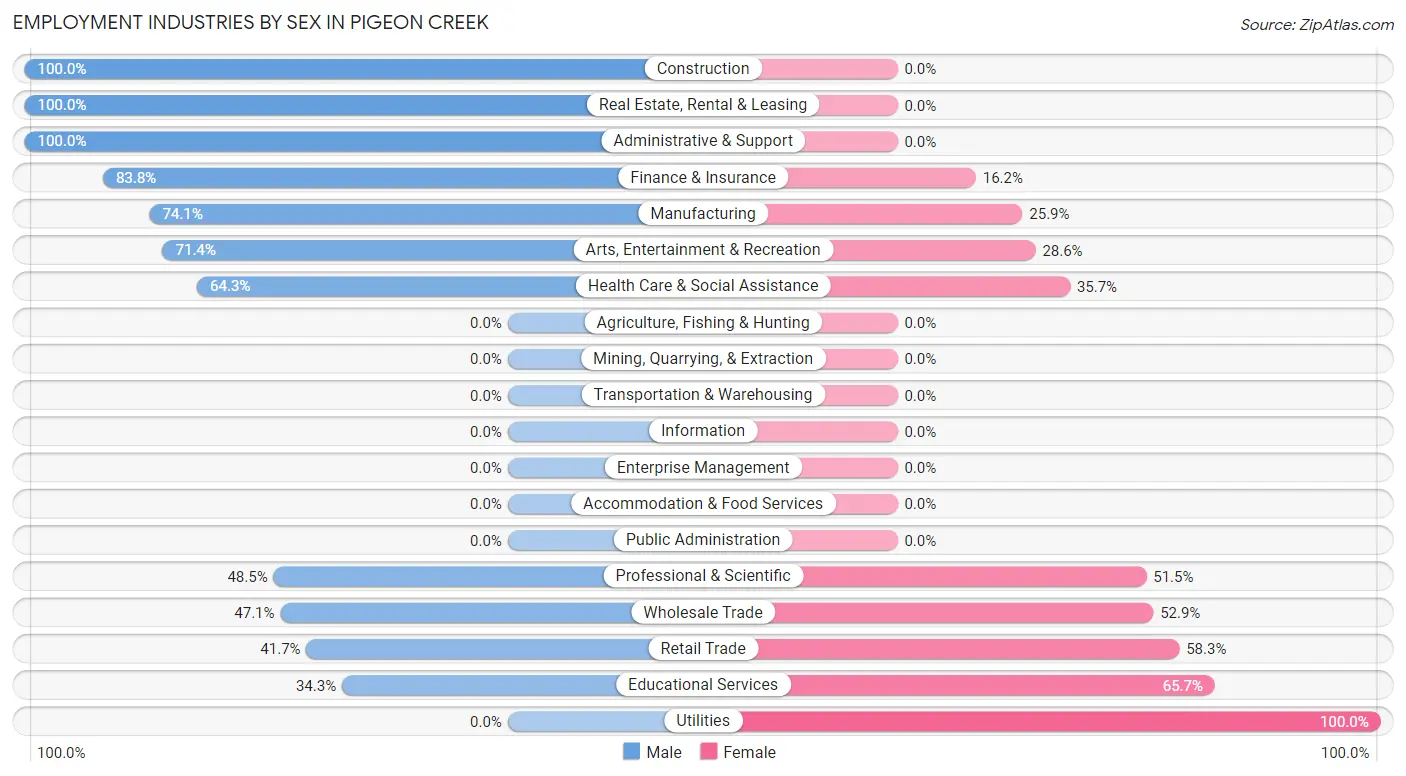
Employment Industries by Sex in Pigeon Creek
The Pigeon Creek industries that see more men than women are Construction (100.0%), Real Estate, Rental & Leasing (100.0%), and Administrative & Support (100.0%), whereas the industries that tend to have a higher number of women are Utilities (100.0%), Educational Services (65.7%), and Retail Trade (58.3%).
| Industry | Male | Female |
| Agriculture, Fishing & Hunting | 0 (0.0%) | 0 (0.0%) |
| Mining, Quarrying, & Extraction | 0 (0.0%) | 0 (0.0%) |
| Construction | 9 (100.0%) | 0 (0.0%) |
| Manufacturing | 43 (74.1%) | 15 (25.9%) |
| Wholesale Trade | 8 (47.1%) | 9 (52.9%) |
| Retail Trade | 20 (41.7%) | 28 (58.3%) |
| Transportation & Warehousing | 0 (0.0%) | 0 (0.0%) |
| Utilities | 0 (0.0%) | 10 (100.0%) |
| Information | 0 (0.0%) | 0 (0.0%) |
| Finance & Insurance | 31 (83.8%) | 6 (16.2%) |
| Real Estate, Rental & Leasing | 8 (100.0%) | 0 (0.0%) |
| Professional & Scientific | 32 (48.5%) | 34 (51.5%) |
| Enterprise Management | 0 (0.0%) | 0 (0.0%) |
| Administrative & Support | 5 (100.0%) | 0 (0.0%) |
| Educational Services | 35 (34.3%) | 67 (65.7%) |
| Health Care & Social Assistance | 9 (64.3%) | 5 (35.7%) |
| Arts, Entertainment & Recreation | 15 (71.4%) | 6 (28.6%) |
| Accommodation & Food Services | 0 (0.0%) | 0 (0.0%) |
| Public Administration | 0 (0.0%) | 0 (0.0%) |
| Total | 215 (54.4%) | 180 (45.6%) |
Education in Pigeon Creek
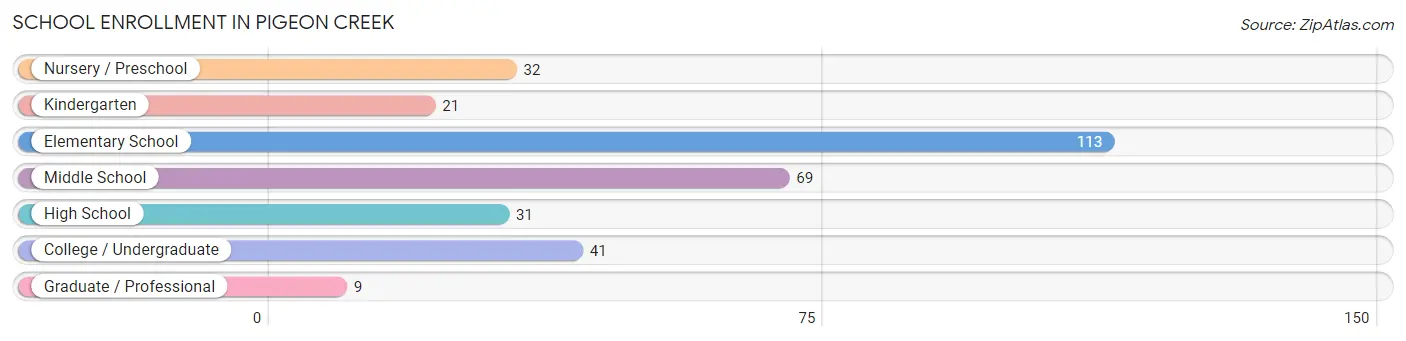
School Enrollment in Pigeon Creek
The most common levels of schooling among the 316 students in Pigeon Creek are elementary school (113 | 35.8%), middle school (69 | 21.8%), and college / undergraduate (41 | 13.0%).
| School Level | # Students | % Students |
| Nursery / Preschool | 32 | 10.1% |
| Kindergarten | 21 | 6.7% |
| Elementary School | 113 | 35.8% |
| Middle School | 69 | 21.8% |
| High School | 31 | 9.8% |
| College / Undergraduate | 41 | 13.0% |
| Graduate / Professional | 9 | 2.9% |
| Total | 316 | 100.0% |
School Enrollment by Age by Funding Source in Pigeon Creek
Out of a total of 316 students who are enrolled in schools in Pigeon Creek, 60 (19.0%) attend a private institution, while the remaining 256 (81.0%) are enrolled in public schools. The age group of 25 to 34 year olds has the highest likelihood of being enrolled in private schools, with 19 (100.0% in the age bracket) enrolled. Conversely, the age group of 3 to 4 year olds has the lowest likelihood of being enrolled in a private school, with 11 (100.0% in the age bracket) attending a public institution.
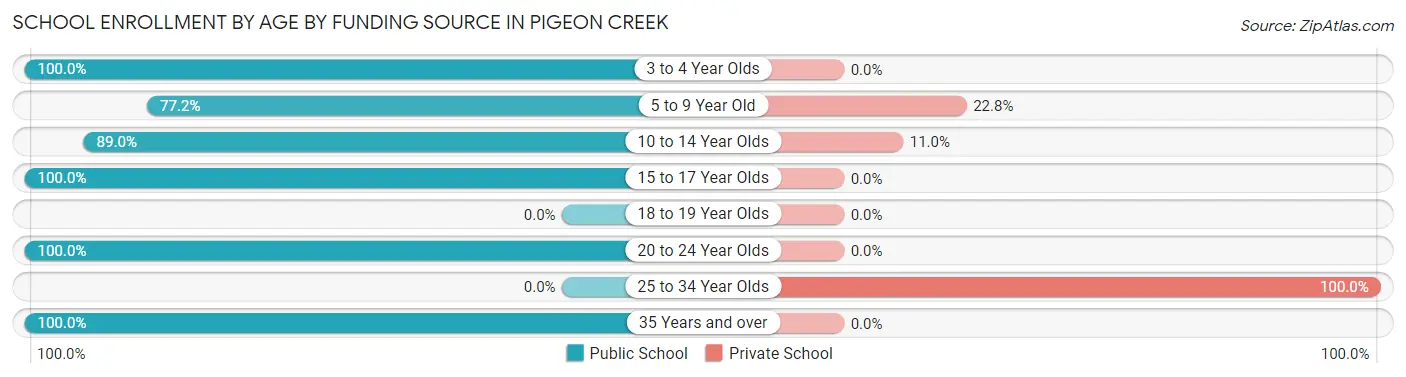
| Age Bracket | Public School | Private School |
| 3 to 4 Year Olds | 11 (100.0%) | 0 (0.0%) |
| 5 to 9 Year Old | 98 (77.2%) | 29 (22.8%) |
| 10 to 14 Year Olds | 97 (89.0%) | 12 (11.0%) |
| 15 to 17 Year Olds | 19 (100.0%) | 0 (0.0%) |
| 18 to 19 Year Olds | 0 (0.0%) | 0 (0.0%) |
| 20 to 24 Year Olds | 22 (100.0%) | 0 (0.0%) |
| 25 to 34 Year Olds | 0 (0.0%) | 19 (100.0%) |
| 35 Years and over | 9 (100.0%) | 0 (0.0%) |
| Total | 256 (81.0%) | 60 (19.0%) |
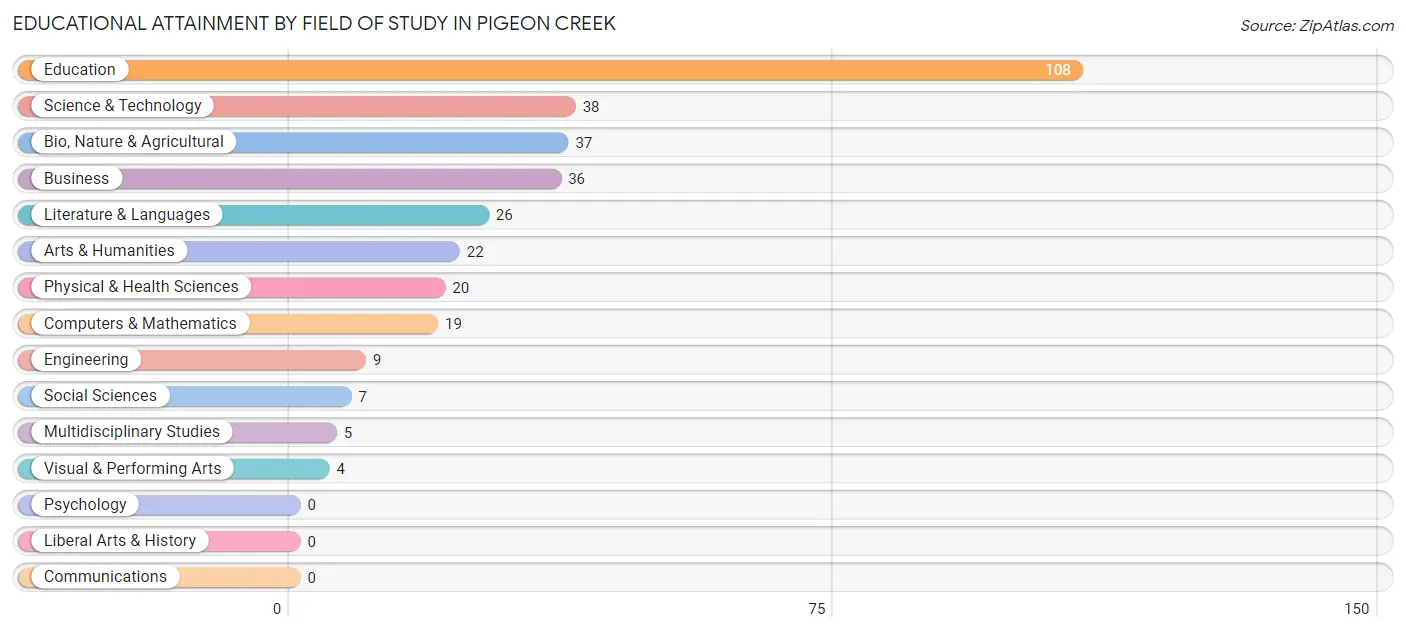
Educational Attainment by Field of Study in Pigeon Creek
Education (108 | 32.6%), science & technology (38 | 11.5%), bio, nature & agricultural (37 | 11.2%), business (36 | 10.9%), and literature & languages (26 | 7.9%) are the most common fields of study among 331 individuals in Pigeon Creek who have obtained a bachelor's degree or higher.
| Field of Study | # Graduates | % Graduates |
| Computers & Mathematics | 19 | 5.7% |
| Bio, Nature & Agricultural | 37 | 11.2% |
| Physical & Health Sciences | 20 | 6.0% |
| Psychology | 0 | 0.0% |
| Social Sciences | 7 | 2.1% |
| Engineering | 9 | 2.7% |
| Multidisciplinary Studies | 5 | 1.5% |
| Science & Technology | 38 | 11.5% |
| Business | 36 | 10.9% |
| Education | 108 | 32.6% |
| Literature & Languages | 26 | 7.9% |
| Liberal Arts & History | 0 | 0.0% |
| Visual & Performing Arts | 4 | 1.2% |
| Communications | 0 | 0.0% |
| Arts & Humanities | 22 | 6.7% |
| Total | 331 | 100.0% |
Transportation & Commute in Pigeon Creek
Vehicle Availability by Sex in Pigeon Creek
The most prevalent vehicle ownership categories in Pigeon Creek are males with 2 vehicles (135, accounting for 62.8%) and females with 2 vehicles (142, making up 77.6%).
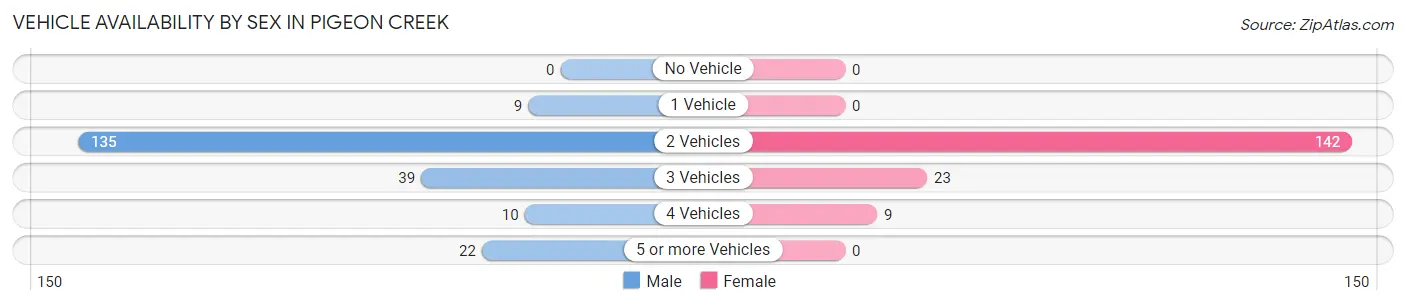
| Vehicles Available | Male | Female |
| No Vehicle | 0 (0.0%) | 0 (0.0%) |
| 1 Vehicle | 9 (4.2%) | 0 (0.0%) |
| 2 Vehicles | 135 (62.8%) | 142 (81.6%) |
| 3 Vehicles | 39 (18.1%) | 23 (13.2%) |
| 4 Vehicles | 10 (4.6%) | 9 (5.2%) |
| 5 or more Vehicles | 22 (10.2%) | 0 (0.0%) |
| Total | 215 (100.0%) | 174 (100.0%) |
Commute Time in Pigeon Creek
The most frequently occuring commute durations in Pigeon Creek are 15 to 19 minutes (126 commuters, 37.3%), 10 to 14 minutes (62 commuters, 18.3%), and less than 5 minutes (38 commuters, 11.2%).
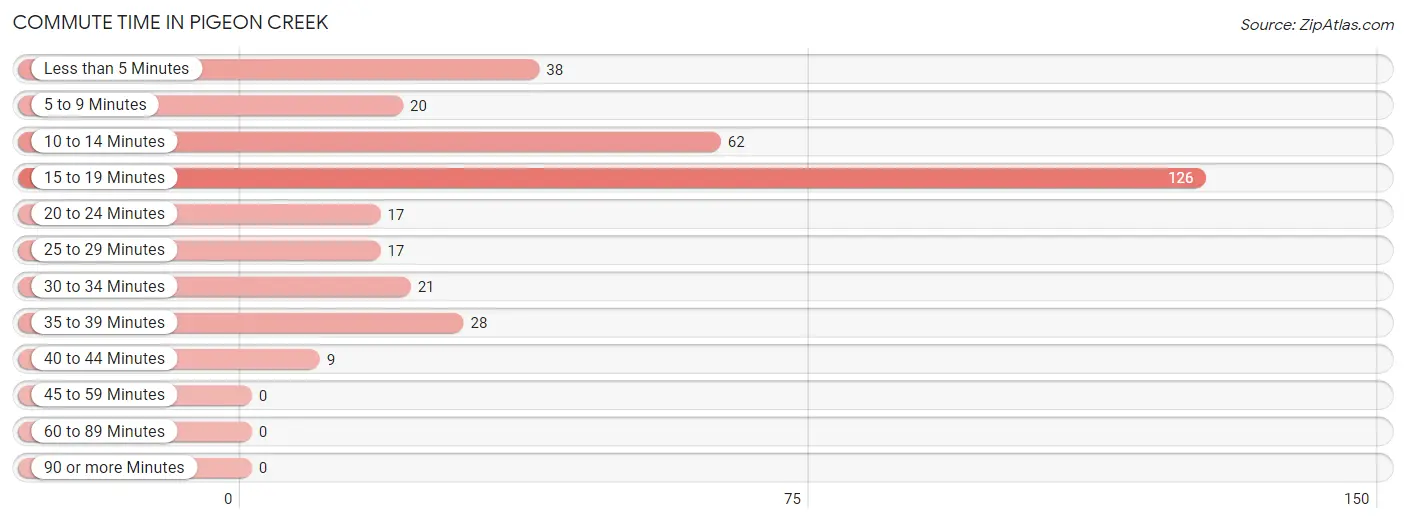
| Commute Time | # Commuters | % Commuters |
| Less than 5 Minutes | 38 | 11.2% |
| 5 to 9 Minutes | 20 | 5.9% |
| 10 to 14 Minutes | 62 | 18.3% |
| 15 to 19 Minutes | 126 | 37.3% |
| 20 to 24 Minutes | 17 | 5.0% |
| 25 to 29 Minutes | 17 | 5.0% |
| 30 to 34 Minutes | 21 | 6.2% |
| 35 to 39 Minutes | 28 | 8.3% |
| 40 to 44 Minutes | 9 | 2.7% |
| 45 to 59 Minutes | 0 | 0.0% |
| 60 to 89 Minutes | 0 | 0.0% |
| 90 or more Minutes | 0 | 0.0% |
Commute Time by Sex in Pigeon Creek
The most common commute times in Pigeon Creek are 15 to 19 minutes (49 commuters, 28.2%) for males and 15 to 19 minutes (77 commuters, 46.9%) for females.
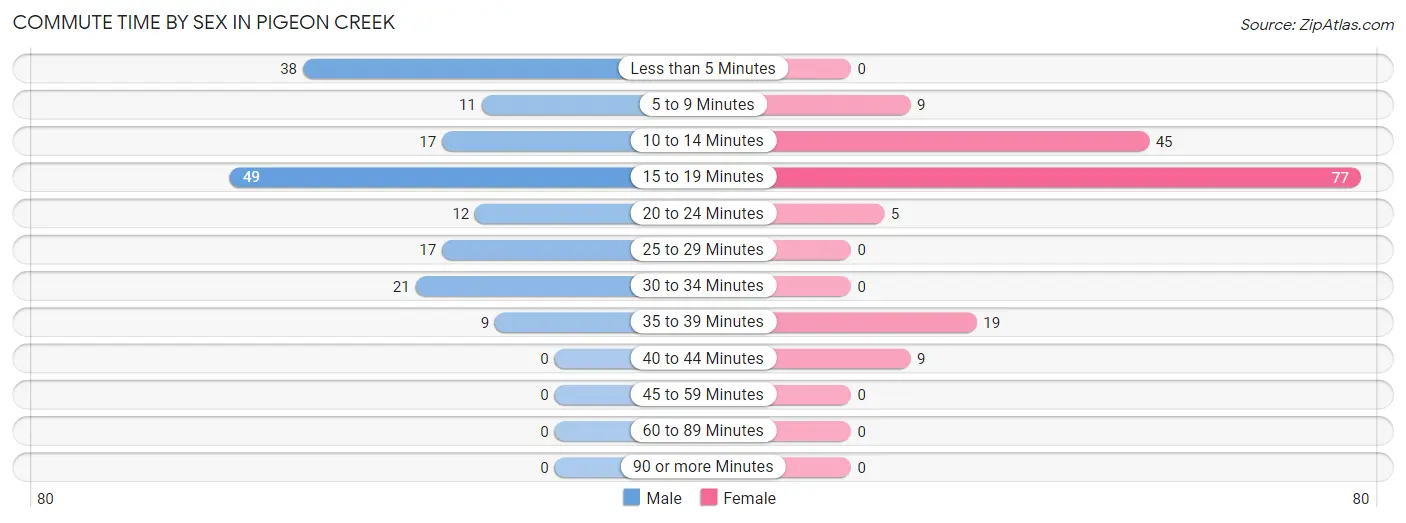
| Commute Time | Male | Female |
| Less than 5 Minutes | 38 (21.8%) | 0 (0.0%) |
| 5 to 9 Minutes | 11 (6.3%) | 9 (5.5%) |
| 10 to 14 Minutes | 17 (9.8%) | 45 (27.4%) |
| 15 to 19 Minutes | 49 (28.2%) | 77 (46.9%) |
| 20 to 24 Minutes | 12 (6.9%) | 5 (3.0%) |
| 25 to 29 Minutes | 17 (9.8%) | 0 (0.0%) |
| 30 to 34 Minutes | 21 (12.1%) | 0 (0.0%) |
| 35 to 39 Minutes | 9 (5.2%) | 19 (11.6%) |
| 40 to 44 Minutes | 0 (0.0%) | 9 (5.5%) |
| 45 to 59 Minutes | 0 (0.0%) | 0 (0.0%) |
| 60 to 89 Minutes | 0 (0.0%) | 0 (0.0%) |
| 90 or more Minutes | 0 (0.0%) | 0 (0.0%) |
Time of Departure to Work by Sex in Pigeon Creek
The most frequent times of departure to work in Pigeon Creek are 4:00 PM to 11:59 PM (46, 26.4%) for males and 8:00 AM to 8:29 AM (78, 47.6%) for females.
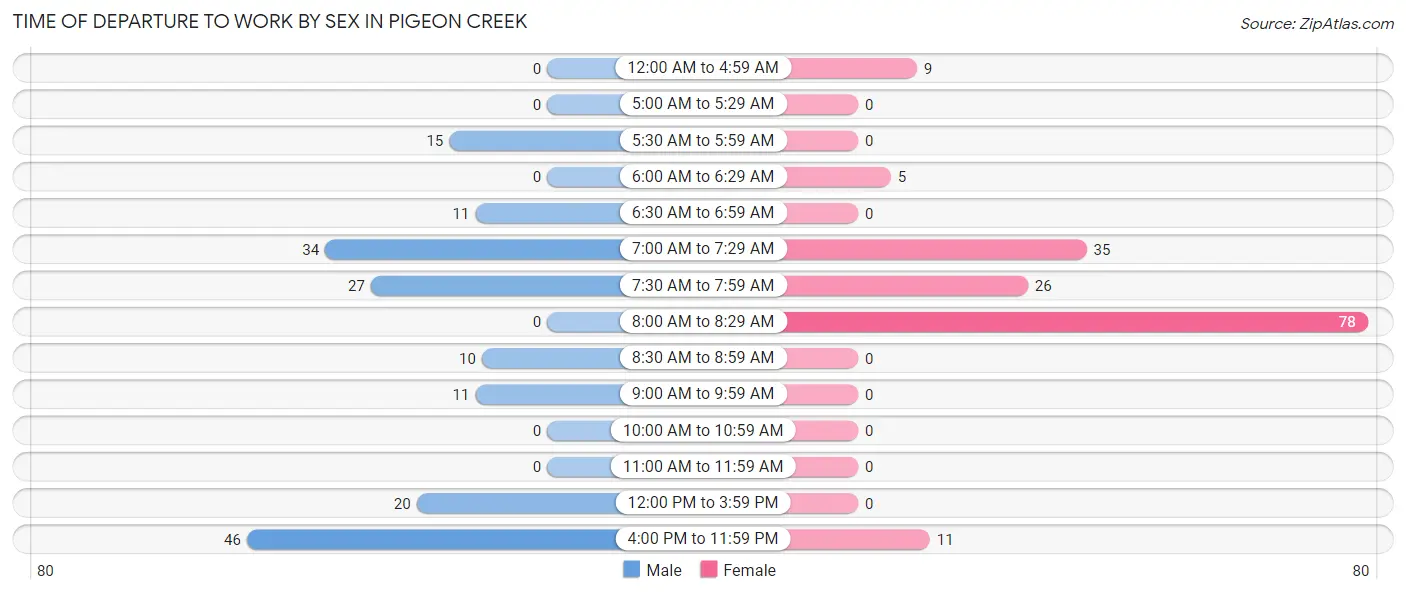
| Time of Departure | Male | Female |
| 12:00 AM to 4:59 AM | 0 (0.0%) | 9 (5.5%) |
| 5:00 AM to 5:29 AM | 0 (0.0%) | 0 (0.0%) |
| 5:30 AM to 5:59 AM | 15 (8.6%) | 0 (0.0%) |
| 6:00 AM to 6:29 AM | 0 (0.0%) | 5 (3.0%) |
| 6:30 AM to 6:59 AM | 11 (6.3%) | 0 (0.0%) |
| 7:00 AM to 7:29 AM | 34 (19.5%) | 35 (21.3%) |
| 7:30 AM to 7:59 AM | 27 (15.5%) | 26 (15.9%) |
| 8:00 AM to 8:29 AM | 0 (0.0%) | 78 (47.6%) |
| 8:30 AM to 8:59 AM | 10 (5.8%) | 0 (0.0%) |
| 9:00 AM to 9:59 AM | 11 (6.3%) | 0 (0.0%) |
| 10:00 AM to 10:59 AM | 0 (0.0%) | 0 (0.0%) |
| 11:00 AM to 11:59 AM | 0 (0.0%) | 0 (0.0%) |
| 12:00 PM to 3:59 PM | 20 (11.5%) | 0 (0.0%) |
| 4:00 PM to 11:59 PM | 46 (26.4%) | 11 (6.7%) |
| Total | 174 (100.0%) | 164 (100.0%) |
Housing Occupancy in Pigeon Creek
Occupancy by Ownership in Pigeon Creek
Of the total 244 dwellings in Pigeon Creek, owner-occupied units account for 225 (92.2%), while renter-occupied units make up 19 (7.8%).
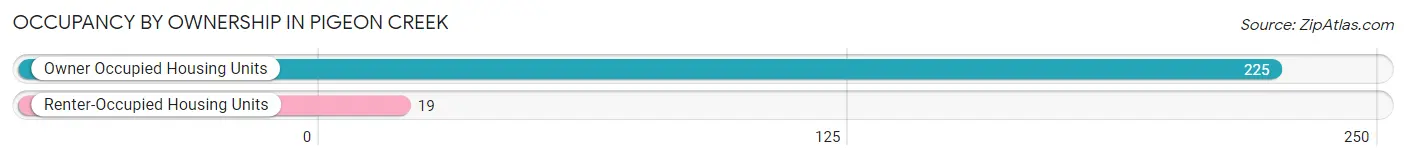
| Occupancy | # Housing Units | % Housing Units |
| Owner Occupied Housing Units | 225 | 92.2% |
| Renter-Occupied Housing Units | 19 | 7.8% |
| Total Occupied Housing Units | 244 | 100.0% |
Occupancy by Household Size in Pigeon Creek
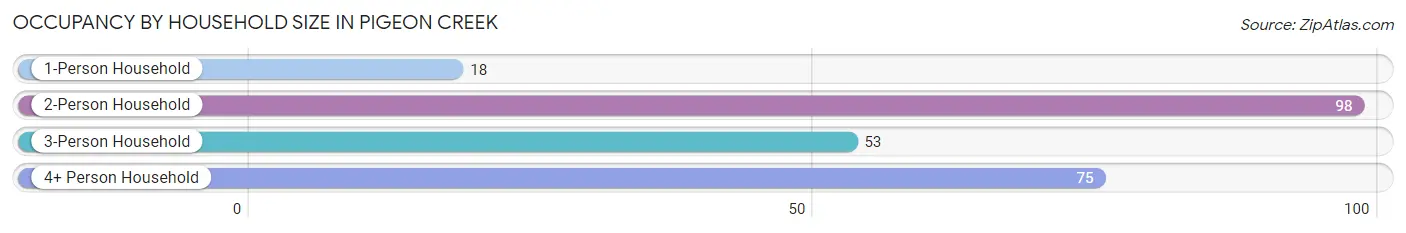
| Household Size | # Housing Units | % Housing Units |
| 1-Person Household | 18 | 7.4% |
| 2-Person Household | 98 | 40.2% |
| 3-Person Household | 53 | 21.7% |
| 4+ Person Household | 75 | 30.7% |
| Total Housing Units | 244 | 100.0% |
Occupancy by Ownership by Household Size in Pigeon Creek
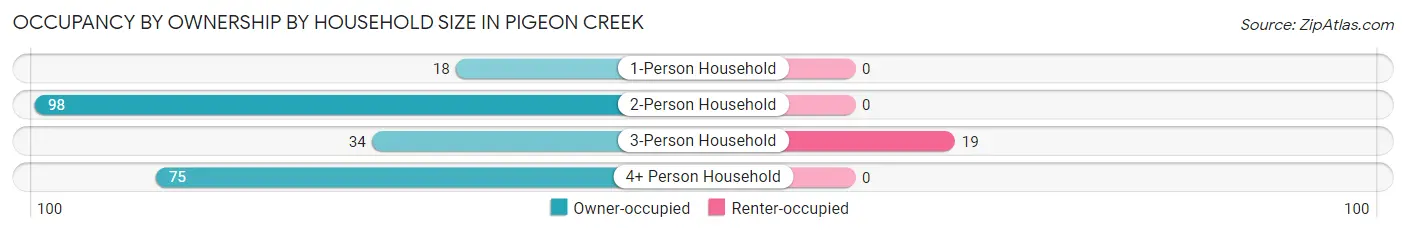
| Household Size | Owner-occupied | Renter-occupied |
| 1-Person Household | 18 (100.0%) | 0 (0.0%) |
| 2-Person Household | 98 (100.0%) | 0 (0.0%) |
| 3-Person Household | 34 (64.1%) | 19 (35.8%) |
| 4+ Person Household | 75 (100.0%) | 0 (0.0%) |
| Total Housing Units | 225 (92.2%) | 19 (7.8%) |
Occupancy by Educational Attainment in Pigeon Creek
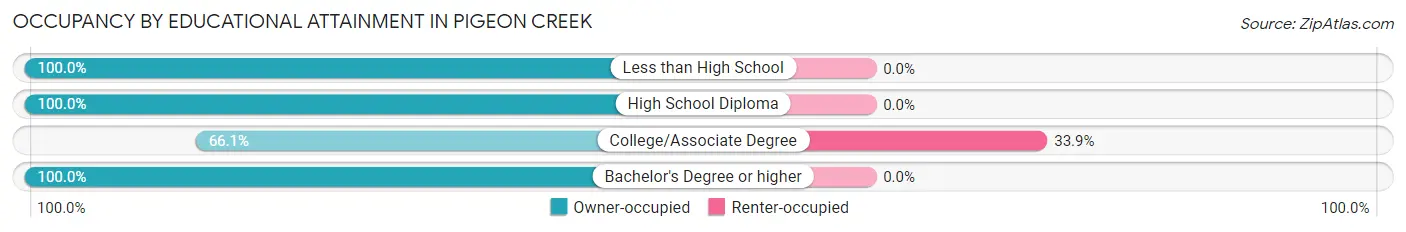
| Household Size | Owner-occupied | Renter-occupied |
| Less than High School | 5 (100.0%) | 0 (0.0%) |
| High School Diploma | 30 (100.0%) | 0 (0.0%) |
| College/Associate Degree | 37 (66.1%) | 19 (33.9%) |
| Bachelor's Degree or higher | 153 (100.0%) | 0 (0.0%) |
Occupancy by Age of Householder in Pigeon Creek
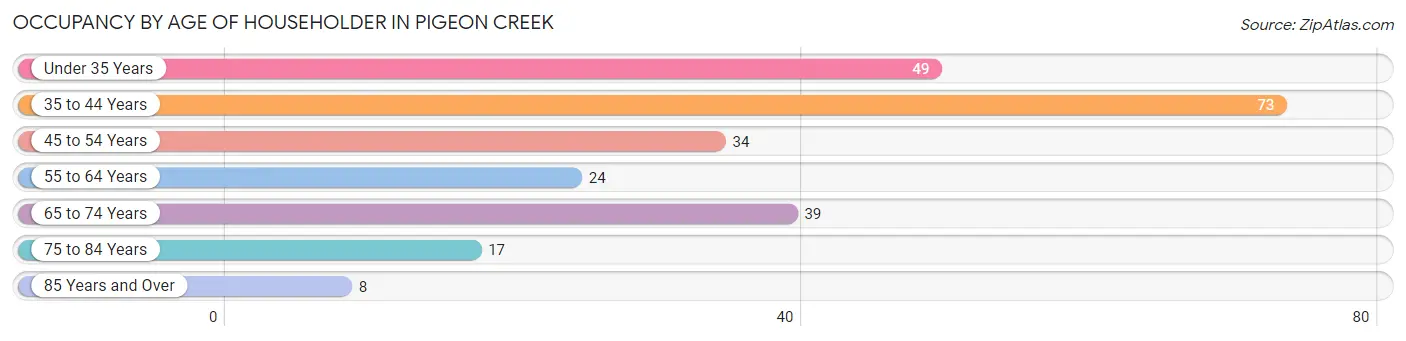
| Age Bracket | # Households | % Households |
| Under 35 Years | 49 | 20.1% |
| 35 to 44 Years | 73 | 29.9% |
| 45 to 54 Years | 34 | 13.9% |
| 55 to 64 Years | 24 | 9.8% |
| 65 to 74 Years | 39 | 16.0% |
| 75 to 84 Years | 17 | 7.0% |
| 85 Years and Over | 8 | 3.3% |
| Total | 244 | 100.0% |
Housing Finances in Pigeon Creek
Median Income by Occupancy in Pigeon Creek
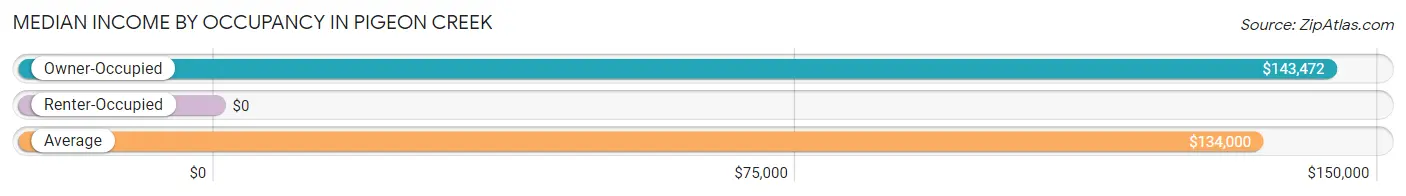
| Occupancy Type | # Households | Median Income |
| Owner-Occupied | 225 (92.2%) | $143,472 |
| Renter-Occupied | 19 (7.8%) | $0 |
| Average | 244 (100.0%) | $134,000 |
Occupancy by Householder Income Bracket in Pigeon Creek
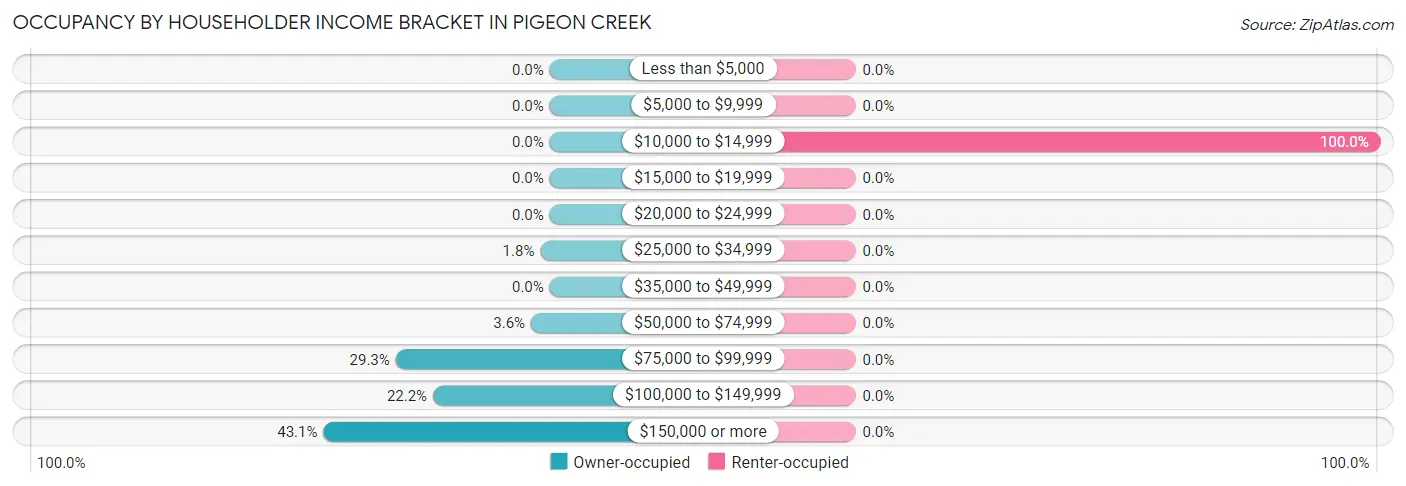
| Income Bracket | Owner-occupied | Renter-occupied |
| Less than $5,000 | 0 (0.0%) | 0 (0.0%) |
| $5,000 to $9,999 | 0 (0.0%) | 0 (0.0%) |
| $10,000 to $14,999 | 0 (0.0%) | 19 (100.0%) |
| $15,000 to $19,999 | 0 (0.0%) | 0 (0.0%) |
| $20,000 to $24,999 | 0 (0.0%) | 0 (0.0%) |
| $25,000 to $34,999 | 4 (1.8%) | 0 (0.0%) |
| $35,000 to $49,999 | 0 (0.0%) | 0 (0.0%) |
| $50,000 to $74,999 | 8 (3.6%) | 0 (0.0%) |
| $75,000 to $99,999 | 66 (29.3%) | 0 (0.0%) |
| $100,000 to $149,999 | 50 (22.2%) | 0 (0.0%) |
| $150,000 or more | 97 (43.1%) | 0 (0.0%) |
| Total | 225 (100.0%) | 19 (100.0%) |
Monthly Housing Cost Tiers in Pigeon Creek
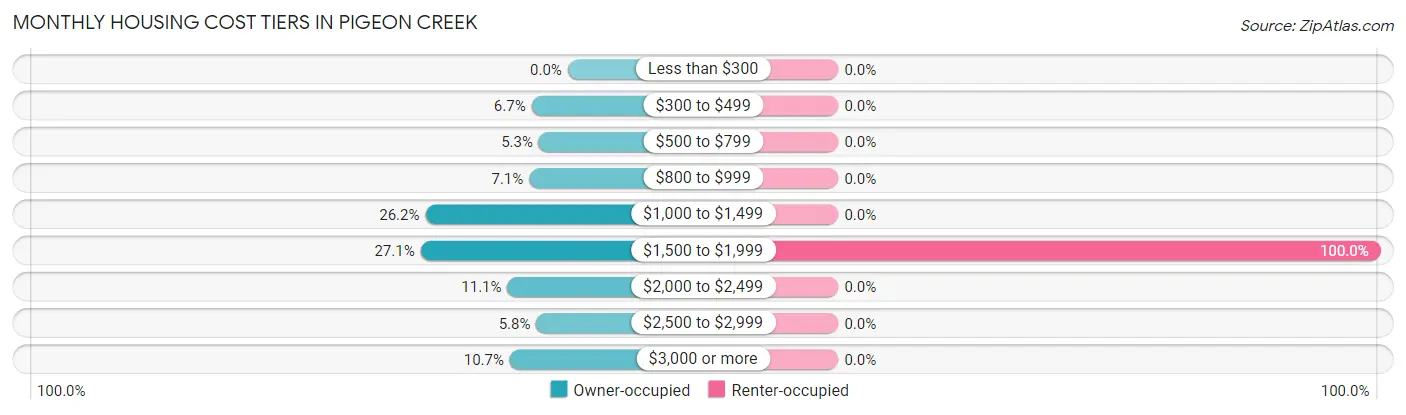
| Monthly Cost | Owner-occupied | Renter-occupied |
| Less than $300 | 0 (0.0%) | 0 (0.0%) |
| $300 to $499 | 15 (6.7%) | 0 (0.0%) |
| $500 to $799 | 12 (5.3%) | 0 (0.0%) |
| $800 to $999 | 16 (7.1%) | 0 (0.0%) |
| $1,000 to $1,499 | 59 (26.2%) | 0 (0.0%) |
| $1,500 to $1,999 | 61 (27.1%) | 19 (100.0%) |
| $2,000 to $2,499 | 25 (11.1%) | 0 (0.0%) |
| $2,500 to $2,999 | 13 (5.8%) | 0 (0.0%) |
| $3,000 or more | 24 (10.7%) | 0 (0.0%) |
| Total | 225 (100.0%) | 19 (100.0%) |
Physical Housing Characteristics in Pigeon Creek
Housing Structures in Pigeon Creek
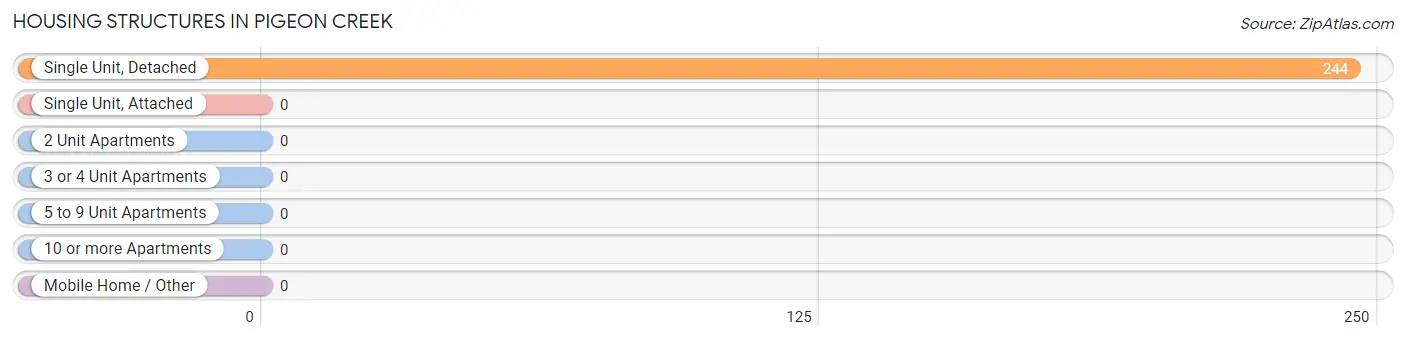
| Structure Type | # Housing Units | % Housing Units |
| Single Unit, Detached | 244 | 100.0% |
| Single Unit, Attached | 0 | 0.0% |
| 2 Unit Apartments | 0 | 0.0% |
| 3 or 4 Unit Apartments | 0 | 0.0% |
| 5 to 9 Unit Apartments | 0 | 0.0% |
| 10 or more Apartments | 0 | 0.0% |
| Mobile Home / Other | 0 | 0.0% |
| Total | 244 | 100.0% |
Housing Structures by Occupancy in Pigeon Creek
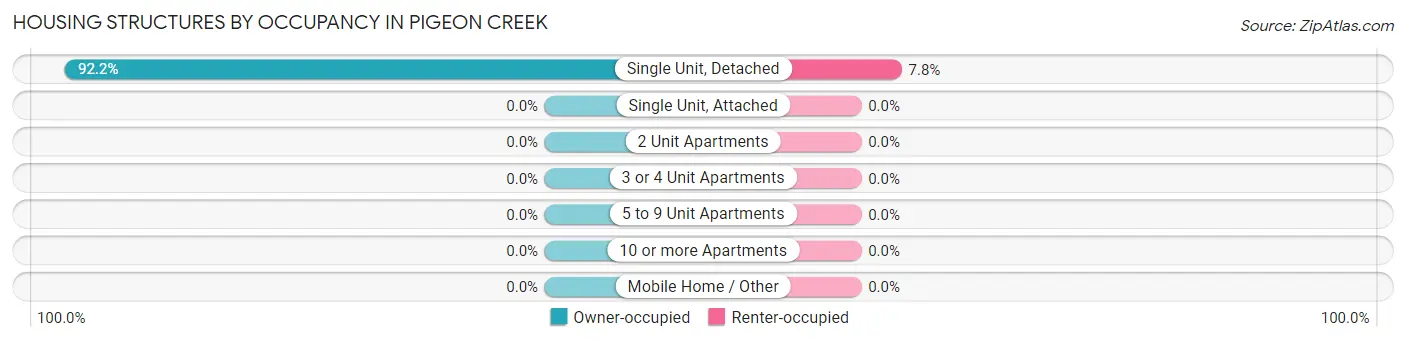
| Structure Type | Owner-occupied | Renter-occupied |
| Single Unit, Detached | 225 (92.2%) | 19 (7.8%) |
| Single Unit, Attached | 0 (0.0%) | 0 (0.0%) |
| 2 Unit Apartments | 0 (0.0%) | 0 (0.0%) |
| 3 or 4 Unit Apartments | 0 (0.0%) | 0 (0.0%) |
| 5 to 9 Unit Apartments | 0 (0.0%) | 0 (0.0%) |
| 10 or more Apartments | 0 (0.0%) | 0 (0.0%) |
| Mobile Home / Other | 0 (0.0%) | 0 (0.0%) |
| Total | 225 (92.2%) | 19 (7.8%) |
Housing Structures by Number of Rooms in Pigeon Creek
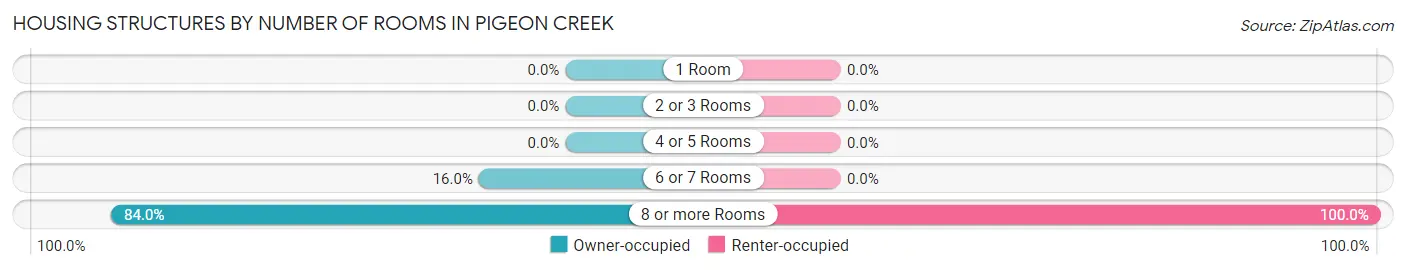
| Number of Rooms | Owner-occupied | Renter-occupied |
| 1 Room | 0 (0.0%) | 0 (0.0%) |
| 2 or 3 Rooms | 0 (0.0%) | 0 (0.0%) |
| 4 or 5 Rooms | 0 (0.0%) | 0 (0.0%) |
| 6 or 7 Rooms | 36 (16.0%) | 0 (0.0%) |
| 8 or more Rooms | 189 (84.0%) | 19 (100.0%) |
| Total | 225 (100.0%) | 19 (100.0%) |
Housing Structure by Heating Type in Pigeon Creek
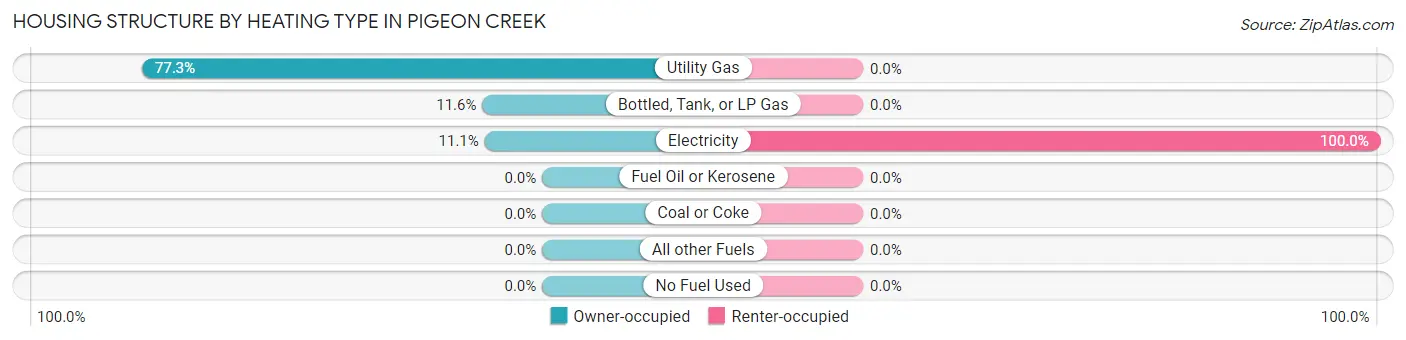
| Heating Type | Owner-occupied | Renter-occupied |
| Utility Gas | 174 (77.3%) | 0 (0.0%) |
| Bottled, Tank, or LP Gas | 26 (11.6%) | 0 (0.0%) |
| Electricity | 25 (11.1%) | 19 (100.0%) |
| Fuel Oil or Kerosene | 0 (0.0%) | 0 (0.0%) |
| Coal or Coke | 0 (0.0%) | 0 (0.0%) |
| All other Fuels | 0 (0.0%) | 0 (0.0%) |
| No Fuel Used | 0 (0.0%) | 0 (0.0%) |
| Total | 225 (100.0%) | 19 (100.0%) |
Household Vehicle Usage in Pigeon Creek
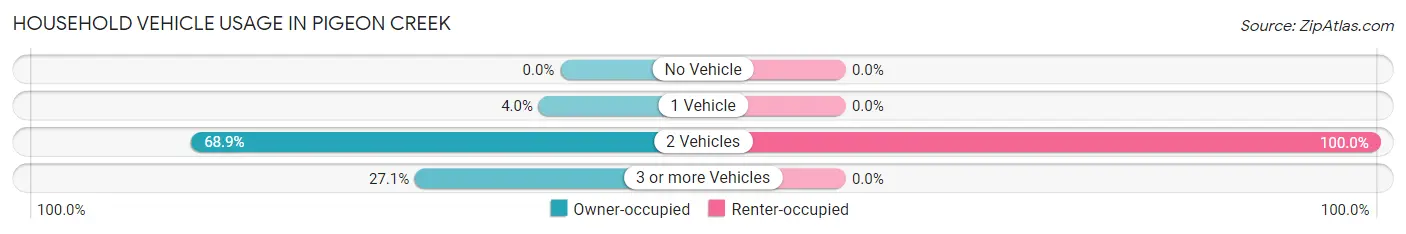
| Vehicles per Household | Owner-occupied | Renter-occupied |
| No Vehicle | 0 (0.0%) | 0 (0.0%) |
| 1 Vehicle | 9 (4.0%) | 0 (0.0%) |
| 2 Vehicles | 155 (68.9%) | 19 (100.0%) |
| 3 or more Vehicles | 61 (27.1%) | 0 (0.0%) |
| Total | 225 (100.0%) | 19 (100.0%) |
Real Estate & Mortgages in Pigeon Creek
Real Estate and Mortgage Overview in Pigeon Creek
| Characteristic | Without Mortgage | With Mortgage |
| Housing Units | 58 | 167 |
| Median Property Value | $370,000 | $282,300 |
| Median Household Income | $134,000 | $93 |
| Monthly Housing Costs | $963 | $24 |
| Real Estate Taxes | $7,083 | $0 |
Property Value by Mortgage Status in Pigeon Creek
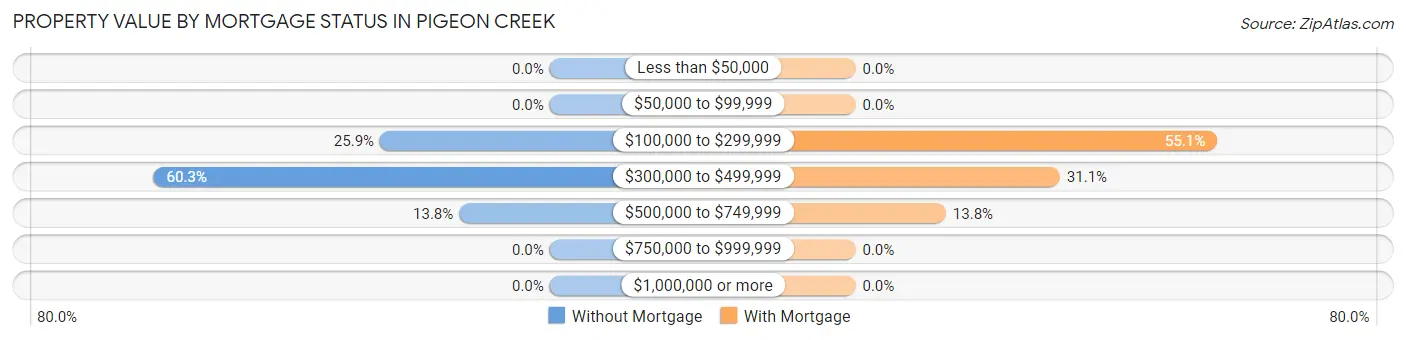
| Property Value | Without Mortgage | With Mortgage |
| Less than $50,000 | 0 (0.0%) | 0 (0.0%) |
| $50,000 to $99,999 | 0 (0.0%) | 0 (0.0%) |
| $100,000 to $299,999 | 15 (25.9%) | 92 (55.1%) |
| $300,000 to $499,999 | 35 (60.3%) | 52 (31.1%) |
| $500,000 to $749,999 | 8 (13.8%) | 23 (13.8%) |
| $750,000 to $999,999 | 0 (0.0%) | 0 (0.0%) |
| $1,000,000 or more | 0 (0.0%) | 0 (0.0%) |
| Total | 58 (100.0%) | 167 (100.0%) |
Household Income by Mortgage Status in Pigeon Creek
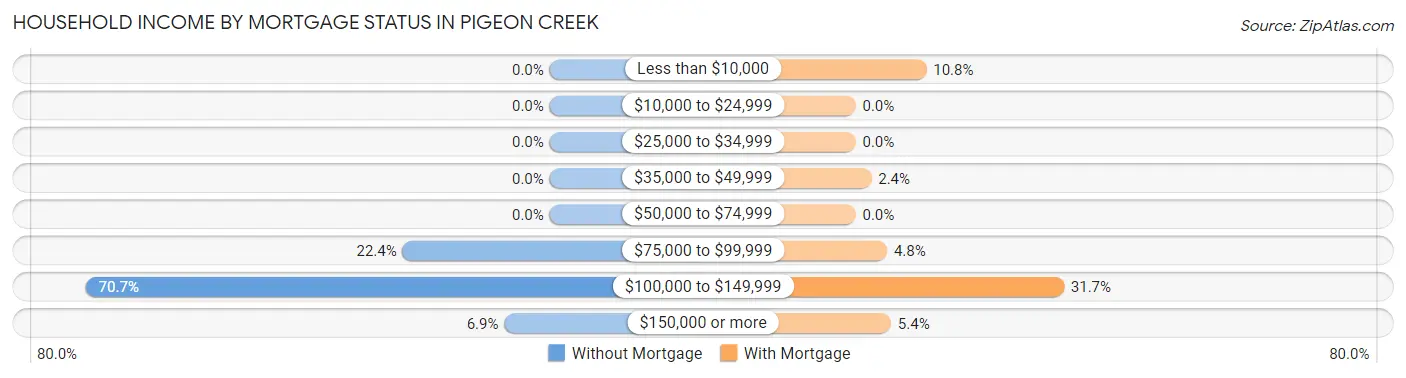
| Household Income | Without Mortgage | With Mortgage |
| Less than $10,000 | 0 (0.0%) | 18 (10.8%) |
| $10,000 to $24,999 | 0 (0.0%) | 0 (0.0%) |
| $25,000 to $34,999 | 0 (0.0%) | 0 (0.0%) |
| $35,000 to $49,999 | 0 (0.0%) | 4 (2.4%) |
| $50,000 to $74,999 | 0 (0.0%) | 0 (0.0%) |
| $75,000 to $99,999 | 13 (22.4%) | 8 (4.8%) |
| $100,000 to $149,999 | 41 (70.7%) | 53 (31.7%) |
| $150,000 or more | 4 (6.9%) | 9 (5.4%) |
| Total | 58 (100.0%) | 167 (100.0%) |
Property Value to Household Income Ratio in Pigeon Creek
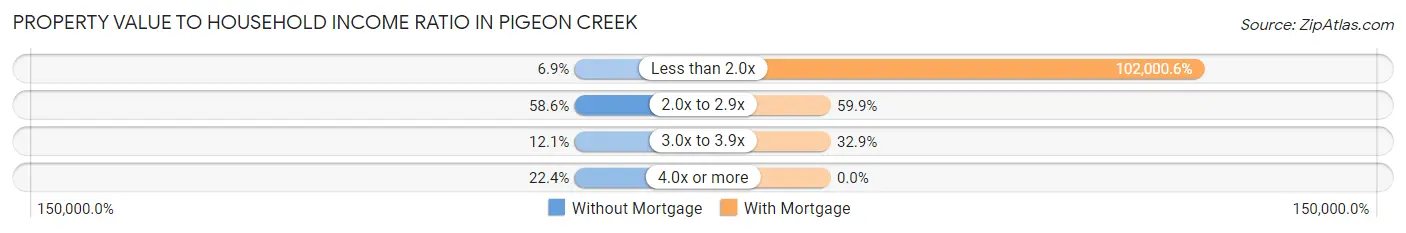
| Value-to-Income Ratio | Without Mortgage | With Mortgage |
| Less than 2.0x | 4 (6.9%) | 170,341 (102,000.6%) |
| 2.0x to 2.9x | 34 (58.6%) | 100 (59.9%) |
| 3.0x to 3.9x | 7 (12.1%) | 55 (32.9%) |
| 4.0x or more | 13 (22.4%) | 0 (0.0%) |
| Total | 58 (100.0%) | 167 (100.0%) |
Real Estate Taxes by Mortgage Status in Pigeon Creek
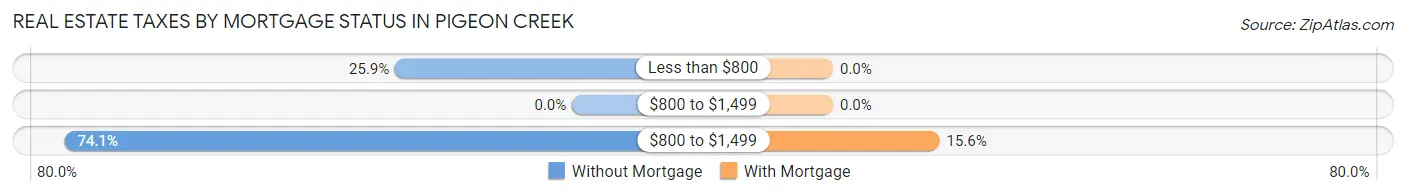
| Property Taxes | Without Mortgage | With Mortgage |
| Less than $800 | 15 (25.9%) | 0 (0.0%) |
| $800 to $1,499 | 0 (0.0%) | 0 (0.0%) |
| $800 to $1,499 | 43 (74.1%) | 26 (15.6%) |
| Total | 58 (100.0%) | 167 (100.0%) |
Health & Disability in Pigeon Creek
Health Insurance Coverage by Age in Pigeon Creek
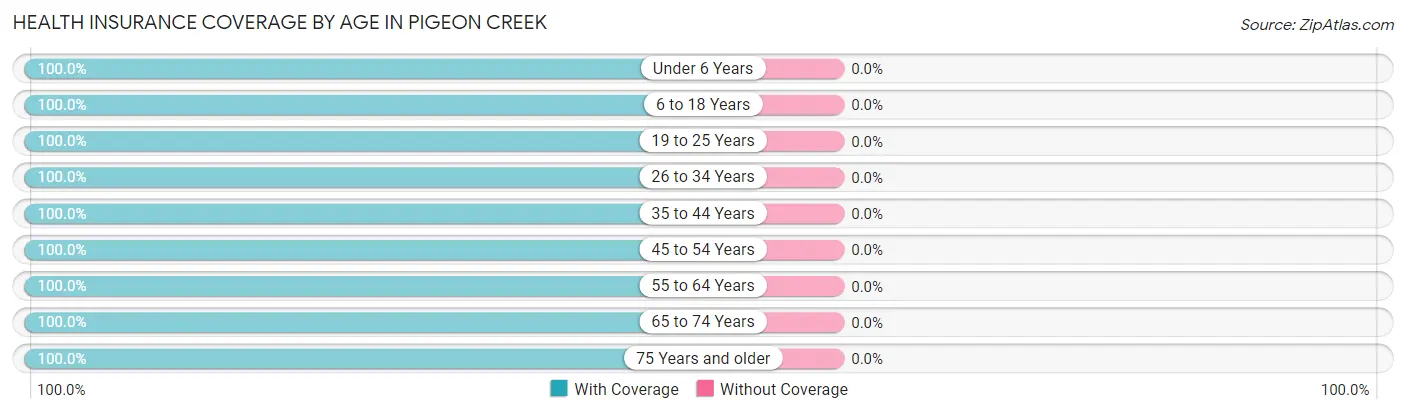
| Age Bracket | With Coverage | Without Coverage |
| Under 6 Years | 78 (100.0%) | 0 (0.0%) |
| 6 to 18 Years | 223 (100.0%) | 0 (0.0%) |
| 19 to 25 Years | 27 (100.0%) | 0 (0.0%) |
| 26 to 34 Years | 100 (100.0%) | 0 (0.0%) |
| 35 to 44 Years | 129 (100.0%) | 0 (0.0%) |
| 45 to 54 Years | 73 (100.0%) | 0 (0.0%) |
| 55 to 64 Years | 78 (100.0%) | 0 (0.0%) |
| 65 to 74 Years | 65 (100.0%) | 0 (0.0%) |
| 75 Years and older | 38 (100.0%) | 0 (0.0%) |
| Total | 811 (100.0%) | 0 (0.0%) |
Health Insurance Coverage by Citizenship Status in Pigeon Creek

| Citizenship Status | With Coverage | Without Coverage |
| Native Born | 78 (100.0%) | 0 (0.0%) |
| Foreign Born, Citizen | 223 (100.0%) | 0 (0.0%) |
| Foreign Born, not a Citizen | 27 (100.0%) | 0 (0.0%) |
Health Insurance Coverage by Household Income in Pigeon Creek
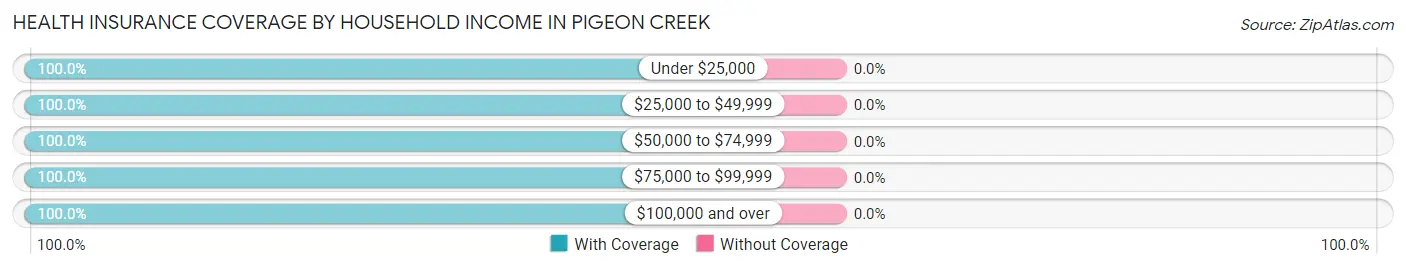
| Household Income | With Coverage | Without Coverage |
| Under $25,000 | 70 (100.0%) | 0 (0.0%) |
| $25,000 to $49,999 | 18 (100.0%) | 0 (0.0%) |
| $50,000 to $74,999 | 16 (100.0%) | 0 (0.0%) |
| $75,000 to $99,999 | 156 (100.0%) | 0 (0.0%) |
| $100,000 and over | 551 (100.0%) | 0 (0.0%) |
Public vs Private Health Insurance Coverage by Age in Pigeon Creek
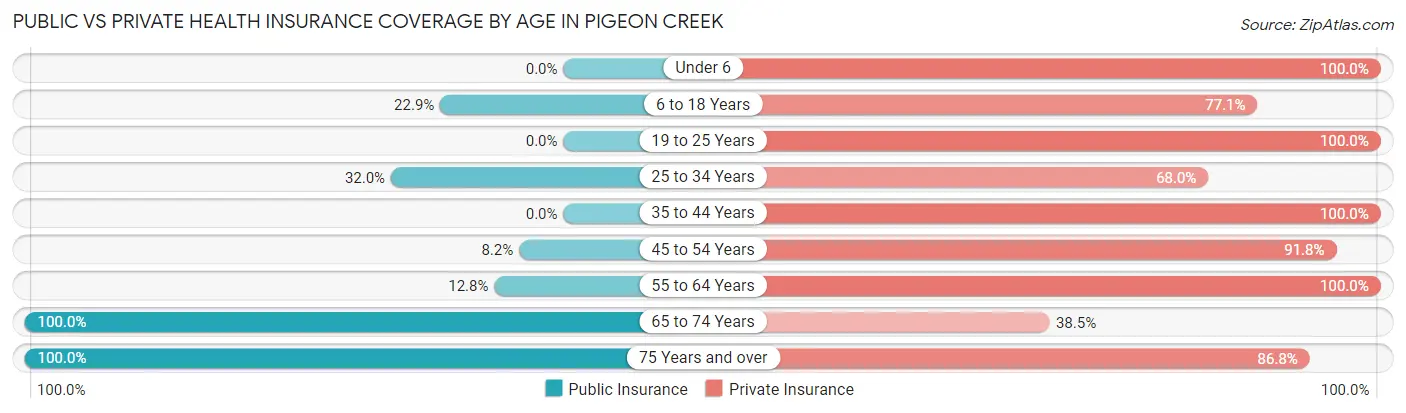
| Age Bracket | Public Insurance | Private Insurance |
| Under 6 | 0 (0.0%) | 78 (100.0%) |
| 6 to 18 Years | 51 (22.9%) | 172 (77.1%) |
| 19 to 25 Years | 0 (0.0%) | 27 (100.0%) |
| 25 to 34 Years | 32 (32.0%) | 68 (68.0%) |
| 35 to 44 Years | 0 (0.0%) | 129 (100.0%) |
| 45 to 54 Years | 6 (8.2%) | 67 (91.8%) |
| 55 to 64 Years | 10 (12.8%) | 78 (100.0%) |
| 65 to 74 Years | 65 (100.0%) | 25 (38.5%) |
| 75 Years and over | 38 (100.0%) | 33 (86.8%) |
| Total | 202 (24.9%) | 677 (83.5%) |
Disability Status by Sex by Age in Pigeon Creek
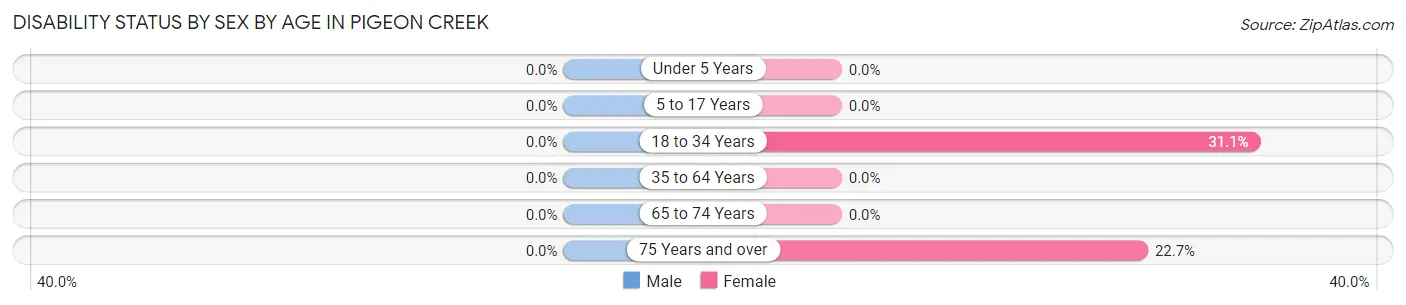
| Age Bracket | Male | Female |
| Under 5 Years | 0 (0.0%) | 0 (0.0%) |
| 5 to 17 Years | 0 (0.0%) | 0 (0.0%) |
| 18 to 34 Years | 0 (0.0%) | 23 (31.1%) |
| 35 to 64 Years | 0 (0.0%) | 0 (0.0%) |
| 65 to 74 Years | 0 (0.0%) | 0 (0.0%) |
| 75 Years and over | 0 (0.0%) | 5 (22.7%) |
Disability Class by Sex by Age in Pigeon Creek
Disability Class: Hearing Difficulty
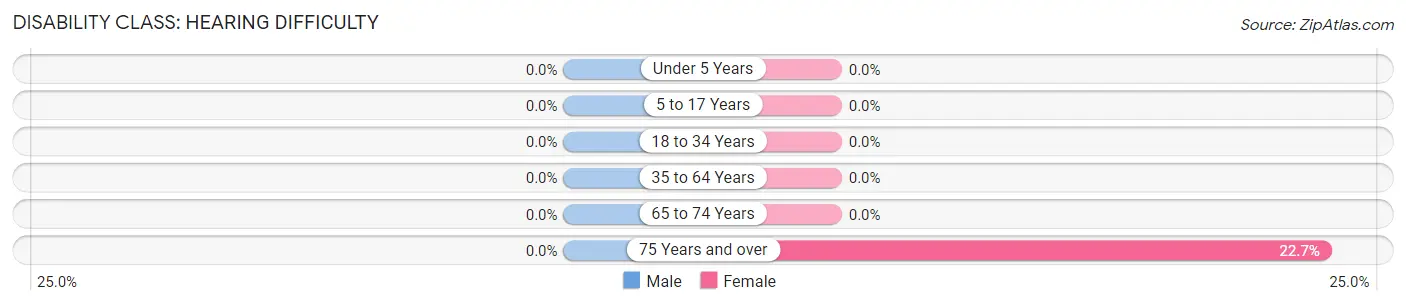
| Age Bracket | Male | Female |
| Under 5 Years | 0 (0.0%) | 0 (0.0%) |
| 5 to 17 Years | 0 (0.0%) | 0 (0.0%) |
| 18 to 34 Years | 0 (0.0%) | 0 (0.0%) |
| 35 to 64 Years | 0 (0.0%) | 0 (0.0%) |
| 65 to 74 Years | 0 (0.0%) | 0 (0.0%) |
| 75 Years and over | 0 (0.0%) | 5 (22.7%) |
Disability Class: Vision Difficulty
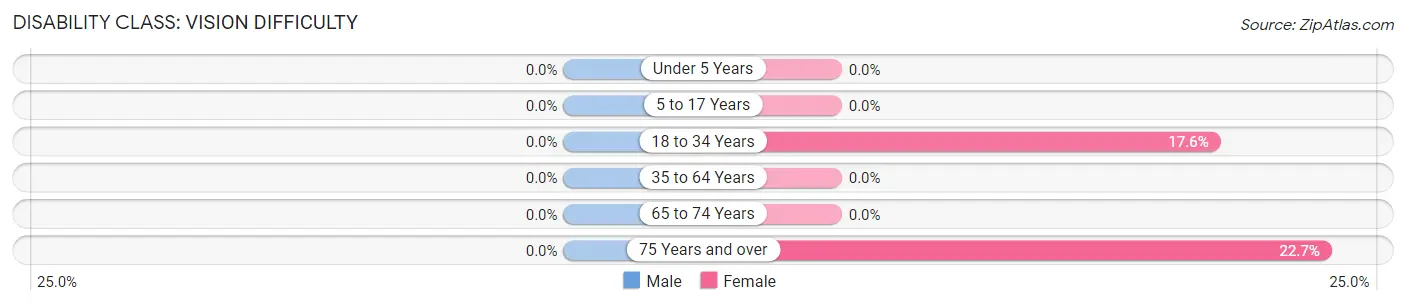
| Age Bracket | Male | Female |
| Under 5 Years | 0 (0.0%) | 0 (0.0%) |
| 5 to 17 Years | 0 (0.0%) | 0 (0.0%) |
| 18 to 34 Years | 0 (0.0%) | 13 (17.6%) |
| 35 to 64 Years | 0 (0.0%) | 0 (0.0%) |
| 65 to 74 Years | 0 (0.0%) | 0 (0.0%) |
| 75 Years and over | 0 (0.0%) | 5 (22.7%) |
Disability Class: Cognitive Difficulty
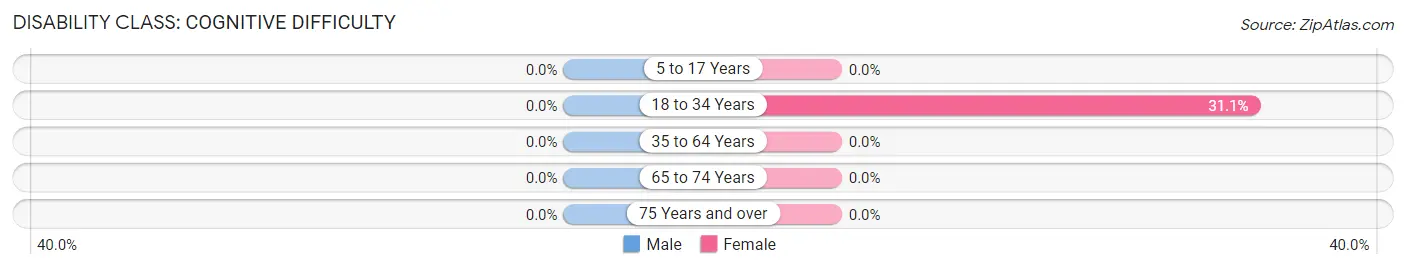
| Age Bracket | Male | Female |
| 5 to 17 Years | 0 (0.0%) | 0 (0.0%) |
| 18 to 34 Years | 0 (0.0%) | 23 (31.1%) |
| 35 to 64 Years | 0 (0.0%) | 0 (0.0%) |
| 65 to 74 Years | 0 (0.0%) | 0 (0.0%) |
| 75 Years and over | 0 (0.0%) | 0 (0.0%) |
Disability Class: Ambulatory Difficulty
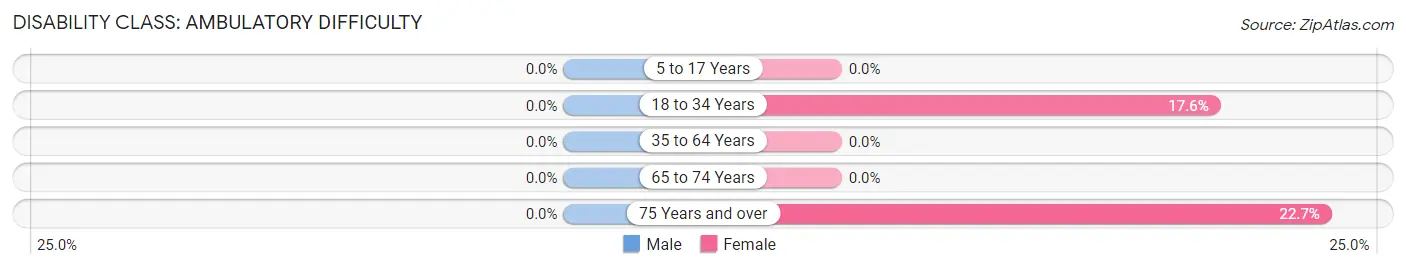
| Age Bracket | Male | Female |
| 5 to 17 Years | 0 (0.0%) | 0 (0.0%) |
| 18 to 34 Years | 0 (0.0%) | 13 (17.6%) |
| 35 to 64 Years | 0 (0.0%) | 0 (0.0%) |
| 65 to 74 Years | 0 (0.0%) | 0 (0.0%) |
| 75 Years and over | 0 (0.0%) | 5 (22.7%) |
Disability Class: Self-Care Difficulty
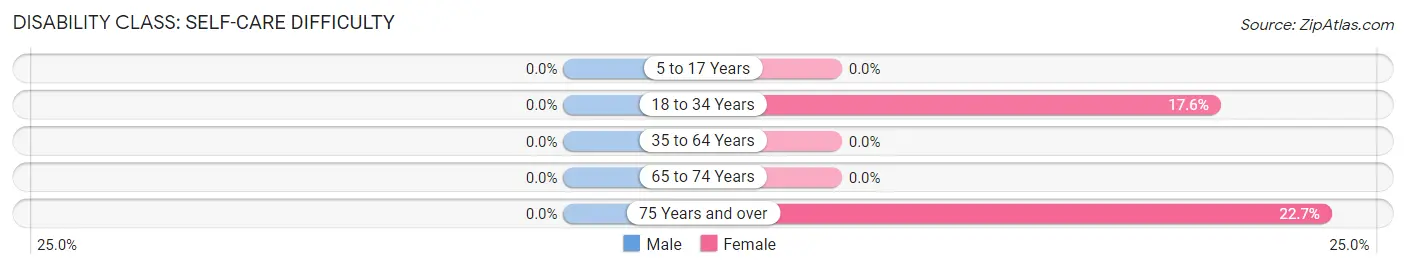
| Age Bracket | Male | Female |
| 5 to 17 Years | 0 (0.0%) | 0 (0.0%) |
| 18 to 34 Years | 0 (0.0%) | 13 (17.6%) |
| 35 to 64 Years | 0 (0.0%) | 0 (0.0%) |
| 65 to 74 Years | 0 (0.0%) | 0 (0.0%) |
| 75 Years and over | 0 (0.0%) | 5 (22.7%) |
Technology Access in Pigeon Creek
Computing Device Access in Pigeon Creek
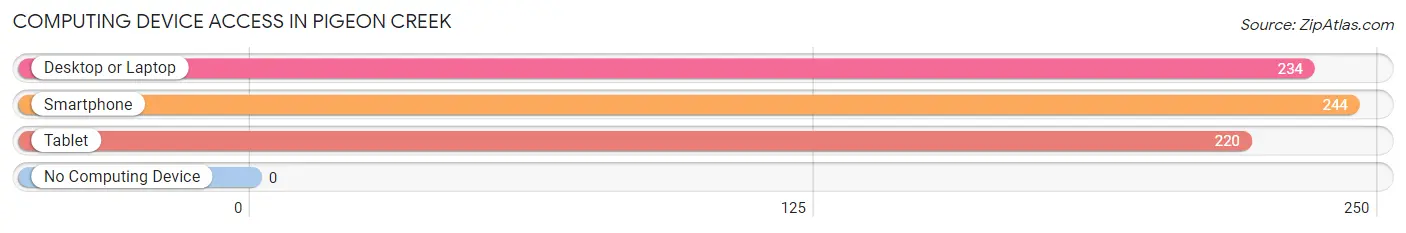
| Device Type | # Households | % Households |
| Desktop or Laptop | 234 | 95.9% |
| Smartphone | 244 | 100.0% |
| Tablet | 220 | 90.2% |
| No Computing Device | 0 | 0.0% |
| Total | 244 | 100.0% |
Internet Access in Pigeon Creek
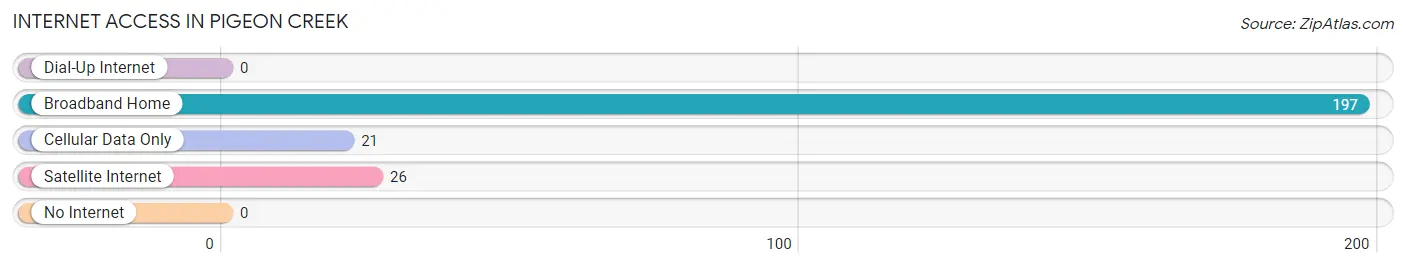
| Internet Type | # Households | % Households |
| Dial-Up Internet | 0 | 0.0% |
| Broadband Home | 197 | 80.7% |
| Cellular Data Only | 21 | 8.6% |
| Satellite Internet | 26 | 10.7% |
| No Internet | 0 | 0.0% |
| Total | 244 | 100.0% |
Pigeon Creek Summary
Pigeon Creek is a small unincorporated community located in the southeastern corner of Ohio, in the United States. It is situated in the Appalachian foothills of the Appalachian Mountains, in the state’s Appalachian region. The community is located in the county of Lawrence, and is part of the Huntington-Ashland, WV-KY-OH, Metropolitan Statistical Area.
History
The area that is now Pigeon Creek was first settled in the late 1700s by a group of settlers from Pennsylvania. The settlers were primarily of German and Scots-Irish descent, and they named the area after the nearby Pigeon Creek. The creek was named for the large number of passenger pigeons that were found in the area.
The first post office in the area was established in 1820, and the community was officially incorporated in 1837. The town was originally known as Pigeon Creek Station, and was a stop on the Ohio and Erie Canal. The canal was an important transportation route for the area, and it allowed for the transportation of goods and people between the Ohio River and Lake Erie.
The town grew slowly over the years, and by the early 1900s, it had a population of around 500 people. The town was primarily an agricultural community, and the main crops grown in the area were corn, wheat, and hay.
Geography
Pigeon Creek is located in the southeastern corner of Ohio, in the Appalachian region. The community is situated in the foothills of the Appalachian Mountains, and is surrounded by rolling hills and forests. The town is located in the county of Lawrence, and is part of the Huntington-Ashland, WV-KY-OH, Metropolitan Statistical Area.
The town is located at the intersection of State Route 93 and State Route 7. The nearest major city is Huntington, West Virginia, which is located about 25 miles to the south. The nearest airport is Tri-State Airport, which is located about 30 miles to the south.
Economy
The economy of Pigeon Creek is primarily based on agriculture. The main crops grown in the area are corn, wheat, and hay. The town also has a few small businesses, including a general store, a gas station, and a few restaurants.
The town is also home to a few small manufacturing companies, including a furniture factory and a plastics factory. The town also has a few small service businesses, including a few auto repair shops and a few small construction companies.
Demographics
As of the 2010 census, the population of Pigeon Creek was 545 people. The racial makeup of the town was 97.3% White, 0.7% African American, 0.2% Native American, 0.2% Asian, and 1.6% from other races. The median household income in the town was $37,500, and the median family income was $41,250.
The town has a high rate of poverty, with 28.3% of the population living below the poverty line. The town also has a high rate of unemployment, with 8.3% of the population unemployed. The town also has a high rate of crime, with a crime rate of 8.3 per 1,000 people.
Conclusion
Pigeon Creek is a small unincorporated community located in the southeastern corner of Ohio, in the United States. The town was first settled in the late 1700s by a group of settlers from Pennsylvania, and it was officially incorporated in 1837. The town is primarily an agricultural community, and the main crops grown in the area are corn, wheat, and hay. The town also has a few small businesses, including a general store, a gas station, and a few restaurants. As of the 2010 census, the population of Pigeon Creek was 545 people. The town has a high rate of poverty, with 28.3% of the population living below the poverty line. The town also has a high rate of unemployment, with 8.3% of the population unemployed. The town also has a high rate of crime, with a crime rate of 8.3 per 1,000 people.
Common Questions
What is Per Capita Income in Pigeon Creek?
Per Capita income in Pigeon Creek is $56,921.
What is the Median Family Income in Pigeon Creek?
Median Family Income in Pigeon Creek is $134,000.
What is the Median Household income in Pigeon Creek?
Median Household Income in Pigeon Creek is $134,000.
What is Income or Wage Gap in Pigeon Creek?
Income or Wage Gap in Pigeon Creek is 44.3%.
Women in Pigeon Creek earn 55.7 cents for every dollar earned by a man.
What is Inequality or Gini Index in Pigeon Creek?
Inequality or Gini Index in Pigeon Creek is 0.45.
What is the Total Population of Pigeon Creek?
Total Population of Pigeon Creek is 811.
What is the Total Male Population of Pigeon Creek?
Total Male Population of Pigeon Creek is 430.
What is the Total Female Population of Pigeon Creek?
Total Female Population of Pigeon Creek is 381.
What is the Ratio of Males per 100 Females in Pigeon Creek?
There are 112.86 Males per 100 Females in Pigeon Creek.
What is the Ratio of Females per 100 Males in Pigeon Creek?
There are 88.60 Females per 100 Males in Pigeon Creek.
What is the Median Population Age in Pigeon Creek?
Median Population Age in Pigeon Creek is 34.3 Years.
What is the Average Family Size in Pigeon Creek
Average Family Size in Pigeon Creek is 3.6 People.
What is the Average Household Size in Pigeon Creek
Average Household Size in Pigeon Creek is 3.3 People.
How Large is the Labor Force in Pigeon Creek?
There are 408 People in the Labor Forcein in Pigeon Creek.
What is the Percentage of People in the Labor Force in Pigeon Creek?
77.1% of People are in the Labor Force in Pigeon Creek.
What is the Unemployment Rate in Pigeon Creek?
Unemployment Rate in Pigeon Creek is 3.2%.