Moreland Hills, OH Map & Demographics
Moreland Hills Map
Moreland Hills Overview
$149,750
PER CAPITA INCOME
$208,611
AVG FAMILY INCOME
$199,279
AVG HOUSEHOLD INCOME
55.5%
WAGE / INCOME GAP [ % ]
44.5¢/ $1
WAGE / INCOME GAP [ $ ]
$14,554
FAMILY INCOME DEFICIT
0.56
INEQUALITY / GINI INDEX
3,440
TOTAL POPULATION
1,795
MALE POPULATION
1,645
FEMALE POPULATION
109.12
MALES / 100 FEMALES
91.64
FEMALES / 100 MALES
55.6
MEDIAN AGE
2.6
AVG FAMILY SIZE
2.4
AVG HOUSEHOLD SIZE
1,765
LABOR FORCE [ PEOPLE ]
59.3%
PERCENT IN LABOR FORCE
5.4%
UNEMPLOYMENT RATE
Moreland Hills Area Codes
Income in Moreland Hills
Income Overview in Moreland Hills
Per Capita Income in Moreland Hills is $149,750, while median incomes of families and households are $208,611 and $199,279 respectively.
| Characteristic | Number | Measure |
| Per Capita Income | 3,440 | $149,750 |
| Median Family Income | 1,112 | $208,611 |
| Mean Family Income | 1,112 | $397,600 |
| Median Household Income | 1,425 | $199,279 |
| Mean Household Income | 1,425 | $361,478 |
| Income Deficit | 1,112 | $14,554 |
| Wage / Income Gap (%) | 3,440 | 55.51% |
| Wage / Income Gap ($) | 3,440 | 44.49¢ per $1 |
| Gini / Inequality Index | 3,440 | 0.56 |
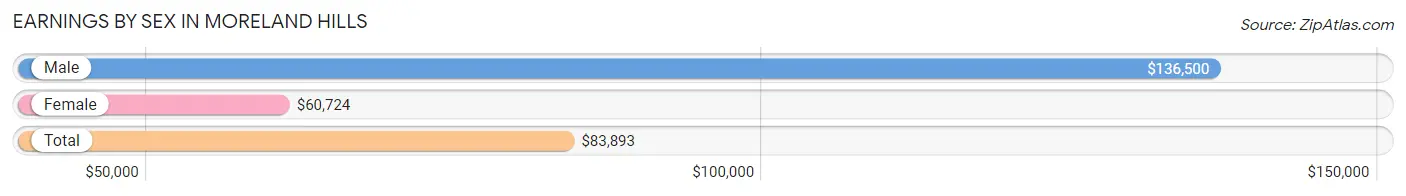
Earnings by Sex in Moreland Hills
Average Earnings in Moreland Hills are $83,893, $136,500 for men and $60,724 for women, a difference of 55.5%.
| Sex | Number | Average Earnings |
| Male | 1,068 (56.7%) | $136,500 |
| Female | 815 (43.3%) | $60,724 |
| Total | 1,883 (100.0%) | $83,893 |
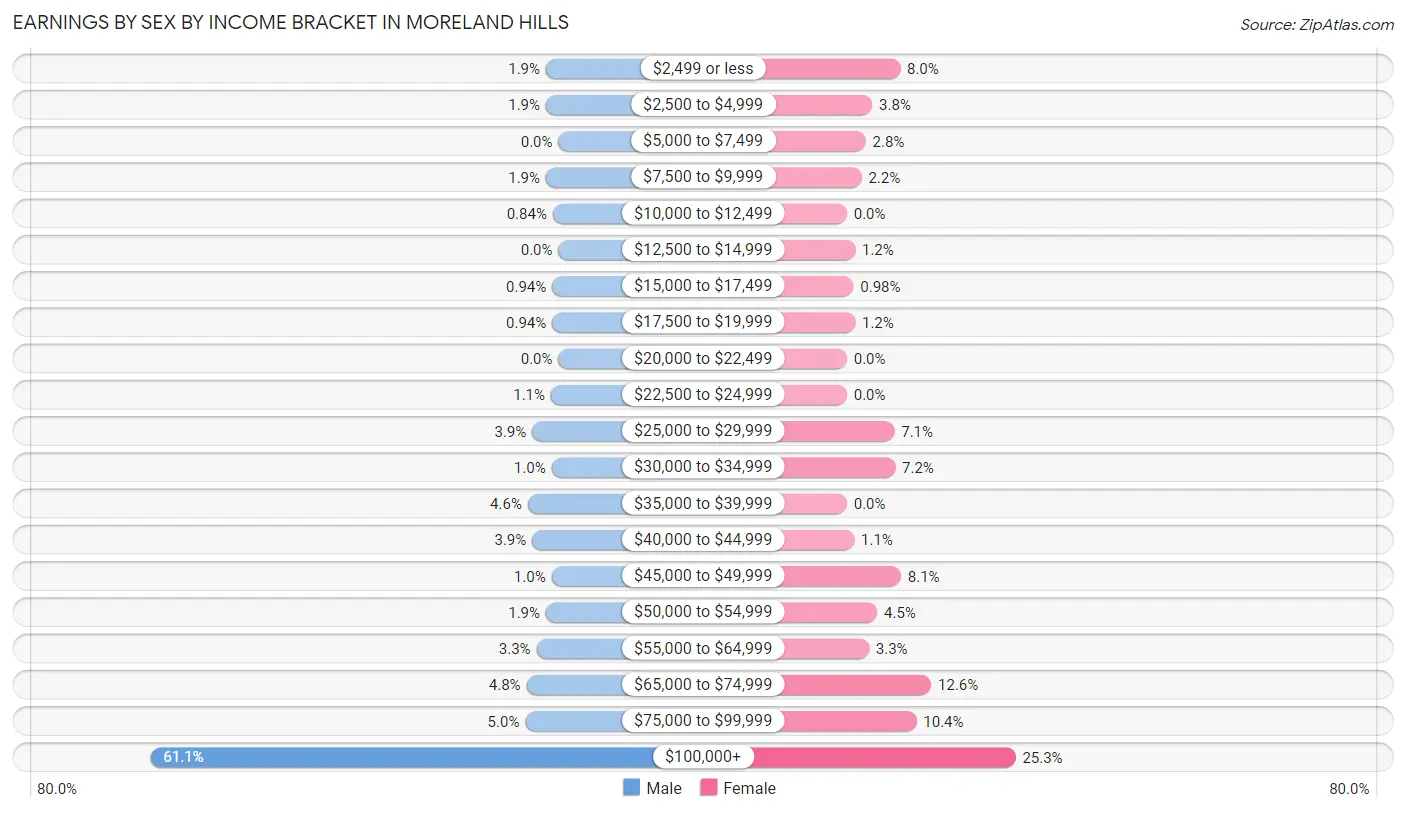
Earnings by Sex by Income Bracket in Moreland Hills
The most common earnings brackets in Moreland Hills are $100,000+ for men (653 | 61.1%) and $100,000+ for women (206 | 25.3%).
| Income | Male | Female |
| $2,499 or less | 20 (1.9%) | 65 (8.0%) |
| $2,500 to $4,999 | 20 (1.9%) | 31 (3.8%) |
| $5,000 to $7,499 | 0 (0.0%) | 23 (2.8%) |
| $7,500 to $9,999 | 20 (1.9%) | 18 (2.2%) |
| $10,000 to $12,499 | 9 (0.8%) | 0 (0.0%) |
| $12,500 to $14,999 | 0 (0.0%) | 10 (1.2%) |
| $15,000 to $17,499 | 10 (0.9%) | 8 (1.0%) |
| $17,500 to $19,999 | 10 (0.9%) | 10 (1.2%) |
| $20,000 to $22,499 | 0 (0.0%) | 0 (0.0%) |
| $22,500 to $24,999 | 12 (1.1%) | 0 (0.0%) |
| $25,000 to $29,999 | 42 (3.9%) | 58 (7.1%) |
| $30,000 to $34,999 | 11 (1.0%) | 59 (7.2%) |
| $35,000 to $39,999 | 49 (4.6%) | 0 (0.0%) |
| $40,000 to $44,999 | 42 (3.9%) | 9 (1.1%) |
| $45,000 to $49,999 | 11 (1.0%) | 66 (8.1%) |
| $50,000 to $54,999 | 20 (1.9%) | 37 (4.5%) |
| $55,000 to $64,999 | 35 (3.3%) | 27 (3.3%) |
| $65,000 to $74,999 | 51 (4.8%) | 103 (12.6%) |
| $75,000 to $99,999 | 53 (5.0%) | 85 (10.4%) |
| $100,000+ | 653 (61.1%) | 206 (25.3%) |
| Total | 1,068 (100.0%) | 815 (100.0%) |
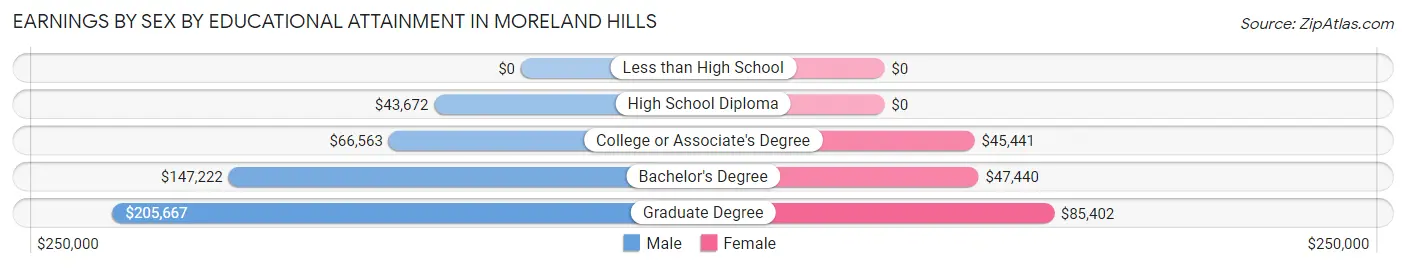
Earnings by Sex by Educational Attainment in Moreland Hills
Average earnings in Moreland Hills are $138,839 for men and $66,125 for women, a difference of 52.4%. Men with an educational attainment of graduate degree enjoy the highest average annual earnings of $205,667, while those with high school diploma education earn the least with $43,672. Women with an educational attainment of graduate degree earn the most with the average annual earnings of $85,402, while those with college or associate's degree education have the smallest earnings of $45,441.
| Educational Attainment | Male Income | Female Income |
| Less than High School | - | - |
| High School Diploma | $43,672 | $0 |
| College or Associate's Degree | $66,563 | $45,441 |
| Bachelor's Degree | $147,222 | $47,440 |
| Graduate Degree | $205,667 | $85,402 |
| Total | $138,839 | $66,125 |
Family Income in Moreland Hills
Family Income Brackets in Moreland Hills
According to the Moreland Hills family income data, there are 580 families falling into the $200,000+ income range, which is the most common income bracket and makes up 52.2% of all families.
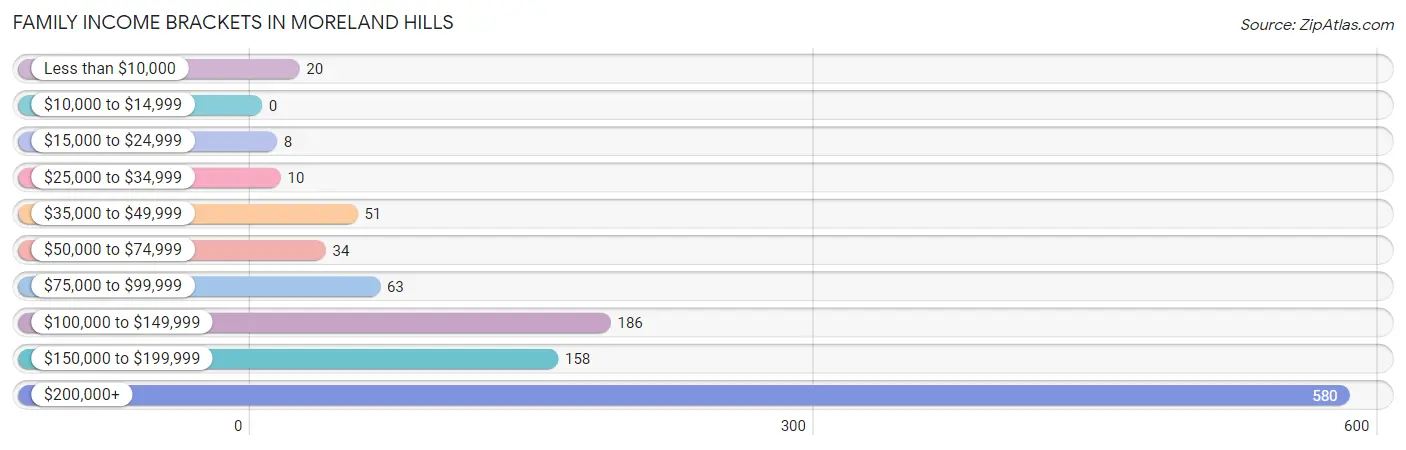
| Income Bracket | # Families | % Families |
| Less than $10,000 | 20 | 1.8% |
| $10,000 to $14,999 | 0 | 0.0% |
| $15,000 to $24,999 | 8 | 0.7% |
| $25,000 to $34,999 | 10 | 0.9% |
| $35,000 to $49,999 | 51 | 4.6% |
| $50,000 to $74,999 | 34 | 3.1% |
| $75,000 to $99,999 | 63 | 5.7% |
| $100,000 to $149,999 | 186 | 16.7% |
| $150,000 to $199,999 | 158 | 14.2% |
| $200,000+ | 580 | 52.2% |
Family Income by Famaliy Size in Moreland Hills
5-person families (85 | 7.6%) account for the highest median family income in Moreland Hills with $250,001 per family, while 2-person families (717 | 64.5%) have the highest median income of $89,488 per family member.
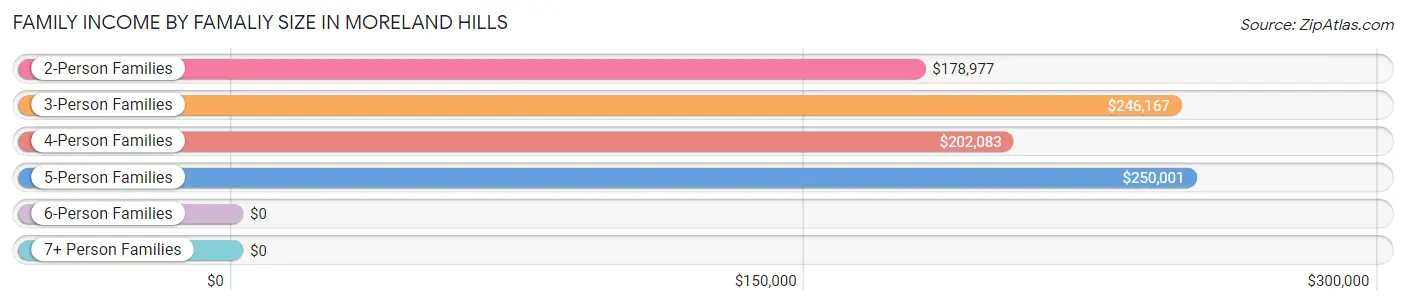
| Income Bracket | # Families | Median Income |
| 2-Person Families | 717 (64.5%) | $178,977 |
| 3-Person Families | 212 (19.1%) | $246,167 |
| 4-Person Families | 98 (8.8%) | $202,083 |
| 5-Person Families | 85 (7.6%) | $250,001 |
| 6-Person Families | 0 (0.0%) | $0 |
| 7+ Person Families | 0 (0.0%) | $0 |
| Total | 1,112 (100.0%) | $208,611 |
Family Income by Number of Earners in Moreland Hills
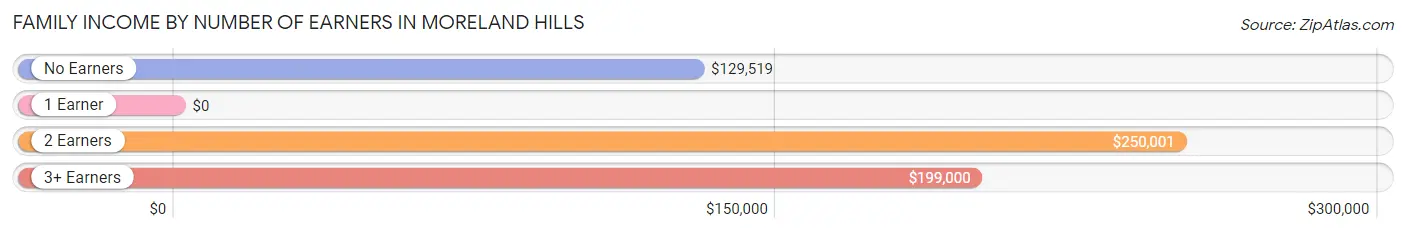
| Number of Earners | # Families | Median Income |
| No Earners | 225 (20.2%) | $129,519 |
| 1 Earner | 323 (29.0%) | $0 |
| 2 Earners | 516 (46.4%) | $250,001 |
| 3+ Earners | 48 (4.3%) | $199,000 |
| Total | 1,112 (100.0%) | $208,611 |
Household Income in Moreland Hills
Household Income Brackets in Moreland Hills
With 705 households falling in the category, the $200,000+ income range is the most frequent in Moreland Hills, accounting for 49.5% of all households.
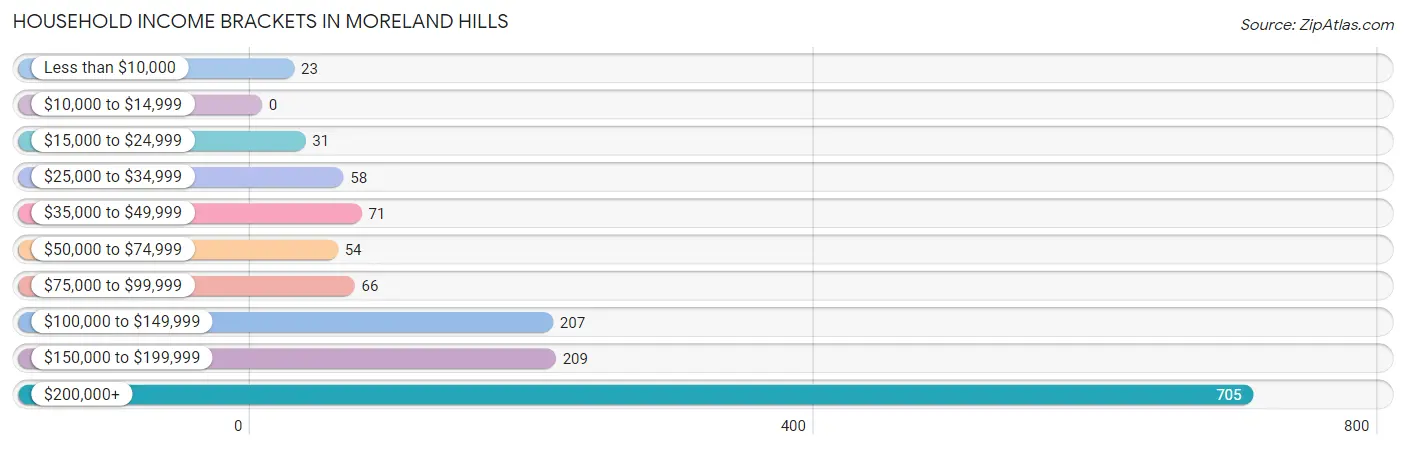
| Income Bracket | # Households | % Households |
| Less than $10,000 | 23 | 1.6% |
| $10,000 to $14,999 | 0 | 0.0% |
| $15,000 to $24,999 | 31 | 2.2% |
| $25,000 to $34,999 | 58 | 4.1% |
| $35,000 to $49,999 | 71 | 5.0% |
| $50,000 to $74,999 | 54 | 3.8% |
| $75,000 to $99,999 | 66 | 4.6% |
| $100,000 to $149,999 | 207 | 14.5% |
| $150,000 to $199,999 | 209 | 14.7% |
| $200,000+ | 705 | 49.5% |
Household Income by Householder Age in Moreland Hills
The median household income in Moreland Hills is $199,279, with the highest median household income of $204,265 found in the 25 to 44 years age bracket for the primary householder. A total of 198 households (13.9%) fall into this category.
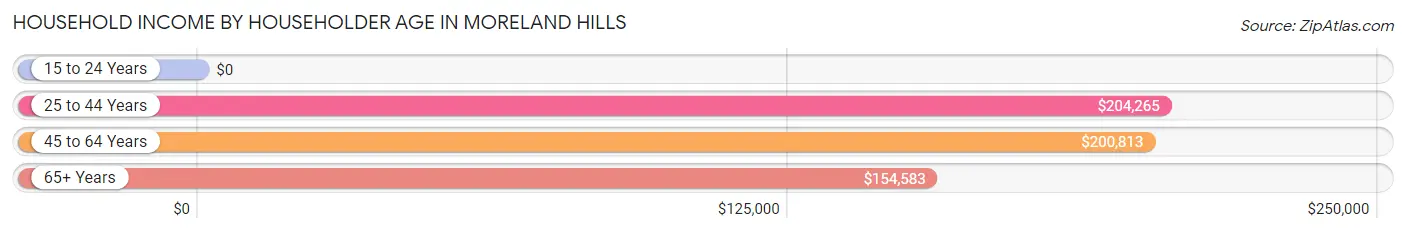
| Income Bracket | # Households | Median Income |
| 15 to 24 Years | 0 (0.0%) | $0 |
| 25 to 44 Years | 198 (13.9%) | $204,265 |
| 45 to 64 Years | 639 (44.8%) | $200,813 |
| 65+ Years | 588 (41.3%) | $154,583 |
| Total | 1,425 (100.0%) | $199,279 |
Poverty in Moreland Hills
Income Below Poverty by Sex and Age in Moreland Hills
With 3.1% poverty level for males and 4.0% for females among the residents of Moreland Hills, 18 to 24 year old males and 55 to 64 year old females are the most vulnerable to poverty, with 10 males (18.9%) and 53 females (12.7%) in their respective age groups living below the poverty level.
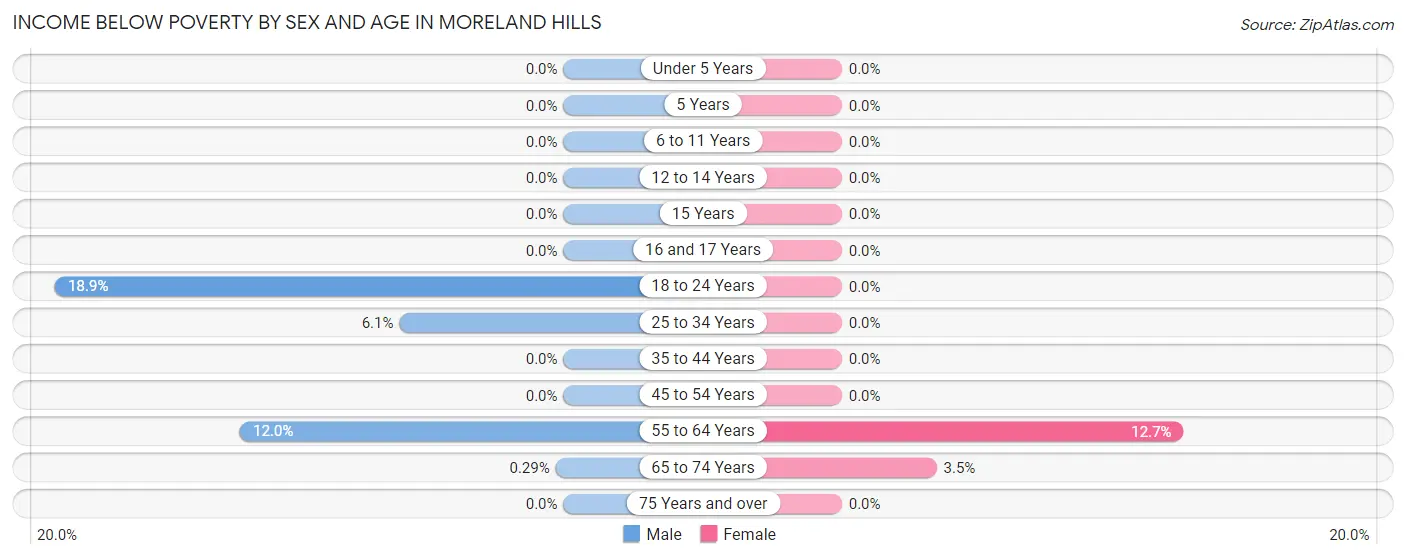
| Age Bracket | Male | Female |
| Under 5 Years | 0 (0.0%) | 0 (0.0%) |
| 5 Years | 0 (0.0%) | 0 (0.0%) |
| 6 to 11 Years | 0 (0.0%) | 0 (0.0%) |
| 12 to 14 Years | 0 (0.0%) | 0 (0.0%) |
| 15 Years | 0 (0.0%) | 0 (0.0%) |
| 16 and 17 Years | 0 (0.0%) | 0 (0.0%) |
| 18 to 24 Years | 10 (18.9%) | 0 (0.0%) |
| 25 to 34 Years | 12 (6.1%) | 0 (0.0%) |
| 35 to 44 Years | 0 (0.0%) | 0 (0.0%) |
| 45 to 54 Years | 0 (0.0%) | 0 (0.0%) |
| 55 to 64 Years | 33 (12.0%) | 53 (12.7%) |
| 65 to 74 Years | 1 (0.3%) | 12 (3.5%) |
| 75 Years and over | 0 (0.0%) | 0 (0.0%) |
| Total | 56 (3.1%) | 65 (4.0%) |
Income Above Poverty by Sex and Age in Moreland Hills
According to the poverty statistics in Moreland Hills, males aged under 5 years and females aged under 5 years are the age groups that are most secure financially, with 100.0% of males and 100.0% of females in these age groups living above the poverty line.
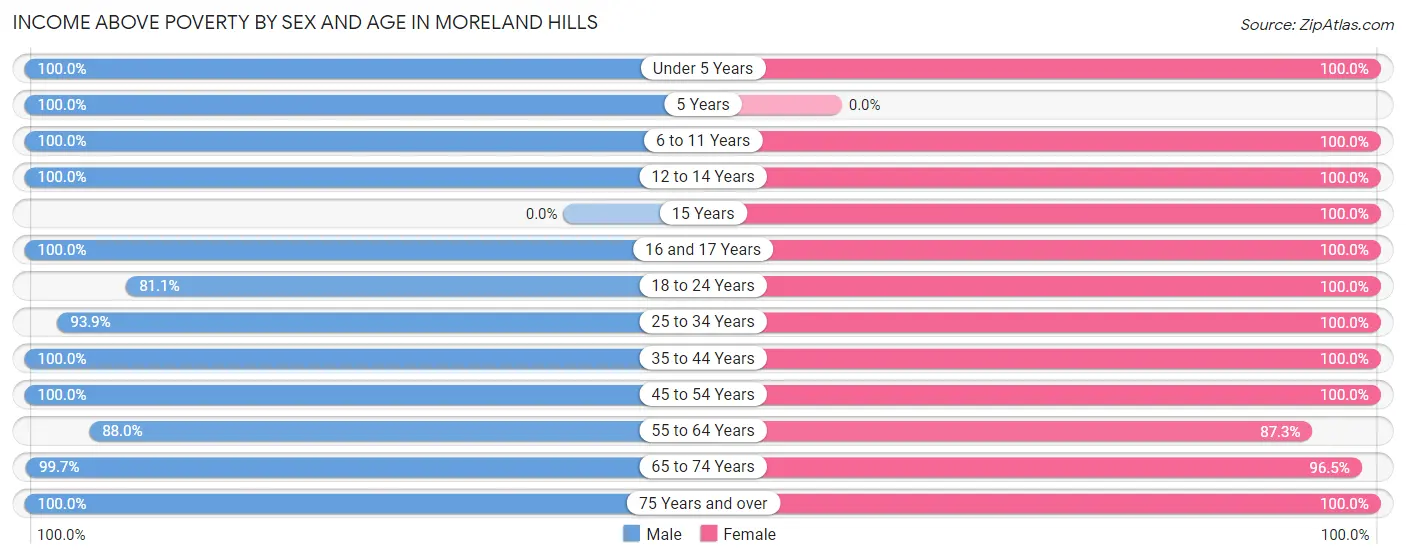
| Age Bracket | Male | Female |
| Under 5 Years | 76 (100.0%) | 29 (100.0%) |
| 5 Years | 32 (100.0%) | 0 (0.0%) |
| 6 to 11 Years | 87 (100.0%) | 83 (100.0%) |
| 12 to 14 Years | 112 (100.0%) | 33 (100.0%) |
| 15 Years | 0 (0.0%) | 11 (100.0%) |
| 16 and 17 Years | 28 (100.0%) | 55 (100.0%) |
| 18 to 24 Years | 43 (81.1%) | 11 (100.0%) |
| 25 to 34 Years | 185 (93.9%) | 51 (100.0%) |
| 35 to 44 Years | 157 (100.0%) | 192 (100.0%) |
| 45 to 54 Years | 231 (100.0%) | 252 (100.0%) |
| 55 to 64 Years | 242 (88.0%) | 365 (87.3%) |
| 65 to 74 Years | 338 (99.7%) | 329 (96.5%) |
| 75 Years and over | 208 (100.0%) | 169 (100.0%) |
| Total | 1,739 (96.9%) | 1,580 (96.1%) |
Income Below Poverty Among Married-Couple Families in Moreland Hills
The poverty statistics for married-couple families in Moreland Hills show that 2.8% or 28 of the total 1,020 families live below the poverty line. Families with no children have the highest poverty rate of 3.7%, comprising of 28 families. On the other hand, families with 1 or 2 children have the lowest poverty rate of 0.0%, which includes 0 families.
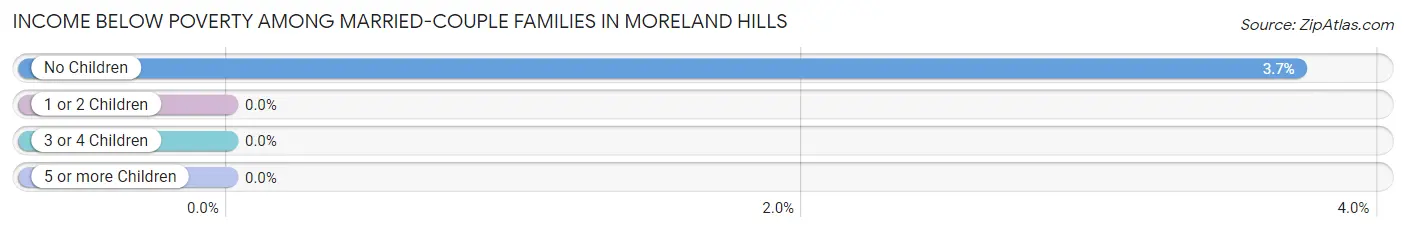
| Children | Above Poverty | Below Poverty |
| No Children | 724 (96.3%) | 28 (3.7%) |
| 1 or 2 Children | 183 (100.0%) | 0 (0.0%) |
| 3 or 4 Children | 85 (100.0%) | 0 (0.0%) |
| 5 or more Children | 0 (0.0%) | 0 (0.0%) |
| Total | 992 (97.3%) | 28 (2.8%) |
Income Below Poverty Among Single-Parent Households in Moreland Hills
| Children | Single Father | Single Mother |
| No Children | 0 (0.0%) | 0 (0.0%) |
| 1 or 2 Children | 0 (0.0%) | 0 (0.0%) |
| 3 or 4 Children | 0 (0.0%) | 0 (0.0%) |
| 5 or more Children | 0 (0.0%) | 0 (0.0%) |
| Total | 0 (0.0%) | 0 (0.0%) |
Income Below Poverty Among Married-Couple vs Single-Parent Households in Moreland Hills
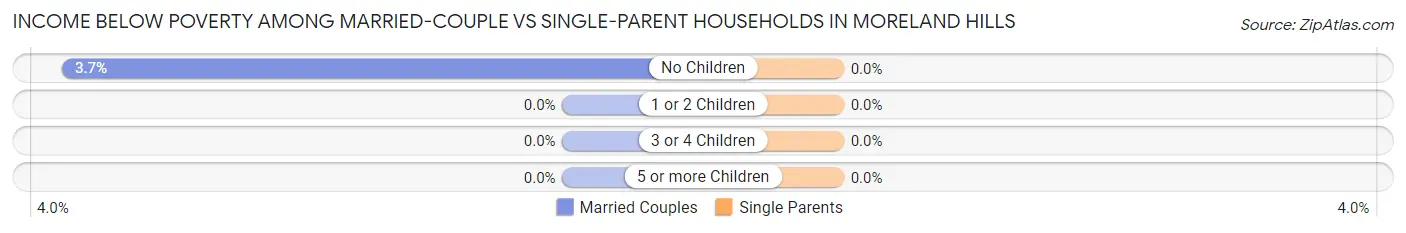
| Children | Married-Couple Families | Single-Parent Households |
| No Children | 28 (3.7%) | 0 (0.0%) |
| 1 or 2 Children | 0 (0.0%) | 0 (0.0%) |
| 3 or 4 Children | 0 (0.0%) | 0 (0.0%) |
| 5 or more Children | 0 (0.0%) | 0 (0.0%) |
| Total | 28 (2.8%) | 0 (0.0%) |
Race in Moreland Hills
The most populous races in Moreland Hills are White / Caucasian (3,220 | 93.6%), Asian (124 | 3.6%), and Two or more Races (64 | 1.9%).
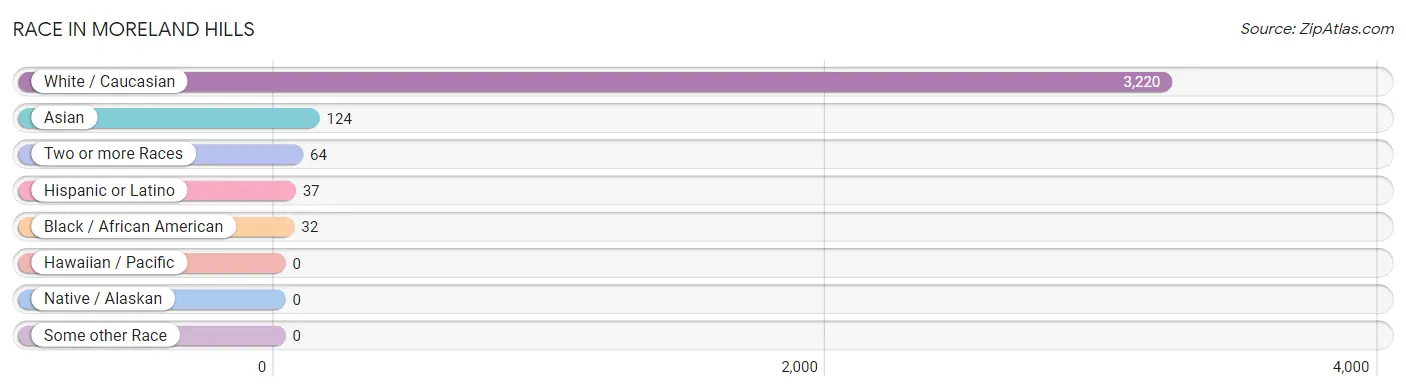
| Race | # Population | % Population |
| Asian | 124 | 3.6% |
| Black / African American | 32 | 0.9% |
| Hawaiian / Pacific | 0 | 0.0% |
| Hispanic or Latino | 37 | 1.1% |
| Native / Alaskan | 0 | 0.0% |
| White / Caucasian | 3,220 | 93.6% |
| Two or more Races | 64 | 1.9% |
| Some other Race | 0 | 0.0% |
| Total | 3,440 | 100.0% |
Ancestry in Moreland Hills
The most populous ancestries reported in Moreland Hills are German (455 | 13.2%), English (316 | 9.2%), Italian (293 | 8.5%), Irish (264 | 7.7%), and Russian (245 | 7.1%), together accounting for 45.7% of all Moreland Hills residents.
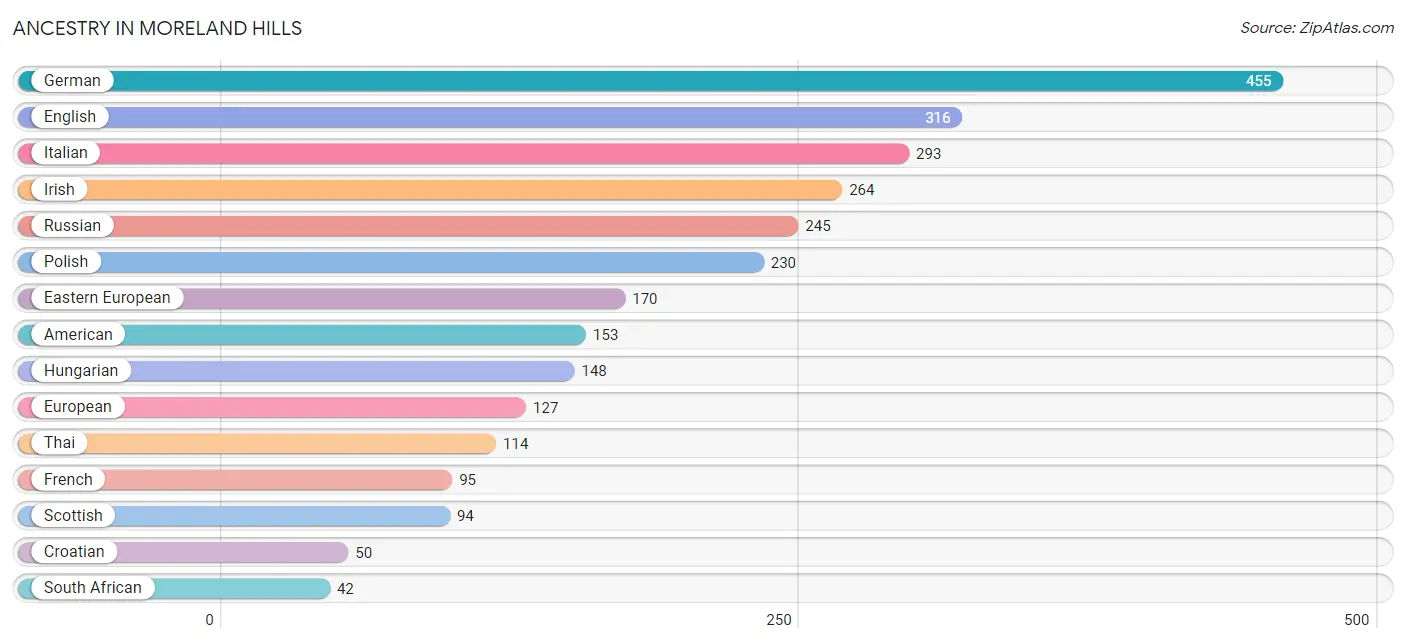
| Ancestry | # Population | % Population |
| American | 153 | 4.4% |
| Arab | 32 | 0.9% |
| Austrian | 9 | 0.3% |
| Basque | 11 | 0.3% |
| Blackfeet | 16 | 0.5% |
| Bolivian | 16 | 0.5% |
| Brazilian | 24 | 0.7% |
| British | 19 | 0.5% |
| British West Indian | 12 | 0.4% |
| Croatian | 50 | 1.5% |
| Cuban | 21 | 0.6% |
| Czech | 32 | 0.9% |
| Danish | 8 | 0.2% |
| Dutch | 10 | 0.3% |
| Eastern European | 170 | 4.9% |
| English | 316 | 9.2% |
| Estonian | 12 | 0.4% |
| European | 127 | 3.7% |
| Finnish | 11 | 0.3% |
| French | 95 | 2.8% |
| German | 455 | 13.2% |
| Greek | 10 | 0.3% |
| Hungarian | 148 | 4.3% |
| Iraqi | 22 | 0.6% |
| Irish | 264 | 7.7% |
| Italian | 293 | 8.5% |
| Latvian | 12 | 0.4% |
| Lithuanian | 18 | 0.5% |
| Norwegian | 20 | 0.6% |
| Pennsylvania German | 37 | 1.1% |
| Polish | 230 | 6.7% |
| Romanian | 18 | 0.5% |
| Russian | 245 | 7.1% |
| Scotch-Irish | 41 | 1.2% |
| Scottish | 94 | 2.7% |
| Serbian | 22 | 0.6% |
| Slovak | 17 | 0.5% |
| Slovene | 30 | 0.9% |
| South African | 42 | 1.2% |
| South American | 16 | 0.5% |
| Subsaharan African | 42 | 1.2% |
| Swedish | 25 | 0.7% |
| Swiss | 26 | 0.8% |
| Thai | 114 | 3.3% |
| Ukrainian | 31 | 0.9% |
| Welsh | 19 | 0.5% |
| Yugoslavian | 22 | 0.6% | View All 47 Rows |
Immigrants in Moreland Hills
The most numerous immigrant groups reported in Moreland Hills came from Europe (222 | 6.5%), Eastern Europe (152 | 4.4%), Asia (111 | 3.2%), Western Europe (70 | 2.0%), and Ukraine (62 | 1.8%), together accounting for 17.9% of all Moreland Hills residents.
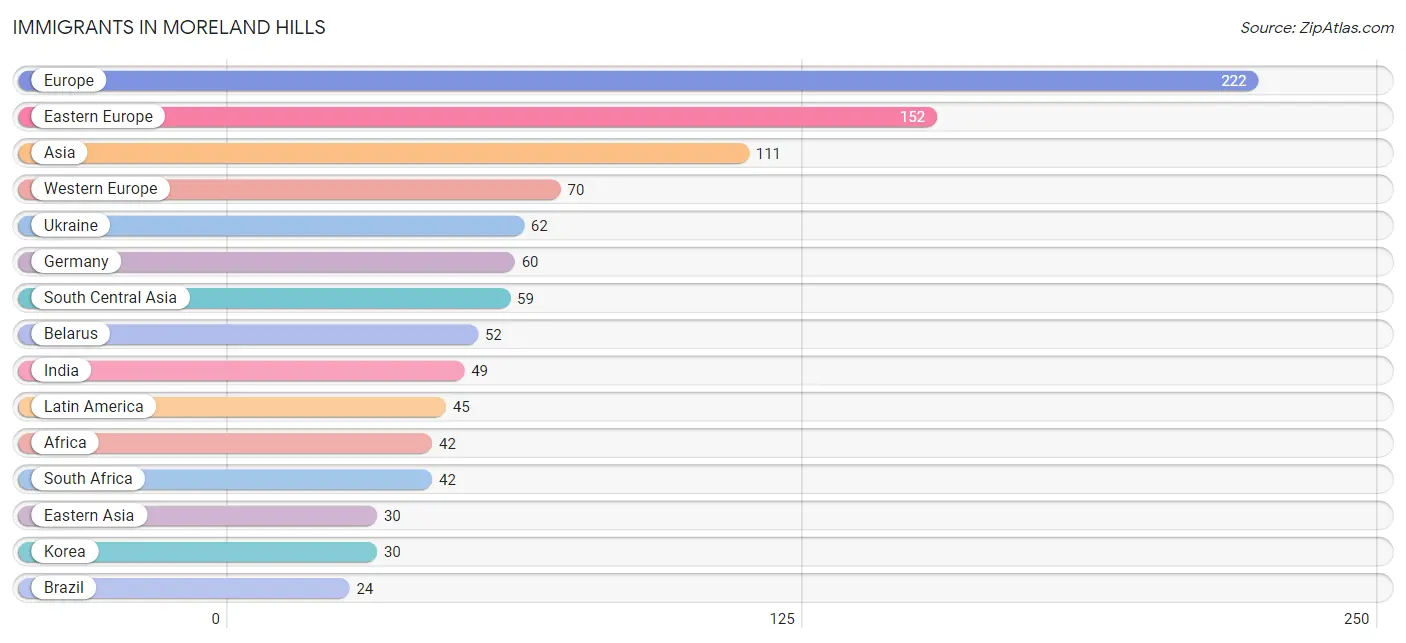
| Immigration Origin | # Population | % Population |
| Africa | 42 | 1.2% |
| Asia | 111 | 3.2% |
| Belarus | 52 | 1.5% |
| Brazil | 24 | 0.7% |
| Caribbean | 21 | 0.6% |
| Croatia | 8 | 0.2% |
| Cuba | 9 | 0.3% |
| Eastern Asia | 30 | 0.9% |
| Eastern Europe | 152 | 4.4% |
| Europe | 222 | 6.5% |
| France | 10 | 0.3% |
| Germany | 60 | 1.7% |
| India | 49 | 1.4% |
| Iraq | 22 | 0.6% |
| Korea | 30 | 0.9% |
| Latin America | 45 | 1.3% |
| South Africa | 42 | 1.2% |
| South America | 24 | 0.7% |
| South Central Asia | 59 | 1.7% |
| Sri Lanka | 10 | 0.3% |
| Ukraine | 62 | 1.8% |
| Western Asia | 22 | 0.6% |
| Western Europe | 70 | 2.0% | View All 23 Rows |
Sex and Age in Moreland Hills
Sex and Age in Moreland Hills
The most populous age groups in Moreland Hills are 70 to 74 Years (235 | 13.1%) for men and 60 to 64 Years (262 | 15.9%) for women.
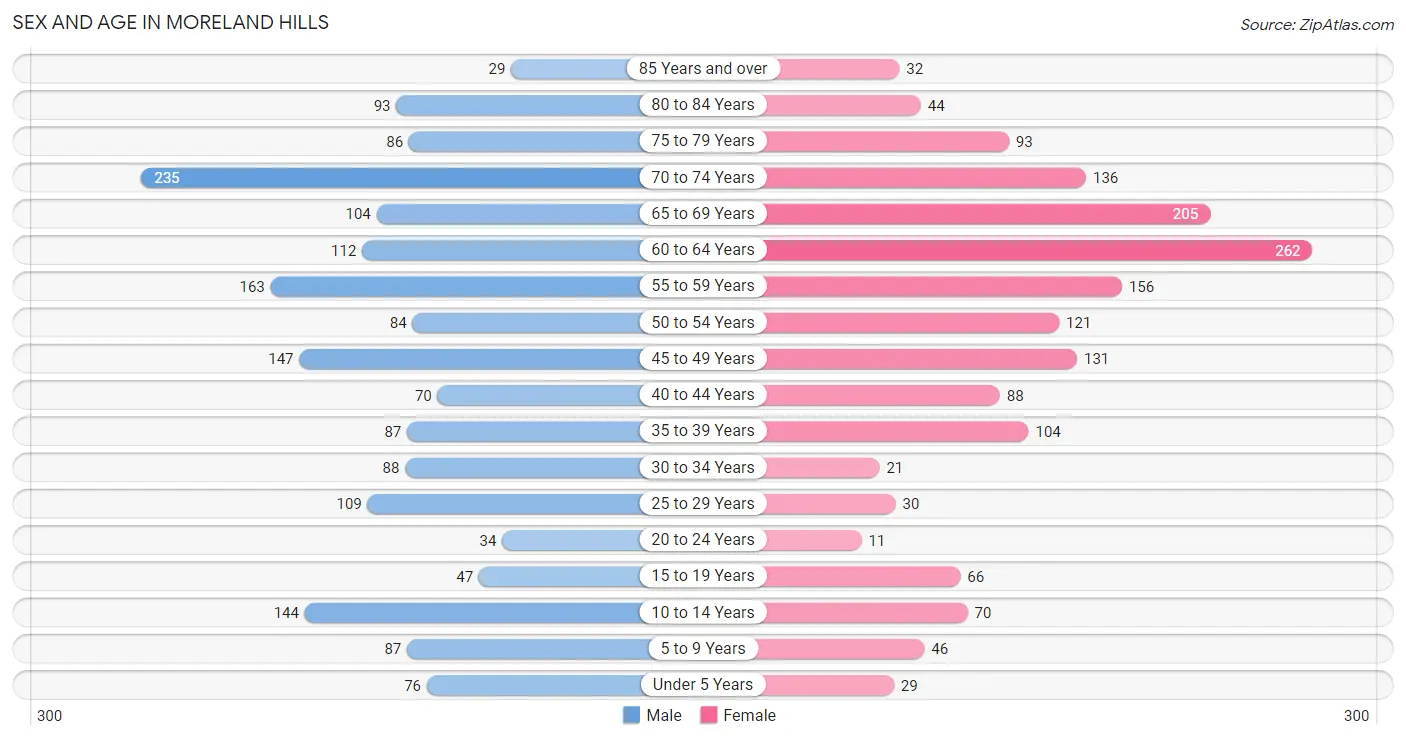
| Age Bracket | Male | Female |
| Under 5 Years | 76 (4.2%) | 29 (1.8%) |
| 5 to 9 Years | 87 (4.9%) | 46 (2.8%) |
| 10 to 14 Years | 144 (8.0%) | 70 (4.3%) |
| 15 to 19 Years | 47 (2.6%) | 66 (4.0%) |
| 20 to 24 Years | 34 (1.9%) | 11 (0.7%) |
| 25 to 29 Years | 109 (6.1%) | 30 (1.8%) |
| 30 to 34 Years | 88 (4.9%) | 21 (1.3%) |
| 35 to 39 Years | 87 (4.9%) | 104 (6.3%) |
| 40 to 44 Years | 70 (3.9%) | 88 (5.3%) |
| 45 to 49 Years | 147 (8.2%) | 131 (8.0%) |
| 50 to 54 Years | 84 (4.7%) | 121 (7.4%) |
| 55 to 59 Years | 163 (9.1%) | 156 (9.5%) |
| 60 to 64 Years | 112 (6.2%) | 262 (15.9%) |
| 65 to 69 Years | 104 (5.8%) | 205 (12.5%) |
| 70 to 74 Years | 235 (13.1%) | 136 (8.3%) |
| 75 to 79 Years | 86 (4.8%) | 93 (5.7%) |
| 80 to 84 Years | 93 (5.2%) | 44 (2.7%) |
| 85 Years and over | 29 (1.6%) | 32 (1.9%) |
| Total | 1,795 (100.0%) | 1,645 (100.0%) |
Families and Households in Moreland Hills
Median Family Size in Moreland Hills
The median family size in Moreland Hills is 2.65 persons per family, with married-couple families (1,020 | 91.7%) accounting for the largest median family size of 2.68 persons per family. On the other hand, single female/mother families (64 | 5.8%) represent the smallest median family size with 2.20 persons per family.
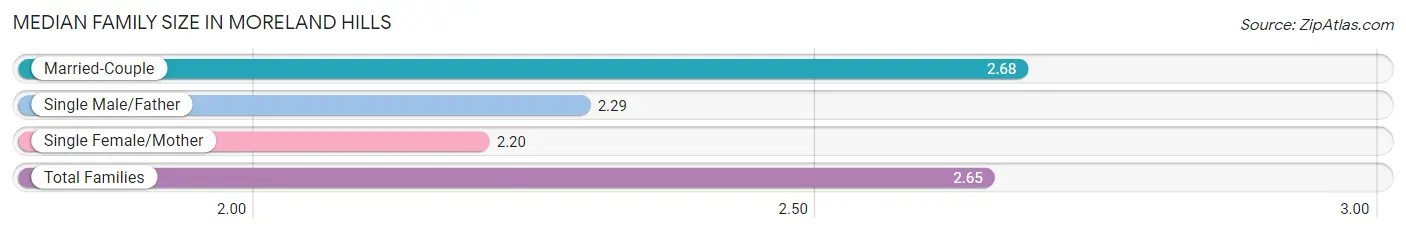
| Family Type | # Families | Family Size |
| Married-Couple | 1,020 (91.7%) | 2.68 |
| Single Male/Father | 28 (2.5%) | 2.29 |
| Single Female/Mother | 64 (5.8%) | 2.20 |
| Total Families | 1,112 (100.0%) | 2.65 |
Median Household Size in Moreland Hills
The median household size in Moreland Hills is 2.41 persons per household, with single female/mother households (64 | 4.5%) accounting for the largest median household size of 3.13 persons per household. non-family households (313 | 22.0%) represent the smallest median household size with 1.17 persons per household.
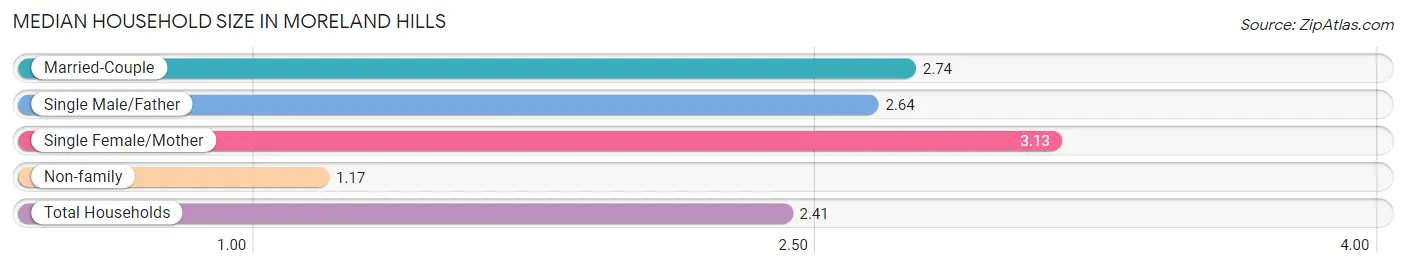
| Household Type | # Households | Household Size |
| Married-Couple | 1,020 (71.6%) | 2.74 |
| Single Male/Father | 28 (2.0%) | 2.64 |
| Single Female/Mother | 64 (4.5%) | 3.13 |
| Non-family | 313 (22.0%) | 1.17 |
| Total Households | 1,425 (100.0%) | 2.41 |
Household Size by Marriage Status in Moreland Hills
Out of a total of 1,425 households in Moreland Hills, 1,112 (78.0%) are family households, while 313 (22.0%) are nonfamily households. The most numerous type of family households are 2-person households, comprising 655, and the most common type of nonfamily households are 1-person households, comprising 259.
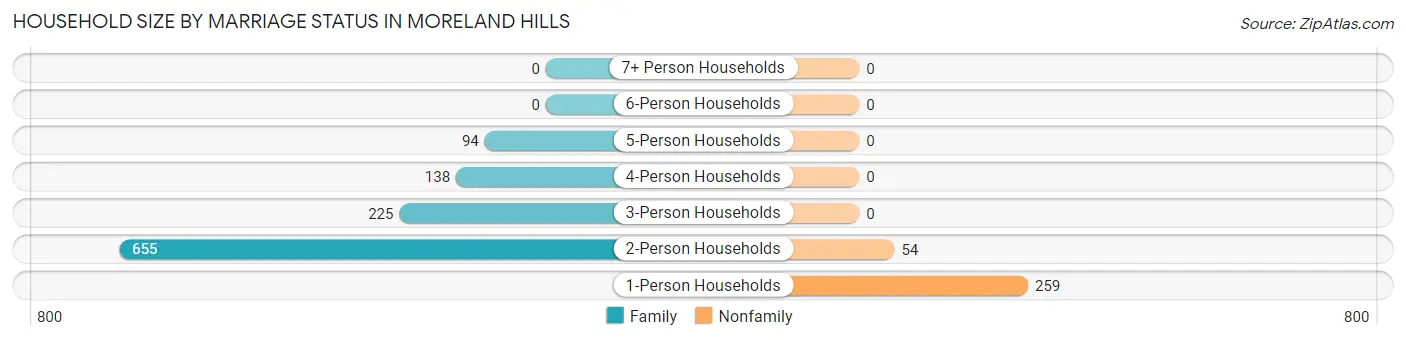
| Household Size | Family Households | Nonfamily Households |
| 1-Person Households | - | 259 (18.2%) |
| 2-Person Households | 655 (46.0%) | 54 (3.8%) |
| 3-Person Households | 225 (15.8%) | 0 (0.0%) |
| 4-Person Households | 138 (9.7%) | 0 (0.0%) |
| 5-Person Households | 94 (6.6%) | 0 (0.0%) |
| 6-Person Households | 0 (0.0%) | 0 (0.0%) |
| 7+ Person Households | 0 (0.0%) | 0 (0.0%) |
| Total | 1,112 (78.0%) | 313 (22.0%) |
Female Fertility in Moreland Hills
Fertility by Age in Moreland Hills
| Age Bracket | Women with Births | Births / 1,000 Women |
| 15 to 19 years | 0 (0.0%) | 0.0 |
| 20 to 34 years | 0 (0.0%) | 0.0 |
| 35 to 50 years | 0 (0.0%) | 0.0 |
| Total | 0 (0.0%) | 0.0 |
Fertility by Age by Marriage Status in Moreland Hills
| Age Bracket | Married | Unmarried |
| 15 to 19 years | 0 (0.0%) | 0 (0.0%) |
| 20 to 34 years | 0 (0.0%) | 0 (0.0%) |
| 35 to 50 years | 0 (0.0%) | 0 (0.0%) |
| Total | 0 (0.0%) | 0 (0.0%) |
Fertility by Education in Moreland Hills
| Educational Attainment | Women with Births | Births / 1,000 Women |
| Less than High School | 0 (0.0%) | 0.0 |
| High School Diploma | 0 (0.0%) | 0.0 |
| College or Associate's Degree | 0 (0.0%) | 0.0 |
| Bachelor's Degree | 0 (0.0%) | 0.0 |
| Graduate Degree | 0 (0.0%) | 0.0 |
| Total | 0 (0.0%) | 0.0 |
Fertility by Education by Marriage Status in Moreland Hills
| Educational Attainment | Married | Unmarried |
| Less than High School | 0 (0.0%) | 0 (0.0%) |
| High School Diploma | 0 (0.0%) | 0 (0.0%) |
| College or Associate's Degree | 0 (0.0%) | 0 (0.0%) |
| Bachelor's Degree | 0 (0.0%) | 0 (0.0%) |
| Graduate Degree | 0 (0.0%) | 0 (0.0%) |
| Total | 0 (0.0%) | 0 (0.0%) |
Employment Characteristics in Moreland Hills
Employment by Class of Employer in Moreland Hills
Among the 1,669 employed individuals in Moreland Hills, private company employees (855 | 51.2%), not-for-profit organizations (334 | 20.0%), and self-employed (incorporated) (216 | 12.9%) make up the most common classes of employment.
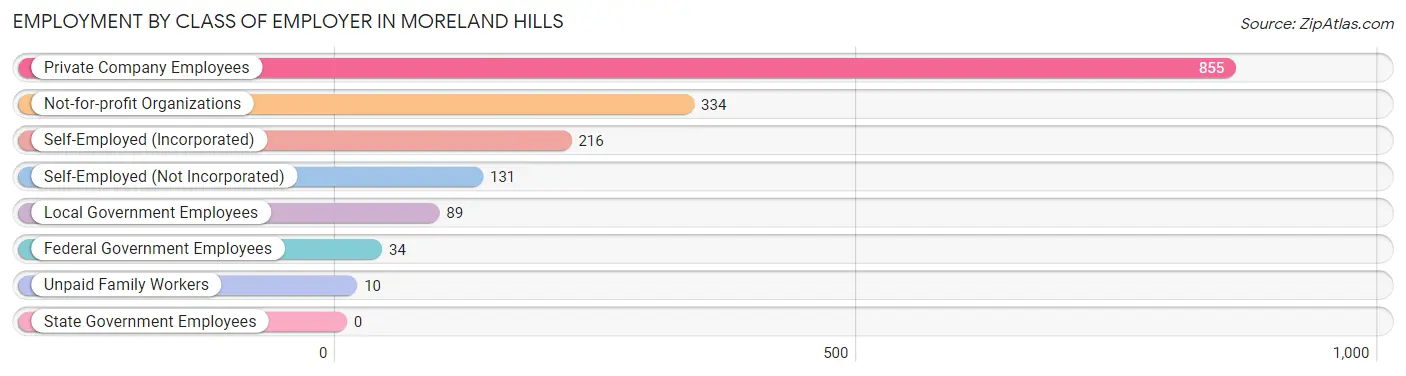
| Employer Class | # Employees | % Employees |
| Private Company Employees | 855 | 51.2% |
| Self-Employed (Incorporated) | 216 | 12.9% |
| Self-Employed (Not Incorporated) | 131 | 7.9% |
| Not-for-profit Organizations | 334 | 20.0% |
| Local Government Employees | 89 | 5.3% |
| State Government Employees | 0 | 0.0% |
| Federal Government Employees | 34 | 2.0% |
| Unpaid Family Workers | 10 | 0.6% |
| Total | 1,669 | 100.0% |
Employment Status by Age in Moreland Hills
According to the labor force statistics for Moreland Hills, out of the total population over 16 years of age (2,977), 59.3% or 1,765 individuals are in the labor force, with 5.4% or 95 of them unemployed. The age group with the highest labor force participation rate is 45 to 54 years, with 88.0% or 425 individuals in the labor force. Within the labor force, the 25 to 29 years age range has the highest percentage of unemployed individuals, with 39.3% or 42 of them being unemployed.
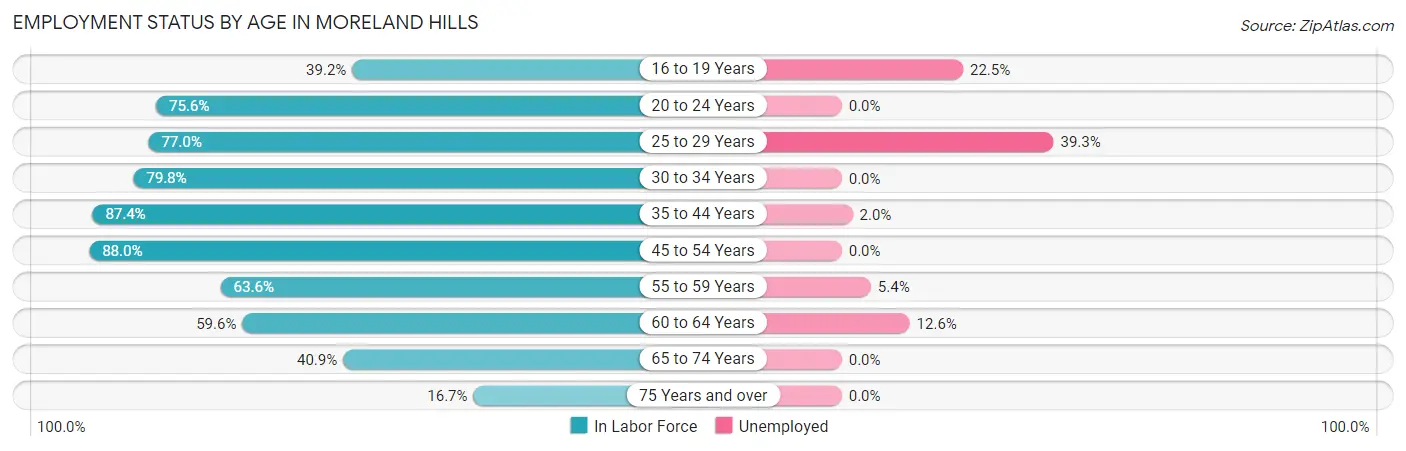
| Age Bracket | In Labor Force | Unemployed |
| 16 to 19 Years | 40 (39.2%) | 9 (22.5%) |
| 20 to 24 Years | 34 (75.6%) | 0 (0.0%) |
| 25 to 29 Years | 107 (77.0%) | 42 (39.3%) |
| 30 to 34 Years | 87 (79.8%) | 0 (0.0%) |
| 35 to 44 Years | 305 (87.4%) | 6 (2.0%) |
| 45 to 54 Years | 425 (88.0%) | 0 (0.0%) |
| 55 to 59 Years | 203 (63.6%) | 11 (5.4%) |
| 60 to 64 Years | 223 (59.6%) | 28 (12.6%) |
| 65 to 74 Years | 278 (40.9%) | 0 (0.0%) |
| 75 Years and over | 63 (16.7%) | 0 (0.0%) |
| Total | 1,765 (59.3%) | 95 (5.4%) |
Employment Status by Educational Attainment in Moreland Hills
According to labor force statistics for Moreland Hills, 76.1% of individuals (1,349) out of the total population between 25 and 64 years of age (1,773) are in the labor force, with 6.4% or 86 of them being unemployed. The group with the highest labor force participation rate are those with the educational attainment of bachelor's degree or higher, with 83.0% or 1,058 individuals in the labor force. Within the labor force, individuals with bachelor's degree or higher education have the highest percentage of unemployment, with 7.7% or 81 of them being unemployed.
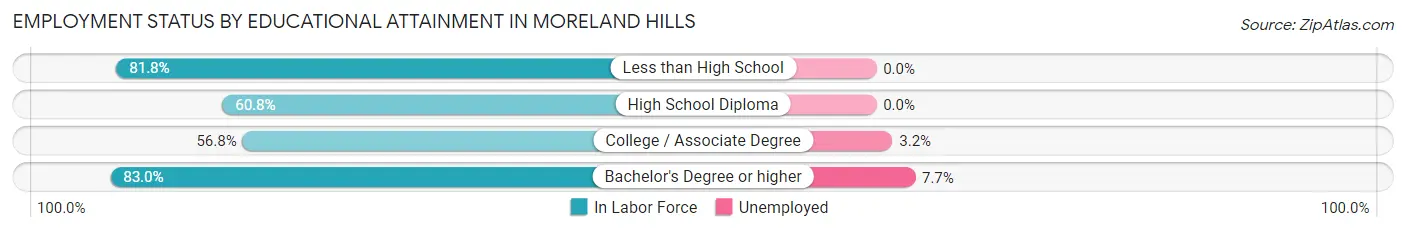
| Educational Attainment | In Labor Force | Unemployed |
| Less than High School | 9 (81.8%) | 0 (0.0%) |
| High School Diploma | 96 (60.8%) | 0 (0.0%) |
| College / Associate Degree | 187 (56.8%) | 11 (3.2%) |
| Bachelor's Degree or higher | 1,058 (83.0%) | 98 (7.7%) |
| Total | 1,349 (76.1%) | 113 (6.4%) |
Employment Occupations by Sex in Moreland Hills
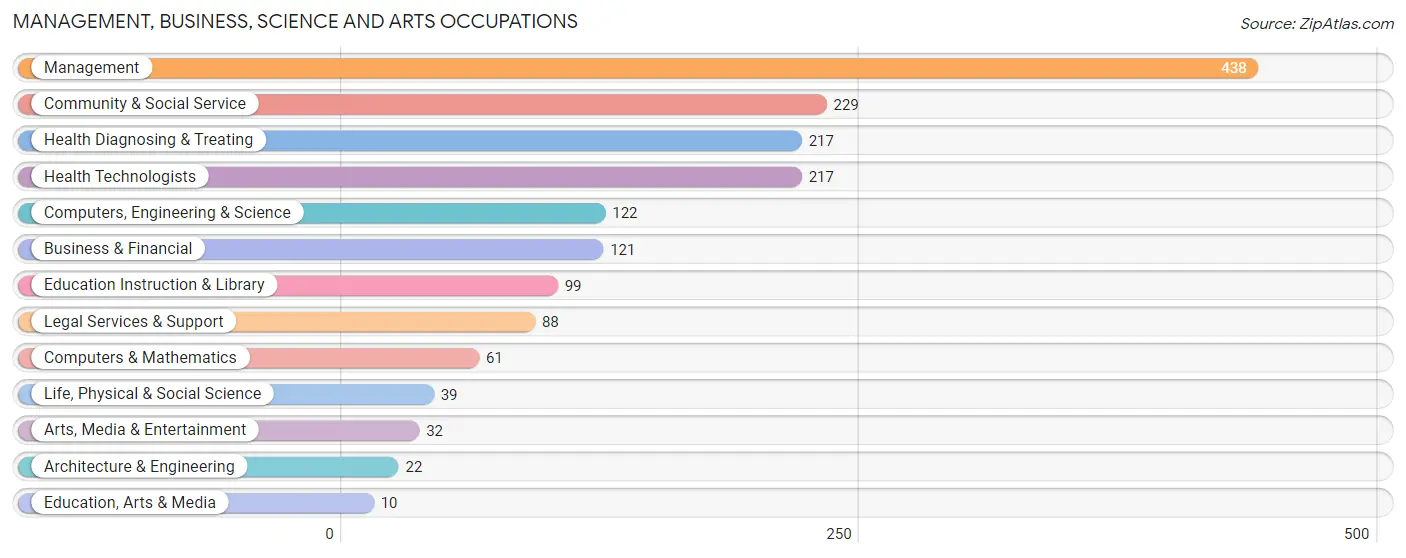
Management, Business, Science and Arts Occupations
The most common Management, Business, Science and Arts occupations in Moreland Hills are Management (438 | 26.2%), Community & Social Service (229 | 13.7%), Health Diagnosing & Treating (217 | 13.0%), Health Technologists (217 | 13.0%), and Computers, Engineering & Science (122 | 7.3%).
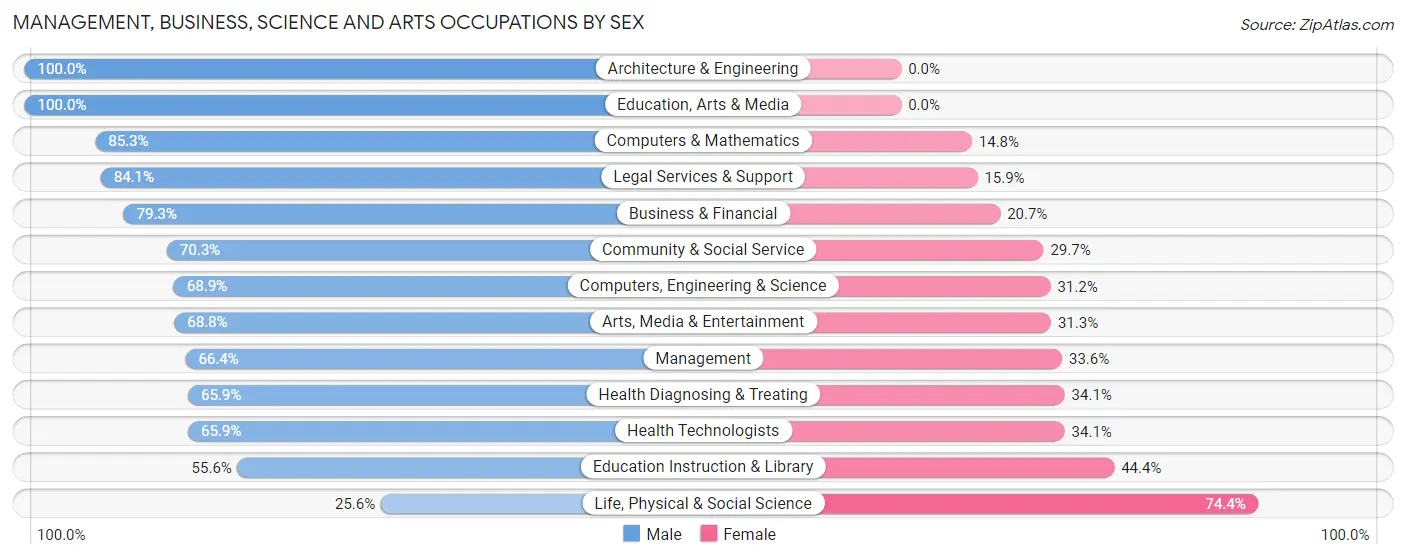
Management, Business, Science and Arts Occupations by Sex
Within the Management, Business, Science and Arts occupations in Moreland Hills, the most male-oriented occupations are Architecture & Engineering (100.0%), Education, Arts & Media (100.0%), and Computers & Mathematics (85.3%), while the most female-oriented occupations are Life, Physical & Social Science (74.4%), Education Instruction & Library (44.4%), and Health Diagnosing & Treating (34.1%).
| Occupation | Male | Female |
| Management | 291 (66.4%) | 147 (33.6%) |
| Business & Financial | 96 (79.3%) | 25 (20.7%) |
| Computers, Engineering & Science | 84 (68.9%) | 38 (31.1%) |
| Computers & Mathematics | 52 (85.3%) | 9 (14.7%) |
| Architecture & Engineering | 22 (100.0%) | 0 (0.0%) |
| Life, Physical & Social Science | 10 (25.6%) | 29 (74.4%) |
| Community & Social Service | 161 (70.3%) | 68 (29.7%) |
| Education, Arts & Media | 10 (100.0%) | 0 (0.0%) |
| Legal Services & Support | 74 (84.1%) | 14 (15.9%) |
| Education Instruction & Library | 55 (55.6%) | 44 (44.4%) |
| Arts, Media & Entertainment | 22 (68.8%) | 10 (31.2%) |
| Health Diagnosing & Treating | 143 (65.9%) | 74 (34.1%) |
| Health Technologists | 143 (65.9%) | 74 (34.1%) |
| Total (Category) | 775 (68.8%) | 352 (31.2%) |
| Total (Overall) | 968 (58.0%) | 701 (42.0%) |
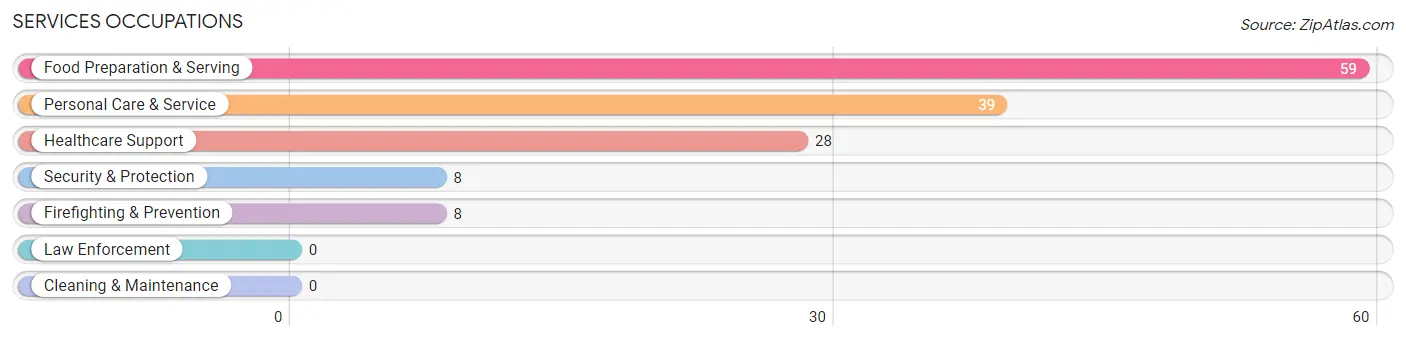
Services Occupations
The most common Services occupations in Moreland Hills are Food Preparation & Serving (59 | 3.5%), Personal Care & Service (39 | 2.3%), Healthcare Support (28 | 1.7%), Security & Protection (8 | 0.5%), and Firefighting & Prevention (8 | 0.5%).
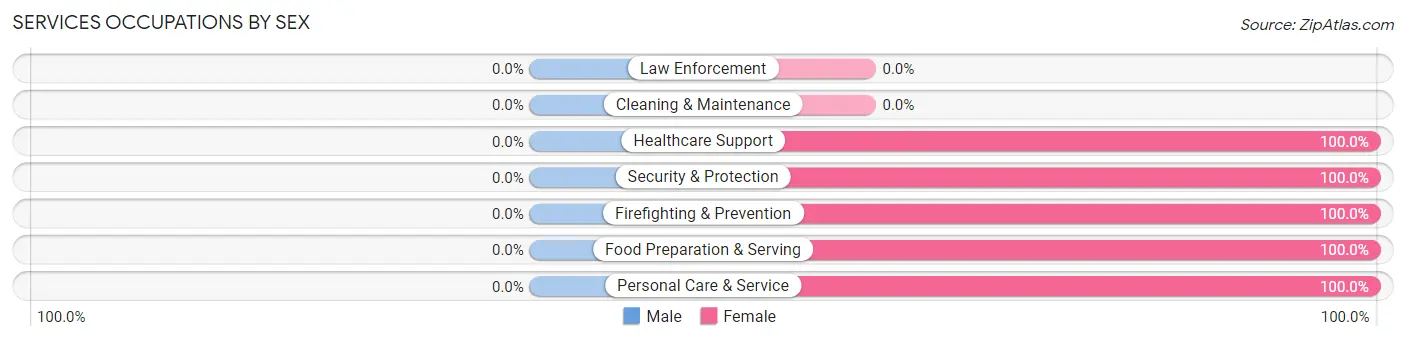
Services Occupations by Sex
| Occupation | Male | Female |
| Healthcare Support | 0 (0.0%) | 28 (100.0%) |
| Security & Protection | 0 (0.0%) | 8 (100.0%) |
| Firefighting & Prevention | 0 (0.0%) | 8 (100.0%) |
| Law Enforcement | 0 (0.0%) | 0 (0.0%) |
| Food Preparation & Serving | 0 (0.0%) | 59 (100.0%) |
| Cleaning & Maintenance | 0 (0.0%) | 0 (0.0%) |
| Personal Care & Service | 0 (0.0%) | 39 (100.0%) |
| Total (Category) | 0 (0.0%) | 134 (100.0%) |
| Total (Overall) | 968 (58.0%) | 701 (42.0%) |
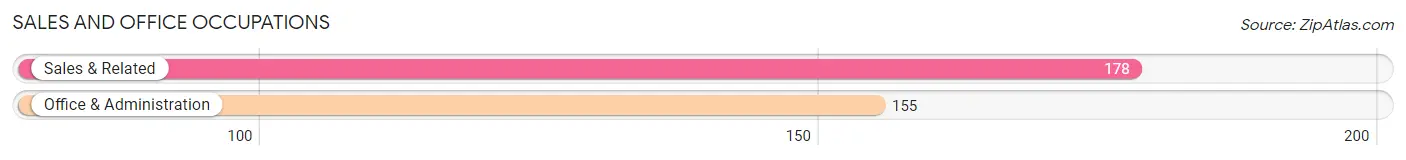
Sales and Office Occupations
The most common Sales and Office occupations in Moreland Hills are Sales & Related (178 | 10.7%), and Office & Administration (155 | 9.3%).
Sales and Office Occupations by Sex
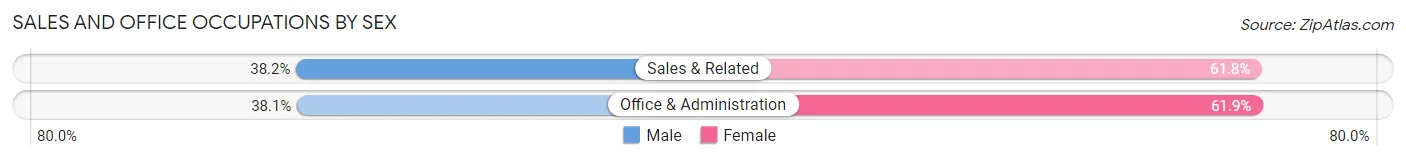
| Occupation | Male | Female |
| Sales & Related | 68 (38.2%) | 110 (61.8%) |
| Office & Administration | 59 (38.1%) | 96 (61.9%) |
| Total (Category) | 127 (38.1%) | 206 (61.9%) |
| Total (Overall) | 968 (58.0%) | 701 (42.0%) |
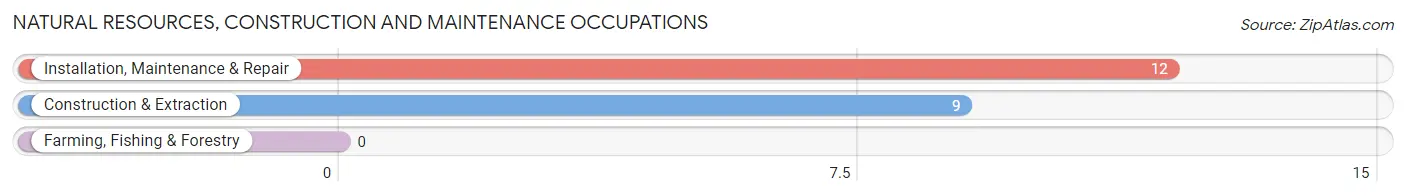
Natural Resources, Construction and Maintenance Occupations
The most common Natural Resources, Construction and Maintenance occupations in Moreland Hills are Installation, Maintenance & Repair (12 | 0.7%), and Construction & Extraction (9 | 0.5%).
Natural Resources, Construction and Maintenance Occupations by Sex
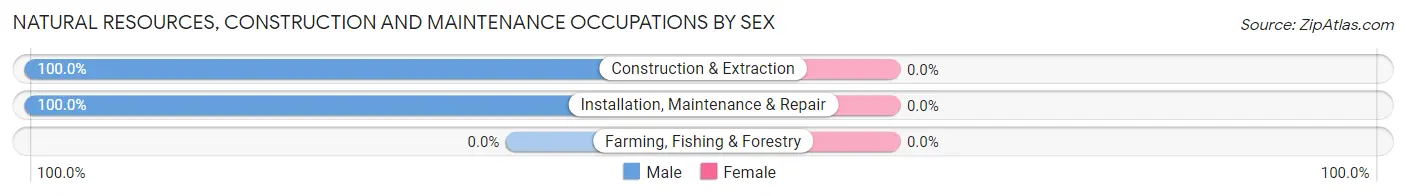
| Occupation | Male | Female |
| Farming, Fishing & Forestry | 0 (0.0%) | 0 (0.0%) |
| Construction & Extraction | 9 (100.0%) | 0 (0.0%) |
| Installation, Maintenance & Repair | 12 (100.0%) | 0 (0.0%) |
| Total (Category) | 21 (100.0%) | 0 (0.0%) |
| Total (Overall) | 968 (58.0%) | 701 (42.0%) |
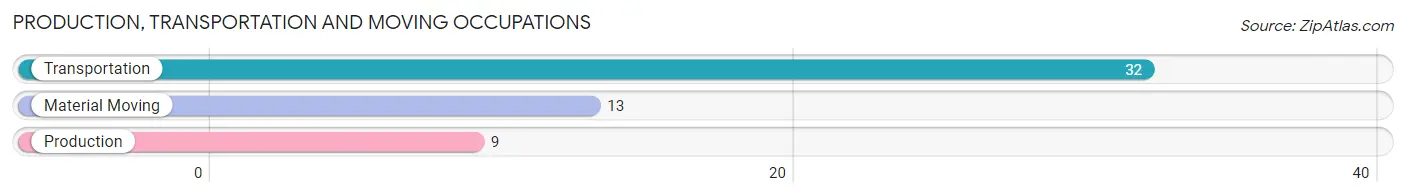
Production, Transportation and Moving Occupations
The most common Production, Transportation and Moving occupations in Moreland Hills are Transportation (32 | 1.9%), Material Moving (13 | 0.8%), and Production (9 | 0.5%).
Production, Transportation and Moving Occupations by Sex
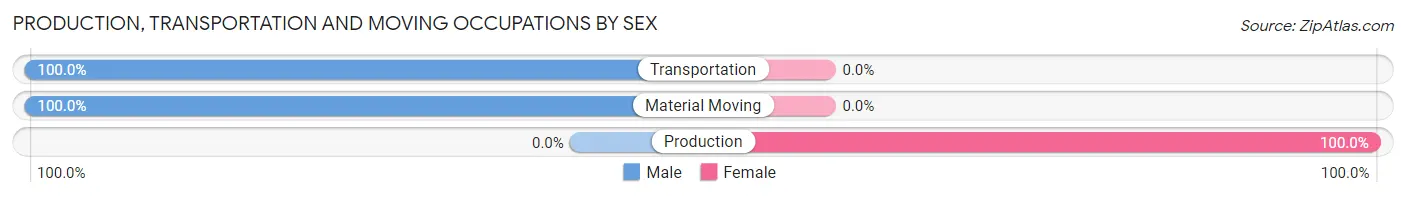
| Occupation | Male | Female |
| Production | 0 (0.0%) | 9 (100.0%) |
| Transportation | 32 (100.0%) | 0 (0.0%) |
| Material Moving | 13 (100.0%) | 0 (0.0%) |
| Total (Category) | 45 (83.3%) | 9 (16.7%) |
| Total (Overall) | 968 (58.0%) | 701 (42.0%) |
Employment Industries by Sex in Moreland Hills
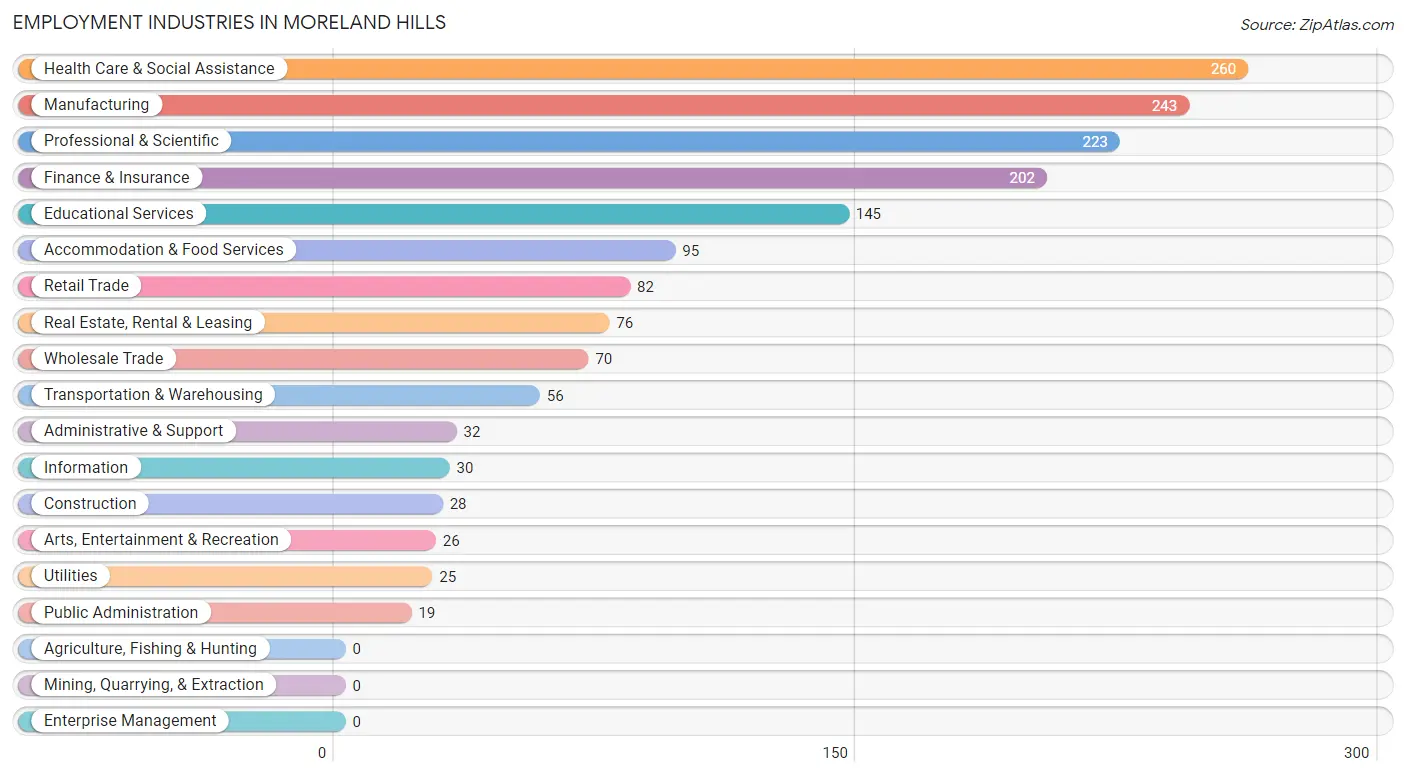
Employment Industries in Moreland Hills
The major employment industries in Moreland Hills include Health Care & Social Assistance (260 | 15.6%), Manufacturing (243 | 14.6%), Professional & Scientific (223 | 13.4%), Finance & Insurance (202 | 12.1%), and Educational Services (145 | 8.7%).
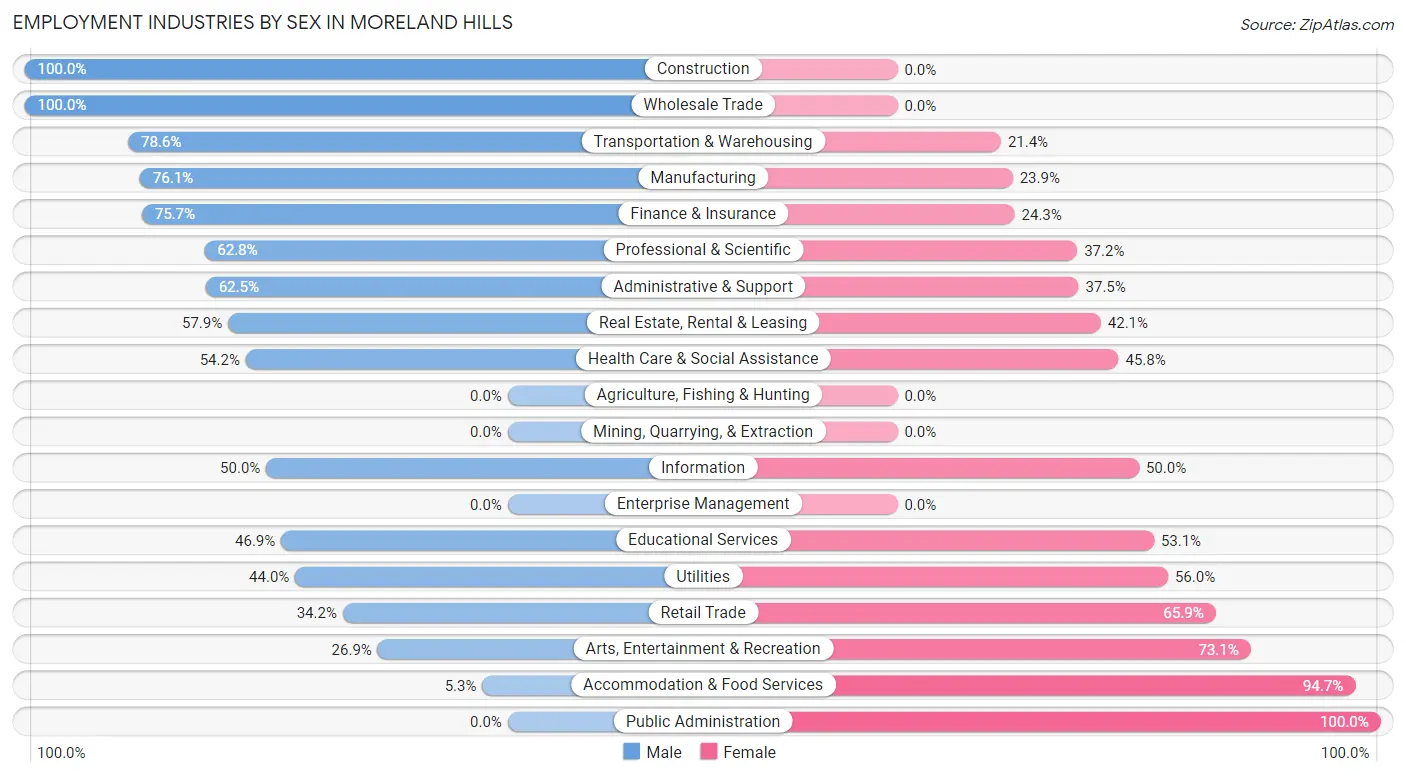
Employment Industries by Sex in Moreland Hills
The Moreland Hills industries that see more men than women are Construction (100.0%), Wholesale Trade (100.0%), and Transportation & Warehousing (78.6%), whereas the industries that tend to have a higher number of women are Public Administration (100.0%), Accommodation & Food Services (94.7%), and Arts, Entertainment & Recreation (73.1%).
| Industry | Male | Female |
| Agriculture, Fishing & Hunting | 0 (0.0%) | 0 (0.0%) |
| Mining, Quarrying, & Extraction | 0 (0.0%) | 0 (0.0%) |
| Construction | 28 (100.0%) | 0 (0.0%) |
| Manufacturing | 185 (76.1%) | 58 (23.9%) |
| Wholesale Trade | 70 (100.0%) | 0 (0.0%) |
| Retail Trade | 28 (34.2%) | 54 (65.8%) |
| Transportation & Warehousing | 44 (78.6%) | 12 (21.4%) |
| Utilities | 11 (44.0%) | 14 (56.0%) |
| Information | 15 (50.0%) | 15 (50.0%) |
| Finance & Insurance | 153 (75.7%) | 49 (24.3%) |
| Real Estate, Rental & Leasing | 44 (57.9%) | 32 (42.1%) |
| Professional & Scientific | 140 (62.8%) | 83 (37.2%) |
| Enterprise Management | 0 (0.0%) | 0 (0.0%) |
| Administrative & Support | 20 (62.5%) | 12 (37.5%) |
| Educational Services | 68 (46.9%) | 77 (53.1%) |
| Health Care & Social Assistance | 141 (54.2%) | 119 (45.8%) |
| Arts, Entertainment & Recreation | 7 (26.9%) | 19 (73.1%) |
| Accommodation & Food Services | 5 (5.3%) | 90 (94.7%) |
| Public Administration | 0 (0.0%) | 19 (100.0%) |
| Total | 968 (58.0%) | 701 (42.0%) |
Education in Moreland Hills
School Enrollment in Moreland Hills
The most common levels of schooling among the 556 students in Moreland Hills are middle school (192 | 34.5%), high school (116 | 20.9%), and elementary school (111 | 20.0%).
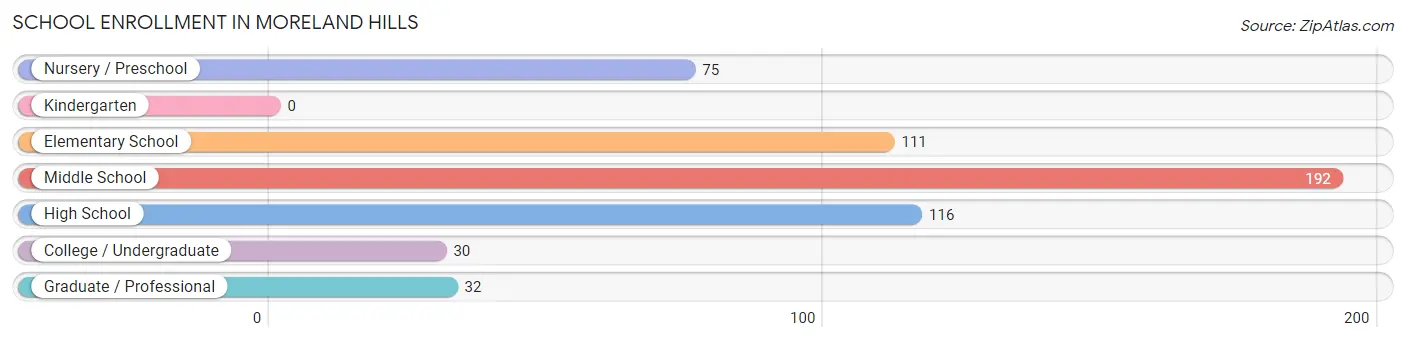
| School Level | # Students | % Students |
| Nursery / Preschool | 75 | 13.5% |
| Kindergarten | 0 | 0.0% |
| Elementary School | 111 | 20.0% |
| Middle School | 192 | 34.5% |
| High School | 116 | 20.9% |
| College / Undergraduate | 30 | 5.4% |
| Graduate / Professional | 32 | 5.8% |
| Total | 556 | 100.0% |
School Enrollment by Age by Funding Source in Moreland Hills
Out of a total of 556 students who are enrolled in schools in Moreland Hills, 186 (33.5%) attend a private institution, while the remaining 370 (66.5%) are enrolled in public schools. The age group of 5 to 9 year old has the highest likelihood of being enrolled in private schools, with 77 (57.9% in the age bracket) enrolled. Conversely, the age group of 3 to 4 year olds has the lowest likelihood of being enrolled in a private school, with 43 (100.0% in the age bracket) attending a public institution.
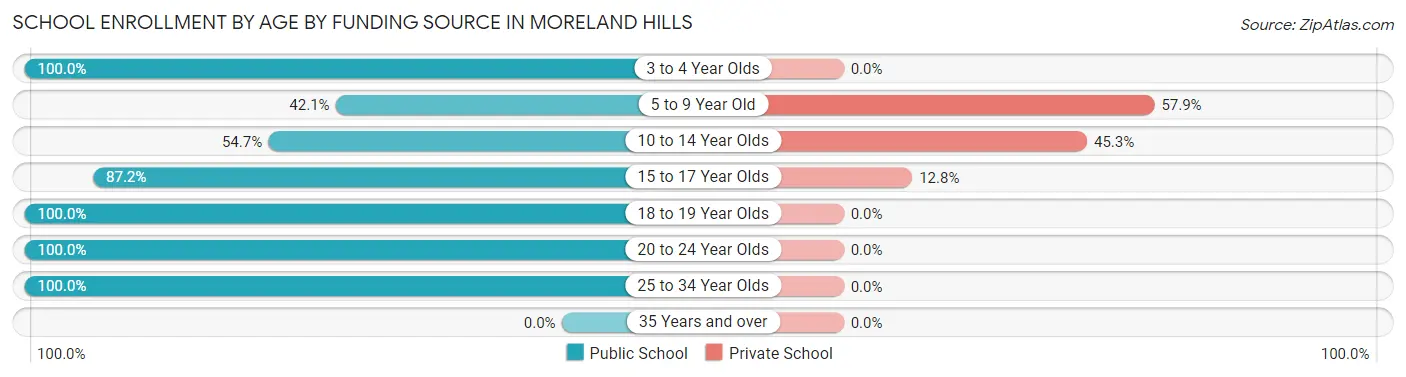
| Age Bracket | Public School | Private School |
| 3 to 4 Year Olds | 43 (100.0%) | 0 (0.0%) |
| 5 to 9 Year Old | 56 (42.1%) | 77 (57.9%) |
| 10 to 14 Year Olds | 117 (54.7%) | 97 (45.3%) |
| 15 to 17 Year Olds | 82 (87.2%) | 12 (12.8%) |
| 18 to 19 Year Olds | 19 (100.0%) | 0 (0.0%) |
| 20 to 24 Year Olds | 21 (100.0%) | 0 (0.0%) |
| 25 to 34 Year Olds | 32 (100.0%) | 0 (0.0%) |
| 35 Years and over | 0 (0.0%) | 0 (0.0%) |
| Total | 370 (66.5%) | 186 (33.5%) |
Educational Attainment by Field of Study in Moreland Hills
Business (553 | 25.1%), bio, nature & agricultural (285 | 12.9%), social sciences (211 | 9.6%), education (194 | 8.8%), and liberal arts & history (158 | 7.2%) are the most common fields of study among 2,205 individuals in Moreland Hills who have obtained a bachelor's degree or higher.
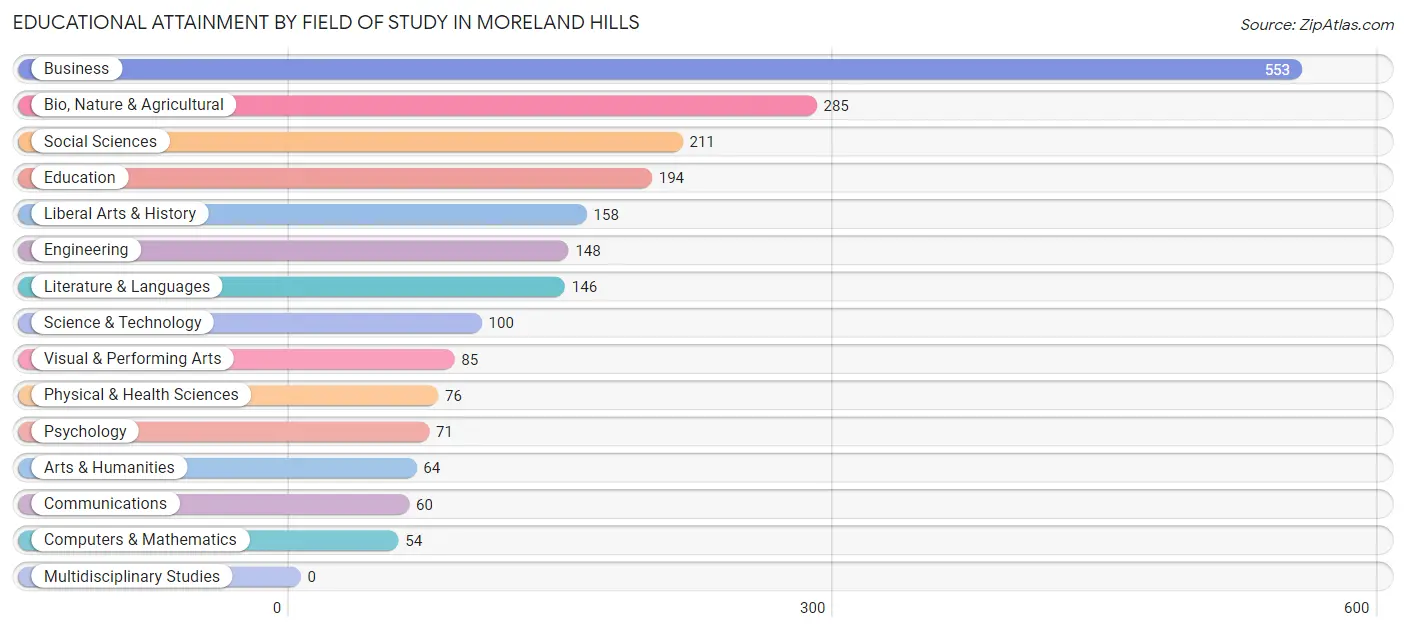
| Field of Study | # Graduates | % Graduates |
| Computers & Mathematics | 54 | 2.5% |
| Bio, Nature & Agricultural | 285 | 12.9% |
| Physical & Health Sciences | 76 | 3.5% |
| Psychology | 71 | 3.2% |
| Social Sciences | 211 | 9.6% |
| Engineering | 148 | 6.7% |
| Multidisciplinary Studies | 0 | 0.0% |
| Science & Technology | 100 | 4.5% |
| Business | 553 | 25.1% |
| Education | 194 | 8.8% |
| Literature & Languages | 146 | 6.6% |
| Liberal Arts & History | 158 | 7.2% |
| Visual & Performing Arts | 85 | 3.8% |
| Communications | 60 | 2.7% |
| Arts & Humanities | 64 | 2.9% |
| Total | 2,205 | 100.0% |
Transportation & Commute in Moreland Hills
Vehicle Availability by Sex in Moreland Hills
The most prevalent vehicle ownership categories in Moreland Hills are males with 2 vehicles (431, accounting for 44.6%) and females with 2 vehicles (354, making up 61.5%).
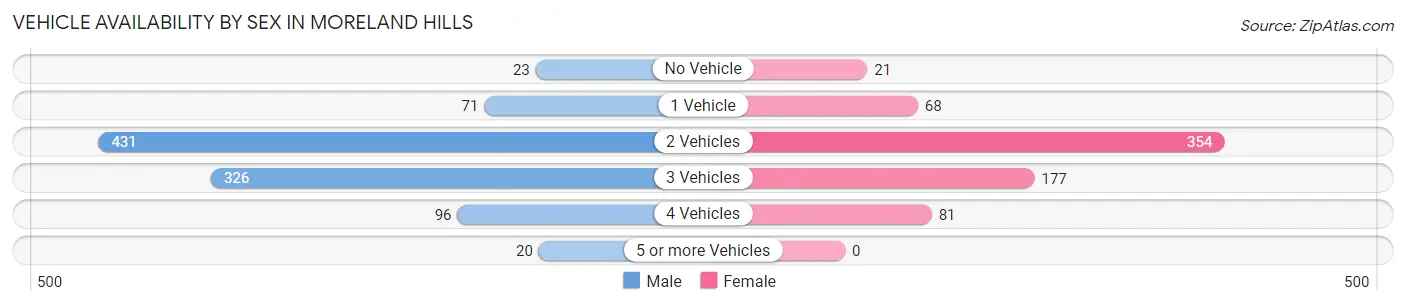
| Vehicles Available | Male | Female |
| No Vehicle | 23 (2.4%) | 21 (3.0%) |
| 1 Vehicle | 71 (7.3%) | 68 (9.7%) |
| 2 Vehicles | 431 (44.6%) | 354 (50.5%) |
| 3 Vehicles | 326 (33.7%) | 177 (25.3%) |
| 4 Vehicles | 96 (9.9%) | 81 (11.6%) |
| 5 or more Vehicles | 20 (2.1%) | 0 (0.0%) |
| Total | 967 (100.0%) | 701 (100.0%) |
Commute Time in Moreland Hills
The most frequently occuring commute durations in Moreland Hills are 30 to 34 minutes (300 commuters, 21.3%), 15 to 19 minutes (213 commuters, 15.2%), and 10 to 14 minutes (199 commuters, 14.2%).
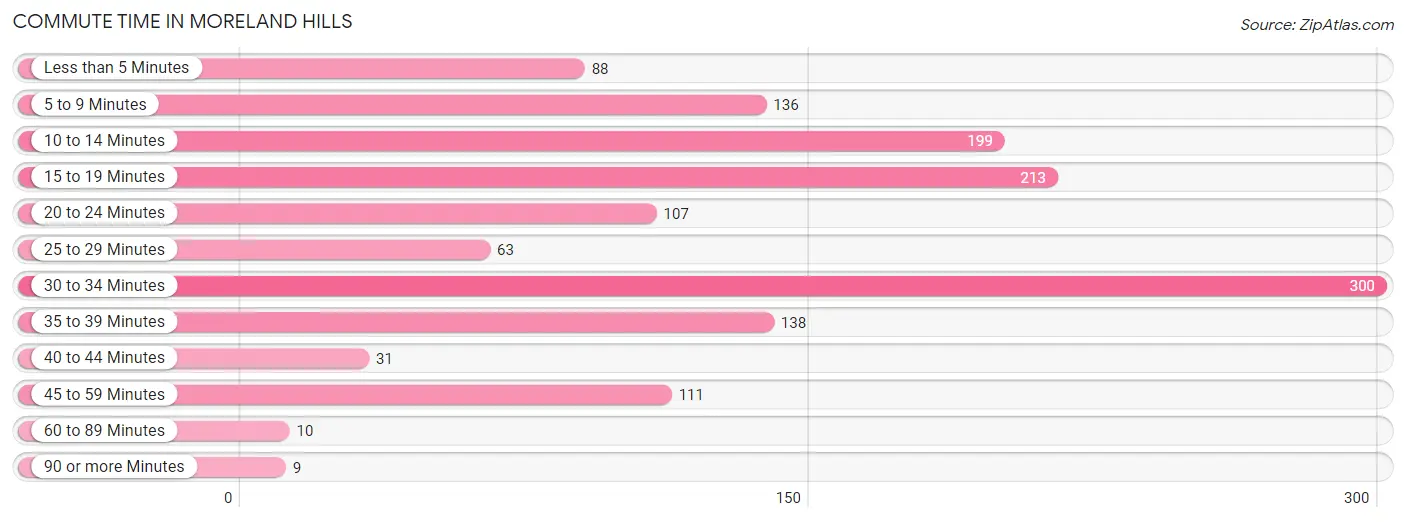
| Commute Time | # Commuters | % Commuters |
| Less than 5 Minutes | 88 | 6.3% |
| 5 to 9 Minutes | 136 | 9.7% |
| 10 to 14 Minutes | 199 | 14.2% |
| 15 to 19 Minutes | 213 | 15.2% |
| 20 to 24 Minutes | 107 | 7.6% |
| 25 to 29 Minutes | 63 | 4.5% |
| 30 to 34 Minutes | 300 | 21.3% |
| 35 to 39 Minutes | 138 | 9.8% |
| 40 to 44 Minutes | 31 | 2.2% |
| 45 to 59 Minutes | 111 | 7.9% |
| 60 to 89 Minutes | 10 | 0.7% |
| 90 or more Minutes | 9 | 0.6% |
Commute Time by Sex in Moreland Hills
The most common commute times in Moreland Hills are 30 to 34 minutes (207 commuters, 26.1%) for males and 5 to 9 minutes (105 commuters, 17.2%) for females.
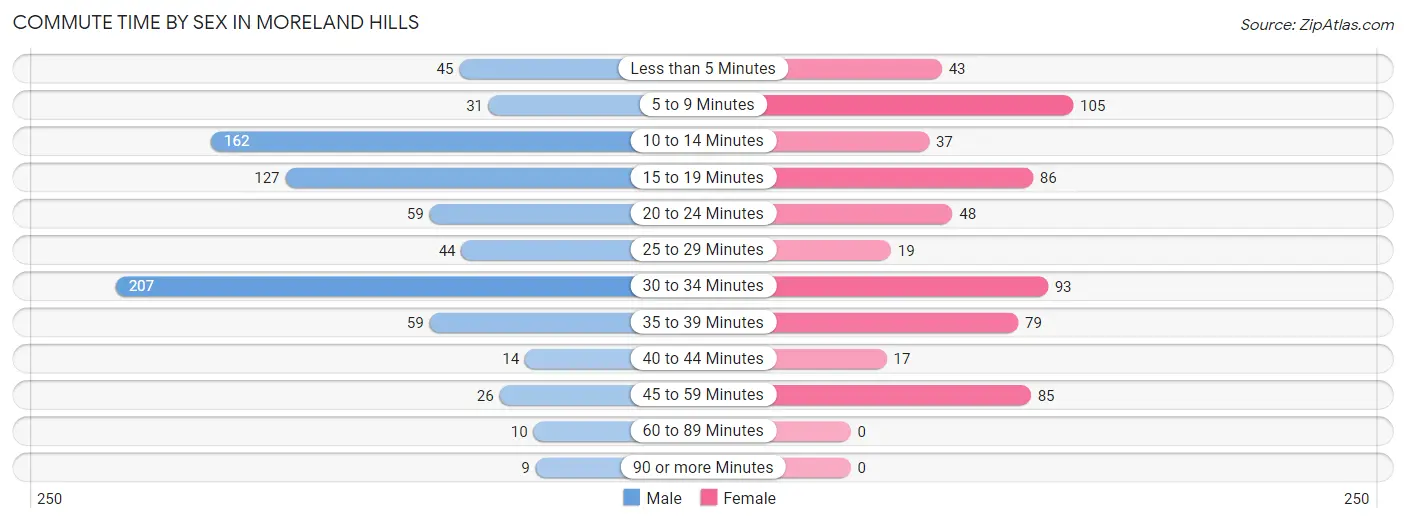
| Commute Time | Male | Female |
| Less than 5 Minutes | 45 (5.7%) | 43 (7.0%) |
| 5 to 9 Minutes | 31 (3.9%) | 105 (17.2%) |
| 10 to 14 Minutes | 162 (20.4%) | 37 (6.0%) |
| 15 to 19 Minutes | 127 (16.0%) | 86 (14.1%) |
| 20 to 24 Minutes | 59 (7.4%) | 48 (7.8%) |
| 25 to 29 Minutes | 44 (5.6%) | 19 (3.1%) |
| 30 to 34 Minutes | 207 (26.1%) | 93 (15.2%) |
| 35 to 39 Minutes | 59 (7.4%) | 79 (12.9%) |
| 40 to 44 Minutes | 14 (1.8%) | 17 (2.8%) |
| 45 to 59 Minutes | 26 (3.3%) | 85 (13.9%) |
| 60 to 89 Minutes | 10 (1.3%) | 0 (0.0%) |
| 90 or more Minutes | 9 (1.1%) | 0 (0.0%) |
Time of Departure to Work by Sex in Moreland Hills
The most frequent times of departure to work in Moreland Hills are 7:00 AM to 7:29 AM (137, 17.3%) for males and 7:30 AM to 7:59 AM (155, 25.3%) for females.
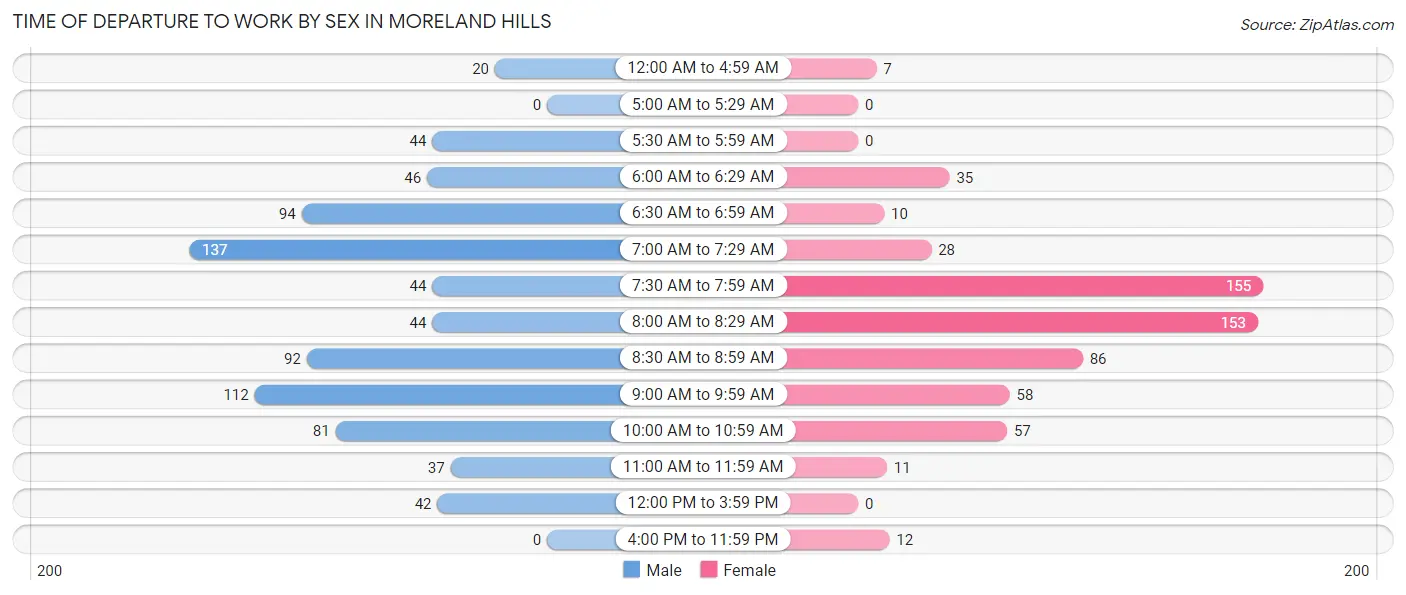
| Time of Departure | Male | Female |
| 12:00 AM to 4:59 AM | 20 (2.5%) | 7 (1.1%) |
| 5:00 AM to 5:29 AM | 0 (0.0%) | 0 (0.0%) |
| 5:30 AM to 5:59 AM | 44 (5.6%) | 0 (0.0%) |
| 6:00 AM to 6:29 AM | 46 (5.8%) | 35 (5.7%) |
| 6:30 AM to 6:59 AM | 94 (11.8%) | 10 (1.6%) |
| 7:00 AM to 7:29 AM | 137 (17.3%) | 28 (4.6%) |
| 7:30 AM to 7:59 AM | 44 (5.6%) | 155 (25.3%) |
| 8:00 AM to 8:29 AM | 44 (5.6%) | 153 (25.0%) |
| 8:30 AM to 8:59 AM | 92 (11.6%) | 86 (14.1%) |
| 9:00 AM to 9:59 AM | 112 (14.1%) | 58 (9.5%) |
| 10:00 AM to 10:59 AM | 81 (10.2%) | 57 (9.3%) |
| 11:00 AM to 11:59 AM | 37 (4.7%) | 11 (1.8%) |
| 12:00 PM to 3:59 PM | 42 (5.3%) | 0 (0.0%) |
| 4:00 PM to 11:59 PM | 0 (0.0%) | 12 (2.0%) |
| Total | 793 (100.0%) | 612 (100.0%) |
Housing Occupancy in Moreland Hills
Occupancy by Ownership in Moreland Hills
Of the total 1,425 dwellings in Moreland Hills, owner-occupied units account for 1,345 (94.4%), while renter-occupied units make up 80 (5.6%).
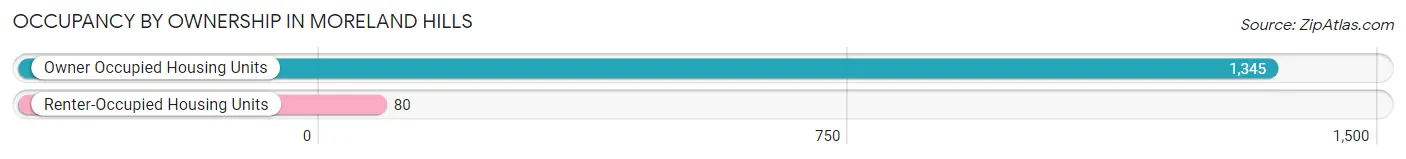
| Occupancy | # Housing Units | % Housing Units |
| Owner Occupied Housing Units | 1,345 | 94.4% |
| Renter-Occupied Housing Units | 80 | 5.6% |
| Total Occupied Housing Units | 1,425 | 100.0% |
Occupancy by Household Size in Moreland Hills
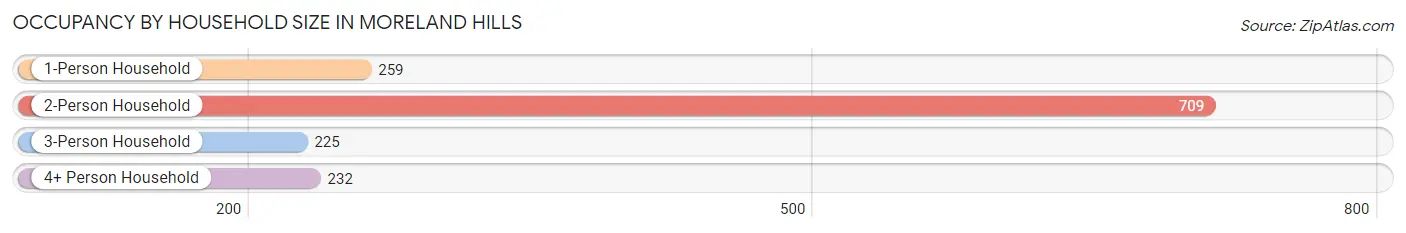
| Household Size | # Housing Units | % Housing Units |
| 1-Person Household | 259 | 18.2% |
| 2-Person Household | 709 | 49.7% |
| 3-Person Household | 225 | 15.8% |
| 4+ Person Household | 232 | 16.3% |
| Total Housing Units | 1,425 | 100.0% |
Occupancy by Ownership by Household Size in Moreland Hills
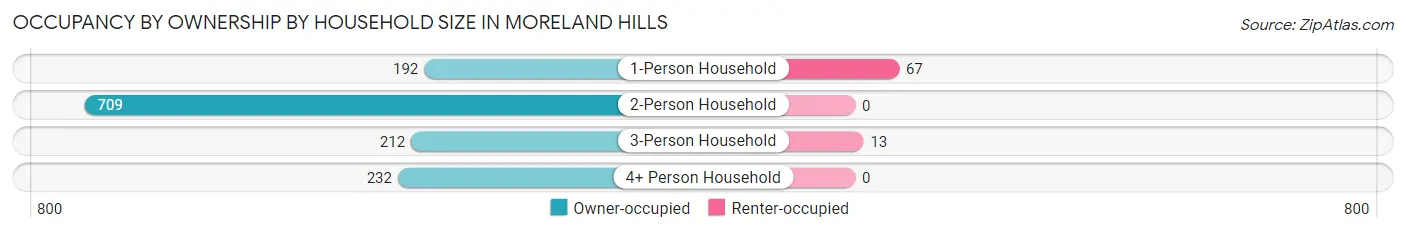
| Household Size | Owner-occupied | Renter-occupied |
| 1-Person Household | 192 (74.1%) | 67 (25.9%) |
| 2-Person Household | 709 (100.0%) | 0 (0.0%) |
| 3-Person Household | 212 (94.2%) | 13 (5.8%) |
| 4+ Person Household | 232 (100.0%) | 0 (0.0%) |
| Total Housing Units | 1,345 (94.4%) | 80 (5.6%) |
Occupancy by Educational Attainment in Moreland Hills
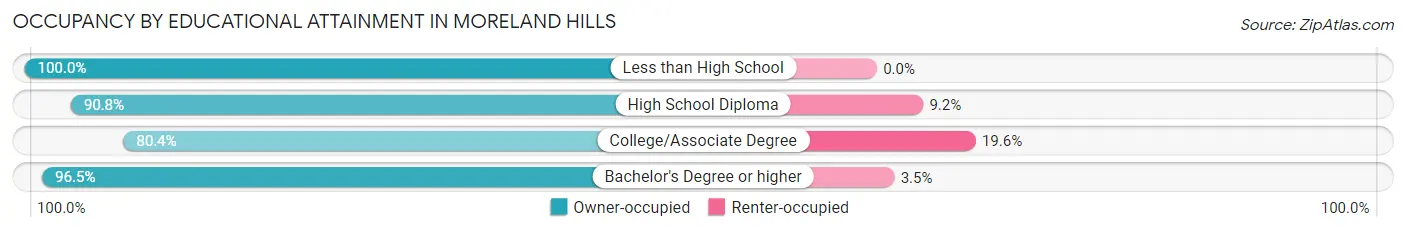
| Household Size | Owner-occupied | Renter-occupied |
| Less than High School | 8 (100.0%) | 0 (0.0%) |
| High School Diploma | 109 (90.8%) | 11 (9.2%) |
| College/Associate Degree | 119 (80.4%) | 29 (19.6%) |
| Bachelor's Degree or higher | 1,109 (96.5%) | 40 (3.5%) |
Occupancy by Age of Householder in Moreland Hills
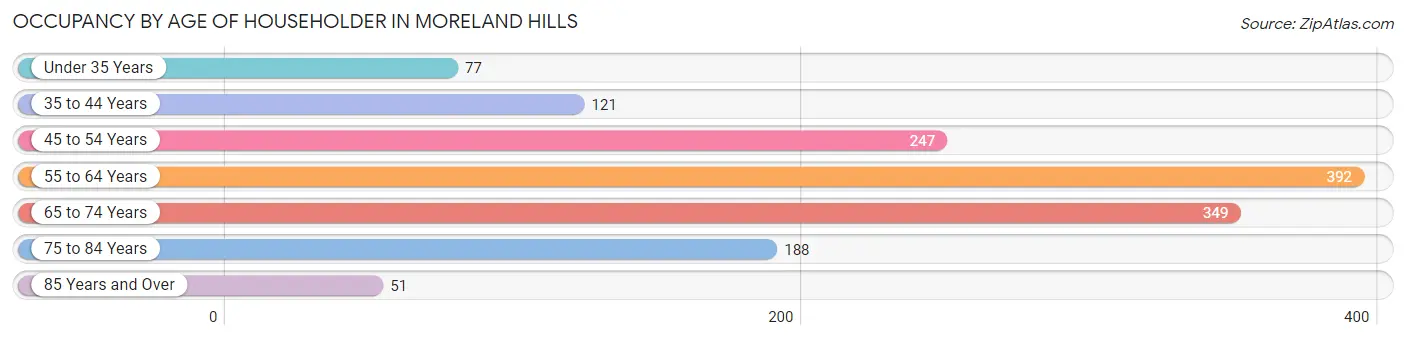
| Age Bracket | # Households | % Households |
| Under 35 Years | 77 | 5.4% |
| 35 to 44 Years | 121 | 8.5% |
| 45 to 54 Years | 247 | 17.3% |
| 55 to 64 Years | 392 | 27.5% |
| 65 to 74 Years | 349 | 24.5% |
| 75 to 84 Years | 188 | 13.2% |
| 85 Years and Over | 51 | 3.6% |
| Total | 1,425 | 100.0% |
Housing Finances in Moreland Hills
Median Income by Occupancy in Moreland Hills
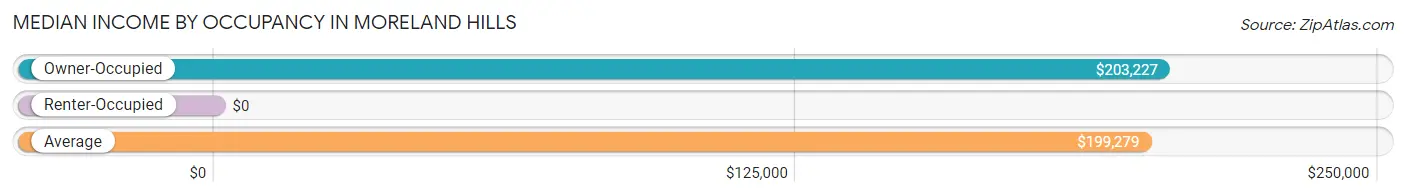
| Occupancy Type | # Households | Median Income |
| Owner-Occupied | 1,345 (94.4%) | $203,227 |
| Renter-Occupied | 80 (5.6%) | $0 |
| Average | 1,425 (100.0%) | $199,279 |
Occupancy by Householder Income Bracket in Moreland Hills
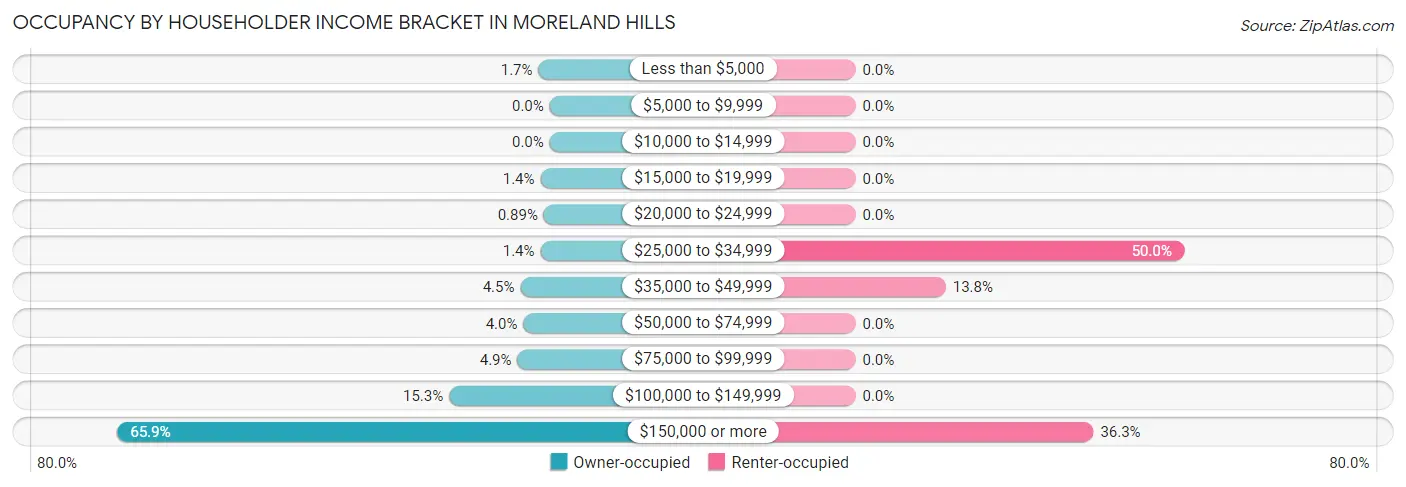
| Income Bracket | Owner-occupied | Renter-occupied |
| Less than $5,000 | 23 (1.7%) | 0 (0.0%) |
| $5,000 to $9,999 | 0 (0.0%) | 0 (0.0%) |
| $10,000 to $14,999 | 0 (0.0%) | 0 (0.0%) |
| $15,000 to $19,999 | 19 (1.4%) | 0 (0.0%) |
| $20,000 to $24,999 | 12 (0.9%) | 0 (0.0%) |
| $25,000 to $34,999 | 19 (1.4%) | 40 (50.0%) |
| $35,000 to $49,999 | 60 (4.5%) | 11 (13.8%) |
| $50,000 to $74,999 | 54 (4.0%) | 0 (0.0%) |
| $75,000 to $99,999 | 66 (4.9%) | 0 (0.0%) |
| $100,000 to $149,999 | 206 (15.3%) | 0 (0.0%) |
| $150,000 or more | 886 (65.9%) | 29 (36.2%) |
| Total | 1,345 (100.0%) | 80 (100.0%) |
Monthly Housing Cost Tiers in Moreland Hills
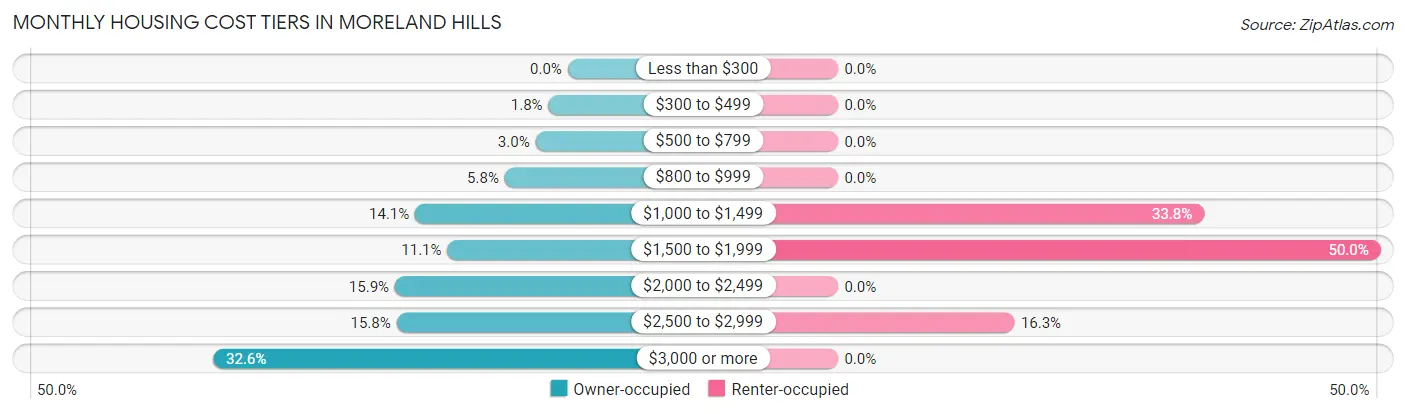
| Monthly Cost | Owner-occupied | Renter-occupied |
| Less than $300 | 0 (0.0%) | 0 (0.0%) |
| $300 to $499 | 24 (1.8%) | 0 (0.0%) |
| $500 to $799 | 40 (3.0%) | 0 (0.0%) |
| $800 to $999 | 78 (5.8%) | 0 (0.0%) |
| $1,000 to $1,499 | 189 (14.1%) | 27 (33.8%) |
| $1,500 to $1,999 | 149 (11.1%) | 40 (50.0%) |
| $2,000 to $2,499 | 214 (15.9%) | 0 (0.0%) |
| $2,500 to $2,999 | 212 (15.8%) | 13 (16.3%) |
| $3,000 or more | 439 (32.6%) | 0 (0.0%) |
| Total | 1,345 (100.0%) | 80 (100.0%) |
Physical Housing Characteristics in Moreland Hills
Housing Structures in Moreland Hills
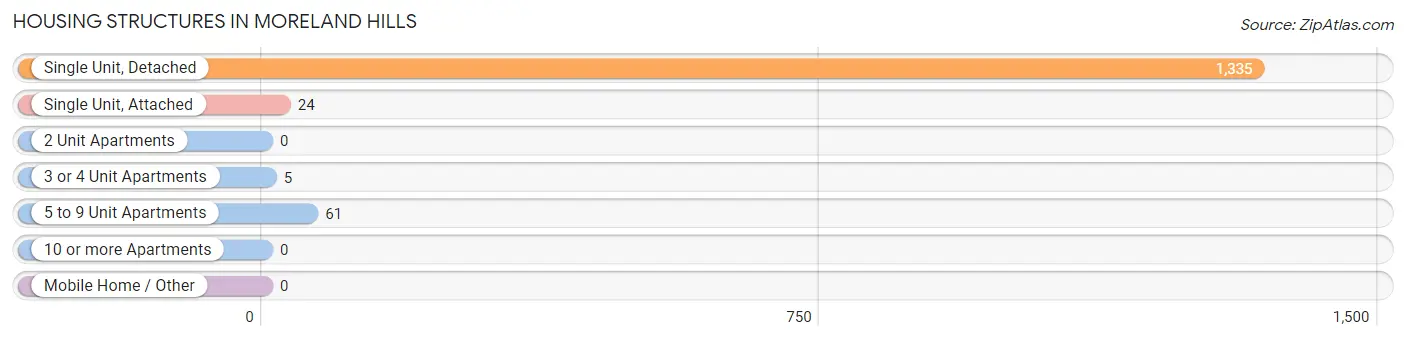
| Structure Type | # Housing Units | % Housing Units |
| Single Unit, Detached | 1,335 | 93.7% |
| Single Unit, Attached | 24 | 1.7% |
| 2 Unit Apartments | 0 | 0.0% |
| 3 or 4 Unit Apartments | 5 | 0.4% |
| 5 to 9 Unit Apartments | 61 | 4.3% |
| 10 or more Apartments | 0 | 0.0% |
| Mobile Home / Other | 0 | 0.0% |
| Total | 1,425 | 100.0% |
Housing Structures by Occupancy in Moreland Hills
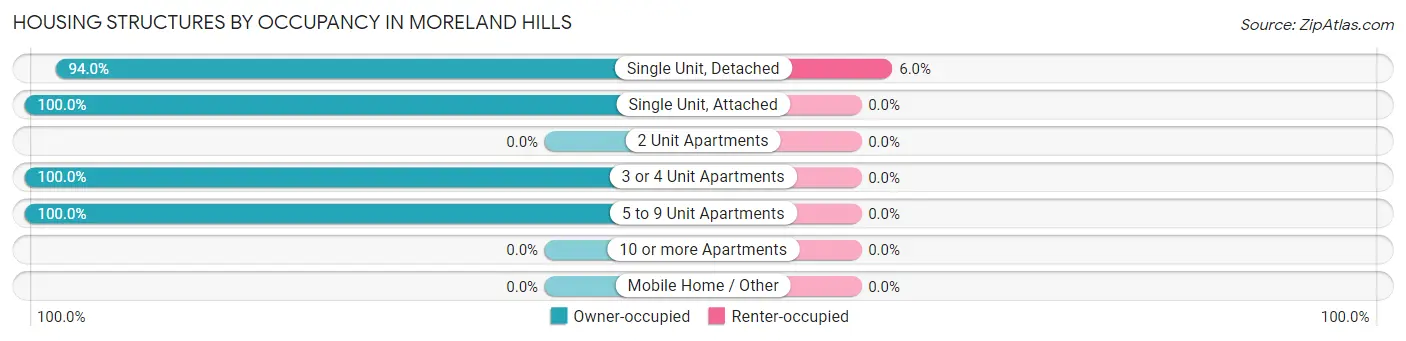
| Structure Type | Owner-occupied | Renter-occupied |
| Single Unit, Detached | 1,255 (94.0%) | 80 (6.0%) |
| Single Unit, Attached | 24 (100.0%) | 0 (0.0%) |
| 2 Unit Apartments | 0 (0.0%) | 0 (0.0%) |
| 3 or 4 Unit Apartments | 5 (100.0%) | 0 (0.0%) |
| 5 to 9 Unit Apartments | 61 (100.0%) | 0 (0.0%) |
| 10 or more Apartments | 0 (0.0%) | 0 (0.0%) |
| Mobile Home / Other | 0 (0.0%) | 0 (0.0%) |
| Total | 1,345 (94.4%) | 80 (5.6%) |
Housing Structures by Number of Rooms in Moreland Hills
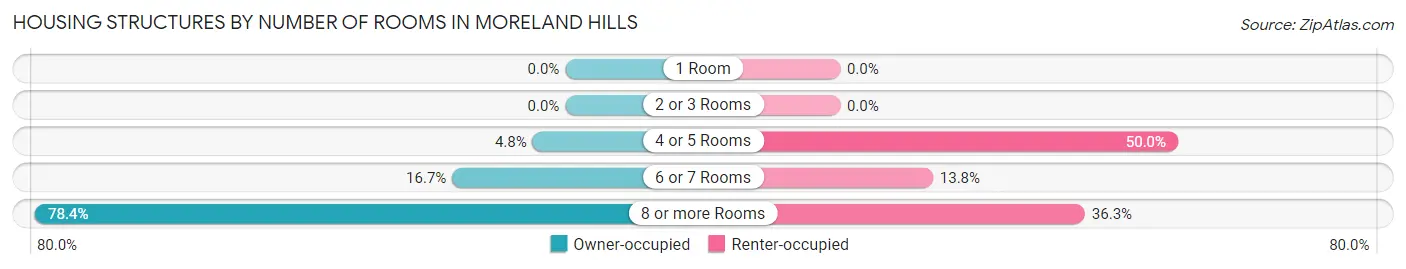
| Number of Rooms | Owner-occupied | Renter-occupied |
| 1 Room | 0 (0.0%) | 0 (0.0%) |
| 2 or 3 Rooms | 0 (0.0%) | 0 (0.0%) |
| 4 or 5 Rooms | 65 (4.8%) | 40 (50.0%) |
| 6 or 7 Rooms | 225 (16.7%) | 11 (13.8%) |
| 8 or more Rooms | 1,055 (78.4%) | 29 (36.2%) |
| Total | 1,345 (100.0%) | 80 (100.0%) |
Housing Structure by Heating Type in Moreland Hills
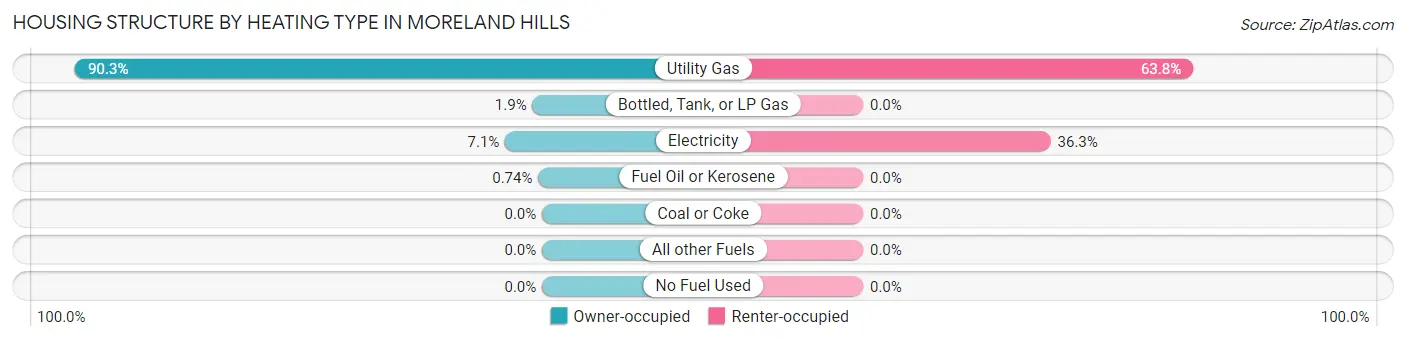
| Heating Type | Owner-occupied | Renter-occupied |
| Utility Gas | 1,214 (90.3%) | 51 (63.7%) |
| Bottled, Tank, or LP Gas | 25 (1.9%) | 0 (0.0%) |
| Electricity | 96 (7.1%) | 29 (36.2%) |
| Fuel Oil or Kerosene | 10 (0.7%) | 0 (0.0%) |
| Coal or Coke | 0 (0.0%) | 0 (0.0%) |
| All other Fuels | 0 (0.0%) | 0 (0.0%) |
| No Fuel Used | 0 (0.0%) | 0 (0.0%) |
| Total | 1,345 (100.0%) | 80 (100.0%) |
Household Vehicle Usage in Moreland Hills
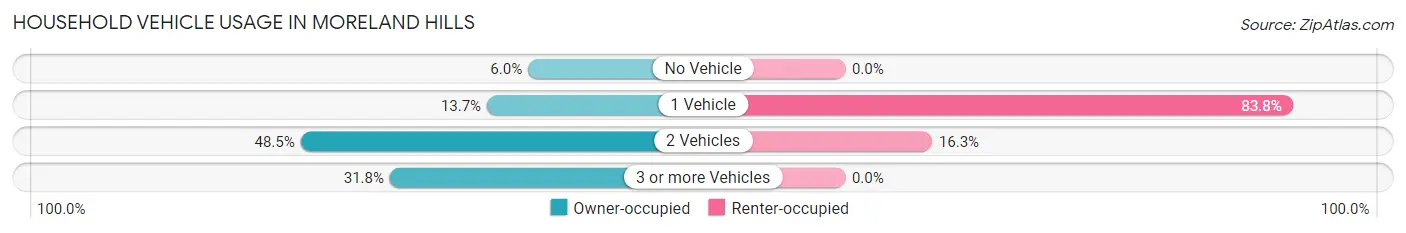
| Vehicles per Household | Owner-occupied | Renter-occupied |
| No Vehicle | 81 (6.0%) | 0 (0.0%) |
| 1 Vehicle | 184 (13.7%) | 67 (83.8%) |
| 2 Vehicles | 652 (48.5%) | 13 (16.3%) |
| 3 or more Vehicles | 428 (31.8%) | 0 (0.0%) |
| Total | 1,345 (100.0%) | 80 (100.0%) |
Real Estate & Mortgages in Moreland Hills
Real Estate and Mortgage Overview in Moreland Hills
| Characteristic | Without Mortgage | With Mortgage |
| Housing Units | 640 | 705 |
| Median Property Value | $531,600 | $515,400 |
| Median Household Income | $195,357 | $516 |
| Monthly Housing Costs | $1,501 | $349 |
| Real Estate Taxes | $10,001 | $0 |
Property Value by Mortgage Status in Moreland Hills
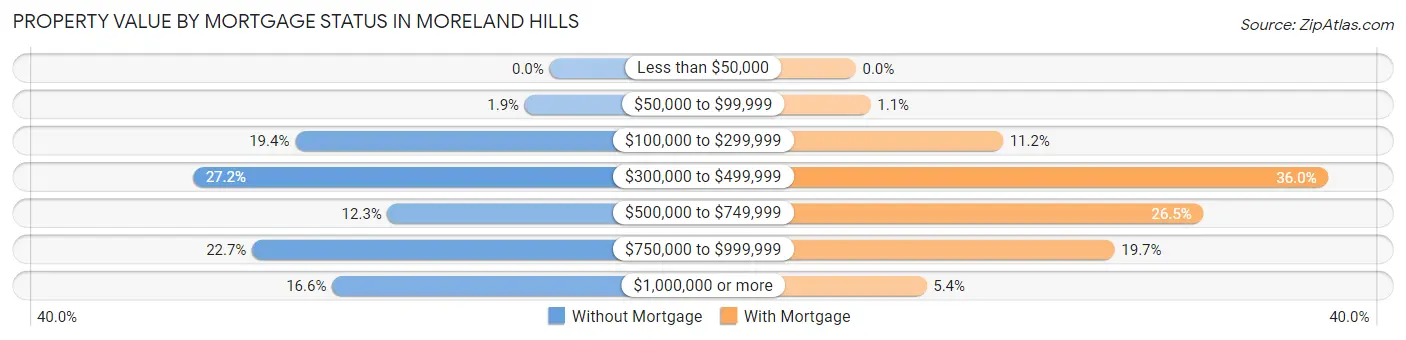
| Property Value | Without Mortgage | With Mortgage |
| Less than $50,000 | 0 (0.0%) | 0 (0.0%) |
| $50,000 to $99,999 | 12 (1.9%) | 8 (1.1%) |
| $100,000 to $299,999 | 124 (19.4%) | 79 (11.2%) |
| $300,000 to $499,999 | 174 (27.2%) | 254 (36.0%) |
| $500,000 to $749,999 | 79 (12.3%) | 187 (26.5%) |
| $750,000 to $999,999 | 145 (22.7%) | 139 (19.7%) |
| $1,000,000 or more | 106 (16.6%) | 38 (5.4%) |
| Total | 640 (100.0%) | 705 (100.0%) |
Household Income by Mortgage Status in Moreland Hills
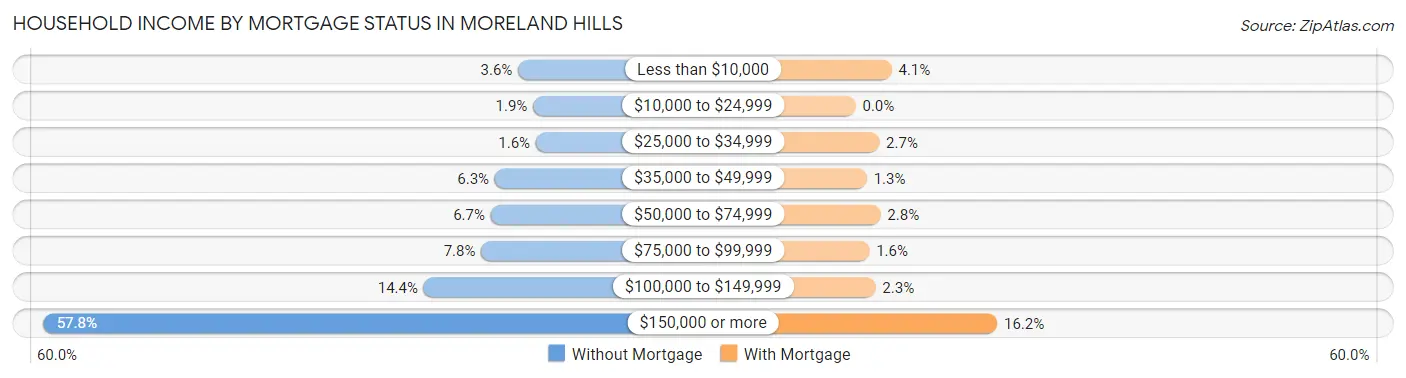
| Household Income | Without Mortgage | With Mortgage |
| Less than $10,000 | 23 (3.6%) | 29 (4.1%) |
| $10,000 to $24,999 | 12 (1.9%) | 0 (0.0%) |
| $25,000 to $34,999 | 10 (1.6%) | 19 (2.7%) |
| $35,000 to $49,999 | 40 (6.2%) | 9 (1.3%) |
| $50,000 to $74,999 | 43 (6.7%) | 20 (2.8%) |
| $75,000 to $99,999 | 50 (7.8%) | 11 (1.6%) |
| $100,000 to $149,999 | 92 (14.4%) | 16 (2.3%) |
| $150,000 or more | 370 (57.8%) | 114 (16.2%) |
| Total | 640 (100.0%) | 705 (100.0%) |
Property Value to Household Income Ratio in Moreland Hills
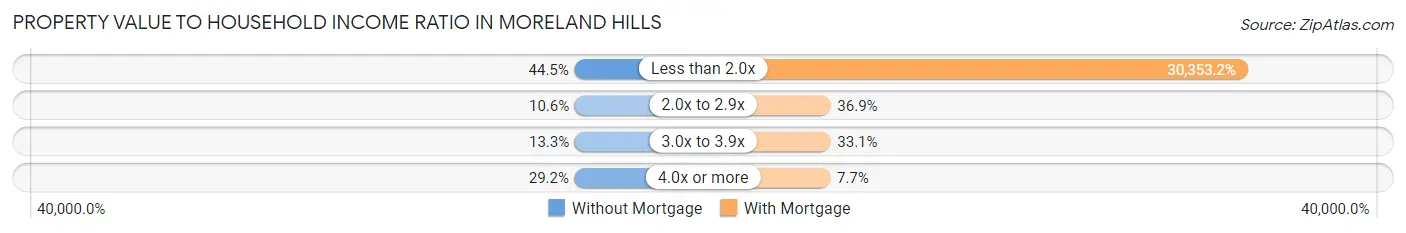
| Value-to-Income Ratio | Without Mortgage | With Mortgage |
| Less than 2.0x | 285 (44.5%) | 213,990 (30,353.2%) |
| 2.0x to 2.9x | 68 (10.6%) | 260 (36.9%) |
| 3.0x to 3.9x | 85 (13.3%) | 233 (33.1%) |
| 4.0x or more | 187 (29.2%) | 54 (7.7%) |
| Total | 640 (100.0%) | 705 (100.0%) |
Real Estate Taxes by Mortgage Status in Moreland Hills
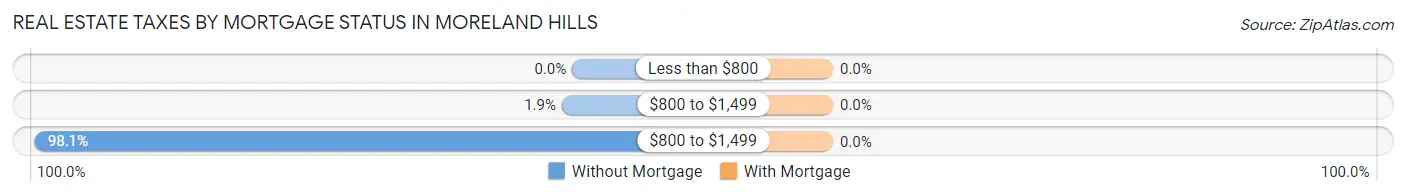
| Property Taxes | Without Mortgage | With Mortgage |
| Less than $800 | 0 (0.0%) | 0 (0.0%) |
| $800 to $1,499 | 12 (1.9%) | 0 (0.0%) |
| $800 to $1,499 | 628 (98.1%) | 0 (0.0%) |
| Total | 640 (100.0%) | 705 (100.0%) |
Health & Disability in Moreland Hills
Health Insurance Coverage by Age in Moreland Hills
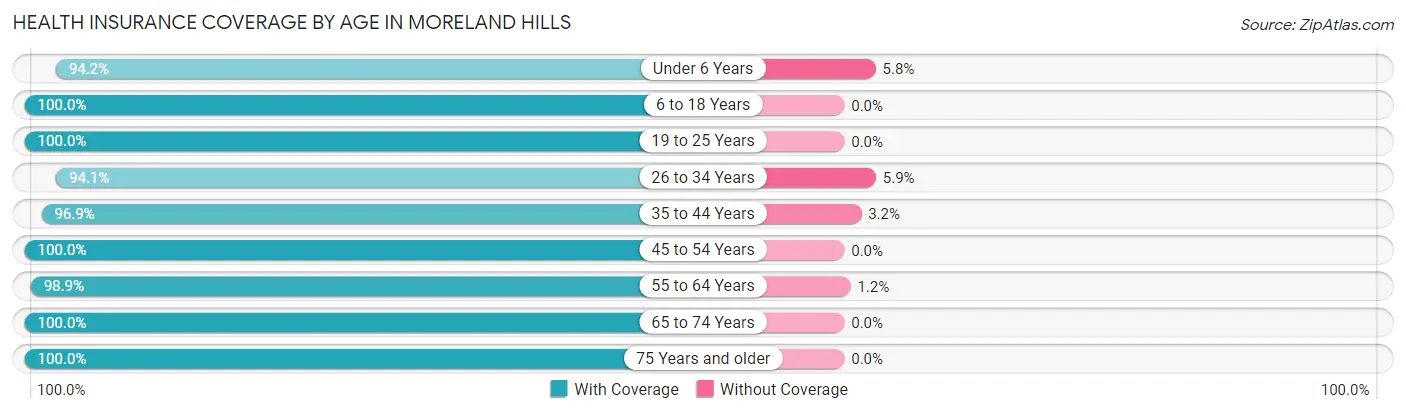
| Age Bracket | With Coverage | Without Coverage |
| Under 6 Years | 129 (94.2%) | 8 (5.8%) |
| 6 to 18 Years | 428 (100.0%) | 0 (0.0%) |
| 19 to 25 Years | 89 (100.0%) | 0 (0.0%) |
| 26 to 34 Years | 192 (94.1%) | 12 (5.9%) |
| 35 to 44 Years | 338 (96.9%) | 11 (3.2%) |
| 45 to 54 Years | 483 (100.0%) | 0 (0.0%) |
| 55 to 64 Years | 685 (98.9%) | 8 (1.1%) |
| 65 to 74 Years | 680 (100.0%) | 0 (0.0%) |
| 75 Years and older | 377 (100.0%) | 0 (0.0%) |
| Total | 3,401 (98.9%) | 39 (1.1%) |
Health Insurance Coverage by Citizenship Status in Moreland Hills
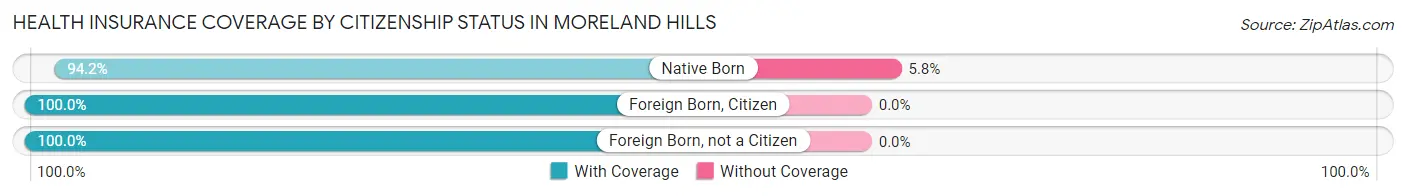
| Citizenship Status | With Coverage | Without Coverage |
| Native Born | 129 (94.2%) | 8 (5.8%) |
| Foreign Born, Citizen | 428 (100.0%) | 0 (0.0%) |
| Foreign Born, not a Citizen | 89 (100.0%) | 0 (0.0%) |
Health Insurance Coverage by Household Income in Moreland Hills
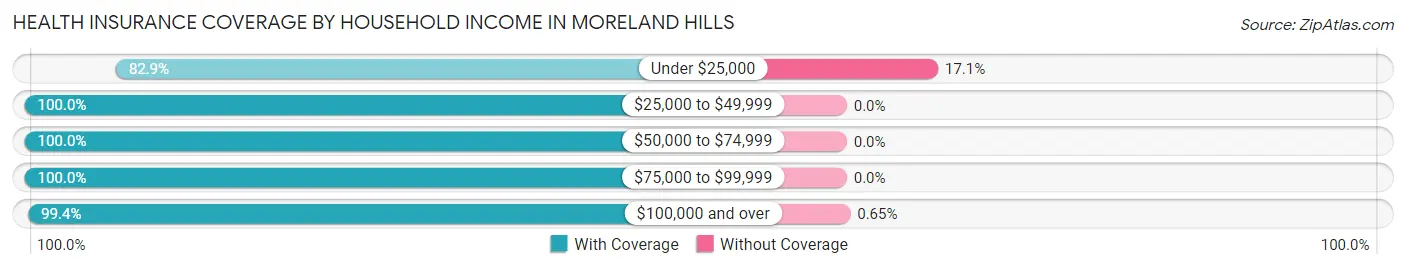
| Household Income | With Coverage | Without Coverage |
| Under $25,000 | 97 (82.9%) | 20 (17.1%) |
| $25,000 to $49,999 | 194 (100.0%) | 0 (0.0%) |
| $50,000 to $74,999 | 73 (100.0%) | 0 (0.0%) |
| $75,000 to $99,999 | 120 (100.0%) | 0 (0.0%) |
| $100,000 and over | 2,911 (99.4%) | 19 (0.6%) |
Public vs Private Health Insurance Coverage by Age in Moreland Hills
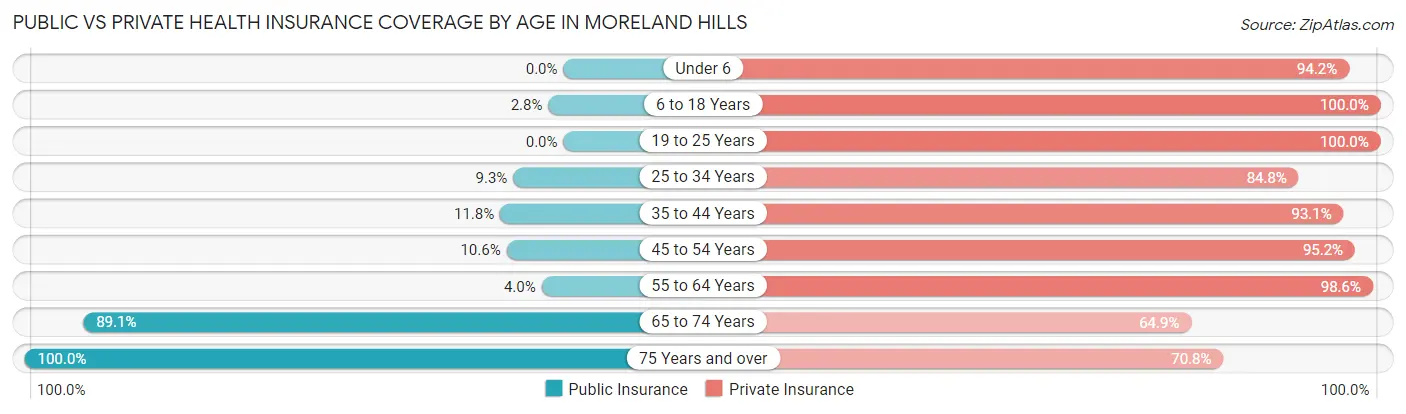
| Age Bracket | Public Insurance | Private Insurance |
| Under 6 | 0 (0.0%) | 129 (94.2%) |
| 6 to 18 Years | 12 (2.8%) | 428 (100.0%) |
| 19 to 25 Years | 0 (0.0%) | 89 (100.0%) |
| 25 to 34 Years | 19 (9.3%) | 173 (84.8%) |
| 35 to 44 Years | 41 (11.7%) | 325 (93.1%) |
| 45 to 54 Years | 51 (10.6%) | 460 (95.2%) |
| 55 to 64 Years | 28 (4.0%) | 683 (98.6%) |
| 65 to 74 Years | 606 (89.1%) | 441 (64.8%) |
| 75 Years and over | 377 (100.0%) | 267 (70.8%) |
| Total | 1,134 (33.0%) | 2,995 (87.1%) |
Disability Status by Sex by Age in Moreland Hills
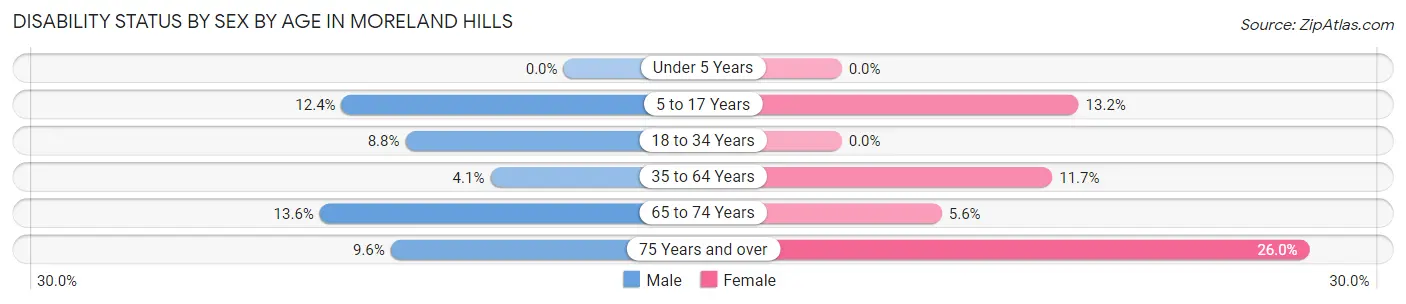
| Age Bracket | Male | Female |
| Under 5 Years | 0 (0.0%) | 0 (0.0%) |
| 5 to 17 Years | 32 (12.4%) | 24 (13.2%) |
| 18 to 34 Years | 22 (8.8%) | 0 (0.0%) |
| 35 to 64 Years | 27 (4.1%) | 101 (11.7%) |
| 65 to 74 Years | 46 (13.6%) | 19 (5.6%) |
| 75 Years and over | 20 (9.6%) | 44 (26.0%) |
Disability Class by Sex by Age in Moreland Hills
Disability Class: Hearing Difficulty
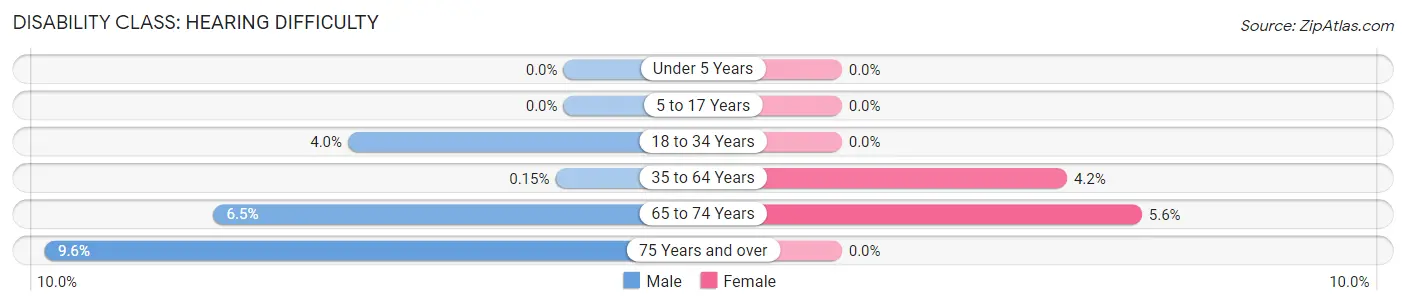
| Age Bracket | Male | Female |
| Under 5 Years | 0 (0.0%) | 0 (0.0%) |
| 5 to 17 Years | 0 (0.0%) | 0 (0.0%) |
| 18 to 34 Years | 10 (4.0%) | 0 (0.0%) |
| 35 to 64 Years | 1 (0.2%) | 36 (4.2%) |
| 65 to 74 Years | 22 (6.5%) | 19 (5.6%) |
| 75 Years and over | 20 (9.6%) | 0 (0.0%) |
Disability Class: Vision Difficulty
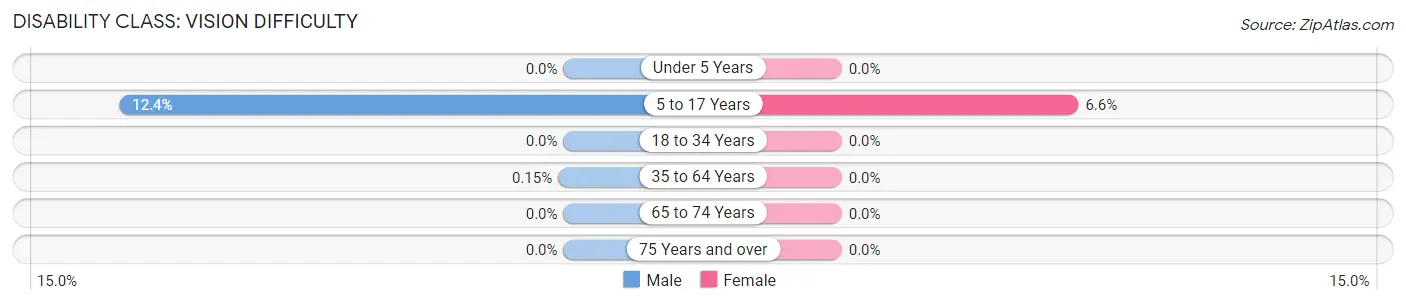
| Age Bracket | Male | Female |
| Under 5 Years | 0 (0.0%) | 0 (0.0%) |
| 5 to 17 Years | 32 (12.4%) | 12 (6.6%) |
| 18 to 34 Years | 0 (0.0%) | 0 (0.0%) |
| 35 to 64 Years | 1 (0.2%) | 0 (0.0%) |
| 65 to 74 Years | 0 (0.0%) | 0 (0.0%) |
| 75 Years and over | 0 (0.0%) | 0 (0.0%) |
Disability Class: Cognitive Difficulty
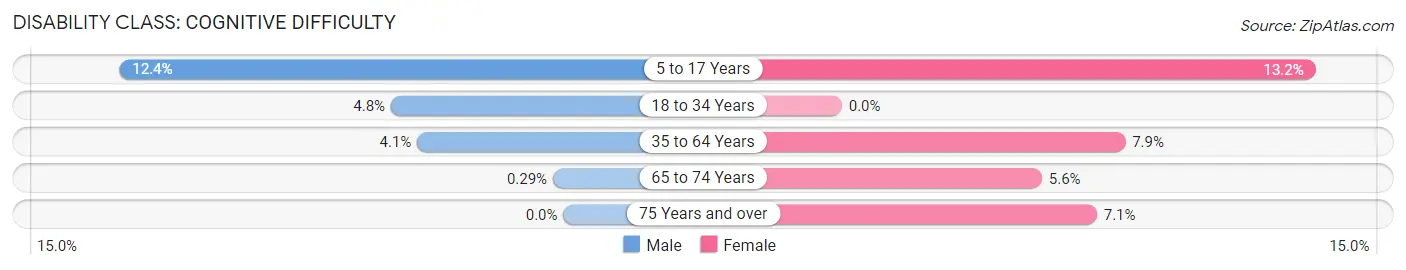
| Age Bracket | Male | Female |
| 5 to 17 Years | 32 (12.4%) | 24 (13.2%) |
| 18 to 34 Years | 12 (4.8%) | 0 (0.0%) |
| 35 to 64 Years | 27 (4.1%) | 68 (7.9%) |
| 65 to 74 Years | 1 (0.3%) | 19 (5.6%) |
| 75 Years and over | 0 (0.0%) | 12 (7.1%) |
Disability Class: Ambulatory Difficulty
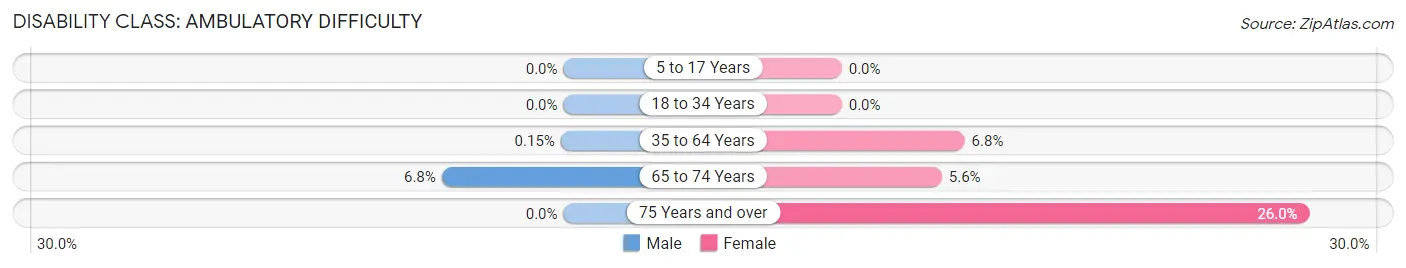
| Age Bracket | Male | Female |
| 5 to 17 Years | 0 (0.0%) | 0 (0.0%) |
| 18 to 34 Years | 0 (0.0%) | 0 (0.0%) |
| 35 to 64 Years | 1 (0.2%) | 59 (6.8%) |
| 65 to 74 Years | 23 (6.8%) | 19 (5.6%) |
| 75 Years and over | 0 (0.0%) | 44 (26.0%) |
Disability Class: Self-Care Difficulty
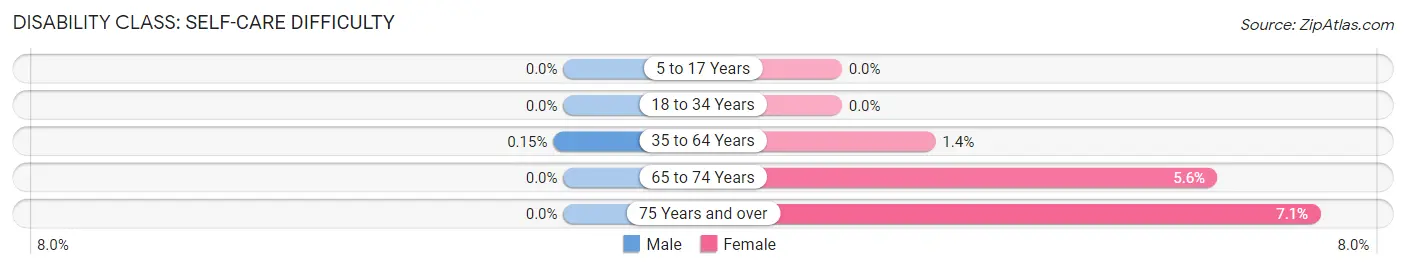
| Age Bracket | Male | Female |
| 5 to 17 Years | 0 (0.0%) | 0 (0.0%) |
| 18 to 34 Years | 0 (0.0%) | 0 (0.0%) |
| 35 to 64 Years | 1 (0.2%) | 12 (1.4%) |
| 65 to 74 Years | 0 (0.0%) | 19 (5.6%) |
| 75 Years and over | 0 (0.0%) | 12 (7.1%) |
Technology Access in Moreland Hills
Computing Device Access in Moreland Hills
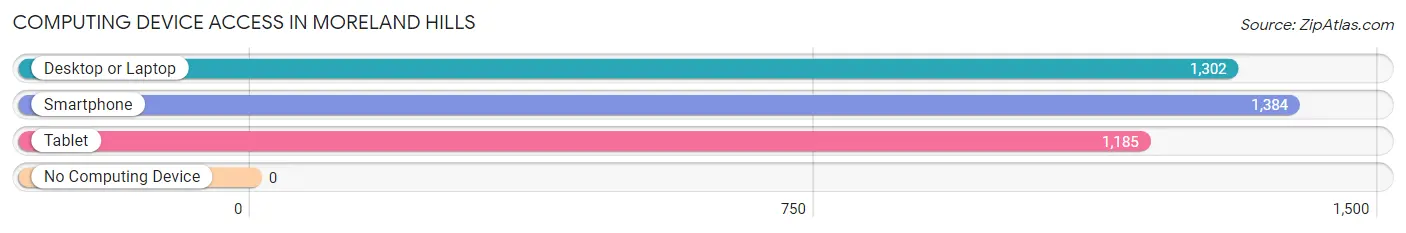
| Device Type | # Households | % Households |
| Desktop or Laptop | 1,302 | 91.4% |
| Smartphone | 1,384 | 97.1% |
| Tablet | 1,185 | 83.2% |
| No Computing Device | 0 | 0.0% |
| Total | 1,425 | 100.0% |
Internet Access in Moreland Hills
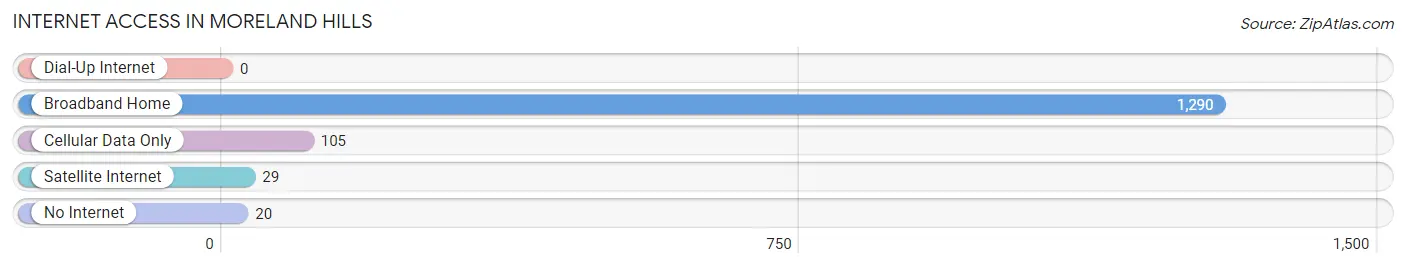
| Internet Type | # Households | % Households |
| Dial-Up Internet | 0 | 0.0% |
| Broadband Home | 1,290 | 90.5% |
| Cellular Data Only | 105 | 7.4% |
| Satellite Internet | 29 | 2.0% |
| No Internet | 20 | 1.4% |
| Total | 1,425 | 100.0% |
Moreland Hills Summary
Moreland Hills is a village located in Cuyahoga County, Ohio, United States. It is a suburb of Cleveland and is located in the eastern part of the county. The village was incorporated in 1927 and has a population of 3,845 as of the 2010 census.
History
Moreland Hills was first settled in 1815 by a group of settlers from Connecticut. The village was originally known as Orange Township, but was later renamed Moreland Hills in 1927 when it was incorporated. The name was chosen to honor the Moreland family, who were among the first settlers in the area.
The village was primarily an agricultural community until the 1950s, when it began to experience rapid growth due to its proximity to Cleveland. This growth continued into the 1960s and 1970s, when the village saw an influx of new residents and businesses.
Geography
Moreland Hills is located in eastern Cuyahoga County, Ohio, approximately 20 miles east of Cleveland. It is bordered by the cities of Pepper Pike, Orange, and Hunting Valley. The village covers an area of 4.2 square miles and has a population of 3,845 as of the 2010 census.
The village is situated on a plateau that is part of the Allegheny Plateau. The terrain is mostly flat, with some rolling hills. The Chagrin River runs through the village, and there are several small lakes and ponds in the area.
Economy
Moreland Hills is primarily a residential community, with most of its residents commuting to nearby cities for work. The village does have a few businesses, including a grocery store, a bank, and a few restaurants.
The village is also home to several corporate headquarters, including the headquarters of the Cleveland Clinic, Eaton Corporation, and the Cleveland Institute of Art.
Demographics
As of the 2010 census, Moreland Hills had a population of 3,845. The racial makeup of the village was 94.3% White, 1.7% African American, 0.3% Native American, 1.7% Asian, 0.1% Pacific Islander, 0.7% from other races, and 1.2% from two or more races. Hispanic or Latino of any race were 2.2% of the population.
The median household income in Moreland Hills was $118,945 in 2018, and the median home value was $521,000. The village has a highly educated population, with over 90% of residents having a bachelor's degree or higher.
Conclusion
Moreland Hills is a small village located in Cuyahoga County, Ohio. It was first settled in 1815 and was incorporated in 1927. The village is primarily a residential community, with most of its residents commuting to nearby cities for work. The village has a population of 3,845 as of the 2010 census, and the median household income is $118,945. Moreland Hills is home to several corporate headquarters, including the Cleveland Clinic, Eaton Corporation, and the Cleveland Institute of Art.
Common Questions
What is Per Capita Income in Moreland Hills?
Per Capita income in Moreland Hills is $149,750.
What is the Median Family Income in Moreland Hills?
Median Family Income in Moreland Hills is $208,611.
What is the Median Household income in Moreland Hills?
Median Household Income in Moreland Hills is $199,279.
What is Income or Wage Gap in Moreland Hills?
Income or Wage Gap in Moreland Hills is 55.5%.
Women in Moreland Hills earn 44.5 cents for every dollar earned by a man.
What is Family Income Deficit in Moreland Hills?
Family Income Deficit in Moreland Hills is $14,554.
Families that are below poverty line in Moreland Hills earn $14,554 less on average than the poverty threshold level.
What is Inequality or Gini Index in Moreland Hills?
Inequality or Gini Index in Moreland Hills is 0.56.
What is the Total Population of Moreland Hills?
Total Population of Moreland Hills is 3,440.
What is the Total Male Population of Moreland Hills?
Total Male Population of Moreland Hills is 1,795.
What is the Total Female Population of Moreland Hills?
Total Female Population of Moreland Hills is 1,645.
What is the Ratio of Males per 100 Females in Moreland Hills?
There are 109.12 Males per 100 Females in Moreland Hills.
What is the Ratio of Females per 100 Males in Moreland Hills?
There are 91.64 Females per 100 Males in Moreland Hills.
What is the Median Population Age in Moreland Hills?
Median Population Age in Moreland Hills is 55.6 Years.
What is the Average Family Size in Moreland Hills
Average Family Size in Moreland Hills is 2.6 People.
What is the Average Household Size in Moreland Hills
Average Household Size in Moreland Hills is 2.4 People.
How Large is the Labor Force in Moreland Hills?
There are 1,765 People in the Labor Forcein in Moreland Hills.
What is the Percentage of People in the Labor Force in Moreland Hills?
59.3% of People are in the Labor Force in Moreland Hills.
What is the Unemployment Rate in Moreland Hills?
Unemployment Rate in Moreland Hills is 5.4%.