Highland Heights, OH Map & Demographics
Highland Heights Map
Highland Heights Overview
$66,287
PER CAPITA INCOME
$146,355
AVG FAMILY INCOME
$124,821
AVG HOUSEHOLD INCOME
38.3%
WAGE / INCOME GAP [ % ]
61.7¢/ $1
WAGE / INCOME GAP [ $ ]
0.47
INEQUALITY / GINI INDEX
8,652
TOTAL POPULATION
4,183
MALE POPULATION
4,469
FEMALE POPULATION
93.60
MALES / 100 FEMALES
106.84
FEMALES / 100 MALES
48.0
MEDIAN AGE
2.9
AVG FAMILY SIZE
2.5
AVG HOUSEHOLD SIZE
4,243
LABOR FORCE [ PEOPLE ]
61.0%
PERCENT IN LABOR FORCE
4.6%
UNEMPLOYMENT RATE
Highland Heights Area Codes
Income in Highland Heights
Income Overview in Highland Heights
Per Capita Income in Highland Heights is $66,287, while median incomes of families and households are $146,355 and $124,821 respectively.
| Characteristic | Number | Measure |
| Per Capita Income | 8,652 | $66,287 |
| Median Family Income | 2,685 | $146,355 |
| Mean Family Income | 2,685 | $190,572 |
| Median Household Income | 3,504 | $124,821 |
| Mean Household Income | 3,504 | $164,705 |
| Income Deficit | 2,685 | $0 |
| Wage / Income Gap (%) | 8,652 | 38.27% |
| Wage / Income Gap ($) | 8,652 | 61.73¢ per $1 |
| Gini / Inequality Index | 8,652 | 0.47 |
Earnings by Sex in Highland Heights
Average Earnings in Highland Heights are $66,392, $76,830 for men and $47,426 for women, a difference of 38.3%.
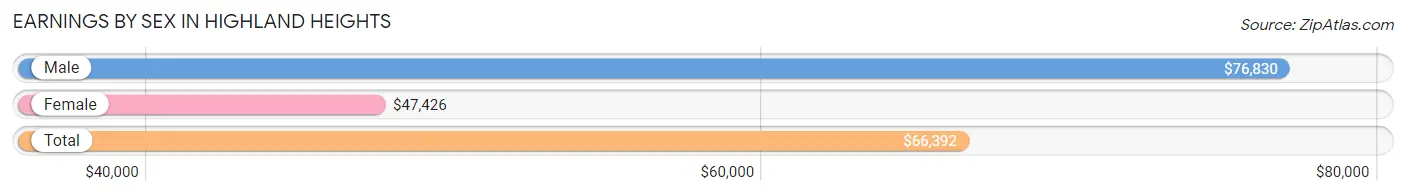
| Sex | Number | Average Earnings |
| Male | 2,464 (52.7%) | $76,830 |
| Female | 2,208 (47.3%) | $47,426 |
| Total | 4,672 (100.0%) | $66,392 |
Earnings by Sex by Income Bracket in Highland Heights
The most common earnings brackets in Highland Heights are $100,000+ for men (995 | 40.4%) and $100,000+ for women (381 | 17.3%).
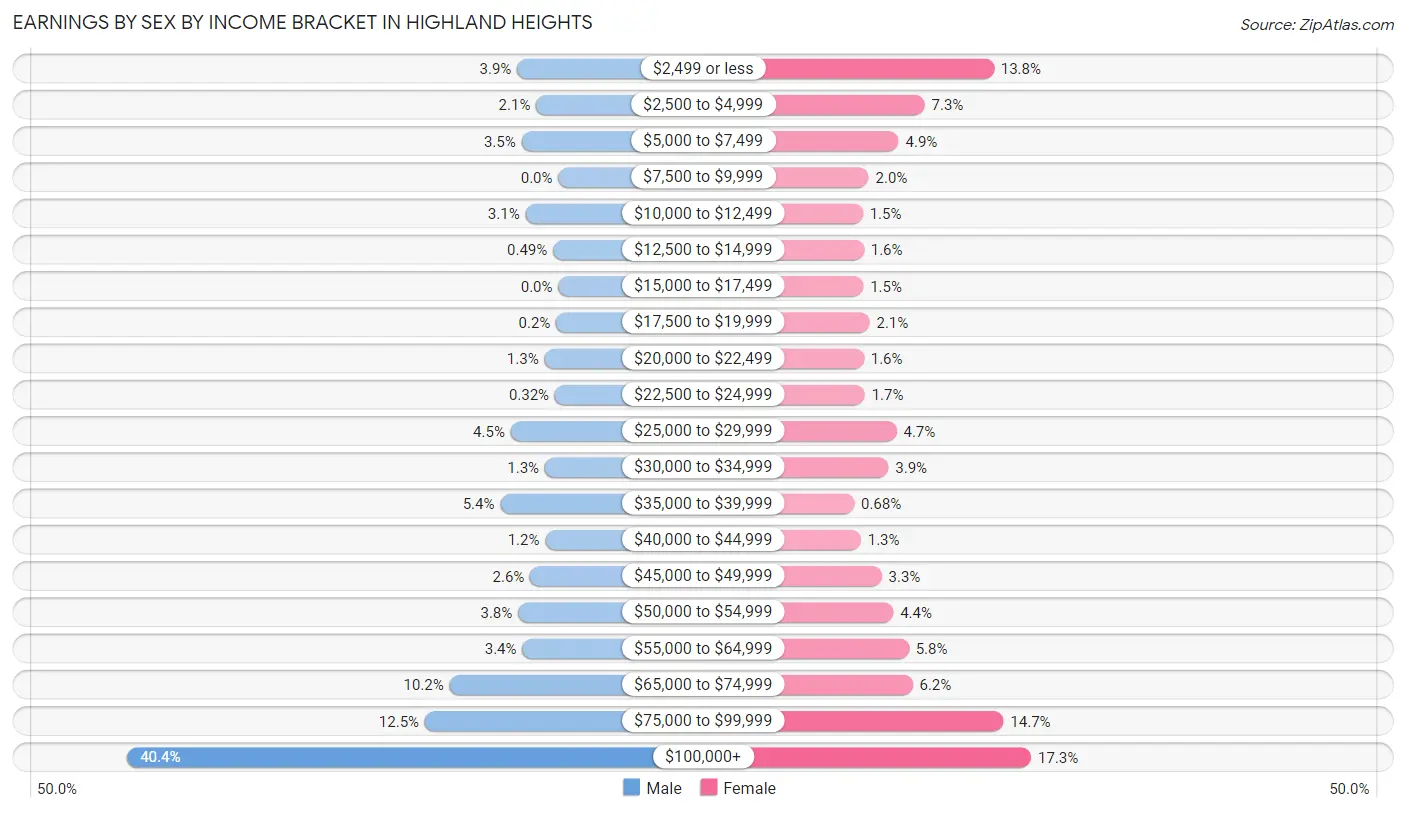
| Income | Male | Female |
| $2,499 or less | 95 (3.9%) | 304 (13.8%) |
| $2,500 to $4,999 | 51 (2.1%) | 161 (7.3%) |
| $5,000 to $7,499 | 85 (3.5%) | 107 (4.9%) |
| $7,500 to $9,999 | 0 (0.0%) | 45 (2.0%) |
| $10,000 to $12,499 | 76 (3.1%) | 33 (1.5%) |
| $12,500 to $14,999 | 12 (0.5%) | 35 (1.6%) |
| $15,000 to $17,499 | 0 (0.0%) | 34 (1.5%) |
| $17,500 to $19,999 | 5 (0.2%) | 47 (2.1%) |
| $20,000 to $22,499 | 32 (1.3%) | 35 (1.6%) |
| $22,500 to $24,999 | 8 (0.3%) | 37 (1.7%) |
| $25,000 to $29,999 | 110 (4.5%) | 103 (4.7%) |
| $30,000 to $34,999 | 31 (1.3%) | 86 (3.9%) |
| $35,000 to $39,999 | 134 (5.4%) | 15 (0.7%) |
| $40,000 to $44,999 | 30 (1.2%) | 29 (1.3%) |
| $45,000 to $49,999 | 65 (2.6%) | 72 (3.3%) |
| $50,000 to $54,999 | 93 (3.8%) | 96 (4.3%) |
| $55,000 to $64,999 | 83 (3.4%) | 128 (5.8%) |
| $65,000 to $74,999 | 251 (10.2%) | 136 (6.2%) |
| $75,000 to $99,999 | 308 (12.5%) | 324 (14.7%) |
| $100,000+ | 995 (40.4%) | 381 (17.3%) |
| Total | 2,464 (100.0%) | 2,208 (100.0%) |
Earnings by Sex by Educational Attainment in Highland Heights
Average earnings in Highland Heights are $83,500 for men and $53,292 for women, a difference of 36.2%. Men with an educational attainment of graduate degree enjoy the highest average annual earnings of $162,574, while those with college or associate's degree education earn the least with $56,371. Women with an educational attainment of graduate degree earn the most with the average annual earnings of $69,545, while those with less than high school education have the smallest earnings of $27,647.
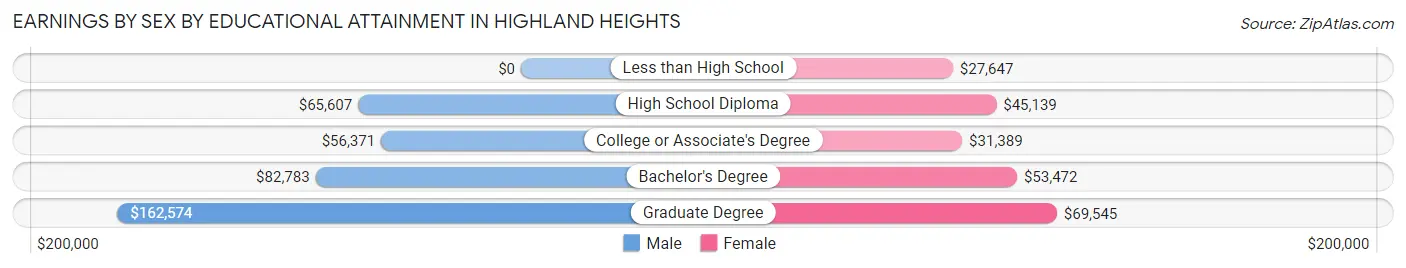
| Educational Attainment | Male Income | Female Income |
| Less than High School | - | - |
| High School Diploma | $65,607 | $45,139 |
| College or Associate's Degree | $56,371 | $31,389 |
| Bachelor's Degree | $82,783 | $53,472 |
| Graduate Degree | $162,574 | $69,545 |
| Total | $83,500 | $53,292 |
Family Income in Highland Heights
Family Income Brackets in Highland Heights
According to the Highland Heights family income data, there are 803 families falling into the $200,000+ income range, which is the most common income bracket and makes up 29.9% of all families. Conversely, the less than $10,000 income bracket is the least frequent group with only 19 families (0.7%) belonging to this category.
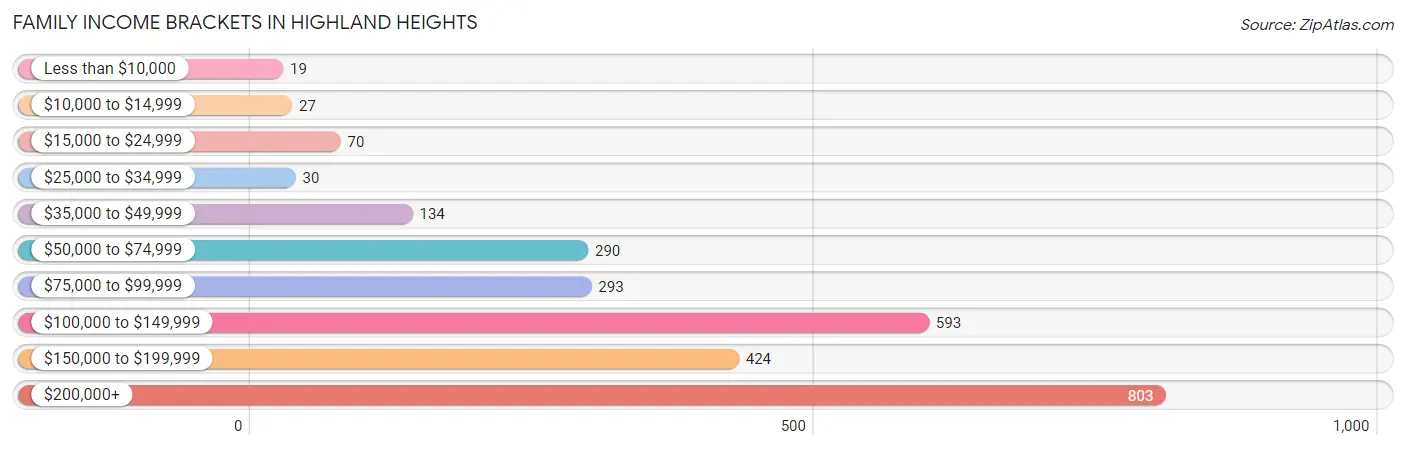
| Income Bracket | # Families | % Families |
| Less than $10,000 | 19 | 0.7% |
| $10,000 to $14,999 | 27 | 1.0% |
| $15,000 to $24,999 | 70 | 2.6% |
| $25,000 to $34,999 | 30 | 1.1% |
| $35,000 to $49,999 | 134 | 5.0% |
| $50,000 to $74,999 | 290 | 10.8% |
| $75,000 to $99,999 | 293 | 10.9% |
| $100,000 to $149,999 | 593 | 22.1% |
| $150,000 to $199,999 | 424 | 15.8% |
| $200,000+ | 803 | 29.9% |
Family Income by Famaliy Size in Highland Heights
5-person families (181 | 6.7%) account for the highest median family income in Highland Heights with $204,766 per family, while 2-person families (1,390 | 51.8%) have the highest median income of $66,358 per family member.
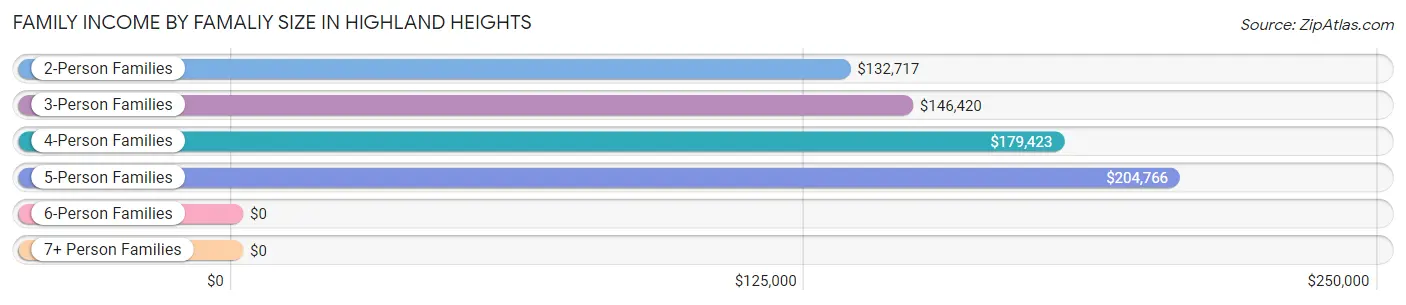
| Income Bracket | # Families | Median Income |
| 2-Person Families | 1,390 (51.8%) | $132,717 |
| 3-Person Families | 529 (19.7%) | $146,420 |
| 4-Person Families | 556 (20.7%) | $179,423 |
| 5-Person Families | 181 (6.7%) | $204,766 |
| 6-Person Families | 0 (0.0%) | $0 |
| 7+ Person Families | 29 (1.1%) | $0 |
| Total | 2,685 (100.0%) | $146,355 |
Family Income by Number of Earners in Highland Heights
The median family income in Highland Heights is $146,355, with families comprising 3+ earners (281) having the highest median family income of $200,262, while families with no earners (462) have the lowest median family income of $66,532, accounting for 10.5% and 17.2% of families, respectively.
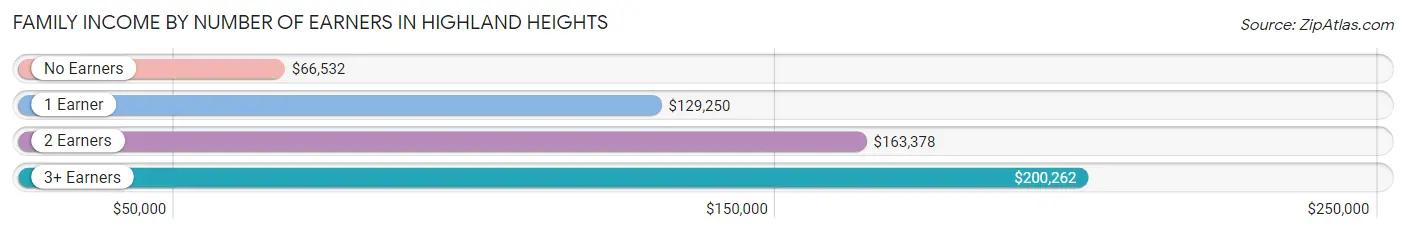
| Number of Earners | # Families | Median Income |
| No Earners | 462 (17.2%) | $66,532 |
| 1 Earner | 593 (22.1%) | $129,250 |
| 2 Earners | 1,349 (50.2%) | $163,378 |
| 3+ Earners | 281 (10.5%) | $200,262 |
| Total | 2,685 (100.0%) | $146,355 |
Household Income in Highland Heights
Household Income Brackets in Highland Heights
With 855 households falling in the category, the $200,000+ income range is the most frequent in Highland Heights, accounting for 24.4% of all households. In contrast, only 28 households (0.8%) fall into the $10,000 to $14,999 income bracket, making it the least populous group.
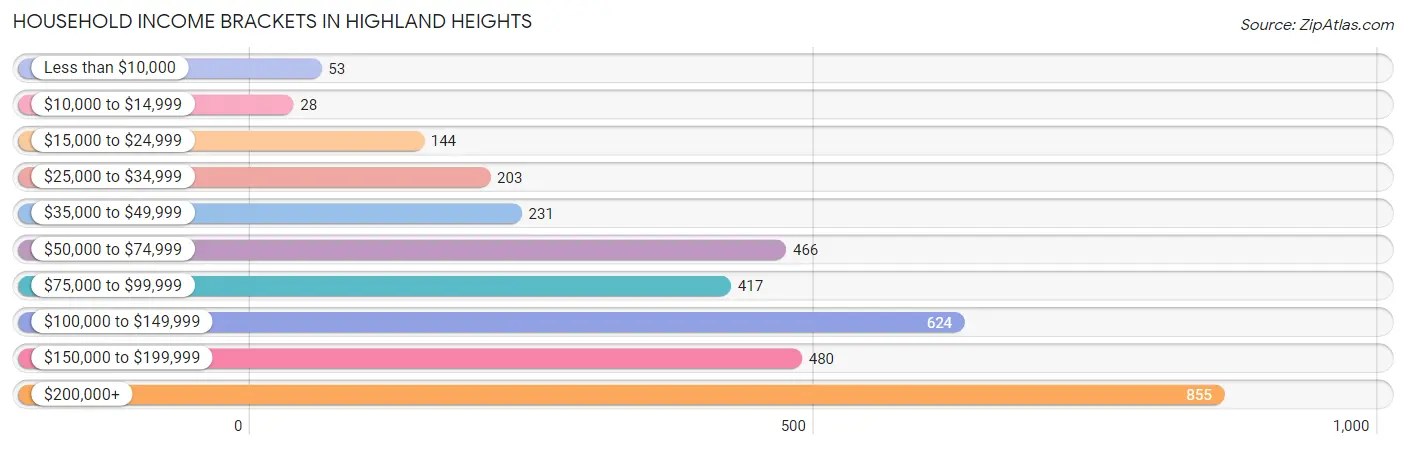
| Income Bracket | # Households | % Households |
| Less than $10,000 | 53 | 1.5% |
| $10,000 to $14,999 | 28 | 0.8% |
| $15,000 to $24,999 | 144 | 4.1% |
| $25,000 to $34,999 | 203 | 5.8% |
| $35,000 to $49,999 | 231 | 6.6% |
| $50,000 to $74,999 | 466 | 13.3% |
| $75,000 to $99,999 | 417 | 11.9% |
| $100,000 to $149,999 | 624 | 17.8% |
| $150,000 to $199,999 | 480 | 13.7% |
| $200,000+ | 855 | 24.4% |
Household Income by Householder Age in Highland Heights
The median household income in Highland Heights is $124,821, with the highest median household income of $164,954 found in the 45 to 64 years age bracket for the primary householder. A total of 1,161 households (33.1%) fall into this category. Meanwhile, the 15 to 24 years age bracket for the primary householder has the lowest median household income of $0, with 11 households (0.3%) in this group.
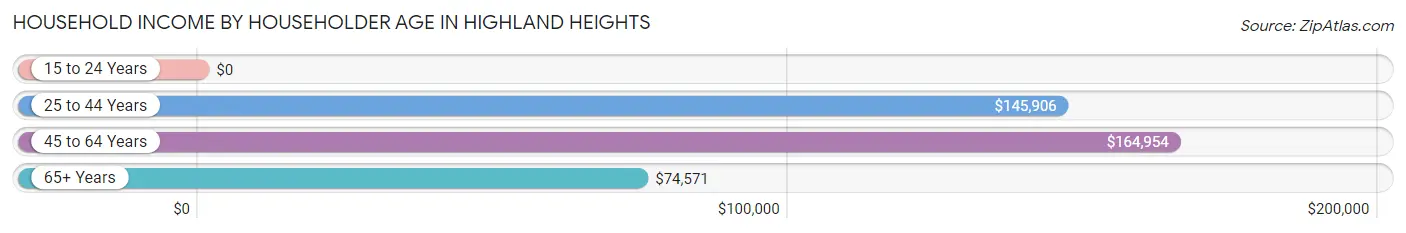
| Income Bracket | # Households | Median Income |
| 15 to 24 Years | 11 (0.3%) | $0 |
| 25 to 44 Years | 848 (24.2%) | $145,906 |
| 45 to 64 Years | 1,161 (33.1%) | $164,954 |
| 65+ Years | 1,484 (42.3%) | $74,571 |
| Total | 3,504 (100.0%) | $124,821 |
Poverty in Highland Heights
Income Below Poverty by Sex and Age in Highland Heights
With 2.0% poverty level for males and 2.2% for females among the residents of Highland Heights, 18 to 24 year old males and 75 year old and over females are the most vulnerable to poverty, with 24 males (12.3%) and 72 females (11.5%) in their respective age groups living below the poverty level.
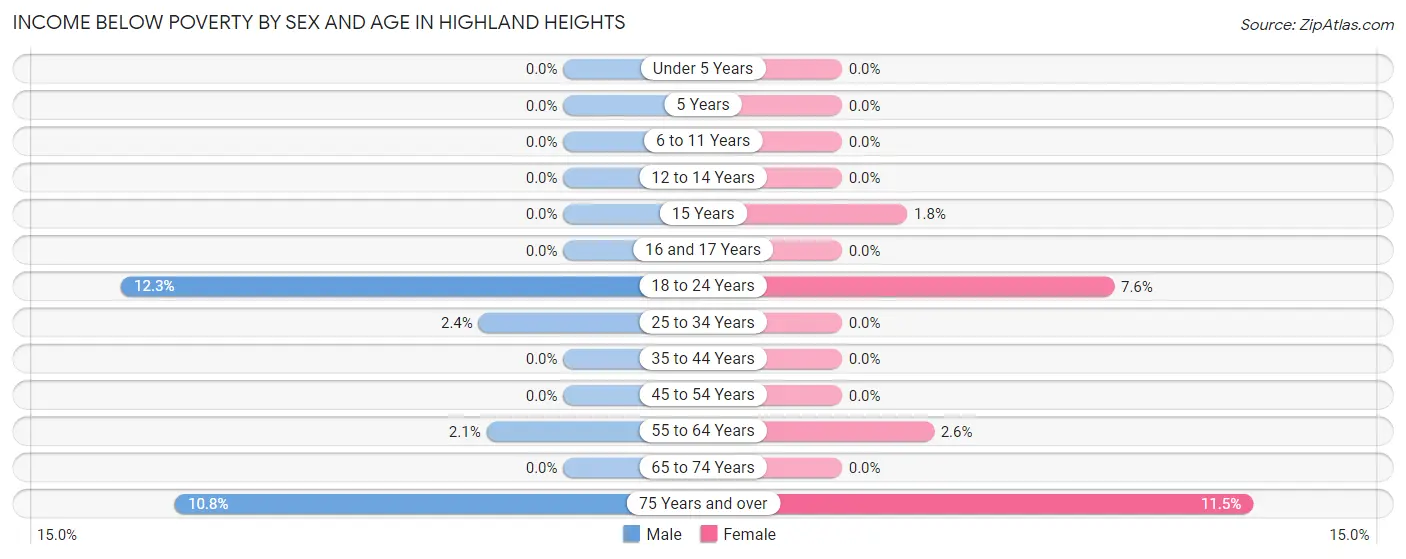
| Age Bracket | Male | Female |
| Under 5 Years | 0 (0.0%) | 0 (0.0%) |
| 5 Years | 0 (0.0%) | 0 (0.0%) |
| 6 to 11 Years | 0 (0.0%) | 0 (0.0%) |
| 12 to 14 Years | 0 (0.0%) | 0 (0.0%) |
| 15 Years | 0 (0.0%) | 2 (1.8%) |
| 16 and 17 Years | 0 (0.0%) | 0 (0.0%) |
| 18 to 24 Years | 24 (12.3%) | 10 (7.6%) |
| 25 to 34 Years | 5 (2.4%) | 0 (0.0%) |
| 35 to 44 Years | 0 (0.0%) | 0 (0.0%) |
| 45 to 54 Years | 0 (0.0%) | 0 (0.0%) |
| 55 to 64 Years | 13 (2.1%) | 16 (2.6%) |
| 65 to 74 Years | 0 (0.0%) | 0 (0.0%) |
| 75 Years and over | 40 (10.8%) | 72 (11.5%) |
| Total | 82 (2.0%) | 100 (2.2%) |
Income Above Poverty by Sex and Age in Highland Heights
According to the poverty statistics in Highland Heights, males aged under 5 years and females aged under 5 years are the age groups that are most secure financially, with 100.0% of males and 100.0% of females in these age groups living above the poverty line.
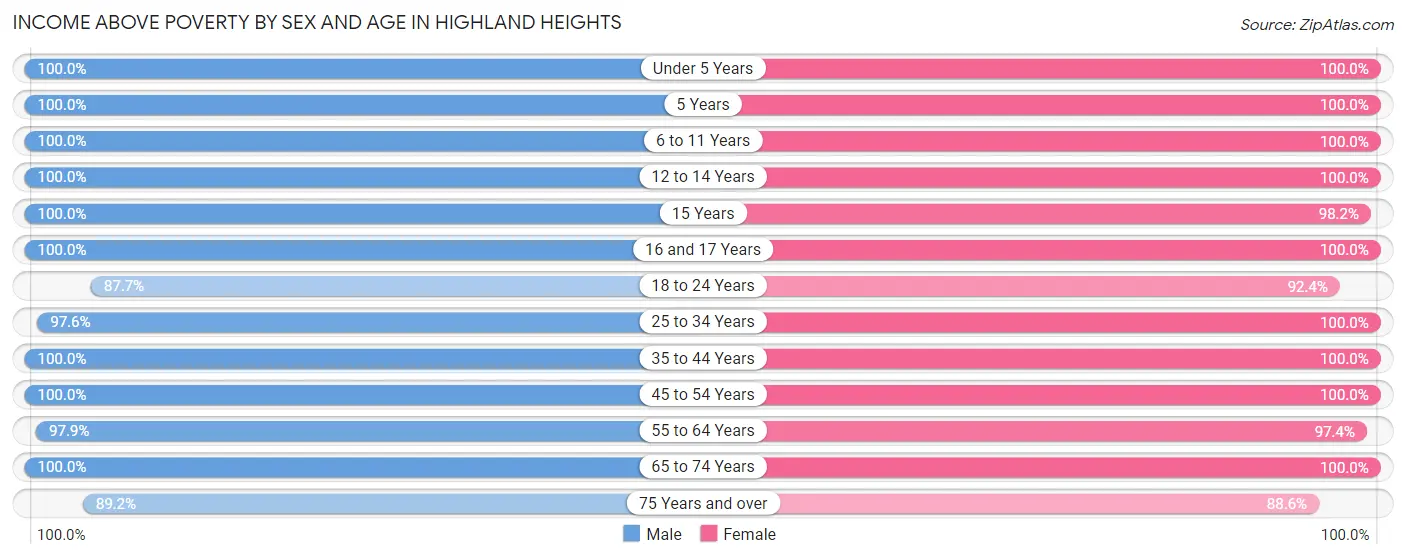
| Age Bracket | Male | Female |
| Under 5 Years | 182 (100.0%) | 183 (100.0%) |
| 5 Years | 32 (100.0%) | 8 (100.0%) |
| 6 to 11 Years | 310 (100.0%) | 479 (100.0%) |
| 12 to 14 Years | 190 (100.0%) | 74 (100.0%) |
| 15 Years | 115 (100.0%) | 108 (98.2%) |
| 16 and 17 Years | 126 (100.0%) | 161 (100.0%) |
| 18 to 24 Years | 171 (87.7%) | 122 (92.4%) |
| 25 to 34 Years | 207 (97.6%) | 266 (100.0%) |
| 35 to 44 Years | 752 (100.0%) | 563 (100.0%) |
| 45 to 54 Years | 380 (100.0%) | 518 (100.0%) |
| 55 to 64 Years | 594 (97.9%) | 609 (97.4%) |
| 65 to 74 Years | 712 (100.0%) | 694 (100.0%) |
| 75 Years and over | 330 (89.2%) | 557 (88.5%) |
| Total | 4,101 (98.0%) | 4,342 (97.8%) |
Income Below Poverty Among Married-Couple Families in Highland Heights
The poverty statistics for married-couple families in Highland Heights show that 1.5% or 37 of the total 2,395 families live below the poverty line. Families with no children have the highest poverty rate of 2.5%, comprising of 37 families. On the other hand, families with 1 or 2 children have the lowest poverty rate of 0.0%, which includes 0 families.
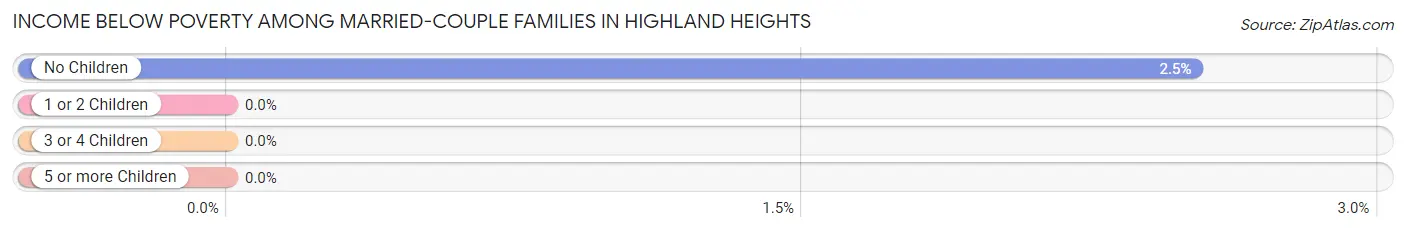
| Children | Above Poverty | Below Poverty |
| No Children | 1,429 (97.5%) | 37 (2.5%) |
| 1 or 2 Children | 764 (100.0%) | 0 (0.0%) |
| 3 or 4 Children | 136 (100.0%) | 0 (0.0%) |
| 5 or more Children | 29 (100.0%) | 0 (0.0%) |
| Total | 2,358 (98.5%) | 37 (1.5%) |
Income Below Poverty Among Single-Parent Households in Highland Heights
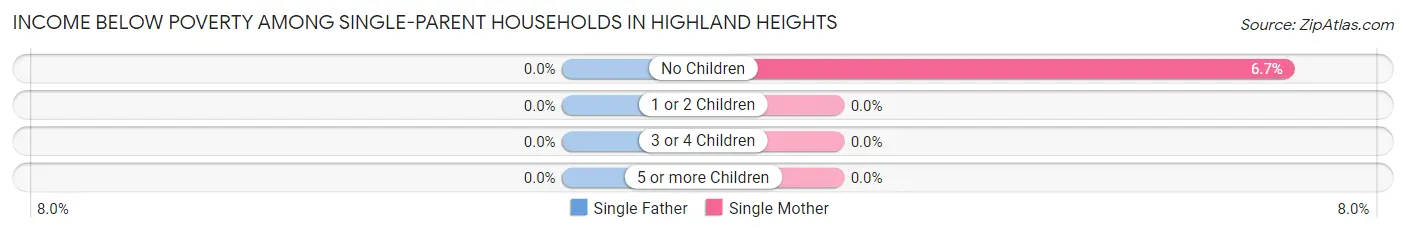
| Children | Single Father | Single Mother |
| No Children | 0 (0.0%) | 9 (6.7%) |
| 1 or 2 Children | 0 (0.0%) | 0 (0.0%) |
| 3 or 4 Children | 0 (0.0%) | 0 (0.0%) |
| 5 or more Children | 0 (0.0%) | 0 (0.0%) |
| Total | 0 (0.0%) | 9 (5.6%) |
Income Below Poverty Among Married-Couple vs Single-Parent Households in Highland Heights
The poverty data for Highland Heights shows that 37 of the married-couple family households (1.5%) and 9 of the single-parent households (3.1%) are living below the poverty level. Within the married-couple family households, those with no children have the highest poverty rate, with 37 households (2.5%) falling below the poverty line. Among the single-parent households, those with no children have the highest poverty rate, with 9 household (6.1%) living below poverty.
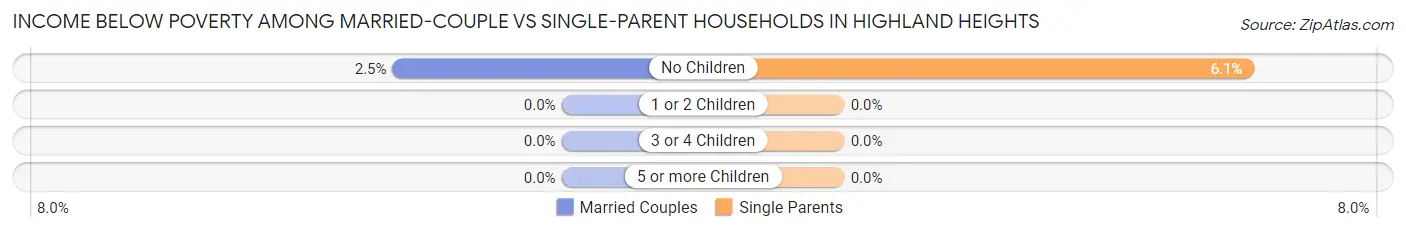
| Children | Married-Couple Families | Single-Parent Households |
| No Children | 37 (2.5%) | 9 (6.1%) |
| 1 or 2 Children | 0 (0.0%) | 0 (0.0%) |
| 3 or 4 Children | 0 (0.0%) | 0 (0.0%) |
| 5 or more Children | 0 (0.0%) | 0 (0.0%) |
| Total | 37 (1.5%) | 9 (3.1%) |
Race in Highland Heights
The most populous races in Highland Heights are White / Caucasian (7,750 | 89.6%), Asian (514 | 5.9%), and Two or more Races (253 | 2.9%).
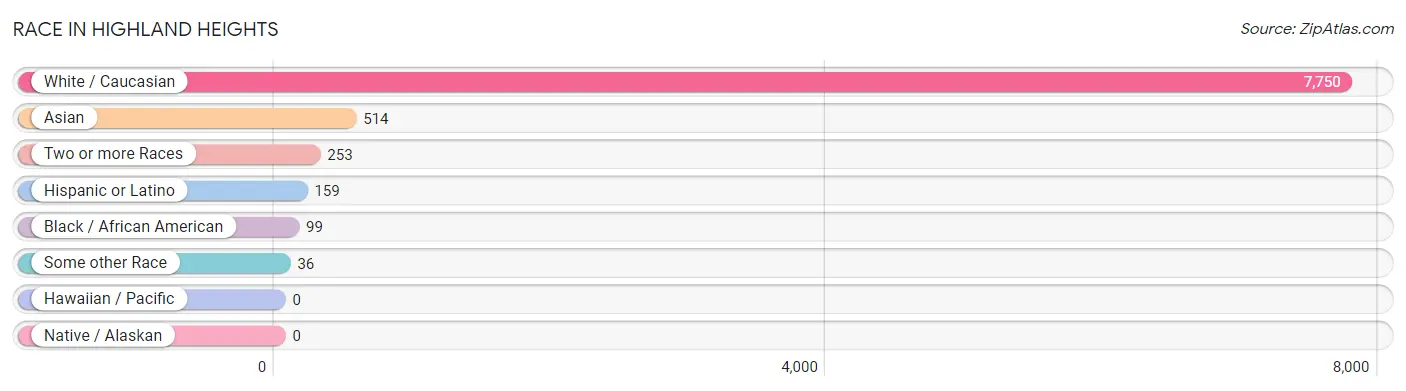
| Race | # Population | % Population |
| Asian | 514 | 5.9% |
| Black / African American | 99 | 1.1% |
| Hawaiian / Pacific | 0 | 0.0% |
| Hispanic or Latino | 159 | 1.8% |
| Native / Alaskan | 0 | 0.0% |
| White / Caucasian | 7,750 | 89.6% |
| Two or more Races | 253 | 2.9% |
| Some other Race | 36 | 0.4% |
| Total | 8,652 | 100.0% |
Ancestry in Highland Heights
The most populous ancestries reported in Highland Heights are Italian (2,402 | 27.8%), German (1,506 | 17.4%), Irish (1,385 | 16.0%), English (796 | 9.2%), and Polish (658 | 7.6%), together accounting for 78.0% of all Highland Heights residents.
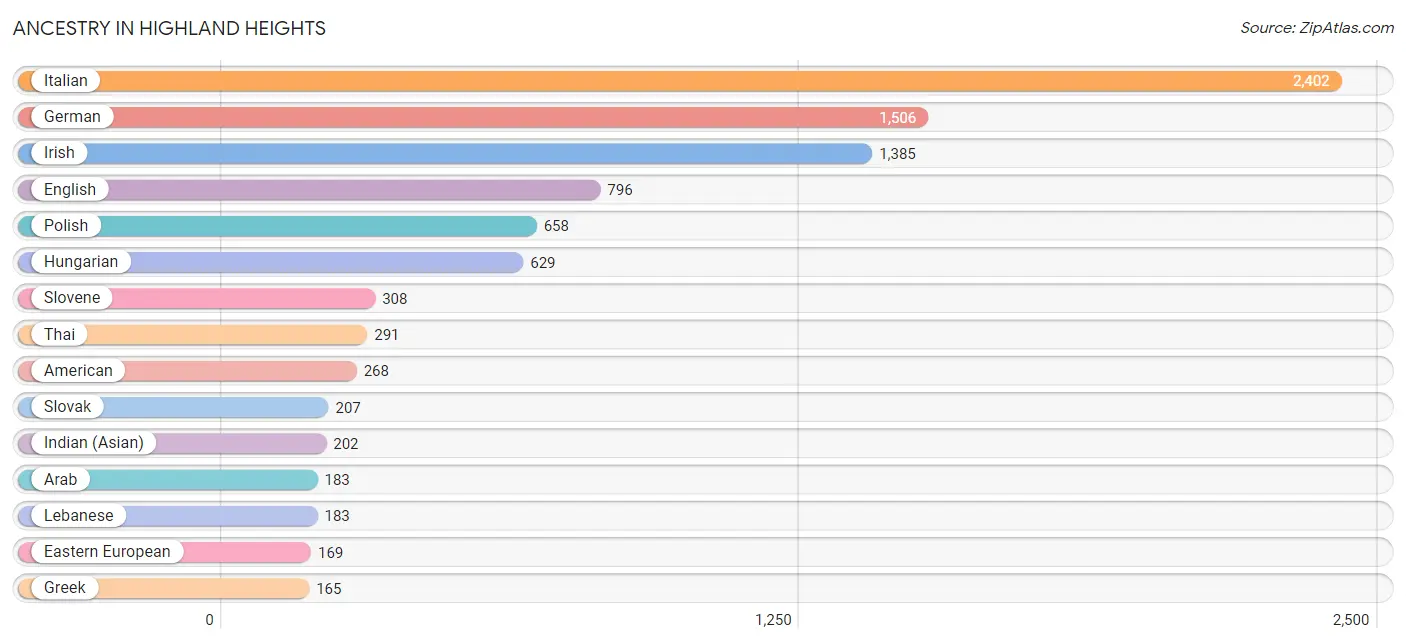
| Ancestry | # Population | % Population |
| American | 268 | 3.1% |
| Arab | 183 | 2.1% |
| Armenian | 22 | 0.3% |
| Austrian | 54 | 0.6% |
| British | 42 | 0.5% |
| Burmese | 13 | 0.2% |
| Canadian | 18 | 0.2% |
| Croatian | 98 | 1.1% |
| Czech | 46 | 0.5% |
| Czechoslovakian | 15 | 0.2% |
| Dutch | 32 | 0.4% |
| Eastern European | 169 | 1.9% |
| English | 796 | 9.2% |
| Estonian | 19 | 0.2% |
| European | 20 | 0.2% |
| French | 69 | 0.8% |
| German | 1,506 | 17.4% |
| Greek | 165 | 1.9% |
| Hungarian | 629 | 7.3% |
| Indian (Asian) | 202 | 2.3% |
| Irish | 1,385 | 16.0% |
| Italian | 2,402 | 27.8% |
| Korean | 65 | 0.7% |
| Lebanese | 183 | 2.1% |
| Lithuanian | 89 | 1.0% |
| Luxembourger | 11 | 0.1% |
| Mexican | 158 | 1.8% |
| New Zealander | 32 | 0.4% |
| Norwegian | 33 | 0.4% |
| Polish | 658 | 7.6% |
| Portuguese | 31 | 0.4% |
| Puerto Rican | 1 | 0.0% |
| Romanian | 13 | 0.2% |
| Russian | 103 | 1.2% |
| Scandinavian | 31 | 0.4% |
| Scotch-Irish | 7 | 0.1% |
| Scottish | 134 | 1.5% |
| Slavic | 5 | 0.1% |
| Slovak | 207 | 2.4% |
| Slovene | 308 | 3.6% |
| Sri Lankan | 62 | 0.7% |
| Swedish | 37 | 0.4% |
| Swiss | 7 | 0.1% |
| Thai | 291 | 3.4% |
| Ukrainian | 112 | 1.3% |
| Welsh | 83 | 1.0% | View All 46 Rows |
Immigrants in Highland Heights
The most numerous immigrant groups reported in Highland Heights came from Asia (521 | 6.0%), South Central Asia (266 | 3.1%), Europe (227 | 2.6%), India (205 | 2.4%), and Eastern Europe (145 | 1.7%), together accounting for 15.8% of all Highland Heights residents.
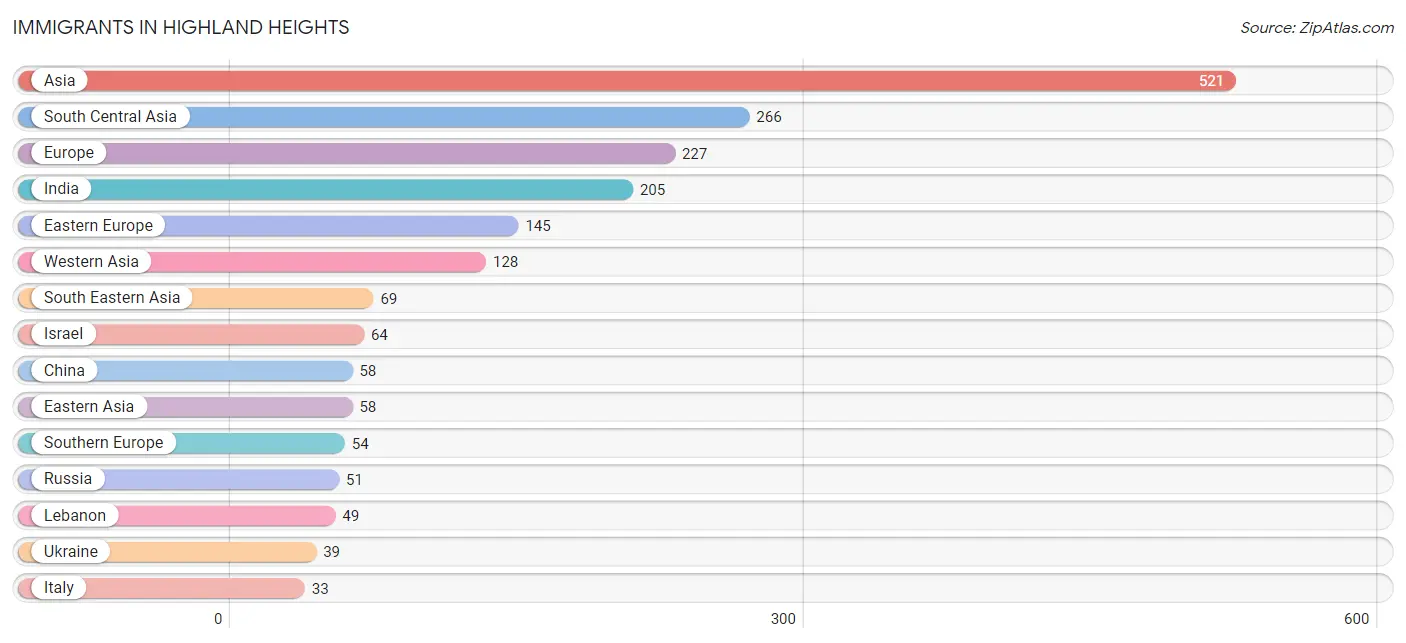
| Immigration Origin | # Population | % Population |
| Asia | 521 | 6.0% |
| Cambodia | 17 | 0.2% |
| Central America | 7 | 0.1% |
| China | 58 | 0.7% |
| Croatia | 15 | 0.2% |
| Eastern Asia | 58 | 0.7% |
| Eastern Europe | 145 | 1.7% |
| Europe | 227 | 2.6% |
| France | 8 | 0.1% |
| Germany | 20 | 0.2% |
| Greece | 21 | 0.2% |
| India | 205 | 2.4% |
| Iran | 6 | 0.1% |
| Israel | 64 | 0.7% |
| Italy | 33 | 0.4% |
| Kazakhstan | 33 | 0.4% |
| Kuwait | 15 | 0.2% |
| Latin America | 7 | 0.1% |
| Lebanon | 49 | 0.6% |
| Malaysia | 17 | 0.2% |
| Mexico | 7 | 0.1% |
| Moldova | 29 | 0.3% |
| Oceania | 32 | 0.4% |
| Pakistan | 22 | 0.3% |
| Philippines | 16 | 0.2% |
| Poland | 11 | 0.1% |
| Russia | 51 | 0.6% |
| Singapore | 19 | 0.2% |
| South Central Asia | 266 | 3.1% |
| South Eastern Asia | 69 | 0.8% |
| Southern Europe | 54 | 0.6% |
| Ukraine | 39 | 0.4% |
| Western Asia | 128 | 1.5% |
| Western Europe | 28 | 0.3% | View All 34 Rows |
Sex and Age in Highland Heights
Sex and Age in Highland Heights
The most populous age groups in Highland Heights are 40 to 44 Years (408 | 9.8%) for men and 65 to 69 Years (424 | 9.5%) for women.
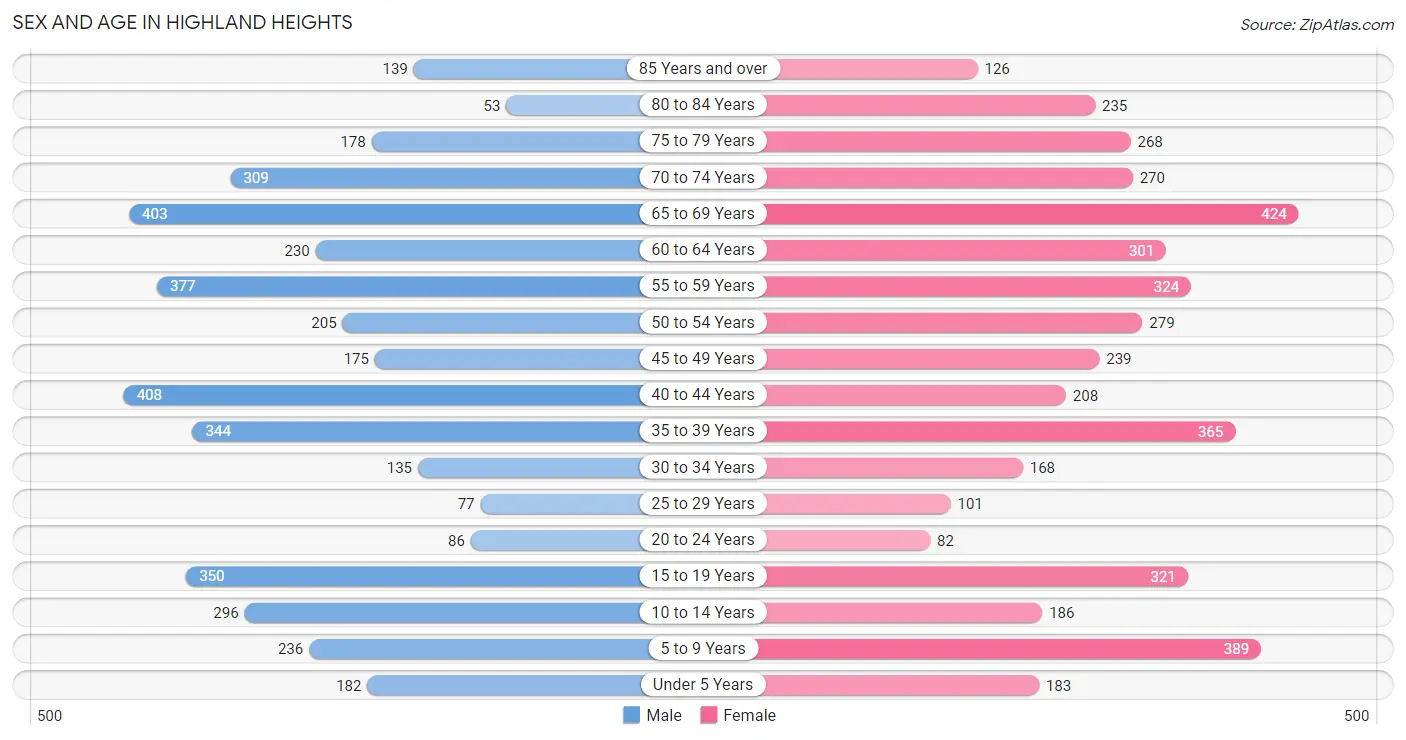
| Age Bracket | Male | Female |
| Under 5 Years | 182 (4.3%) | 183 (4.1%) |
| 5 to 9 Years | 236 (5.6%) | 389 (8.7%) |
| 10 to 14 Years | 296 (7.1%) | 186 (4.2%) |
| 15 to 19 Years | 350 (8.4%) | 321 (7.2%) |
| 20 to 24 Years | 86 (2.1%) | 82 (1.8%) |
| 25 to 29 Years | 77 (1.8%) | 101 (2.3%) |
| 30 to 34 Years | 135 (3.2%) | 168 (3.8%) |
| 35 to 39 Years | 344 (8.2%) | 365 (8.2%) |
| 40 to 44 Years | 408 (9.8%) | 208 (4.6%) |
| 45 to 49 Years | 175 (4.2%) | 239 (5.3%) |
| 50 to 54 Years | 205 (4.9%) | 279 (6.2%) |
| 55 to 59 Years | 377 (9.0%) | 324 (7.2%) |
| 60 to 64 Years | 230 (5.5%) | 301 (6.7%) |
| 65 to 69 Years | 403 (9.6%) | 424 (9.5%) |
| 70 to 74 Years | 309 (7.4%) | 270 (6.0%) |
| 75 to 79 Years | 178 (4.3%) | 268 (6.0%) |
| 80 to 84 Years | 53 (1.3%) | 235 (5.3%) |
| 85 Years and over | 139 (3.3%) | 126 (2.8%) |
| Total | 4,183 (100.0%) | 4,469 (100.0%) |
Families and Households in Highland Heights
Median Family Size in Highland Heights
The median family size in Highland Heights is 2.86 persons per family, with single male/father families (129 | 4.8%) accounting for the largest median family size of 3.48 persons per family. On the other hand, single female/mother families (161 | 6.0%) represent the smallest median family size with 2.53 persons per family.
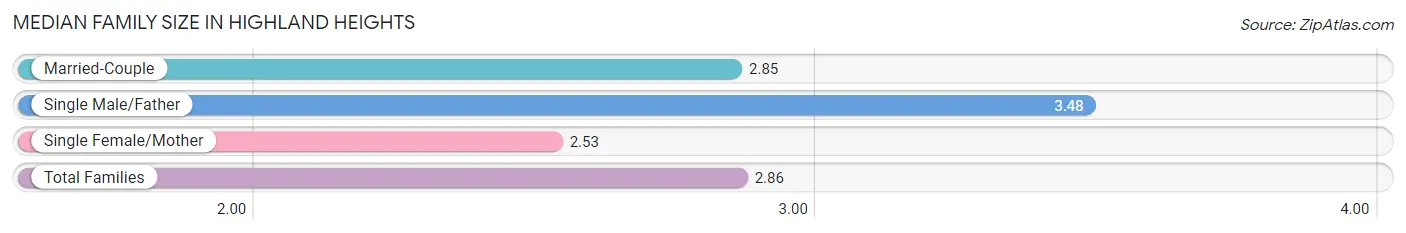
| Family Type | # Families | Family Size |
| Married-Couple | 2,395 (89.2%) | 2.85 |
| Single Male/Father | 129 (4.8%) | 3.48 |
| Single Female/Mother | 161 (6.0%) | 2.53 |
| Total Families | 2,685 (100.0%) | 2.86 |
Median Household Size in Highland Heights
The median household size in Highland Heights is 2.46 persons per household, with single male/father households (129 | 3.7%) accounting for the largest median household size of 3.59 persons per household. non-family households (819 | 23.4%) represent the smallest median household size with 1.09 persons per household.
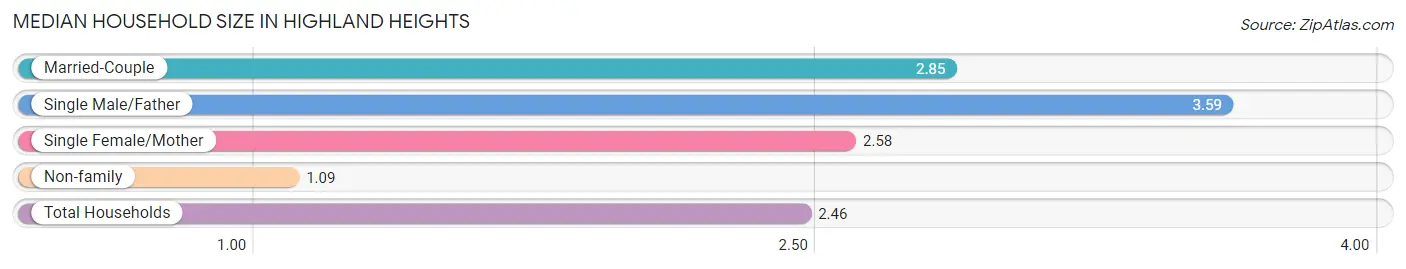
| Household Type | # Households | Household Size |
| Married-Couple | 2,395 (68.3%) | 2.85 |
| Single Male/Father | 129 (3.7%) | 3.59 |
| Single Female/Mother | 161 (4.6%) | 2.58 |
| Non-family | 819 (23.4%) | 1.09 |
| Total Households | 3,504 (100.0%) | 2.46 |
Household Size by Marriage Status in Highland Heights
Out of a total of 3,504 households in Highland Heights, 2,685 (76.6%) are family households, while 819 (23.4%) are nonfamily households. The most numerous type of family households are 2-person households, comprising 1,364, and the most common type of nonfamily households are 1-person households, comprising 750.
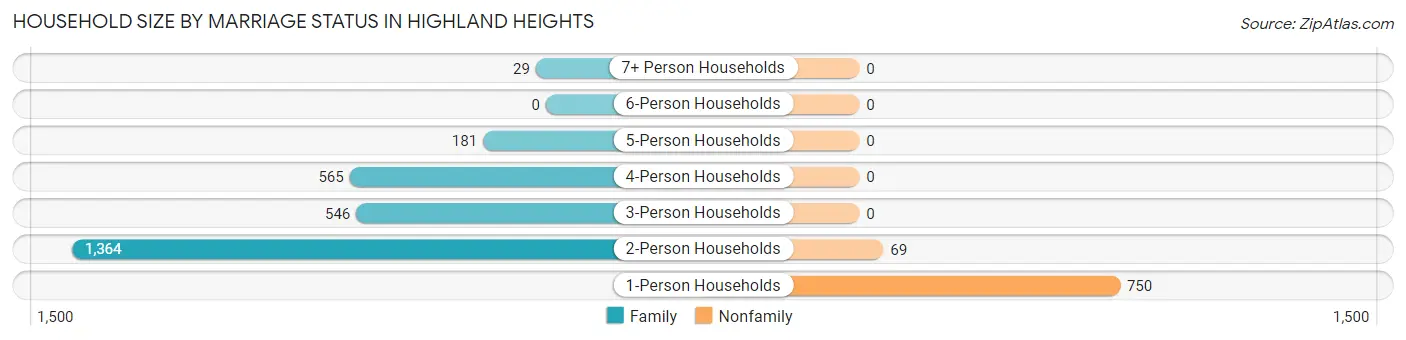
| Household Size | Family Households | Nonfamily Households |
| 1-Person Households | - | 750 (21.4%) |
| 2-Person Households | 1,364 (38.9%) | 69 (2.0%) |
| 3-Person Households | 546 (15.6%) | 0 (0.0%) |
| 4-Person Households | 565 (16.1%) | 0 (0.0%) |
| 5-Person Households | 181 (5.2%) | 0 (0.0%) |
| 6-Person Households | 0 (0.0%) | 0 (0.0%) |
| 7+ Person Households | 29 (0.8%) | 0 (0.0%) |
| Total | 2,685 (76.6%) | 819 (23.4%) |
Female Fertility in Highland Heights
Fertility by Age in Highland Heights
Average fertility rate in Highland Heights is 28.0 births per 1,000 women. Women in the age bracket of 35 to 50 years have the highest fertility rate with 36.0 births per 1,000 women. Women in the age bracket of 35 to 50 years acount for 72.7% of all women with births.
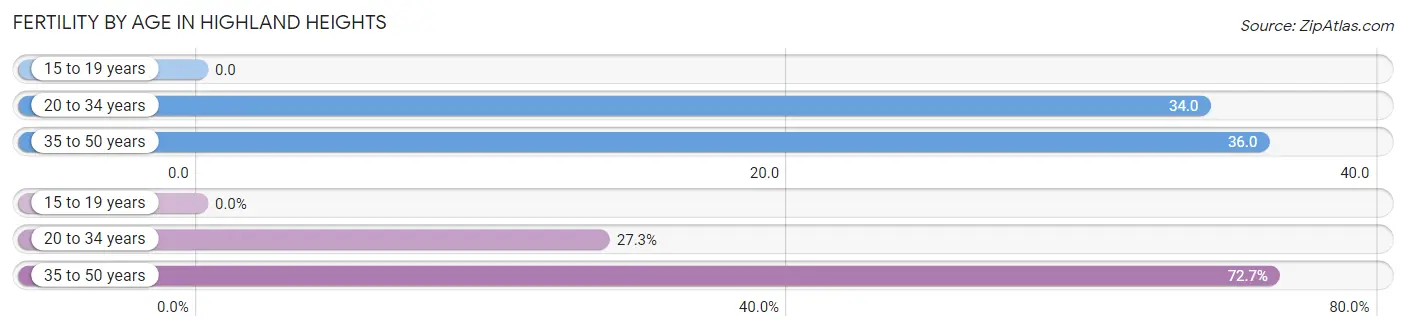
| Age Bracket | Women with Births | Births / 1,000 Women |
| 15 to 19 years | 0 (0.0%) | 0.0 |
| 20 to 34 years | 12 (27.3%) | 34.0 |
| 35 to 50 years | 32 (72.7%) | 36.0 |
| Total | 44 (100.0%) | 28.0 |
Fertility by Age by Marriage Status in Highland Heights

| Age Bracket | Married | Unmarried |
| 15 to 19 years | 0 (0.0%) | 0 (0.0%) |
| 20 to 34 years | 12 (100.0%) | 0 (0.0%) |
| 35 to 50 years | 32 (100.0%) | 0 (0.0%) |
| Total | 44 (100.0%) | 0 (0.0%) |
Fertility by Education in Highland Heights
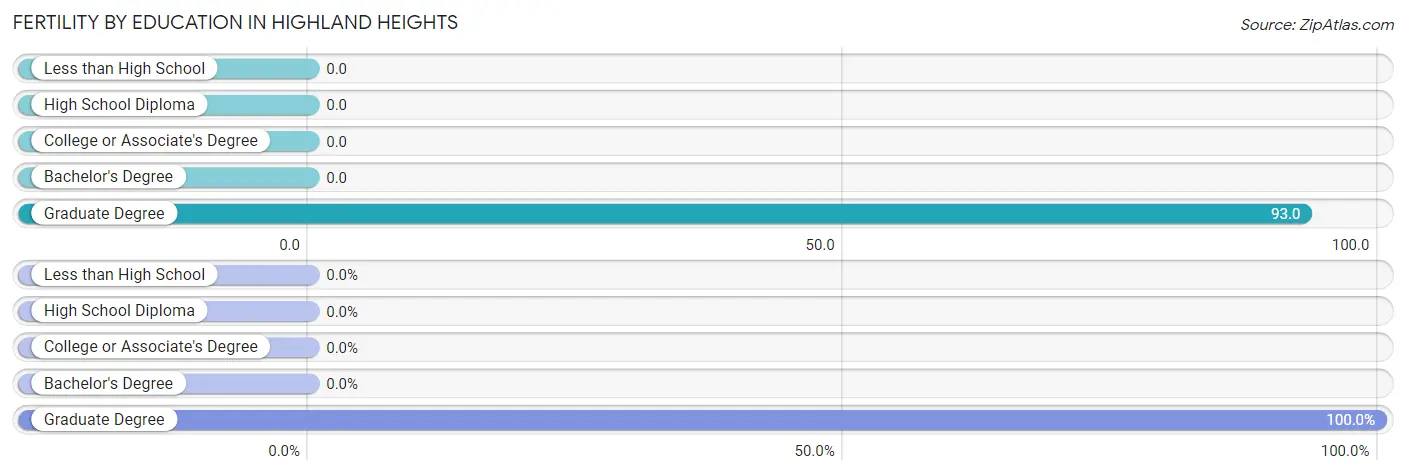
| Educational Attainment | Women with Births | Births / 1,000 Women |
| Less than High School | 0 (0.0%) | 0.0 |
| High School Diploma | 0 (0.0%) | 0.0 |
| College or Associate's Degree | 0 (0.0%) | 0.0 |
| Bachelor's Degree | 0 (0.0%) | 0.0 |
| Graduate Degree | 44 (100.0%) | 93.0 |
| Total | 44 (100.0%) | 28.0 |
Fertility by Education by Marriage Status in Highland Heights
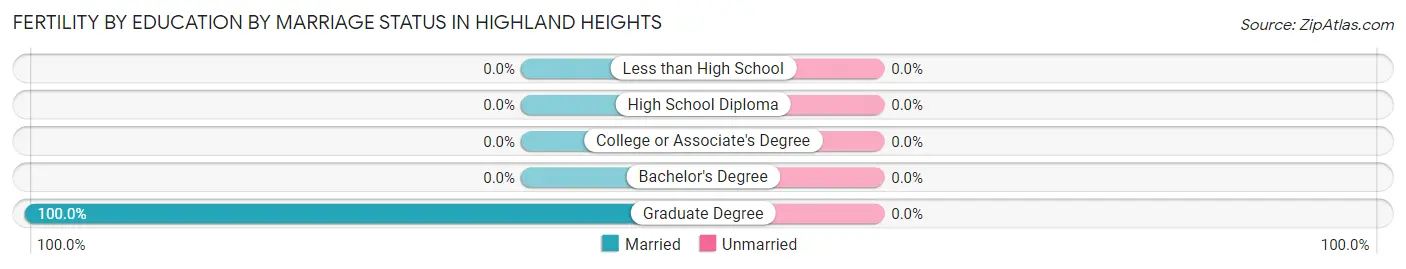
| Educational Attainment | Married | Unmarried |
| Less than High School | 0 (0.0%) | 0 (0.0%) |
| High School Diploma | 0 (0.0%) | 0 (0.0%) |
| College or Associate's Degree | 0 (0.0%) | 0 (0.0%) |
| Bachelor's Degree | 0 (0.0%) | 0 (0.0%) |
| Graduate Degree | 44 (100.0%) | 0 (0.0%) |
| Total | 44 (100.0%) | 0 (0.0%) |
Employment Characteristics in Highland Heights
Employment by Class of Employer in Highland Heights
Among the 4,034 employed individuals in Highland Heights, private company employees (2,483 | 61.6%), not-for-profit organizations (456 | 11.3%), and local government employees (361 | 8.9%) make up the most common classes of employment.
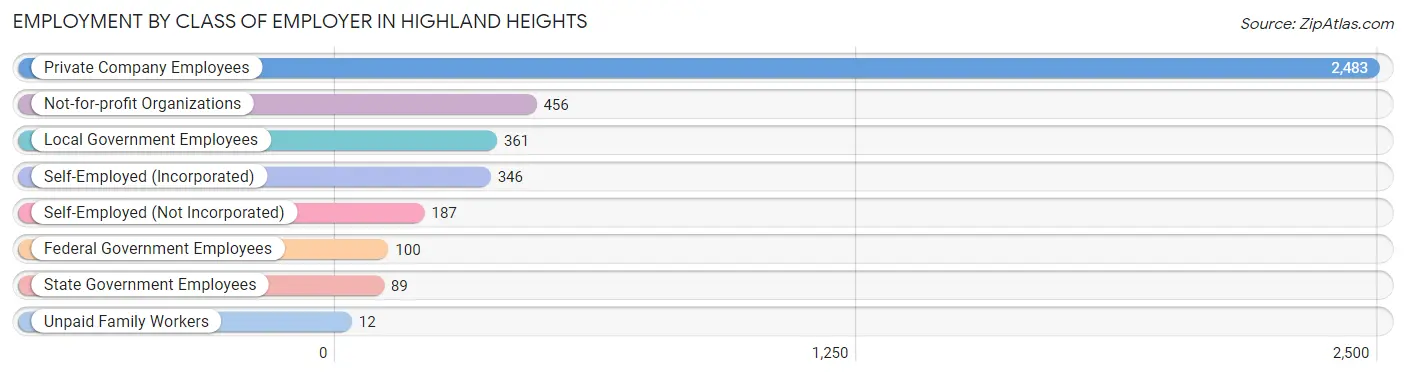
| Employer Class | # Employees | % Employees |
| Private Company Employees | 2,483 | 61.6% |
| Self-Employed (Incorporated) | 346 | 8.6% |
| Self-Employed (Not Incorporated) | 187 | 4.6% |
| Not-for-profit Organizations | 456 | 11.3% |
| Local Government Employees | 361 | 8.9% |
| State Government Employees | 89 | 2.2% |
| Federal Government Employees | 100 | 2.5% |
| Unpaid Family Workers | 12 | 0.3% |
| Total | 4,034 | 100.0% |
Employment Status by Age in Highland Heights
According to the labor force statistics for Highland Heights, out of the total population over 16 years of age (6,955), 61.0% or 4,243 individuals are in the labor force, with 4.6% or 195 of them unemployed. The age group with the highest labor force participation rate is 25 to 29 years, with 92.7% or 165 individuals in the labor force. Within the labor force, the 20 to 24 years age range has the highest percentage of unemployed individuals, with 43.0% or 64 of them being unemployed.
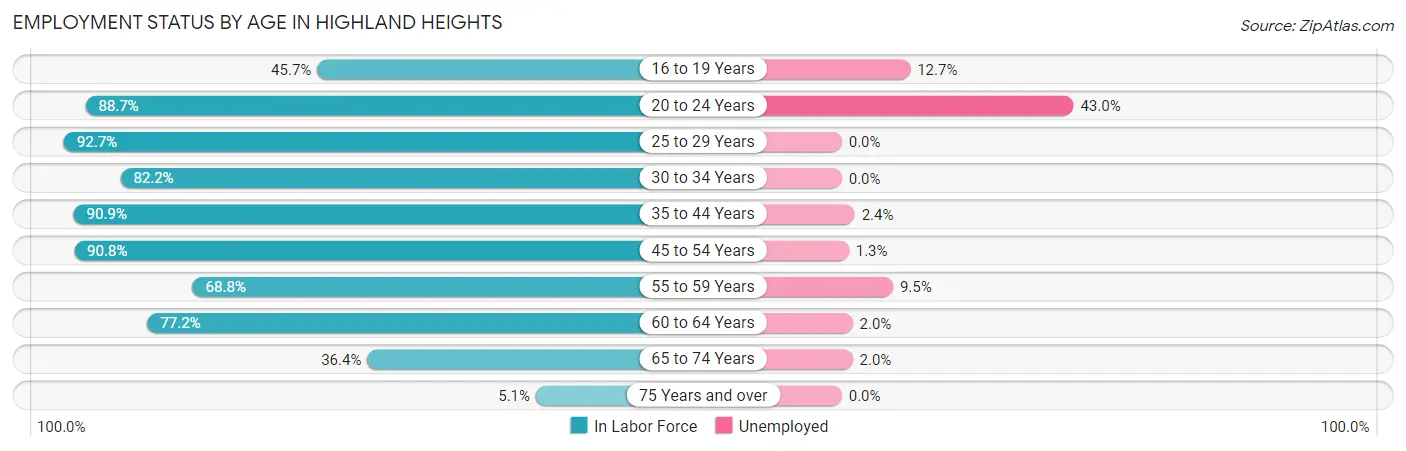
| Age Bracket | In Labor Force | Unemployed |
| 16 to 19 Years | 204 (45.7%) | 26 (12.7%) |
| 20 to 24 Years | 149 (88.7%) | 64 (43.0%) |
| 25 to 29 Years | 165 (92.7%) | 0 (0.0%) |
| 30 to 34 Years | 249 (82.2%) | 0 (0.0%) |
| 35 to 44 Years | 1,204 (90.9%) | 29 (2.4%) |
| 45 to 54 Years | 815 (90.8%) | 11 (1.3%) |
| 55 to 59 Years | 482 (68.8%) | 46 (9.5%) |
| 60 to 64 Years | 410 (77.2%) | 8 (2.0%) |
| 65 to 74 Years | 512 (36.4%) | 10 (2.0%) |
| 75 Years and over | 51 (5.1%) | 0 (0.0%) |
| Total | 4,243 (61.0%) | 195 (4.6%) |
Employment Status by Educational Attainment in Highland Heights
According to labor force statistics for Highland Heights, 84.5% of individuals (3,326) out of the total population between 25 and 64 years of age (3,936) are in the labor force, with 2.8% or 93 of them being unemployed. The group with the highest labor force participation rate are those with the educational attainment of bachelor's degree or higher, with 87.0% or 2,271 individuals in the labor force. Within the labor force, individuals with less than high school education have the highest percentage of unemployment, with 28.6% or 16 of them being unemployed.
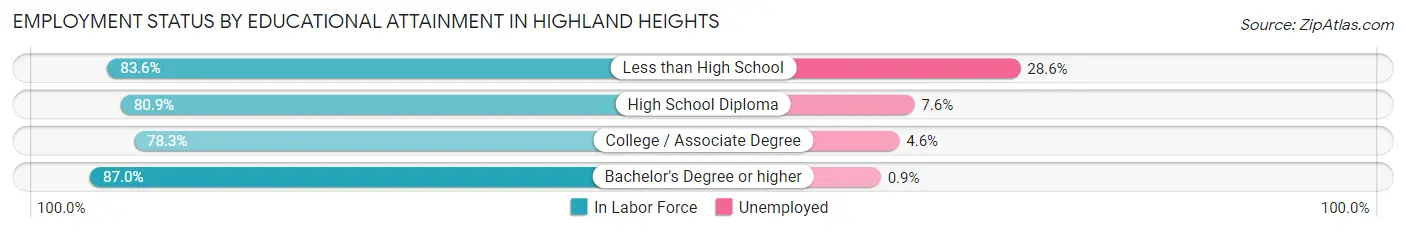
| Educational Attainment | In Labor Force | Unemployed |
| Less than High School | 56 (83.6%) | 19 (28.6%) |
| High School Diploma | 395 (80.9%) | 37 (7.6%) |
| College / Associate Degree | 604 (78.3%) | 35 (4.6%) |
| Bachelor's Degree or higher | 2,271 (87.0%) | 23 (0.9%) |
| Total | 3,326 (84.5%) | 110 (2.8%) |
Employment Occupations by Sex in Highland Heights
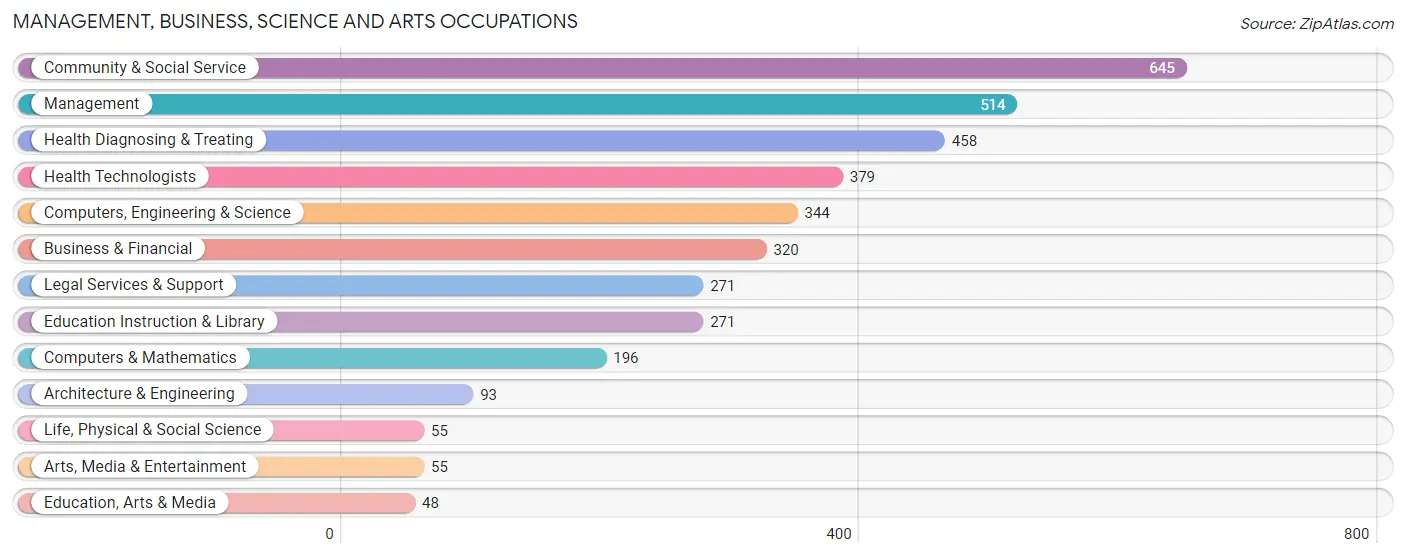
Management, Business, Science and Arts Occupations
The most common Management, Business, Science and Arts occupations in Highland Heights are Community & Social Service (645 | 15.9%), Management (514 | 12.7%), Health Diagnosing & Treating (458 | 11.3%), Health Technologists (379 | 9.4%), and Computers, Engineering & Science (344 | 8.5%).
Management, Business, Science and Arts Occupations by Sex
Within the Management, Business, Science and Arts occupations in Highland Heights, the most male-oriented occupations are Architecture & Engineering (91.4%), Computers, Engineering & Science (74.1%), and Computers & Mathematics (72.5%), while the most female-oriented occupations are Education Instruction & Library (79.3%), Education, Arts & Media (66.7%), and Health Diagnosing & Treating (63.8%).
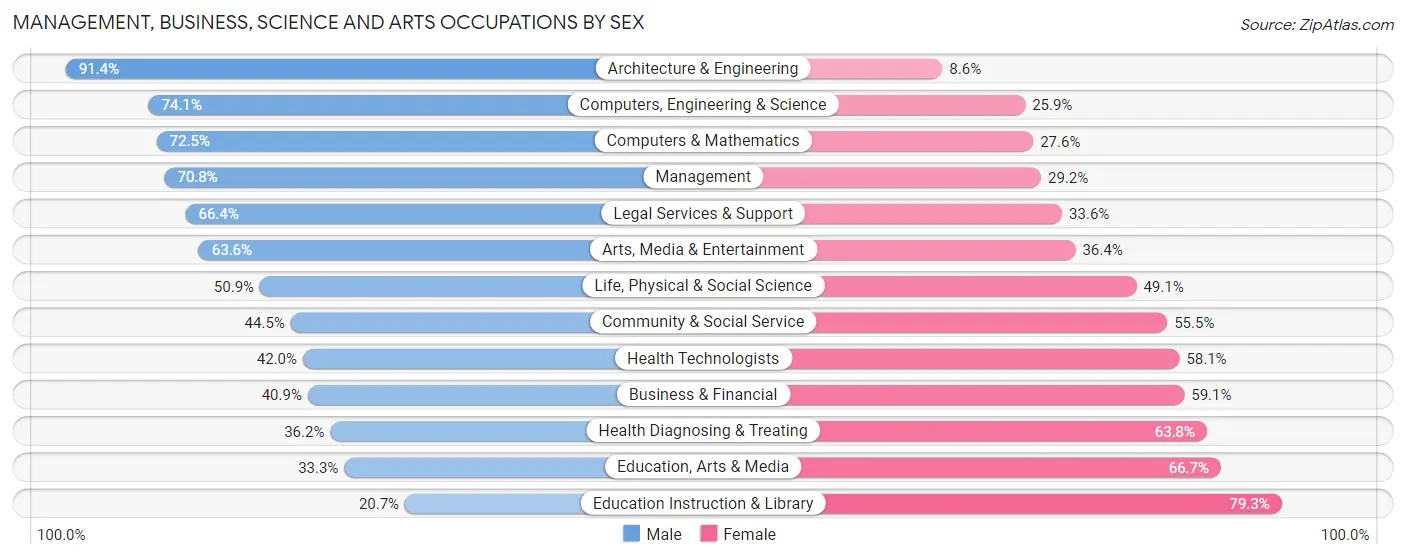
| Occupation | Male | Female |
| Management | 364 (70.8%) | 150 (29.2%) |
| Business & Financial | 131 (40.9%) | 189 (59.1%) |
| Computers, Engineering & Science | 255 (74.1%) | 89 (25.9%) |
| Computers & Mathematics | 142 (72.5%) | 54 (27.6%) |
| Architecture & Engineering | 85 (91.4%) | 8 (8.6%) |
| Life, Physical & Social Science | 28 (50.9%) | 27 (49.1%) |
| Community & Social Service | 287 (44.5%) | 358 (55.5%) |
| Education, Arts & Media | 16 (33.3%) | 32 (66.7%) |
| Legal Services & Support | 180 (66.4%) | 91 (33.6%) |
| Education Instruction & Library | 56 (20.7%) | 215 (79.3%) |
| Arts, Media & Entertainment | 35 (63.6%) | 20 (36.4%) |
| Health Diagnosing & Treating | 166 (36.2%) | 292 (63.8%) |
| Health Technologists | 159 (41.9%) | 220 (58.1%) |
| Total (Category) | 1,203 (52.7%) | 1,078 (47.3%) |
| Total (Overall) | 2,208 (54.6%) | 1,839 (45.4%) |
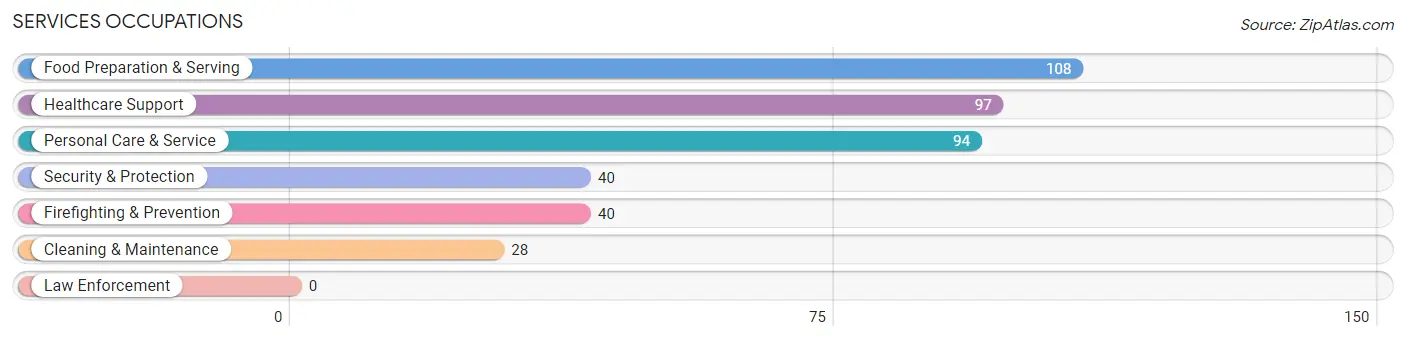
Services Occupations
The most common Services occupations in Highland Heights are Food Preparation & Serving (108 | 2.7%), Healthcare Support (97 | 2.4%), Personal Care & Service (94 | 2.3%), Security & Protection (40 | 1.0%), and Firefighting & Prevention (40 | 1.0%).
Services Occupations by Sex
Within the Services occupations in Highland Heights, the most male-oriented occupations are Food Preparation & Serving (81.5%), Cleaning & Maintenance (53.6%), and Healthcare Support (45.4%), while the most female-oriented occupations are Personal Care & Service (73.4%), Security & Protection (60.0%), and Firefighting & Prevention (60.0%).
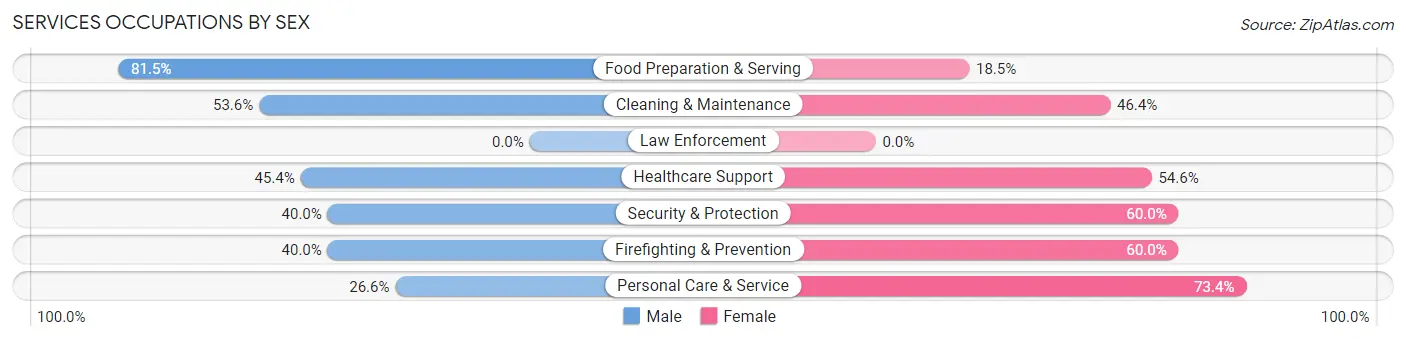
| Occupation | Male | Female |
| Healthcare Support | 44 (45.4%) | 53 (54.6%) |
| Security & Protection | 16 (40.0%) | 24 (60.0%) |
| Firefighting & Prevention | 16 (40.0%) | 24 (60.0%) |
| Law Enforcement | 0 (0.0%) | 0 (0.0%) |
| Food Preparation & Serving | 88 (81.5%) | 20 (18.5%) |
| Cleaning & Maintenance | 15 (53.6%) | 13 (46.4%) |
| Personal Care & Service | 25 (26.6%) | 69 (73.4%) |
| Total (Category) | 188 (51.2%) | 179 (48.8%) |
| Total (Overall) | 2,208 (54.6%) | 1,839 (45.4%) |
Sales and Office Occupations
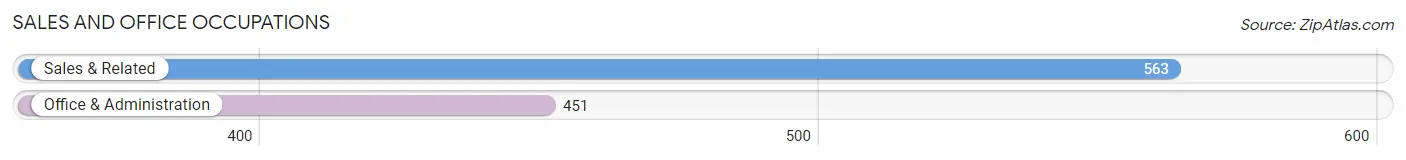
The most common Sales and Office occupations in Highland Heights are Sales & Related (563 | 13.9%), and Office & Administration (451 | 11.1%).
Sales and Office Occupations by Sex
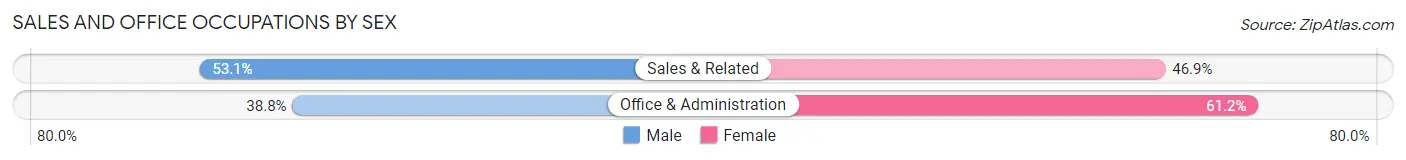
| Occupation | Male | Female |
| Sales & Related | 299 (53.1%) | 264 (46.9%) |
| Office & Administration | 175 (38.8%) | 276 (61.2%) |
| Total (Category) | 474 (46.8%) | 540 (53.2%) |
| Total (Overall) | 2,208 (54.6%) | 1,839 (45.4%) |
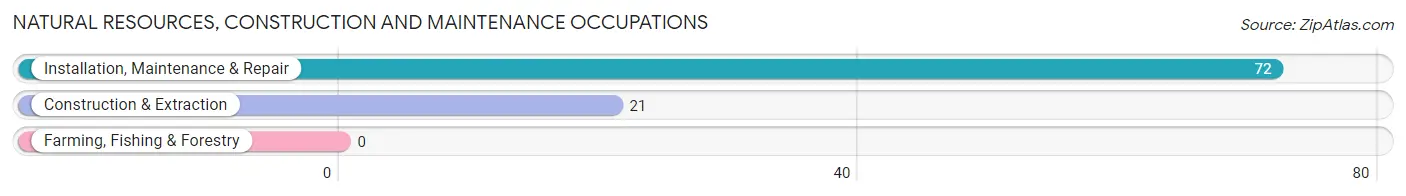
Natural Resources, Construction and Maintenance Occupations
The most common Natural Resources, Construction and Maintenance occupations in Highland Heights are Installation, Maintenance & Repair (72 | 1.8%), and Construction & Extraction (21 | 0.5%).
Natural Resources, Construction and Maintenance Occupations by Sex
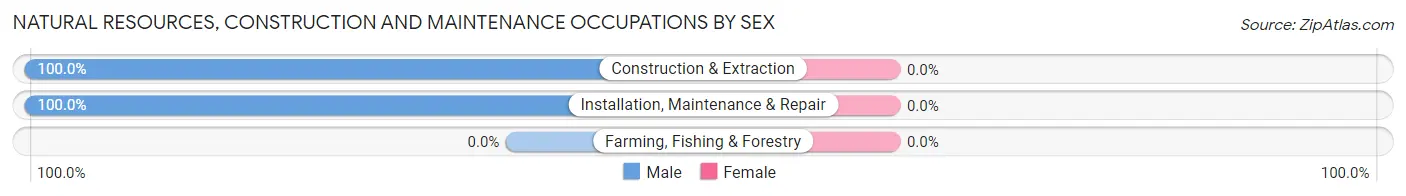
| Occupation | Male | Female |
| Farming, Fishing & Forestry | 0 (0.0%) | 0 (0.0%) |
| Construction & Extraction | 21 (100.0%) | 0 (0.0%) |
| Installation, Maintenance & Repair | 72 (100.0%) | 0 (0.0%) |
| Total (Category) | 93 (100.0%) | 0 (0.0%) |
| Total (Overall) | 2,208 (54.6%) | 1,839 (45.4%) |
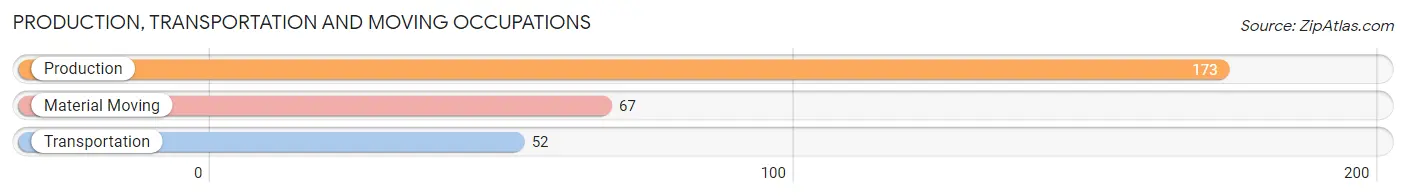
Production, Transportation and Moving Occupations
The most common Production, Transportation and Moving occupations in Highland Heights are Production (173 | 4.3%), Material Moving (67 | 1.7%), and Transportation (52 | 1.3%).
Production, Transportation and Moving Occupations by Sex
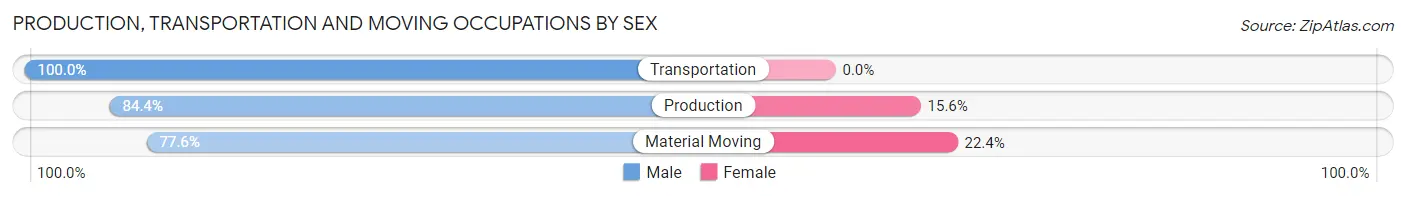
| Occupation | Male | Female |
| Production | 146 (84.4%) | 27 (15.6%) |
| Transportation | 52 (100.0%) | 0 (0.0%) |
| Material Moving | 52 (77.6%) | 15 (22.4%) |
| Total (Category) | 250 (85.6%) | 42 (14.4%) |
| Total (Overall) | 2,208 (54.6%) | 1,839 (45.4%) |
Employment Industries by Sex in Highland Heights
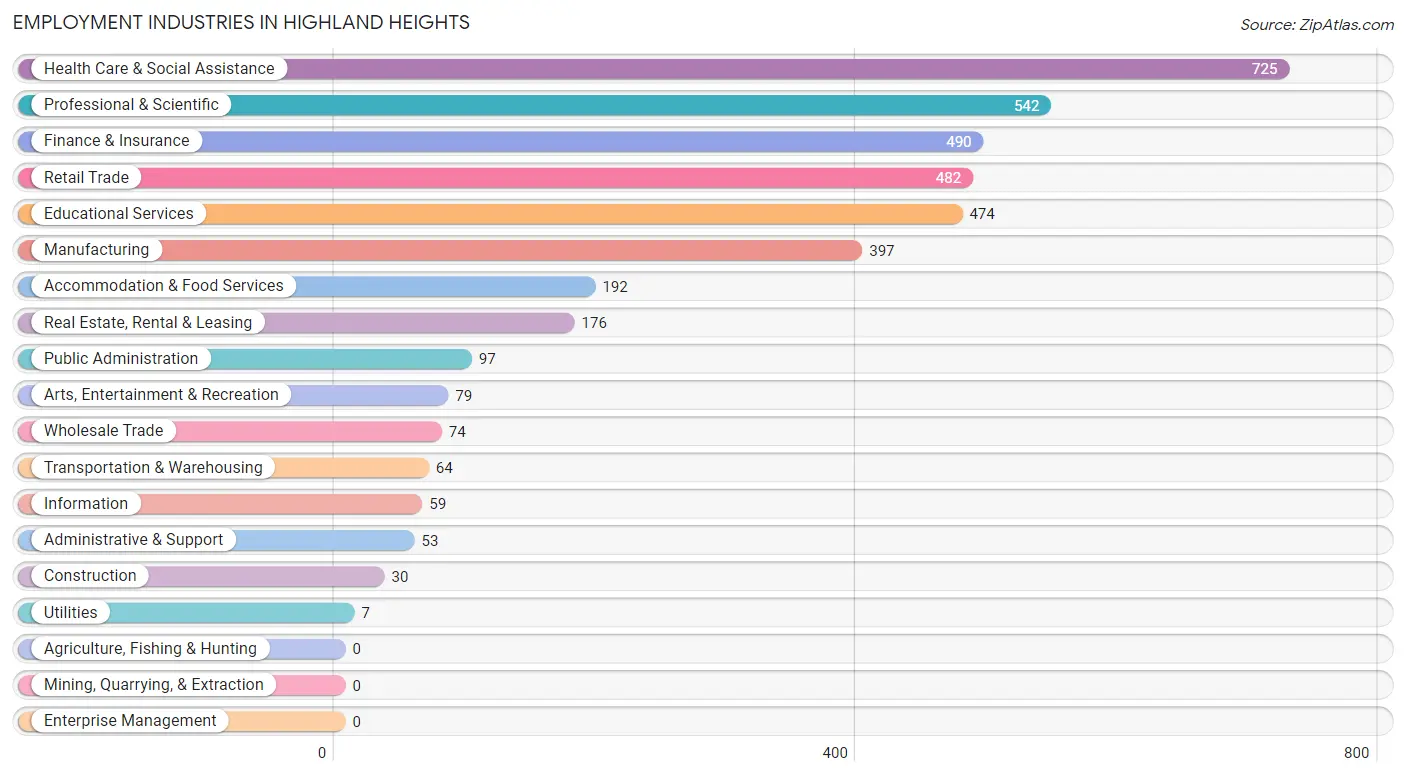
Employment Industries in Highland Heights
The major employment industries in Highland Heights include Health Care & Social Assistance (725 | 17.9%), Professional & Scientific (542 | 13.4%), Finance & Insurance (490 | 12.1%), Retail Trade (482 | 11.9%), and Educational Services (474 | 11.7%).
Employment Industries by Sex in Highland Heights
The Highland Heights industries that see more men than women are Construction (100.0%), Transportation & Warehousing (100.0%), and Utilities (100.0%), whereas the industries that tend to have a higher number of women are Educational Services (68.6%), Health Care & Social Assistance (67.6%), and Retail Trade (52.9%).
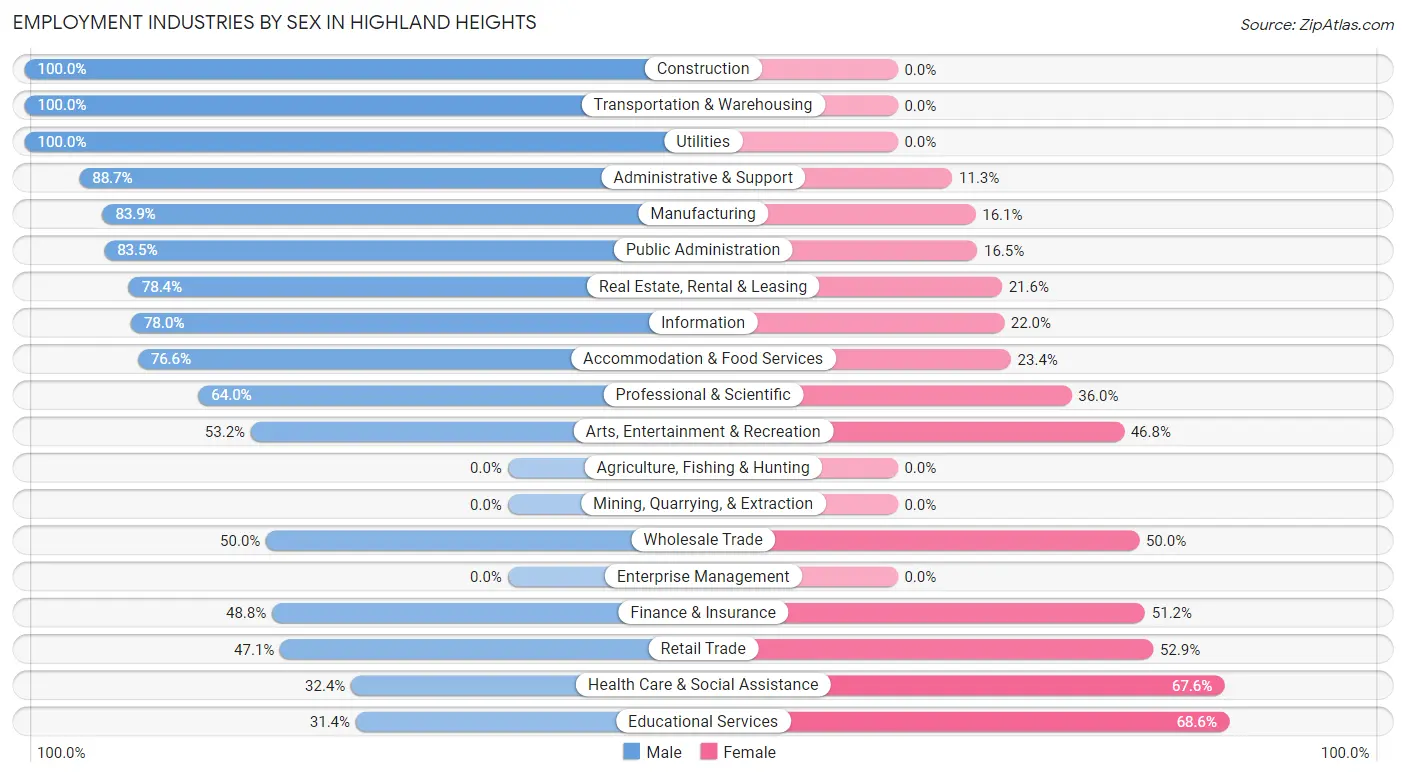
| Industry | Male | Female |
| Agriculture, Fishing & Hunting | 0 (0.0%) | 0 (0.0%) |
| Mining, Quarrying, & Extraction | 0 (0.0%) | 0 (0.0%) |
| Construction | 30 (100.0%) | 0 (0.0%) |
| Manufacturing | 333 (83.9%) | 64 (16.1%) |
| Wholesale Trade | 37 (50.0%) | 37 (50.0%) |
| Retail Trade | 227 (47.1%) | 255 (52.9%) |
| Transportation & Warehousing | 64 (100.0%) | 0 (0.0%) |
| Utilities | 7 (100.0%) | 0 (0.0%) |
| Information | 46 (78.0%) | 13 (22.0%) |
| Finance & Insurance | 239 (48.8%) | 251 (51.2%) |
| Real Estate, Rental & Leasing | 138 (78.4%) | 38 (21.6%) |
| Professional & Scientific | 347 (64.0%) | 195 (36.0%) |
| Enterprise Management | 0 (0.0%) | 0 (0.0%) |
| Administrative & Support | 47 (88.7%) | 6 (11.3%) |
| Educational Services | 149 (31.4%) | 325 (68.6%) |
| Health Care & Social Assistance | 235 (32.4%) | 490 (67.6%) |
| Arts, Entertainment & Recreation | 42 (53.2%) | 37 (46.8%) |
| Accommodation & Food Services | 147 (76.6%) | 45 (23.4%) |
| Public Administration | 81 (83.5%) | 16 (16.5%) |
| Total | 2,208 (54.6%) | 1,839 (45.4%) |
Education in Highland Heights
School Enrollment in Highland Heights
The most common levels of schooling among the 2,254 students in Highland Heights are high school (631 | 28.0%), elementary school (566 | 25.1%), and middle school (438 | 19.4%).
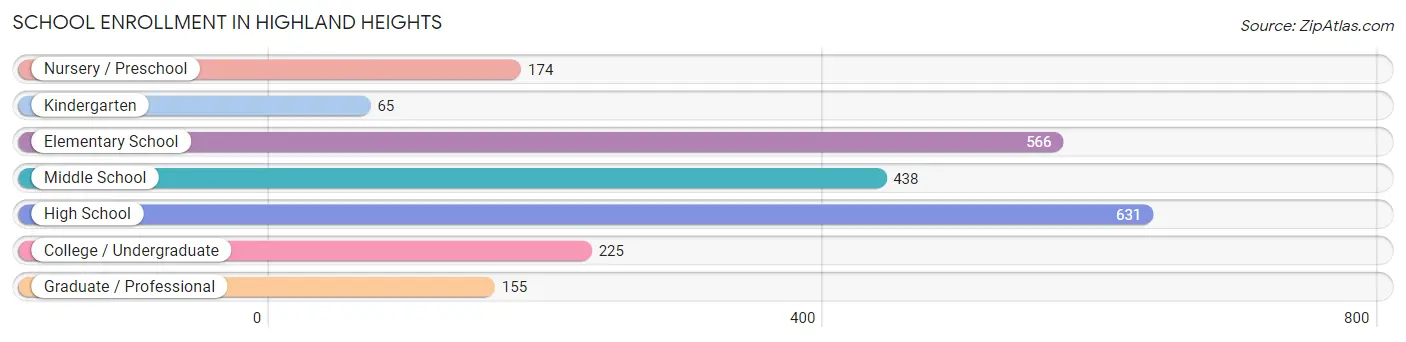
| School Level | # Students | % Students |
| Nursery / Preschool | 174 | 7.7% |
| Kindergarten | 65 | 2.9% |
| Elementary School | 566 | 25.1% |
| Middle School | 438 | 19.4% |
| High School | 631 | 28.0% |
| College / Undergraduate | 225 | 10.0% |
| Graduate / Professional | 155 | 6.9% |
| Total | 2,254 | 100.0% |
School Enrollment by Age by Funding Source in Highland Heights
Out of a total of 2,254 students who are enrolled in schools in Highland Heights, 685 (30.4%) attend a private institution, while the remaining 1,569 (69.6%) are enrolled in public schools. The age group of 3 to 4 year olds has the highest likelihood of being enrolled in private schools, with 131 (79.9% in the age bracket) enrolled. Conversely, the age group of 18 to 19 year olds has the lowest likelihood of being enrolled in a private school, with 159 (100.0% in the age bracket) attending a public institution.
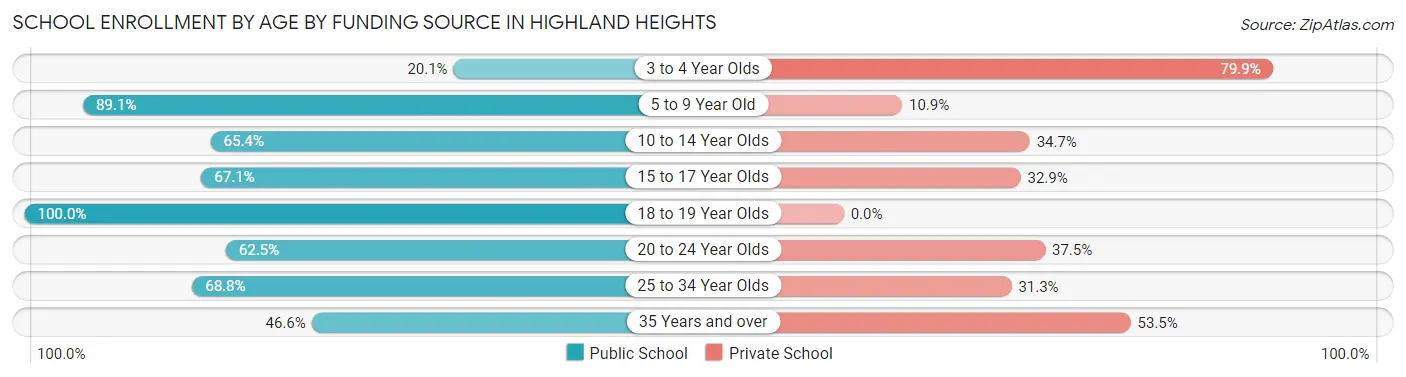
| Age Bracket | Public School | Private School |
| 3 to 4 Year Olds | 33 (20.1%) | 131 (79.9%) |
| 5 to 9 Year Old | 557 (89.1%) | 68 (10.9%) |
| 10 to 14 Year Olds | 315 (65.3%) | 167 (34.6%) |
| 15 to 17 Year Olds | 338 (67.1%) | 166 (32.9%) |
| 18 to 19 Year Olds | 159 (100.0%) | 0 (0.0%) |
| 20 to 24 Year Olds | 25 (62.5%) | 15 (37.5%) |
| 25 to 34 Year Olds | 33 (68.8%) | 15 (31.2%) |
| 35 Years and over | 108 (46.6%) | 124 (53.4%) |
| Total | 1,569 (69.6%) | 685 (30.4%) |
Educational Attainment by Field of Study in Highland Heights
Business (844 | 21.2%), education (586 | 14.7%), science & technology (383 | 9.6%), social sciences (325 | 8.2%), and engineering (287 | 7.2%) are the most common fields of study among 3,982 individuals in Highland Heights who have obtained a bachelor's degree or higher.
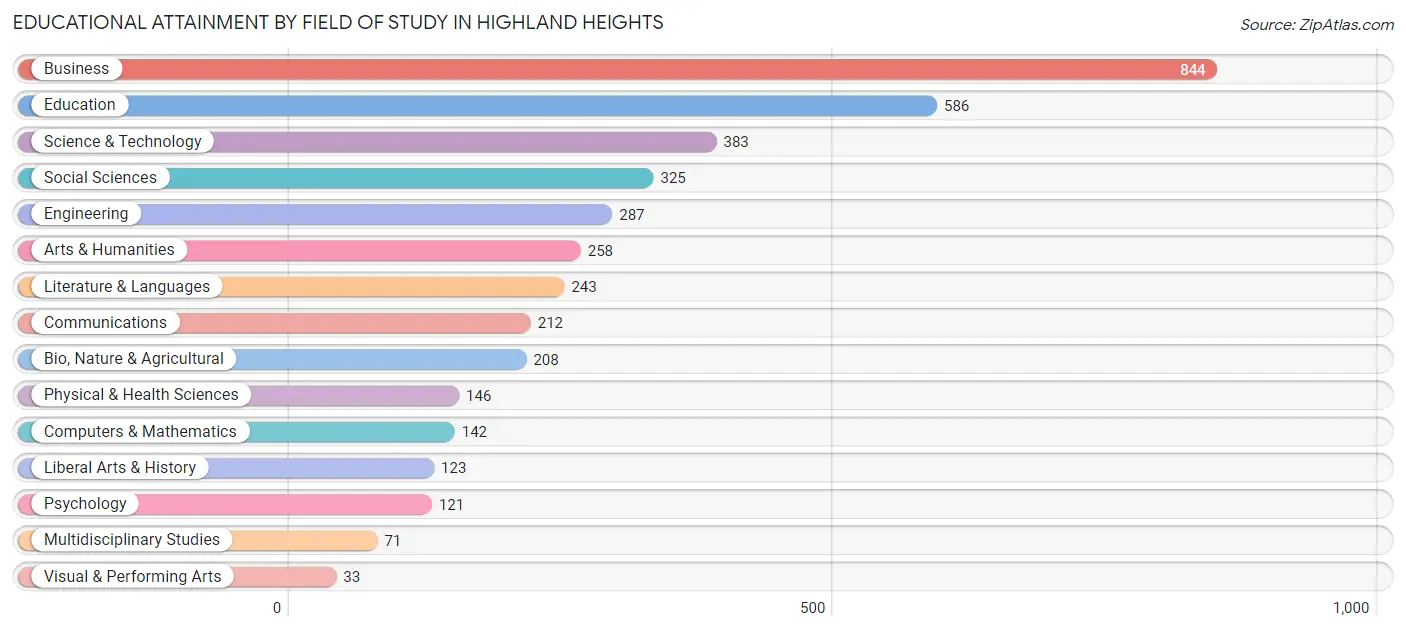
| Field of Study | # Graduates | % Graduates |
| Computers & Mathematics | 142 | 3.6% |
| Bio, Nature & Agricultural | 208 | 5.2% |
| Physical & Health Sciences | 146 | 3.7% |
| Psychology | 121 | 3.0% |
| Social Sciences | 325 | 8.2% |
| Engineering | 287 | 7.2% |
| Multidisciplinary Studies | 71 | 1.8% |
| Science & Technology | 383 | 9.6% |
| Business | 844 | 21.2% |
| Education | 586 | 14.7% |
| Literature & Languages | 243 | 6.1% |
| Liberal Arts & History | 123 | 3.1% |
| Visual & Performing Arts | 33 | 0.8% |
| Communications | 212 | 5.3% |
| Arts & Humanities | 258 | 6.5% |
| Total | 3,982 | 100.0% |
Transportation & Commute in Highland Heights
Vehicle Availability by Sex in Highland Heights
The most prevalent vehicle ownership categories in Highland Heights are males with 2 vehicles (1,380, accounting for 63.0%) and females with 2 vehicles (1,079, making up 75.6%).
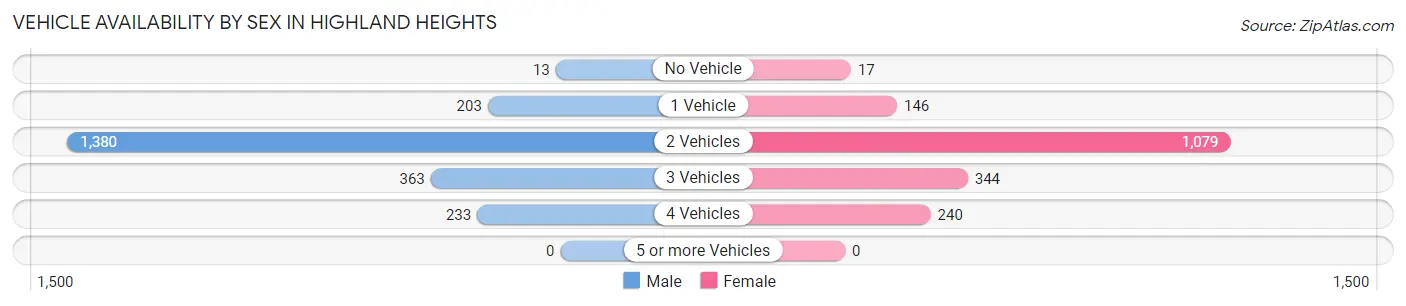
| Vehicles Available | Male | Female |
| No Vehicle | 13 (0.6%) | 17 (0.9%) |
| 1 Vehicle | 203 (9.3%) | 146 (8.0%) |
| 2 Vehicles | 1,380 (63.0%) | 1,079 (59.1%) |
| 3 Vehicles | 363 (16.6%) | 344 (18.8%) |
| 4 Vehicles | 233 (10.6%) | 240 (13.1%) |
| 5 or more Vehicles | 0 (0.0%) | 0 (0.0%) |
| Total | 2,192 (100.0%) | 1,826 (100.0%) |
Commute Time in Highland Heights
The most frequently occuring commute durations in Highland Heights are 30 to 34 minutes (579 commuters, 17.0%), 25 to 29 minutes (497 commuters, 14.6%), and 15 to 19 minutes (466 commuters, 13.7%).
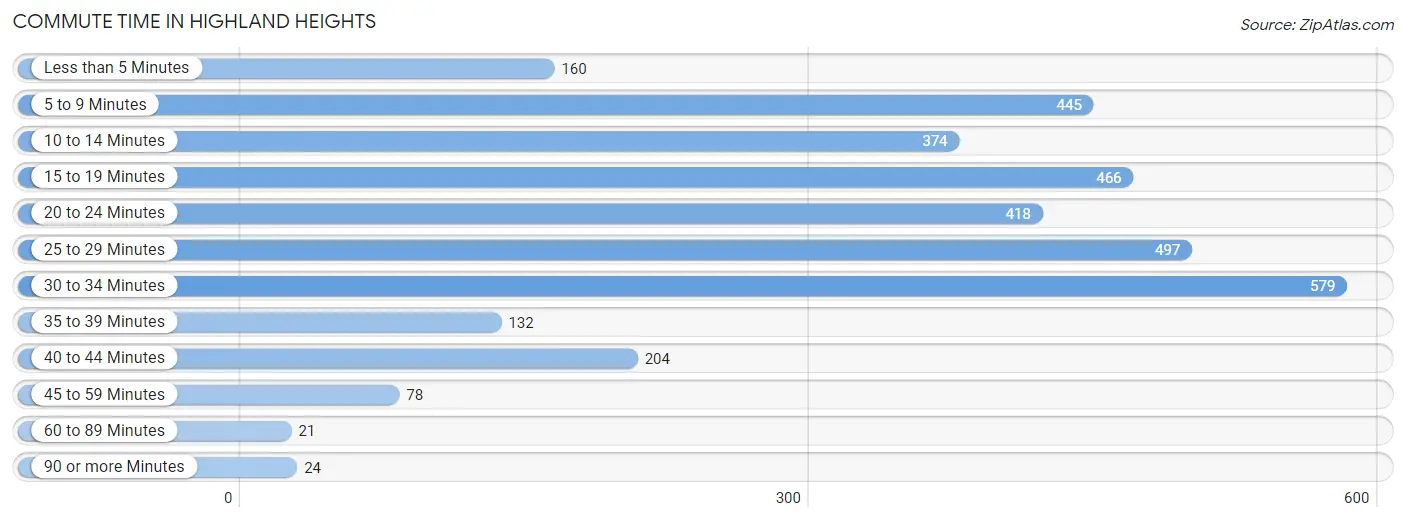
| Commute Time | # Commuters | % Commuters |
| Less than 5 Minutes | 160 | 4.7% |
| 5 to 9 Minutes | 445 | 13.1% |
| 10 to 14 Minutes | 374 | 11.0% |
| 15 to 19 Minutes | 466 | 13.7% |
| 20 to 24 Minutes | 418 | 12.3% |
| 25 to 29 Minutes | 497 | 14.6% |
| 30 to 34 Minutes | 579 | 17.0% |
| 35 to 39 Minutes | 132 | 3.9% |
| 40 to 44 Minutes | 204 | 6.0% |
| 45 to 59 Minutes | 78 | 2.3% |
| 60 to 89 Minutes | 21 | 0.6% |
| 90 or more Minutes | 24 | 0.7% |
Commute Time by Sex in Highland Heights
The most common commute times in Highland Heights are 5 to 9 minutes (308 commuters, 16.7%) for males and 15 to 19 minutes (296 commuters, 19.1%) for females.
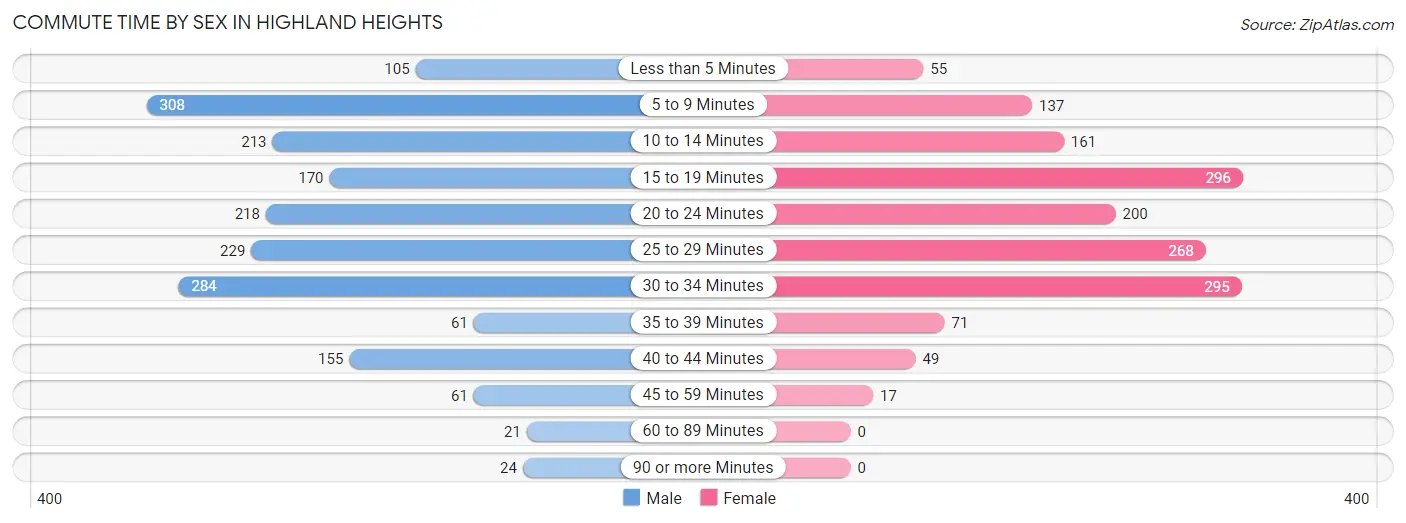
| Commute Time | Male | Female |
| Less than 5 Minutes | 105 (5.7%) | 55 (3.5%) |
| 5 to 9 Minutes | 308 (16.7%) | 137 (8.8%) |
| 10 to 14 Minutes | 213 (11.5%) | 161 (10.4%) |
| 15 to 19 Minutes | 170 (9.2%) | 296 (19.1%) |
| 20 to 24 Minutes | 218 (11.8%) | 200 (12.9%) |
| 25 to 29 Minutes | 229 (12.4%) | 268 (17.3%) |
| 30 to 34 Minutes | 284 (15.4%) | 295 (19.0%) |
| 35 to 39 Minutes | 61 (3.3%) | 71 (4.6%) |
| 40 to 44 Minutes | 155 (8.4%) | 49 (3.2%) |
| 45 to 59 Minutes | 61 (3.3%) | 17 (1.1%) |
| 60 to 89 Minutes | 21 (1.1%) | 0 (0.0%) |
| 90 or more Minutes | 24 (1.3%) | 0 (0.0%) |
Time of Departure to Work by Sex in Highland Heights
The most frequent times of departure to work in Highland Heights are 8:00 AM to 8:29 AM (348, 18.8%) for males and 8:00 AM to 8:29 AM (355, 22.9%) for females.
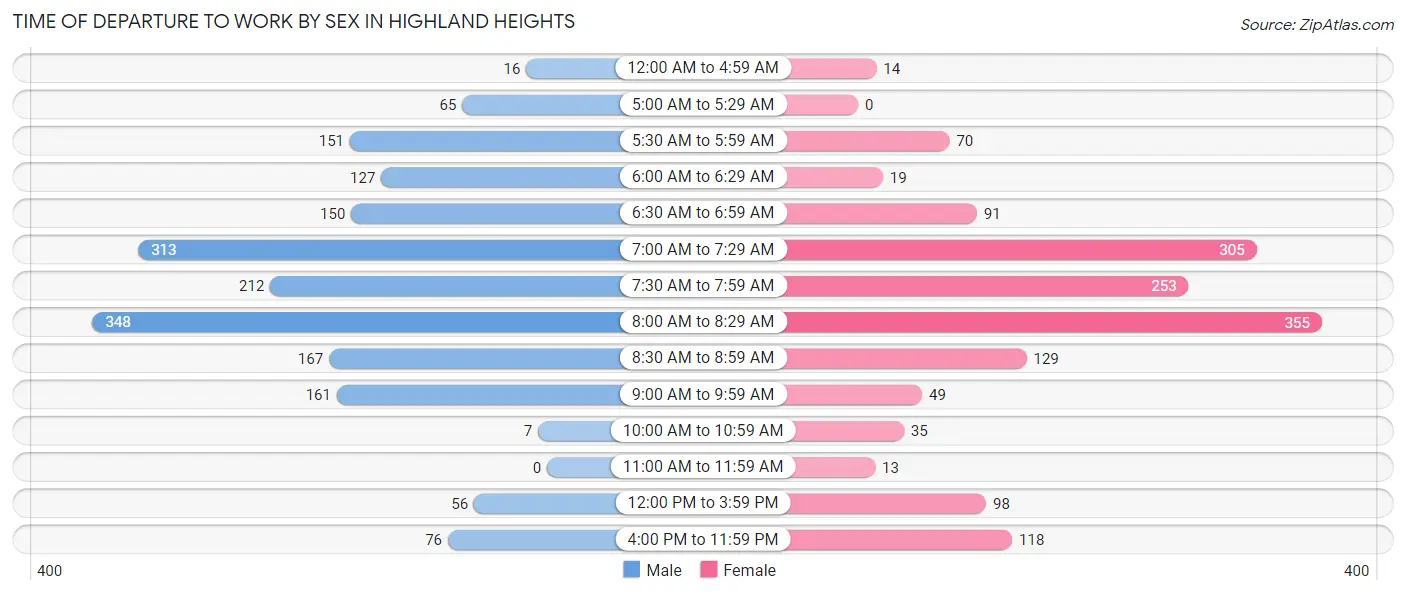
| Time of Departure | Male | Female |
| 12:00 AM to 4:59 AM | 16 (0.9%) | 14 (0.9%) |
| 5:00 AM to 5:29 AM | 65 (3.5%) | 0 (0.0%) |
| 5:30 AM to 5:59 AM | 151 (8.2%) | 70 (4.5%) |
| 6:00 AM to 6:29 AM | 127 (6.9%) | 19 (1.2%) |
| 6:30 AM to 6:59 AM | 150 (8.1%) | 91 (5.9%) |
| 7:00 AM to 7:29 AM | 313 (16.9%) | 305 (19.7%) |
| 7:30 AM to 7:59 AM | 212 (11.5%) | 253 (16.3%) |
| 8:00 AM to 8:29 AM | 348 (18.8%) | 355 (22.9%) |
| 8:30 AM to 8:59 AM | 167 (9.0%) | 129 (8.3%) |
| 9:00 AM to 9:59 AM | 161 (8.7%) | 49 (3.2%) |
| 10:00 AM to 10:59 AM | 7 (0.4%) | 35 (2.3%) |
| 11:00 AM to 11:59 AM | 0 (0.0%) | 13 (0.8%) |
| 12:00 PM to 3:59 PM | 56 (3.0%) | 98 (6.3%) |
| 4:00 PM to 11:59 PM | 76 (4.1%) | 118 (7.6%) |
| Total | 1,849 (100.0%) | 1,549 (100.0%) |
Housing Occupancy in Highland Heights
Occupancy by Ownership in Highland Heights
Of the total 3,504 dwellings in Highland Heights, owner-occupied units account for 3,319 (94.7%), while renter-occupied units make up 185 (5.3%).
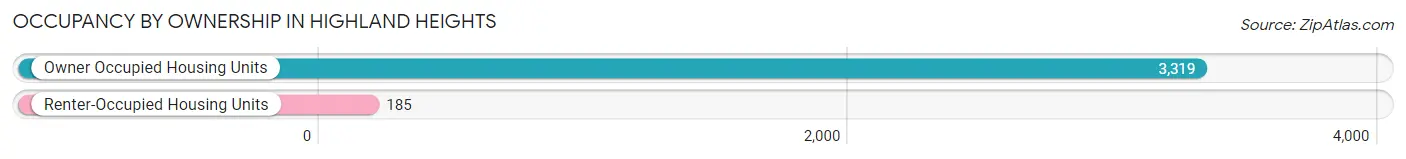
| Occupancy | # Housing Units | % Housing Units |
| Owner Occupied Housing Units | 3,319 | 94.7% |
| Renter-Occupied Housing Units | 185 | 5.3% |
| Total Occupied Housing Units | 3,504 | 100.0% |
Occupancy by Household Size in Highland Heights
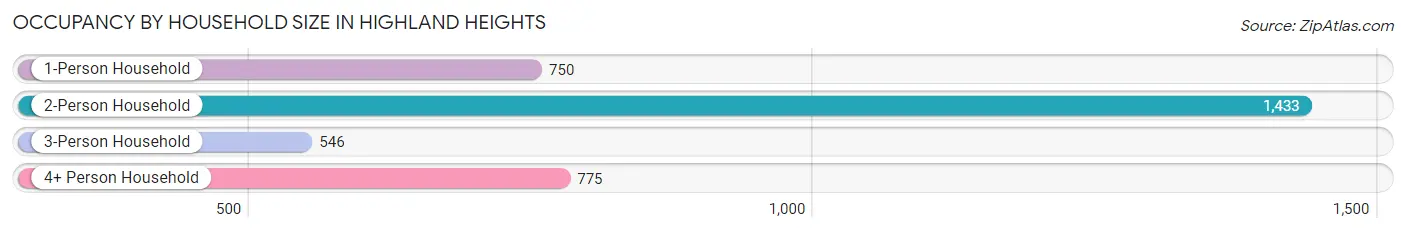
| Household Size | # Housing Units | % Housing Units |
| 1-Person Household | 750 | 21.4% |
| 2-Person Household | 1,433 | 40.9% |
| 3-Person Household | 546 | 15.6% |
| 4+ Person Household | 775 | 22.1% |
| Total Housing Units | 3,504 | 100.0% |
Occupancy by Ownership by Household Size in Highland Heights
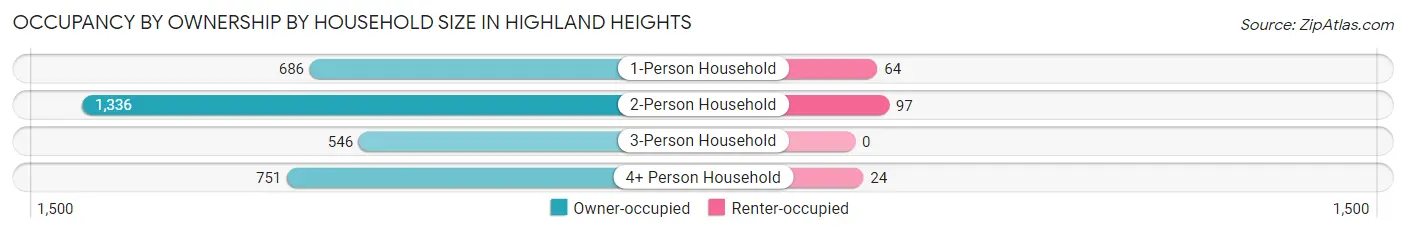
| Household Size | Owner-occupied | Renter-occupied |
| 1-Person Household | 686 (91.5%) | 64 (8.5%) |
| 2-Person Household | 1,336 (93.2%) | 97 (6.8%) |
| 3-Person Household | 546 (100.0%) | 0 (0.0%) |
| 4+ Person Household | 751 (96.9%) | 24 (3.1%) |
| Total Housing Units | 3,319 (94.7%) | 185 (5.3%) |
Occupancy by Educational Attainment in Highland Heights
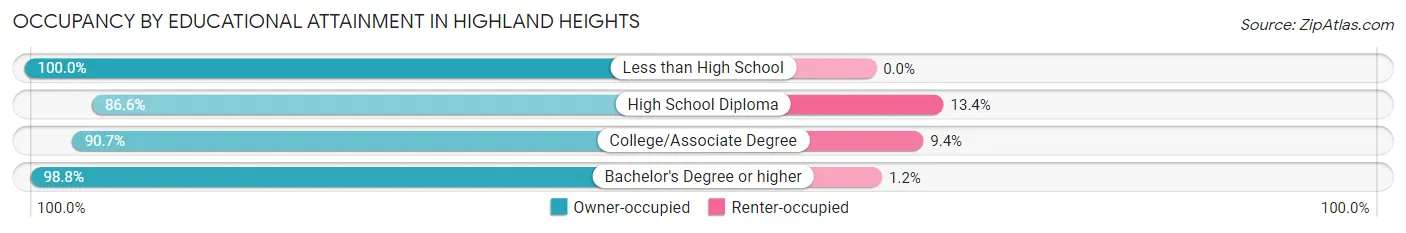
| Household Size | Owner-occupied | Renter-occupied |
| Less than High School | 30 (100.0%) | 0 (0.0%) |
| High School Diploma | 596 (86.6%) | 92 (13.4%) |
| College/Associate Degree | 669 (90.6%) | 69 (9.3%) |
| Bachelor's Degree or higher | 2,024 (98.8%) | 24 (1.2%) |
Occupancy by Age of Householder in Highland Heights
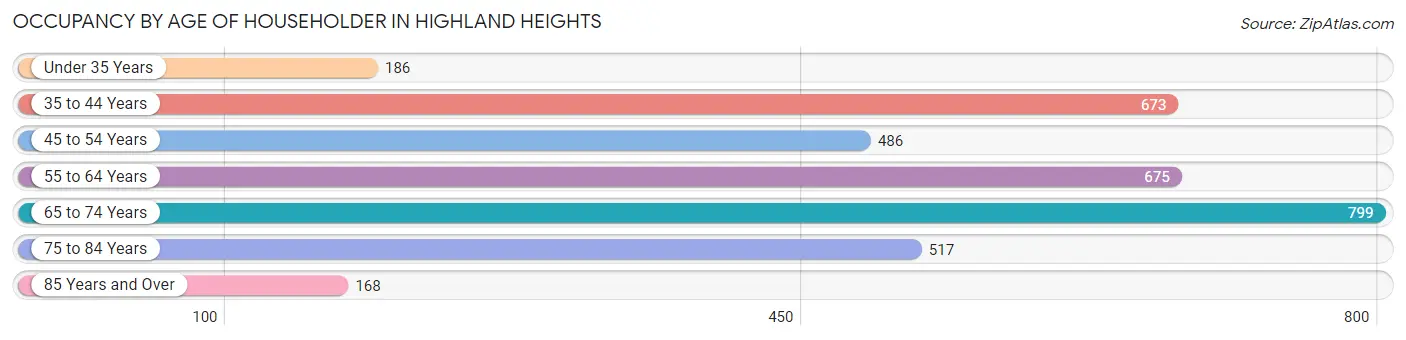
| Age Bracket | # Households | % Households |
| Under 35 Years | 186 | 5.3% |
| 35 to 44 Years | 673 | 19.2% |
| 45 to 54 Years | 486 | 13.9% |
| 55 to 64 Years | 675 | 19.3% |
| 65 to 74 Years | 799 | 22.8% |
| 75 to 84 Years | 517 | 14.7% |
| 85 Years and Over | 168 | 4.8% |
| Total | 3,504 | 100.0% |
Housing Finances in Highland Heights
Median Income by Occupancy in Highland Heights
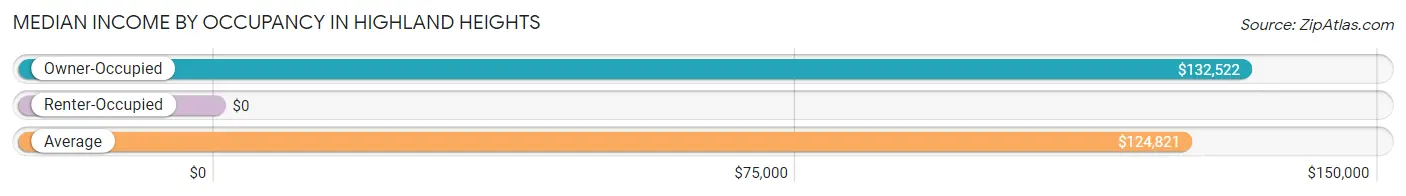
| Occupancy Type | # Households | Median Income |
| Owner-Occupied | 3,319 (94.7%) | $132,522 |
| Renter-Occupied | 185 (5.3%) | $0 |
| Average | 3,504 (100.0%) | $124,821 |
Occupancy by Householder Income Bracket in Highland Heights
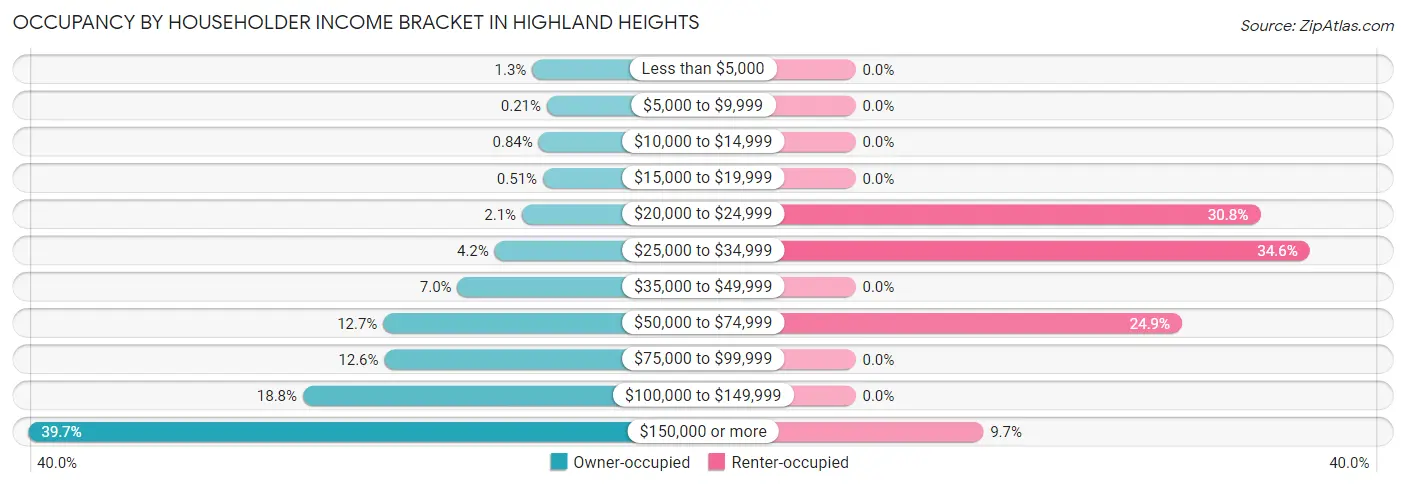
| Income Bracket | Owner-occupied | Renter-occupied |
| Less than $5,000 | 44 (1.3%) | 0 (0.0%) |
| $5,000 to $9,999 | 7 (0.2%) | 0 (0.0%) |
| $10,000 to $14,999 | 28 (0.8%) | 0 (0.0%) |
| $15,000 to $19,999 | 17 (0.5%) | 0 (0.0%) |
| $20,000 to $24,999 | 70 (2.1%) | 57 (30.8%) |
| $25,000 to $34,999 | 139 (4.2%) | 64 (34.6%) |
| $35,000 to $49,999 | 233 (7.0%) | 0 (0.0%) |
| $50,000 to $74,999 | 421 (12.7%) | 46 (24.9%) |
| $75,000 to $99,999 | 418 (12.6%) | 0 (0.0%) |
| $100,000 to $149,999 | 624 (18.8%) | 0 (0.0%) |
| $150,000 or more | 1,318 (39.7%) | 18 (9.7%) |
| Total | 3,319 (100.0%) | 185 (100.0%) |
Monthly Housing Cost Tiers in Highland Heights
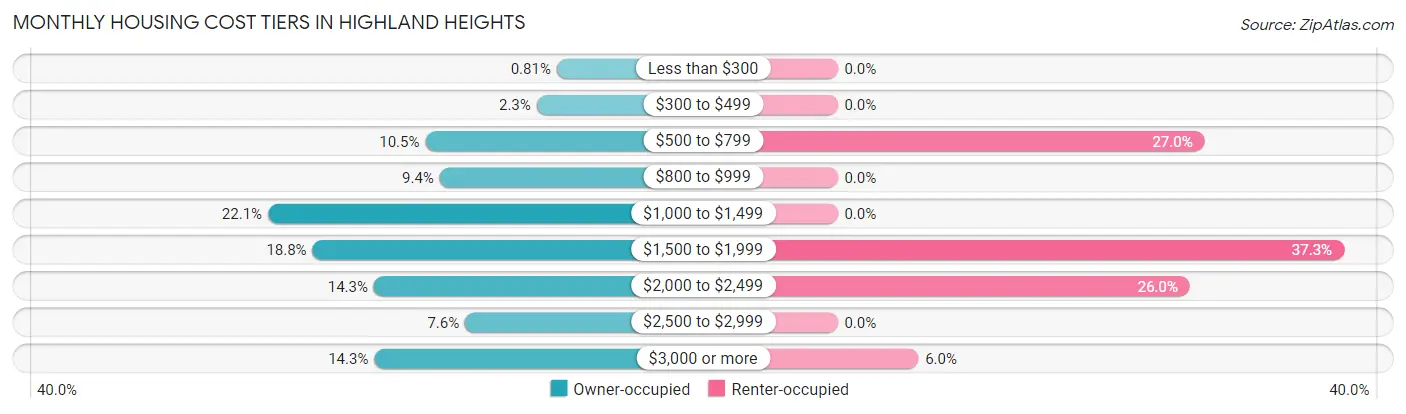
| Monthly Cost | Owner-occupied | Renter-occupied |
| Less than $300 | 27 (0.8%) | 0 (0.0%) |
| $300 to $499 | 76 (2.3%) | 0 (0.0%) |
| $500 to $799 | 348 (10.5%) | 50 (27.0%) |
| $800 to $999 | 313 (9.4%) | 0 (0.0%) |
| $1,000 to $1,499 | 733 (22.1%) | 0 (0.0%) |
| $1,500 to $1,999 | 624 (18.8%) | 69 (37.3%) |
| $2,000 to $2,499 | 474 (14.3%) | 48 (26.0%) |
| $2,500 to $2,999 | 251 (7.6%) | 0 (0.0%) |
| $3,000 or more | 473 (14.2%) | 11 (5.9%) |
| Total | 3,319 (100.0%) | 185 (100.0%) |
Physical Housing Characteristics in Highland Heights
Housing Structures in Highland Heights
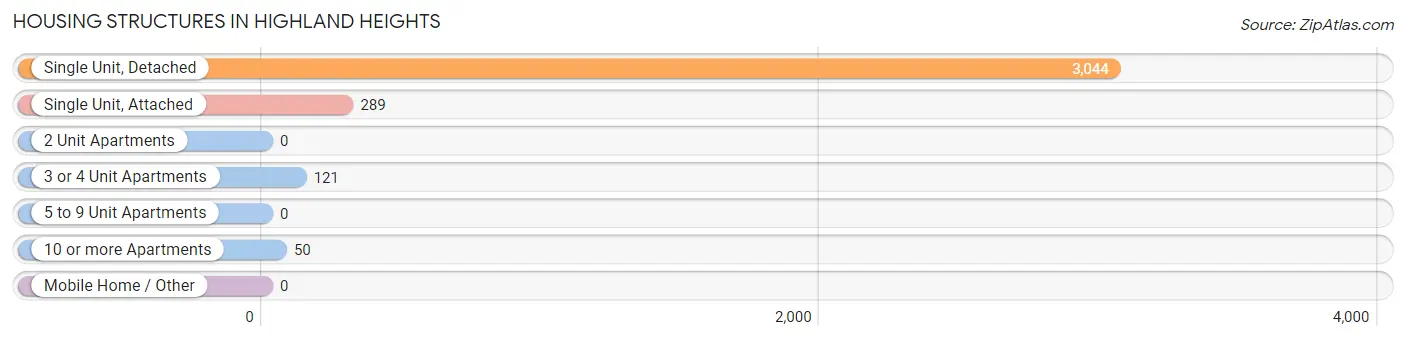
| Structure Type | # Housing Units | % Housing Units |
| Single Unit, Detached | 3,044 | 86.9% |
| Single Unit, Attached | 289 | 8.3% |
| 2 Unit Apartments | 0 | 0.0% |
| 3 or 4 Unit Apartments | 121 | 3.5% |
| 5 to 9 Unit Apartments | 0 | 0.0% |
| 10 or more Apartments | 50 | 1.4% |
| Mobile Home / Other | 0 | 0.0% |
| Total | 3,504 | 100.0% |
Housing Structures by Occupancy in Highland Heights
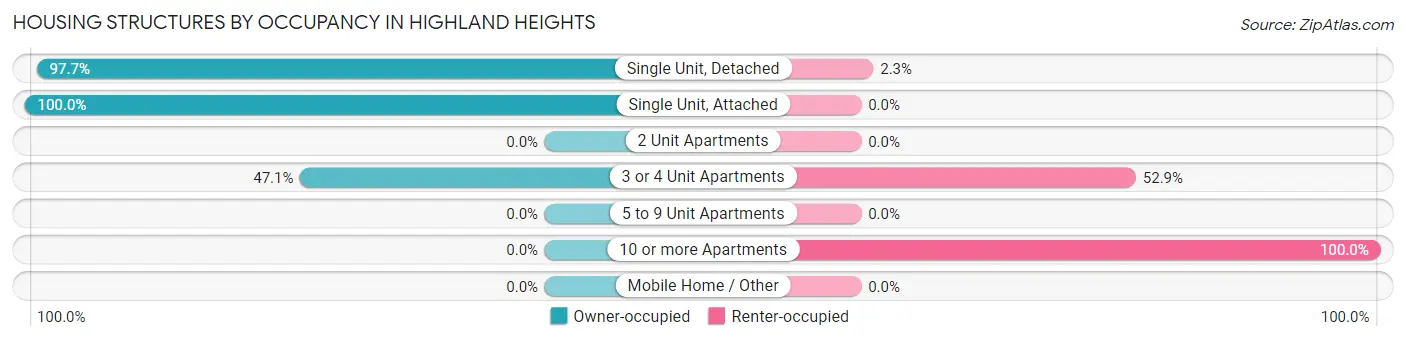
| Structure Type | Owner-occupied | Renter-occupied |
| Single Unit, Detached | 2,973 (97.7%) | 71 (2.3%) |
| Single Unit, Attached | 289 (100.0%) | 0 (0.0%) |
| 2 Unit Apartments | 0 (0.0%) | 0 (0.0%) |
| 3 or 4 Unit Apartments | 57 (47.1%) | 64 (52.9%) |
| 5 to 9 Unit Apartments | 0 (0.0%) | 0 (0.0%) |
| 10 or more Apartments | 0 (0.0%) | 50 (100.0%) |
| Mobile Home / Other | 0 (0.0%) | 0 (0.0%) |
| Total | 3,319 (94.7%) | 185 (5.3%) |
Housing Structures by Number of Rooms in Highland Heights
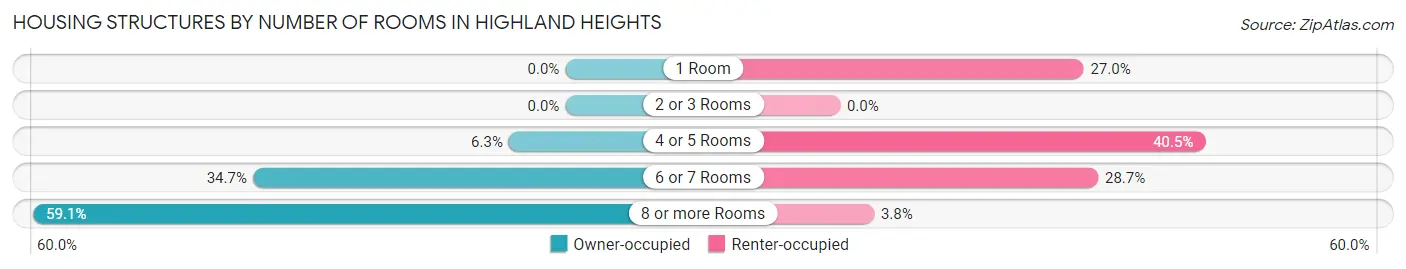
| Number of Rooms | Owner-occupied | Renter-occupied |
| 1 Room | 0 (0.0%) | 50 (27.0%) |
| 2 or 3 Rooms | 0 (0.0%) | 0 (0.0%) |
| 4 or 5 Rooms | 208 (6.3%) | 75 (40.5%) |
| 6 or 7 Rooms | 1,151 (34.7%) | 53 (28.6%) |
| 8 or more Rooms | 1,960 (59.1%) | 7 (3.8%) |
| Total | 3,319 (100.0%) | 185 (100.0%) |
Housing Structure by Heating Type in Highland Heights
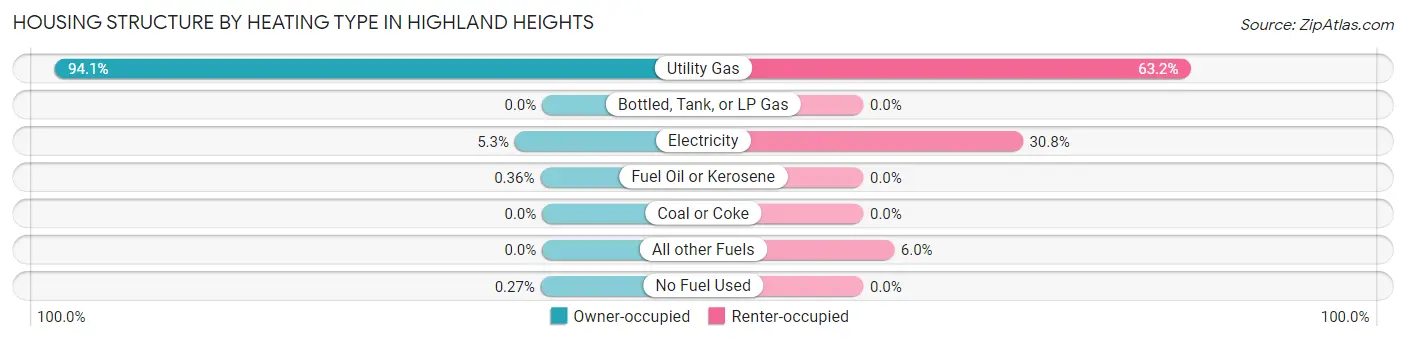
| Heating Type | Owner-occupied | Renter-occupied |
| Utility Gas | 3,123 (94.1%) | 117 (63.2%) |
| Bottled, Tank, or LP Gas | 0 (0.0%) | 0 (0.0%) |
| Electricity | 175 (5.3%) | 57 (30.8%) |
| Fuel Oil or Kerosene | 12 (0.4%) | 0 (0.0%) |
| Coal or Coke | 0 (0.0%) | 0 (0.0%) |
| All other Fuels | 0 (0.0%) | 11 (5.9%) |
| No Fuel Used | 9 (0.3%) | 0 (0.0%) |
| Total | 3,319 (100.0%) | 185 (100.0%) |
Household Vehicle Usage in Highland Heights
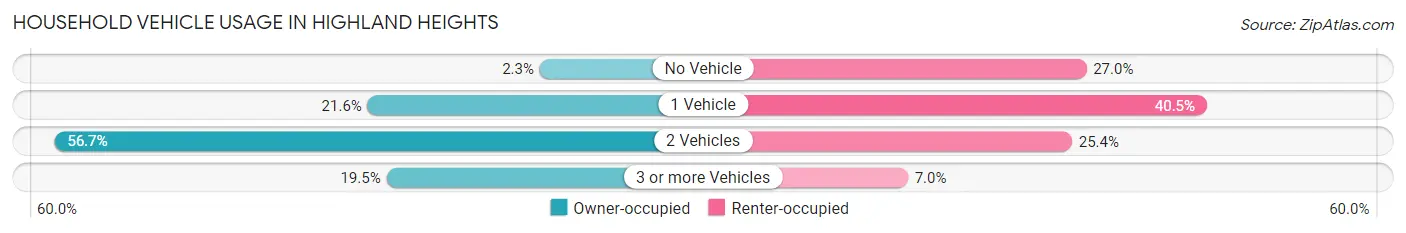
| Vehicles per Household | Owner-occupied | Renter-occupied |
| No Vehicle | 76 (2.3%) | 50 (27.0%) |
| 1 Vehicle | 716 (21.6%) | 75 (40.5%) |
| 2 Vehicles | 1,881 (56.7%) | 47 (25.4%) |
| 3 or more Vehicles | 646 (19.5%) | 13 (7.0%) |
| Total | 3,319 (100.0%) | 185 (100.0%) |
Real Estate & Mortgages in Highland Heights
Real Estate and Mortgage Overview in Highland Heights
| Characteristic | Without Mortgage | With Mortgage |
| Housing Units | 1,255 | 2,064 |
| Median Property Value | $306,300 | $354,100 |
| Median Household Income | $83,875 | $1,031 |
| Monthly Housing Costs | $960 | $473 |
| Real Estate Taxes | $6,897 | $8 |
Property Value by Mortgage Status in Highland Heights
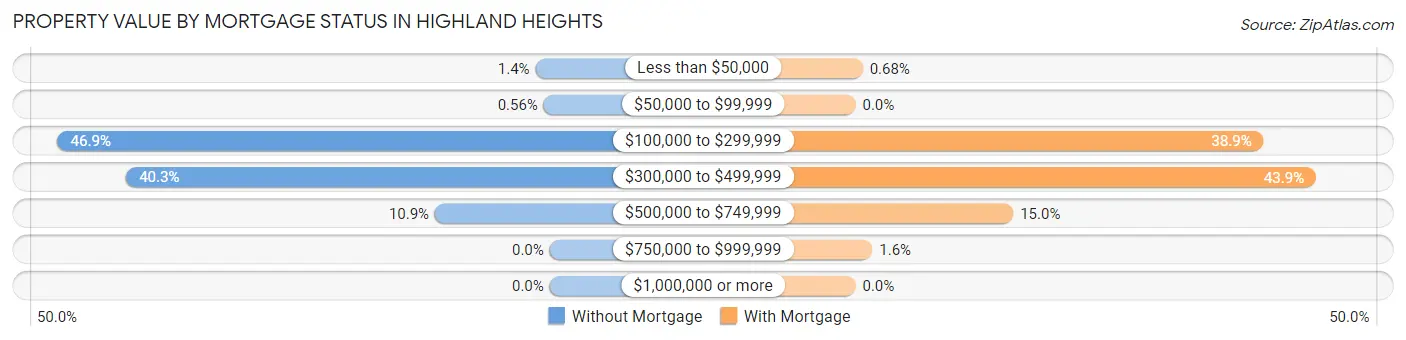
| Property Value | Without Mortgage | With Mortgage |
| Less than $50,000 | 17 (1.3%) | 14 (0.7%) |
| $50,000 to $99,999 | 7 (0.6%) | 0 (0.0%) |
| $100,000 to $299,999 | 588 (46.9%) | 802 (38.9%) |
| $300,000 to $499,999 | 506 (40.3%) | 905 (43.9%) |
| $500,000 to $749,999 | 137 (10.9%) | 310 (15.0%) |
| $750,000 to $999,999 | 0 (0.0%) | 33 (1.6%) |
| $1,000,000 or more | 0 (0.0%) | 0 (0.0%) |
| Total | 1,255 (100.0%) | 2,064 (100.0%) |
Household Income by Mortgage Status in Highland Heights
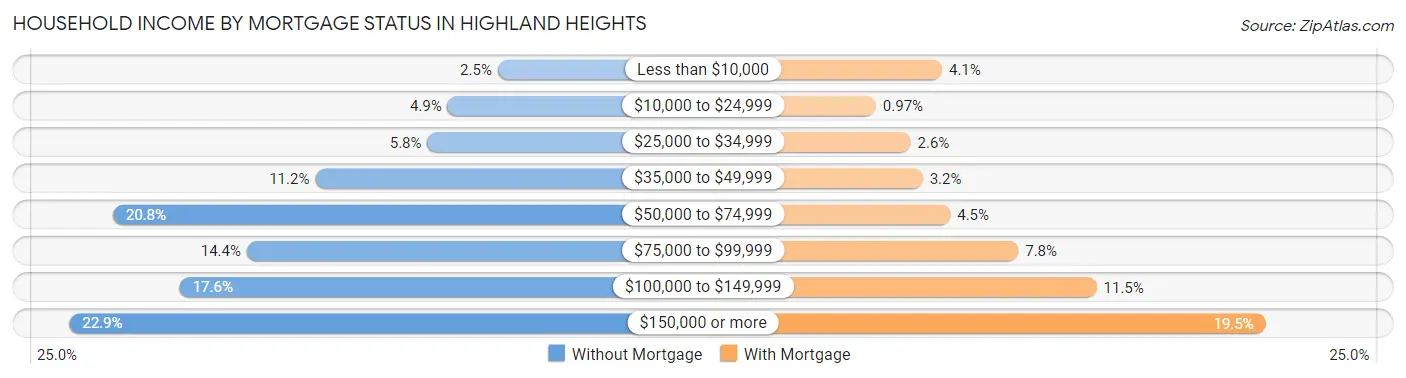
| Household Income | Without Mortgage | With Mortgage |
| Less than $10,000 | 31 (2.5%) | 85 (4.1%) |
| $10,000 to $24,999 | 61 (4.9%) | 20 (1.0%) |
| $25,000 to $34,999 | 73 (5.8%) | 54 (2.6%) |
| $35,000 to $49,999 | 140 (11.2%) | 66 (3.2%) |
| $50,000 to $74,999 | 261 (20.8%) | 93 (4.5%) |
| $75,000 to $99,999 | 181 (14.4%) | 160 (7.7%) |
| $100,000 to $149,999 | 221 (17.6%) | 237 (11.5%) |
| $150,000 or more | 287 (22.9%) | 403 (19.5%) |
| Total | 1,255 (100.0%) | 2,064 (100.0%) |
Property Value to Household Income Ratio in Highland Heights
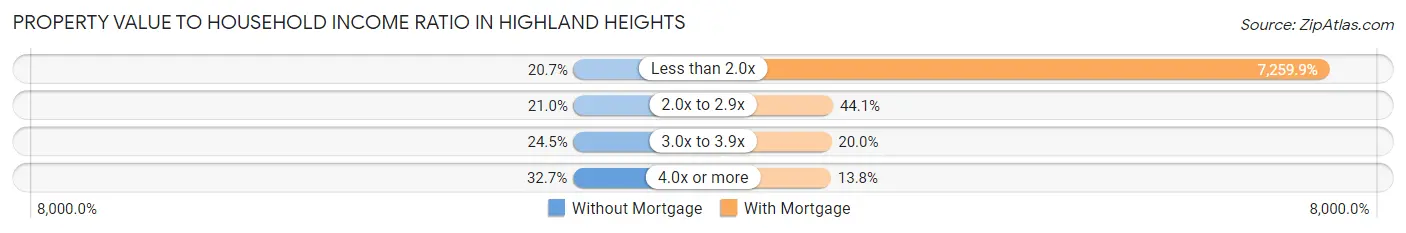
| Value-to-Income Ratio | Without Mortgage | With Mortgage |
| Less than 2.0x | 260 (20.7%) | 149,844 (7,259.9%) |
| 2.0x to 2.9x | 264 (21.0%) | 911 (44.1%) |
| 3.0x to 3.9x | 308 (24.5%) | 412 (20.0%) |
| 4.0x or more | 410 (32.7%) | 285 (13.8%) |
| Total | 1,255 (100.0%) | 2,064 (100.0%) |
Real Estate Taxes by Mortgage Status in Highland Heights
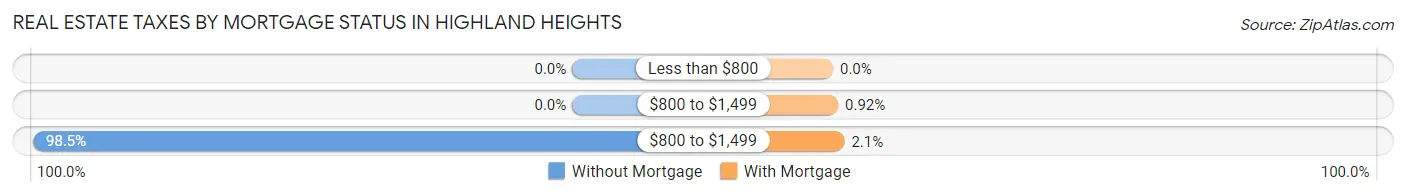
| Property Taxes | Without Mortgage | With Mortgage |
| Less than $800 | 0 (0.0%) | 0 (0.0%) |
| $800 to $1,499 | 0 (0.0%) | 19 (0.9%) |
| $800 to $1,499 | 1,236 (98.5%) | 43 (2.1%) |
| Total | 1,255 (100.0%) | 2,064 (100.0%) |
Health & Disability in Highland Heights
Health Insurance Coverage by Age in Highland Heights
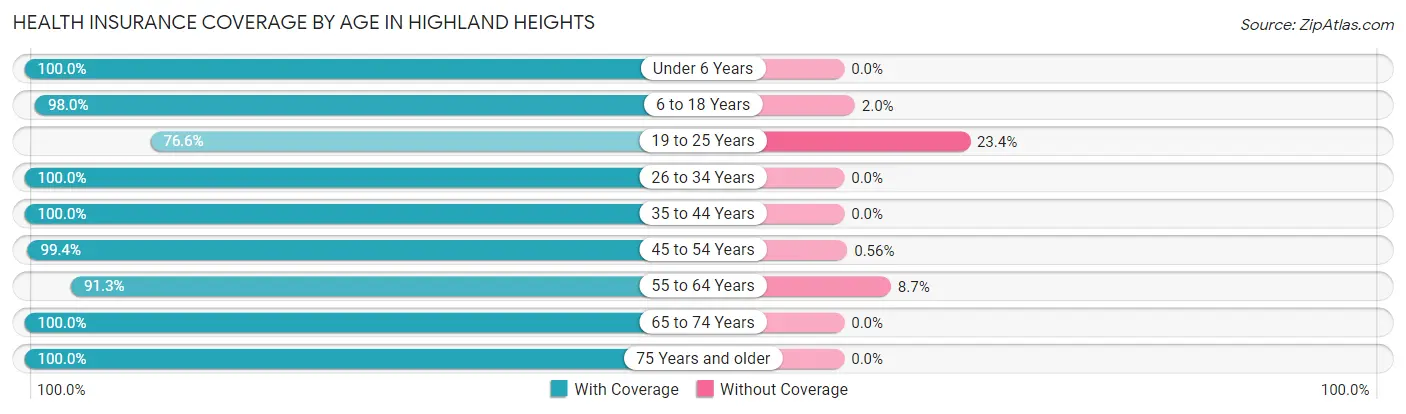
| Age Bracket | With Coverage | Without Coverage |
| Under 6 Years | 405 (100.0%) | 0 (0.0%) |
| 6 to 18 Years | 1,648 (98.0%) | 33 (2.0%) |
| 19 to 25 Years | 209 (76.6%) | 64 (23.4%) |
| 26 to 34 Years | 430 (100.0%) | 0 (0.0%) |
| 35 to 44 Years | 1,315 (100.0%) | 0 (0.0%) |
| 45 to 54 Years | 893 (99.4%) | 5 (0.6%) |
| 55 to 64 Years | 1,125 (91.3%) | 107 (8.7%) |
| 65 to 74 Years | 1,406 (100.0%) | 0 (0.0%) |
| 75 Years and older | 999 (100.0%) | 0 (0.0%) |
| Total | 8,430 (97.6%) | 209 (2.4%) |
Health Insurance Coverage by Citizenship Status in Highland Heights
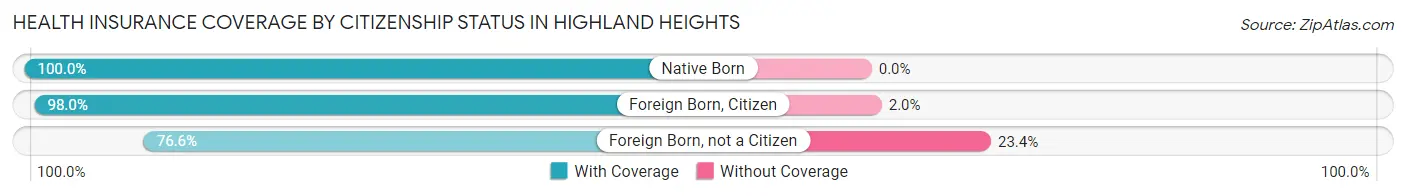
| Citizenship Status | With Coverage | Without Coverage |
| Native Born | 405 (100.0%) | 0 (0.0%) |
| Foreign Born, Citizen | 1,648 (98.0%) | 33 (2.0%) |
| Foreign Born, not a Citizen | 209 (76.6%) | 64 (23.4%) |
Health Insurance Coverage by Household Income in Highland Heights
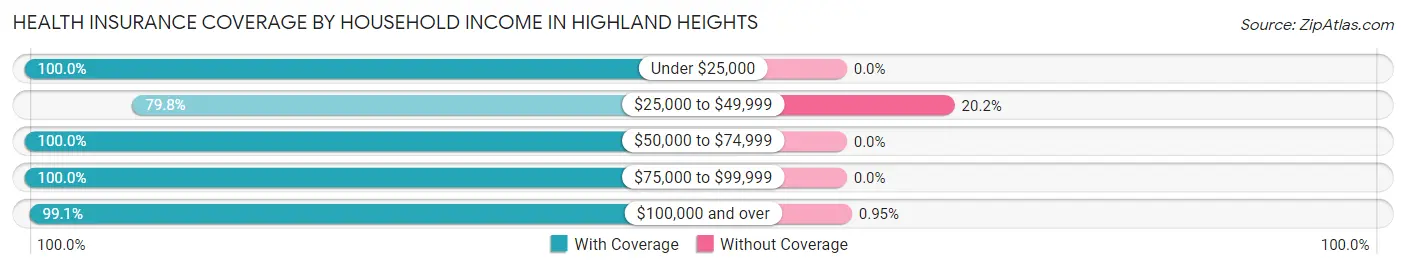
| Household Income | With Coverage | Without Coverage |
| Under $25,000 | 352 (100.0%) | 0 (0.0%) |
| $25,000 to $49,999 | 612 (79.8%) | 155 (20.2%) |
| $50,000 to $74,999 | 878 (100.0%) | 0 (0.0%) |
| $75,000 to $99,999 | 911 (100.0%) | 0 (0.0%) |
| $100,000 and over | 5,646 (99.1%) | 54 (0.9%) |
Public vs Private Health Insurance Coverage by Age in Highland Heights
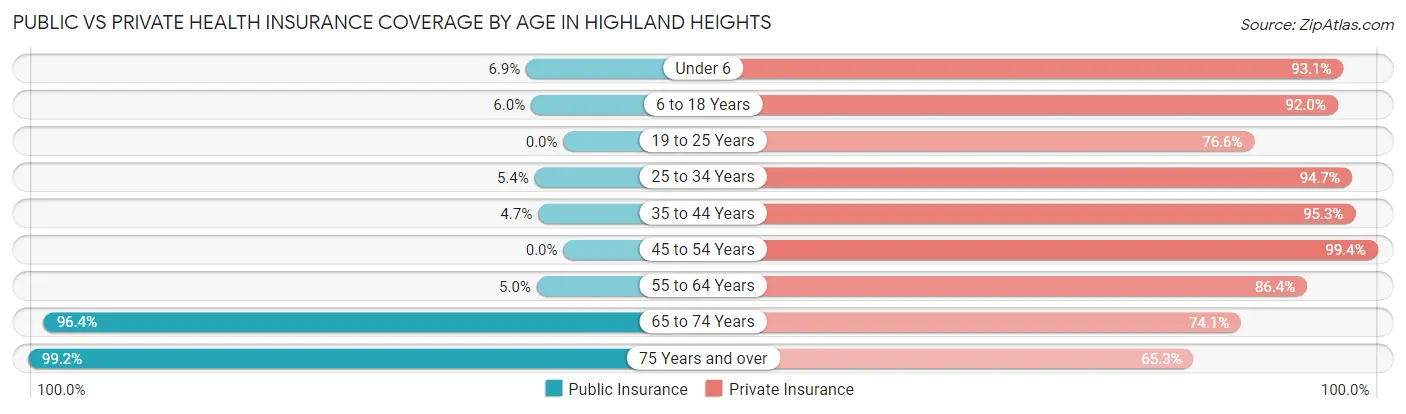
| Age Bracket | Public Insurance | Private Insurance |
| Under 6 | 28 (6.9%) | 377 (93.1%) |
| 6 to 18 Years | 101 (6.0%) | 1,547 (92.0%) |
| 19 to 25 Years | 0 (0.0%) | 209 (76.6%) |
| 25 to 34 Years | 23 (5.3%) | 407 (94.7%) |
| 35 to 44 Years | 62 (4.7%) | 1,253 (95.3%) |
| 45 to 54 Years | 0 (0.0%) | 893 (99.4%) |
| 55 to 64 Years | 61 (5.0%) | 1,064 (86.4%) |
| 65 to 74 Years | 1,356 (96.4%) | 1,042 (74.1%) |
| 75 Years and over | 991 (99.2%) | 652 (65.3%) |
| Total | 2,622 (30.3%) | 7,444 (86.2%) |
Disability Status by Sex by Age in Highland Heights
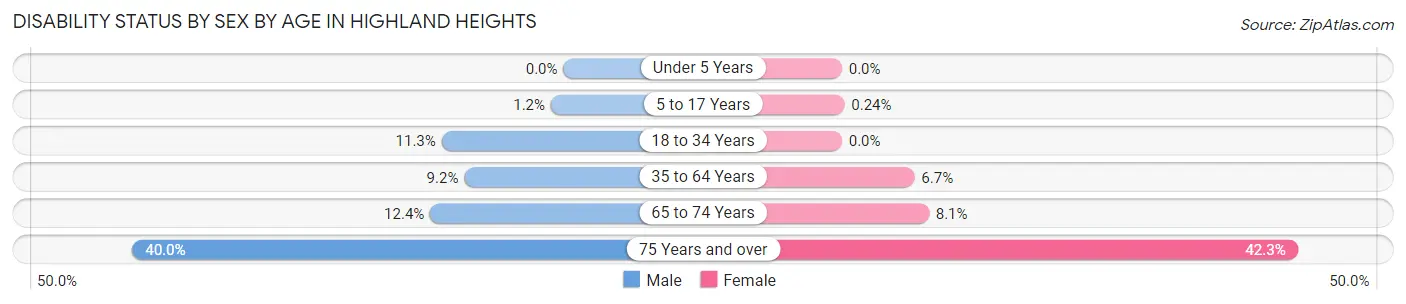
| Age Bracket | Male | Female |
| Under 5 Years | 0 (0.0%) | 0 (0.0%) |
| 5 to 17 Years | 9 (1.2%) | 2 (0.2%) |
| 18 to 34 Years | 46 (11.3%) | 0 (0.0%) |
| 35 to 64 Years | 160 (9.2%) | 115 (6.7%) |
| 65 to 74 Years | 88 (12.4%) | 56 (8.1%) |
| 75 Years and over | 148 (40.0%) | 266 (42.3%) |
Disability Class by Sex by Age in Highland Heights
Disability Class: Hearing Difficulty
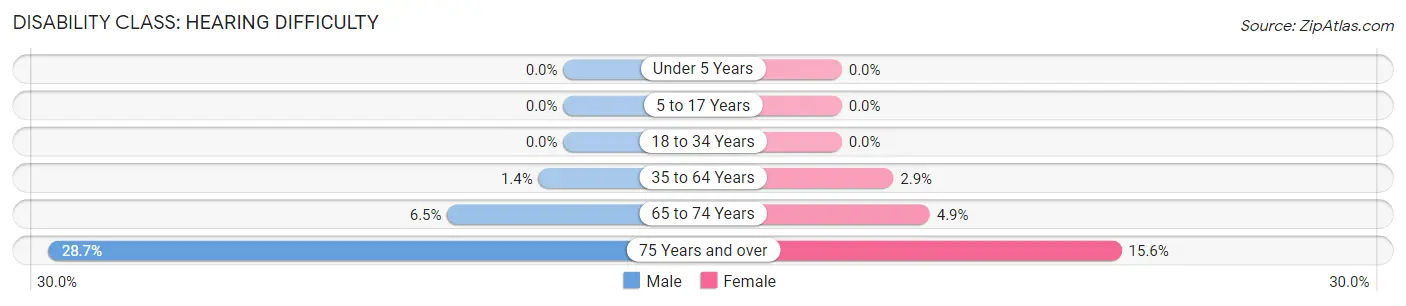
| Age Bracket | Male | Female |
| Under 5 Years | 0 (0.0%) | 0 (0.0%) |
| 5 to 17 Years | 0 (0.0%) | 0 (0.0%) |
| 18 to 34 Years | 0 (0.0%) | 0 (0.0%) |
| 35 to 64 Years | 24 (1.4%) | 49 (2.9%) |
| 65 to 74 Years | 46 (6.5%) | 34 (4.9%) |
| 75 Years and over | 106 (28.6%) | 98 (15.6%) |
Disability Class: Vision Difficulty
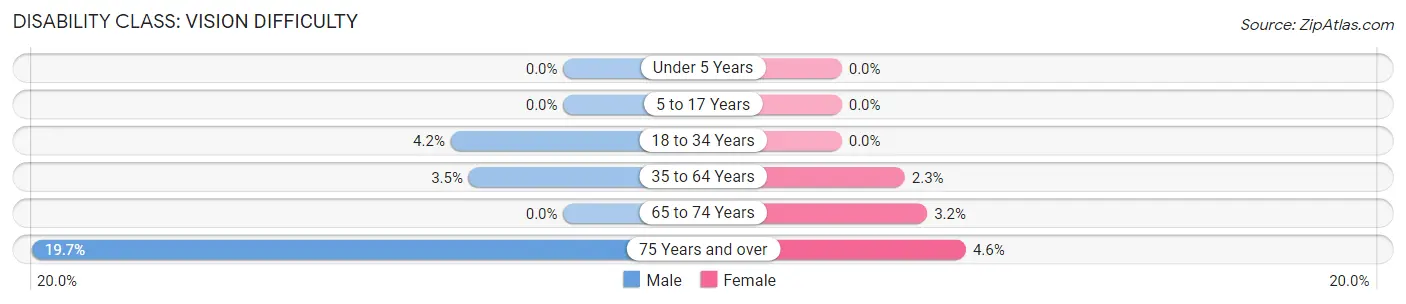
| Age Bracket | Male | Female |
| Under 5 Years | 0 (0.0%) | 0 (0.0%) |
| 5 to 17 Years | 0 (0.0%) | 0 (0.0%) |
| 18 to 34 Years | 17 (4.2%) | 0 (0.0%) |
| 35 to 64 Years | 61 (3.5%) | 40 (2.3%) |
| 65 to 74 Years | 0 (0.0%) | 22 (3.2%) |
| 75 Years and over | 73 (19.7%) | 29 (4.6%) |
Disability Class: Cognitive Difficulty
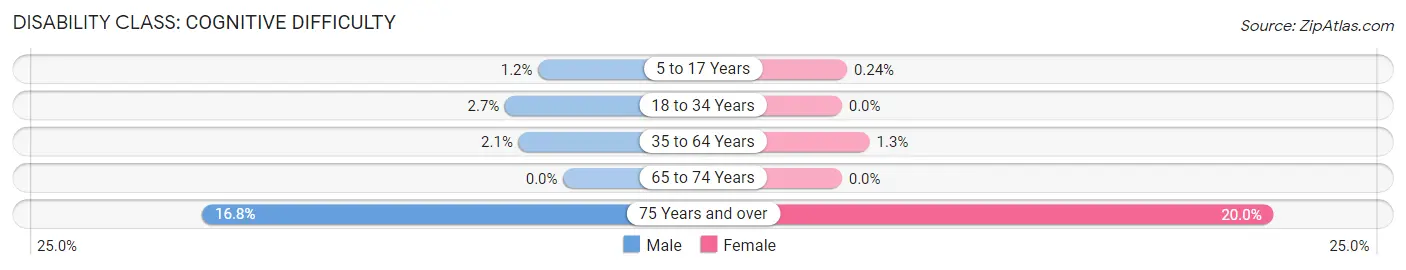
| Age Bracket | Male | Female |
| 5 to 17 Years | 9 (1.2%) | 2 (0.2%) |
| 18 to 34 Years | 11 (2.7%) | 0 (0.0%) |
| 35 to 64 Years | 36 (2.1%) | 22 (1.3%) |
| 65 to 74 Years | 0 (0.0%) | 0 (0.0%) |
| 75 Years and over | 62 (16.8%) | 126 (20.0%) |
Disability Class: Ambulatory Difficulty
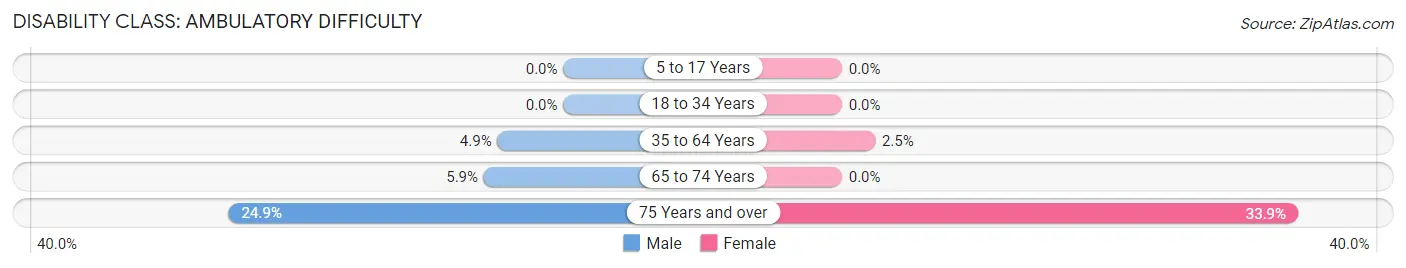
| Age Bracket | Male | Female |
| 5 to 17 Years | 0 (0.0%) | 0 (0.0%) |
| 18 to 34 Years | 0 (0.0%) | 0 (0.0%) |
| 35 to 64 Years | 85 (4.9%) | 42 (2.5%) |
| 65 to 74 Years | 42 (5.9%) | 0 (0.0%) |
| 75 Years and over | 92 (24.9%) | 213 (33.9%) |
Disability Class: Self-Care Difficulty
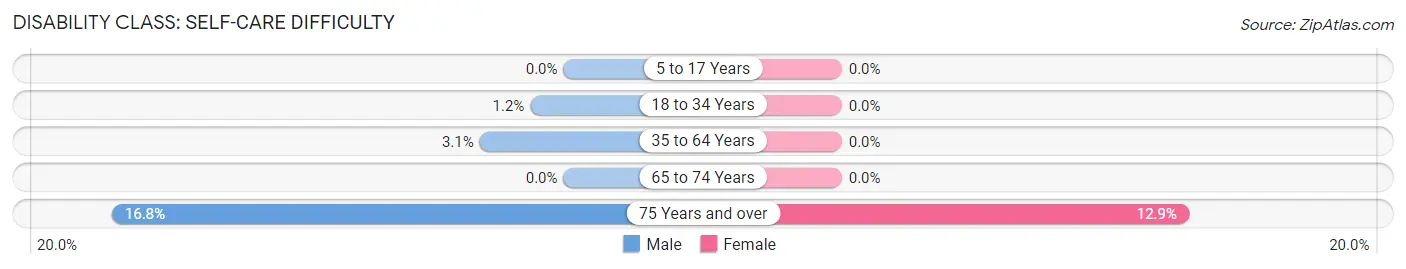
| Age Bracket | Male | Female |
| 5 to 17 Years | 0 (0.0%) | 0 (0.0%) |
| 18 to 34 Years | 5 (1.2%) | 0 (0.0%) |
| 35 to 64 Years | 54 (3.1%) | 0 (0.0%) |
| 65 to 74 Years | 0 (0.0%) | 0 (0.0%) |
| 75 Years and over | 62 (16.8%) | 81 (12.9%) |
Technology Access in Highland Heights
Computing Device Access in Highland Heights
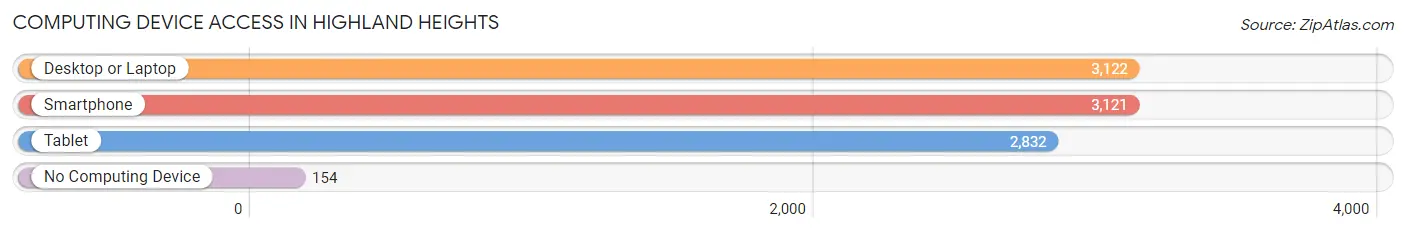
| Device Type | # Households | % Households |
| Desktop or Laptop | 3,122 | 89.1% |
| Smartphone | 3,121 | 89.1% |
| Tablet | 2,832 | 80.8% |
| No Computing Device | 154 | 4.4% |
| Total | 3,504 | 100.0% |
Internet Access in Highland Heights
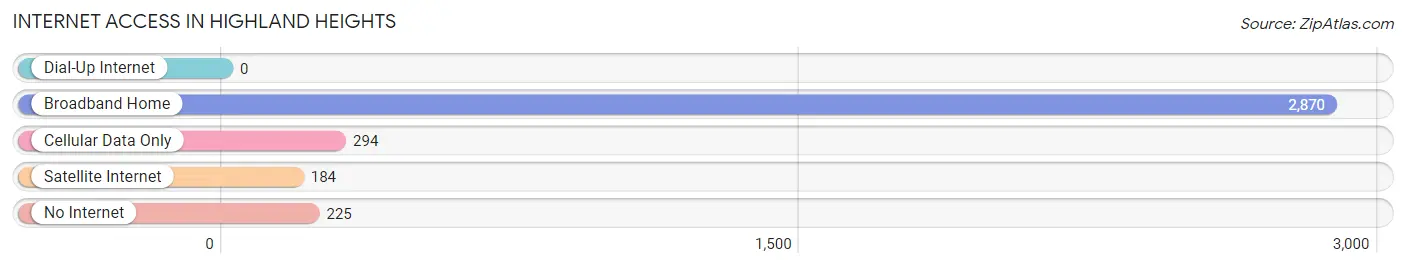
| Internet Type | # Households | % Households |
| Dial-Up Internet | 0 | 0.0% |
| Broadband Home | 2,870 | 81.9% |
| Cellular Data Only | 294 | 8.4% |
| Satellite Internet | 184 | 5.2% |
| No Internet | 225 | 6.4% |
| Total | 3,504 | 100.0% |
Highland Heights Summary
Highland Heights is a city located in Cuyahoga County, Ohio, United States. It is a suburb of Cleveland and is part of the Greater Cleveland Metropolitan Area. The population was 8,345 at the 2010 census.
History
Highland Heights was first settled in 1818 by a group of settlers from Connecticut. The area was originally known as "Highland" and was part of Mayfield Township. In 1845, the area was incorporated as a village and the name was changed to "Highland Heights". The village was annexed by the city of Mayfield in 1874, but was re-established as an independent village in 1891.
In the early 20th century, Highland Heights was a rural farming community. The population began to grow in the 1950s and 1960s as the city of Cleveland expanded and people moved to the suburbs. The city was officially incorporated in 1961.
Geography
Highland Heights is located at 41 30 25 North 81 30 45 West 41 506944 81 5125
According to the United States Census Bureau, the city has a total area of 4.2 square miles (10.8 km2), all land.
Economy
Highland Heights is home to several businesses, including a number of restaurants, retail stores, and professional services. The city is also home to a number of corporate headquarters, including the headquarters of the National City Corporation, a financial services company.
Demographics
As of the census of 2010, there were 8,345 people, 3,541 households, and 2,092 families residing in the city. The population density was 1,988.1 people per square mile (766.7/km2). There were 3,817 housing units at an average density of 912.2 per square mile (352.2/km2). The racial makeup of the city was 87.2% White, 8.2% African American, 0.2% Native American, 1.7% Asian, 0.7% from other races, and 2.0% from two or more races. Hispanic or Latino of any race were 2.3% of the population.
There were 3,541 households, out of which 28.2% had children under the age of 18 living with them, 46.2% were married couples living together, 11.2% had a female householder with no husband present, and 38.2% were non-families. 32.2% of all households were made up of individuals, and 10.2% had someone living alone who was 65 years of age or older. The average household size was 2.35 and the average family size was 2.99.
In the city, the population was spread out, with 23.2% under the age of 18, 8.2% from 18 to 24, 28.2% from 25 to 44, 25.2% from 45 to 64, and 15.2% who were 65 years of age or older. The median age was 38 years. For every 100 females, there were 92.2 males. For every 100 females age 18 and over, there were 88.3 males.
The median income for a household in the city was $50,945, and the median income for a family was $62,917. Males had a median income of $45,917 versus $35,917 for females. The per capita income for the city was $27,945. About 3.2% of families and 4.7% of the population were below the poverty line, including 5.2% of those under age 18 and 4.2% of those age 65 or over.
Common Questions
What is Per Capita Income in Highland Heights?
Per Capita income in Highland Heights is $66,287.
What is the Median Family Income in Highland Heights?
Median Family Income in Highland Heights is $146,355.
What is the Median Household income in Highland Heights?
Median Household Income in Highland Heights is $124,821.
What is Income or Wage Gap in Highland Heights?
Income or Wage Gap in Highland Heights is 38.3%.
Women in Highland Heights earn 61.7 cents for every dollar earned by a man.
What is Inequality or Gini Index in Highland Heights?
Inequality or Gini Index in Highland Heights is 0.47.
What is the Total Population of Highland Heights?
Total Population of Highland Heights is 8,652.
What is the Total Male Population of Highland Heights?
Total Male Population of Highland Heights is 4,183.
What is the Total Female Population of Highland Heights?
Total Female Population of Highland Heights is 4,469.
What is the Ratio of Males per 100 Females in Highland Heights?
There are 93.60 Males per 100 Females in Highland Heights.
What is the Ratio of Females per 100 Males in Highland Heights?
There are 106.84 Females per 100 Males in Highland Heights.
What is the Median Population Age in Highland Heights?
Median Population Age in Highland Heights is 48.0 Years.
What is the Average Family Size in Highland Heights
Average Family Size in Highland Heights is 2.9 People.
What is the Average Household Size in Highland Heights
Average Household Size in Highland Heights is 2.5 People.
How Large is the Labor Force in Highland Heights?
There are 4,243 People in the Labor Forcein in Highland Heights.
What is the Percentage of People in the Labor Force in Highland Heights?
61.0% of People are in the Labor Force in Highland Heights.
What is the Unemployment Rate in Highland Heights?
Unemployment Rate in Highland Heights is 4.6%.