Wetherington, OH Map & Demographics
Wetherington Map
Wetherington Overview
$109,614
PER CAPITA INCOME
$219,000
AVG FAMILY INCOME
$188,368
AVG HOUSEHOLD INCOME
83.3%
WAGE / INCOME GAP [ % ]
16.7¢/ $1
WAGE / INCOME GAP [ $ ]
$8,150
FAMILY INCOME DEFICIT
0.48
INEQUALITY / GINI INDEX
1,237
TOTAL POPULATION
584
MALE POPULATION
653
FEMALE POPULATION
89.43
MALES / 100 FEMALES
111.82
FEMALES / 100 MALES
56.9
MEDIAN AGE
2.6
AVG FAMILY SIZE
2.1
AVG HOUSEHOLD SIZE
569
LABOR FORCE [ PEOPLE ]
49.4%
PERCENT IN LABOR FORCE
Income in Wetherington
Income Overview in Wetherington
Per Capita Income in Wetherington is $109,614, while median incomes of families and households are $219,000 and $188,368 respectively.
| Characteristic | Number | Measure |
| Per Capita Income | 1,237 | $109,614 |
| Median Family Income | 402 | $219,000 |
| Mean Family Income | 402 | $291,359 |
| Median Household Income | 593 | $188,368 |
| Mean Household Income | 593 | $226,681 |
| Income Deficit | 402 | $8,150 |
| Wage / Income Gap (%) | 1,237 | 83.33% |
| Wage / Income Gap ($) | 1,237 | 16.67¢ per $1 |
| Gini / Inequality Index | 1,237 | 0.48 |
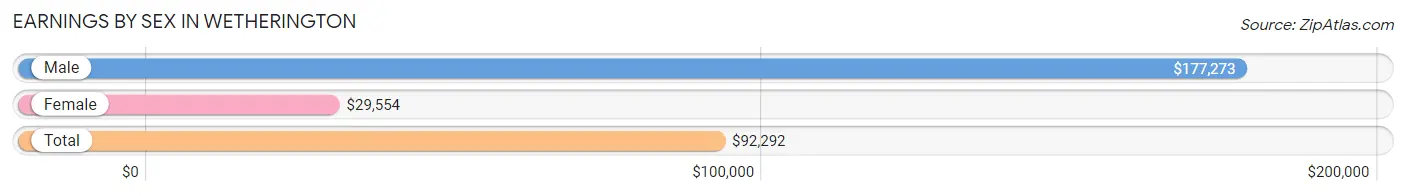
Earnings by Sex in Wetherington
Average Earnings in Wetherington are $92,292, $177,273 for men and $29,554 for women, a difference of 83.3%.
| Sex | Number | Average Earnings |
| Male | 360 (54.8%) | $177,273 |
| Female | 297 (45.2%) | $29,554 |
| Total | 657 (100.0%) | $92,292 |
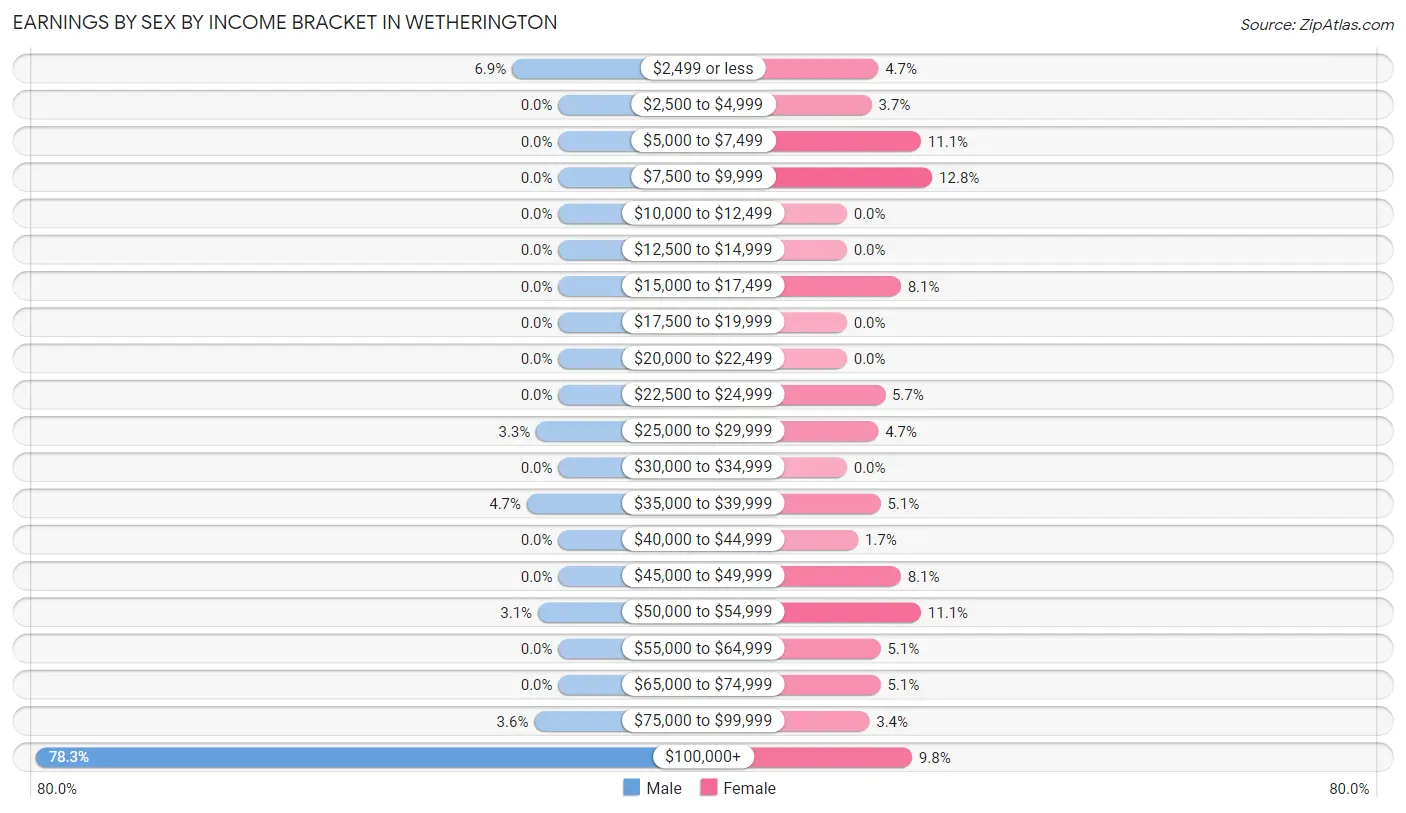
Earnings by Sex by Income Bracket in Wetherington
The most common earnings brackets in Wetherington are $100,000+ for men (282 | 78.3%) and $7,500 to $9,999 for women (38 | 12.8%).
| Income | Male | Female |
| $2,499 or less | 25 (6.9%) | 14 (4.7%) |
| $2,500 to $4,999 | 0 (0.0%) | 11 (3.7%) |
| $5,000 to $7,499 | 0 (0.0%) | 33 (11.1%) |
| $7,500 to $9,999 | 0 (0.0%) | 38 (12.8%) |
| $10,000 to $12,499 | 0 (0.0%) | 0 (0.0%) |
| $12,500 to $14,999 | 0 (0.0%) | 0 (0.0%) |
| $15,000 to $17,499 | 0 (0.0%) | 24 (8.1%) |
| $17,500 to $19,999 | 0 (0.0%) | 0 (0.0%) |
| $20,000 to $22,499 | 0 (0.0%) | 0 (0.0%) |
| $22,500 to $24,999 | 0 (0.0%) | 17 (5.7%) |
| $25,000 to $29,999 | 12 (3.3%) | 14 (4.7%) |
| $30,000 to $34,999 | 0 (0.0%) | 0 (0.0%) |
| $35,000 to $39,999 | 17 (4.7%) | 15 (5.1%) |
| $40,000 to $44,999 | 0 (0.0%) | 5 (1.7%) |
| $45,000 to $49,999 | 0 (0.0%) | 24 (8.1%) |
| $50,000 to $54,999 | 11 (3.1%) | 33 (11.1%) |
| $55,000 to $64,999 | 0 (0.0%) | 15 (5.1%) |
| $65,000 to $74,999 | 0 (0.0%) | 15 (5.1%) |
| $75,000 to $99,999 | 13 (3.6%) | 10 (3.4%) |
| $100,000+ | 282 (78.3%) | 29 (9.8%) |
| Total | 360 (100.0%) | 297 (100.0%) |
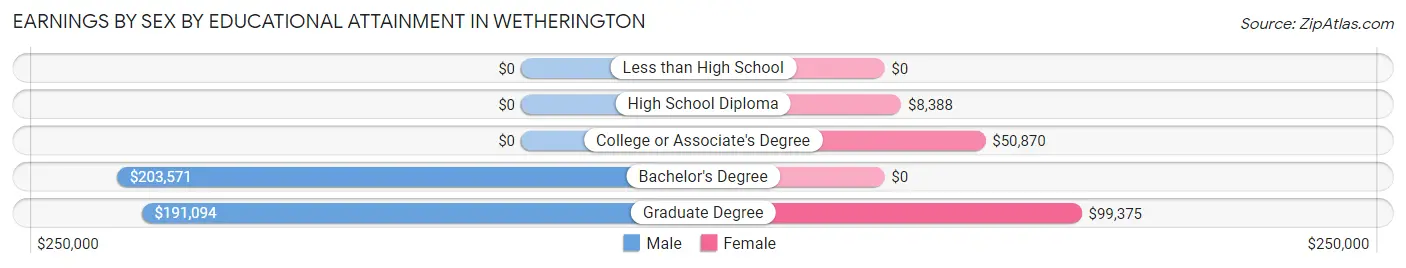
Earnings by Sex by Educational Attainment in Wetherington
Average earnings in Wetherington are $186,667 for men and $43,750 for women, a difference of 76.6%. Men with an educational attainment of bachelor's degree enjoy the highest average annual earnings of $203,571, while those with graduate degree education earn the least with $191,094. Women with an educational attainment of graduate degree earn the most with the average annual earnings of $99,375, while those with high school diploma education have the smallest earnings of $8,388.
| Educational Attainment | Male Income | Female Income |
| Less than High School | - | - |
| High School Diploma | - | - |
| College or Associate's Degree | - | - |
| Bachelor's Degree | $203,571 | $0 |
| Graduate Degree | $191,094 | $99,375 |
| Total | $186,667 | $43,750 |
Family Income in Wetherington
Family Income Brackets in Wetherington
According to the Wetherington family income data, there are 228 families falling into the $200,000+ income range, which is the most common income bracket and makes up 56.7% of all families.
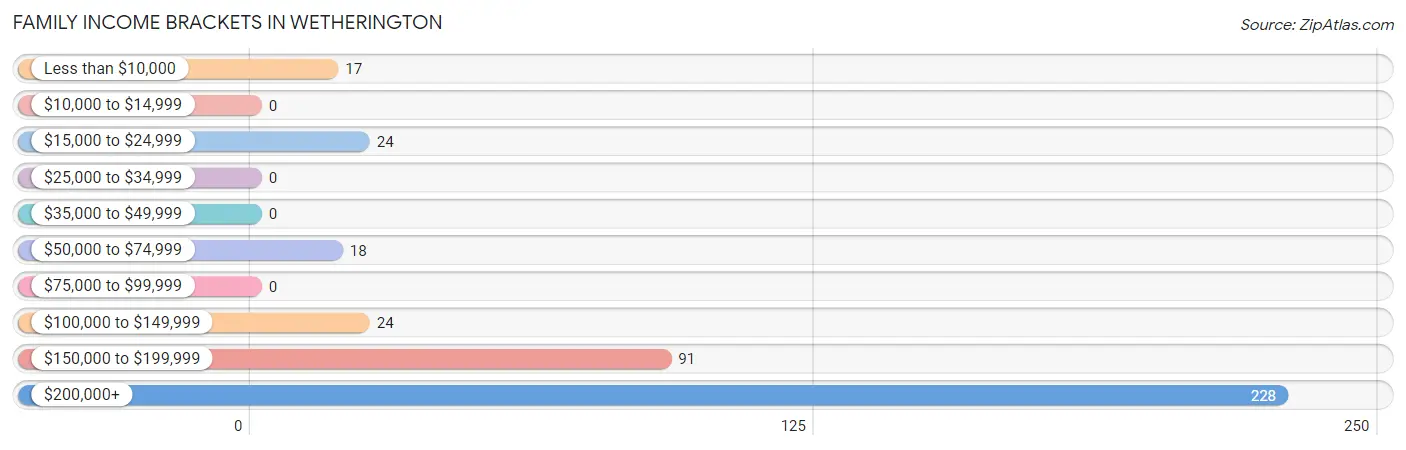
| Income Bracket | # Families | % Families |
| Less than $10,000 | 17 | 4.2% |
| $10,000 to $14,999 | 0 | 0.0% |
| $15,000 to $24,999 | 24 | 6.0% |
| $25,000 to $34,999 | 0 | 0.0% |
| $35,000 to $49,999 | 0 | 0.0% |
| $50,000 to $74,999 | 18 | 4.5% |
| $75,000 to $99,999 | 0 | 0.0% |
| $100,000 to $149,999 | 24 | 6.0% |
| $150,000 to $199,999 | 91 | 22.6% |
| $200,000+ | 228 | 56.7% |
Family Income by Famaliy Size in Wetherington
3-person families (57 | 14.2%) account for the highest median family income in Wetherington with $250,001 per family, while 2-person families (294 | 73.1%) have the highest median income of $95,228 per family member.
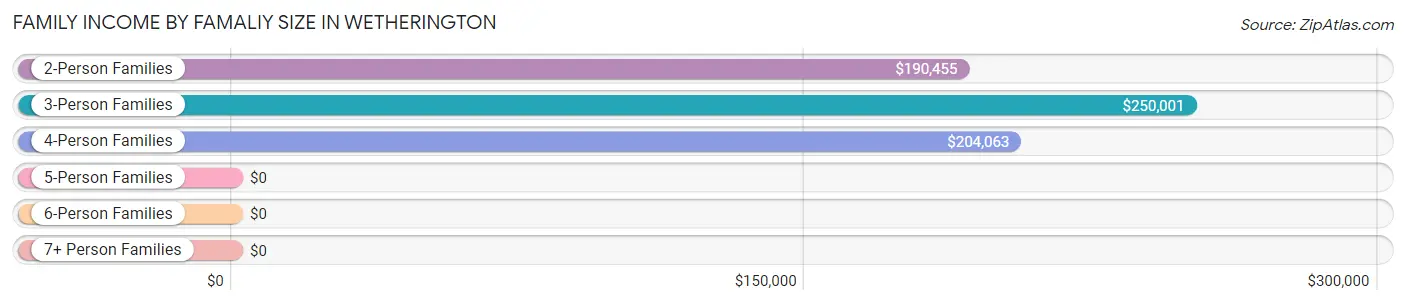
| Income Bracket | # Families | Median Income |
| 2-Person Families | 294 (73.1%) | $190,455 |
| 3-Person Families | 57 (14.2%) | $250,001 |
| 4-Person Families | 41 (10.2%) | $204,063 |
| 5-Person Families | 0 (0.0%) | $0 |
| 6-Person Families | 10 (2.5%) | $0 |
| 7+ Person Families | 0 (0.0%) | $0 |
| Total | 402 (100.0%) | $219,000 |
Family Income by Number of Earners in Wetherington
The median family income in Wetherington is $219,000, with families comprising 2 earners (123) having the highest median family income of $250,001, while families with no earners (142) have the lowest median family income of $151,944, accounting for 30.6% and 35.3% of families, respectively.
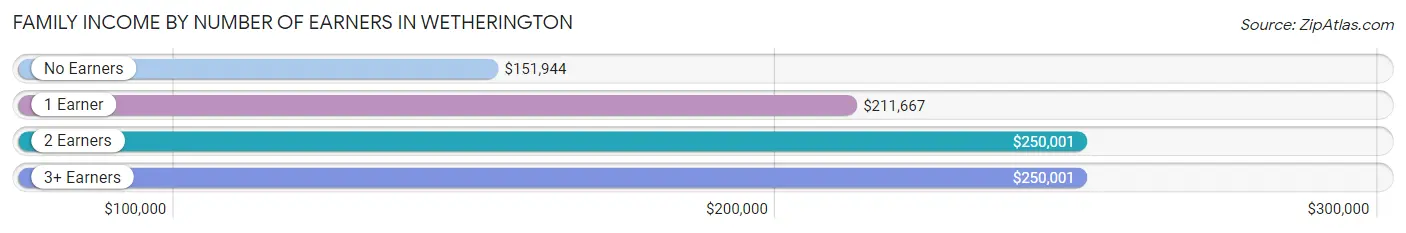
| Number of Earners | # Families | Median Income |
| No Earners | 142 (35.3%) | $151,944 |
| 1 Earner | 98 (24.4%) | $211,667 |
| 2 Earners | 123 (30.6%) | $250,001 |
| 3+ Earners | 39 (9.7%) | $250,001 |
| Total | 402 (100.0%) | $219,000 |
Household Income in Wetherington
Household Income Brackets in Wetherington
With 262 households falling in the category, the $200,000+ income range is the most frequent in Wetherington, accounting for 44.2% of all households. In contrast, only 12 households (2.0%) fall into the $10,000 to $14,999 income bracket, making it the least populous group.
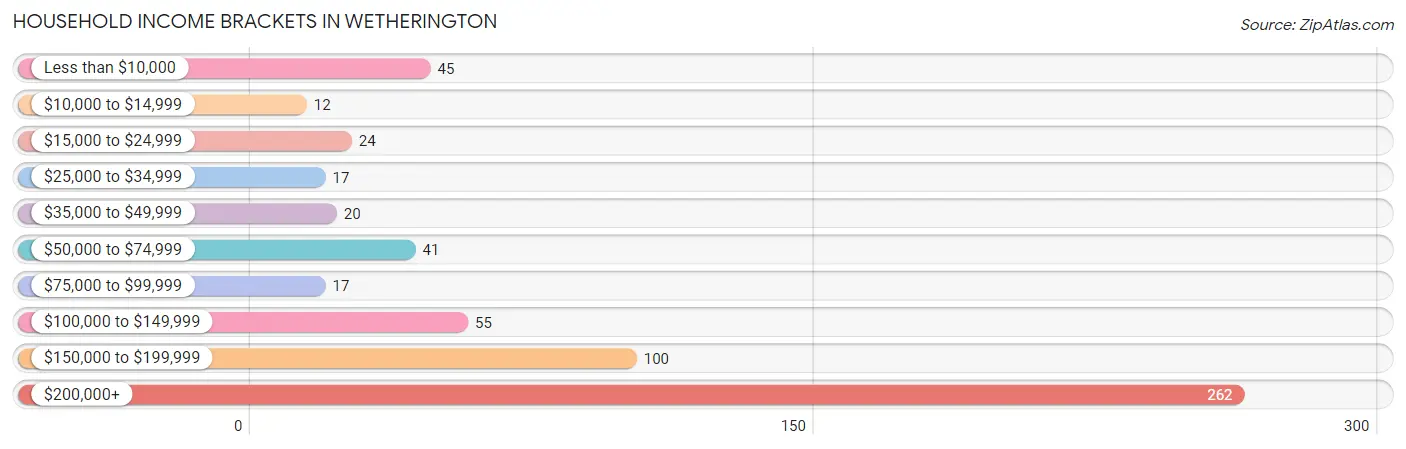
| Income Bracket | # Households | % Households |
| Less than $10,000 | 45 | 7.6% |
| $10,000 to $14,999 | 12 | 2.0% |
| $15,000 to $24,999 | 24 | 4.0% |
| $25,000 to $34,999 | 17 | 2.9% |
| $35,000 to $49,999 | 20 | 3.4% |
| $50,000 to $74,999 | 41 | 6.9% |
| $75,000 to $99,999 | 17 | 2.9% |
| $100,000 to $149,999 | 55 | 9.3% |
| $150,000 to $199,999 | 100 | 16.9% |
| $200,000+ | 262 | 44.2% |
Household Income by Householder Age in Wetherington
The median household income in Wetherington is $188,368, with the highest median household income of $250,001 found in the 45 to 64 years age bracket for the primary householder. A total of 264 households (44.5%) fall into this category. Meanwhile, the 15 to 24 years age bracket for the primary householder has the lowest median household income of $0, with 5 households (0.8%) in this group.
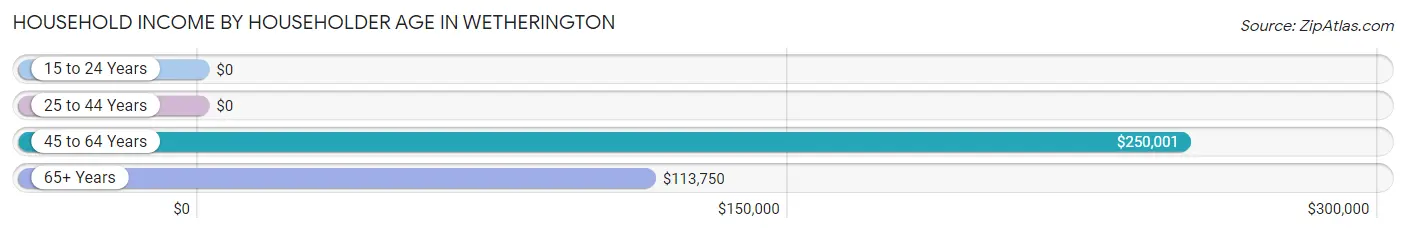
| Income Bracket | # Households | Median Income |
| 15 to 24 Years | 5 (0.8%) | $0 |
| 25 to 44 Years | 39 (6.6%) | $0 |
| 45 to 64 Years | 264 (44.5%) | $250,001 |
| 65+ Years | 285 (48.1%) | $113,750 |
| Total | 593 (100.0%) | $188,368 |
Poverty in Wetherington
Income Below Poverty by Sex and Age in Wetherington
With 4.3% poverty level for males and 10.3% for females among the residents of Wetherington, 75 year old and over males and 75 year old and over females are the most vulnerable to poverty, with 17 males (31.5%) and 67 females (52.3%) in their respective age groups living below the poverty level.
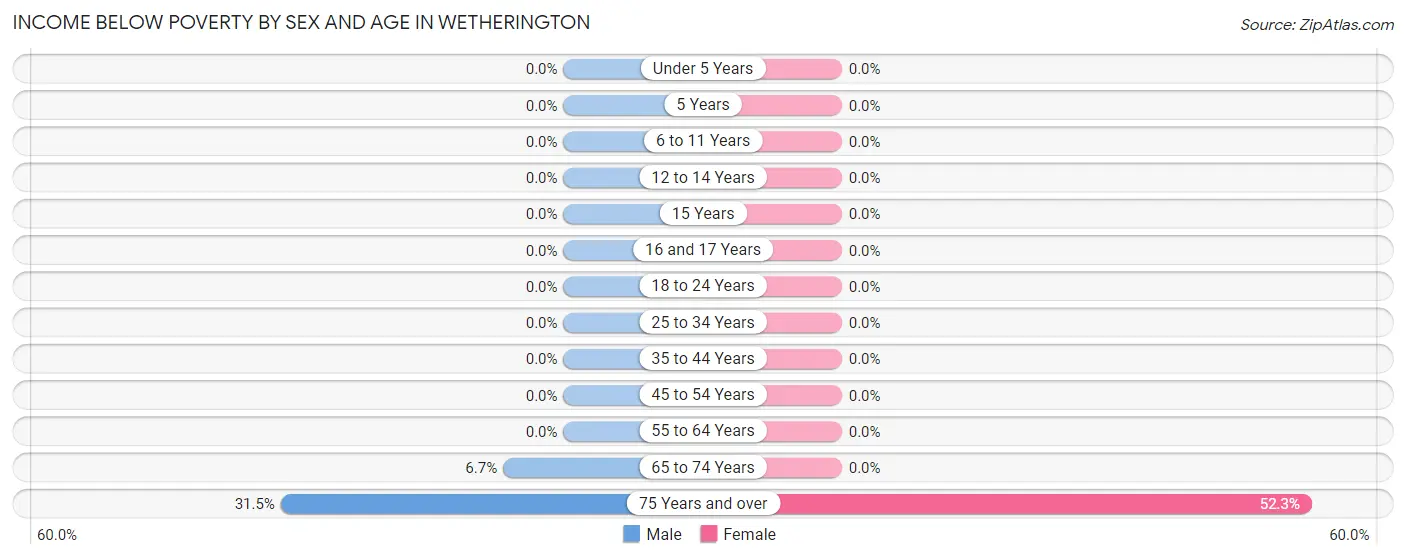
| Age Bracket | Male | Female |
| Under 5 Years | 0 (0.0%) | 0 (0.0%) |
| 5 Years | 0 (0.0%) | 0 (0.0%) |
| 6 to 11 Years | 0 (0.0%) | 0 (0.0%) |
| 12 to 14 Years | 0 (0.0%) | 0 (0.0%) |
| 15 Years | 0 (0.0%) | 0 (0.0%) |
| 16 and 17 Years | 0 (0.0%) | 0 (0.0%) |
| 18 to 24 Years | 0 (0.0%) | 0 (0.0%) |
| 25 to 34 Years | 0 (0.0%) | 0 (0.0%) |
| 35 to 44 Years | 0 (0.0%) | 0 (0.0%) |
| 45 to 54 Years | 0 (0.0%) | 0 (0.0%) |
| 55 to 64 Years | 0 (0.0%) | 0 (0.0%) |
| 65 to 74 Years | 8 (6.7%) | 0 (0.0%) |
| 75 Years and over | 17 (31.5%) | 67 (52.3%) |
| Total | 25 (4.3%) | 67 (10.3%) |
Income Above Poverty by Sex and Age in Wetherington
According to the poverty statistics in Wetherington, males aged under 5 years and females aged 6 to 11 years are the age groups that are most secure financially, with 100.0% of males and 100.0% of females in these age groups living above the poverty line.
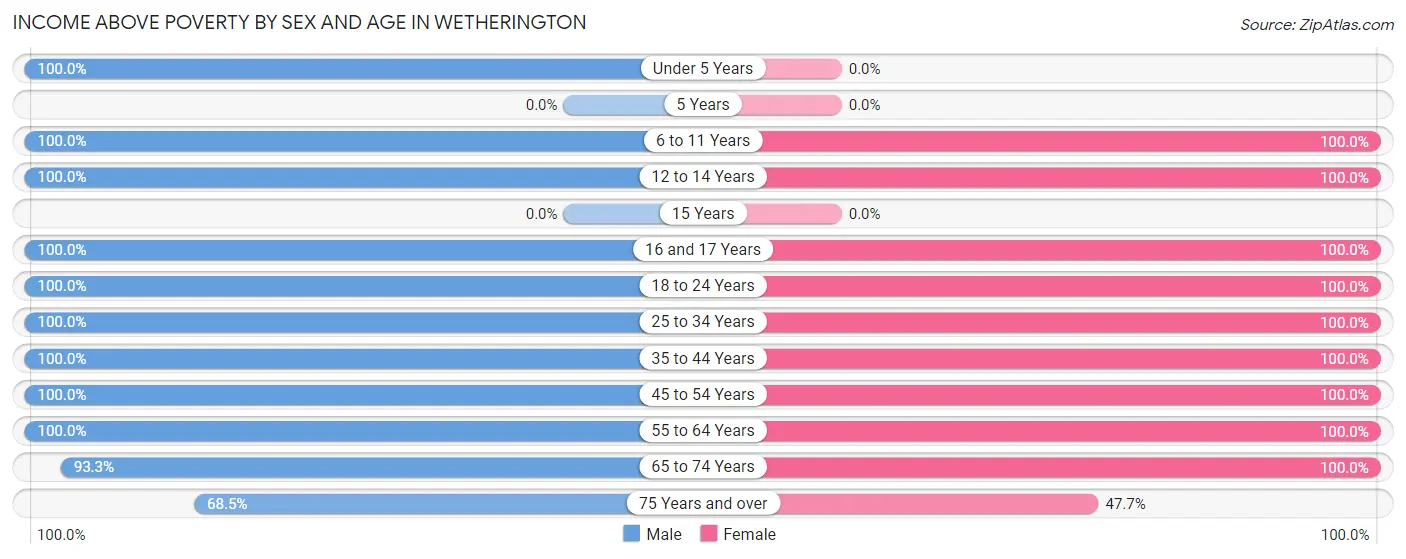
| Age Bracket | Male | Female |
| Under 5 Years | 5 (100.0%) | 0 (0.0%) |
| 5 Years | 0 (0.0%) | 0 (0.0%) |
| 6 to 11 Years | 13 (100.0%) | 24 (100.0%) |
| 12 to 14 Years | 36 (100.0%) | 8 (100.0%) |
| 15 Years | 0 (0.0%) | 0 (0.0%) |
| 16 and 17 Years | 25 (100.0%) | 31 (100.0%) |
| 18 to 24 Years | 18 (100.0%) | 57 (100.0%) |
| 25 to 34 Years | 7 (100.0%) | 4 (100.0%) |
| 35 to 44 Years | 39 (100.0%) | 22 (100.0%) |
| 45 to 54 Years | 138 (100.0%) | 115 (100.0%) |
| 55 to 64 Years | 130 (100.0%) | 97 (100.0%) |
| 65 to 74 Years | 111 (93.3%) | 167 (100.0%) |
| 75 Years and over | 37 (68.5%) | 61 (47.7%) |
| Total | 559 (95.7%) | 586 (89.7%) |
Income Below Poverty Among Married-Couple Families in Wetherington
The poverty statistics for married-couple families in Wetherington show that 6.6% or 26 of the total 392 families live below the poverty line. Families with no children have the highest poverty rate of 7.8%, comprising of 26 families. On the other hand, families with 1 or 2 children have the lowest poverty rate of 0.0%, which includes 0 families.
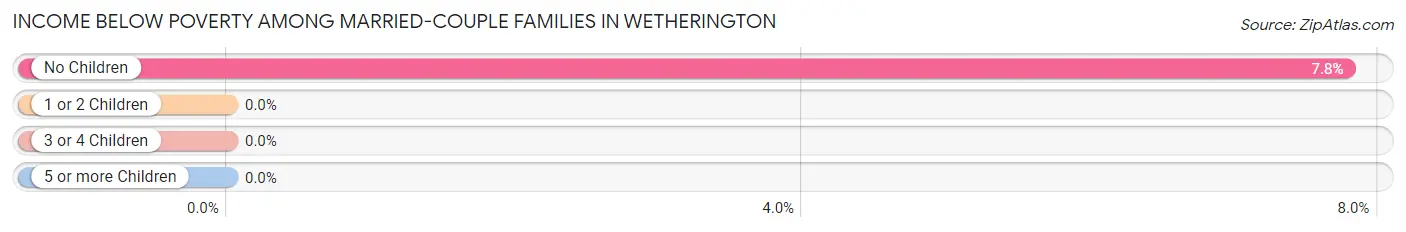
| Children | Above Poverty | Below Poverty |
| No Children | 308 (92.2%) | 26 (7.8%) |
| 1 or 2 Children | 48 (100.0%) | 0 (0.0%) |
| 3 or 4 Children | 10 (100.0%) | 0 (0.0%) |
| 5 or more Children | 0 (0.0%) | 0 (0.0%) |
| Total | 366 (93.4%) | 26 (6.6%) |
Income Below Poverty Among Single-Parent Households in Wetherington
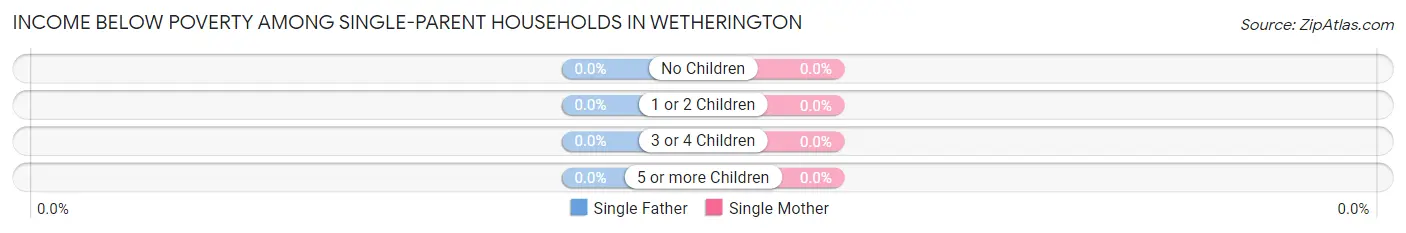
| Children | Single Father | Single Mother |
| No Children | 0 (0.0%) | 0 (0.0%) |
| 1 or 2 Children | 0 (0.0%) | 0 (0.0%) |
| 3 or 4 Children | 0 (0.0%) | 0 (0.0%) |
| 5 or more Children | 0 (0.0%) | 0 (0.0%) |
| Total | 0 (0.0%) | 0 (0.0%) |
Income Below Poverty Among Married-Couple vs Single-Parent Households in Wetherington
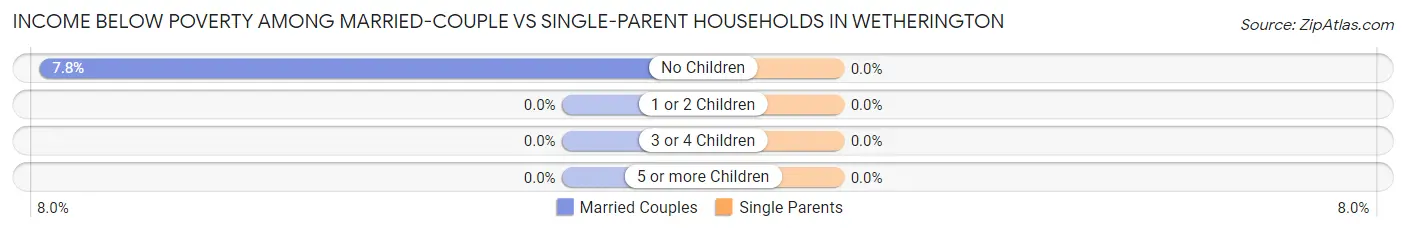
| Children | Married-Couple Families | Single-Parent Households |
| No Children | 26 (7.8%) | 0 (0.0%) |
| 1 or 2 Children | 0 (0.0%) | 0 (0.0%) |
| 3 or 4 Children | 0 (0.0%) | 0 (0.0%) |
| 5 or more Children | 0 (0.0%) | 0 (0.0%) |
| Total | 26 (6.6%) | 0 (0.0%) |
Race in Wetherington
The most populous races in Wetherington are White / Caucasian (1,016 | 82.1%), Asian (137 | 11.1%), and Black / African American (77 | 6.2%).
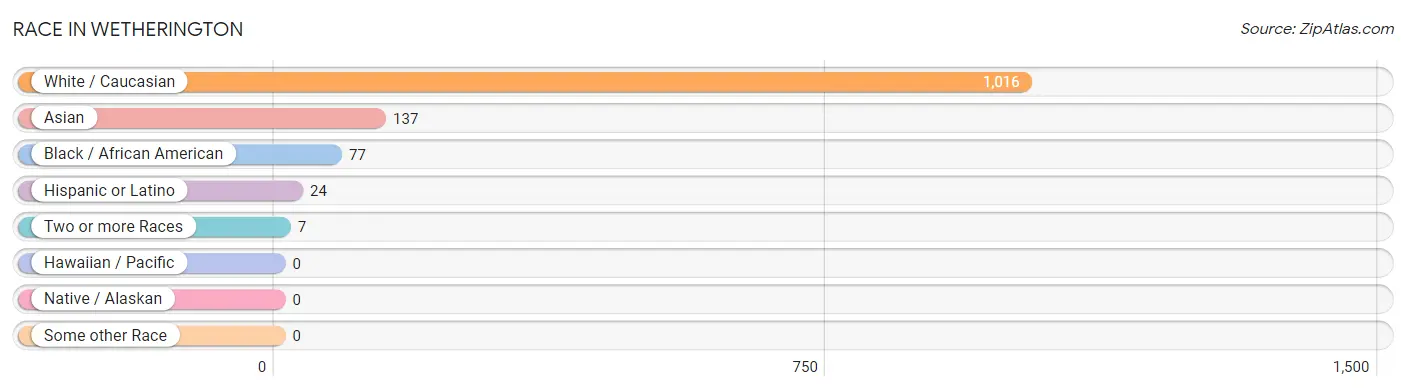
| Race | # Population | % Population |
| Asian | 137 | 11.1% |
| Black / African American | 77 | 6.2% |
| Hawaiian / Pacific | 0 | 0.0% |
| Hispanic or Latino | 24 | 1.9% |
| Native / Alaskan | 0 | 0.0% |
| White / Caucasian | 1,016 | 82.1% |
| Two or more Races | 7 | 0.6% |
| Some other Race | 0 | 0.0% |
| Total | 1,237 | 100.0% |
Ancestry in Wetherington
The most populous ancestries reported in Wetherington are German (361 | 29.2%), Irish (123 | 9.9%), Indian (Asian) (115 | 9.3%), Italian (115 | 9.3%), and English (103 | 8.3%), together accounting for 66.0% of all Wetherington residents.
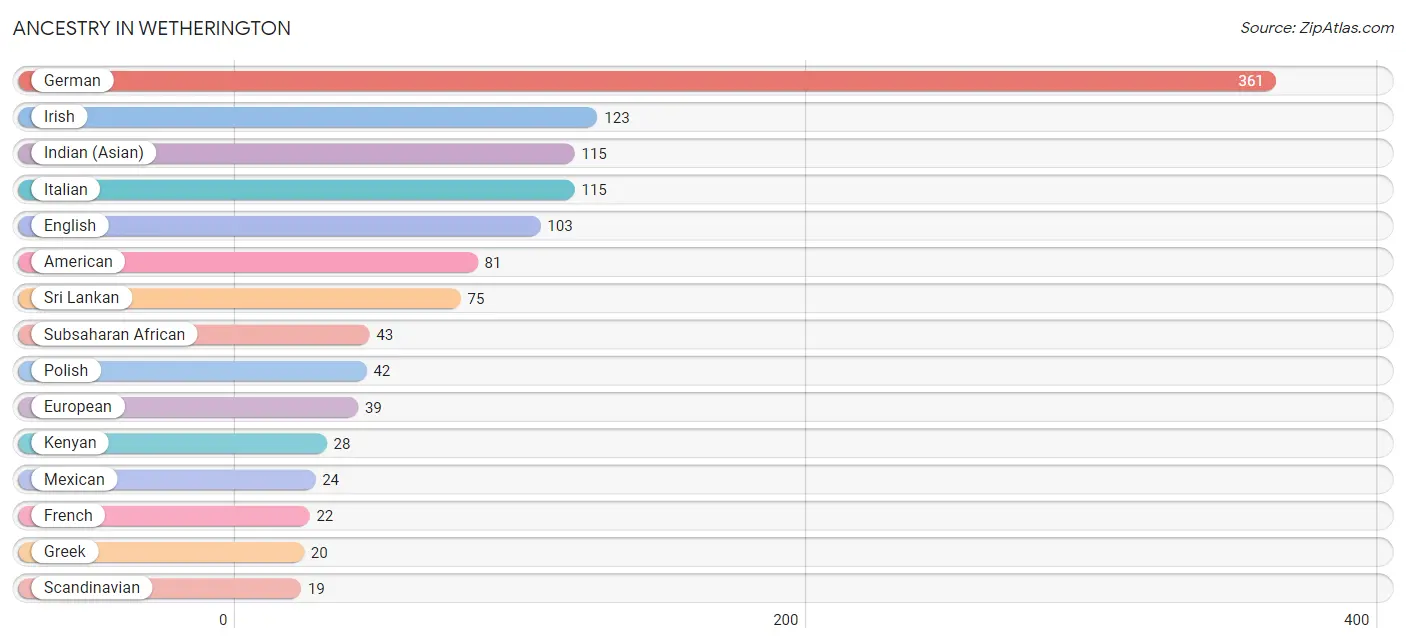
| Ancestry | # Population | % Population |
| African | 15 | 1.2% |
| American | 81 | 6.6% |
| Belgian | 7 | 0.6% |
| Czech | 9 | 0.7% |
| Dutch | 11 | 0.9% |
| English | 103 | 8.3% |
| European | 39 | 3.2% |
| French | 22 | 1.8% |
| German | 361 | 29.2% |
| Greek | 20 | 1.6% |
| Hungarian | 13 | 1.1% |
| Indian (Asian) | 115 | 9.3% |
| Irish | 123 | 9.9% |
| Italian | 115 | 9.3% |
| Kenyan | 28 | 2.3% |
| Mexican | 24 | 1.9% |
| Polish | 42 | 3.4% |
| Scandinavian | 19 | 1.5% |
| Scottish | 7 | 0.6% |
| Sioux | 4 | 0.3% |
| Slovak | 9 | 0.7% |
| Slovene | 8 | 0.6% |
| Sri Lankan | 75 | 6.1% |
| Subsaharan African | 43 | 3.5% |
| Swedish | 5 | 0.4% |
| Thai | 12 | 1.0% | View All 26 Rows |
Immigrants in Wetherington
The most numerous immigrant groups reported in Wetherington came from Asia (67 | 5.4%), China (36 | 2.9%), Eastern Asia (36 | 2.9%), Africa (28 | 2.3%), and Eastern Africa (28 | 2.3%), together accounting for 15.8% of all Wetherington residents.
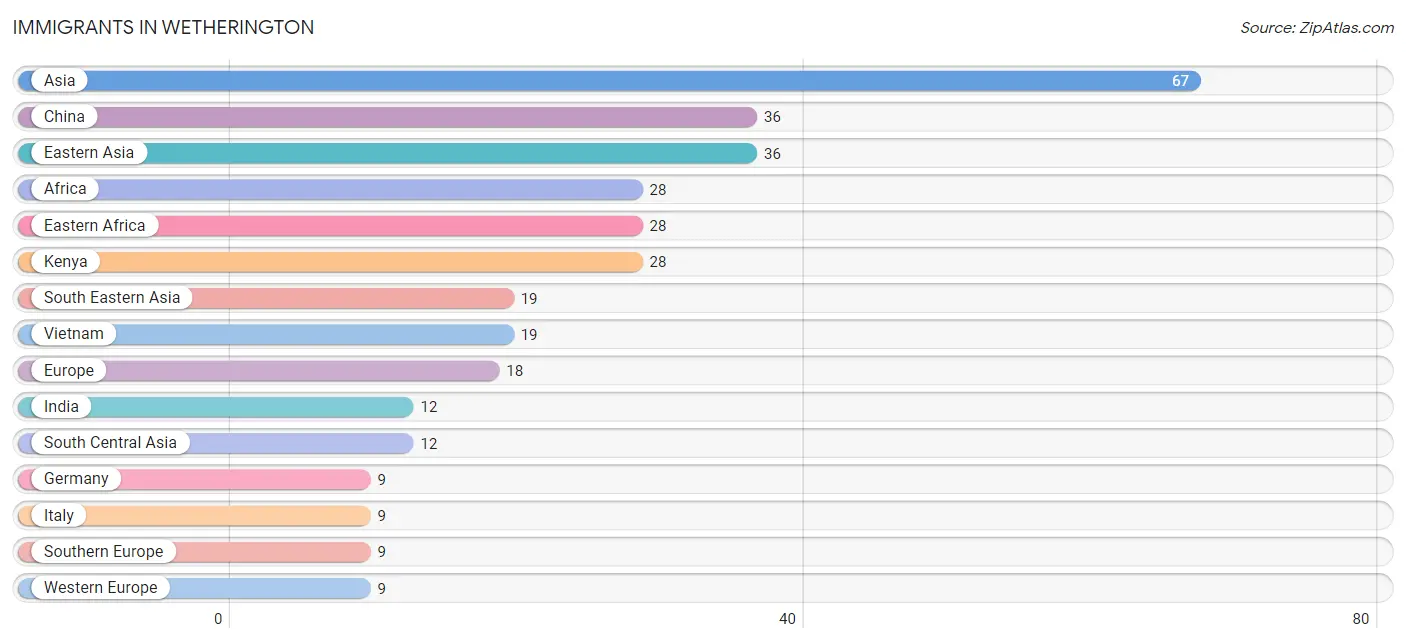
| Immigration Origin | # Population | % Population |
| Africa | 28 | 2.3% |
| Asia | 67 | 5.4% |
| Central America | 3 | 0.2% |
| China | 36 | 2.9% |
| Eastern Africa | 28 | 2.3% |
| Eastern Asia | 36 | 2.9% |
| Europe | 18 | 1.5% |
| Germany | 9 | 0.7% |
| India | 12 | 1.0% |
| Italy | 9 | 0.7% |
| Kenya | 28 | 2.3% |
| Latin America | 3 | 0.2% |
| Mexico | 3 | 0.2% |
| South Central Asia | 12 | 1.0% |
| South Eastern Asia | 19 | 1.5% |
| Southern Europe | 9 | 0.7% |
| Vietnam | 19 | 1.5% |
| Western Europe | 9 | 0.7% | View All 18 Rows |
Sex and Age in Wetherington
Sex and Age in Wetherington
The most populous age groups in Wetherington are 50 to 54 Years (93 | 15.9%) for men and 75 to 79 Years (92 | 14.1%) for women.
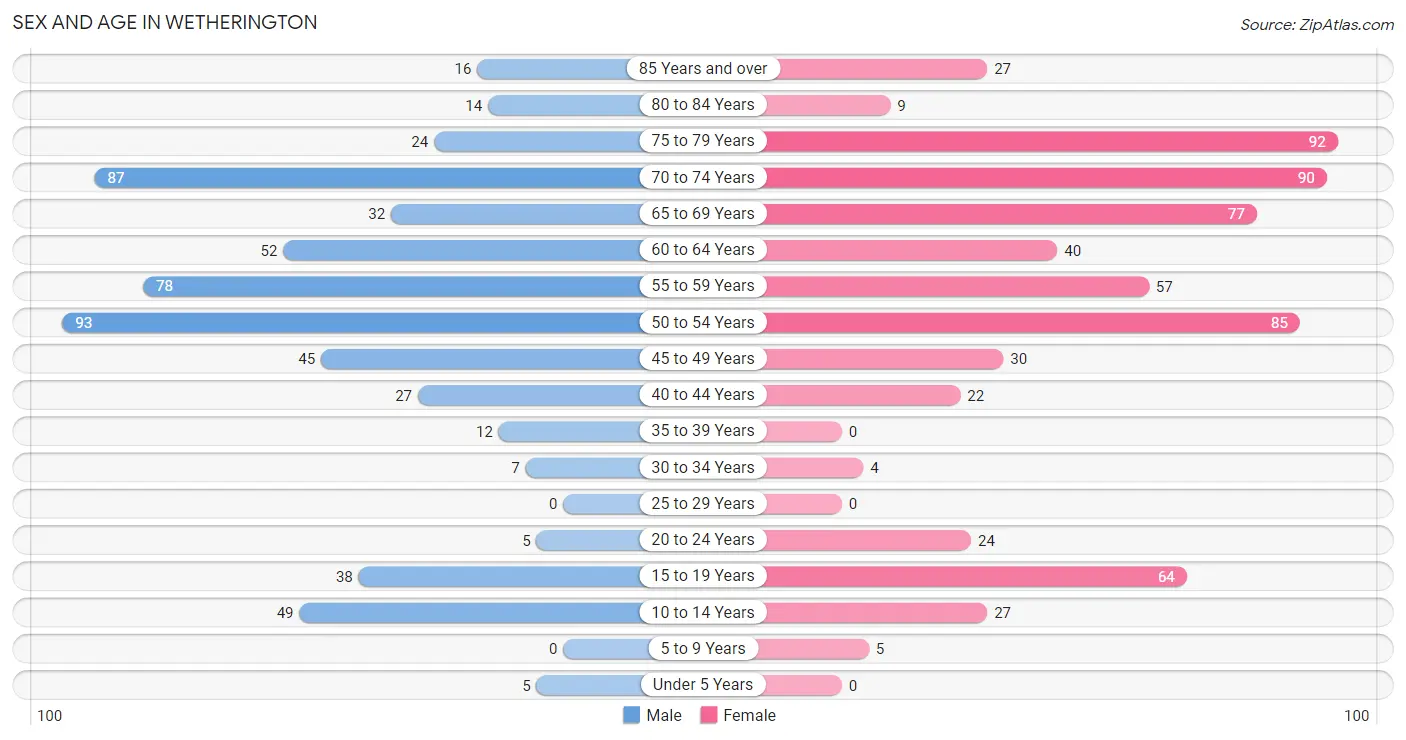
| Age Bracket | Male | Female |
| Under 5 Years | 5 (0.9%) | 0 (0.0%) |
| 5 to 9 Years | 0 (0.0%) | 5 (0.8%) |
| 10 to 14 Years | 49 (8.4%) | 27 (4.1%) |
| 15 to 19 Years | 38 (6.5%) | 64 (9.8%) |
| 20 to 24 Years | 5 (0.9%) | 24 (3.7%) |
| 25 to 29 Years | 0 (0.0%) | 0 (0.0%) |
| 30 to 34 Years | 7 (1.2%) | 4 (0.6%) |
| 35 to 39 Years | 12 (2.1%) | 0 (0.0%) |
| 40 to 44 Years | 27 (4.6%) | 22 (3.4%) |
| 45 to 49 Years | 45 (7.7%) | 30 (4.6%) |
| 50 to 54 Years | 93 (15.9%) | 85 (13.0%) |
| 55 to 59 Years | 78 (13.4%) | 57 (8.7%) |
| 60 to 64 Years | 52 (8.9%) | 40 (6.1%) |
| 65 to 69 Years | 32 (5.5%) | 77 (11.8%) |
| 70 to 74 Years | 87 (14.9%) | 90 (13.8%) |
| 75 to 79 Years | 24 (4.1%) | 92 (14.1%) |
| 80 to 84 Years | 14 (2.4%) | 9 (1.4%) |
| 85 Years and over | 16 (2.7%) | 27 (4.1%) |
| Total | 584 (100.0%) | 653 (100.0%) |
Families and Households in Wetherington
Median Family Size in Wetherington
The median family size in Wetherington is 2.60 persons per family, with single male/father families (5 | 1.2%) accounting for the largest median family size of 5.4 persons per family. On the other hand, married-couple families (392 | 97.5%) represent the smallest median family size with 2.55 persons per family.
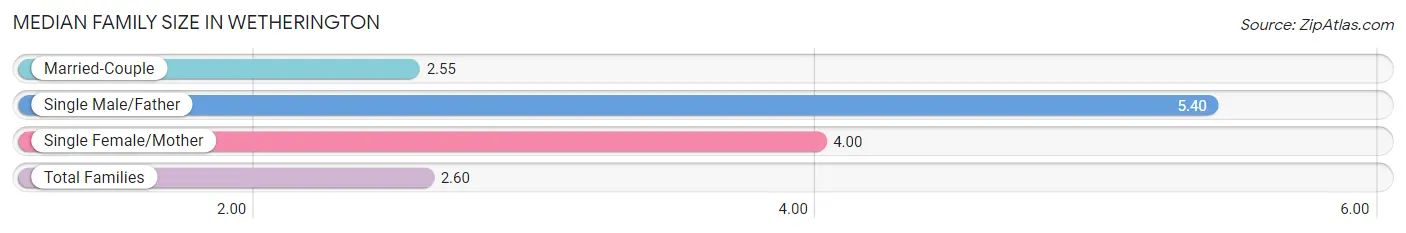
| Family Type | # Families | Family Size |
| Married-Couple | 392 (97.5%) | 2.55 |
| Single Male/Father | 5 (1.2%) | 5.40 |
| Single Female/Mother | 5 (1.2%) | 4.00 |
| Total Families | 402 (100.0%) | 2.60 |
Median Household Size in Wetherington
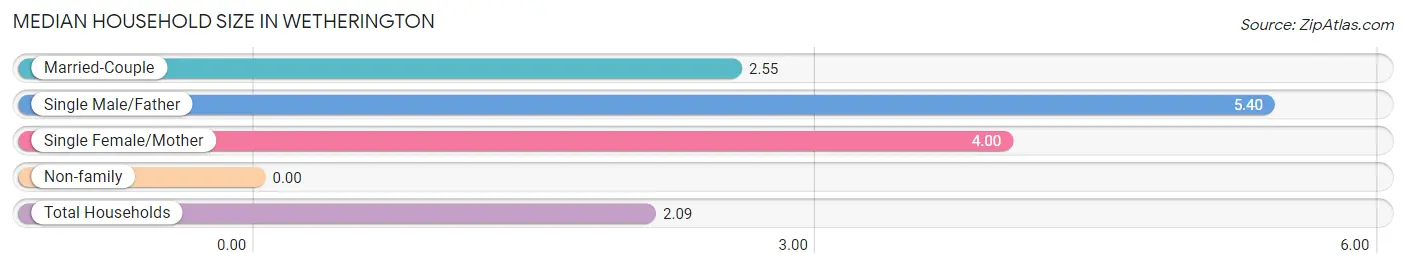
| Household Type | # Households | Household Size |
| Married-Couple | 392 (66.1%) | 2.55 |
| Single Male/Father | 5 (0.8%) | 5.40 |
| Single Female/Mother | 5 (0.8%) | 4.00 |
| Non-family | 191 (32.2%) | - |
| Total Households | 593 (100.0%) | 2.09 |
Household Size by Marriage Status in Wetherington
Out of a total of 593 households in Wetherington, 402 (67.8%) are family households, while 191 (32.2%) are nonfamily households. The most numerous type of family households are 2-person households, comprising 294, and the most common type of nonfamily households are 1-person households, comprising 191.
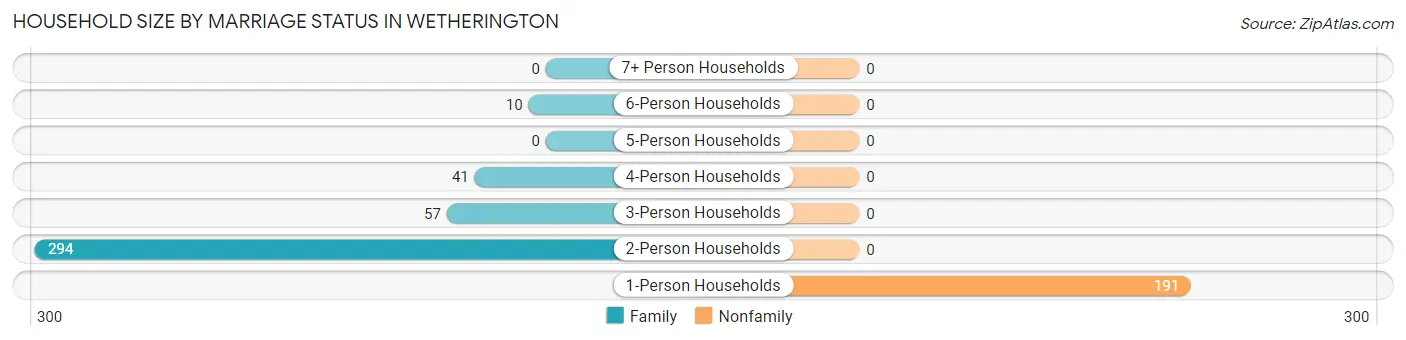
| Household Size | Family Households | Nonfamily Households |
| 1-Person Households | - | 191 (32.2%) |
| 2-Person Households | 294 (49.6%) | 0 (0.0%) |
| 3-Person Households | 57 (9.6%) | 0 (0.0%) |
| 4-Person Households | 41 (6.9%) | 0 (0.0%) |
| 5-Person Households | 0 (0.0%) | 0 (0.0%) |
| 6-Person Households | 10 (1.7%) | 0 (0.0%) |
| 7+ Person Households | 0 (0.0%) | 0 (0.0%) |
| Total | 402 (67.8%) | 191 (32.2%) |
Female Fertility in Wetherington
Fertility by Age in Wetherington
| Age Bracket | Women with Births | Births / 1,000 Women |
| 15 to 19 years | 0 (0.0%) | 0.0 |
| 20 to 34 years | 0 (0.0%) | 0.0 |
| 35 to 50 years | 0 (0.0%) | 0.0 |
| Total | 0 (0.0%) | 0.0 |
Fertility by Age by Marriage Status in Wetherington
| Age Bracket | Married | Unmarried |
| 15 to 19 years | 0 (0.0%) | 0 (0.0%) |
| 20 to 34 years | 0 (0.0%) | 0 (0.0%) |
| 35 to 50 years | 0 (0.0%) | 0 (0.0%) |
| Total | 0 (0.0%) | 0 (0.0%) |
Fertility by Education in Wetherington
| Educational Attainment | Women with Births | Births / 1,000 Women |
| Less than High School | 0 (0.0%) | 0.0 |
| High School Diploma | 0 (0.0%) | 0.0 |
| College or Associate's Degree | 0 (0.0%) | 0.0 |
| Bachelor's Degree | 0 (0.0%) | 0.0 |
| Graduate Degree | 0 (0.0%) | 0.0 |
| Total | 0 (0.0%) | 0.0 |
Fertility by Education by Marriage Status in Wetherington
| Educational Attainment | Married | Unmarried |
| Less than High School | 0 (0.0%) | 0 (0.0%) |
| High School Diploma | 0 (0.0%) | 0 (0.0%) |
| College or Associate's Degree | 0 (0.0%) | 0 (0.0%) |
| Bachelor's Degree | 0 (0.0%) | 0 (0.0%) |
| Graduate Degree | 0 (0.0%) | 0 (0.0%) |
| Total | 0 (0.0%) | 0 (0.0%) |
Employment Characteristics in Wetherington
Employment by Class of Employer in Wetherington
Among the 559 employed individuals in Wetherington, private company employees (414 | 74.1%), self-employed (incorporated) (89 | 15.9%), and state government employees (18 | 3.2%) make up the most common classes of employment.
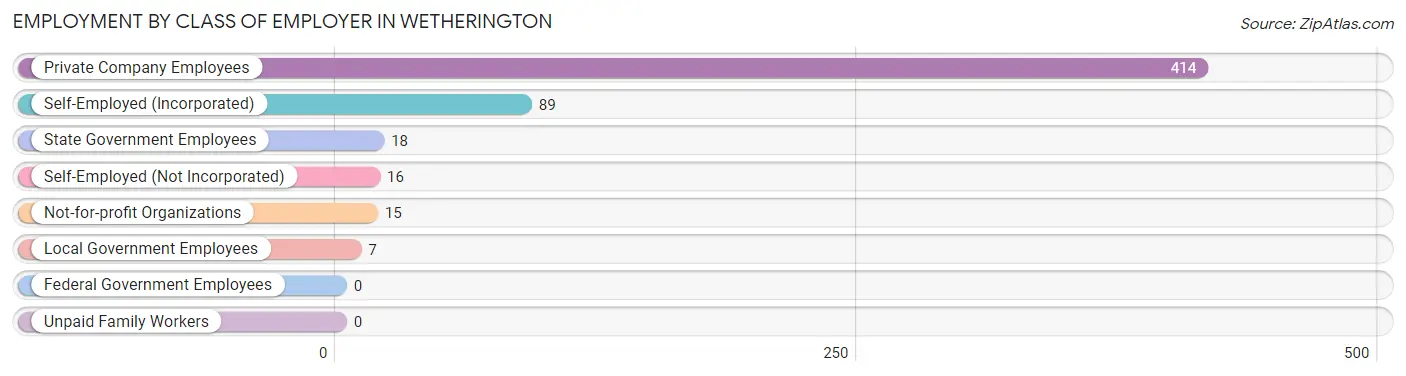
| Employer Class | # Employees | % Employees |
| Private Company Employees | 414 | 74.1% |
| Self-Employed (Incorporated) | 89 | 15.9% |
| Self-Employed (Not Incorporated) | 16 | 2.9% |
| Not-for-profit Organizations | 15 | 2.7% |
| Local Government Employees | 7 | 1.3% |
| State Government Employees | 18 | 3.2% |
| Federal Government Employees | 0 | 0.0% |
| Unpaid Family Workers | 0 | 0.0% |
| Total | 559 | 100.0% |
Employment Status by Age in Wetherington
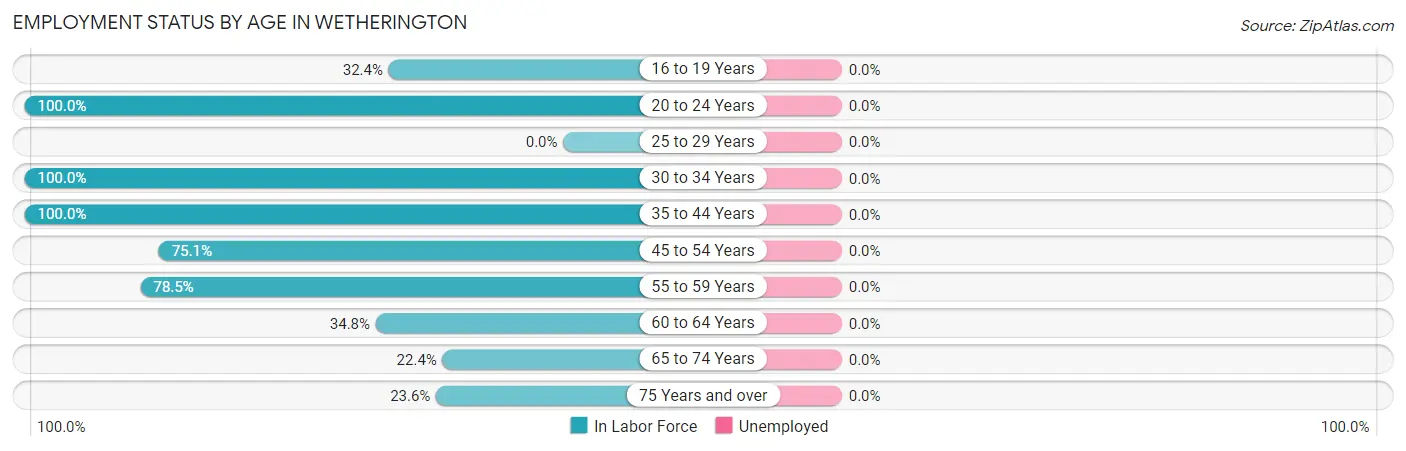
| Age Bracket | In Labor Force | Unemployed |
| 16 to 19 Years | 33 (32.4%) | 0 (0.0%) |
| 20 to 24 Years | 29 (100.0%) | 0 (0.0%) |
| 25 to 29 Years | 0 (0.0%) | 0 (0.0%) |
| 30 to 34 Years | 11 (100.0%) | 0 (0.0%) |
| 35 to 44 Years | 61 (100.0%) | 0 (0.0%) |
| 45 to 54 Years | 190 (75.1%) | 0 (0.0%) |
| 55 to 59 Years | 106 (78.5%) | 0 (0.0%) |
| 60 to 64 Years | 32 (34.8%) | 0 (0.0%) |
| 65 to 74 Years | 64 (22.4%) | 0 (0.0%) |
| 75 Years and over | 43 (23.6%) | 0 (0.0%) |
| Total | 569 (49.4%) | 0 (0.0%) |
Employment Status by Educational Attainment in Wetherington
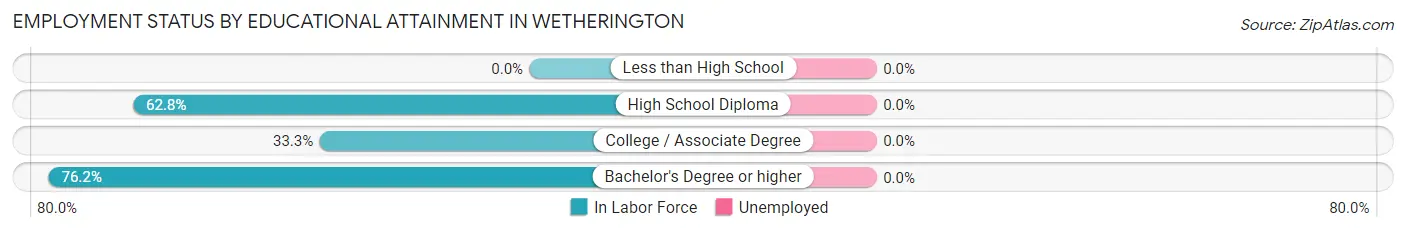
| Educational Attainment | In Labor Force | Unemployed |
| Less than High School | 0 (0.0%) | 0 (0.0%) |
| High School Diploma | 54 (62.8%) | 0 (0.0%) |
| College / Associate Degree | 7 (33.3%) | 0 (0.0%) |
| Bachelor's Degree or higher | 339 (76.2%) | 0 (0.0%) |
| Total | 400 (72.5%) | 0 (0.0%) |
Employment Occupations by Sex in Wetherington
Management, Business, Science and Arts Occupations
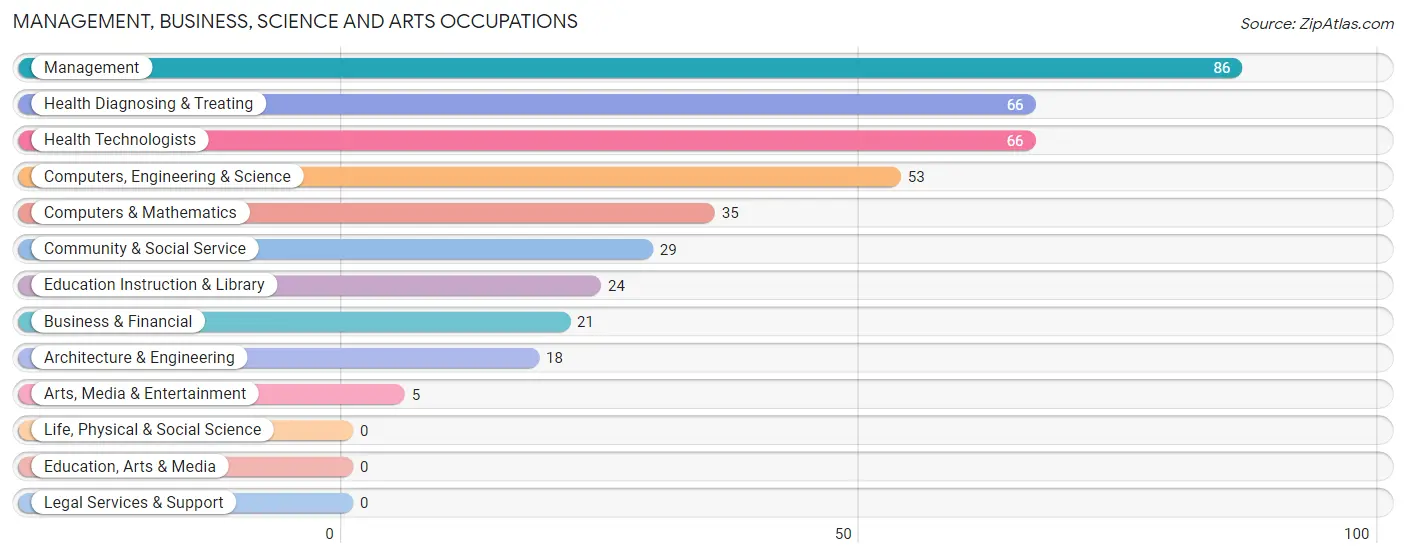
The most common Management, Business, Science and Arts occupations in Wetherington are Management (86 | 15.1%), Health Diagnosing & Treating (66 | 11.6%), Health Technologists (66 | 11.6%), Computers, Engineering & Science (53 | 9.3%), and Computers & Mathematics (35 | 6.1%).
Management, Business, Science and Arts Occupations by Sex
Within the Management, Business, Science and Arts occupations in Wetherington, the most male-oriented occupations are Architecture & Engineering (100.0%), Management (86.1%), and Computers, Engineering & Science (75.5%), while the most female-oriented occupations are Arts, Media & Entertainment (100.0%), Community & Social Service (41.4%), and Business & Financial (38.1%).
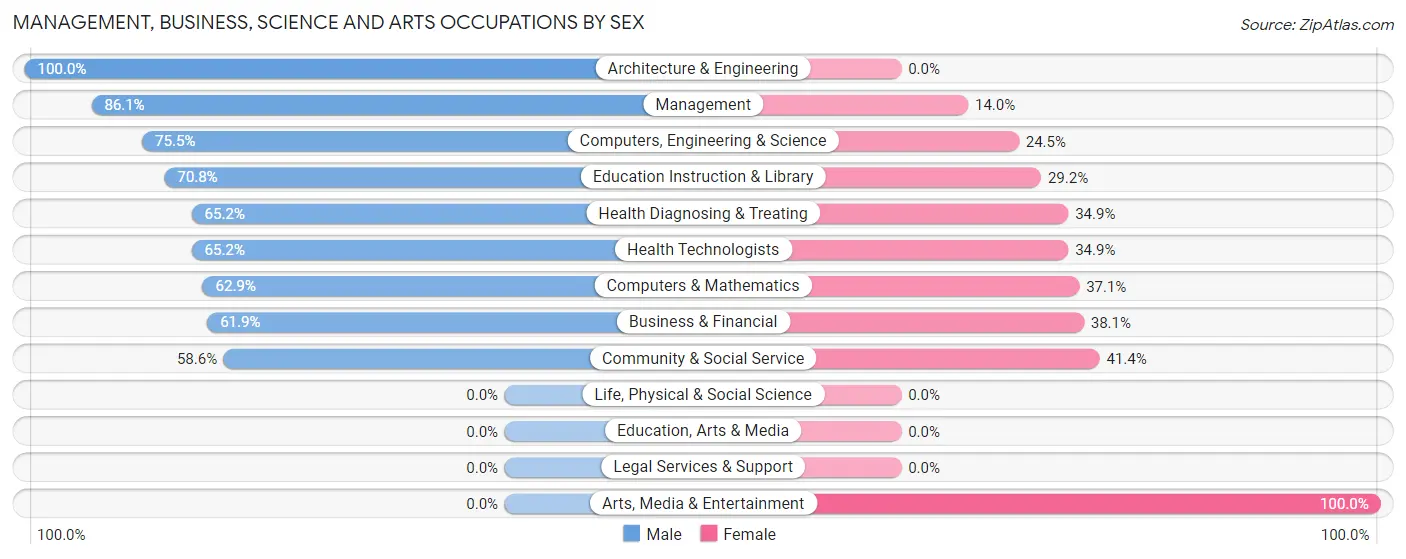
| Occupation | Male | Female |
| Management | 74 (86.1%) | 12 (14.0%) |
| Business & Financial | 13 (61.9%) | 8 (38.1%) |
| Computers, Engineering & Science | 40 (75.5%) | 13 (24.5%) |
| Computers & Mathematics | 22 (62.9%) | 13 (37.1%) |
| Architecture & Engineering | 18 (100.0%) | 0 (0.0%) |
| Life, Physical & Social Science | 0 (0.0%) | 0 (0.0%) |
| Community & Social Service | 17 (58.6%) | 12 (41.4%) |
| Education, Arts & Media | 0 (0.0%) | 0 (0.0%) |
| Legal Services & Support | 0 (0.0%) | 0 (0.0%) |
| Education Instruction & Library | 17 (70.8%) | 7 (29.2%) |
| Arts, Media & Entertainment | 0 (0.0%) | 5 (100.0%) |
| Health Diagnosing & Treating | 43 (65.1%) | 23 (34.8%) |
| Health Technologists | 43 (65.1%) | 23 (34.8%) |
| Total (Category) | 187 (73.3%) | 68 (26.7%) |
| Total (Overall) | 323 (56.8%) | 246 (43.2%) |
Services Occupations
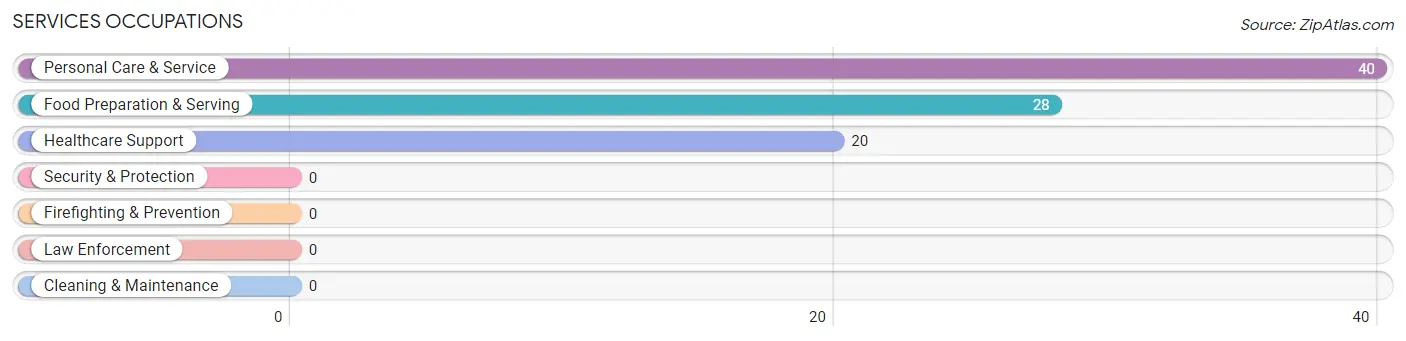
The most common Services occupations in Wetherington are Personal Care & Service (40 | 7.0%), Food Preparation & Serving (28 | 4.9%), and Healthcare Support (20 | 3.5%).
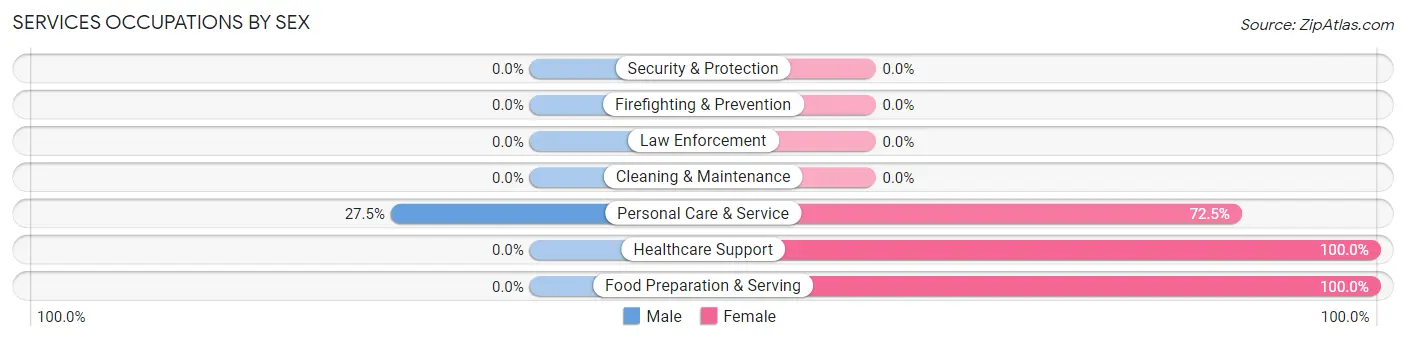
Services Occupations by Sex
| Occupation | Male | Female |
| Healthcare Support | 0 (0.0%) | 20 (100.0%) |
| Security & Protection | 0 (0.0%) | 0 (0.0%) |
| Firefighting & Prevention | 0 (0.0%) | 0 (0.0%) |
| Law Enforcement | 0 (0.0%) | 0 (0.0%) |
| Food Preparation & Serving | 0 (0.0%) | 28 (100.0%) |
| Cleaning & Maintenance | 0 (0.0%) | 0 (0.0%) |
| Personal Care & Service | 11 (27.5%) | 29 (72.5%) |
| Total (Category) | 11 (12.5%) | 77 (87.5%) |
| Total (Overall) | 323 (56.8%) | 246 (43.2%) |
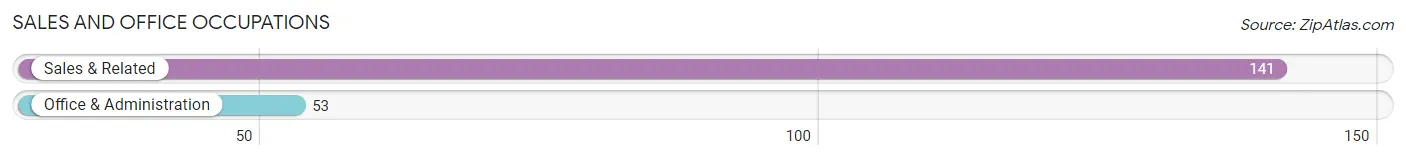
Sales and Office Occupations
The most common Sales and Office occupations in Wetherington are Sales & Related (141 | 24.8%), and Office & Administration (53 | 9.3%).
Sales and Office Occupations by Sex
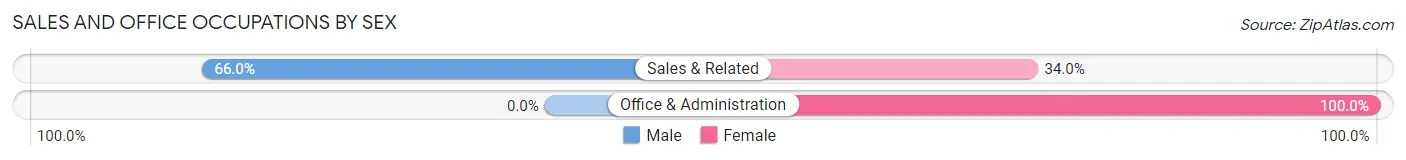
| Occupation | Male | Female |
| Sales & Related | 93 (66.0%) | 48 (34.0%) |
| Office & Administration | 0 (0.0%) | 53 (100.0%) |
| Total (Category) | 93 (47.9%) | 101 (52.1%) |
| Total (Overall) | 323 (56.8%) | 246 (43.2%) |
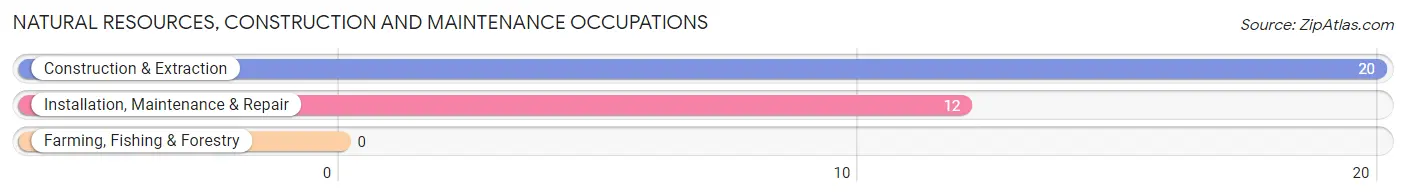
Natural Resources, Construction and Maintenance Occupations
The most common Natural Resources, Construction and Maintenance occupations in Wetherington are Construction & Extraction (20 | 3.5%), and Installation, Maintenance & Repair (12 | 2.1%).
Natural Resources, Construction and Maintenance Occupations by Sex
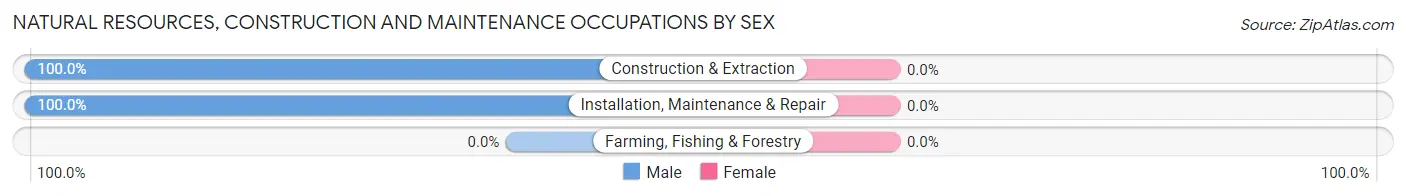
| Occupation | Male | Female |
| Farming, Fishing & Forestry | 0 (0.0%) | 0 (0.0%) |
| Construction & Extraction | 20 (100.0%) | 0 (0.0%) |
| Installation, Maintenance & Repair | 12 (100.0%) | 0 (0.0%) |
| Total (Category) | 32 (100.0%) | 0 (0.0%) |
| Total (Overall) | 323 (56.8%) | 246 (43.2%) |
Production, Transportation and Moving Occupations
Production, Transportation and Moving Occupations by Sex
| Occupation | Male | Female |
| Production | 0 (0.0%) | 0 (0.0%) |
| Transportation | 0 (0.0%) | 0 (0.0%) |
| Material Moving | 0 (0.0%) | 0 (0.0%) |
| Total (Category) | 0 (0.0%) | 0 (0.0%) |
| Total (Overall) | 323 (56.8%) | 246 (43.2%) |
Employment Industries by Sex in Wetherington
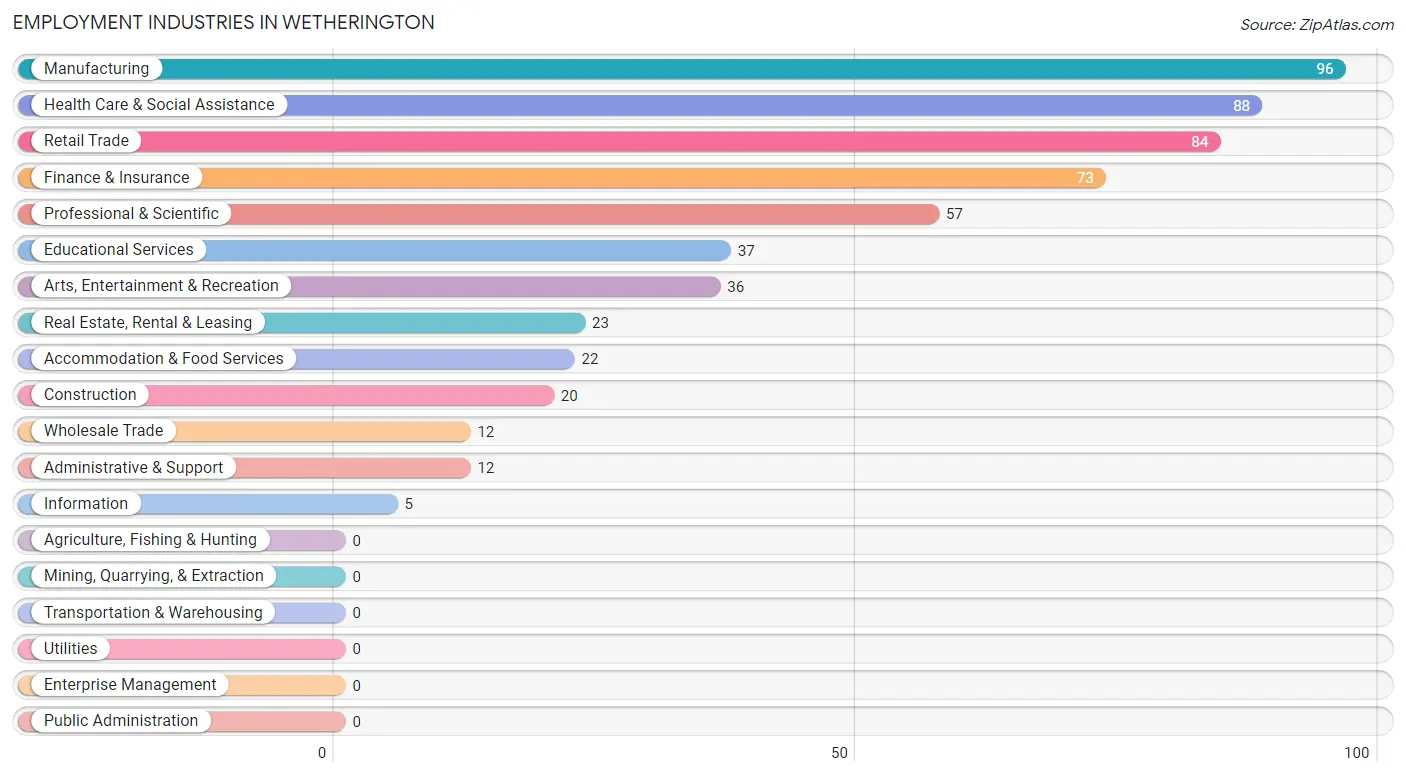
Employment Industries in Wetherington
The major employment industries in Wetherington include Manufacturing (96 | 16.9%), Health Care & Social Assistance (88 | 15.5%), Retail Trade (84 | 14.8%), Finance & Insurance (73 | 12.8%), and Professional & Scientific (57 | 10.0%).
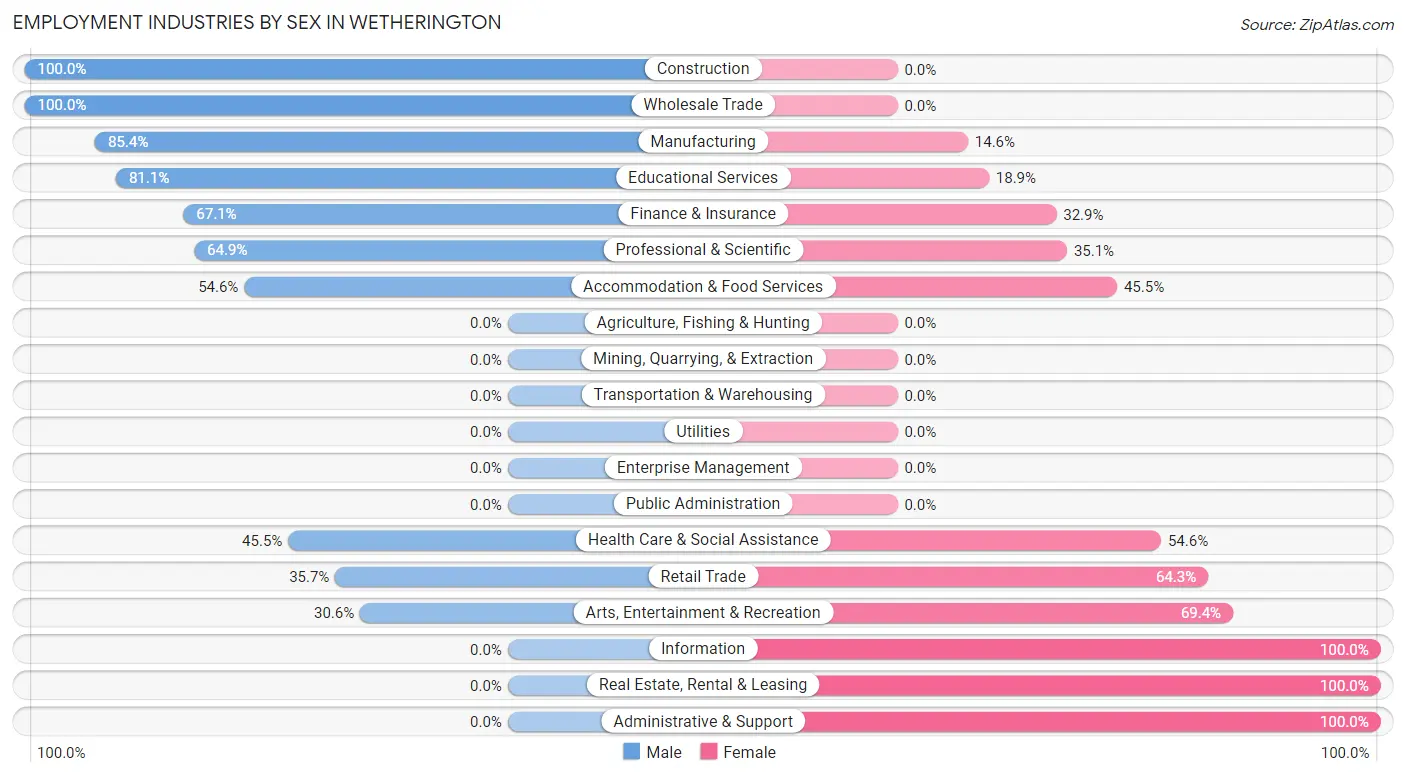
Employment Industries by Sex in Wetherington
The Wetherington industries that see more men than women are Construction (100.0%), Wholesale Trade (100.0%), and Manufacturing (85.4%), whereas the industries that tend to have a higher number of women are Information (100.0%), Real Estate, Rental & Leasing (100.0%), and Administrative & Support (100.0%).
| Industry | Male | Female |
| Agriculture, Fishing & Hunting | 0 (0.0%) | 0 (0.0%) |
| Mining, Quarrying, & Extraction | 0 (0.0%) | 0 (0.0%) |
| Construction | 20 (100.0%) | 0 (0.0%) |
| Manufacturing | 82 (85.4%) | 14 (14.6%) |
| Wholesale Trade | 12 (100.0%) | 0 (0.0%) |
| Retail Trade | 30 (35.7%) | 54 (64.3%) |
| Transportation & Warehousing | 0 (0.0%) | 0 (0.0%) |
| Utilities | 0 (0.0%) | 0 (0.0%) |
| Information | 0 (0.0%) | 5 (100.0%) |
| Finance & Insurance | 49 (67.1%) | 24 (32.9%) |
| Real Estate, Rental & Leasing | 0 (0.0%) | 23 (100.0%) |
| Professional & Scientific | 37 (64.9%) | 20 (35.1%) |
| Enterprise Management | 0 (0.0%) | 0 (0.0%) |
| Administrative & Support | 0 (0.0%) | 12 (100.0%) |
| Educational Services | 30 (81.1%) | 7 (18.9%) |
| Health Care & Social Assistance | 40 (45.5%) | 48 (54.5%) |
| Arts, Entertainment & Recreation | 11 (30.6%) | 25 (69.4%) |
| Accommodation & Food Services | 12 (54.5%) | 10 (45.5%) |
| Public Administration | 0 (0.0%) | 0 (0.0%) |
| Total | 323 (56.8%) | 246 (43.2%) |
Education in Wetherington
School Enrollment in Wetherington
The most common levels of schooling among the 196 students in Wetherington are high school (90 | 45.9%), middle school (65 | 33.2%), and college / undergraduate (28 | 14.3%).
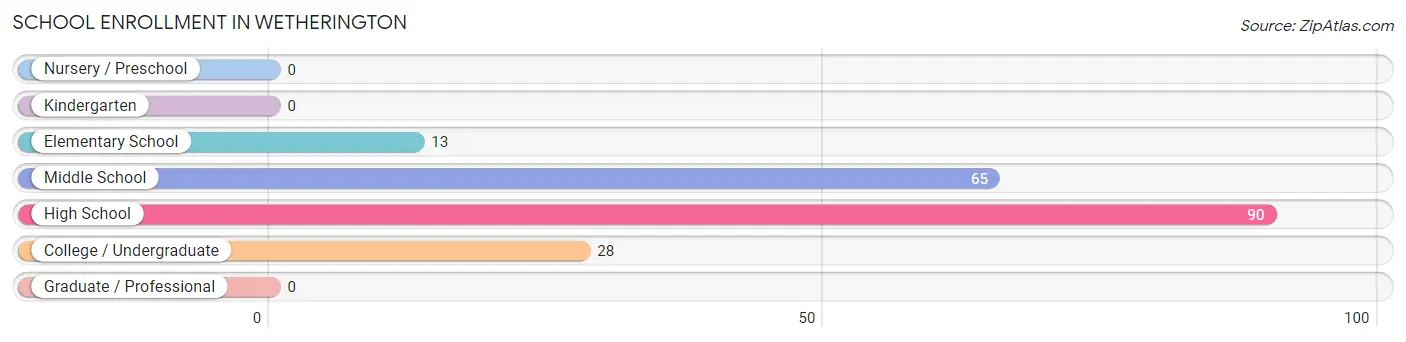
| School Level | # Students | % Students |
| Nursery / Preschool | 0 | 0.0% |
| Kindergarten | 0 | 0.0% |
| Elementary School | 13 | 6.6% |
| Middle School | 65 | 33.2% |
| High School | 90 | 45.9% |
| College / Undergraduate | 28 | 14.3% |
| Graduate / Professional | 0 | 0.0% |
| Total | 196 | 100.0% |
School Enrollment by Age by Funding Source in Wetherington
Out of a total of 196 students who are enrolled in schools in Wetherington, 155 (79.1%) attend a private institution, while the remaining 41 (20.9%) are enrolled in public schools. The age group of 5 to 9 year old has the highest likelihood of being enrolled in private schools, with 5 (100.0% in the age bracket) enrolled. Conversely, the age group of 20 to 24 year olds has the lowest likelihood of being enrolled in a private school, with 5 (100.0% in the age bracket) attending a public institution.
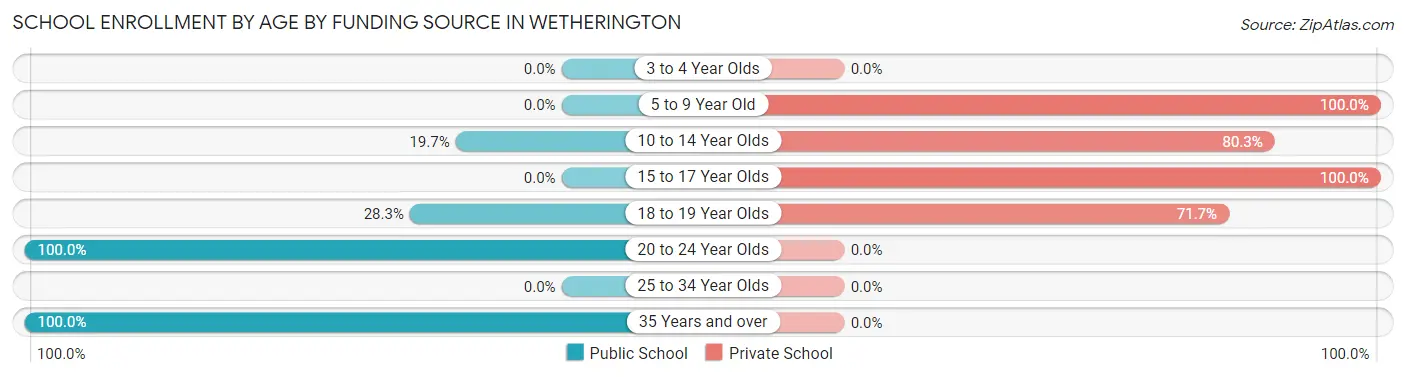
| Age Bracket | Public School | Private School |
| 3 to 4 Year Olds | 0 (0.0%) | 0 (0.0%) |
| 5 to 9 Year Old | 0 (0.0%) | 5 (100.0%) |
| 10 to 14 Year Olds | 15 (19.7%) | 61 (80.3%) |
| 15 to 17 Year Olds | 0 (0.0%) | 56 (100.0%) |
| 18 to 19 Year Olds | 13 (28.3%) | 33 (71.7%) |
| 20 to 24 Year Olds | 5 (100.0%) | 0 (0.0%) |
| 25 to 34 Year Olds | 0 (0.0%) | 0 (0.0%) |
| 35 Years and over | 8 (100.0%) | 0 (0.0%) |
| Total | 41 (20.9%) | 155 (79.1%) |
Educational Attainment by Field of Study in Wetherington
Business (216 | 31.1%), engineering (111 | 16.0%), science & technology (74 | 10.6%), education (74 | 10.6%), and arts & humanities (45 | 6.5%) are the most common fields of study among 695 individuals in Wetherington who have obtained a bachelor's degree or higher.
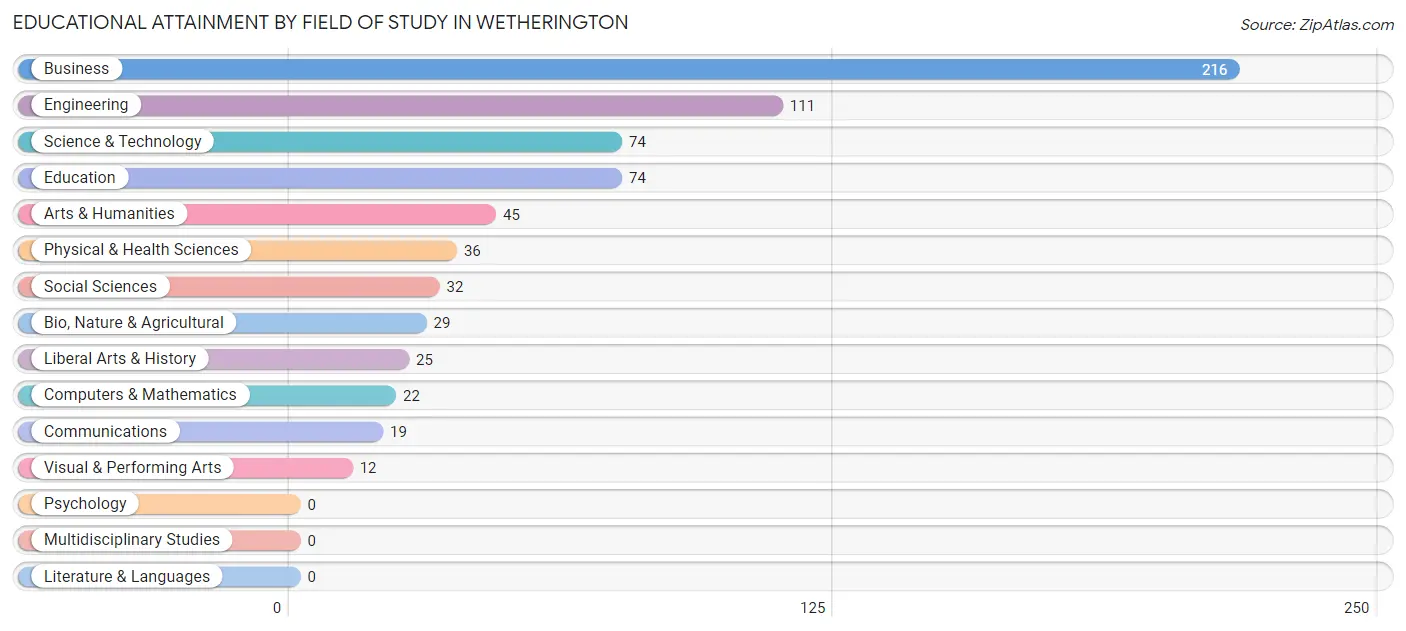
| Field of Study | # Graduates | % Graduates |
| Computers & Mathematics | 22 | 3.2% |
| Bio, Nature & Agricultural | 29 | 4.2% |
| Physical & Health Sciences | 36 | 5.2% |
| Psychology | 0 | 0.0% |
| Social Sciences | 32 | 4.6% |
| Engineering | 111 | 16.0% |
| Multidisciplinary Studies | 0 | 0.0% |
| Science & Technology | 74 | 10.6% |
| Business | 216 | 31.1% |
| Education | 74 | 10.6% |
| Literature & Languages | 0 | 0.0% |
| Liberal Arts & History | 25 | 3.6% |
| Visual & Performing Arts | 12 | 1.7% |
| Communications | 19 | 2.7% |
| Arts & Humanities | 45 | 6.5% |
| Total | 695 | 100.0% |
Transportation & Commute in Wetherington
Vehicle Availability by Sex in Wetherington
The most prevalent vehicle ownership categories in Wetherington are males with 2 vehicles (121, accounting for 37.5%) and females with 2 vehicles (74, making up 51.3%).
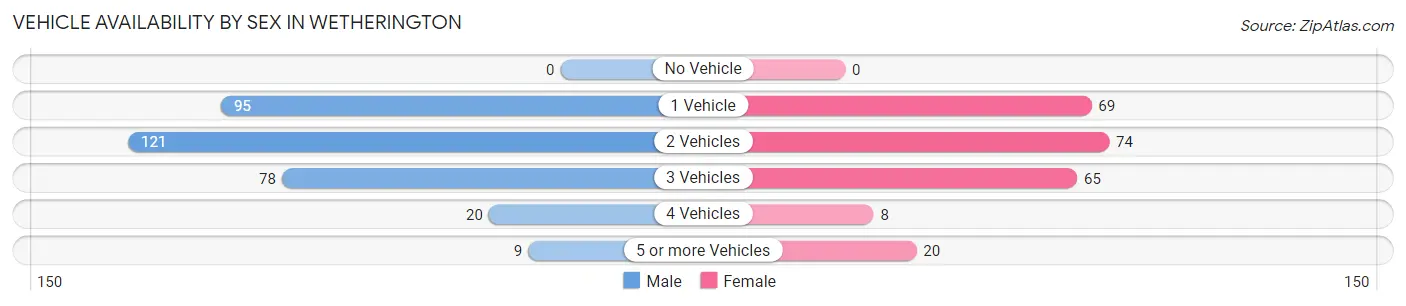
| Vehicles Available | Male | Female |
| No Vehicle | 0 (0.0%) | 0 (0.0%) |
| 1 Vehicle | 95 (29.4%) | 69 (29.2%) |
| 2 Vehicles | 121 (37.5%) | 74 (31.4%) |
| 3 Vehicles | 78 (24.1%) | 65 (27.5%) |
| 4 Vehicles | 20 (6.2%) | 8 (3.4%) |
| 5 or more Vehicles | 9 (2.8%) | 20 (8.5%) |
| Total | 323 (100.0%) | 236 (100.0%) |
Commute Time in Wetherington
The most frequently occuring commute durations in Wetherington are 20 to 24 minutes (115 commuters, 26.3%), 30 to 34 minutes (90 commuters, 20.5%), and 10 to 14 minutes (80 commuters, 18.3%).
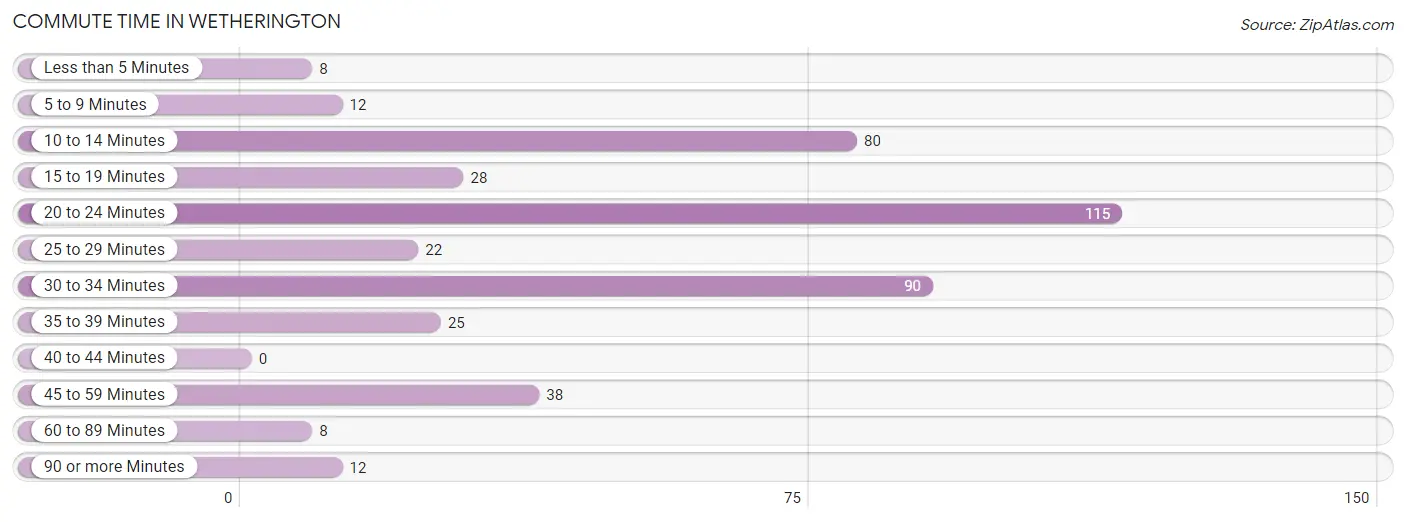
| Commute Time | # Commuters | % Commuters |
| Less than 5 Minutes | 8 | 1.8% |
| 5 to 9 Minutes | 12 | 2.7% |
| 10 to 14 Minutes | 80 | 18.3% |
| 15 to 19 Minutes | 28 | 6.4% |
| 20 to 24 Minutes | 115 | 26.3% |
| 25 to 29 Minutes | 22 | 5.0% |
| 30 to 34 Minutes | 90 | 20.5% |
| 35 to 39 Minutes | 25 | 5.7% |
| 40 to 44 Minutes | 0 | 0.0% |
| 45 to 59 Minutes | 38 | 8.7% |
| 60 to 89 Minutes | 8 | 1.8% |
| 90 or more Minutes | 12 | 2.7% |
Commute Time by Sex in Wetherington
The most common commute times in Wetherington are 20 to 24 minutes (64 commuters, 24.3%) for males and 20 to 24 minutes (51 commuters, 29.1%) for females.
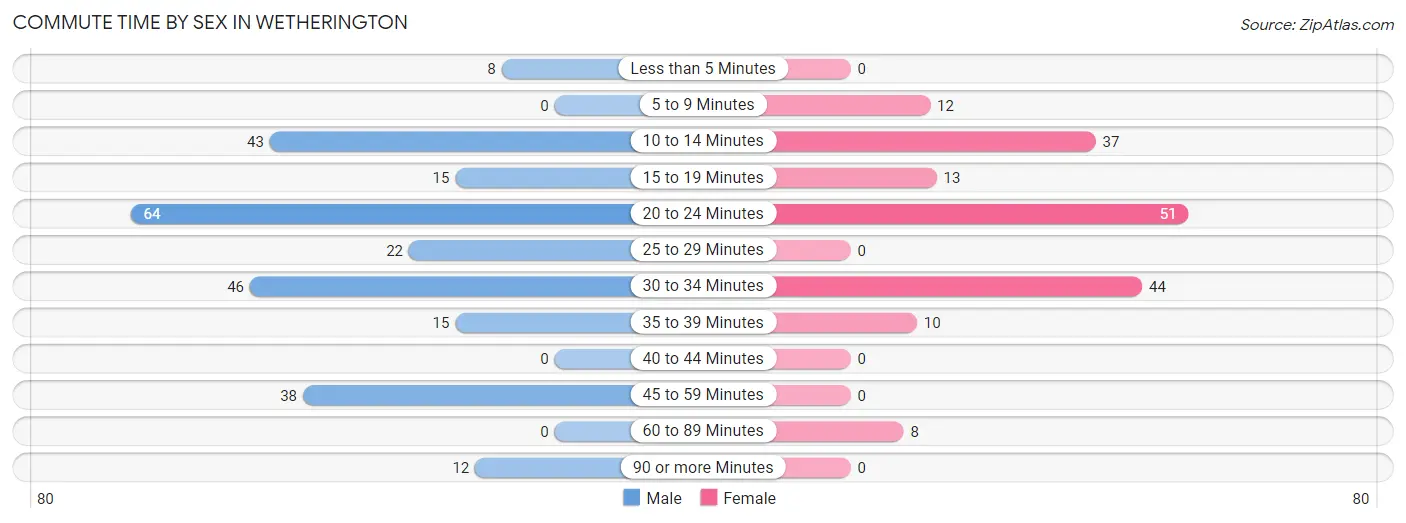
| Commute Time | Male | Female |
| Less than 5 Minutes | 8 (3.0%) | 0 (0.0%) |
| 5 to 9 Minutes | 0 (0.0%) | 12 (6.9%) |
| 10 to 14 Minutes | 43 (16.4%) | 37 (21.1%) |
| 15 to 19 Minutes | 15 (5.7%) | 13 (7.4%) |
| 20 to 24 Minutes | 64 (24.3%) | 51 (29.1%) |
| 25 to 29 Minutes | 22 (8.4%) | 0 (0.0%) |
| 30 to 34 Minutes | 46 (17.5%) | 44 (25.1%) |
| 35 to 39 Minutes | 15 (5.7%) | 10 (5.7%) |
| 40 to 44 Minutes | 0 (0.0%) | 0 (0.0%) |
| 45 to 59 Minutes | 38 (14.4%) | 0 (0.0%) |
| 60 to 89 Minutes | 0 (0.0%) | 8 (4.6%) |
| 90 or more Minutes | 12 (4.6%) | 0 (0.0%) |
Time of Departure to Work by Sex in Wetherington
The most frequent times of departure to work in Wetherington are 8:00 AM to 8:29 AM (78, 29.7%) for males and 8:30 AM to 8:59 AM (42, 24.0%) for females.
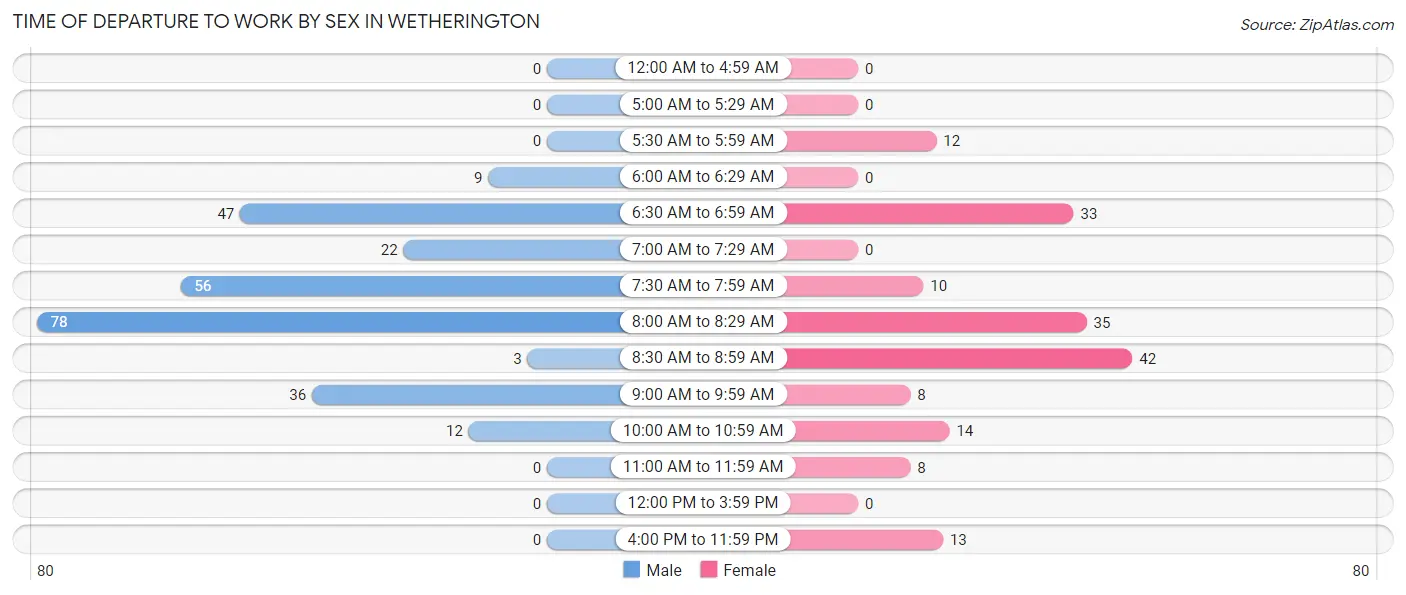
| Time of Departure | Male | Female |
| 12:00 AM to 4:59 AM | 0 (0.0%) | 0 (0.0%) |
| 5:00 AM to 5:29 AM | 0 (0.0%) | 0 (0.0%) |
| 5:30 AM to 5:59 AM | 0 (0.0%) | 12 (6.9%) |
| 6:00 AM to 6:29 AM | 9 (3.4%) | 0 (0.0%) |
| 6:30 AM to 6:59 AM | 47 (17.9%) | 33 (18.9%) |
| 7:00 AM to 7:29 AM | 22 (8.4%) | 0 (0.0%) |
| 7:30 AM to 7:59 AM | 56 (21.3%) | 10 (5.7%) |
| 8:00 AM to 8:29 AM | 78 (29.7%) | 35 (20.0%) |
| 8:30 AM to 8:59 AM | 3 (1.1%) | 42 (24.0%) |
| 9:00 AM to 9:59 AM | 36 (13.7%) | 8 (4.6%) |
| 10:00 AM to 10:59 AM | 12 (4.6%) | 14 (8.0%) |
| 11:00 AM to 11:59 AM | 0 (0.0%) | 8 (4.6%) |
| 12:00 PM to 3:59 PM | 0 (0.0%) | 0 (0.0%) |
| 4:00 PM to 11:59 PM | 0 (0.0%) | 13 (7.4%) |
| Total | 263 (100.0%) | 175 (100.0%) |
Housing Occupancy in Wetherington
Occupancy by Ownership in Wetherington
Of the total 593 dwellings in Wetherington, owner-occupied units account for 510 (86.0%), while renter-occupied units make up 83 (14.0%).
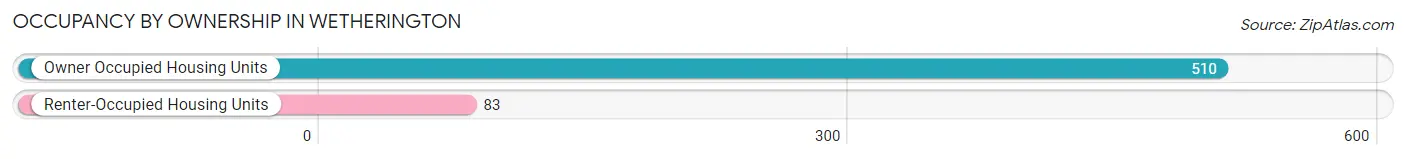
| Occupancy | # Housing Units | % Housing Units |
| Owner Occupied Housing Units | 510 | 86.0% |
| Renter-Occupied Housing Units | 83 | 14.0% |
| Total Occupied Housing Units | 593 | 100.0% |
Occupancy by Household Size in Wetherington
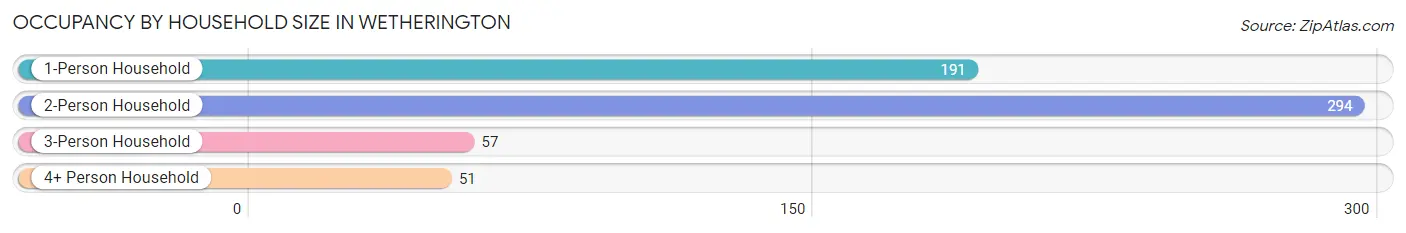
| Household Size | # Housing Units | % Housing Units |
| 1-Person Household | 191 | 32.2% |
| 2-Person Household | 294 | 49.6% |
| 3-Person Household | 57 | 9.6% |
| 4+ Person Household | 51 | 8.6% |
| Total Housing Units | 593 | 100.0% |
Occupancy by Ownership by Household Size in Wetherington
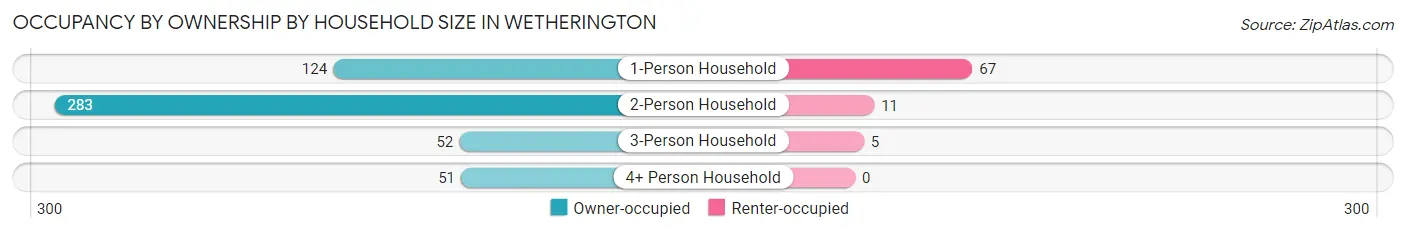
| Household Size | Owner-occupied | Renter-occupied |
| 1-Person Household | 124 (64.9%) | 67 (35.1%) |
| 2-Person Household | 283 (96.3%) | 11 (3.7%) |
| 3-Person Household | 52 (91.2%) | 5 (8.8%) |
| 4+ Person Household | 51 (100.0%) | 0 (0.0%) |
| Total Housing Units | 510 (86.0%) | 83 (14.0%) |
Occupancy by Educational Attainment in Wetherington
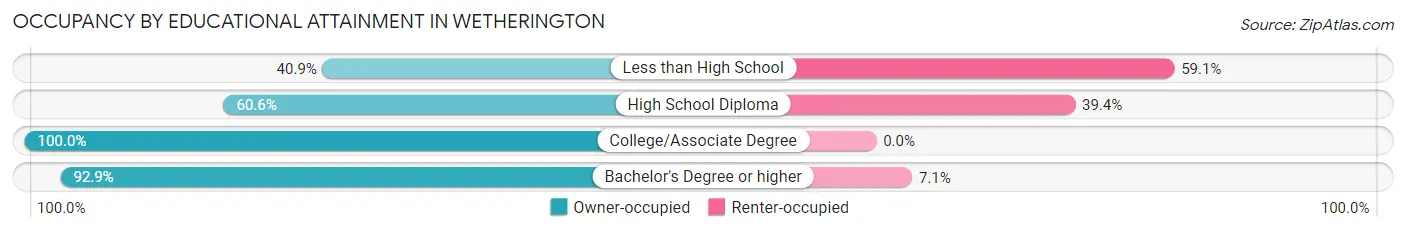
| Household Size | Owner-occupied | Renter-occupied |
| Less than High School | 18 (40.9%) | 26 (59.1%) |
| High School Diploma | 43 (60.6%) | 28 (39.4%) |
| College/Associate Degree | 70 (100.0%) | 0 (0.0%) |
| Bachelor's Degree or higher | 379 (92.9%) | 29 (7.1%) |
Occupancy by Age of Householder in Wetherington
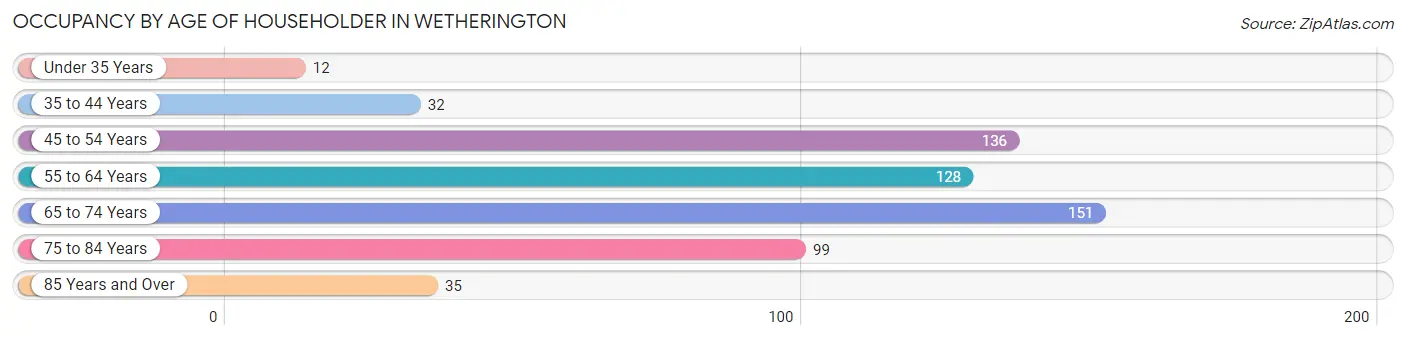
| Age Bracket | # Households | % Households |
| Under 35 Years | 12 | 2.0% |
| 35 to 44 Years | 32 | 5.4% |
| 45 to 54 Years | 136 | 22.9% |
| 55 to 64 Years | 128 | 21.6% |
| 65 to 74 Years | 151 | 25.5% |
| 75 to 84 Years | 99 | 16.7% |
| 85 Years and Over | 35 | 5.9% |
| Total | 593 | 100.0% |
Housing Finances in Wetherington
Median Income by Occupancy in Wetherington
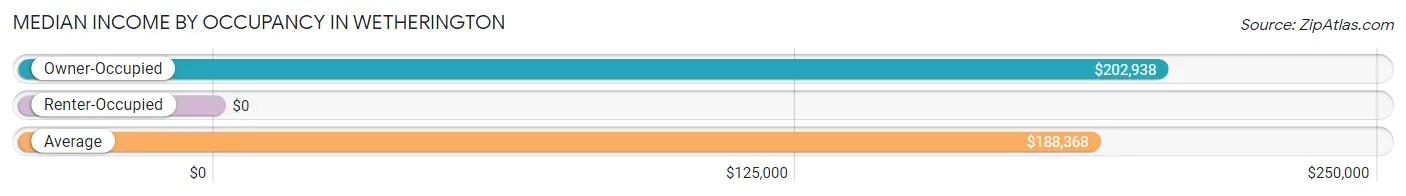
| Occupancy Type | # Households | Median Income |
| Owner-Occupied | 510 (86.0%) | $202,938 |
| Renter-Occupied | 83 (14.0%) | $0 |
| Average | 593 (100.0%) | $188,368 |
Occupancy by Householder Income Bracket in Wetherington
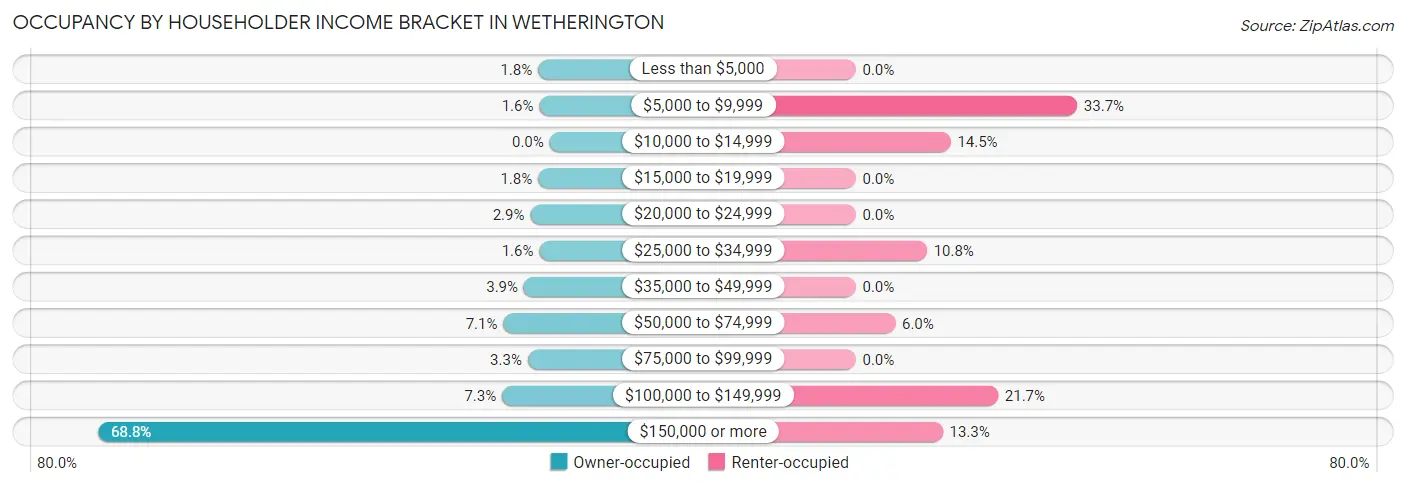
| Income Bracket | Owner-occupied | Renter-occupied |
| Less than $5,000 | 9 (1.8%) | 0 (0.0%) |
| $5,000 to $9,999 | 8 (1.6%) | 28 (33.7%) |
| $10,000 to $14,999 | 0 (0.0%) | 12 (14.5%) |
| $15,000 to $19,999 | 9 (1.8%) | 0 (0.0%) |
| $20,000 to $24,999 | 15 (2.9%) | 0 (0.0%) |
| $25,000 to $34,999 | 8 (1.6%) | 9 (10.8%) |
| $35,000 to $49,999 | 20 (3.9%) | 0 (0.0%) |
| $50,000 to $74,999 | 36 (7.1%) | 5 (6.0%) |
| $75,000 to $99,999 | 17 (3.3%) | 0 (0.0%) |
| $100,000 to $149,999 | 37 (7.2%) | 18 (21.7%) |
| $150,000 or more | 351 (68.8%) | 11 (13.3%) |
| Total | 510 (100.0%) | 83 (100.0%) |
Monthly Housing Cost Tiers in Wetherington
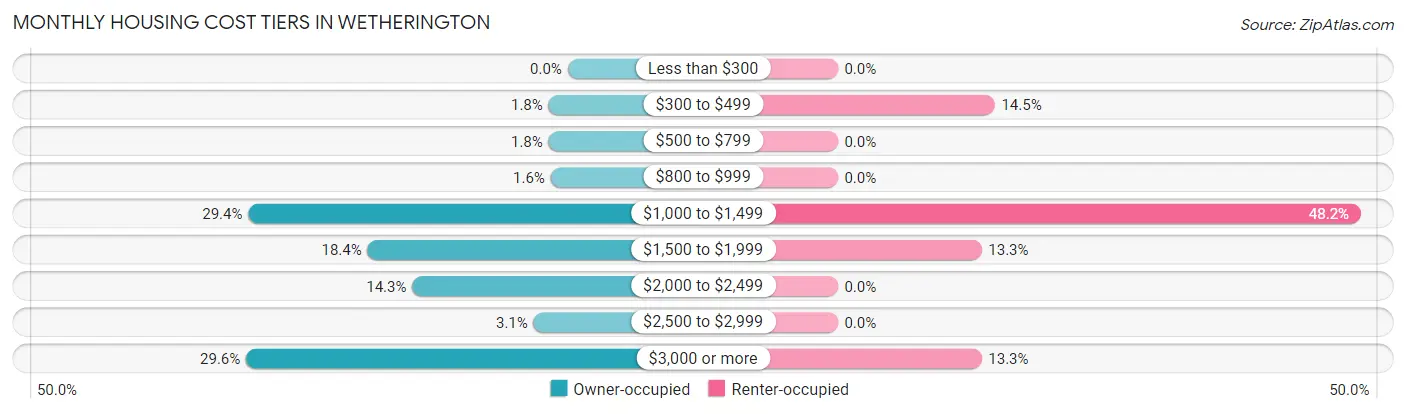
| Monthly Cost | Owner-occupied | Renter-occupied |
| Less than $300 | 0 (0.0%) | 0 (0.0%) |
| $300 to $499 | 9 (1.8%) | 12 (14.5%) |
| $500 to $799 | 9 (1.8%) | 0 (0.0%) |
| $800 to $999 | 8 (1.6%) | 0 (0.0%) |
| $1,000 to $1,499 | 150 (29.4%) | 40 (48.2%) |
| $1,500 to $1,999 | 94 (18.4%) | 11 (13.3%) |
| $2,000 to $2,499 | 73 (14.3%) | 0 (0.0%) |
| $2,500 to $2,999 | 16 (3.1%) | 0 (0.0%) |
| $3,000 or more | 151 (29.6%) | 11 (13.3%) |
| Total | 510 (100.0%) | 83 (100.0%) |
Physical Housing Characteristics in Wetherington
Housing Structures in Wetherington
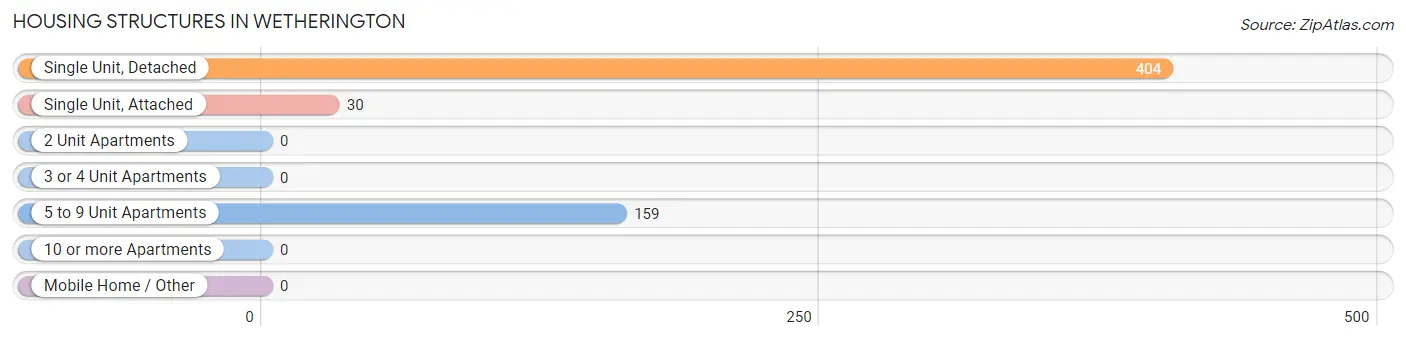
| Structure Type | # Housing Units | % Housing Units |
| Single Unit, Detached | 404 | 68.1% |
| Single Unit, Attached | 30 | 5.1% |
| 2 Unit Apartments | 0 | 0.0% |
| 3 or 4 Unit Apartments | 0 | 0.0% |
| 5 to 9 Unit Apartments | 159 | 26.8% |
| 10 or more Apartments | 0 | 0.0% |
| Mobile Home / Other | 0 | 0.0% |
| Total | 593 | 100.0% |
Housing Structures by Occupancy in Wetherington
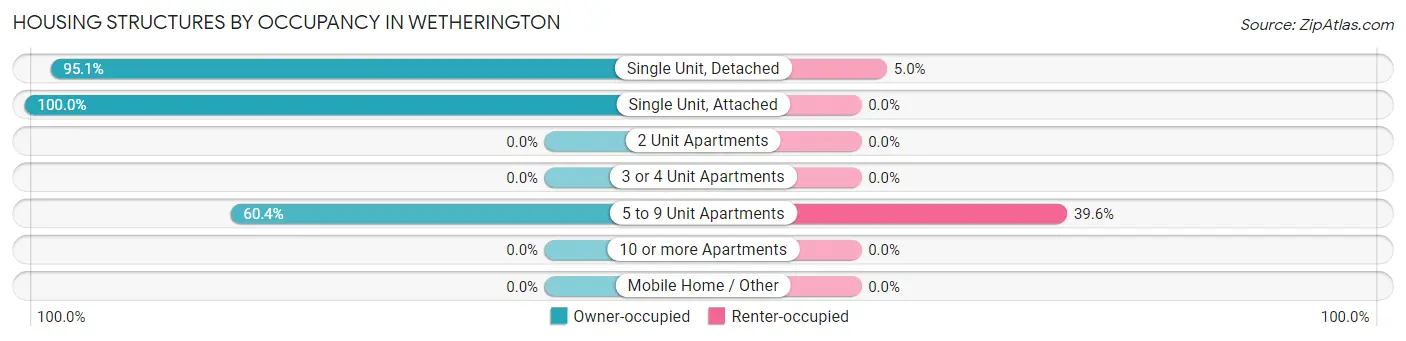
| Structure Type | Owner-occupied | Renter-occupied |
| Single Unit, Detached | 384 (95.1%) | 20 (5.0%) |
| Single Unit, Attached | 30 (100.0%) | 0 (0.0%) |
| 2 Unit Apartments | 0 (0.0%) | 0 (0.0%) |
| 3 or 4 Unit Apartments | 0 (0.0%) | 0 (0.0%) |
| 5 to 9 Unit Apartments | 96 (60.4%) | 63 (39.6%) |
| 10 or more Apartments | 0 (0.0%) | 0 (0.0%) |
| Mobile Home / Other | 0 (0.0%) | 0 (0.0%) |
| Total | 510 (86.0%) | 83 (14.0%) |
Housing Structures by Number of Rooms in Wetherington
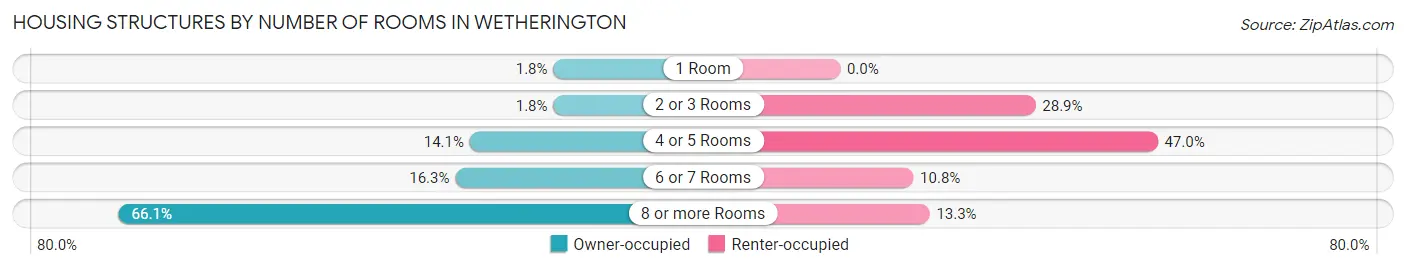
| Number of Rooms | Owner-occupied | Renter-occupied |
| 1 Room | 9 (1.8%) | 0 (0.0%) |
| 2 or 3 Rooms | 9 (1.8%) | 24 (28.9%) |
| 4 or 5 Rooms | 72 (14.1%) | 39 (47.0%) |
| 6 or 7 Rooms | 83 (16.3%) | 9 (10.8%) |
| 8 or more Rooms | 337 (66.1%) | 11 (13.3%) |
| Total | 510 (100.0%) | 83 (100.0%) |
Housing Structure by Heating Type in Wetherington
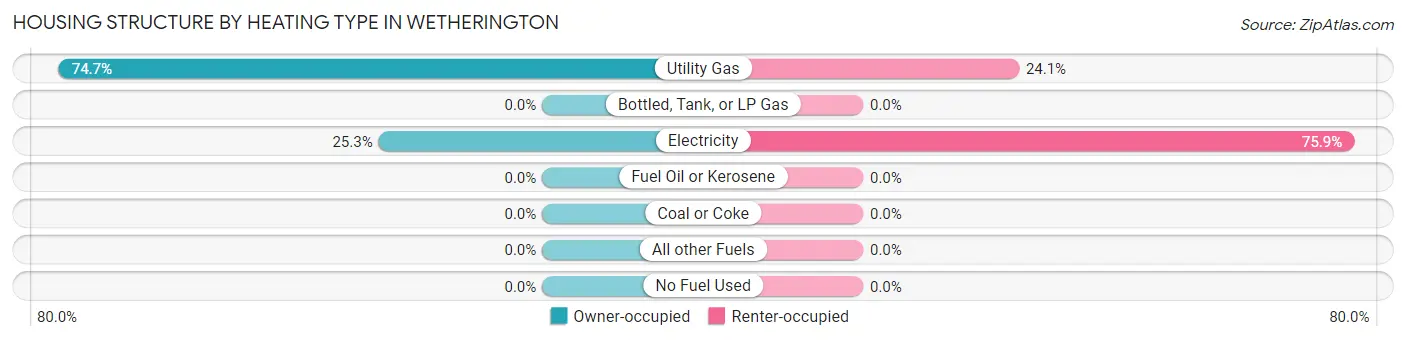
| Heating Type | Owner-occupied | Renter-occupied |
| Utility Gas | 381 (74.7%) | 20 (24.1%) |
| Bottled, Tank, or LP Gas | 0 (0.0%) | 0 (0.0%) |
| Electricity | 129 (25.3%) | 63 (75.9%) |
| Fuel Oil or Kerosene | 0 (0.0%) | 0 (0.0%) |
| Coal or Coke | 0 (0.0%) | 0 (0.0%) |
| All other Fuels | 0 (0.0%) | 0 (0.0%) |
| No Fuel Used | 0 (0.0%) | 0 (0.0%) |
| Total | 510 (100.0%) | 83 (100.0%) |
Household Vehicle Usage in Wetherington
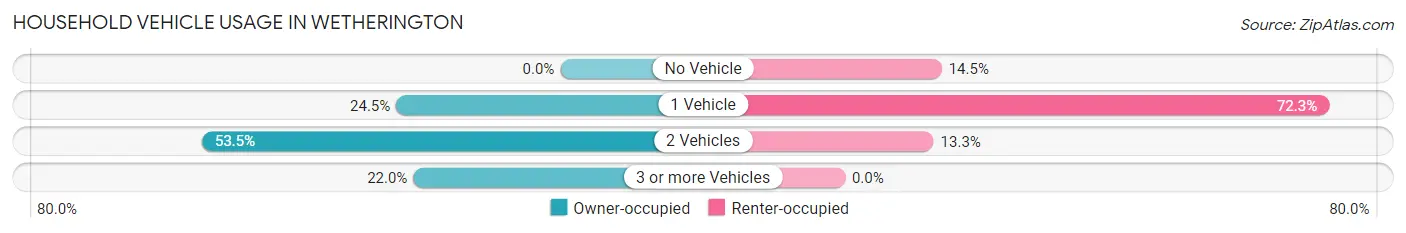
| Vehicles per Household | Owner-occupied | Renter-occupied |
| No Vehicle | 0 (0.0%) | 12 (14.5%) |
| 1 Vehicle | 125 (24.5%) | 60 (72.3%) |
| 2 Vehicles | 273 (53.5%) | 11 (13.3%) |
| 3 or more Vehicles | 112 (22.0%) | 0 (0.0%) |
| Total | 510 (100.0%) | 83 (100.0%) |
Real Estate & Mortgages in Wetherington
Real Estate and Mortgage Overview in Wetherington
| Characteristic | Without Mortgage | With Mortgage |
| Housing Units | 196 | 314 |
| Median Property Value | $640,300 | $569,100 |
| Median Household Income | $187,946 | $203 |
| Monthly Housing Costs | $1,344 | $151 |
| Real Estate Taxes | $10,001 | $0 |
Property Value by Mortgage Status in Wetherington
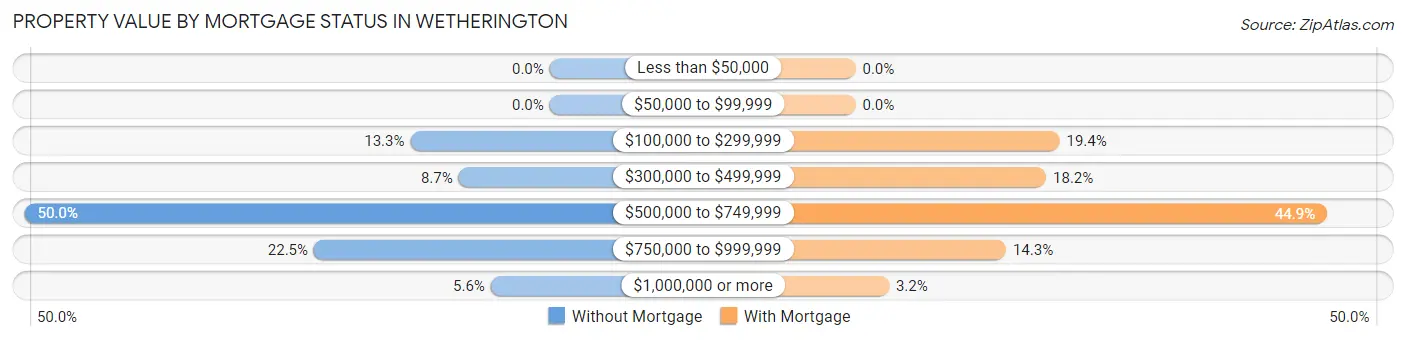
| Property Value | Without Mortgage | With Mortgage |
| Less than $50,000 | 0 (0.0%) | 0 (0.0%) |
| $50,000 to $99,999 | 0 (0.0%) | 0 (0.0%) |
| $100,000 to $299,999 | 26 (13.3%) | 61 (19.4%) |
| $300,000 to $499,999 | 17 (8.7%) | 57 (18.1%) |
| $500,000 to $749,999 | 98 (50.0%) | 141 (44.9%) |
| $750,000 to $999,999 | 44 (22.5%) | 45 (14.3%) |
| $1,000,000 or more | 11 (5.6%) | 10 (3.2%) |
| Total | 196 (100.0%) | 314 (100.0%) |
Household Income by Mortgage Status in Wetherington
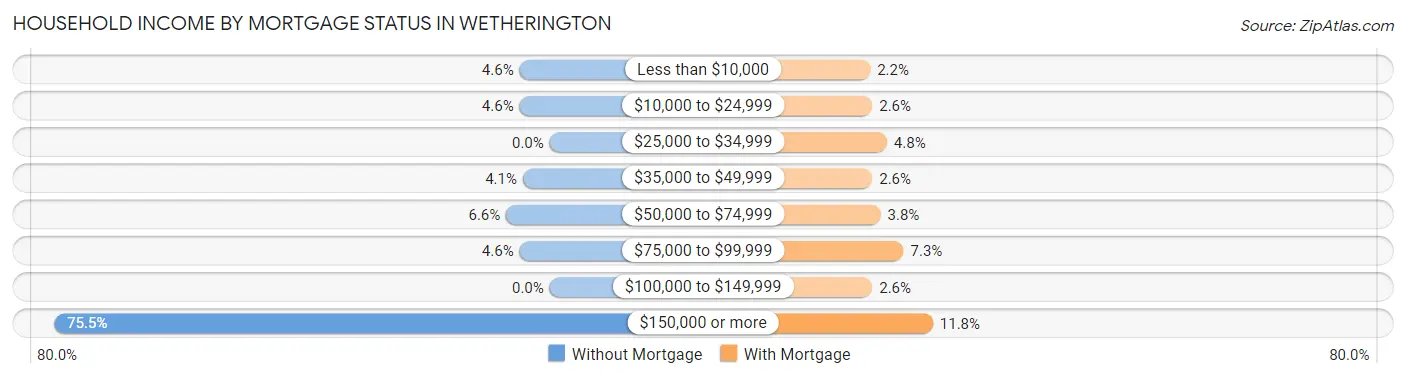
| Household Income | Without Mortgage | With Mortgage |
| Less than $10,000 | 9 (4.6%) | 7 (2.2%) |
| $10,000 to $24,999 | 9 (4.6%) | 8 (2.5%) |
| $25,000 to $34,999 | 0 (0.0%) | 15 (4.8%) |
| $35,000 to $49,999 | 8 (4.1%) | 8 (2.5%) |
| $50,000 to $74,999 | 13 (6.6%) | 12 (3.8%) |
| $75,000 to $99,999 | 9 (4.6%) | 23 (7.3%) |
| $100,000 to $149,999 | 0 (0.0%) | 8 (2.5%) |
| $150,000 or more | 148 (75.5%) | 37 (11.8%) |
| Total | 196 (100.0%) | 314 (100.0%) |
Property Value to Household Income Ratio in Wetherington
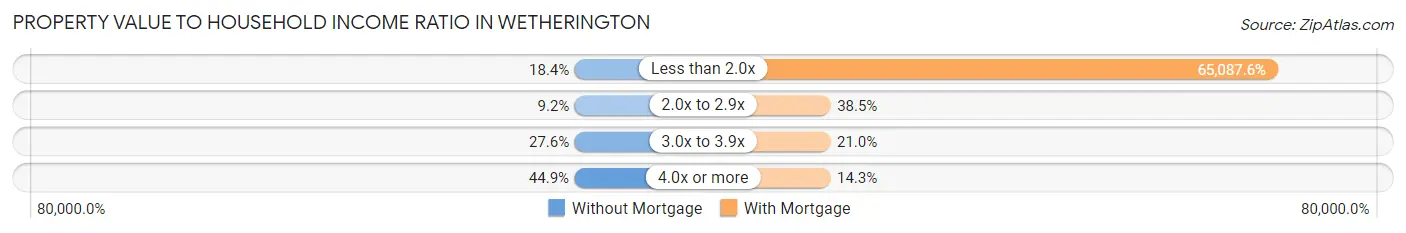
| Value-to-Income Ratio | Without Mortgage | With Mortgage |
| Less than 2.0x | 36 (18.4%) | 204,375 (65,087.6%) |
| 2.0x to 2.9x | 18 (9.2%) | 121 (38.5%) |
| 3.0x to 3.9x | 54 (27.6%) | 66 (21.0%) |
| 4.0x or more | 88 (44.9%) | 45 (14.3%) |
| Total | 196 (100.0%) | 314 (100.0%) |
Real Estate Taxes by Mortgage Status in Wetherington
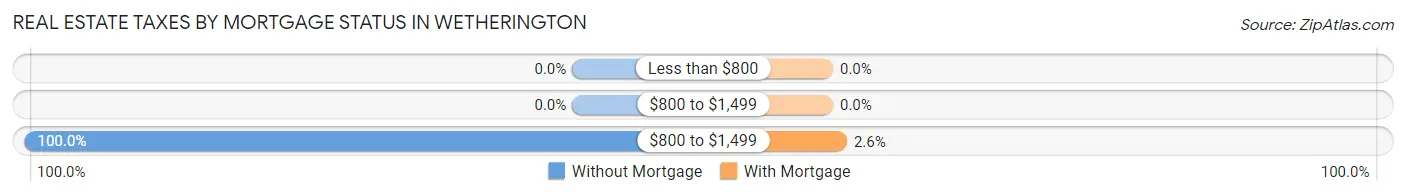
| Property Taxes | Without Mortgage | With Mortgage |
| Less than $800 | 0 (0.0%) | 0 (0.0%) |
| $800 to $1,499 | 0 (0.0%) | 0 (0.0%) |
| $800 to $1,499 | 196 (100.0%) | 8 (2.5%) |
| Total | 196 (100.0%) | 314 (100.0%) |
Health & Disability in Wetherington
Health Insurance Coverage by Age in Wetherington
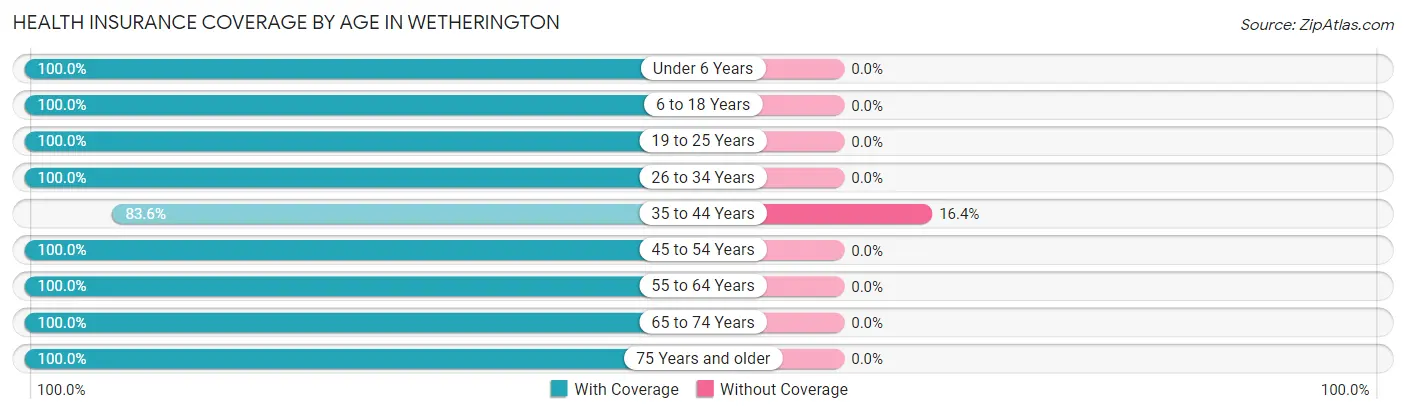
| Age Bracket | With Coverage | Without Coverage |
| Under 6 Years | 5 (100.0%) | 0 (0.0%) |
| 6 to 18 Years | 150 (100.0%) | 0 (0.0%) |
| 19 to 25 Years | 62 (100.0%) | 0 (0.0%) |
| 26 to 34 Years | 11 (100.0%) | 0 (0.0%) |
| 35 to 44 Years | 51 (83.6%) | 10 (16.4%) |
| 45 to 54 Years | 253 (100.0%) | 0 (0.0%) |
| 55 to 64 Years | 227 (100.0%) | 0 (0.0%) |
| 65 to 74 Years | 286 (100.0%) | 0 (0.0%) |
| 75 Years and older | 182 (100.0%) | 0 (0.0%) |
| Total | 1,227 (99.2%) | 10 (0.8%) |
Health Insurance Coverage by Citizenship Status in Wetherington
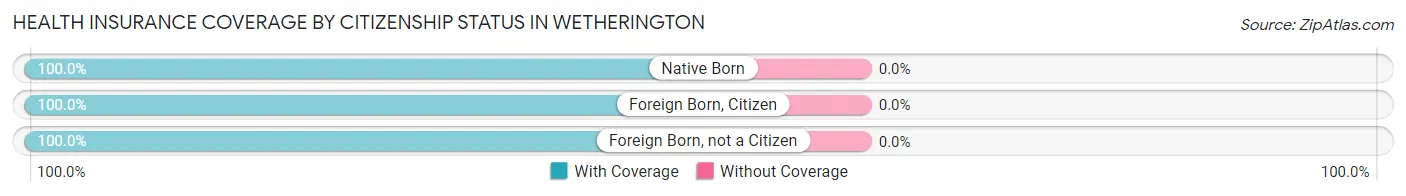
| Citizenship Status | With Coverage | Without Coverage |
| Native Born | 5 (100.0%) | 0 (0.0%) |
| Foreign Born, Citizen | 150 (100.0%) | 0 (0.0%) |
| Foreign Born, not a Citizen | 62 (100.0%) | 0 (0.0%) |
Health Insurance Coverage by Household Income in Wetherington
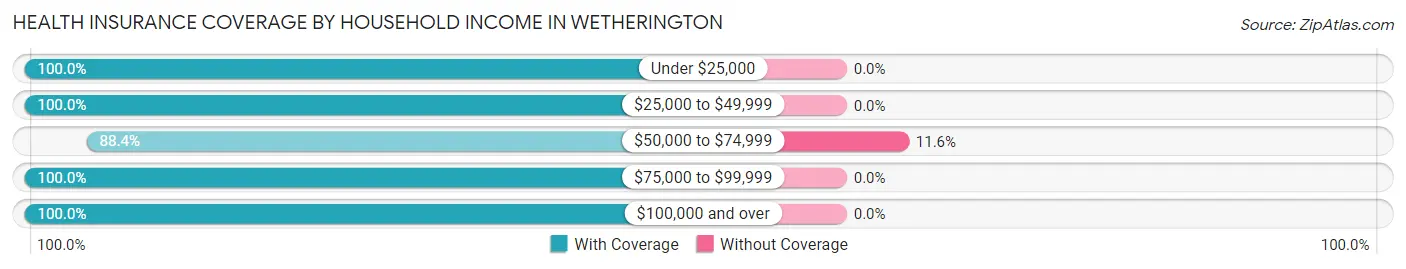
| Household Income | With Coverage | Without Coverage |
| Under $25,000 | 120 (100.0%) | 0 (0.0%) |
| $25,000 to $49,999 | 37 (100.0%) | 0 (0.0%) |
| $50,000 to $74,999 | 76 (88.4%) | 10 (11.6%) |
| $75,000 to $99,999 | 17 (100.0%) | 0 (0.0%) |
| $100,000 and over | 977 (100.0%) | 0 (0.0%) |
Public vs Private Health Insurance Coverage by Age in Wetherington
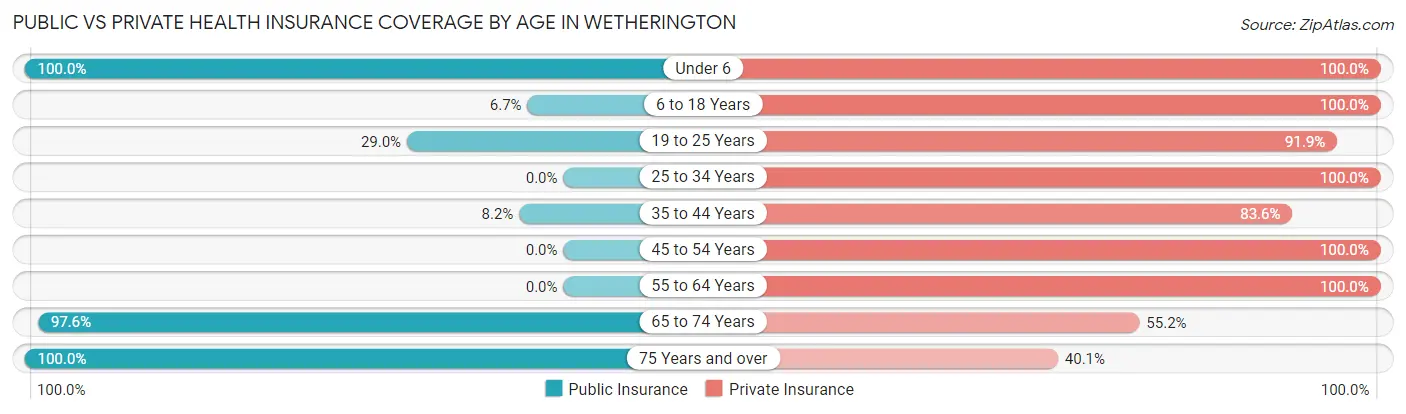
| Age Bracket | Public Insurance | Private Insurance |
| Under 6 | 5 (100.0%) | 5 (100.0%) |
| 6 to 18 Years | 10 (6.7%) | 150 (100.0%) |
| 19 to 25 Years | 18 (29.0%) | 57 (91.9%) |
| 25 to 34 Years | 0 (0.0%) | 11 (100.0%) |
| 35 to 44 Years | 5 (8.2%) | 51 (83.6%) |
| 45 to 54 Years | 0 (0.0%) | 253 (100.0%) |
| 55 to 64 Years | 0 (0.0%) | 227 (100.0%) |
| 65 to 74 Years | 279 (97.6%) | 158 (55.2%) |
| 75 Years and over | 182 (100.0%) | 73 (40.1%) |
| Total | 499 (40.3%) | 985 (79.6%) |
Disability Status by Sex by Age in Wetherington
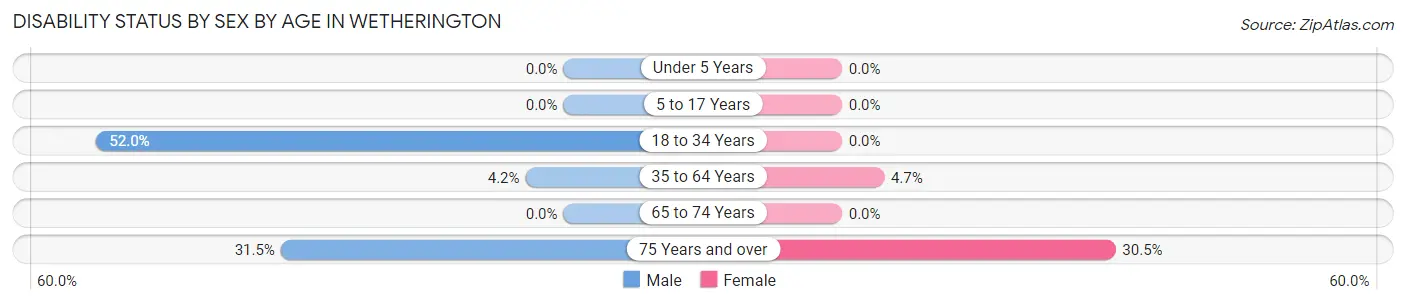
| Age Bracket | Male | Female |
| Under 5 Years | 0 (0.0%) | 0 (0.0%) |
| 5 to 17 Years | 0 (0.0%) | 0 (0.0%) |
| 18 to 34 Years | 13 (52.0%) | 0 (0.0%) |
| 35 to 64 Years | 13 (4.2%) | 11 (4.7%) |
| 65 to 74 Years | 0 (0.0%) | 0 (0.0%) |
| 75 Years and over | 17 (31.5%) | 39 (30.5%) |
Disability Class by Sex by Age in Wetherington
Disability Class: Hearing Difficulty
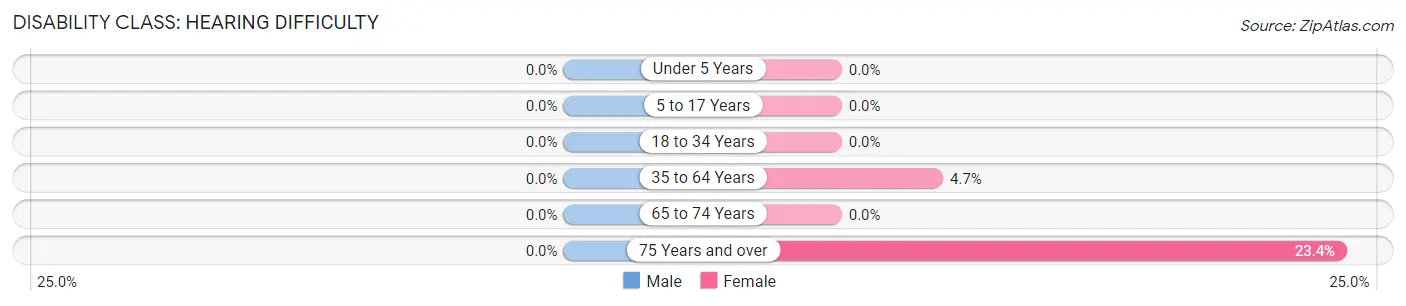
| Age Bracket | Male | Female |
| Under 5 Years | 0 (0.0%) | 0 (0.0%) |
| 5 to 17 Years | 0 (0.0%) | 0 (0.0%) |
| 18 to 34 Years | 0 (0.0%) | 0 (0.0%) |
| 35 to 64 Years | 0 (0.0%) | 11 (4.7%) |
| 65 to 74 Years | 0 (0.0%) | 0 (0.0%) |
| 75 Years and over | 0 (0.0%) | 30 (23.4%) |
Disability Class: Vision Difficulty
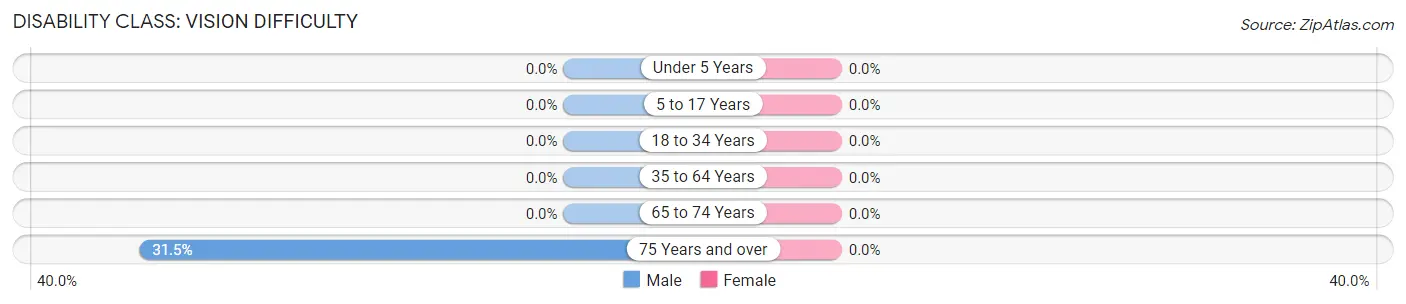
| Age Bracket | Male | Female |
| Under 5 Years | 0 (0.0%) | 0 (0.0%) |
| 5 to 17 Years | 0 (0.0%) | 0 (0.0%) |
| 18 to 34 Years | 0 (0.0%) | 0 (0.0%) |
| 35 to 64 Years | 0 (0.0%) | 0 (0.0%) |
| 65 to 74 Years | 0 (0.0%) | 0 (0.0%) |
| 75 Years and over | 17 (31.5%) | 0 (0.0%) |
Disability Class: Cognitive Difficulty
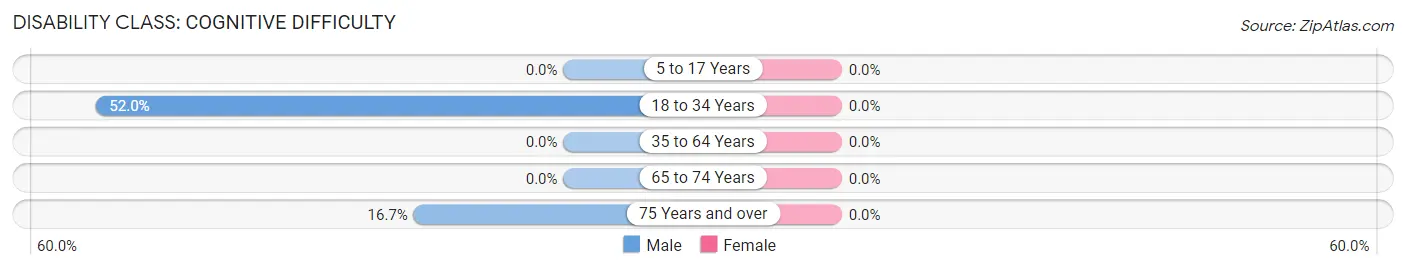
| Age Bracket | Male | Female |
| 5 to 17 Years | 0 (0.0%) | 0 (0.0%) |
| 18 to 34 Years | 13 (52.0%) | 0 (0.0%) |
| 35 to 64 Years | 0 (0.0%) | 0 (0.0%) |
| 65 to 74 Years | 0 (0.0%) | 0 (0.0%) |
| 75 Years and over | 9 (16.7%) | 0 (0.0%) |
Disability Class: Ambulatory Difficulty
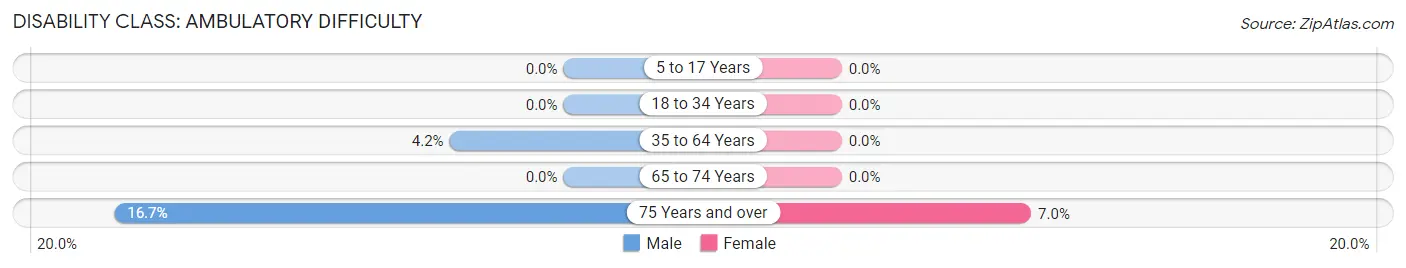
| Age Bracket | Male | Female |
| 5 to 17 Years | 0 (0.0%) | 0 (0.0%) |
| 18 to 34 Years | 0 (0.0%) | 0 (0.0%) |
| 35 to 64 Years | 13 (4.2%) | 0 (0.0%) |
| 65 to 74 Years | 0 (0.0%) | 0 (0.0%) |
| 75 Years and over | 9 (16.7%) | 9 (7.0%) |
Disability Class: Self-Care Difficulty
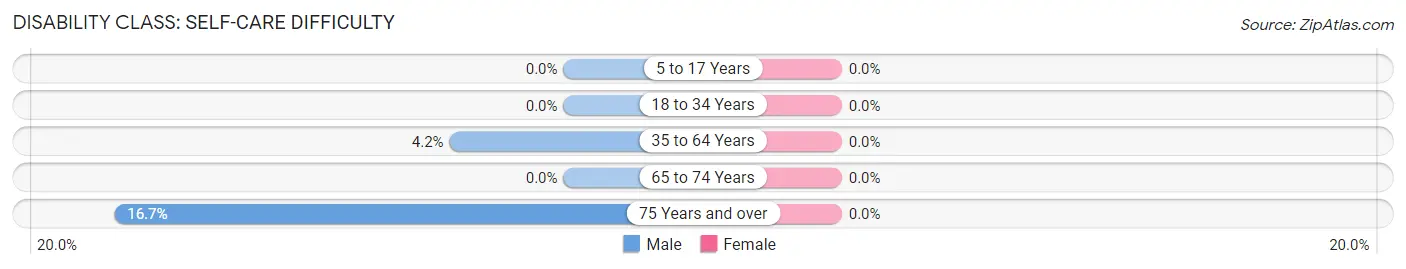
| Age Bracket | Male | Female |
| 5 to 17 Years | 0 (0.0%) | 0 (0.0%) |
| 18 to 34 Years | 0 (0.0%) | 0 (0.0%) |
| 35 to 64 Years | 13 (4.2%) | 0 (0.0%) |
| 65 to 74 Years | 0 (0.0%) | 0 (0.0%) |
| 75 Years and over | 9 (16.7%) | 0 (0.0%) |
Technology Access in Wetherington
Computing Device Access in Wetherington
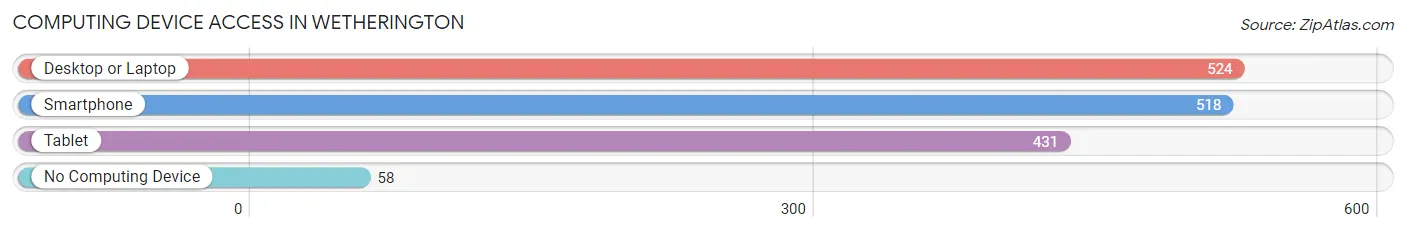
| Device Type | # Households | % Households |
| Desktop or Laptop | 524 | 88.4% |
| Smartphone | 518 | 87.4% |
| Tablet | 431 | 72.7% |
| No Computing Device | 58 | 9.8% |
| Total | 593 | 100.0% |
Internet Access in Wetherington
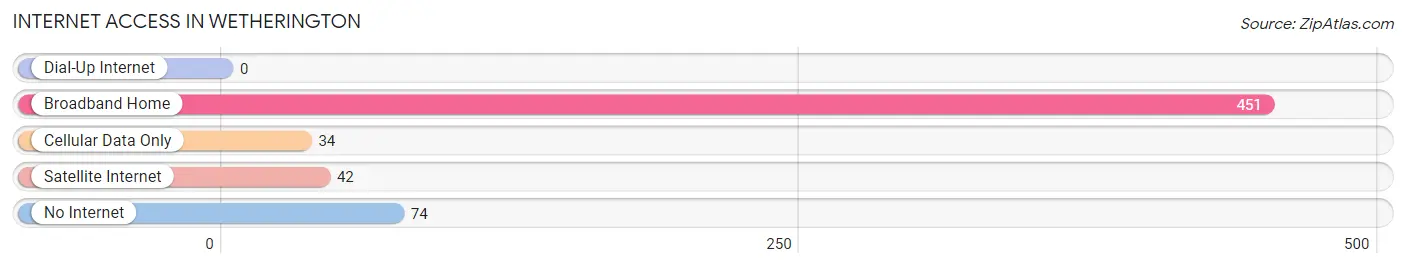
| Internet Type | # Households | % Households |
| Dial-Up Internet | 0 | 0.0% |
| Broadband Home | 451 | 76.0% |
| Cellular Data Only | 34 | 5.7% |
| Satellite Internet | 42 | 7.1% |
| No Internet | 74 | 12.5% |
| Total | 593 | 100.0% |
Wetherington Summary
Wetherington is a small village located in Butler County, Ohio. It is situated in the southwestern corner of the state, just north of Cincinnati. The village has a population of approximately 1,000 people and is part of the Hamilton-Middletown Metropolitan Statistical Area.
Geography
Wetherington is located in the southwestern corner of Butler County, Ohio. It is situated on the banks of the Great Miami River, which flows through the village. The village is bordered by the cities of Hamilton and Middletown to the north and east, respectively. The village is also bordered by the townships of Liberty and Wayne to the south and west, respectively. The village is located approximately 25 miles north of Cincinnati and is part of the Hamilton-Middletown Metropolitan Statistical Area.
The village is situated on a flat plain, with an elevation of approximately 890 feet above sea level. The climate in the area is classified as humid continental, with hot summers and cold winters. The average annual temperature is approximately 54 degrees Fahrenheit, with an average annual precipitation of approximately 40 inches.
History
Wetherington was founded in 1817 by a group of settlers from Pennsylvania. The village was named after the Wetherington family, who were among the first settlers in the area. The village was originally a farming community, with the main crops being corn, wheat, and oats.
In the late 19th century, the village began to grow and develop. The first school was built in 1876, and the first post office was established in 1877. The village was incorporated in 1891, and the first mayor was elected in 1892.
In the early 20th century, the village began to experience a period of growth and development. The first bank was established in 1906, and the first telephone service was established in 1908. The village also experienced a period of industrial growth, with the establishment of several factories in the area.
Economy
The economy of Wetherington is largely based on agriculture and manufacturing. The village is home to several farms, which produce a variety of crops, including corn, wheat, and oats. The village is also home to several factories, which produce a variety of products, including furniture, clothing, and automotive parts.
The village is also home to several small businesses, including restaurants, retail stores, and service providers. The village is also home to several banks, which provide financial services to the local community.
Demographics
As of the 2010 census, the population of Wetherington was 1,000 people. The racial makeup of the village was 97.2% White, 0.7% African American, 0.2% Native American, 0.2% Asian, 0.2% from other races, and 1.7% from two or more races. The median household income was $45,000, and the median family income was $50,000.
The village is served by the Wetherington School District, which consists of one elementary school, one middle school, and one high school. The village is also home to several churches, including the Wetherington United Methodist Church, the Wetherington Baptist Church, and the Wetherington Presbyterian Church.
Conclusion
Wetherington is a small village located in Butler County, Ohio. It is situated on the banks of the Great Miami River and is part of the Hamilton-Middletown Metropolitan Statistical Area. The village has a population of approximately 1,000 people and is largely based on agriculture and manufacturing. The village is served by the Wetherington School District and is home to several churches.
Common Questions
What is Per Capita Income in Wetherington?
Per Capita income in Wetherington is $109,614.
What is the Median Family Income in Wetherington?
Median Family Income in Wetherington is $219,000.
What is the Median Household income in Wetherington?
Median Household Income in Wetherington is $188,368.
What is Income or Wage Gap in Wetherington?
Income or Wage Gap in Wetherington is 83.3%.
Women in Wetherington earn 16.7 cents for every dollar earned by a man.
What is Family Income Deficit in Wetherington?
Family Income Deficit in Wetherington is $8,150.
Families that are below poverty line in Wetherington earn $8,150 less on average than the poverty threshold level.
What is Inequality or Gini Index in Wetherington?
Inequality or Gini Index in Wetherington is 0.48.
What is the Total Population of Wetherington?
Total Population of Wetherington is 1,237.
What is the Total Male Population of Wetherington?
Total Male Population of Wetherington is 584.
What is the Total Female Population of Wetherington?
Total Female Population of Wetherington is 653.
What is the Ratio of Males per 100 Females in Wetherington?
There are 89.43 Males per 100 Females in Wetherington.
What is the Ratio of Females per 100 Males in Wetherington?
There are 111.82 Females per 100 Males in Wetherington.
What is the Median Population Age in Wetherington?
Median Population Age in Wetherington is 56.9 Years.
What is the Average Family Size in Wetherington
Average Family Size in Wetherington is 2.6 People.
What is the Average Household Size in Wetherington
Average Household Size in Wetherington is 2.1 People.
How Large is the Labor Force in Wetherington?
There are 569 People in the Labor Forcein in Wetherington.
What is the Percentage of People in the Labor Force in Wetherington?
49.4% of People are in the Labor Force in Wetherington.