Kirtland, OH Map & Demographics
Kirtland Map
Kirtland Overview
$60,562
PER CAPITA INCOME
$148,276
AVG FAMILY INCOME
$111,184
AVG HOUSEHOLD INCOME
43.0%
WAGE / INCOME GAP [ % ]
57.0¢/ $1
WAGE / INCOME GAP [ $ ]
0.47
INEQUALITY / GINI INDEX
6,914
TOTAL POPULATION
3,392
MALE POPULATION
3,522
FEMALE POPULATION
96.31
MALES / 100 FEMALES
103.83
FEMALES / 100 MALES
51.2
MEDIAN AGE
3.0
AVG FAMILY SIZE
2.5
AVG HOUSEHOLD SIZE
3,601
LABOR FORCE [ PEOPLE ]
62.5%
PERCENT IN LABOR FORCE
3.1%
UNEMPLOYMENT RATE
Kirtland Area Codes
Income in Kirtland
Income Overview in Kirtland
Per Capita Income in Kirtland is $60,562, while median incomes of families and households are $148,276 and $111,184 respectively.
| Characteristic | Number | Measure |
| Per Capita Income | 6,914 | $60,562 |
| Median Family Income | 1,896 | $148,276 |
| Mean Family Income | 1,896 | $186,137 |
| Median Household Income | 2,668 | $111,184 |
| Mean Household Income | 2,668 | $154,108 |
| Income Deficit | 1,896 | $0 |
| Wage / Income Gap (%) | 6,914 | 43.01% |
| Wage / Income Gap ($) | 6,914 | 56.99¢ per $1 |
| Gini / Inequality Index | 6,914 | 0.47 |
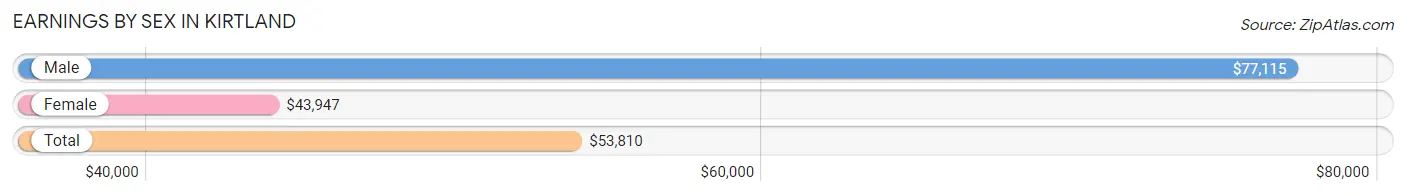
Earnings by Sex in Kirtland
Average Earnings in Kirtland are $53,810, $77,115 for men and $43,947 for women, a difference of 43.0%.
| Sex | Number | Average Earnings |
| Male | 2,072 (55.7%) | $77,115 |
| Female | 1,650 (44.3%) | $43,947 |
| Total | 3,722 (100.0%) | $53,810 |
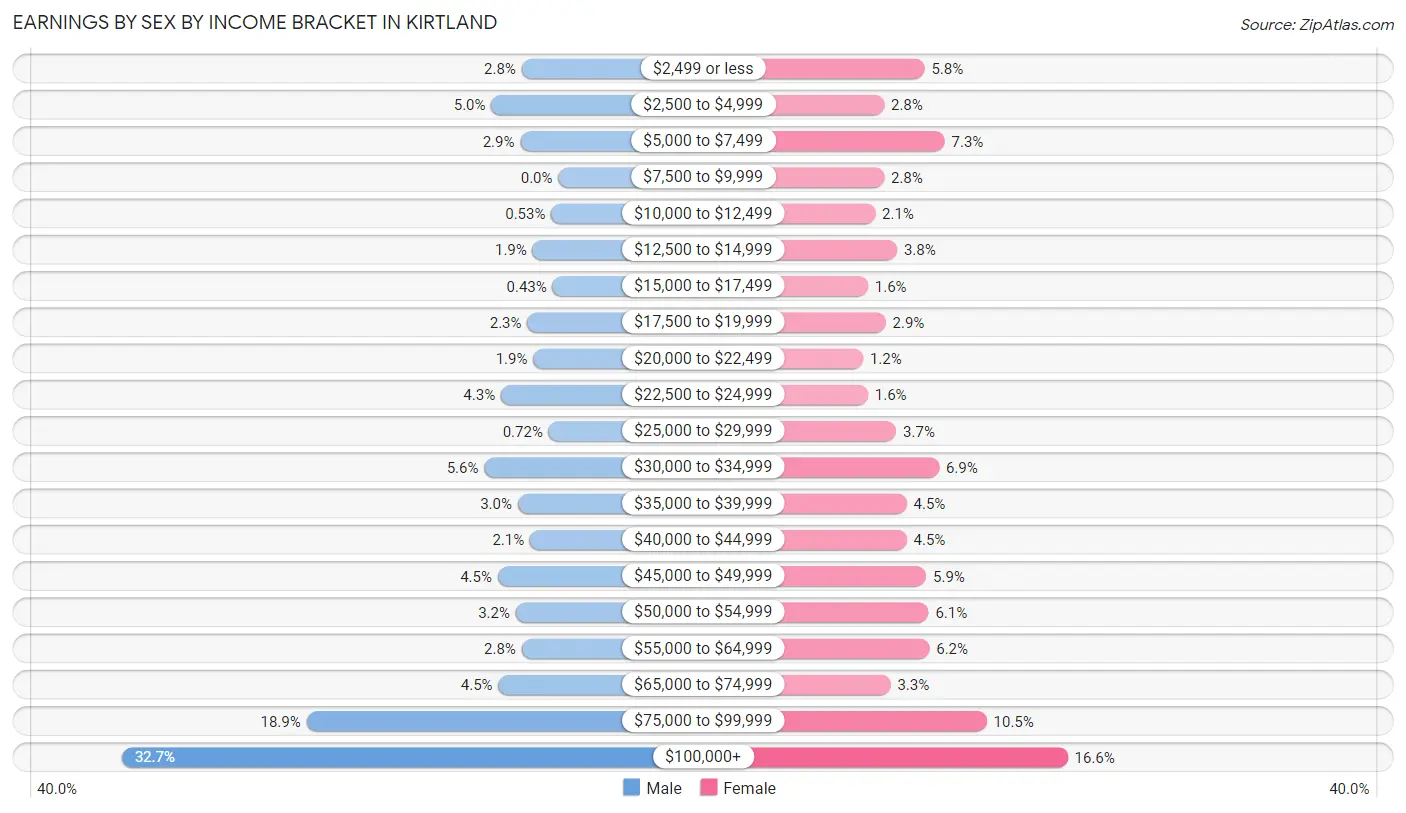
Earnings by Sex by Income Bracket in Kirtland
The most common earnings brackets in Kirtland are $100,000+ for men (678 | 32.7%) and $100,000+ for women (273 | 16.6%).
| Income | Male | Female |
| $2,499 or less | 57 (2.8%) | 96 (5.8%) |
| $2,500 to $4,999 | 104 (5.0%) | 46 (2.8%) |
| $5,000 to $7,499 | 59 (2.9%) | 121 (7.3%) |
| $7,500 to $9,999 | 0 (0.0%) | 46 (2.8%) |
| $10,000 to $12,499 | 11 (0.5%) | 35 (2.1%) |
| $12,500 to $14,999 | 40 (1.9%) | 62 (3.8%) |
| $15,000 to $17,499 | 9 (0.4%) | 26 (1.6%) |
| $17,500 to $19,999 | 48 (2.3%) | 48 (2.9%) |
| $20,000 to $22,499 | 39 (1.9%) | 20 (1.2%) |
| $22,500 to $24,999 | 89 (4.3%) | 26 (1.6%) |
| $25,000 to $29,999 | 15 (0.7%) | 61 (3.7%) |
| $30,000 to $34,999 | 115 (5.6%) | 114 (6.9%) |
| $35,000 to $39,999 | 63 (3.0%) | 74 (4.5%) |
| $40,000 to $44,999 | 44 (2.1%) | 74 (4.5%) |
| $45,000 to $49,999 | 94 (4.5%) | 98 (5.9%) |
| $50,000 to $54,999 | 66 (3.2%) | 101 (6.1%) |
| $55,000 to $64,999 | 57 (2.8%) | 102 (6.2%) |
| $65,000 to $74,999 | 93 (4.5%) | 54 (3.3%) |
| $75,000 to $99,999 | 391 (18.9%) | 173 (10.5%) |
| $100,000+ | 678 (32.7%) | 273 (16.6%) |
| Total | 2,072 (100.0%) | 1,650 (100.0%) |
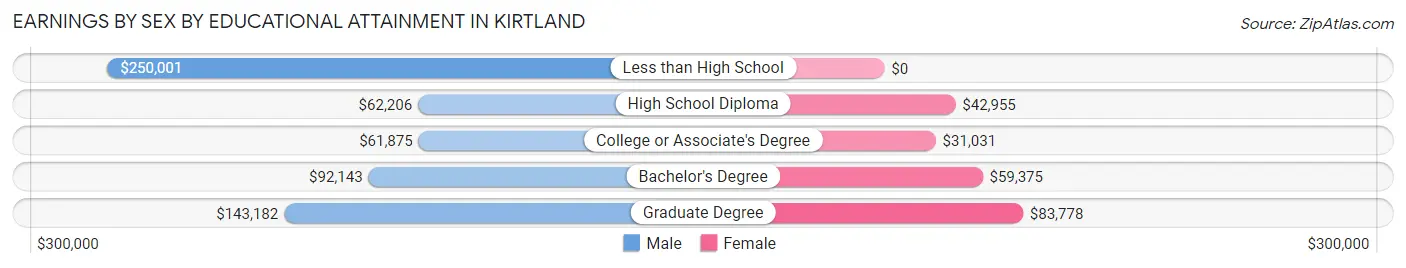
Earnings by Sex by Educational Attainment in Kirtland
Average earnings in Kirtland are $89,115 for men and $50,307 for women, a difference of 43.5%. Men with an educational attainment of less than high school enjoy the highest average annual earnings of $250,001, while those with college or associate's degree education earn the least with $61,875. Women with an educational attainment of graduate degree earn the most with the average annual earnings of $83,778, while those with college or associate's degree education have the smallest earnings of $31,031.
| Educational Attainment | Male Income | Female Income |
| Less than High School | $250,001 | $0 |
| High School Diploma | $62,206 | $42,955 |
| College or Associate's Degree | $61,875 | $31,031 |
| Bachelor's Degree | $92,143 | $59,375 |
| Graduate Degree | $143,182 | $83,778 |
| Total | $89,115 | $50,307 |
Family Income in Kirtland
Family Income Brackets in Kirtland
According to the Kirtland family income data, there are 574 families falling into the $200,000+ income range, which is the most common income bracket and makes up 30.3% of all families.
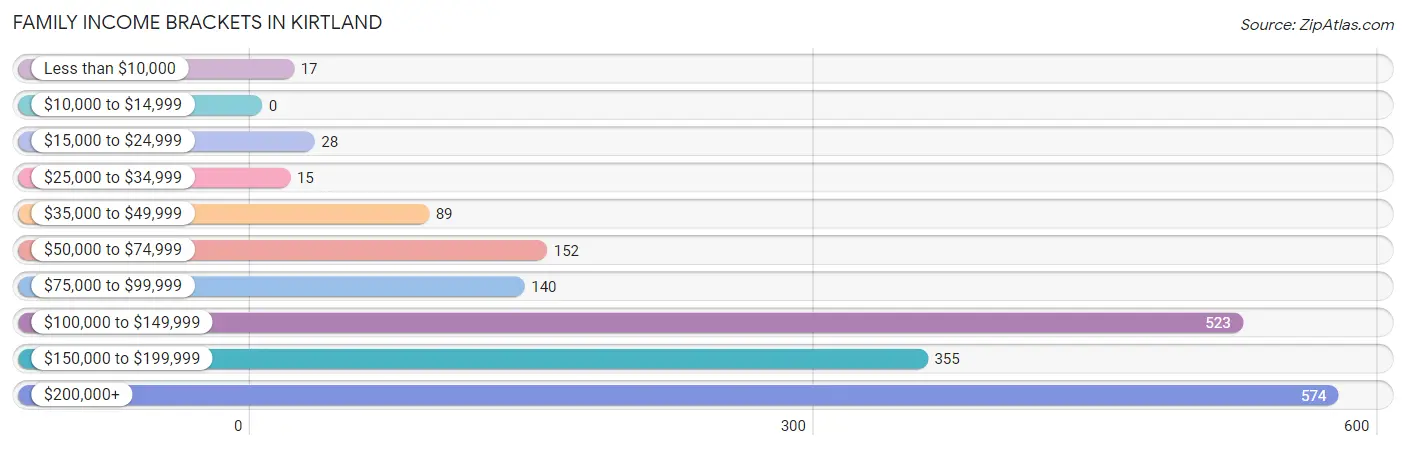
| Income Bracket | # Families | % Families |
| Less than $10,000 | 17 | 0.9% |
| $10,000 to $14,999 | 0 | 0.0% |
| $15,000 to $24,999 | 28 | 1.5% |
| $25,000 to $34,999 | 15 | 0.8% |
| $35,000 to $49,999 | 89 | 4.7% |
| $50,000 to $74,999 | 152 | 8.0% |
| $75,000 to $99,999 | 140 | 7.4% |
| $100,000 to $149,999 | 523 | 27.6% |
| $150,000 to $199,999 | 355 | 18.7% |
| $200,000+ | 574 | 30.3% |
Family Income by Famaliy Size in Kirtland
4-person families (365 | 19.3%) account for the highest median family income in Kirtland with $192,375 per family, while 2-person families (978 | 51.6%) have the highest median income of $62,354 per family member.
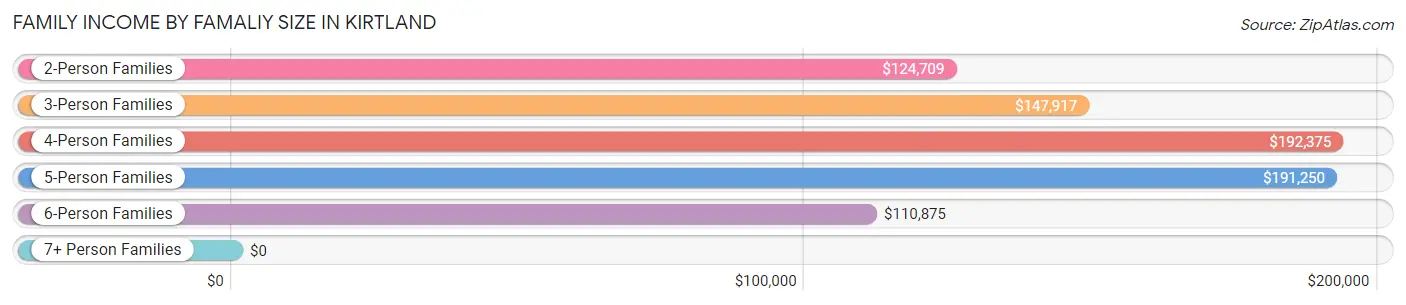
| Income Bracket | # Families | Median Income |
| 2-Person Families | 978 (51.6%) | $124,709 |
| 3-Person Families | 350 (18.5%) | $147,917 |
| 4-Person Families | 365 (19.3%) | $192,375 |
| 5-Person Families | 166 (8.8%) | $191,250 |
| 6-Person Families | 37 (1.9%) | $110,875 |
| 7+ Person Families | 0 (0.0%) | $0 |
| Total | 1,896 (100.0%) | $148,276 |
Family Income by Number of Earners in Kirtland
The median family income in Kirtland is $148,276, with families comprising 2 earners (787) having the highest median family income of $174,659, while families with no earners (364) have the lowest median family income of $84,167, accounting for 41.5% and 19.2% of families, respectively.
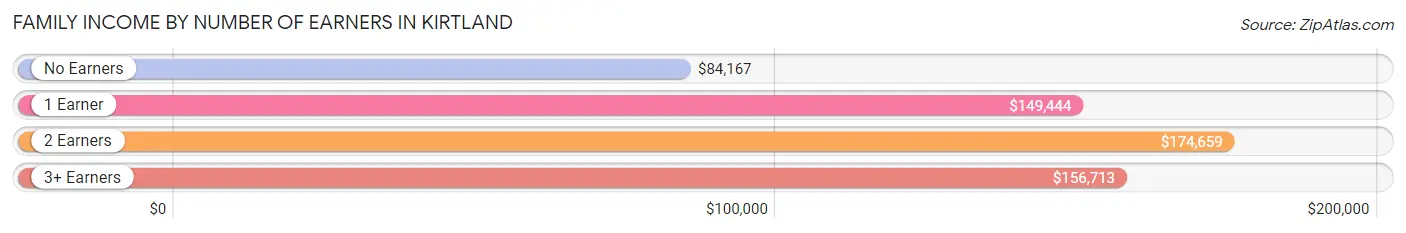
| Number of Earners | # Families | Median Income |
| No Earners | 364 (19.2%) | $84,167 |
| 1 Earner | 466 (24.6%) | $149,444 |
| 2 Earners | 787 (41.5%) | $174,659 |
| 3+ Earners | 279 (14.7%) | $156,713 |
| Total | 1,896 (100.0%) | $148,276 |
Household Income in Kirtland
Household Income Brackets in Kirtland
With 614 households falling in the category, the $100,000 to $149,999 income range is the most frequent in Kirtland, accounting for 23.0% of all households. In contrast, only 56 households (2.1%) fall into the $10,000 to $14,999 income bracket, making it the least populous group.
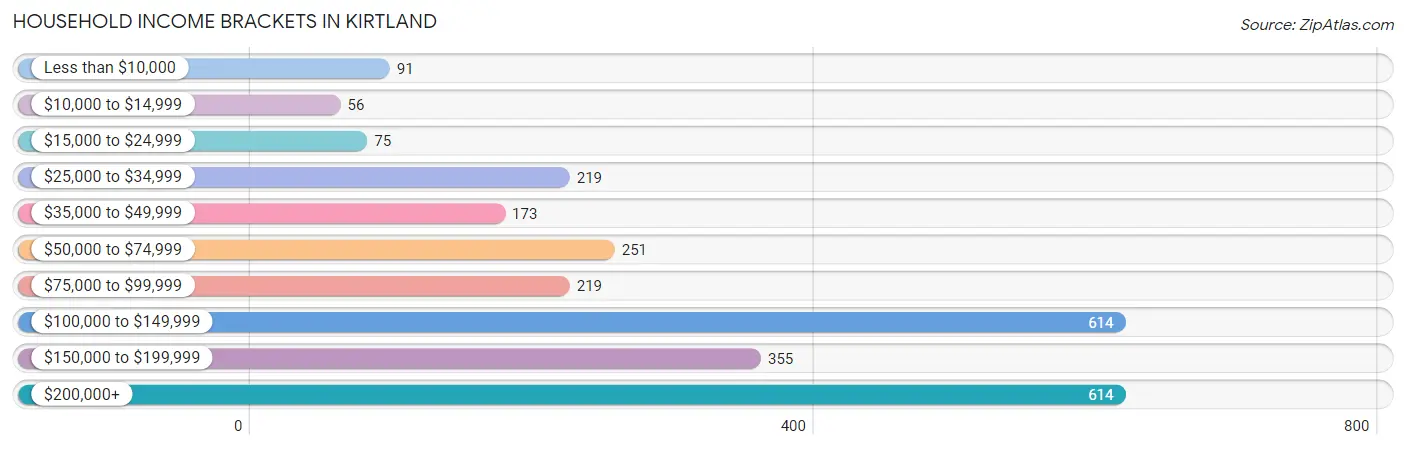
| Income Bracket | # Households | % Households |
| Less than $10,000 | 91 | 3.4% |
| $10,000 to $14,999 | 56 | 2.1% |
| $15,000 to $24,999 | 75 | 2.8% |
| $25,000 to $34,999 | 219 | 8.2% |
| $35,000 to $49,999 | 173 | 6.5% |
| $50,000 to $74,999 | 251 | 9.4% |
| $75,000 to $99,999 | 219 | 8.2% |
| $100,000 to $149,999 | 614 | 23.0% |
| $150,000 to $199,999 | 355 | 13.3% |
| $200,000+ | 614 | 23.0% |
Household Income by Householder Age in Kirtland
The median household income in Kirtland is $111,184, with the highest median household income of $155,417 found in the 45 to 64 years age bracket for the primary householder. A total of 1,115 households (41.8%) fall into this category.
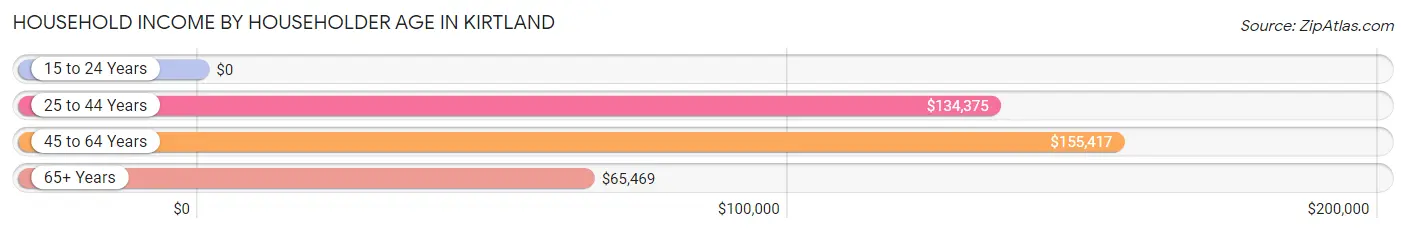
| Income Bracket | # Households | Median Income |
| 15 to 24 Years | 0 (0.0%) | $0 |
| 25 to 44 Years | 528 (19.8%) | $134,375 |
| 45 to 64 Years | 1,115 (41.8%) | $155,417 |
| 65+ Years | 1,025 (38.4%) | $65,469 |
| Total | 2,668 (100.0%) | $111,184 |
Poverty in Kirtland
Income Below Poverty by Sex and Age in Kirtland
With 4.8% poverty level for males and 4.1% for females among the residents of Kirtland, 6 to 11 year old males and 18 to 24 year old females are the most vulnerable to poverty, with 43 males (32.3%) and 64 females (28.4%) in their respective age groups living below the poverty level.
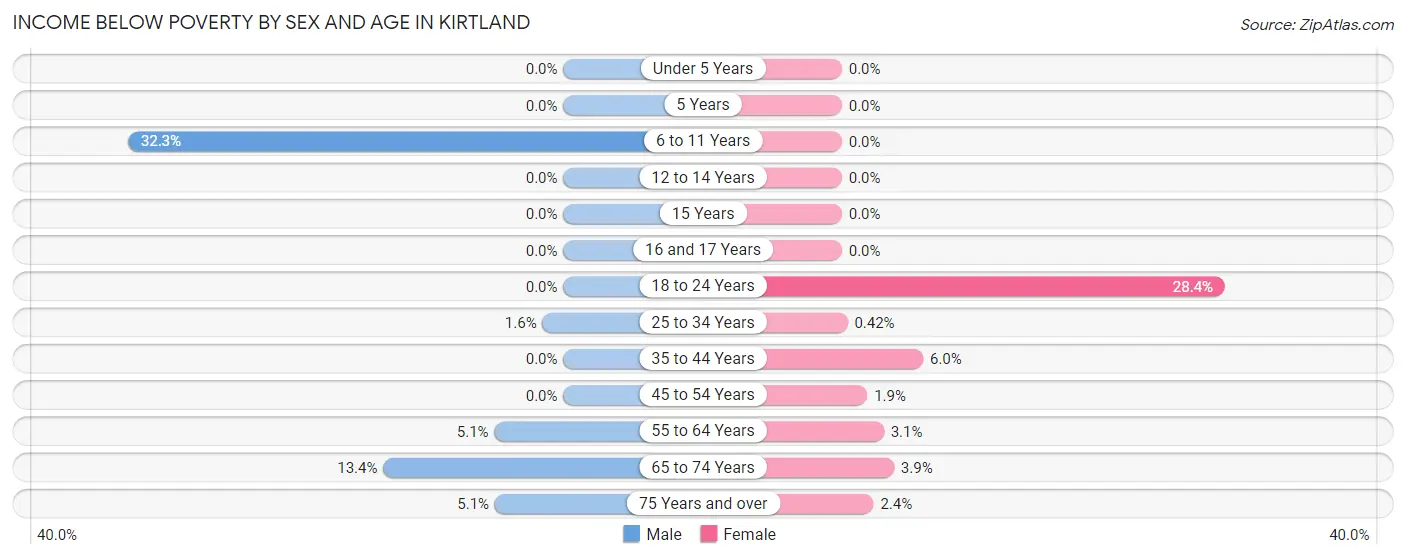
| Age Bracket | Male | Female |
| Under 5 Years | 0 (0.0%) | 0 (0.0%) |
| 5 Years | 0 (0.0%) | 0 (0.0%) |
| 6 to 11 Years | 43 (32.3%) | 0 (0.0%) |
| 12 to 14 Years | 0 (0.0%) | 0 (0.0%) |
| 15 Years | 0 (0.0%) | 0 (0.0%) |
| 16 and 17 Years | 0 (0.0%) | 0 (0.0%) |
| 18 to 24 Years | 0 (0.0%) | 64 (28.4%) |
| 25 to 34 Years | 5 (1.5%) | 1 (0.4%) |
| 35 to 44 Years | 0 (0.0%) | 21 (6.0%) |
| 45 to 54 Years | 0 (0.0%) | 9 (1.9%) |
| 55 to 64 Years | 24 (5.1%) | 18 (3.1%) |
| 65 to 74 Years | 77 (13.4%) | 16 (3.9%) |
| 75 Years and over | 13 (5.1%) | 10 (2.4%) |
| Total | 162 (4.8%) | 139 (4.1%) |
Income Above Poverty by Sex and Age in Kirtland
According to the poverty statistics in Kirtland, males aged under 5 years and females aged under 5 years are the age groups that are most secure financially, with 100.0% of males and 100.0% of females in these age groups living above the poverty line.
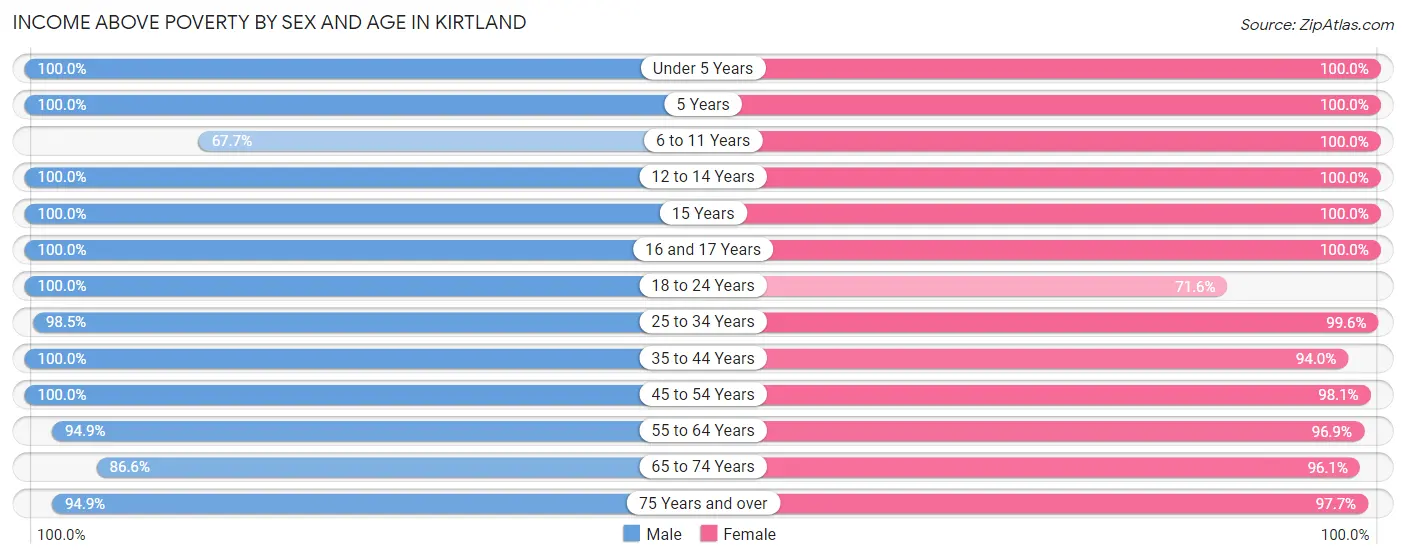
| Age Bracket | Male | Female |
| Under 5 Years | 149 (100.0%) | 84 (100.0%) |
| 5 Years | 24 (100.0%) | 11 (100.0%) |
| 6 to 11 Years | 90 (67.7%) | 308 (100.0%) |
| 12 to 14 Years | 175 (100.0%) | 160 (100.0%) |
| 15 Years | 17 (100.0%) | 91 (100.0%) |
| 16 and 17 Years | 145 (100.0%) | 76 (100.0%) |
| 18 to 24 Years | 226 (100.0%) | 161 (71.6%) |
| 25 to 34 Years | 317 (98.5%) | 236 (99.6%) |
| 35 to 44 Years | 310 (100.0%) | 327 (94.0%) |
| 45 to 54 Years | 550 (100.0%) | 468 (98.1%) |
| 55 to 64 Years | 445 (94.9%) | 560 (96.9%) |
| 65 to 74 Years | 499 (86.6%) | 397 (96.1%) |
| 75 Years and over | 243 (94.9%) | 416 (97.7%) |
| Total | 3,190 (95.2%) | 3,295 (96.0%) |
Income Below Poverty Among Married-Couple Families in Kirtland
The poverty statistics for married-couple families in Kirtland show that 1.0% or 17 of the total 1,749 families live below the poverty line. Families with no children have the highest poverty rate of 1.5%, comprising of 17 families. On the other hand, families with 1 or 2 children have the lowest poverty rate of 0.0%, which includes 0 families.
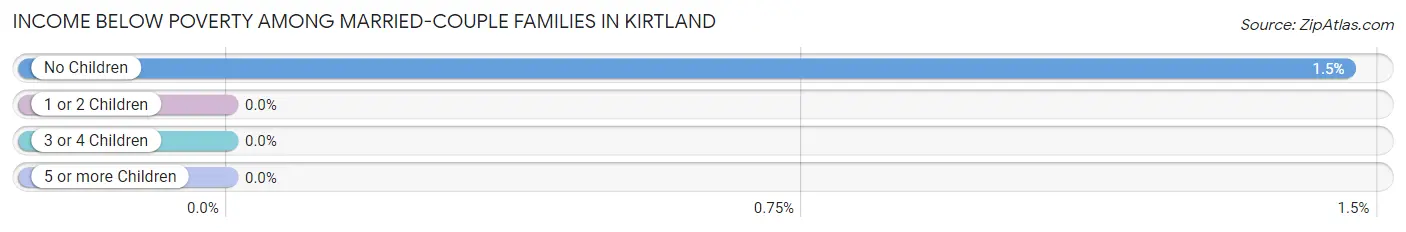
| Children | Above Poverty | Below Poverty |
| No Children | 1,144 (98.5%) | 17 (1.5%) |
| 1 or 2 Children | 467 (100.0%) | 0 (0.0%) |
| 3 or 4 Children | 121 (100.0%) | 0 (0.0%) |
| 5 or more Children | 0 (0.0%) | 0 (0.0%) |
| Total | 1,732 (99.0%) | 17 (1.0%) |
Income Below Poverty Among Single-Parent Households in Kirtland
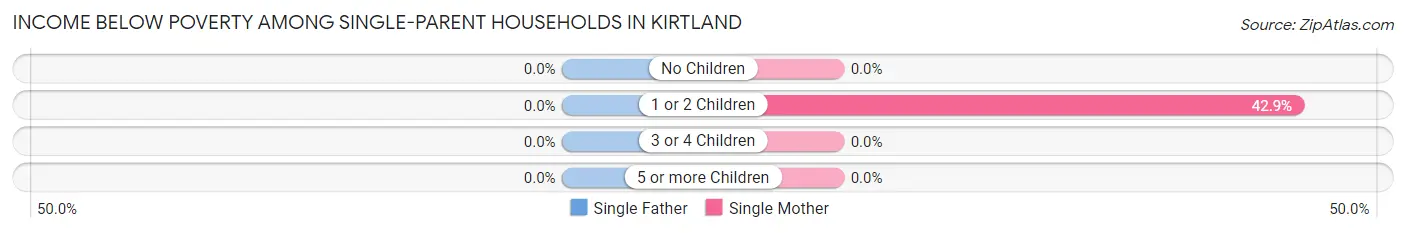
| Children | Single Father | Single Mother |
| No Children | 0 (0.0%) | 0 (0.0%) |
| 1 or 2 Children | 0 (0.0%) | 21 (42.9%) |
| 3 or 4 Children | 0 (0.0%) | 0 (0.0%) |
| 5 or more Children | 0 (0.0%) | 0 (0.0%) |
| Total | 0 (0.0%) | 21 (16.5%) |
Income Below Poverty Among Married-Couple vs Single-Parent Households in Kirtland
The poverty data for Kirtland shows that 17 of the married-couple family households (1.0%) and 21 of the single-parent households (14.3%) are living below the poverty level. Within the married-couple family households, those with no children have the highest poverty rate, with 17 households (1.5%) falling below the poverty line. Among the single-parent households, those with 1 or 2 children have the highest poverty rate, with 21 household (30.4%) living below poverty.
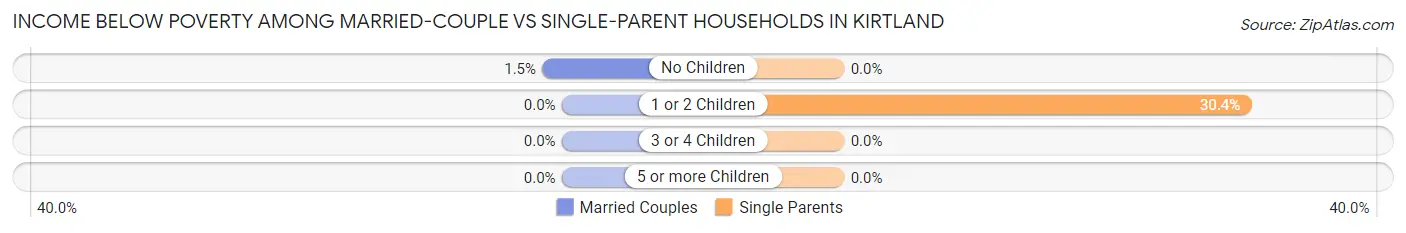
| Children | Married-Couple Families | Single-Parent Households |
| No Children | 17 (1.5%) | 0 (0.0%) |
| 1 or 2 Children | 0 (0.0%) | 21 (30.4%) |
| 3 or 4 Children | 0 (0.0%) | 0 (0.0%) |
| 5 or more Children | 0 (0.0%) | 0 (0.0%) |
| Total | 17 (1.0%) | 21 (14.3%) |
Race in Kirtland
The most populous races in Kirtland are White / Caucasian (6,611 | 95.6%), Two or more Races (229 | 3.3%), and Hispanic or Latino (96 | 1.4%).
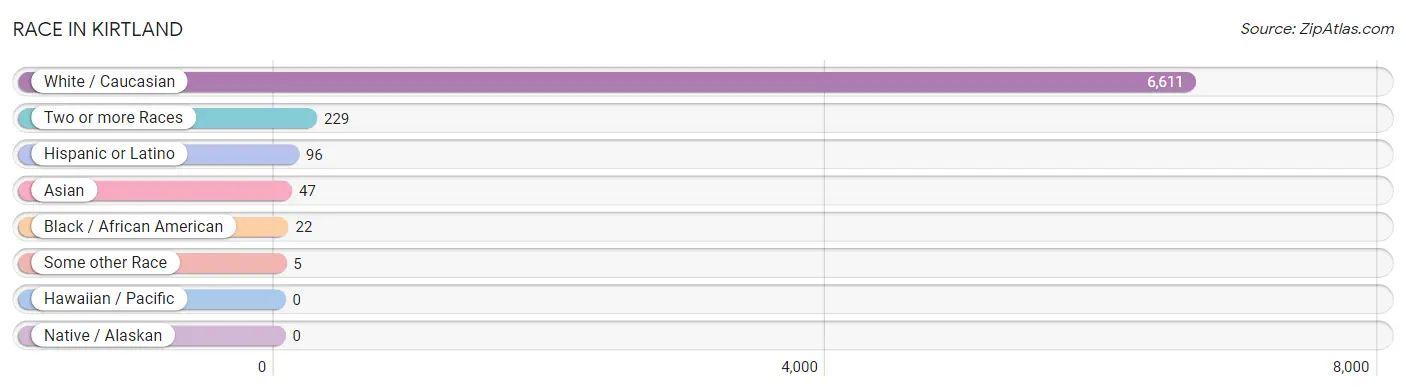
| Race | # Population | % Population |
| Asian | 47 | 0.7% |
| Black / African American | 22 | 0.3% |
| Hawaiian / Pacific | 0 | 0.0% |
| Hispanic or Latino | 96 | 1.4% |
| Native / Alaskan | 0 | 0.0% |
| White / Caucasian | 6,611 | 95.6% |
| Two or more Races | 229 | 3.3% |
| Some other Race | 5 | 0.1% |
| Total | 6,914 | 100.0% |
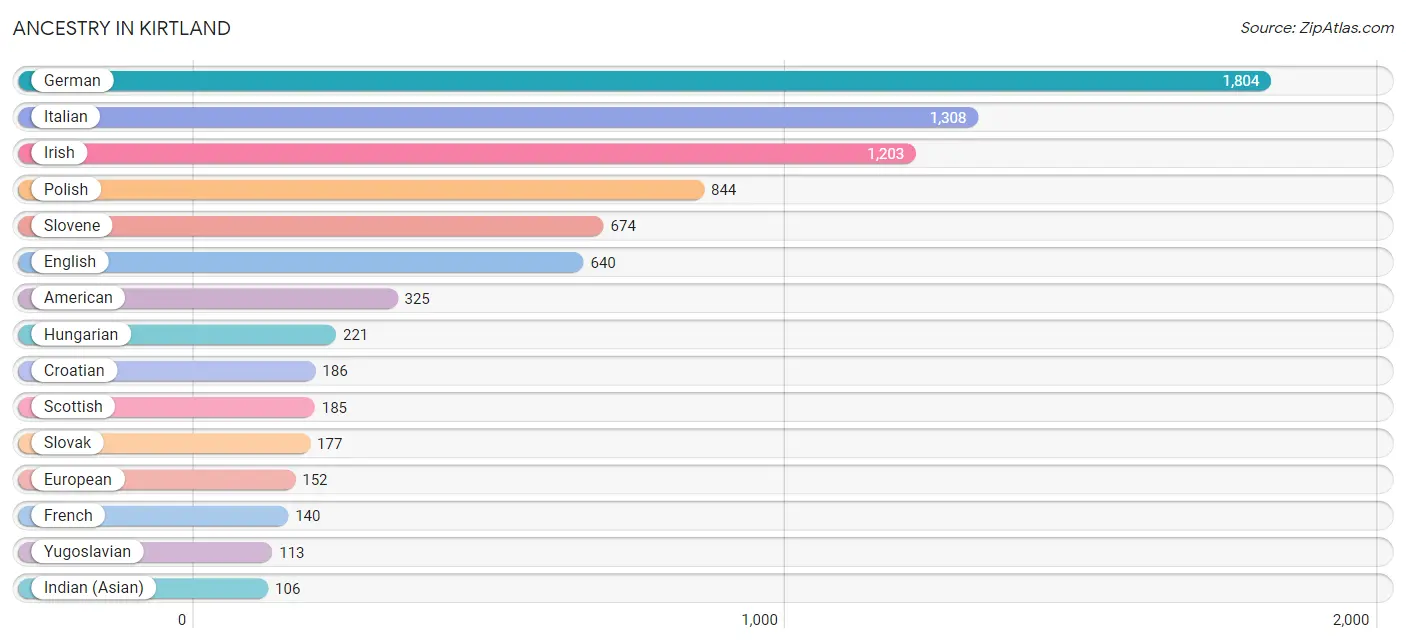
Ancestry in Kirtland
The most populous ancestries reported in Kirtland are German (1,804 | 26.1%), Italian (1,308 | 18.9%), Irish (1,203 | 17.4%), Polish (844 | 12.2%), and Slovene (674 | 9.8%), together accounting for 84.4% of all Kirtland residents.
| Ancestry | # Population | % Population |
| American | 325 | 4.7% |
| Arab | 51 | 0.7% |
| Armenian | 21 | 0.3% |
| Austrian | 26 | 0.4% |
| British | 38 | 0.5% |
| Burmese | 65 | 0.9% |
| Canadian | 4 | 0.1% |
| Cherokee | 2 | 0.0% |
| Chippewa | 1 | 0.0% |
| Croatian | 186 | 2.7% |
| Czech | 71 | 1.0% |
| Danish | 19 | 0.3% |
| Dutch | 57 | 0.8% |
| Eastern European | 27 | 0.4% |
| English | 640 | 9.3% |
| European | 152 | 2.2% |
| Finnish | 20 | 0.3% |
| French | 140 | 2.0% |
| German | 1,804 | 26.1% |
| Greek | 20 | 0.3% |
| Hungarian | 221 | 3.2% |
| Indian (Asian) | 106 | 1.5% |
| Iranian | 13 | 0.2% |
| Irish | 1,203 | 17.4% |
| Italian | 1,308 | 18.9% |
| Latvian | 6 | 0.1% |
| Lebanese | 51 | 0.7% |
| Lithuanian | 24 | 0.4% |
| Macedonian | 7 | 0.1% |
| Mexican | 96 | 1.4% |
| Pennsylvania German | 9 | 0.1% |
| Polish | 844 | 12.2% |
| Russian | 61 | 0.9% |
| Scandinavian | 11 | 0.2% |
| Scotch-Irish | 74 | 1.1% |
| Scottish | 185 | 2.7% |
| Serbian | 20 | 0.3% |
| Slovak | 177 | 2.6% |
| Slovene | 674 | 9.8% |
| Swedish | 41 | 0.6% |
| Thai | 23 | 0.3% |
| Ukrainian | 18 | 0.3% |
| Welsh | 55 | 0.8% |
| Yugoslavian | 113 | 1.6% | View All 44 Rows |
Immigrants in Kirtland
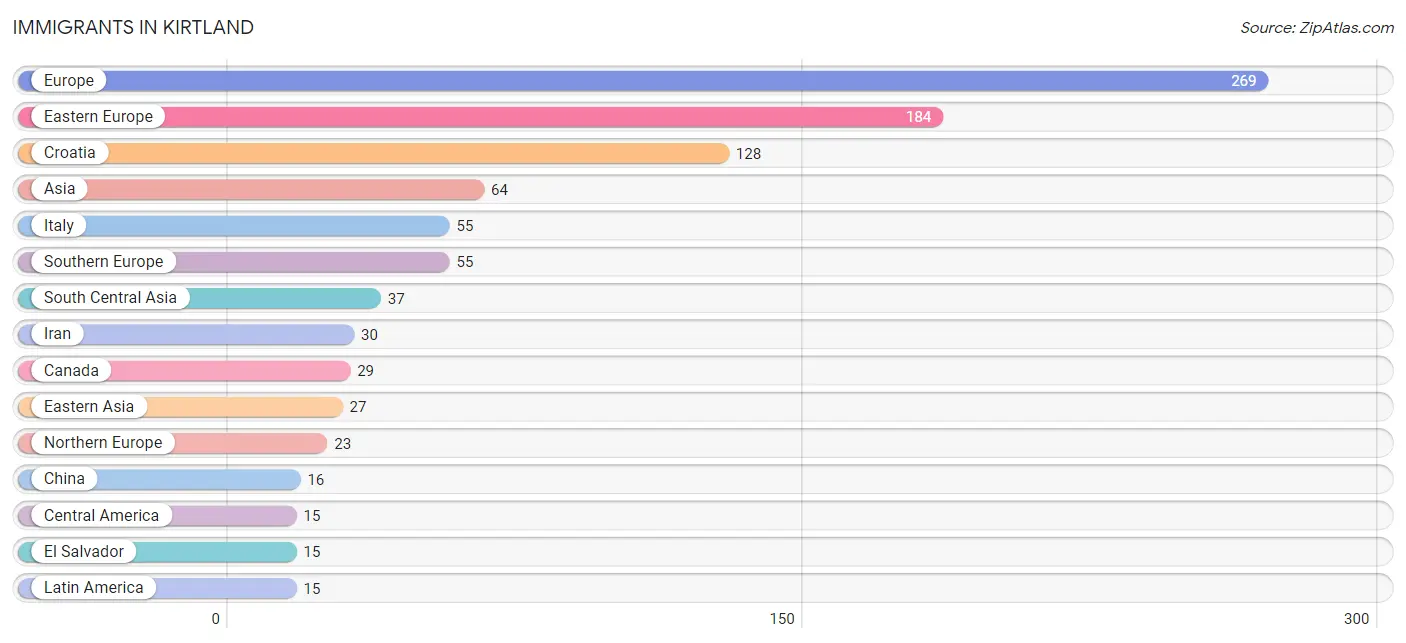
The most numerous immigrant groups reported in Kirtland came from Europe (269 | 3.9%), Eastern Europe (184 | 2.7%), Croatia (128 | 1.8%), Asia (64 | 0.9%), and Italy (55 | 0.8%), together accounting for 10.1% of all Kirtland residents.
| Immigration Origin | # Population | % Population |
| Asia | 64 | 0.9% |
| Canada | 29 | 0.4% |
| Central America | 15 | 0.2% |
| China | 16 | 0.2% |
| Croatia | 128 | 1.8% |
| Eastern Asia | 27 | 0.4% |
| Eastern Europe | 184 | 2.7% |
| El Salvador | 15 | 0.2% |
| Europe | 269 | 3.9% |
| Germany | 7 | 0.1% |
| India | 7 | 0.1% |
| Iran | 30 | 0.4% |
| Italy | 55 | 0.8% |
| Korea | 11 | 0.2% |
| Latin America | 15 | 0.2% |
| Northern Europe | 23 | 0.3% |
| Poland | 7 | 0.1% |
| South Central Asia | 37 | 0.5% |
| Southern Europe | 55 | 0.8% |
| Sweden | 10 | 0.1% |
| Western Europe | 7 | 0.1% | View All 21 Rows |
Sex and Age in Kirtland
Sex and Age in Kirtland
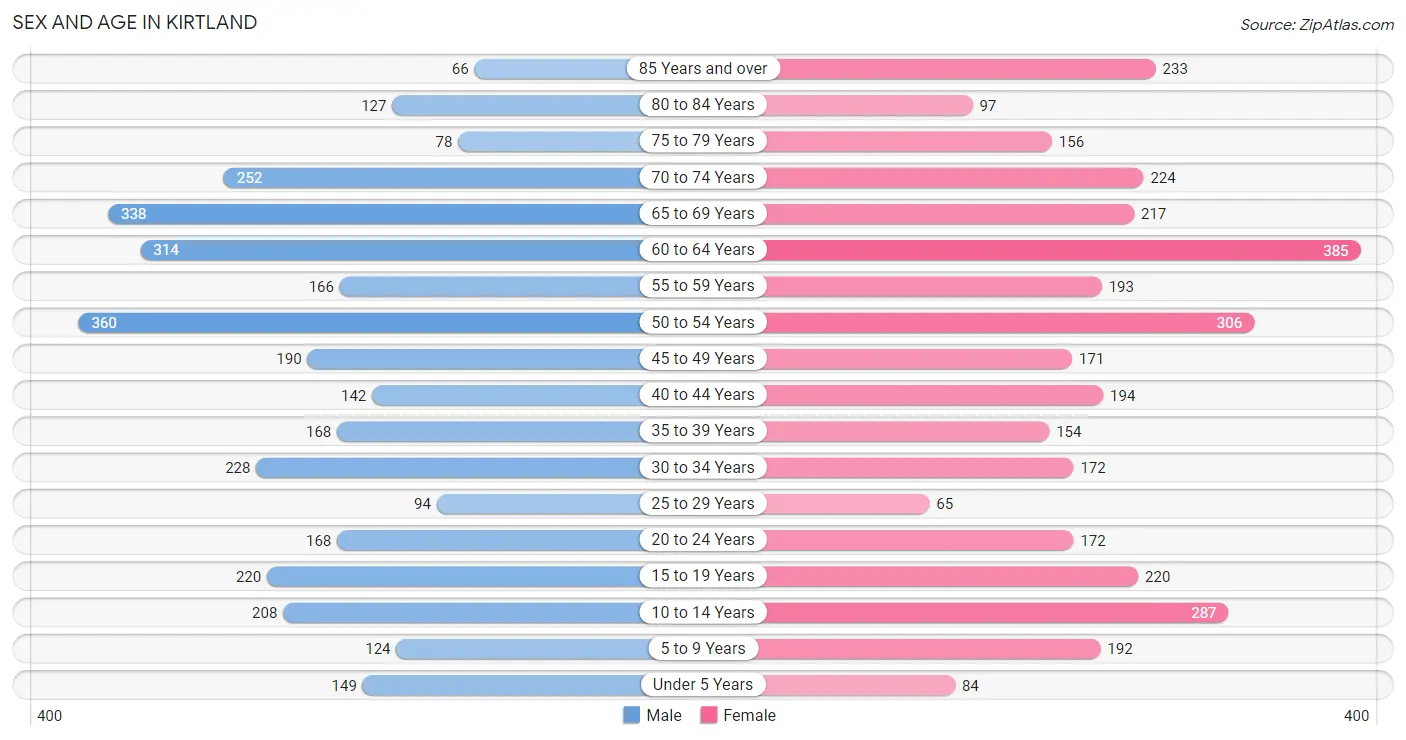
The most populous age groups in Kirtland are 50 to 54 Years (360 | 10.6%) for men and 60 to 64 Years (385 | 10.9%) for women.
| Age Bracket | Male | Female |
| Under 5 Years | 149 (4.4%) | 84 (2.4%) |
| 5 to 9 Years | 124 (3.7%) | 192 (5.4%) |
| 10 to 14 Years | 208 (6.1%) | 287 (8.2%) |
| 15 to 19 Years | 220 (6.5%) | 220 (6.2%) |
| 20 to 24 Years | 168 (5.0%) | 172 (4.9%) |
| 25 to 29 Years | 94 (2.8%) | 65 (1.8%) |
| 30 to 34 Years | 228 (6.7%) | 172 (4.9%) |
| 35 to 39 Years | 168 (5.0%) | 154 (4.4%) |
| 40 to 44 Years | 142 (4.2%) | 194 (5.5%) |
| 45 to 49 Years | 190 (5.6%) | 171 (4.9%) |
| 50 to 54 Years | 360 (10.6%) | 306 (8.7%) |
| 55 to 59 Years | 166 (4.9%) | 193 (5.5%) |
| 60 to 64 Years | 314 (9.3%) | 385 (10.9%) |
| 65 to 69 Years | 338 (10.0%) | 217 (6.2%) |
| 70 to 74 Years | 252 (7.4%) | 224 (6.4%) |
| 75 to 79 Years | 78 (2.3%) | 156 (4.4%) |
| 80 to 84 Years | 127 (3.7%) | 97 (2.8%) |
| 85 Years and over | 66 (1.9%) | 233 (6.6%) |
| Total | 3,392 (100.0%) | 3,522 (100.0%) |
Families and Households in Kirtland
Median Family Size in Kirtland
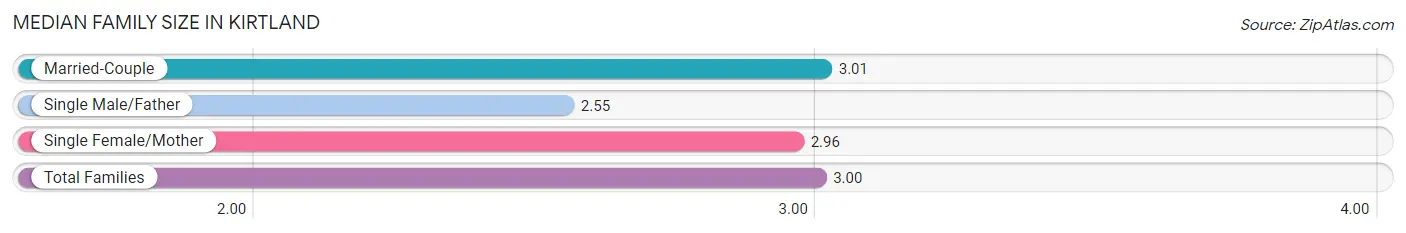
The median family size in Kirtland is 3.00 persons per family, with married-couple families (1,749 | 92.2%) accounting for the largest median family size of 3.01 persons per family. On the other hand, single male/father families (20 | 1.1%) represent the smallest median family size with 2.55 persons per family.
| Family Type | # Families | Family Size |
| Married-Couple | 1,749 (92.2%) | 3.01 |
| Single Male/Father | 20 (1.1%) | 2.55 |
| Single Female/Mother | 127 (6.7%) | 2.96 |
| Total Families | 1,896 (100.0%) | 3.00 |
Median Household Size in Kirtland
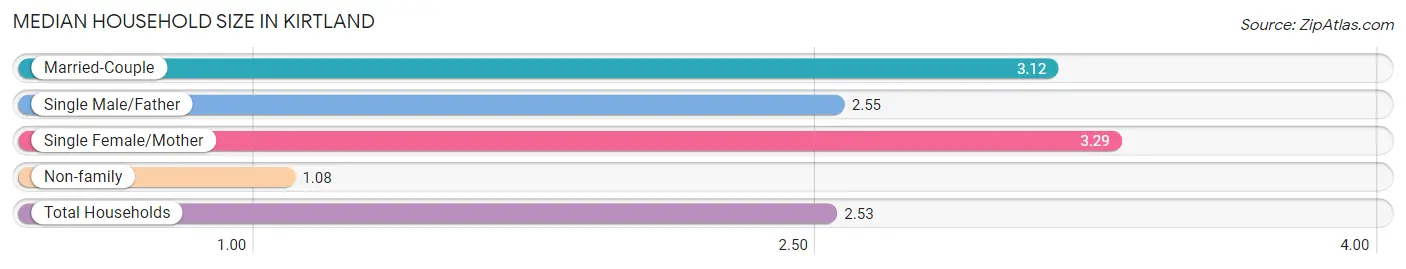
The median household size in Kirtland is 2.53 persons per household, with single female/mother households (127 | 4.8%) accounting for the largest median household size of 3.29 persons per household. non-family households (772 | 28.9%) represent the smallest median household size with 1.08 persons per household.
| Household Type | # Households | Household Size |
| Married-Couple | 1,749 (65.5%) | 3.12 |
| Single Male/Father | 20 (0.7%) | 2.55 |
| Single Female/Mother | 127 (4.8%) | 3.29 |
| Non-family | 772 (28.9%) | 1.08 |
| Total Households | 2,668 (100.0%) | 2.53 |
Household Size by Marriage Status in Kirtland
Out of a total of 2,668 households in Kirtland, 1,896 (71.1%) are family households, while 772 (28.9%) are nonfamily households. The most numerous type of family households are 2-person households, comprising 956, and the most common type of nonfamily households are 1-person households, comprising 713.
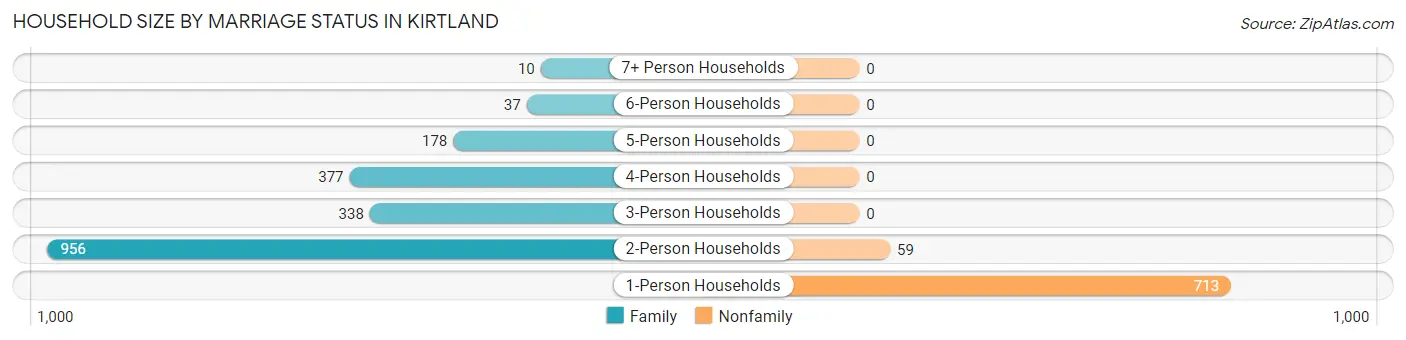
| Household Size | Family Households | Nonfamily Households |
| 1-Person Households | - | 713 (26.7%) |
| 2-Person Households | 956 (35.8%) | 59 (2.2%) |
| 3-Person Households | 338 (12.7%) | 0 (0.0%) |
| 4-Person Households | 377 (14.1%) | 0 (0.0%) |
| 5-Person Households | 178 (6.7%) | 0 (0.0%) |
| 6-Person Households | 37 (1.4%) | 0 (0.0%) |
| 7+ Person Households | 10 (0.4%) | 0 (0.0%) |
| Total | 1,896 (71.1%) | 772 (28.9%) |
Female Fertility in Kirtland
Fertility by Age in Kirtland
Average fertility rate in Kirtland is 72.0 births per 1,000 women. Women in the age bracket of 20 to 34 years have the highest fertility rate with 159.0 births per 1,000 women. Women in the age bracket of 20 to 34 years acount for 78.3% of all women with births.
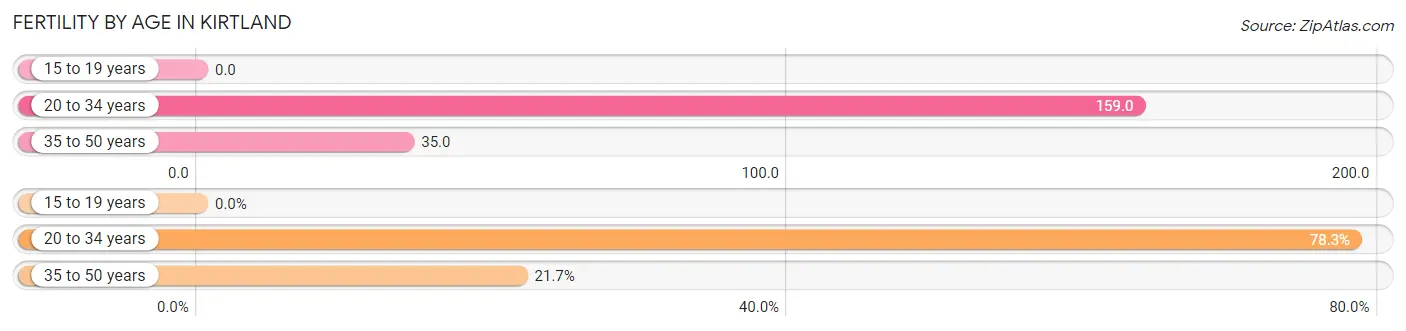
| Age Bracket | Women with Births | Births / 1,000 Women |
| 15 to 19 years | 0 (0.0%) | 0.0 |
| 20 to 34 years | 65 (78.3%) | 159.0 |
| 35 to 50 years | 18 (21.7%) | 35.0 |
| Total | 83 (100.0%) | 72.0 |
Fertility by Age by Marriage Status in Kirtland
85.5% of women with births (83) in Kirtland are married. The highest percentage of unmarried women with births falls into 20 to 34 years age bracket with 18.5% of them unmarried at the time of birth, while the lowest percentage of unmarried women with births belong to 35 to 50 years age bracket with 0.0% of them unmarried.
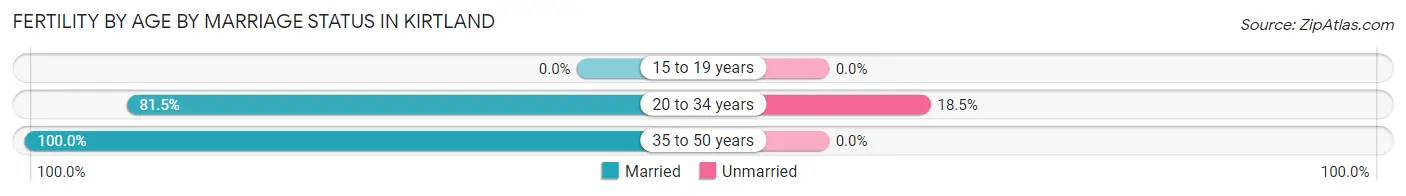
| Age Bracket | Married | Unmarried |
| 15 to 19 years | 0 (0.0%) | 0 (0.0%) |
| 20 to 34 years | 53 (81.5%) | 12 (18.5%) |
| 35 to 50 years | 18 (100.0%) | 0 (0.0%) |
| Total | 71 (85.5%) | 12 (14.5%) |
Fertility by Education in Kirtland
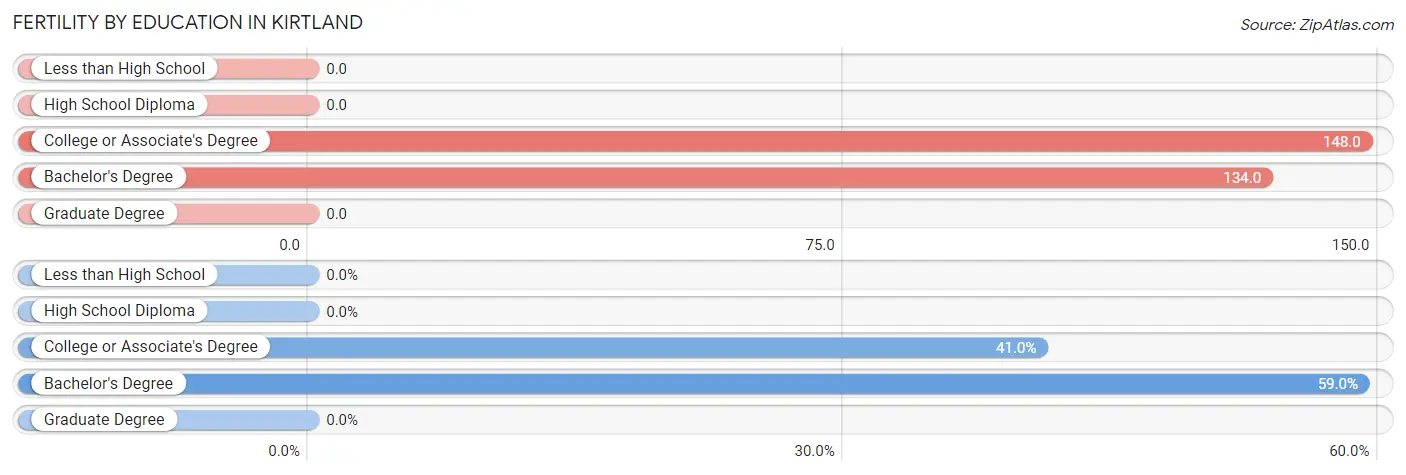
| Educational Attainment | Women with Births | Births / 1,000 Women |
| Less than High School | 0 (0.0%) | 0.0 |
| High School Diploma | 0 (0.0%) | 0.0 |
| College or Associate's Degree | 34 (41.0%) | 148.0 |
| Bachelor's Degree | 49 (59.0%) | 134.0 |
| Graduate Degree | 0 (0.0%) | 0.0 |
| Total | 83 (100.0%) | 72.0 |
Fertility by Education by Marriage Status in Kirtland
14.5% of women with births in Kirtland are unmarried. Women with the educational attainment of bachelor's degree are most likely to be married with 100.0% of them married at childbirth, while women with the educational attainment of college or associate's degree are least likely to be married with 35.3% of them unmarried at childbirth.
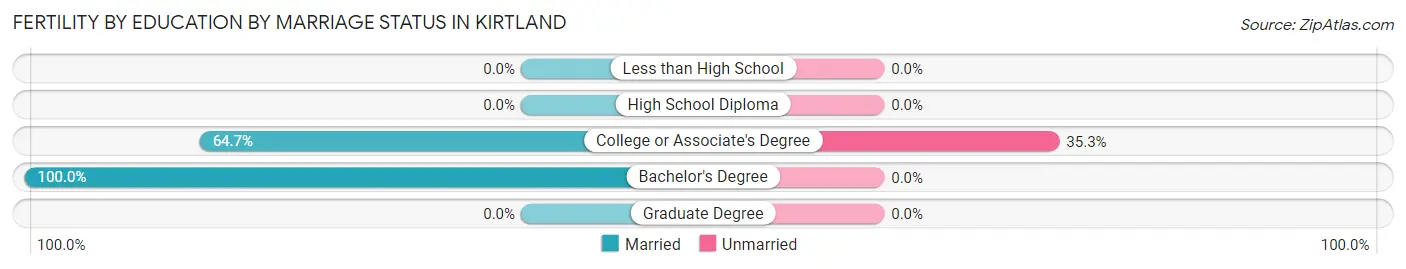
| Educational Attainment | Married | Unmarried |
| Less than High School | 0 (0.0%) | 0 (0.0%) |
| High School Diploma | 0 (0.0%) | 0 (0.0%) |
| College or Associate's Degree | 22 (64.7%) | 12 (35.3%) |
| Bachelor's Degree | 49 (100.0%) | 0 (0.0%) |
| Graduate Degree | 0 (0.0%) | 0 (0.0%) |
| Total | 71 (85.5%) | 12 (14.5%) |
Employment Characteristics in Kirtland
Employment by Class of Employer in Kirtland
Among the 3,442 employed individuals in Kirtland, private company employees (2,247 | 65.3%), not-for-profit organizations (410 | 11.9%), and local government employees (357 | 10.4%) make up the most common classes of employment.
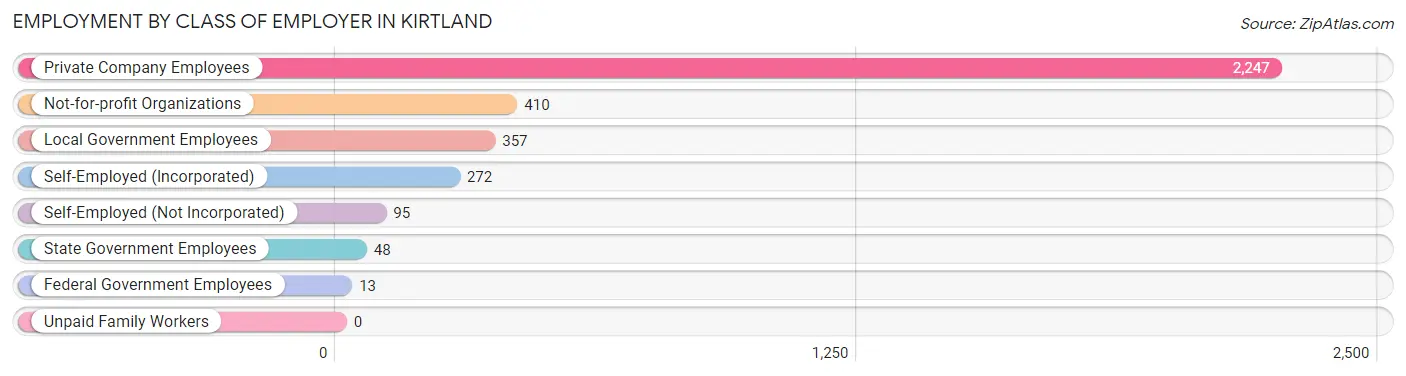
| Employer Class | # Employees | % Employees |
| Private Company Employees | 2,247 | 65.3% |
| Self-Employed (Incorporated) | 272 | 7.9% |
| Self-Employed (Not Incorporated) | 95 | 2.8% |
| Not-for-profit Organizations | 410 | 11.9% |
| Local Government Employees | 357 | 10.4% |
| State Government Employees | 48 | 1.4% |
| Federal Government Employees | 13 | 0.4% |
| Unpaid Family Workers | 0 | 0.0% |
| Total | 3,442 | 100.0% |
Employment Status by Age in Kirtland
According to the labor force statistics for Kirtland, out of the total population over 16 years of age (5,762), 62.5% or 3,601 individuals are in the labor force, with 3.1% or 112 of them unemployed. The age group with the highest labor force participation rate is 25 to 29 years, with 96.2% or 153 individuals in the labor force. Within the labor force, the 25 to 29 years age range has the highest percentage of unemployed individuals, with 11.1% or 17 of them being unemployed.
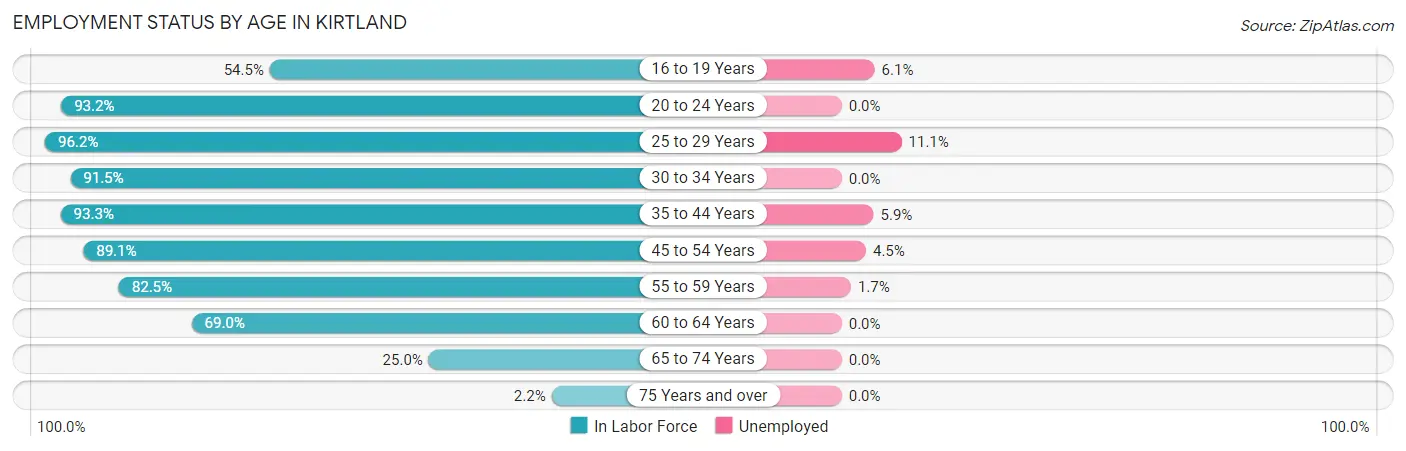
| Age Bracket | In Labor Force | Unemployed |
| 16 to 19 Years | 181 (54.5%) | 11 (6.1%) |
| 20 to 24 Years | 317 (93.2%) | 0 (0.0%) |
| 25 to 29 Years | 153 (96.2%) | 17 (11.1%) |
| 30 to 34 Years | 366 (91.5%) | 0 (0.0%) |
| 35 to 44 Years | 614 (93.3%) | 36 (5.9%) |
| 45 to 54 Years | 915 (89.1%) | 41 (4.5%) |
| 55 to 59 Years | 296 (82.5%) | 5 (1.7%) |
| 60 to 64 Years | 482 (69.0%) | 0 (0.0%) |
| 65 to 74 Years | 258 (25.0%) | 0 (0.0%) |
| 75 Years and over | 17 (2.2%) | 0 (0.0%) |
| Total | 3,601 (62.5%) | 112 (3.1%) |
Employment Status by Educational Attainment in Kirtland
According to labor force statistics for Kirtland, 85.6% of individuals (2,827) out of the total population between 25 and 64 years of age (3,302) are in the labor force, with 3.5% or 99 of them being unemployed. The group with the highest labor force participation rate are those with the educational attainment of bachelor's degree or higher, with 90.5% or 1,739 individuals in the labor force. Within the labor force, individuals with high school diploma education have the highest percentage of unemployment, with 16.6% or 79 of them being unemployed.
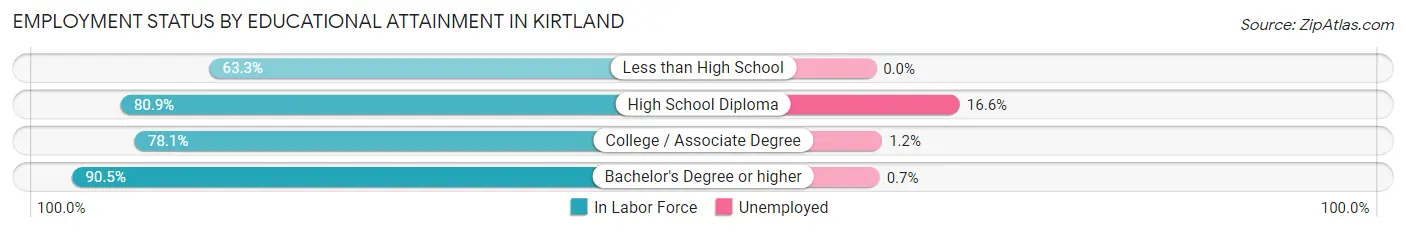
| Educational Attainment | In Labor Force | Unemployed |
| Less than High School | 31 (63.3%) | 0 (0.0%) |
| High School Diploma | 475 (80.9%) | 97 (16.6%) |
| College / Associate Degree | 582 (78.1%) | 9 (1.2%) |
| Bachelor's Degree or higher | 1,739 (90.5%) | 13 (0.7%) |
| Total | 2,827 (85.6%) | 116 (3.5%) |
Employment Occupations by Sex in Kirtland
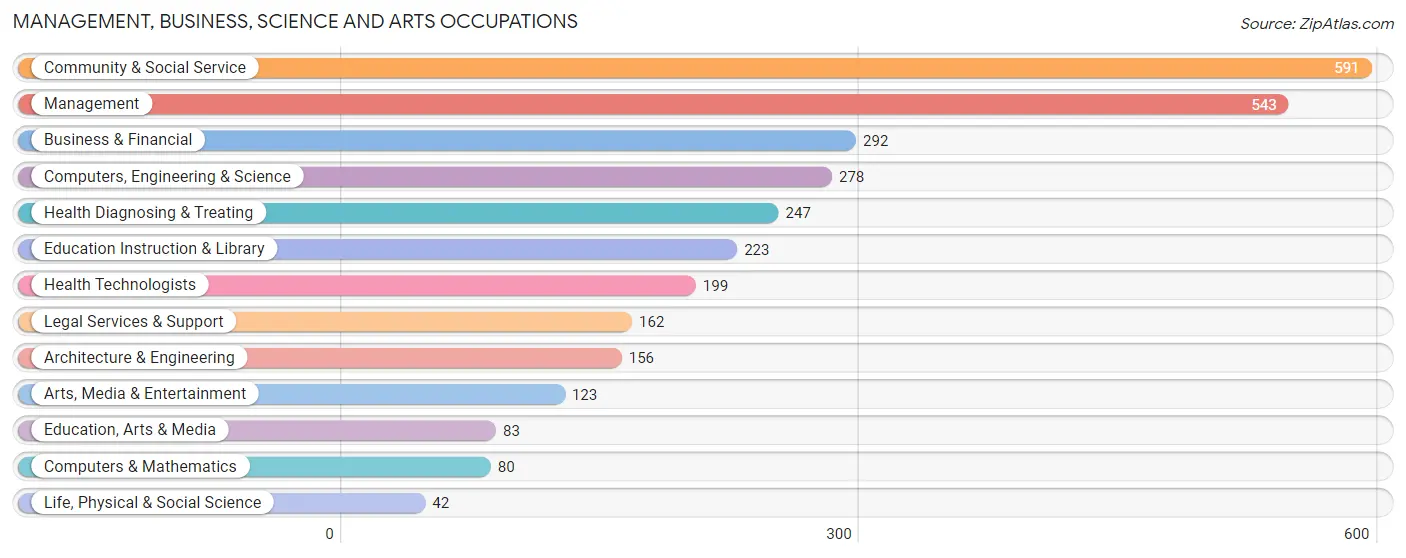
Management, Business, Science and Arts Occupations
The most common Management, Business, Science and Arts occupations in Kirtland are Community & Social Service (591 | 16.9%), Management (543 | 15.6%), Business & Financial (292 | 8.4%), Computers, Engineering & Science (278 | 8.0%), and Health Diagnosing & Treating (247 | 7.1%).
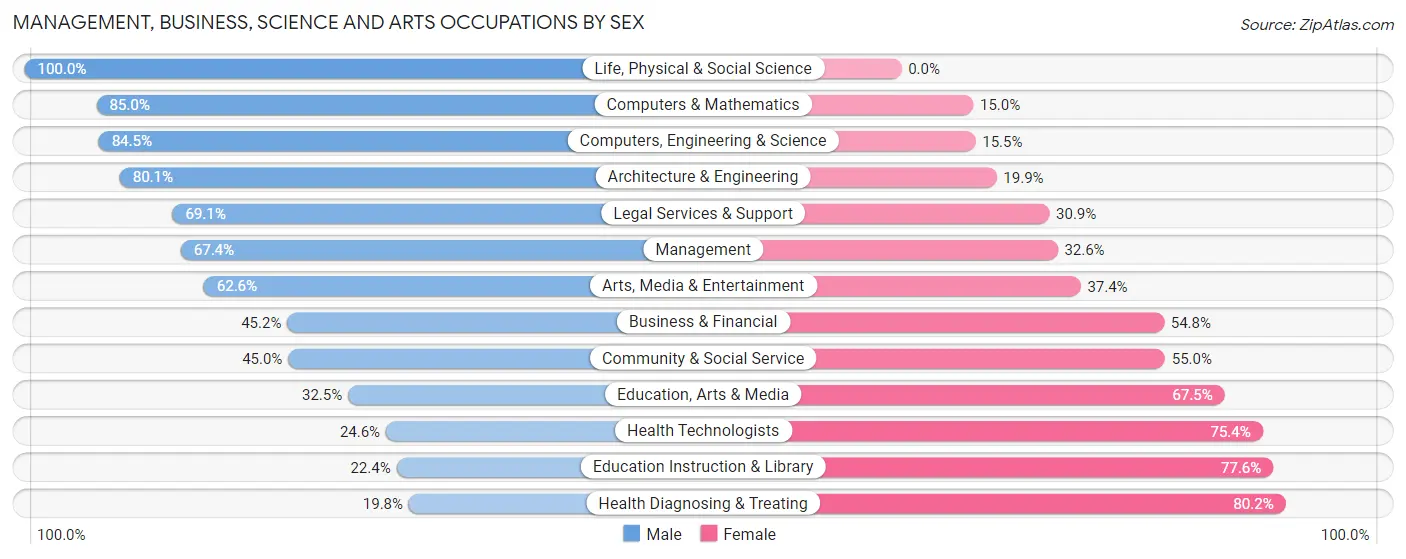
Management, Business, Science and Arts Occupations by Sex
Within the Management, Business, Science and Arts occupations in Kirtland, the most male-oriented occupations are Life, Physical & Social Science (100.0%), Computers & Mathematics (85.0%), and Computers, Engineering & Science (84.5%), while the most female-oriented occupations are Health Diagnosing & Treating (80.2%), Education Instruction & Library (77.6%), and Health Technologists (75.4%).
| Occupation | Male | Female |
| Management | 366 (67.4%) | 177 (32.6%) |
| Business & Financial | 132 (45.2%) | 160 (54.8%) |
| Computers, Engineering & Science | 235 (84.5%) | 43 (15.5%) |
| Computers & Mathematics | 68 (85.0%) | 12 (15.0%) |
| Architecture & Engineering | 125 (80.1%) | 31 (19.9%) |
| Life, Physical & Social Science | 42 (100.0%) | 0 (0.0%) |
| Community & Social Service | 266 (45.0%) | 325 (55.0%) |
| Education, Arts & Media | 27 (32.5%) | 56 (67.5%) |
| Legal Services & Support | 112 (69.1%) | 50 (30.9%) |
| Education Instruction & Library | 50 (22.4%) | 173 (77.6%) |
| Arts, Media & Entertainment | 77 (62.6%) | 46 (37.4%) |
| Health Diagnosing & Treating | 49 (19.8%) | 198 (80.2%) |
| Health Technologists | 49 (24.6%) | 150 (75.4%) |
| Total (Category) | 1,048 (53.7%) | 903 (46.3%) |
| Total (Overall) | 1,892 (54.2%) | 1,597 (45.8%) |
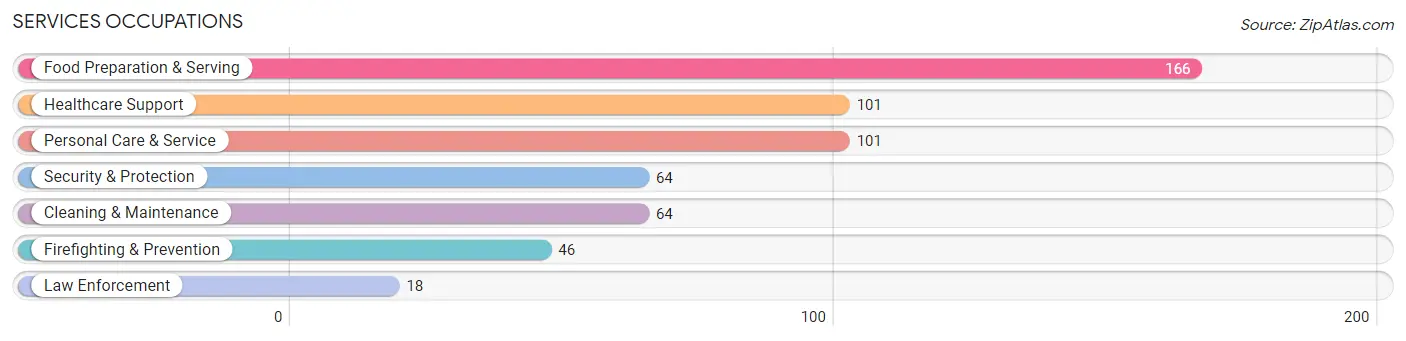
Services Occupations
The most common Services occupations in Kirtland are Food Preparation & Serving (166 | 4.8%), Healthcare Support (101 | 2.9%), Personal Care & Service (101 | 2.9%), Security & Protection (64 | 1.8%), and Cleaning & Maintenance (64 | 1.8%).
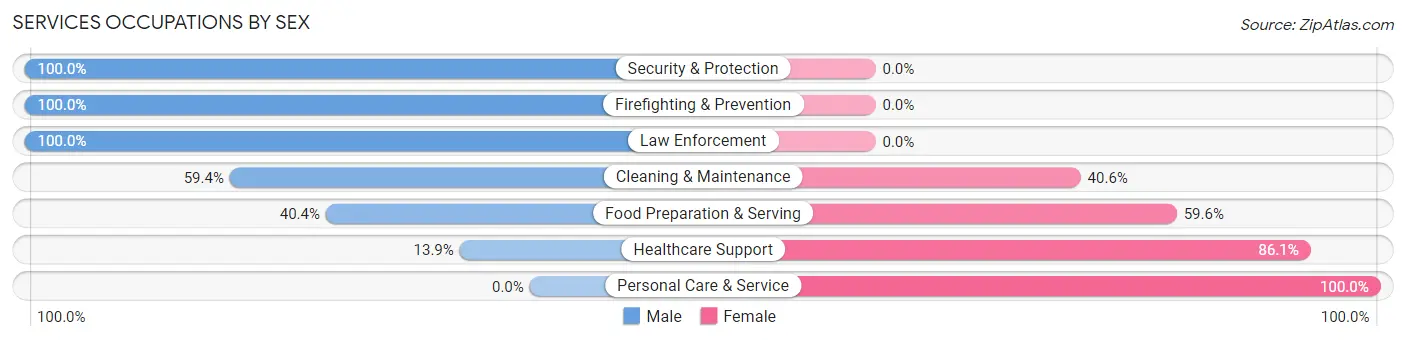
Services Occupations by Sex
Within the Services occupations in Kirtland, the most male-oriented occupations are Security & Protection (100.0%), Firefighting & Prevention (100.0%), and Law Enforcement (100.0%), while the most female-oriented occupations are Personal Care & Service (100.0%), Healthcare Support (86.1%), and Food Preparation & Serving (59.6%).
| Occupation | Male | Female |
| Healthcare Support | 14 (13.9%) | 87 (86.1%) |
| Security & Protection | 64 (100.0%) | 0 (0.0%) |
| Firefighting & Prevention | 46 (100.0%) | 0 (0.0%) |
| Law Enforcement | 18 (100.0%) | 0 (0.0%) |
| Food Preparation & Serving | 67 (40.4%) | 99 (59.6%) |
| Cleaning & Maintenance | 38 (59.4%) | 26 (40.6%) |
| Personal Care & Service | 0 (0.0%) | 101 (100.0%) |
| Total (Category) | 183 (36.9%) | 313 (63.1%) |
| Total (Overall) | 1,892 (54.2%) | 1,597 (45.8%) |
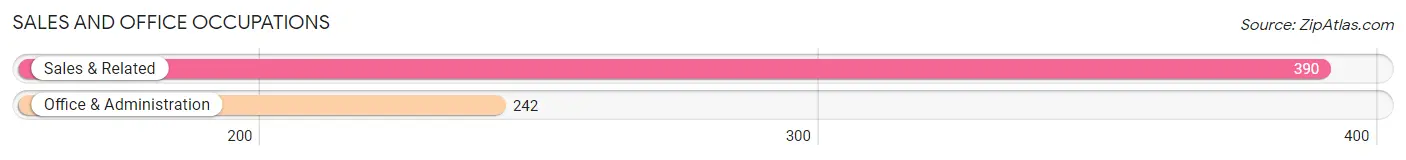
Sales and Office Occupations
The most common Sales and Office occupations in Kirtland are Sales & Related (390 | 11.2%), and Office & Administration (242 | 6.9%).
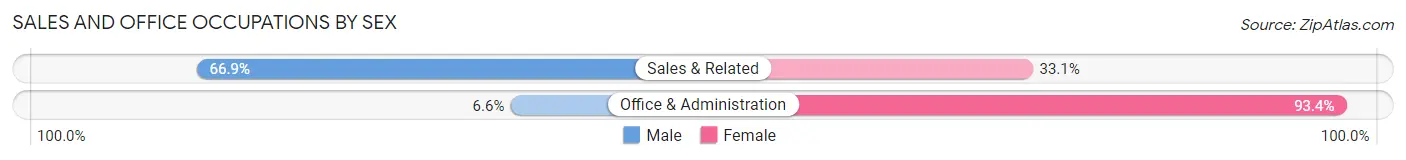
Sales and Office Occupations by Sex
| Occupation | Male | Female |
| Sales & Related | 261 (66.9%) | 129 (33.1%) |
| Office & Administration | 16 (6.6%) | 226 (93.4%) |
| Total (Category) | 277 (43.8%) | 355 (56.2%) |
| Total (Overall) | 1,892 (54.2%) | 1,597 (45.8%) |
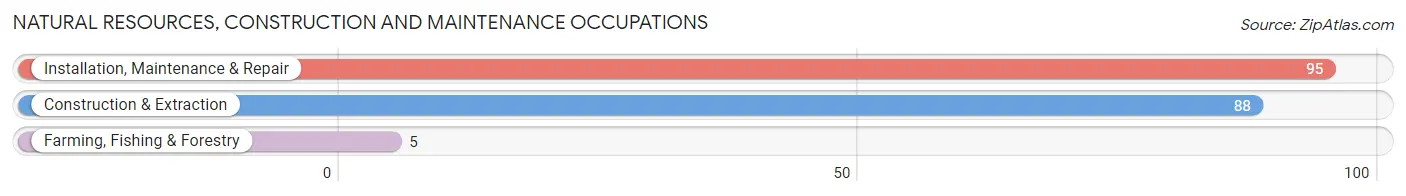
Natural Resources, Construction and Maintenance Occupations
The most common Natural Resources, Construction and Maintenance occupations in Kirtland are Installation, Maintenance & Repair (95 | 2.7%), Construction & Extraction (88 | 2.5%), and Farming, Fishing & Forestry (5 | 0.1%).
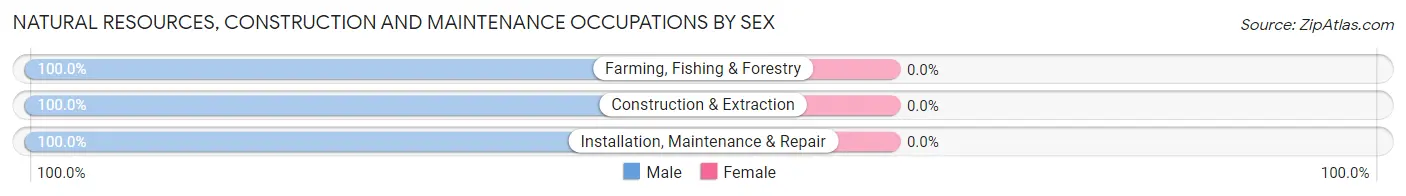
Natural Resources, Construction and Maintenance Occupations by Sex
| Occupation | Male | Female |
| Farming, Fishing & Forestry | 5 (100.0%) | 0 (0.0%) |
| Construction & Extraction | 88 (100.0%) | 0 (0.0%) |
| Installation, Maintenance & Repair | 95 (100.0%) | 0 (0.0%) |
| Total (Category) | 188 (100.0%) | 0 (0.0%) |
| Total (Overall) | 1,892 (54.2%) | 1,597 (45.8%) |
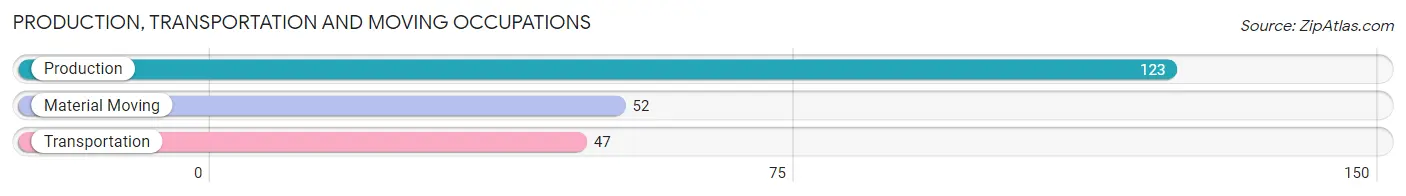
Production, Transportation and Moving Occupations
The most common Production, Transportation and Moving occupations in Kirtland are Production (123 | 3.5%), Material Moving (52 | 1.5%), and Transportation (47 | 1.3%).
Production, Transportation and Moving Occupations by Sex
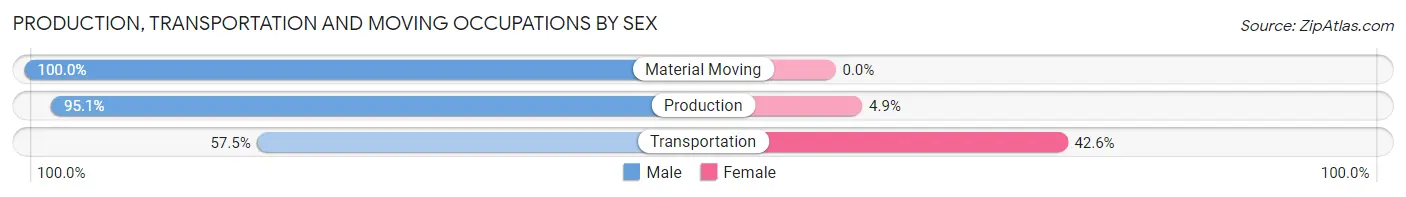
| Occupation | Male | Female |
| Production | 117 (95.1%) | 6 (4.9%) |
| Transportation | 27 (57.5%) | 20 (42.5%) |
| Material Moving | 52 (100.0%) | 0 (0.0%) |
| Total (Category) | 196 (88.3%) | 26 (11.7%) |
| Total (Overall) | 1,892 (54.2%) | 1,597 (45.8%) |
Employment Industries by Sex in Kirtland
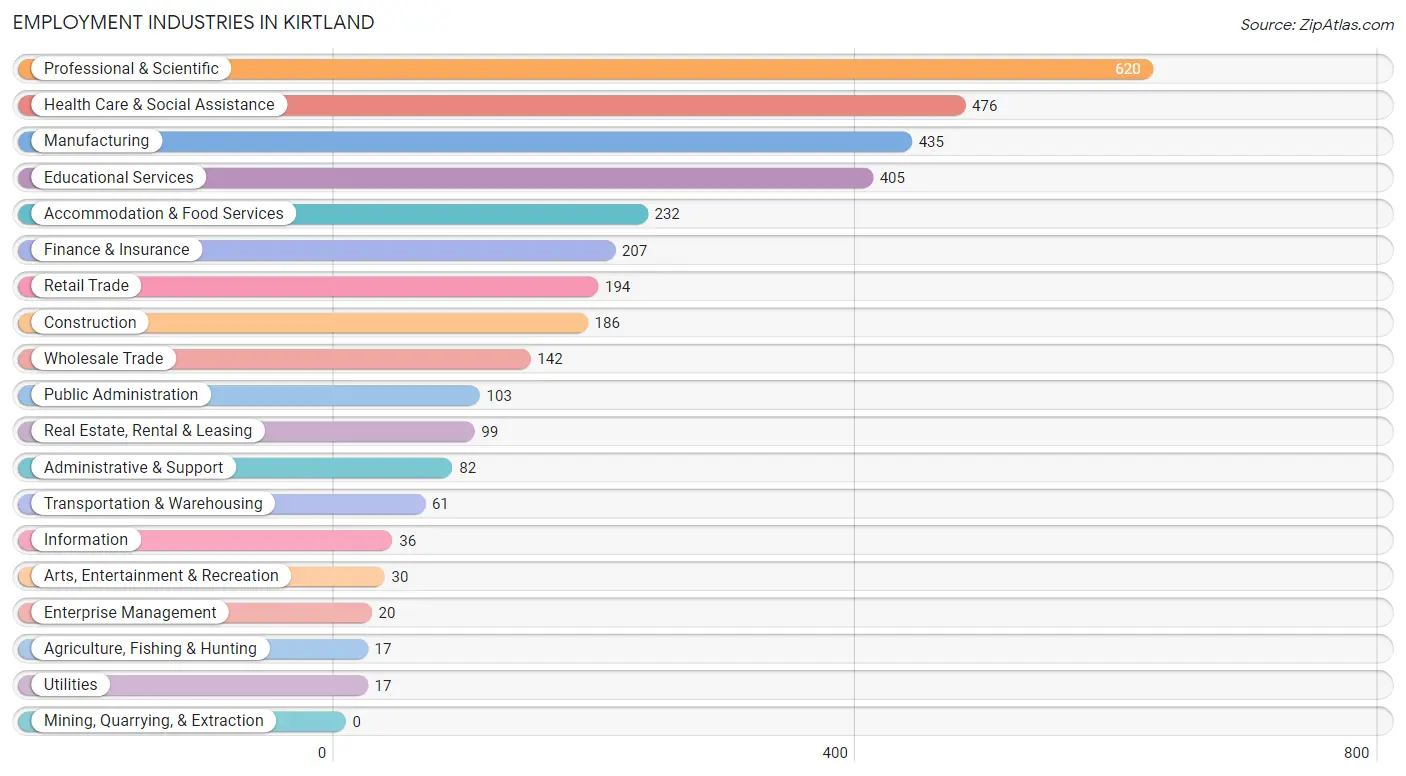
Employment Industries in Kirtland
The major employment industries in Kirtland include Professional & Scientific (620 | 17.8%), Health Care & Social Assistance (476 | 13.6%), Manufacturing (435 | 12.5%), Educational Services (405 | 11.6%), and Accommodation & Food Services (232 | 6.7%).
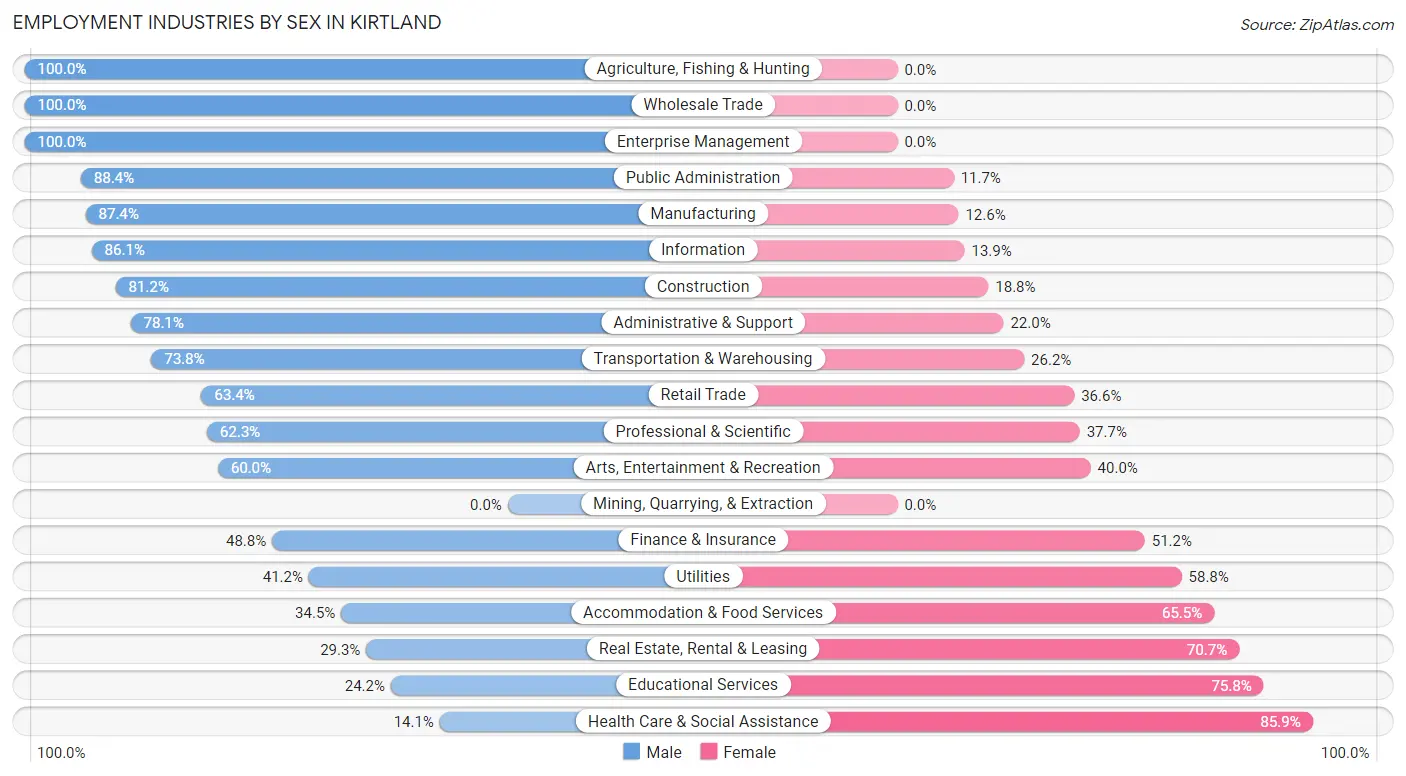
Employment Industries by Sex in Kirtland
The Kirtland industries that see more men than women are Agriculture, Fishing & Hunting (100.0%), Wholesale Trade (100.0%), and Enterprise Management (100.0%), whereas the industries that tend to have a higher number of women are Health Care & Social Assistance (85.9%), Educational Services (75.8%), and Real Estate, Rental & Leasing (70.7%).
| Industry | Male | Female |
| Agriculture, Fishing & Hunting | 17 (100.0%) | 0 (0.0%) |
| Mining, Quarrying, & Extraction | 0 (0.0%) | 0 (0.0%) |
| Construction | 151 (81.2%) | 35 (18.8%) |
| Manufacturing | 380 (87.4%) | 55 (12.6%) |
| Wholesale Trade | 142 (100.0%) | 0 (0.0%) |
| Retail Trade | 123 (63.4%) | 71 (36.6%) |
| Transportation & Warehousing | 45 (73.8%) | 16 (26.2%) |
| Utilities | 7 (41.2%) | 10 (58.8%) |
| Information | 31 (86.1%) | 5 (13.9%) |
| Finance & Insurance | 101 (48.8%) | 106 (51.2%) |
| Real Estate, Rental & Leasing | 29 (29.3%) | 70 (70.7%) |
| Professional & Scientific | 386 (62.3%) | 234 (37.7%) |
| Enterprise Management | 20 (100.0%) | 0 (0.0%) |
| Administrative & Support | 64 (78.0%) | 18 (22.0%) |
| Educational Services | 98 (24.2%) | 307 (75.8%) |
| Health Care & Social Assistance | 67 (14.1%) | 409 (85.9%) |
| Arts, Entertainment & Recreation | 18 (60.0%) | 12 (40.0%) |
| Accommodation & Food Services | 80 (34.5%) | 152 (65.5%) |
| Public Administration | 91 (88.3%) | 12 (11.7%) |
| Total | 1,892 (54.2%) | 1,597 (45.8%) |
Education in Kirtland
School Enrollment in Kirtland
The most common levels of schooling among the 1,509 students in Kirtland are high school (419 | 27.8%), middle school (413 | 27.4%), and elementary school (263 | 17.4%).
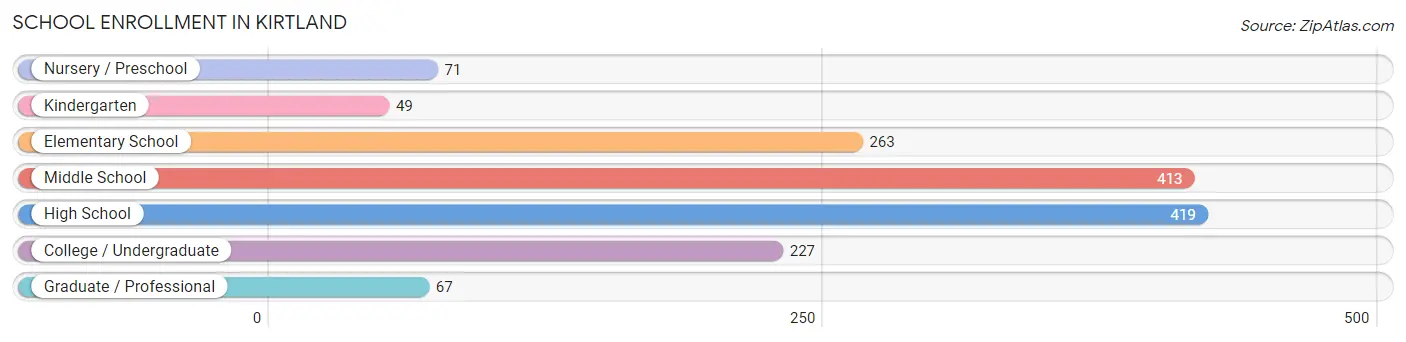
| School Level | # Students | % Students |
| Nursery / Preschool | 71 | 4.7% |
| Kindergarten | 49 | 3.3% |
| Elementary School | 263 | 17.4% |
| Middle School | 413 | 27.4% |
| High School | 419 | 27.8% |
| College / Undergraduate | 227 | 15.0% |
| Graduate / Professional | 67 | 4.4% |
| Total | 1,509 | 100.0% |
School Enrollment by Age by Funding Source in Kirtland
Out of a total of 1,509 students who are enrolled in schools in Kirtland, 250 (16.6%) attend a private institution, while the remaining 1,259 (83.4%) are enrolled in public schools. The age group of 18 to 19 year olds has the highest likelihood of being enrolled in private schools, with 28 (38.9% in the age bracket) enrolled. Conversely, the age group of 20 to 24 year olds has the lowest likelihood of being enrolled in a private school, with 81 (100.0% in the age bracket) attending a public institution.
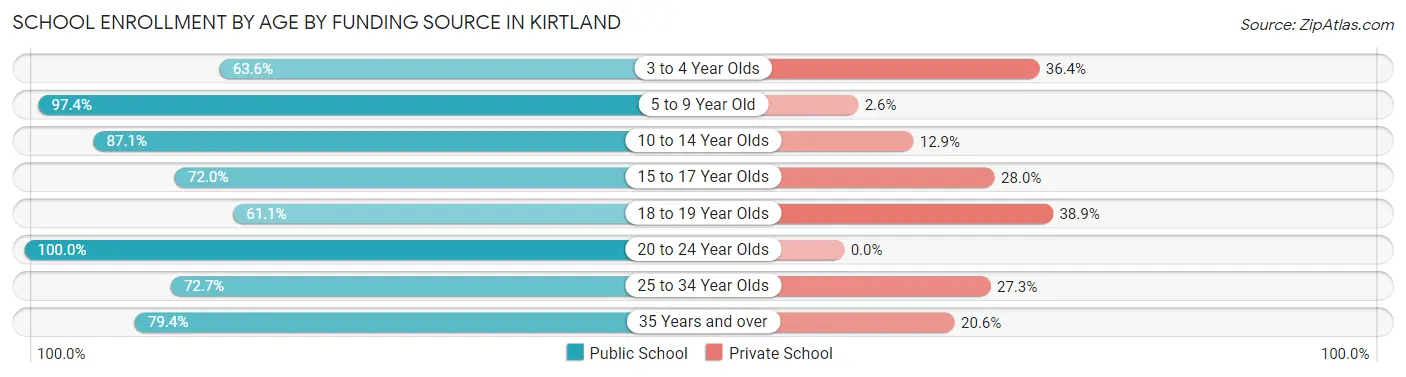
| Age Bracket | Public School | Private School |
| 3 to 4 Year Olds | 35 (63.6%) | 20 (36.4%) |
| 5 to 9 Year Old | 297 (97.4%) | 8 (2.6%) |
| 10 to 14 Year Olds | 413 (87.1%) | 61 (12.9%) |
| 15 to 17 Year Olds | 226 (72.0%) | 88 (28.0%) |
| 18 to 19 Year Olds | 44 (61.1%) | 28 (38.9%) |
| 20 to 24 Year Olds | 81 (100.0%) | 0 (0.0%) |
| 25 to 34 Year Olds | 24 (72.7%) | 9 (27.3%) |
| 35 Years and over | 139 (79.4%) | 36 (20.6%) |
| Total | 1,259 (83.4%) | 250 (16.6%) |
Educational Attainment by Field of Study in Kirtland
Business (632 | 24.4%), education (409 | 15.8%), engineering (353 | 13.7%), science & technology (228 | 8.8%), and social sciences (164 | 6.3%) are the most common fields of study among 2,587 individuals in Kirtland who have obtained a bachelor's degree or higher.
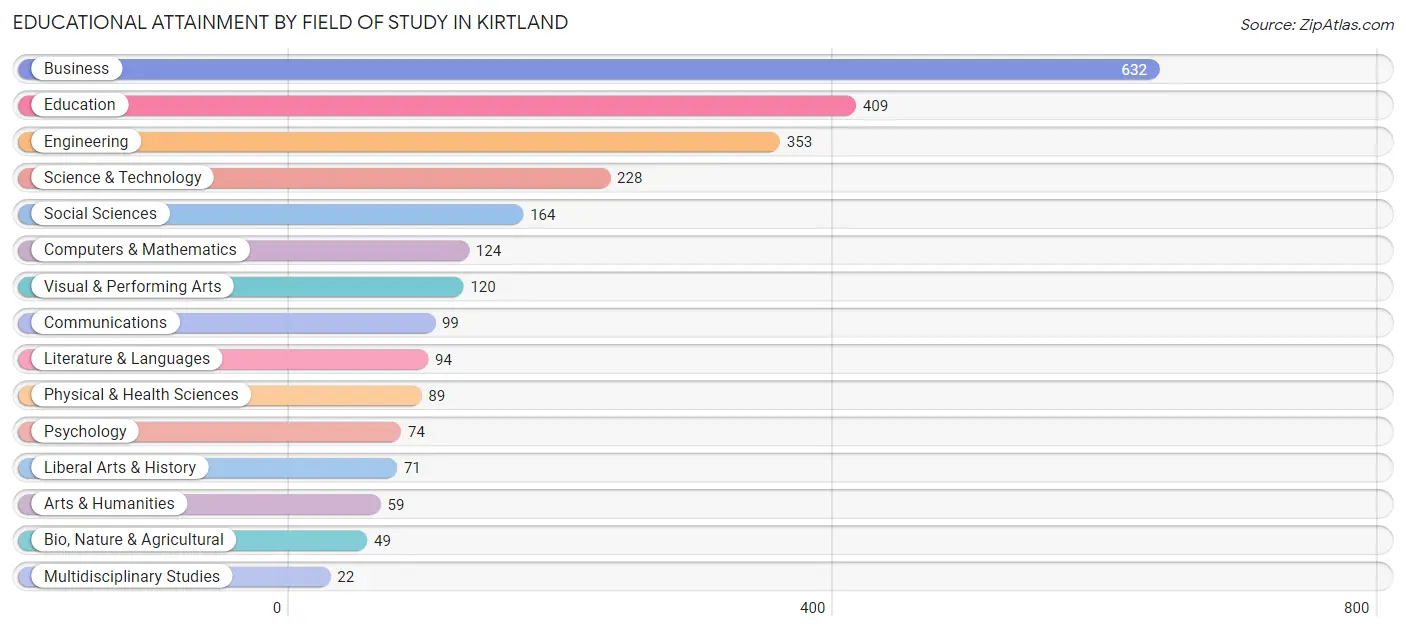
| Field of Study | # Graduates | % Graduates |
| Computers & Mathematics | 124 | 4.8% |
| Bio, Nature & Agricultural | 49 | 1.9% |
| Physical & Health Sciences | 89 | 3.4% |
| Psychology | 74 | 2.9% |
| Social Sciences | 164 | 6.3% |
| Engineering | 353 | 13.7% |
| Multidisciplinary Studies | 22 | 0.9% |
| Science & Technology | 228 | 8.8% |
| Business | 632 | 24.4% |
| Education | 409 | 15.8% |
| Literature & Languages | 94 | 3.6% |
| Liberal Arts & History | 71 | 2.7% |
| Visual & Performing Arts | 120 | 4.6% |
| Communications | 99 | 3.8% |
| Arts & Humanities | 59 | 2.3% |
| Total | 2,587 | 100.0% |
Transportation & Commute in Kirtland
Vehicle Availability by Sex in Kirtland
The most prevalent vehicle ownership categories in Kirtland are males with 2 vehicles (733, accounting for 39.5%) and females with 2 vehicles (602, making up 46.3%).
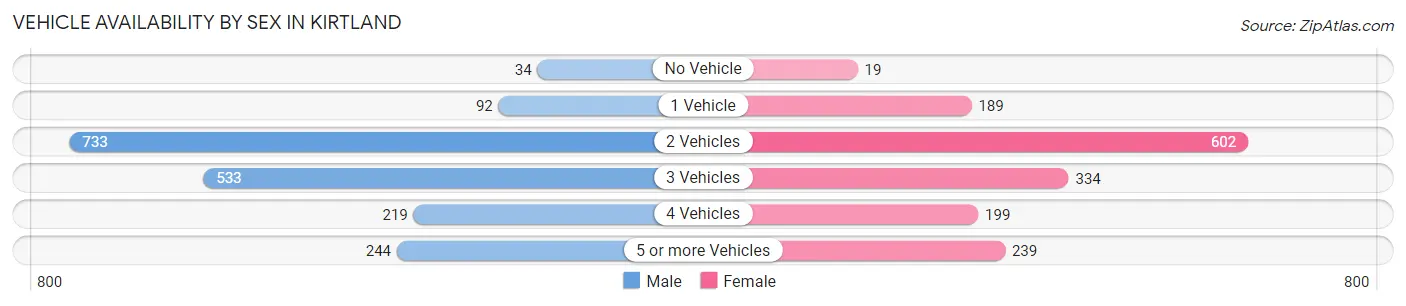
| Vehicles Available | Male | Female |
| No Vehicle | 34 (1.8%) | 19 (1.2%) |
| 1 Vehicle | 92 (5.0%) | 189 (11.9%) |
| 2 Vehicles | 733 (39.5%) | 602 (38.1%) |
| 3 Vehicles | 533 (28.7%) | 334 (21.1%) |
| 4 Vehicles | 219 (11.8%) | 199 (12.6%) |
| 5 or more Vehicles | 244 (13.2%) | 239 (15.1%) |
| Total | 1,855 (100.0%) | 1,582 (100.0%) |
Commute Time in Kirtland
The most frequently occuring commute durations in Kirtland are 30 to 34 minutes (589 commuters, 20.3%), 15 to 19 minutes (548 commuters, 18.9%), and 20 to 24 minutes (451 commuters, 15.6%).
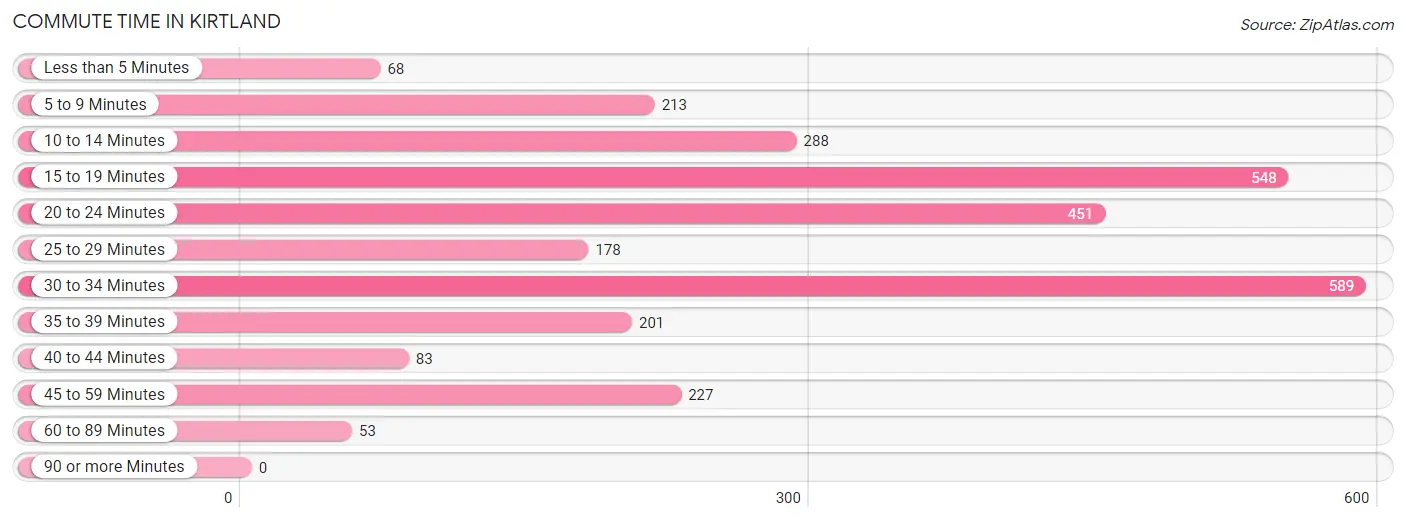
| Commute Time | # Commuters | % Commuters |
| Less than 5 Minutes | 68 | 2.4% |
| 5 to 9 Minutes | 213 | 7.3% |
| 10 to 14 Minutes | 288 | 9.9% |
| 15 to 19 Minutes | 548 | 18.9% |
| 20 to 24 Minutes | 451 | 15.6% |
| 25 to 29 Minutes | 178 | 6.1% |
| 30 to 34 Minutes | 589 | 20.3% |
| 35 to 39 Minutes | 201 | 6.9% |
| 40 to 44 Minutes | 83 | 2.9% |
| 45 to 59 Minutes | 227 | 7.8% |
| 60 to 89 Minutes | 53 | 1.8% |
| 90 or more Minutes | 0 | 0.0% |
Commute Time by Sex in Kirtland
The most common commute times in Kirtland are 30 to 34 minutes (354 commuters, 21.8%) for males and 20 to 24 minutes (258 commuters, 20.2%) for females.
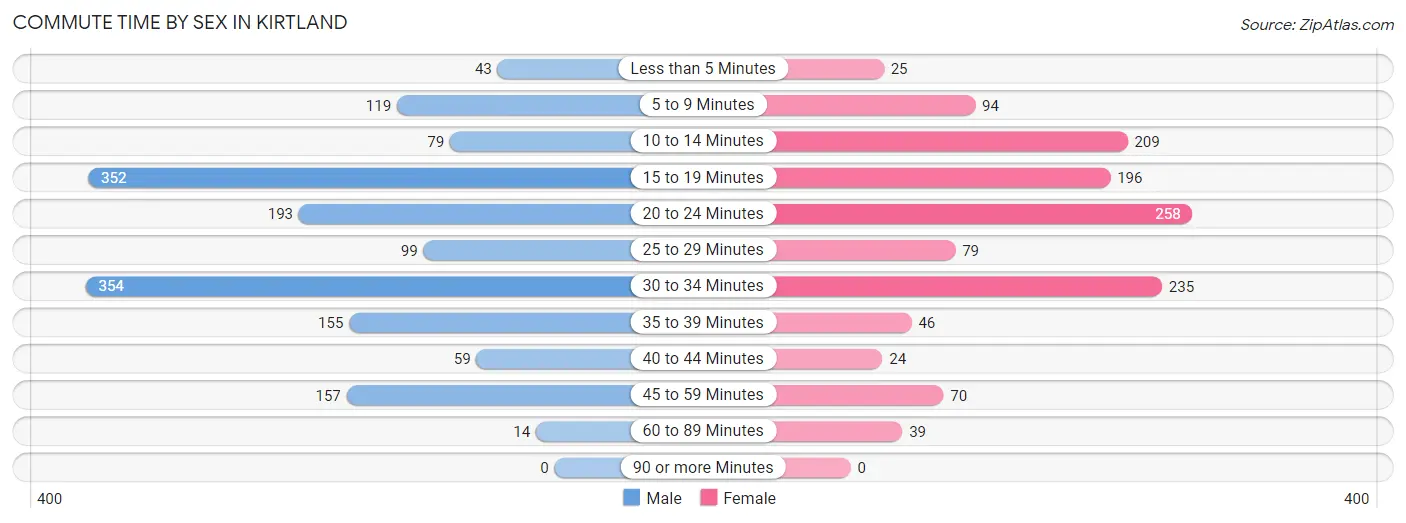
| Commute Time | Male | Female |
| Less than 5 Minutes | 43 (2.6%) | 25 (2.0%) |
| 5 to 9 Minutes | 119 (7.3%) | 94 (7.4%) |
| 10 to 14 Minutes | 79 (4.9%) | 209 (16.4%) |
| 15 to 19 Minutes | 352 (21.7%) | 196 (15.4%) |
| 20 to 24 Minutes | 193 (11.9%) | 258 (20.2%) |
| 25 to 29 Minutes | 99 (6.1%) | 79 (6.2%) |
| 30 to 34 Minutes | 354 (21.8%) | 235 (18.4%) |
| 35 to 39 Minutes | 155 (9.5%) | 46 (3.6%) |
| 40 to 44 Minutes | 59 (3.6%) | 24 (1.9%) |
| 45 to 59 Minutes | 157 (9.7%) | 70 (5.5%) |
| 60 to 89 Minutes | 14 (0.9%) | 39 (3.1%) |
| 90 or more Minutes | 0 (0.0%) | 0 (0.0%) |
Time of Departure to Work by Sex in Kirtland
The most frequent times of departure to work in Kirtland are 7:30 AM to 7:59 AM (319, 19.6%) for males and 6:00 AM to 6:29 AM (235, 18.4%) for females.
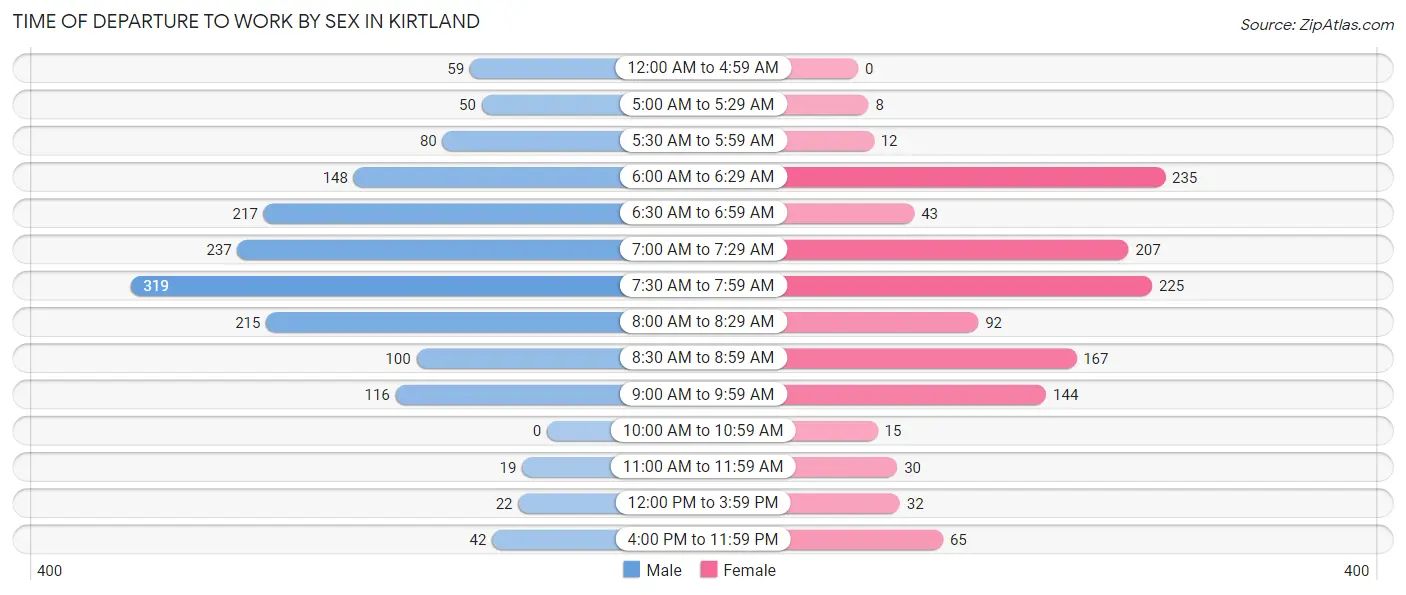
| Time of Departure | Male | Female |
| 12:00 AM to 4:59 AM | 59 (3.6%) | 0 (0.0%) |
| 5:00 AM to 5:29 AM | 50 (3.1%) | 8 (0.6%) |
| 5:30 AM to 5:59 AM | 80 (4.9%) | 12 (0.9%) |
| 6:00 AM to 6:29 AM | 148 (9.1%) | 235 (18.4%) |
| 6:30 AM to 6:59 AM | 217 (13.4%) | 43 (3.4%) |
| 7:00 AM to 7:29 AM | 237 (14.6%) | 207 (16.2%) |
| 7:30 AM to 7:59 AM | 319 (19.6%) | 225 (17.6%) |
| 8:00 AM to 8:29 AM | 215 (13.2%) | 92 (7.2%) |
| 8:30 AM to 8:59 AM | 100 (6.2%) | 167 (13.1%) |
| 9:00 AM to 9:59 AM | 116 (7.1%) | 144 (11.3%) |
| 10:00 AM to 10:59 AM | 0 (0.0%) | 15 (1.2%) |
| 11:00 AM to 11:59 AM | 19 (1.2%) | 30 (2.4%) |
| 12:00 PM to 3:59 PM | 22 (1.3%) | 32 (2.5%) |
| 4:00 PM to 11:59 PM | 42 (2.6%) | 65 (5.1%) |
| Total | 1,624 (100.0%) | 1,275 (100.0%) |
Housing Occupancy in Kirtland
Occupancy by Ownership in Kirtland
Of the total 2,668 dwellings in Kirtland, owner-occupied units account for 2,471 (92.6%), while renter-occupied units make up 197 (7.4%).
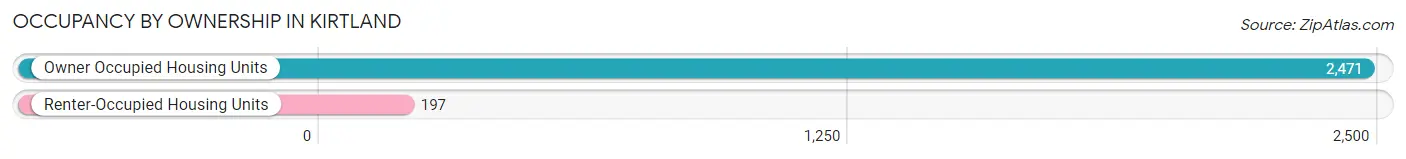
| Occupancy | # Housing Units | % Housing Units |
| Owner Occupied Housing Units | 2,471 | 92.6% |
| Renter-Occupied Housing Units | 197 | 7.4% |
| Total Occupied Housing Units | 2,668 | 100.0% |
Occupancy by Household Size in Kirtland
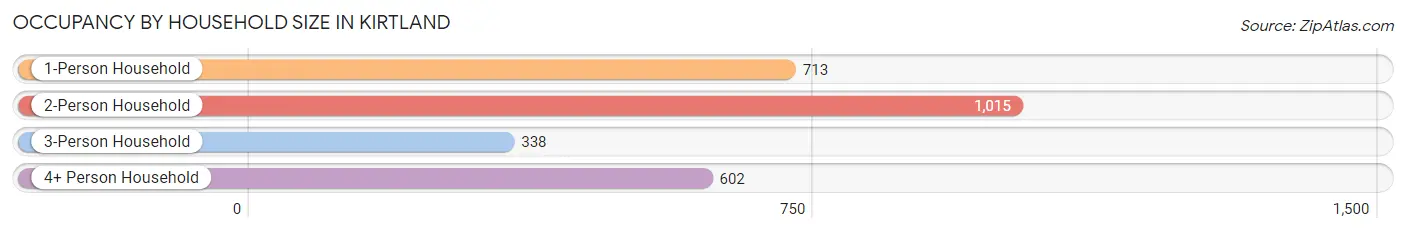
| Household Size | # Housing Units | % Housing Units |
| 1-Person Household | 713 | 26.7% |
| 2-Person Household | 1,015 | 38.0% |
| 3-Person Household | 338 | 12.7% |
| 4+ Person Household | 602 | 22.6% |
| Total Housing Units | 2,668 | 100.0% |
Occupancy by Ownership by Household Size in Kirtland
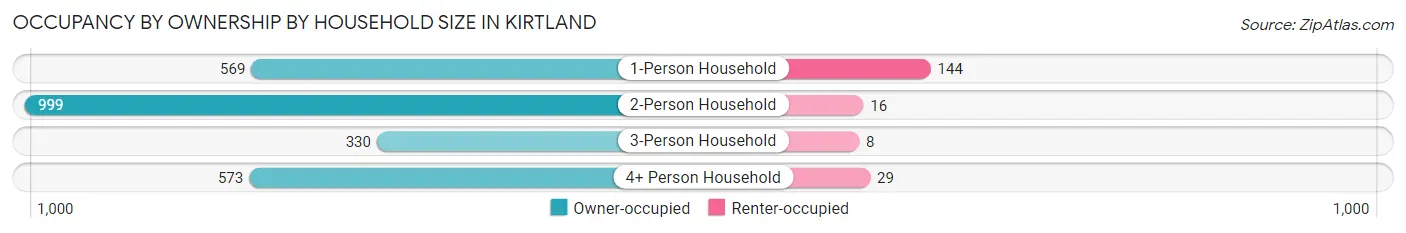
| Household Size | Owner-occupied | Renter-occupied |
| 1-Person Household | 569 (79.8%) | 144 (20.2%) |
| 2-Person Household | 999 (98.4%) | 16 (1.6%) |
| 3-Person Household | 330 (97.6%) | 8 (2.4%) |
| 4+ Person Household | 573 (95.2%) | 29 (4.8%) |
| Total Housing Units | 2,471 (92.6%) | 197 (7.4%) |
Occupancy by Educational Attainment in Kirtland
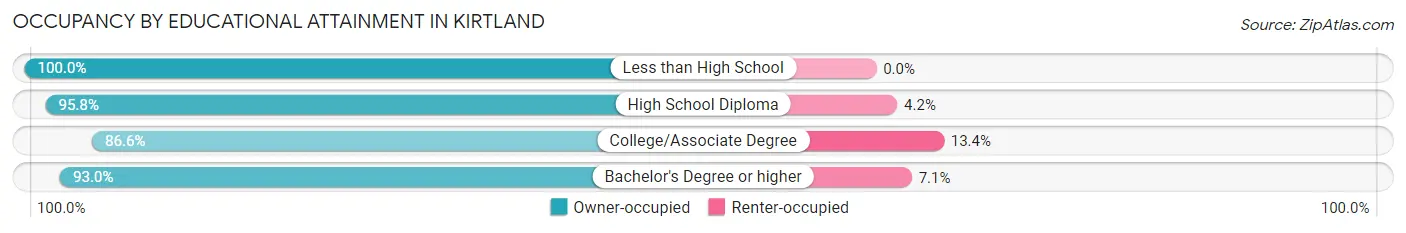
| Household Size | Owner-occupied | Renter-occupied |
| Less than High School | 204 (100.0%) | 0 (0.0%) |
| High School Diploma | 484 (95.8%) | 21 (4.2%) |
| College/Associate Degree | 517 (86.6%) | 80 (13.4%) |
| Bachelor's Degree or higher | 1,266 (92.9%) | 96 (7.0%) |
Occupancy by Age of Householder in Kirtland
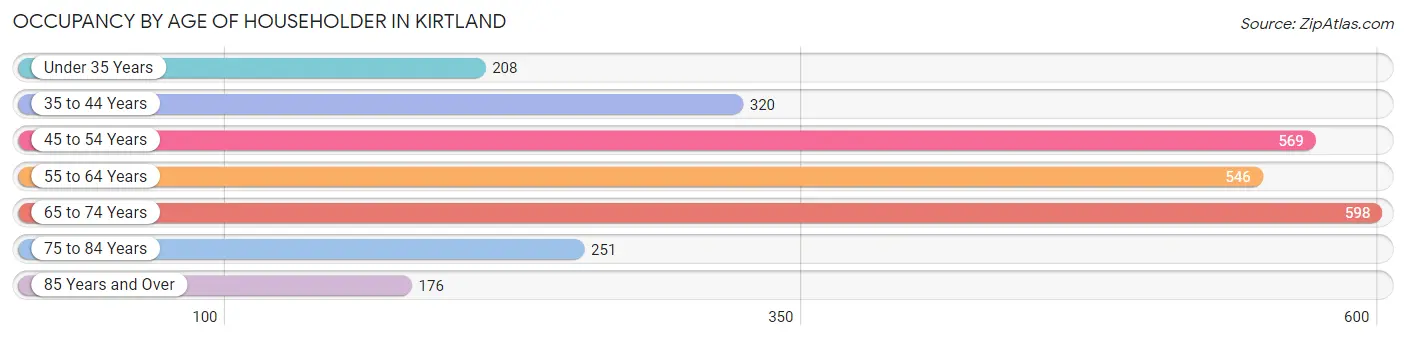
| Age Bracket | # Households | % Households |
| Under 35 Years | 208 | 7.8% |
| 35 to 44 Years | 320 | 12.0% |
| 45 to 54 Years | 569 | 21.3% |
| 55 to 64 Years | 546 | 20.5% |
| 65 to 74 Years | 598 | 22.4% |
| 75 to 84 Years | 251 | 9.4% |
| 85 Years and Over | 176 | 6.6% |
| Total | 2,668 | 100.0% |
Housing Finances in Kirtland
Median Income by Occupancy in Kirtland
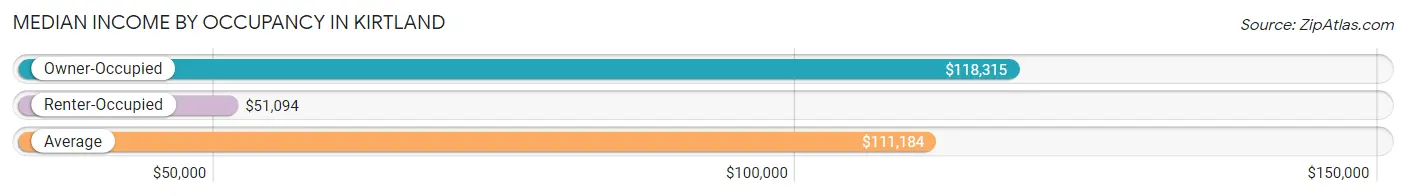
| Occupancy Type | # Households | Median Income |
| Owner-Occupied | 2,471 (92.6%) | $118,315 |
| Renter-Occupied | 197 (7.4%) | $51,094 |
| Average | 2,668 (100.0%) | $111,184 |
Occupancy by Householder Income Bracket in Kirtland
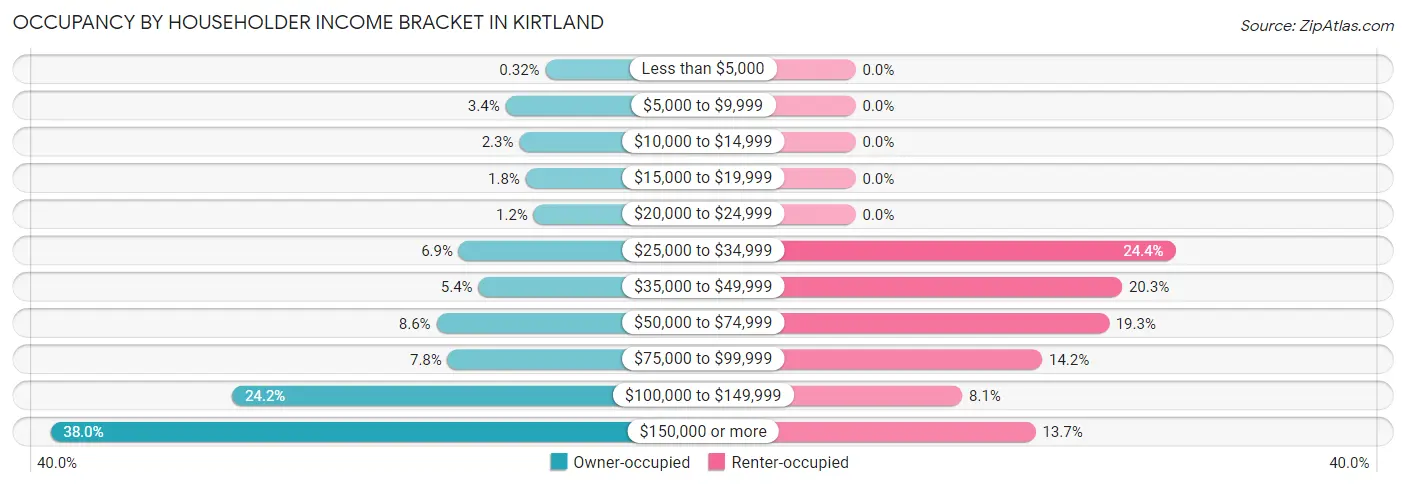
| Income Bracket | Owner-occupied | Renter-occupied |
| Less than $5,000 | 8 (0.3%) | 0 (0.0%) |
| $5,000 to $9,999 | 83 (3.4%) | 0 (0.0%) |
| $10,000 to $14,999 | 57 (2.3%) | 0 (0.0%) |
| $15,000 to $19,999 | 45 (1.8%) | 0 (0.0%) |
| $20,000 to $24,999 | 30 (1.2%) | 0 (0.0%) |
| $25,000 to $34,999 | 171 (6.9%) | 48 (24.4%) |
| $35,000 to $49,999 | 134 (5.4%) | 40 (20.3%) |
| $50,000 to $74,999 | 213 (8.6%) | 38 (19.3%) |
| $75,000 to $99,999 | 192 (7.8%) | 28 (14.2%) |
| $100,000 to $149,999 | 598 (24.2%) | 16 (8.1%) |
| $150,000 or more | 940 (38.0%) | 27 (13.7%) |
| Total | 2,471 (100.0%) | 197 (100.0%) |
Monthly Housing Cost Tiers in Kirtland
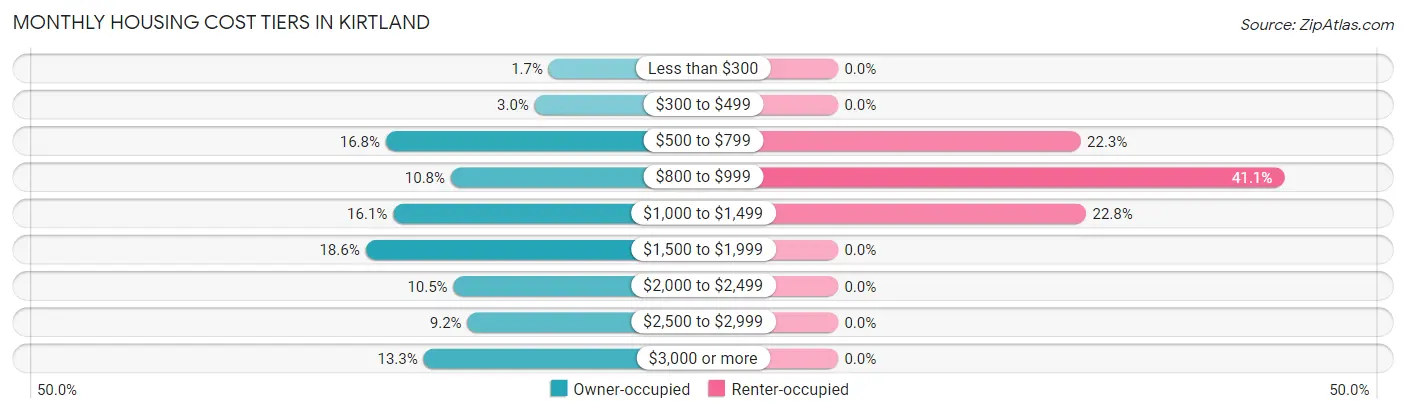
| Monthly Cost | Owner-occupied | Renter-occupied |
| Less than $300 | 43 (1.7%) | 0 (0.0%) |
| $300 to $499 | 75 (3.0%) | 0 (0.0%) |
| $500 to $799 | 414 (16.8%) | 44 (22.3%) |
| $800 to $999 | 266 (10.8%) | 81 (41.1%) |
| $1,000 to $1,499 | 397 (16.1%) | 45 (22.8%) |
| $1,500 to $1,999 | 460 (18.6%) | 0 (0.0%) |
| $2,000 to $2,499 | 260 (10.5%) | 0 (0.0%) |
| $2,500 to $2,999 | 228 (9.2%) | 0 (0.0%) |
| $3,000 or more | 328 (13.3%) | 0 (0.0%) |
| Total | 2,471 (100.0%) | 197 (100.0%) |
Physical Housing Characteristics in Kirtland
Housing Structures in Kirtland
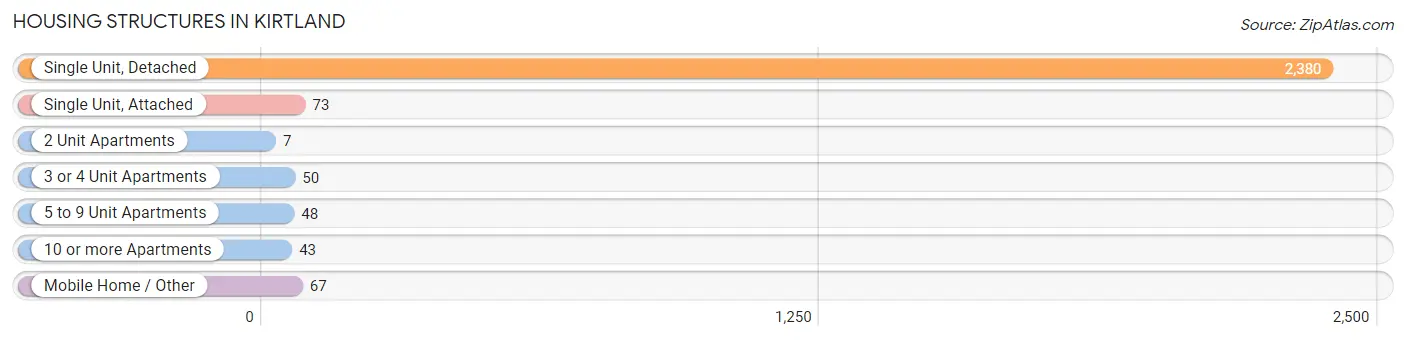
| Structure Type | # Housing Units | % Housing Units |
| Single Unit, Detached | 2,380 | 89.2% |
| Single Unit, Attached | 73 | 2.7% |
| 2 Unit Apartments | 7 | 0.3% |
| 3 or 4 Unit Apartments | 50 | 1.9% |
| 5 to 9 Unit Apartments | 48 | 1.8% |
| 10 or more Apartments | 43 | 1.6% |
| Mobile Home / Other | 67 | 2.5% |
| Total | 2,668 | 100.0% |
Housing Structures by Occupancy in Kirtland
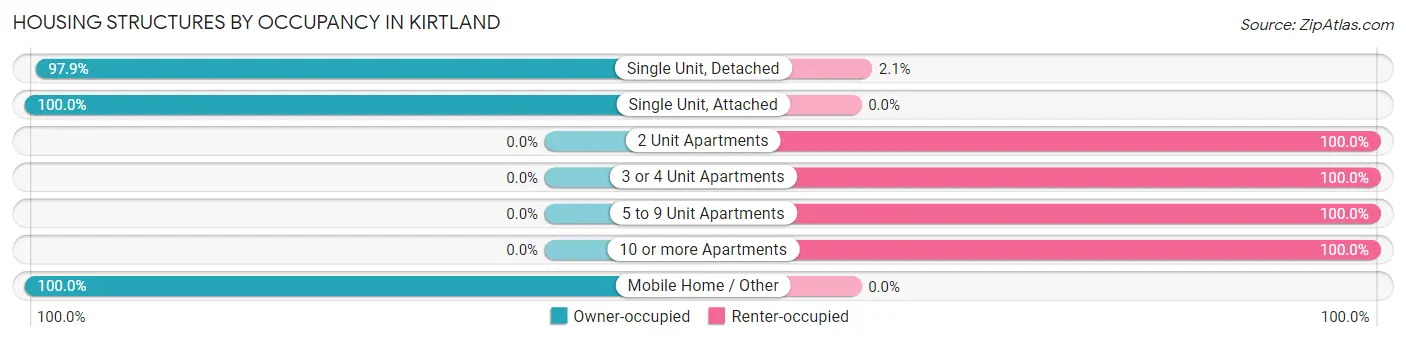
| Structure Type | Owner-occupied | Renter-occupied |
| Single Unit, Detached | 2,331 (97.9%) | 49 (2.1%) |
| Single Unit, Attached | 73 (100.0%) | 0 (0.0%) |
| 2 Unit Apartments | 0 (0.0%) | 7 (100.0%) |
| 3 or 4 Unit Apartments | 0 (0.0%) | 50 (100.0%) |
| 5 to 9 Unit Apartments | 0 (0.0%) | 48 (100.0%) |
| 10 or more Apartments | 0 (0.0%) | 43 (100.0%) |
| Mobile Home / Other | 67 (100.0%) | 0 (0.0%) |
| Total | 2,471 (92.6%) | 197 (7.4%) |
Housing Structures by Number of Rooms in Kirtland
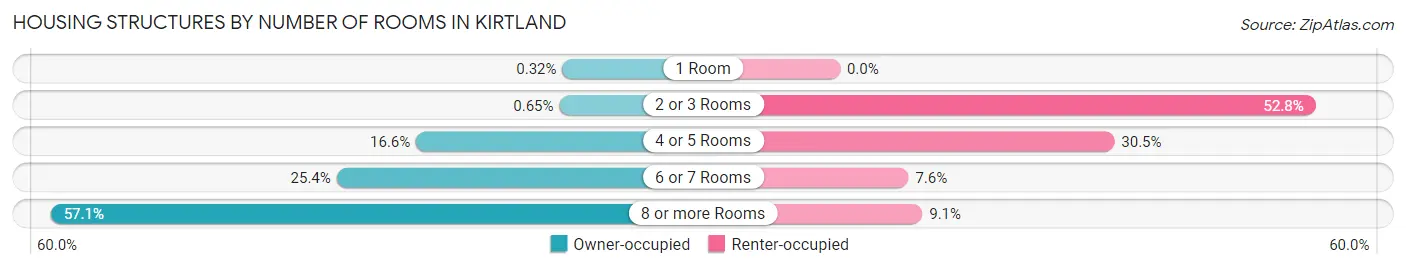
| Number of Rooms | Owner-occupied | Renter-occupied |
| 1 Room | 8 (0.3%) | 0 (0.0%) |
| 2 or 3 Rooms | 16 (0.6%) | 104 (52.8%) |
| 4 or 5 Rooms | 409 (16.6%) | 60 (30.5%) |
| 6 or 7 Rooms | 627 (25.4%) | 15 (7.6%) |
| 8 or more Rooms | 1,411 (57.1%) | 18 (9.1%) |
| Total | 2,471 (100.0%) | 197 (100.0%) |
Housing Structure by Heating Type in Kirtland
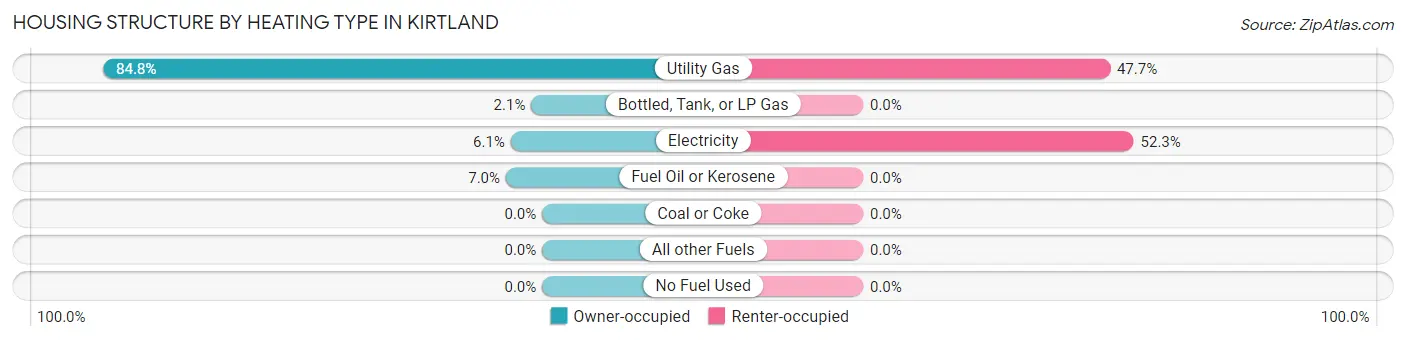
| Heating Type | Owner-occupied | Renter-occupied |
| Utility Gas | 2,096 (84.8%) | 94 (47.7%) |
| Bottled, Tank, or LP Gas | 52 (2.1%) | 0 (0.0%) |
| Electricity | 150 (6.1%) | 103 (52.3%) |
| Fuel Oil or Kerosene | 173 (7.0%) | 0 (0.0%) |
| Coal or Coke | 0 (0.0%) | 0 (0.0%) |
| All other Fuels | 0 (0.0%) | 0 (0.0%) |
| No Fuel Used | 0 (0.0%) | 0 (0.0%) |
| Total | 2,471 (100.0%) | 197 (100.0%) |
Household Vehicle Usage in Kirtland
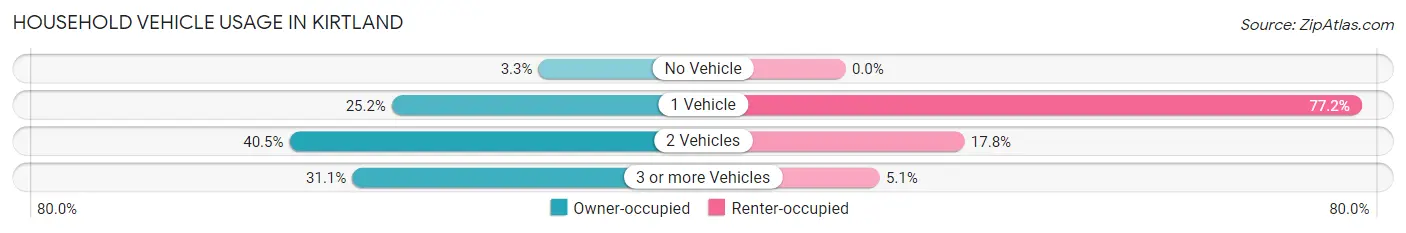
| Vehicles per Household | Owner-occupied | Renter-occupied |
| No Vehicle | 81 (3.3%) | 0 (0.0%) |
| 1 Vehicle | 622 (25.2%) | 152 (77.2%) |
| 2 Vehicles | 1,000 (40.5%) | 35 (17.8%) |
| 3 or more Vehicles | 768 (31.1%) | 10 (5.1%) |
| Total | 2,471 (100.0%) | 197 (100.0%) |
Real Estate & Mortgages in Kirtland
Real Estate and Mortgage Overview in Kirtland
| Characteristic | Without Mortgage | With Mortgage |
| Housing Units | 1,106 | 1,365 |
| Median Property Value | $369,200 | $360,500 |
| Median Household Income | $66,735 | $638 |
| Monthly Housing Costs | $832 | $275 |
| Real Estate Taxes | $5,601 | $0 |
Property Value by Mortgage Status in Kirtland
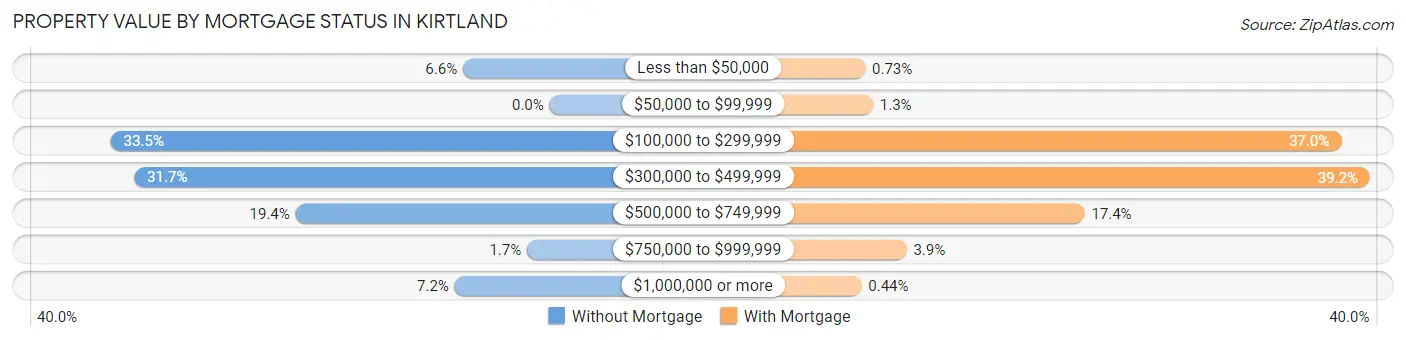
| Property Value | Without Mortgage | With Mortgage |
| Less than $50,000 | 73 (6.6%) | 10 (0.7%) |
| $50,000 to $99,999 | 0 (0.0%) | 18 (1.3%) |
| $100,000 to $299,999 | 370 (33.5%) | 505 (37.0%) |
| $300,000 to $499,999 | 350 (31.7%) | 535 (39.2%) |
| $500,000 to $749,999 | 214 (19.4%) | 238 (17.4%) |
| $750,000 to $999,999 | 19 (1.7%) | 53 (3.9%) |
| $1,000,000 or more | 80 (7.2%) | 6 (0.4%) |
| Total | 1,106 (100.0%) | 1,365 (100.0%) |
Household Income by Mortgage Status in Kirtland
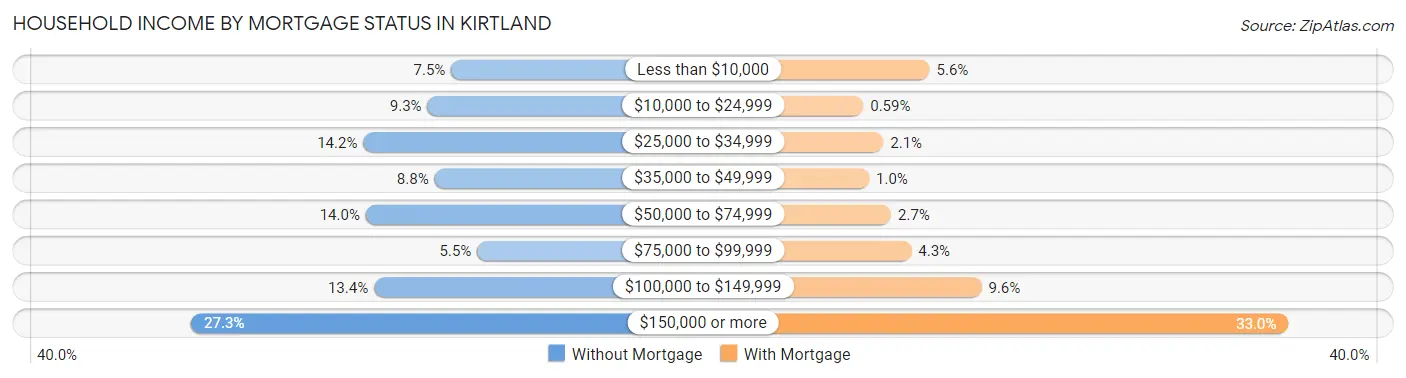
| Household Income | Without Mortgage | With Mortgage |
| Less than $10,000 | 83 (7.5%) | 77 (5.6%) |
| $10,000 to $24,999 | 103 (9.3%) | 8 (0.6%) |
| $25,000 to $34,999 | 157 (14.2%) | 29 (2.1%) |
| $35,000 to $49,999 | 97 (8.8%) | 14 (1.0%) |
| $50,000 to $74,999 | 155 (14.0%) | 37 (2.7%) |
| $75,000 to $99,999 | 61 (5.5%) | 58 (4.3%) |
| $100,000 to $149,999 | 148 (13.4%) | 131 (9.6%) |
| $150,000 or more | 302 (27.3%) | 450 (33.0%) |
| Total | 1,106 (100.0%) | 1,365 (100.0%) |
Property Value to Household Income Ratio in Kirtland
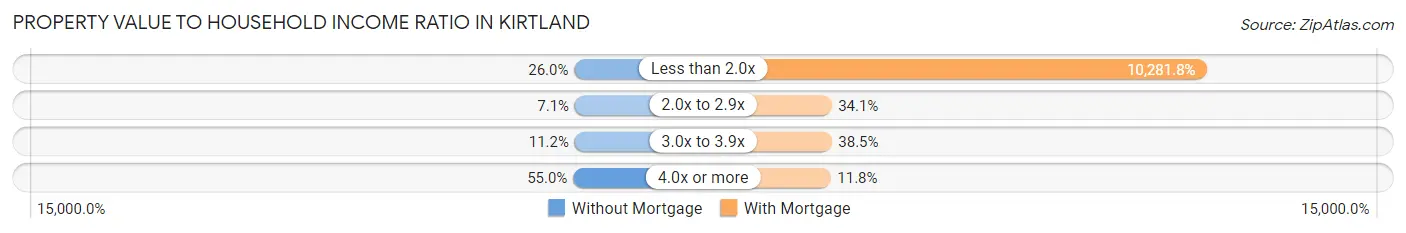
| Value-to-Income Ratio | Without Mortgage | With Mortgage |
| Less than 2.0x | 288 (26.0%) | 140,347 (10,281.8%) |
| 2.0x to 2.9x | 78 (7.0%) | 466 (34.1%) |
| 3.0x to 3.9x | 124 (11.2%) | 526 (38.5%) |
| 4.0x or more | 608 (55.0%) | 161 (11.8%) |
| Total | 1,106 (100.0%) | 1,365 (100.0%) |
Real Estate Taxes by Mortgage Status in Kirtland
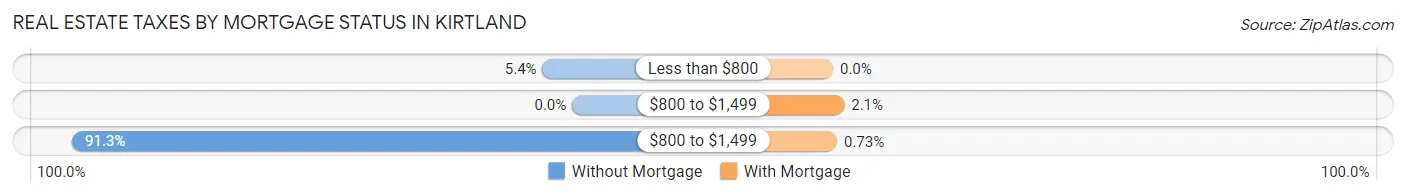
| Property Taxes | Without Mortgage | With Mortgage |
| Less than $800 | 60 (5.4%) | 0 (0.0%) |
| $800 to $1,499 | 0 (0.0%) | 28 (2.1%) |
| $800 to $1,499 | 1,010 (91.3%) | 10 (0.7%) |
| Total | 1,106 (100.0%) | 1,365 (100.0%) |
Health & Disability in Kirtland
Health Insurance Coverage by Age in Kirtland
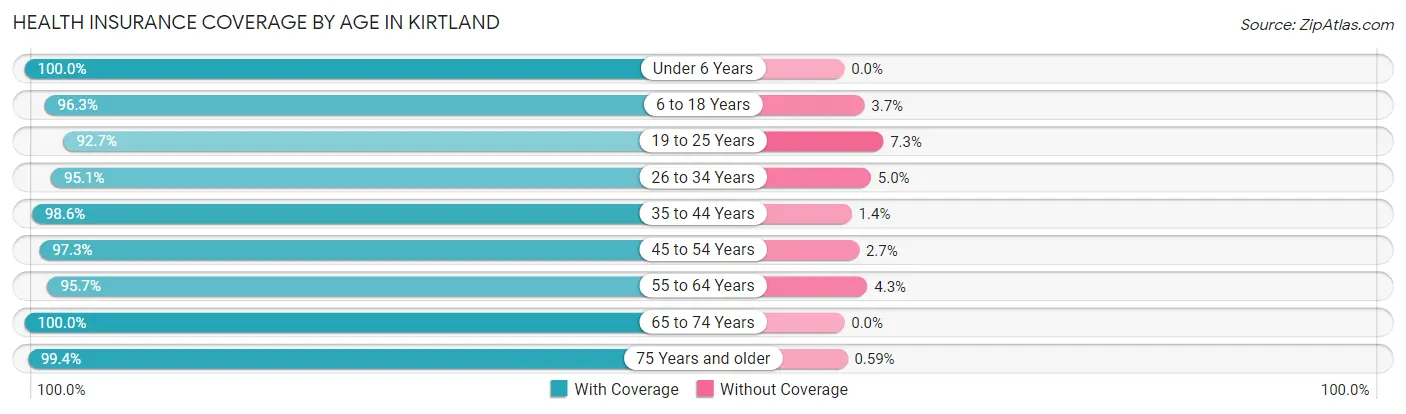
| Age Bracket | With Coverage | Without Coverage |
| Under 6 Years | 268 (100.0%) | 0 (0.0%) |
| 6 to 18 Years | 1,133 (96.3%) | 44 (3.7%) |
| 19 to 25 Years | 383 (92.7%) | 30 (7.3%) |
| 26 to 34 Years | 499 (95.1%) | 26 (5.0%) |
| 35 to 44 Years | 649 (98.6%) | 9 (1.4%) |
| 45 to 54 Years | 999 (97.3%) | 28 (2.7%) |
| 55 to 64 Years | 1,002 (95.7%) | 45 (4.3%) |
| 65 to 74 Years | 989 (100.0%) | 0 (0.0%) |
| 75 Years and older | 678 (99.4%) | 4 (0.6%) |
| Total | 6,600 (97.3%) | 186 (2.7%) |
Health Insurance Coverage by Citizenship Status in Kirtland
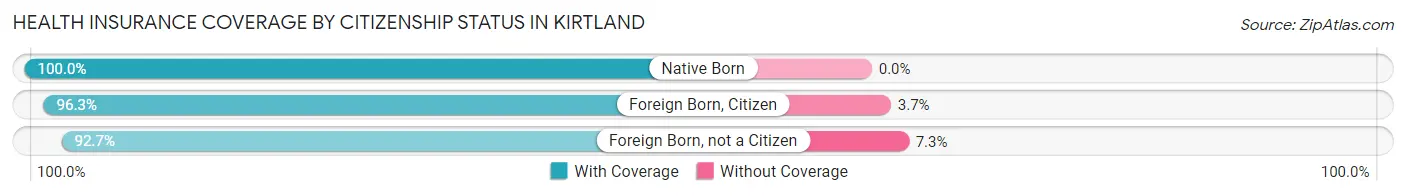
| Citizenship Status | With Coverage | Without Coverage |
| Native Born | 268 (100.0%) | 0 (0.0%) |
| Foreign Born, Citizen | 1,133 (96.3%) | 44 (3.7%) |
| Foreign Born, not a Citizen | 383 (92.7%) | 30 (7.3%) |
Health Insurance Coverage by Household Income in Kirtland
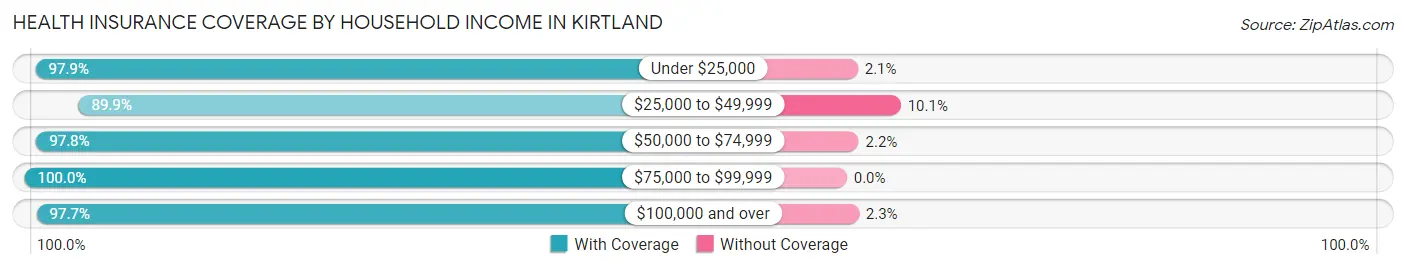
| Household Income | With Coverage | Without Coverage |
| Under $25,000 | 285 (97.9%) | 6 (2.1%) |
| $25,000 to $49,999 | 471 (89.9%) | 53 (10.1%) |
| $50,000 to $74,999 | 443 (97.8%) | 10 (2.2%) |
| $75,000 to $99,999 | 486 (100.0%) | 0 (0.0%) |
| $100,000 and over | 4,893 (97.7%) | 113 (2.3%) |
Public vs Private Health Insurance Coverage by Age in Kirtland
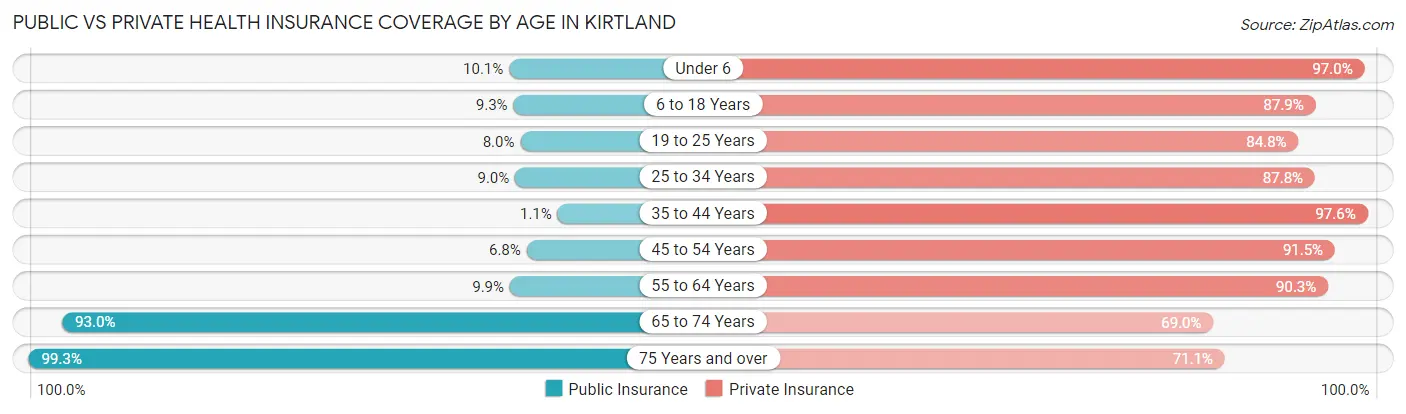
| Age Bracket | Public Insurance | Private Insurance |
| Under 6 | 27 (10.1%) | 260 (97.0%) |
| 6 to 18 Years | 109 (9.3%) | 1,035 (87.9%) |
| 19 to 25 Years | 33 (8.0%) | 350 (84.8%) |
| 25 to 34 Years | 47 (8.9%) | 461 (87.8%) |
| 35 to 44 Years | 7 (1.1%) | 642 (97.6%) |
| 45 to 54 Years | 70 (6.8%) | 940 (91.5%) |
| 55 to 64 Years | 104 (9.9%) | 945 (90.3%) |
| 65 to 74 Years | 920 (93.0%) | 682 (69.0%) |
| 75 Years and over | 677 (99.3%) | 485 (71.1%) |
| Total | 1,994 (29.4%) | 5,800 (85.5%) |
Disability Status by Sex by Age in Kirtland
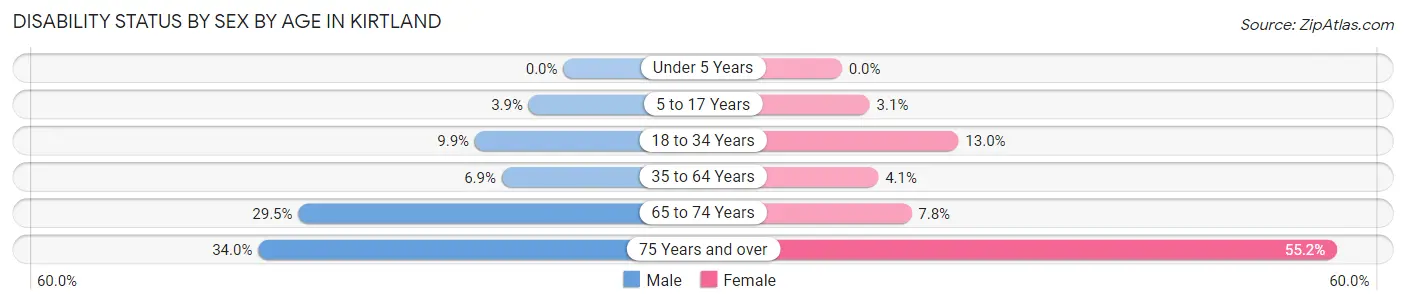
| Age Bracket | Male | Female |
| Under 5 Years | 0 (0.0%) | 0 (0.0%) |
| 5 to 17 Years | 19 (3.8%) | 20 (3.1%) |
| 18 to 34 Years | 54 (9.9%) | 60 (13.0%) |
| 35 to 64 Years | 91 (6.9%) | 57 (4.1%) |
| 65 to 74 Years | 170 (29.5%) | 32 (7.7%) |
| 75 Years and over | 87 (34.0%) | 235 (55.2%) |
Disability Class by Sex by Age in Kirtland
Disability Class: Hearing Difficulty
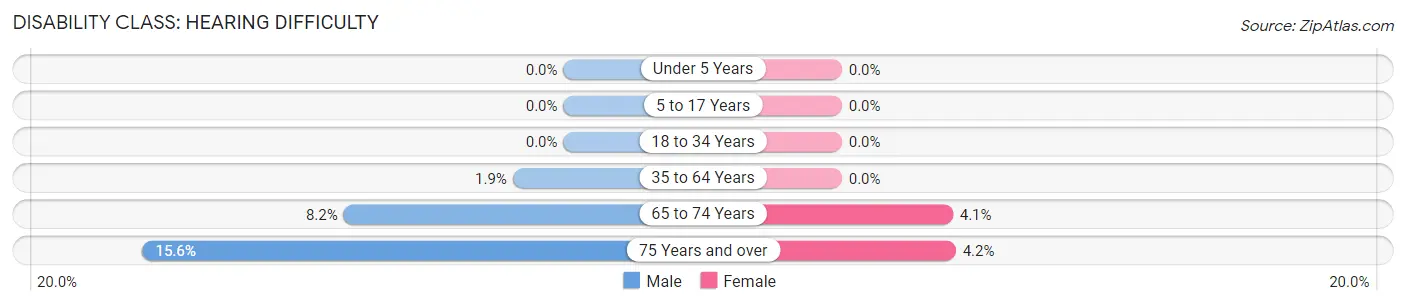
| Age Bracket | Male | Female |
| Under 5 Years | 0 (0.0%) | 0 (0.0%) |
| 5 to 17 Years | 0 (0.0%) | 0 (0.0%) |
| 18 to 34 Years | 0 (0.0%) | 0 (0.0%) |
| 35 to 64 Years | 25 (1.9%) | 0 (0.0%) |
| 65 to 74 Years | 47 (8.2%) | 17 (4.1%) |
| 75 Years and over | 40 (15.6%) | 18 (4.2%) |
Disability Class: Vision Difficulty
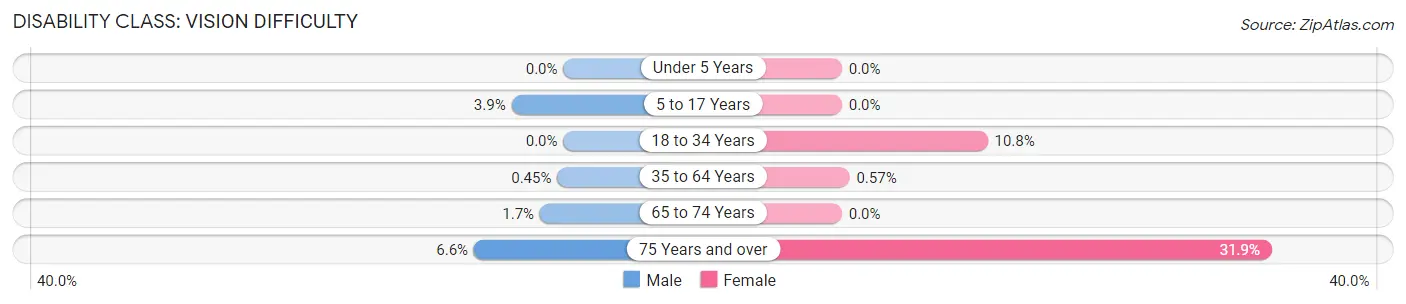
| Age Bracket | Male | Female |
| Under 5 Years | 0 (0.0%) | 0 (0.0%) |
| 5 to 17 Years | 19 (3.8%) | 0 (0.0%) |
| 18 to 34 Years | 0 (0.0%) | 50 (10.8%) |
| 35 to 64 Years | 6 (0.4%) | 8 (0.6%) |
| 65 to 74 Years | 10 (1.7%) | 0 (0.0%) |
| 75 Years and over | 17 (6.6%) | 136 (31.9%) |
Disability Class: Cognitive Difficulty
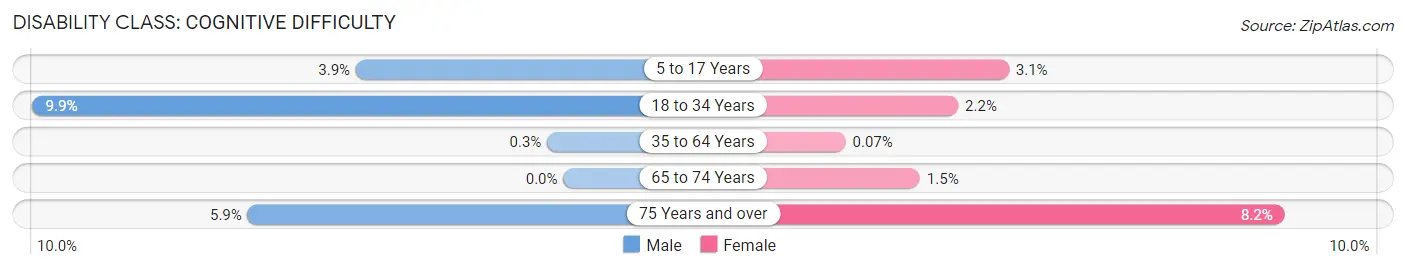
| Age Bracket | Male | Female |
| 5 to 17 Years | 19 (3.8%) | 20 (3.1%) |
| 18 to 34 Years | 54 (9.9%) | 10 (2.2%) |
| 35 to 64 Years | 4 (0.3%) | 1 (0.1%) |
| 65 to 74 Years | 0 (0.0%) | 6 (1.5%) |
| 75 Years and over | 15 (5.9%) | 35 (8.2%) |
Disability Class: Ambulatory Difficulty
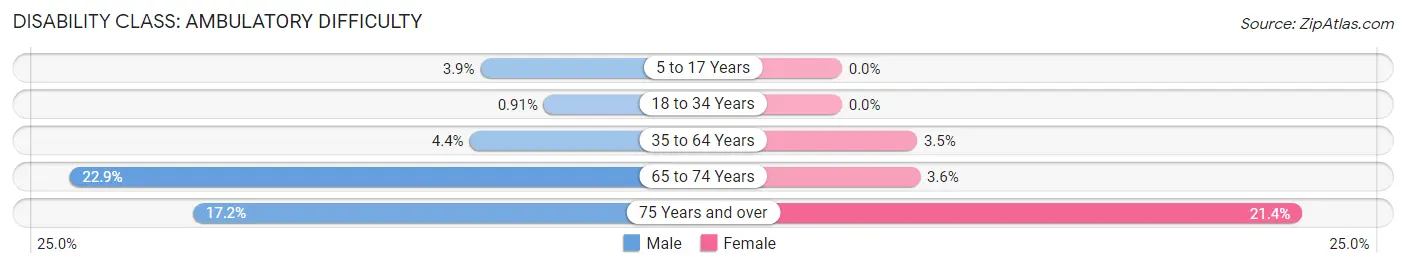
| Age Bracket | Male | Female |
| 5 to 17 Years | 19 (3.8%) | 0 (0.0%) |
| 18 to 34 Years | 5 (0.9%) | 0 (0.0%) |
| 35 to 64 Years | 58 (4.4%) | 49 (3.5%) |
| 65 to 74 Years | 132 (22.9%) | 15 (3.6%) |
| 75 Years and over | 44 (17.2%) | 91 (21.4%) |
Disability Class: Self-Care Difficulty
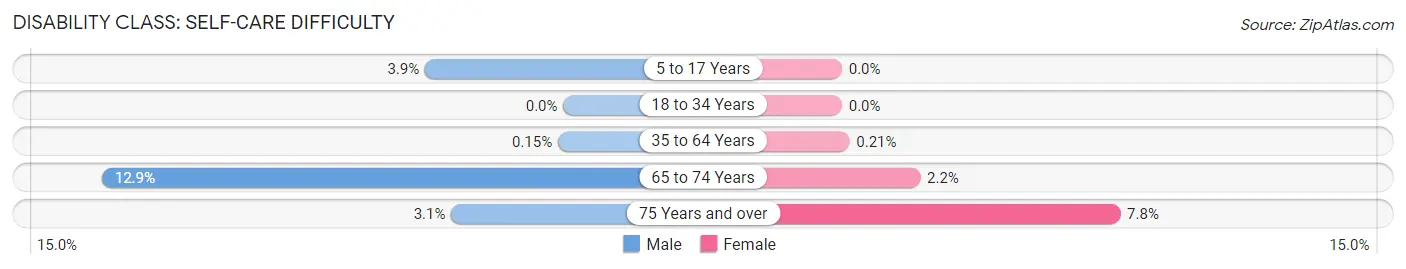
| Age Bracket | Male | Female |
| 5 to 17 Years | 19 (3.8%) | 0 (0.0%) |
| 18 to 34 Years | 0 (0.0%) | 0 (0.0%) |
| 35 to 64 Years | 2 (0.2%) | 3 (0.2%) |
| 65 to 74 Years | 74 (12.9%) | 9 (2.2%) |
| 75 Years and over | 8 (3.1%) | 33 (7.7%) |
Technology Access in Kirtland
Computing Device Access in Kirtland
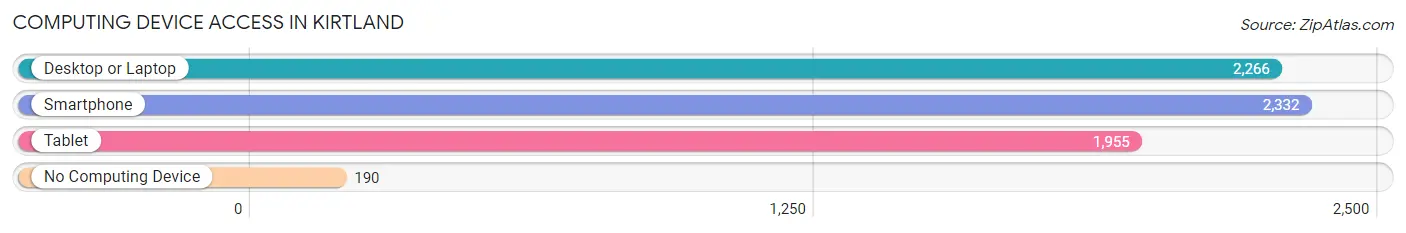
| Device Type | # Households | % Households |
| Desktop or Laptop | 2,266 | 84.9% |
| Smartphone | 2,332 | 87.4% |
| Tablet | 1,955 | 73.3% |
| No Computing Device | 190 | 7.1% |
| Total | 2,668 | 100.0% |
Internet Access in Kirtland
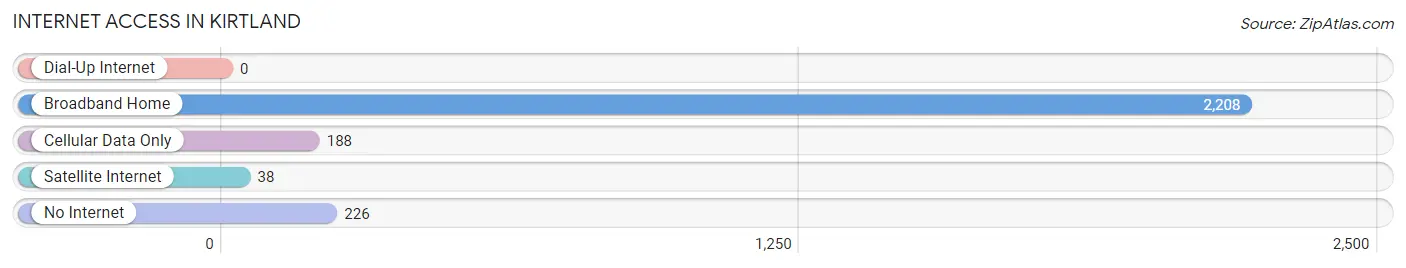
| Internet Type | # Households | % Households |
| Dial-Up Internet | 0 | 0.0% |
| Broadband Home | 2,208 | 82.8% |
| Cellular Data Only | 188 | 7.0% |
| Satellite Internet | 38 | 1.4% |
| No Internet | 226 | 8.5% |
| Total | 2,668 | 100.0% |
Kirtland Summary
Kirtland, Ohio is a small city located in Lake County, Ohio, United States. It is situated on the eastern edge of the Cleveland metropolitan area and is part of the Greater Cleveland Combined Statistical Area. The city is named after Jared Kirtland, a prominent early settler and landowner in the area. As of the 2010 census, the city had a population of 6,866.
Geography
Kirtland is located at 41°37′N 81°20′W (41.619, -81.333). According to the United States Census Bureau, the city has a total area of 4.2 square miles (10.8 km2), all land.
Kirtland is located in the eastern part of Lake County, Ohio, and is bordered by Mentor to the north, Willoughby Hills to the east, Waite Hill to the south, and Concord Township to the west. The city is situated on the western edge of the Chagrin River watershed.
History
Kirtland was first settled in 1809 by Jared Kirtland, a prominent early settler and landowner in the area. The village was incorporated in 1817 and was named after Kirtland. The village was originally a farming community, but it soon developed into a small industrial center. In the late 19th century, Kirtland was home to several factories, including a paper mill, a sawmill, a grist mill, and a brickyard.
In the early 20th century, Kirtland experienced a period of growth and development. The village was incorporated as a city in 1921 and the population grew to over 3,000 by the 1950s. The city continued to grow and develop throughout the 20th century, and by the 2000 census, the population had grown to 6,866.
Economy
Kirtland’s economy is largely based on the service industry, with many residents employed in retail, healthcare, and education. The city is also home to several small businesses, including a number of restaurants, shops, and professional services.
Kirtland is also home to a number of large employers, including Lake Health, a regional healthcare provider, and the Kirtland Country Club, a private golf and country club. The city is also home to the Kirtland Air Force Base, which is a major employer in the area.
Demographics
As of the 2010 census, the population of Kirtland was 6,866. The racial makeup of the city was 94.3% White, 1.3% African American, 0.3% Native American, 1.2% Asian, 0.1% Pacific Islander, 1.2% from other races, and 1.6% from two or more races. Hispanic or Latino of any race were 3.2% of the population.
The median income for a household in Kirtland was $63,917, and the median income for a family was $76,917. The per capita income for the city was $30,917. About 4.2% of families and 5.3% of the population were below the poverty line, including 6.3% of those under age 18 and 4.2% of those age 65 or over.
Kirtland is a small city with a strong sense of community. The city is home to a number of parks and recreational facilities, and the residents take pride in their city and its history. Kirtland is a great place to live, work, and play, and it is a great place to call home.
Common Questions
What is Per Capita Income in Kirtland?
Per Capita income in Kirtland is $60,562.
What is the Median Family Income in Kirtland?
Median Family Income in Kirtland is $148,276.
What is the Median Household income in Kirtland?
Median Household Income in Kirtland is $111,184.
What is Income or Wage Gap in Kirtland?
Income or Wage Gap in Kirtland is 43.0%.
Women in Kirtland earn 57.0 cents for every dollar earned by a man.
What is Inequality or Gini Index in Kirtland?
Inequality or Gini Index in Kirtland is 0.47.
What is the Total Population of Kirtland?
Total Population of Kirtland is 6,914.
What is the Total Male Population of Kirtland?
Total Male Population of Kirtland is 3,392.
What is the Total Female Population of Kirtland?
Total Female Population of Kirtland is 3,522.
What is the Ratio of Males per 100 Females in Kirtland?
There are 96.31 Males per 100 Females in Kirtland.
What is the Ratio of Females per 100 Males in Kirtland?
There are 103.83 Females per 100 Males in Kirtland.
What is the Median Population Age in Kirtland?
Median Population Age in Kirtland is 51.2 Years.
What is the Average Family Size in Kirtland
Average Family Size in Kirtland is 3.0 People.
What is the Average Household Size in Kirtland
Average Household Size in Kirtland is 2.5 People.
How Large is the Labor Force in Kirtland?
There are 3,601 People in the Labor Forcein in Kirtland.
What is the Percentage of People in the Labor Force in Kirtland?
62.5% of People are in the Labor Force in Kirtland.
What is the Unemployment Rate in Kirtland?
Unemployment Rate in Kirtland is 3.1%.