Perrysburg, OH Map & Demographics
Perrysburg Map
Perrysburg Overview
$58,062
PER CAPITA INCOME
$139,415
AVG FAMILY INCOME
$98,419
AVG HOUSEHOLD INCOME
34.1%
WAGE / INCOME GAP [ % ]
65.9¢/ $1
WAGE / INCOME GAP [ $ ]
0.46
INEQUALITY / GINI INDEX
24,855
TOTAL POPULATION
12,479
MALE POPULATION
12,376
FEMALE POPULATION
100.83
MALES / 100 FEMALES
99.17
FEMALES / 100 MALES
38.9
MEDIAN AGE
3.1
AVG FAMILY SIZE
2.4
AVG HOUSEHOLD SIZE
13,358
LABOR FORCE [ PEOPLE ]
69.3%
PERCENT IN LABOR FORCE
4.1%
UNEMPLOYMENT RATE
Perrysburg Zip Codes
Income in Perrysburg
Income Overview in Perrysburg
Per Capita Income in Perrysburg is $58,062, while median incomes of families and households are $139,415 and $98,419 respectively.
| Characteristic | Number | Measure |
| Per Capita Income | 24,855 | $58,062 |
| Median Family Income | 6,325 | $139,415 |
| Mean Family Income | 6,325 | $180,627 |
| Median Household Income | 10,424 | $98,419 |
| Mean Household Income | 10,424 | $138,236 |
| Income Deficit | 6,325 | $0 |
| Wage / Income Gap (%) | 24,855 | 34.09% |
| Wage / Income Gap ($) | 24,855 | 65.91¢ per $1 |
| Gini / Inequality Index | 24,855 | 0.46 |
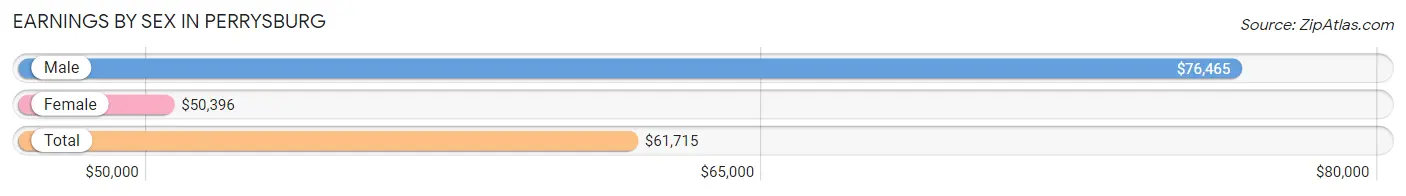
Earnings by Sex in Perrysburg
Average Earnings in Perrysburg are $61,715, $76,465 for men and $50,396 for women, a difference of 34.1%.
| Sex | Number | Average Earnings |
| Male | 7,496 (53.8%) | $76,465 |
| Female | 6,424 (46.2%) | $50,396 |
| Total | 13,920 (100.0%) | $61,715 |
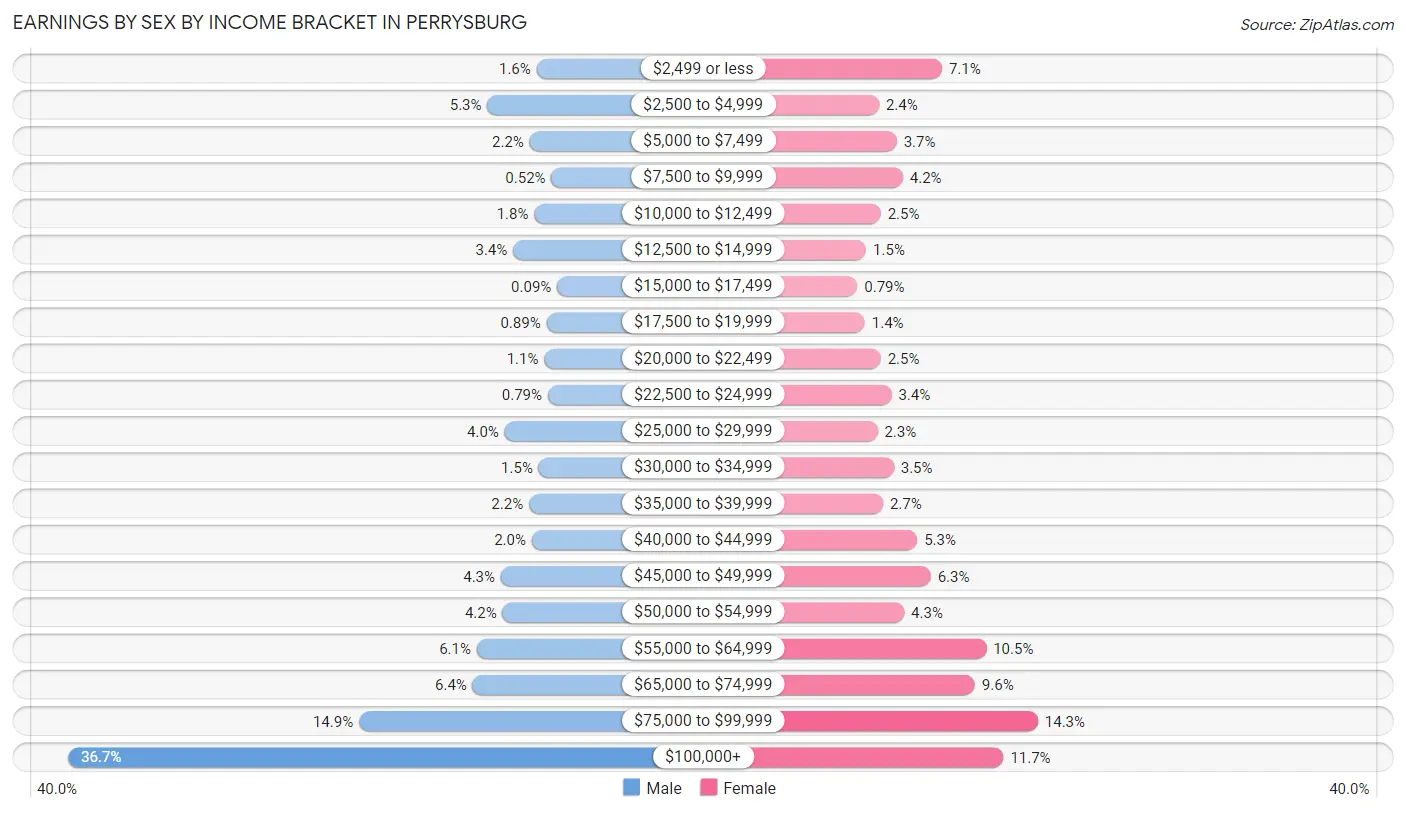
Earnings by Sex by Income Bracket in Perrysburg
The most common earnings brackets in Perrysburg are $100,000+ for men (2,754 | 36.7%) and $75,000 to $99,999 for women (920 | 14.3%).
| Income | Male | Female |
| $2,499 or less | 122 (1.6%) | 458 (7.1%) |
| $2,500 to $4,999 | 399 (5.3%) | 155 (2.4%) |
| $5,000 to $7,499 | 161 (2.1%) | 240 (3.7%) |
| $7,500 to $9,999 | 39 (0.5%) | 270 (4.2%) |
| $10,000 to $12,499 | 135 (1.8%) | 163 (2.5%) |
| $12,500 to $14,999 | 254 (3.4%) | 93 (1.5%) |
| $15,000 to $17,499 | 7 (0.1%) | 51 (0.8%) |
| $17,500 to $19,999 | 67 (0.9%) | 87 (1.3%) |
| $20,000 to $22,499 | 79 (1.1%) | 163 (2.5%) |
| $22,500 to $24,999 | 59 (0.8%) | 215 (3.4%) |
| $25,000 to $29,999 | 301 (4.0%) | 148 (2.3%) |
| $30,000 to $34,999 | 110 (1.5%) | 226 (3.5%) |
| $35,000 to $39,999 | 165 (2.2%) | 174 (2.7%) |
| $40,000 to $44,999 | 149 (2.0%) | 339 (5.3%) |
| $45,000 to $49,999 | 323 (4.3%) | 404 (6.3%) |
| $50,000 to $54,999 | 313 (4.2%) | 276 (4.3%) |
| $55,000 to $64,999 | 458 (6.1%) | 671 (10.4%) |
| $65,000 to $74,999 | 481 (6.4%) | 617 (9.6%) |
| $75,000 to $99,999 | 1,120 (14.9%) | 920 (14.3%) |
| $100,000+ | 2,754 (36.7%) | 754 (11.7%) |
| Total | 7,496 (100.0%) | 6,424 (100.0%) |
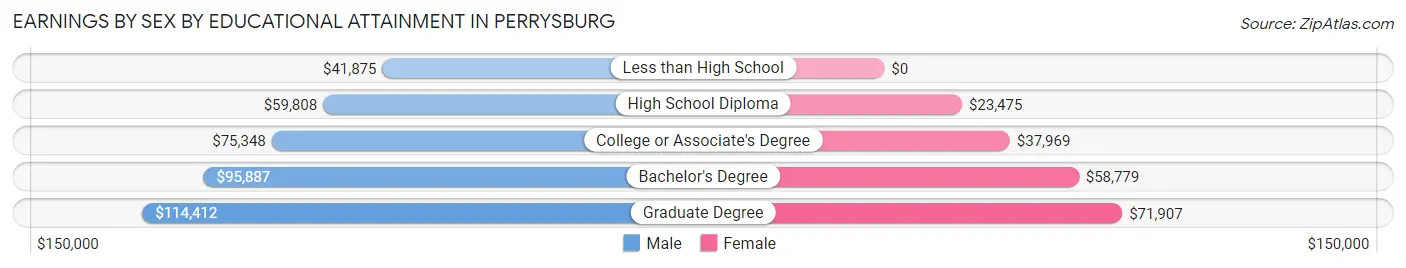
Earnings by Sex by Educational Attainment in Perrysburg
Average earnings in Perrysburg are $87,002 for men and $55,789 for women, a difference of 35.9%. Men with an educational attainment of graduate degree enjoy the highest average annual earnings of $114,412, while those with less than high school education earn the least with $41,875. Women with an educational attainment of graduate degree earn the most with the average annual earnings of $71,907, while those with high school diploma education have the smallest earnings of $23,475.
| Educational Attainment | Male Income | Female Income |
| Less than High School | $41,875 | $0 |
| High School Diploma | $59,808 | $23,475 |
| College or Associate's Degree | $75,348 | $37,969 |
| Bachelor's Degree | $95,887 | $58,779 |
| Graduate Degree | $114,412 | $71,907 |
| Total | $87,002 | $55,789 |
Family Income in Perrysburg
Family Income Brackets in Perrysburg
According to the Perrysburg family income data, there are 1,904 families falling into the $200,000+ income range, which is the most common income bracket and makes up 30.1% of all families.
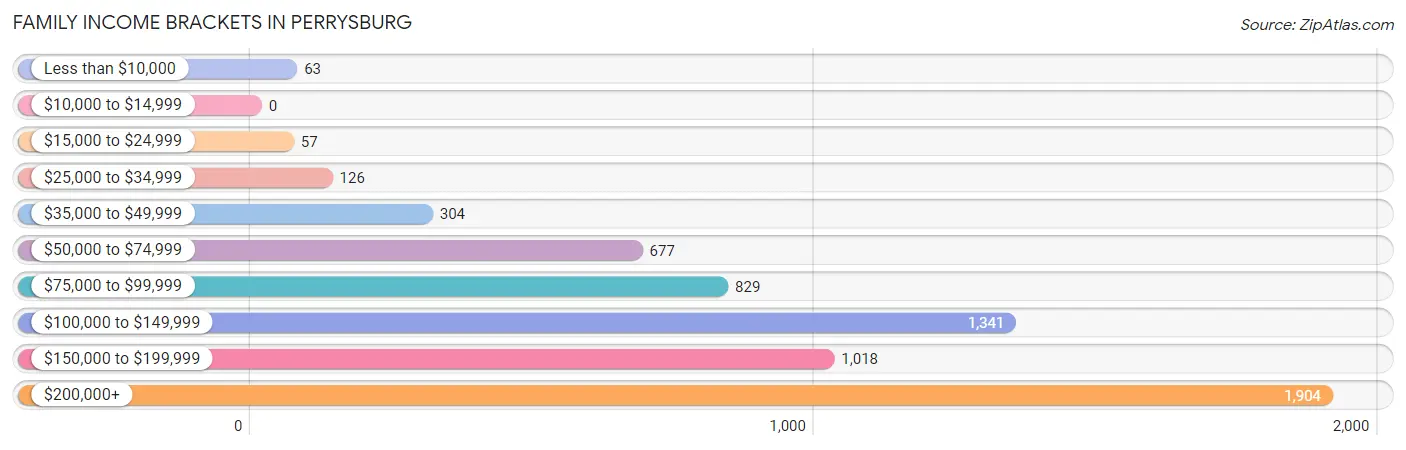
| Income Bracket | # Families | % Families |
| Less than $10,000 | 63 | 1.0% |
| $10,000 to $14,999 | 0 | 0.0% |
| $15,000 to $24,999 | 57 | 0.9% |
| $25,000 to $34,999 | 126 | 2.0% |
| $35,000 to $49,999 | 304 | 4.8% |
| $50,000 to $74,999 | 677 | 10.7% |
| $75,000 to $99,999 | 829 | 13.1% |
| $100,000 to $149,999 | 1,341 | 21.2% |
| $150,000 to $199,999 | 1,018 | 16.1% |
| $200,000+ | 1,904 | 30.1% |
Family Income by Famaliy Size in Perrysburg
3-person families (1,482 | 23.4%) account for the highest median family income in Perrysburg with $156,944 per family, while 2-person families (2,669 | 42.2%) have the highest median income of $61,326 per family member.
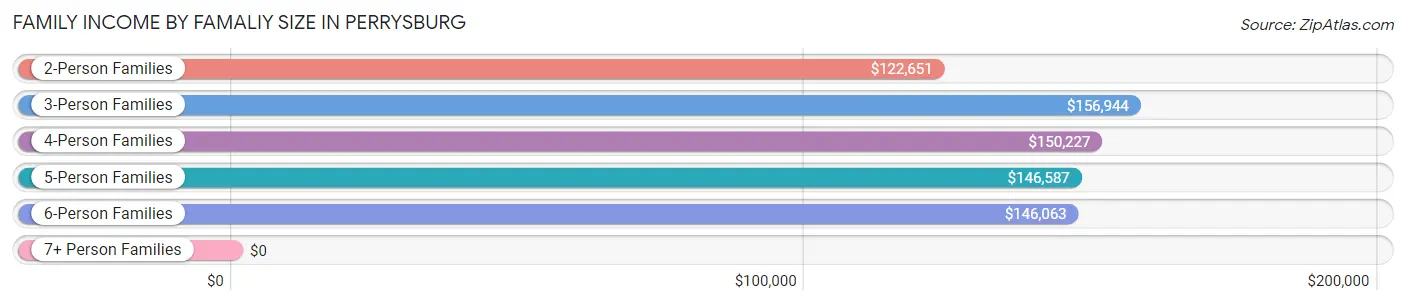
| Income Bracket | # Families | Median Income |
| 2-Person Families | 2,669 (42.2%) | $122,651 |
| 3-Person Families | 1,482 (23.4%) | $156,944 |
| 4-Person Families | 1,444 (22.8%) | $150,227 |
| 5-Person Families | 538 (8.5%) | $146,587 |
| 6-Person Families | 147 (2.3%) | $146,063 |
| 7+ Person Families | 45 (0.7%) | $0 |
| Total | 6,325 (100.0%) | $139,415 |
Family Income by Number of Earners in Perrysburg
The median family income in Perrysburg is $139,415, with families comprising 3+ earners (912) having the highest median family income of $213,992, while families with no earners (672) have the lowest median family income of $65,724, accounting for 14.4% and 10.6% of families, respectively.
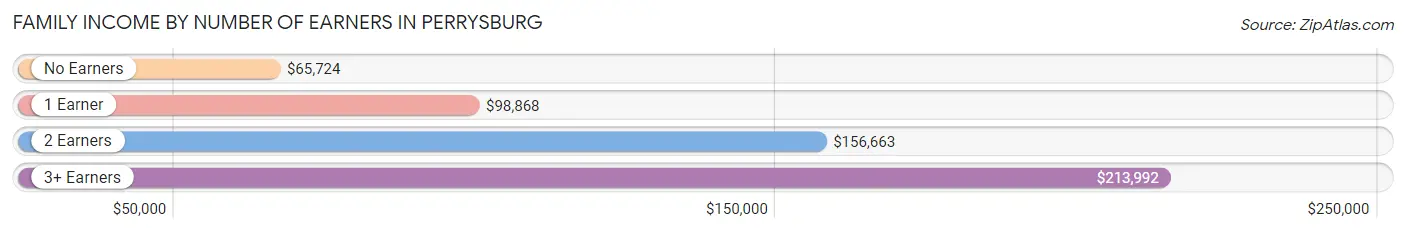
| Number of Earners | # Families | Median Income |
| No Earners | 672 (10.6%) | $65,724 |
| 1 Earner | 2,020 (31.9%) | $98,868 |
| 2 Earners | 2,721 (43.0%) | $156,663 |
| 3+ Earners | 912 (14.4%) | $213,992 |
| Total | 6,325 (100.0%) | $139,415 |
Household Income in Perrysburg
Household Income Brackets in Perrysburg
With 2,064 households falling in the category, the $200,000+ income range is the most frequent in Perrysburg, accounting for 19.8% of all households. In contrast, only 292 households (2.8%) fall into the less than $10,000 income bracket, making it the least populous group.
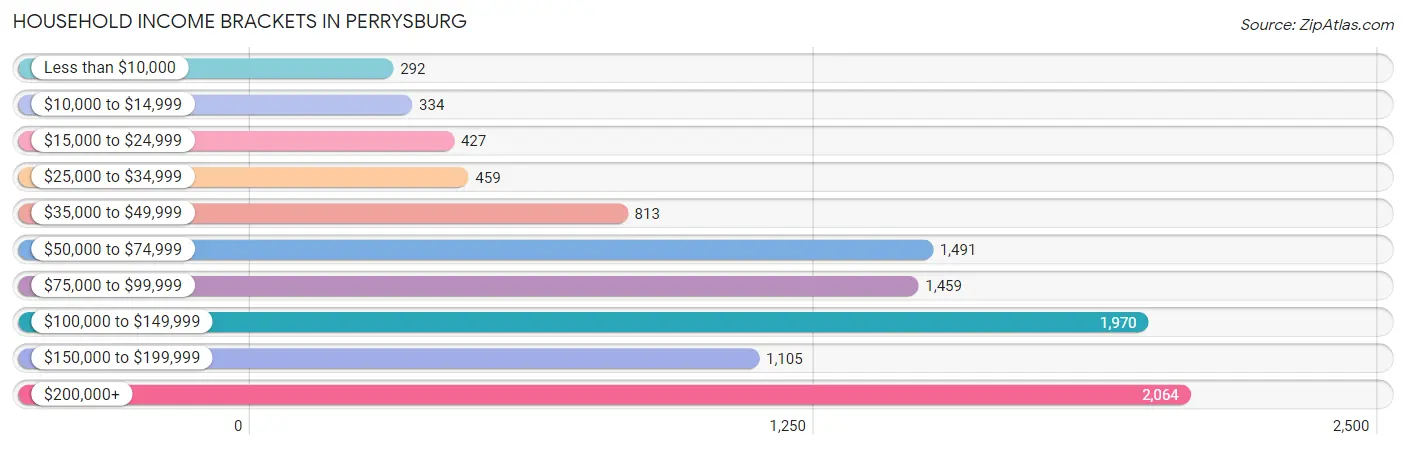
| Income Bracket | # Households | % Households |
| Less than $10,000 | 292 | 2.8% |
| $10,000 to $14,999 | 334 | 3.2% |
| $15,000 to $24,999 | 427 | 4.1% |
| $25,000 to $34,999 | 459 | 4.4% |
| $35,000 to $49,999 | 813 | 7.8% |
| $50,000 to $74,999 | 1,491 | 14.3% |
| $75,000 to $99,999 | 1,459 | 14.0% |
| $100,000 to $149,999 | 1,970 | 18.9% |
| $150,000 to $199,999 | 1,105 | 10.6% |
| $200,000+ | 2,064 | 19.8% |
Household Income by Householder Age in Perrysburg
The median household income in Perrysburg is $98,419, with the highest median household income of $133,875 found in the 45 to 64 years age bracket for the primary householder. A total of 3,597 households (34.5%) fall into this category. Meanwhile, the 65+ years age bracket for the primary householder has the lowest median household income of $65,256, with 2,725 households (26.1%) in this group.
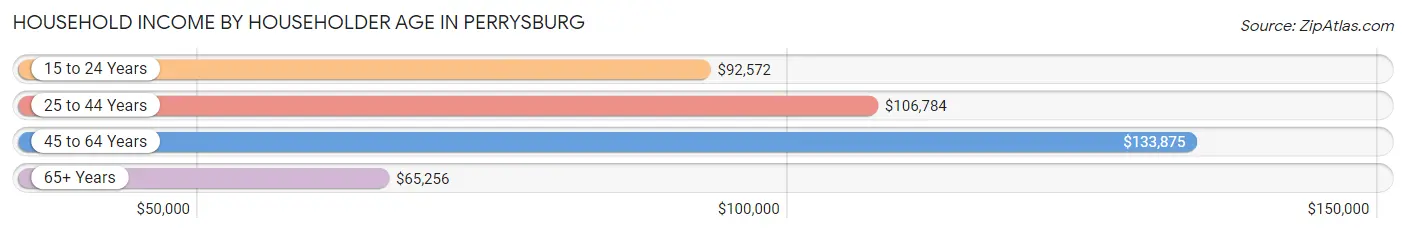
| Income Bracket | # Households | Median Income |
| 15 to 24 Years | 253 (2.4%) | $92,572 |
| 25 to 44 Years | 3,849 (36.9%) | $106,784 |
| 45 to 64 Years | 3,597 (34.5%) | $133,875 |
| 65+ Years | 2,725 (26.1%) | $65,256 |
| Total | 10,424 (100.0%) | $98,419 |
Poverty in Perrysburg
Income Below Poverty by Sex and Age in Perrysburg
With 3.9% poverty level for males and 4.4% for females among the residents of Perrysburg, 75 year old and over males and 16 and 17 year old females are the most vulnerable to poverty, with 68 males (13.5%) and 67 females (19.7%) in their respective age groups living below the poverty level.
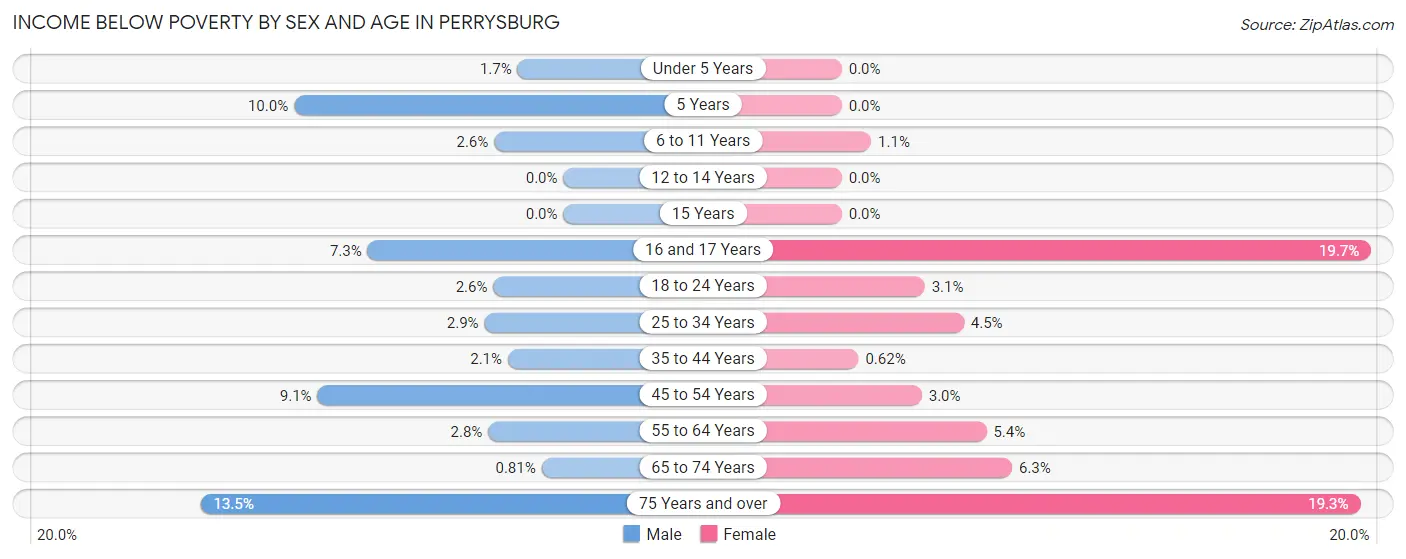
| Age Bracket | Male | Female |
| Under 5 Years | 12 (1.7%) | 0 (0.0%) |
| 5 Years | 19 (10.0%) | 0 (0.0%) |
| 6 to 11 Years | 28 (2.6%) | 13 (1.1%) |
| 12 to 14 Years | 0 (0.0%) | 0 (0.0%) |
| 15 Years | 0 (0.0%) | 0 (0.0%) |
| 16 and 17 Years | 38 (7.3%) | 67 (19.7%) |
| 18 to 24 Years | 22 (2.6%) | 28 (3.1%) |
| 25 to 34 Years | 40 (2.9%) | 62 (4.5%) |
| 35 to 44 Years | 41 (2.1%) | 12 (0.6%) |
| 45 to 54 Years | 173 (9.1%) | 52 (3.0%) |
| 55 to 64 Years | 36 (2.8%) | 60 (5.4%) |
| 65 to 74 Years | 9 (0.8%) | 80 (6.3%) |
| 75 Years and over | 68 (13.5%) | 164 (19.3%) |
| Total | 486 (3.9%) | 538 (4.4%) |
Income Above Poverty by Sex and Age in Perrysburg
According to the poverty statistics in Perrysburg, males aged 12 to 14 years and females aged under 5 years are the age groups that are most secure financially, with 100.0% of males and 100.0% of females in these age groups living above the poverty line.
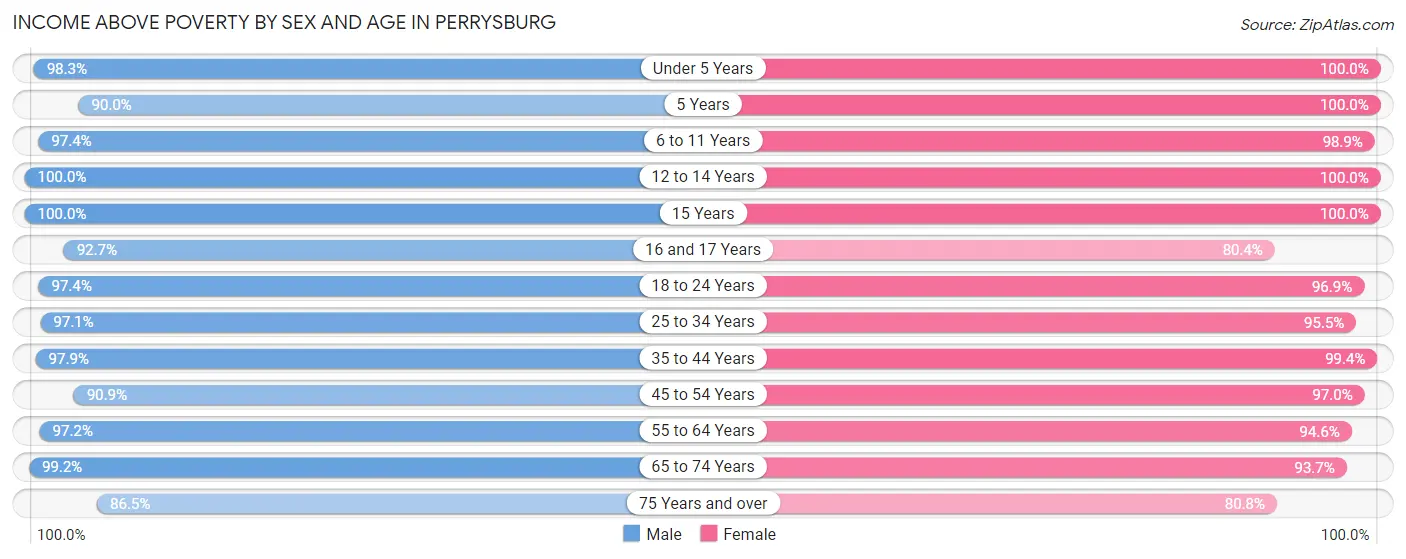
| Age Bracket | Male | Female |
| Under 5 Years | 694 (98.3%) | 657 (100.0%) |
| 5 Years | 171 (90.0%) | 93 (100.0%) |
| 6 to 11 Years | 1,062 (97.4%) | 1,177 (98.9%) |
| 12 to 14 Years | 559 (100.0%) | 630 (100.0%) |
| 15 Years | 282 (100.0%) | 94 (100.0%) |
| 16 and 17 Years | 485 (92.7%) | 274 (80.3%) |
| 18 to 24 Years | 824 (97.4%) | 881 (96.9%) |
| 25 to 34 Years | 1,327 (97.1%) | 1,306 (95.5%) |
| 35 to 44 Years | 1,949 (97.9%) | 1,909 (99.4%) |
| 45 to 54 Years | 1,722 (90.9%) | 1,698 (97.0%) |
| 55 to 64 Years | 1,253 (97.2%) | 1,057 (94.6%) |
| 65 to 74 Years | 1,101 (99.2%) | 1,185 (93.7%) |
| 75 Years and over | 437 (86.5%) | 688 (80.7%) |
| Total | 11,866 (96.1%) | 11,649 (95.6%) |
Income Below Poverty Among Married-Couple Families in Perrysburg
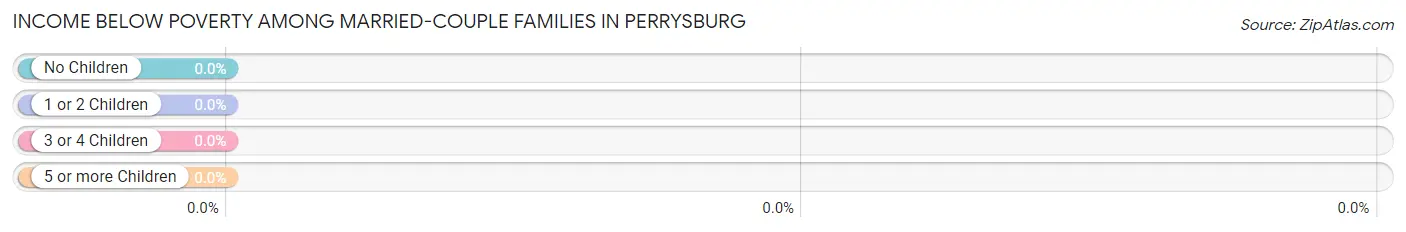
| Children | Above Poverty | Below Poverty |
| No Children | 2,590 (100.0%) | 0 (0.0%) |
| 1 or 2 Children | 1,988 (100.0%) | 0 (0.0%) |
| 3 or 4 Children | 625 (100.0%) | 0 (0.0%) |
| 5 or more Children | 0 (0.0%) | 0 (0.0%) |
| Total | 5,203 (100.0%) | 0 (0.0%) |
Income Below Poverty Among Single-Parent Households in Perrysburg
According to the poverty data in Perrysburg, 10.3% or 36 single-father households and 5.4% or 42 single-mother households are living below the poverty line. Among single-father households, those with 3 or 4 children have the highest poverty rate, with 14 households (35.0%) experiencing poverty. Likewise, among single-mother households, those with 1 or 2 children have the highest poverty rate, with 42 households (9.9%) falling below the poverty line.
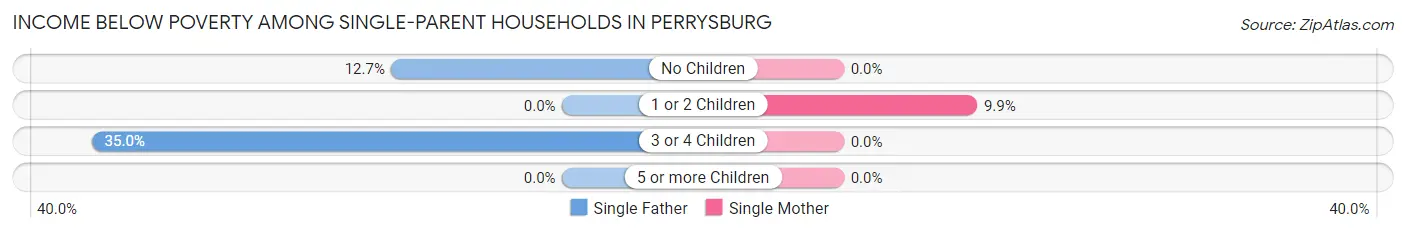
| Children | Single Father | Single Mother |
| No Children | 22 (12.7%) | 0 (0.0%) |
| 1 or 2 Children | 0 (0.0%) | 42 (9.9%) |
| 3 or 4 Children | 14 (35.0%) | 0 (0.0%) |
| 5 or more Children | 0 (0.0%) | 0 (0.0%) |
| Total | 36 (10.3%) | 42 (5.4%) |
Income Below Poverty Among Married-Couple vs Single-Parent Households in Perrysburg
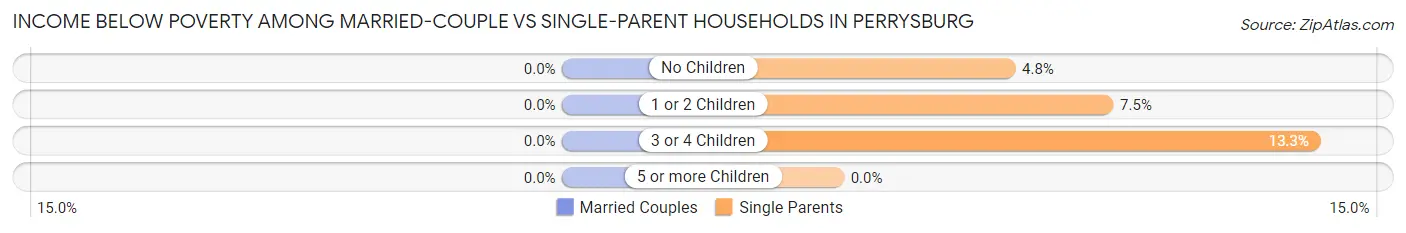
| Children | Married-Couple Families | Single-Parent Households |
| No Children | 0 (0.0%) | 22 (4.8%) |
| 1 or 2 Children | 0 (0.0%) | 42 (7.5%) |
| 3 or 4 Children | 0 (0.0%) | 14 (13.3%) |
| 5 or more Children | 0 (0.0%) | 0 (0.0%) |
| Total | 0 (0.0%) | 78 (7.0%) |
Race in Perrysburg
The most populous races in Perrysburg are White / Caucasian (22,398 | 90.1%), Hispanic or Latino (1,045 | 4.2%), and Two or more Races (1,006 | 4.1%).
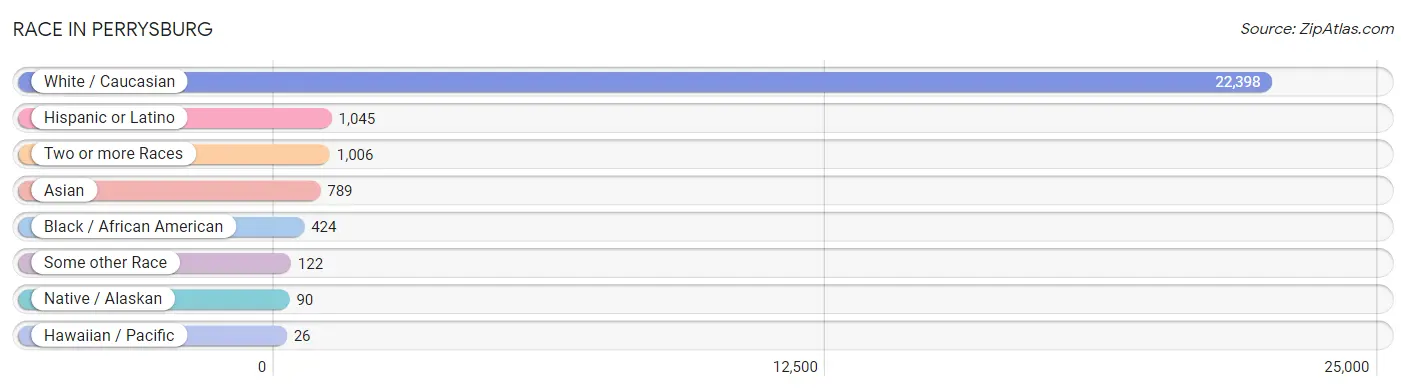
| Race | # Population | % Population |
| Asian | 789 | 3.2% |
| Black / African American | 424 | 1.7% |
| Hawaiian / Pacific | 26 | 0.1% |
| Hispanic or Latino | 1,045 | 4.2% |
| Native / Alaskan | 90 | 0.4% |
| White / Caucasian | 22,398 | 90.1% |
| Two or more Races | 1,006 | 4.1% |
| Some other Race | 122 | 0.5% |
| Total | 24,855 | 100.0% |
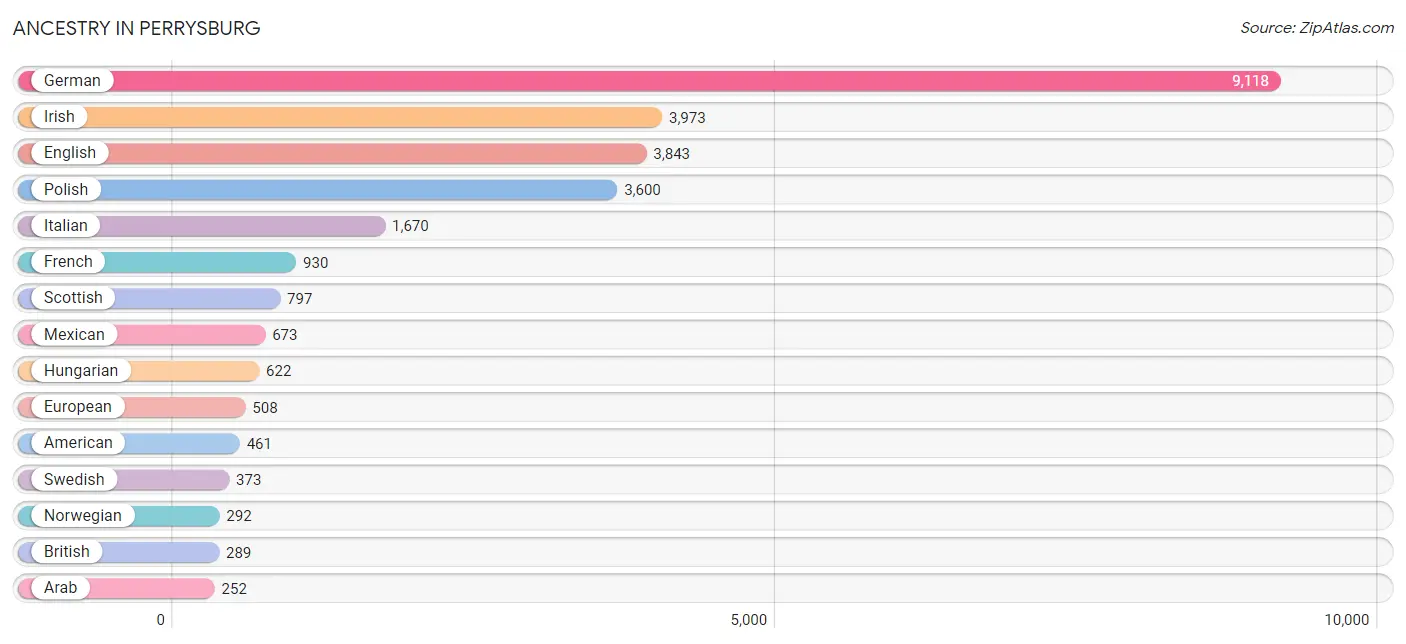
Ancestry in Perrysburg
The most populous ancestries reported in Perrysburg are German (9,118 | 36.7%), Irish (3,973 | 16.0%), English (3,843 | 15.5%), Polish (3,600 | 14.5%), and Italian (1,670 | 6.7%), together accounting for 89.3% of all Perrysburg residents.
| Ancestry | # Population | % Population |
| Albanian | 13 | 0.1% |
| American | 461 | 1.8% |
| Arab | 252 | 1.0% |
| Austrian | 54 | 0.2% |
| Belgian | 37 | 0.2% |
| Bhutanese | 86 | 0.4% |
| British | 289 | 1.2% |
| Bulgarian | 9 | 0.0% |
| Burmese | 53 | 0.2% |
| Canadian | 37 | 0.2% |
| Central American | 74 | 0.3% |
| Cherokee | 33 | 0.1% |
| Colombian | 44 | 0.2% |
| Croatian | 19 | 0.1% |
| Cuban | 32 | 0.1% |
| Czech | 123 | 0.5% |
| Czechoslovakian | 33 | 0.1% |
| Danish | 8 | 0.0% |
| Dutch | 197 | 0.8% |
| Eastern European | 65 | 0.3% |
| Egyptian | 99 | 0.4% |
| English | 3,843 | 15.5% |
| Ethiopian | 25 | 0.1% |
| European | 508 | 2.0% |
| Finnish | 108 | 0.4% |
| French | 930 | 3.7% |
| French Canadian | 113 | 0.4% |
| German | 9,118 | 36.7% |
| Greek | 134 | 0.5% |
| Hungarian | 622 | 2.5% |
| Indian (Asian) | 247 | 1.0% |
| Iranian | 30 | 0.1% |
| Irish | 3,973 | 16.0% |
| Iroquois | 88 | 0.4% |
| Italian | 1,670 | 6.7% |
| Jamaican | 51 | 0.2% |
| Kenyan | 6 | 0.0% |
| Korean | 124 | 0.5% |
| Laotian | 9 | 0.0% |
| Lebanese | 134 | 0.5% |
| Liberian | 7 | 0.0% |
| Lithuanian | 21 | 0.1% |
| Mexican | 673 | 2.7% |
| Mexican American Indian | 39 | 0.2% |
| Native Hawaiian | 26 | 0.1% |
| New Zealander | 24 | 0.1% |
| Northern European | 70 | 0.3% |
| Norwegian | 292 | 1.2% |
| Pakistani | 38 | 0.2% |
| Polish | 3,600 | 14.5% |
| Puerto Rican | 59 | 0.2% |
| Romanian | 48 | 0.2% |
| Russian | 76 | 0.3% |
| Salvadoran | 74 | 0.3% |
| Scandinavian | 188 | 0.8% |
| Scotch-Irish | 142 | 0.6% |
| Scottish | 797 | 3.2% |
| Serbian | 30 | 0.1% |
| Slavic | 10 | 0.0% |
| Slovak | 112 | 0.4% |
| Slovene | 33 | 0.1% |
| South American | 44 | 0.2% |
| Sri Lankan | 84 | 0.3% |
| Subsaharan African | 47 | 0.2% |
| Swedish | 373 | 1.5% |
| Swiss | 248 | 1.0% |
| Thai | 190 | 0.8% |
| Turkish | 150 | 0.6% |
| Ukrainian | 194 | 0.8% |
| Welsh | 169 | 0.7% |
| Yugoslavian | 8 | 0.0% | View All 71 Rows |
Immigrants in Perrysburg
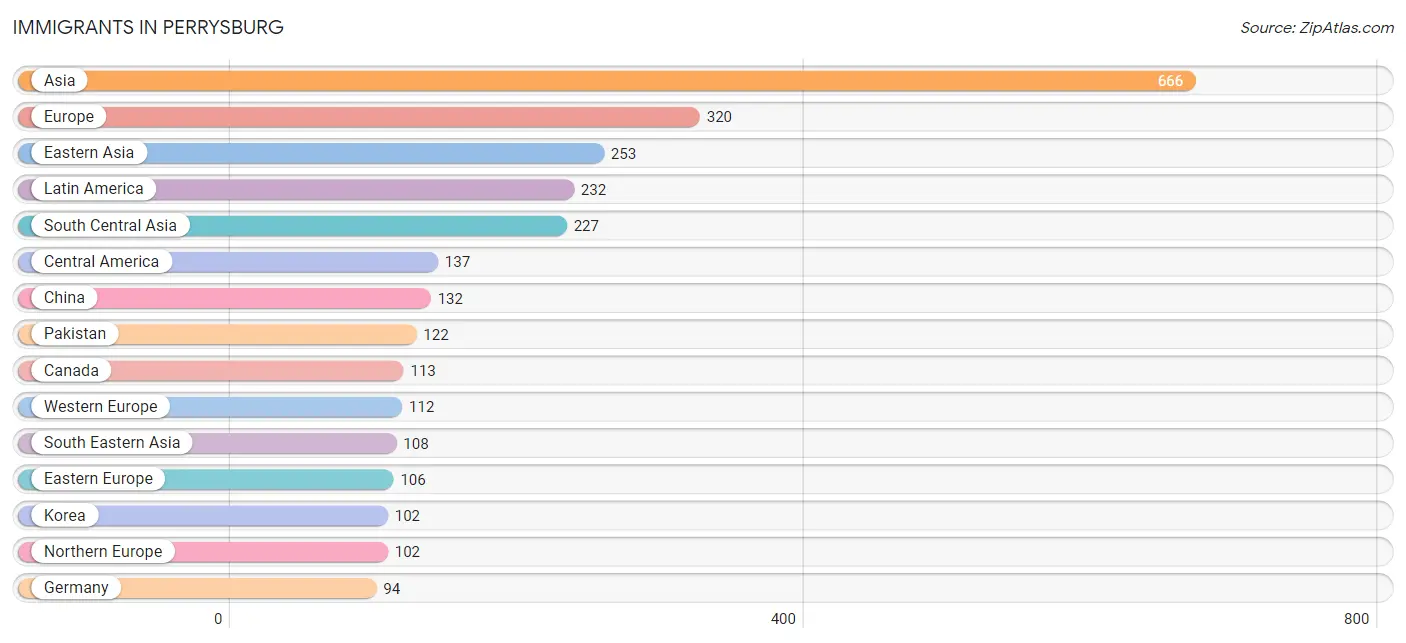
The most numerous immigrant groups reported in Perrysburg came from Asia (666 | 2.7%), Europe (320 | 1.3%), Eastern Asia (253 | 1.0%), Latin America (232 | 0.9%), and South Central Asia (227 | 0.9%), together accounting for 6.8% of all Perrysburg residents.
| Immigration Origin | # Population | % Population |
| Africa | 53 | 0.2% |
| Albania | 13 | 0.1% |
| Asia | 666 | 2.7% |
| Canada | 113 | 0.4% |
| Caribbean | 51 | 0.2% |
| Central America | 137 | 0.5% |
| China | 132 | 0.5% |
| Colombia | 44 | 0.2% |
| Eastern Asia | 253 | 1.0% |
| Eastern Europe | 106 | 0.4% |
| El Salvador | 74 | 0.3% |
| Europe | 320 | 1.3% |
| Germany | 94 | 0.4% |
| Hong Kong | 28 | 0.1% |
| India | 78 | 0.3% |
| Indonesia | 9 | 0.0% |
| Jamaica | 51 | 0.2% |
| Japan | 19 | 0.1% |
| Kazakhstan | 27 | 0.1% |
| Korea | 102 | 0.4% |
| Latin America | 232 | 0.9% |
| Liberia | 7 | 0.0% |
| Mexico | 63 | 0.3% |
| Netherlands | 18 | 0.1% |
| Northern Africa | 34 | 0.1% |
| Northern Europe | 102 | 0.4% |
| Pakistan | 122 | 0.5% |
| Philippines | 30 | 0.1% |
| Poland | 26 | 0.1% |
| Romania | 48 | 0.2% |
| Saudi Arabia | 4 | 0.0% |
| Scotland | 12 | 0.1% |
| South Africa | 12 | 0.1% |
| South America | 44 | 0.2% |
| South Central Asia | 227 | 0.9% |
| South Eastern Asia | 108 | 0.4% |
| Thailand | 11 | 0.0% |
| Turkey | 74 | 0.3% |
| Vietnam | 58 | 0.2% |
| Western Africa | 7 | 0.0% |
| Western Asia | 78 | 0.3% |
| Western Europe | 112 | 0.4% | View All 42 Rows |
Sex and Age in Perrysburg
Sex and Age in Perrysburg
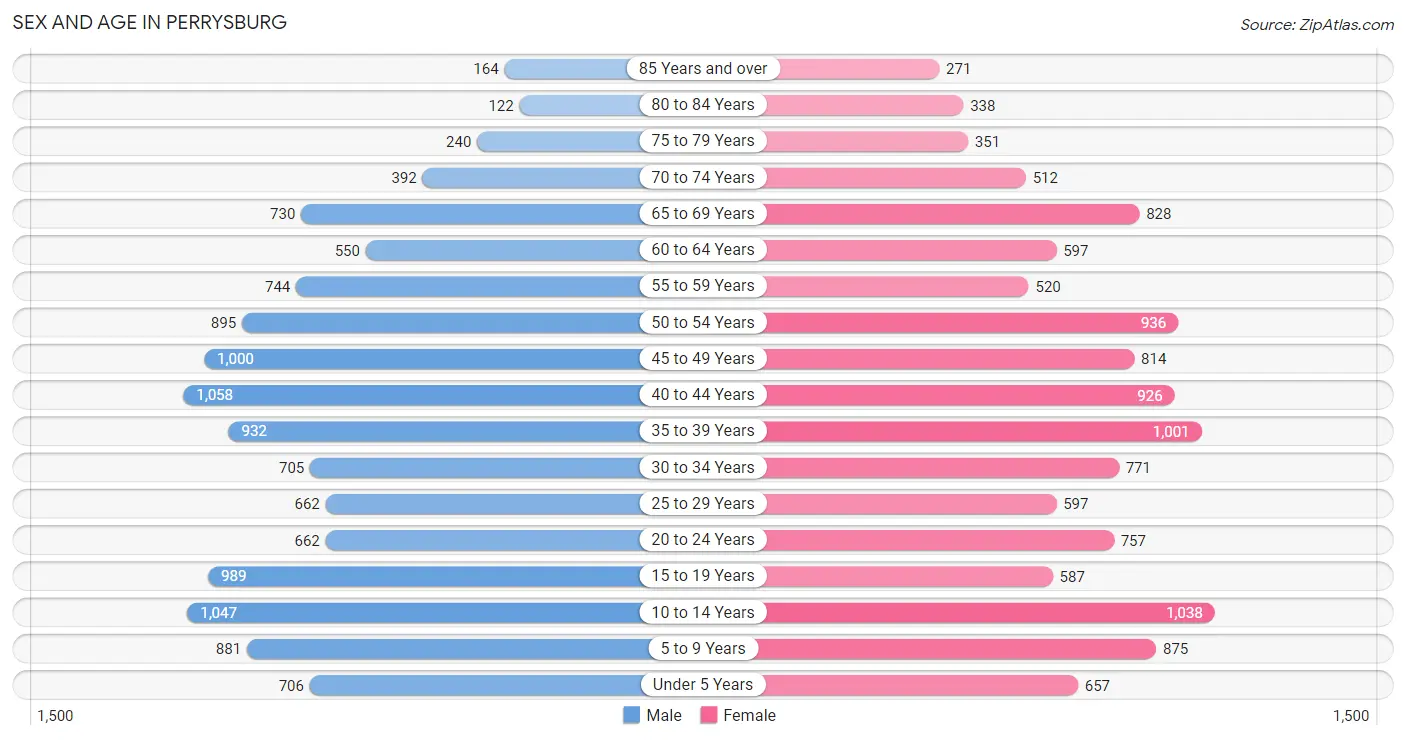
The most populous age groups in Perrysburg are 40 to 44 Years (1,058 | 8.5%) for men and 10 to 14 Years (1,038 | 8.4%) for women.
| Age Bracket | Male | Female |
| Under 5 Years | 706 (5.7%) | 657 (5.3%) |
| 5 to 9 Years | 881 (7.1%) | 875 (7.1%) |
| 10 to 14 Years | 1,047 (8.4%) | 1,038 (8.4%) |
| 15 to 19 Years | 989 (7.9%) | 587 (4.7%) |
| 20 to 24 Years | 662 (5.3%) | 757 (6.1%) |
| 25 to 29 Years | 662 (5.3%) | 597 (4.8%) |
| 30 to 34 Years | 705 (5.7%) | 771 (6.2%) |
| 35 to 39 Years | 932 (7.5%) | 1,001 (8.1%) |
| 40 to 44 Years | 1,058 (8.5%) | 926 (7.5%) |
| 45 to 49 Years | 1,000 (8.0%) | 814 (6.6%) |
| 50 to 54 Years | 895 (7.2%) | 936 (7.6%) |
| 55 to 59 Years | 744 (6.0%) | 520 (4.2%) |
| 60 to 64 Years | 550 (4.4%) | 597 (4.8%) |
| 65 to 69 Years | 730 (5.9%) | 828 (6.7%) |
| 70 to 74 Years | 392 (3.1%) | 512 (4.1%) |
| 75 to 79 Years | 240 (1.9%) | 351 (2.8%) |
| 80 to 84 Years | 122 (1.0%) | 338 (2.7%) |
| 85 Years and over | 164 (1.3%) | 271 (2.2%) |
| Total | 12,479 (100.0%) | 12,376 (100.0%) |
Families and Households in Perrysburg
Median Family Size in Perrysburg
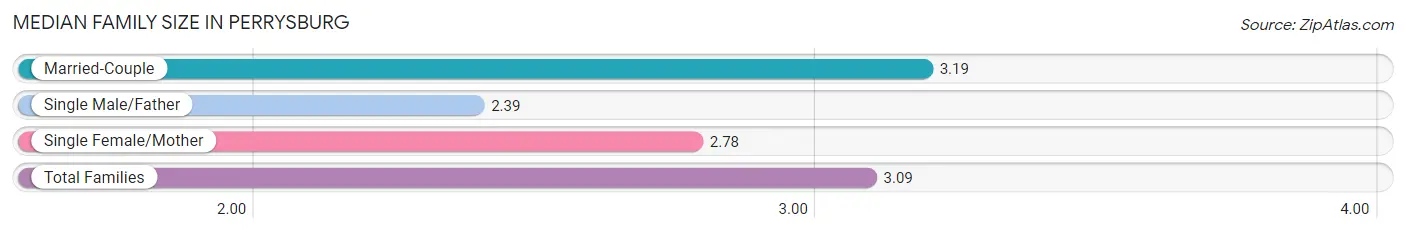
The median family size in Perrysburg is 3.09 persons per family, with married-couple families (5,203 | 82.3%) accounting for the largest median family size of 3.19 persons per family. On the other hand, single male/father families (348 | 5.5%) represent the smallest median family size with 2.39 persons per family.
| Family Type | # Families | Family Size |
| Married-Couple | 5,203 (82.3%) | 3.19 |
| Single Male/Father | 348 (5.5%) | 2.39 |
| Single Female/Mother | 774 (12.2%) | 2.78 |
| Total Families | 6,325 (100.0%) | 3.09 |
Median Household Size in Perrysburg
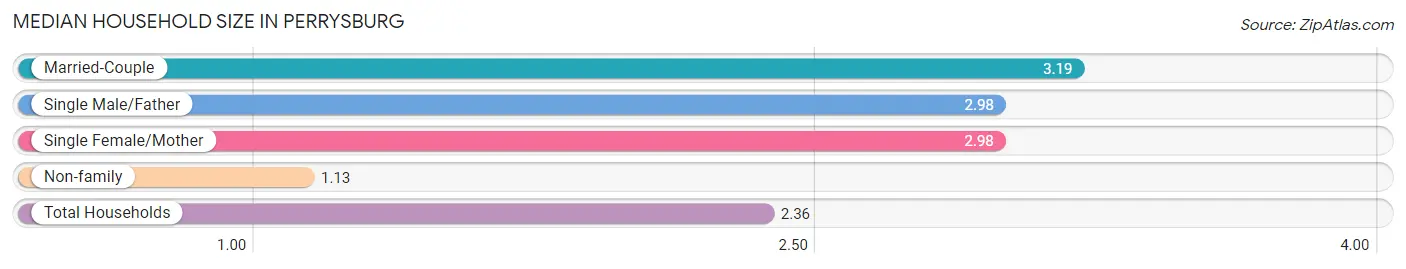
The median household size in Perrysburg is 2.36 persons per household, with married-couple households (5,203 | 49.9%) accounting for the largest median household size of 3.19 persons per household. non-family households (4,099 | 39.3%) represent the smallest median household size with 1.13 persons per household.
| Household Type | # Households | Household Size |
| Married-Couple | 5,203 (49.9%) | 3.19 |
| Single Male/Father | 348 (3.3%) | 2.98 |
| Single Female/Mother | 774 (7.4%) | 2.98 |
| Non-family | 4,099 (39.3%) | 1.13 |
| Total Households | 10,424 (100.0%) | 2.36 |
Household Size by Marriage Status in Perrysburg
Out of a total of 10,424 households in Perrysburg, 6,325 (60.7%) are family households, while 4,099 (39.3%) are nonfamily households. The most numerous type of family households are 2-person households, comprising 2,591, and the most common type of nonfamily households are 1-person households, comprising 3,584.
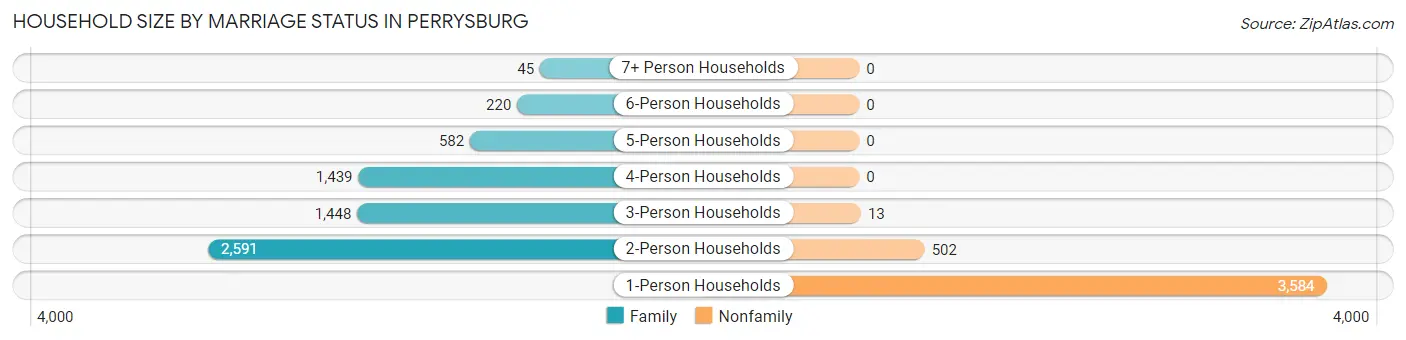
| Household Size | Family Households | Nonfamily Households |
| 1-Person Households | - | 3,584 (34.4%) |
| 2-Person Households | 2,591 (24.9%) | 502 (4.8%) |
| 3-Person Households | 1,448 (13.9%) | 13 (0.1%) |
| 4-Person Households | 1,439 (13.8%) | 0 (0.0%) |
| 5-Person Households | 582 (5.6%) | 0 (0.0%) |
| 6-Person Households | 220 (2.1%) | 0 (0.0%) |
| 7+ Person Households | 45 (0.4%) | 0 (0.0%) |
| Total | 6,325 (60.7%) | 4,099 (39.3%) |
Female Fertility in Perrysburg
Fertility by Age in Perrysburg
Average fertility rate in Perrysburg is 38.0 births per 1,000 women. Women in the age bracket of 20 to 34 years have the highest fertility rate with 69.0 births per 1,000 women. Women in the age bracket of 20 to 34 years acount for 68.9% of all women with births.
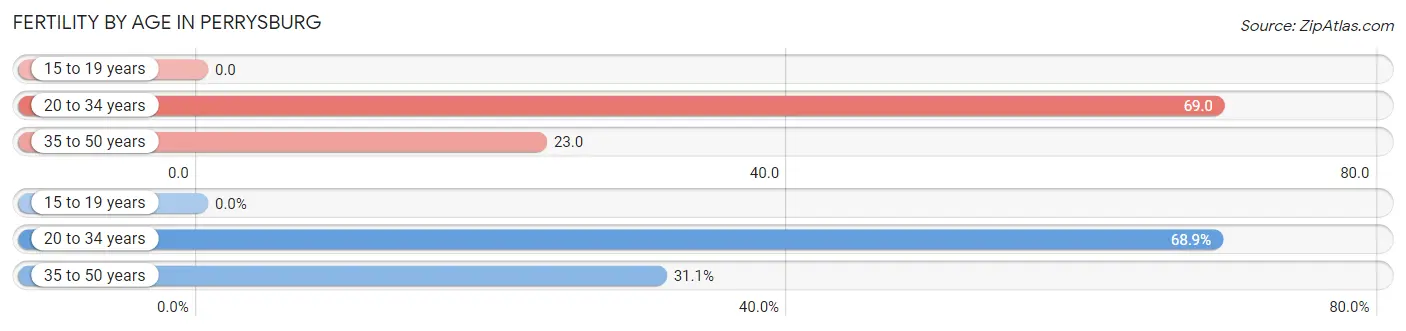
| Age Bracket | Women with Births | Births / 1,000 Women |
| 15 to 19 years | 0 (0.0%) | 0.0 |
| 20 to 34 years | 146 (68.9%) | 69.0 |
| 35 to 50 years | 66 (31.1%) | 23.0 |
| Total | 212 (100.0%) | 38.0 |
Fertility by Age by Marriage Status in Perrysburg
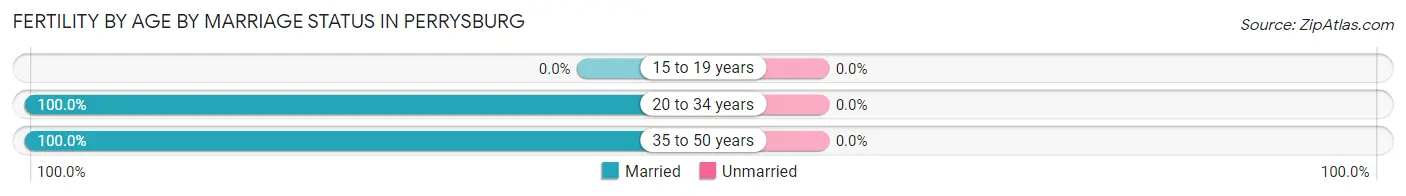
| Age Bracket | Married | Unmarried |
| 15 to 19 years | 0 (0.0%) | 0 (0.0%) |
| 20 to 34 years | 146 (100.0%) | 0 (0.0%) |
| 35 to 50 years | 66 (100.0%) | 0 (0.0%) |
| Total | 212 (100.0%) | 0 (0.0%) |
Fertility by Education in Perrysburg
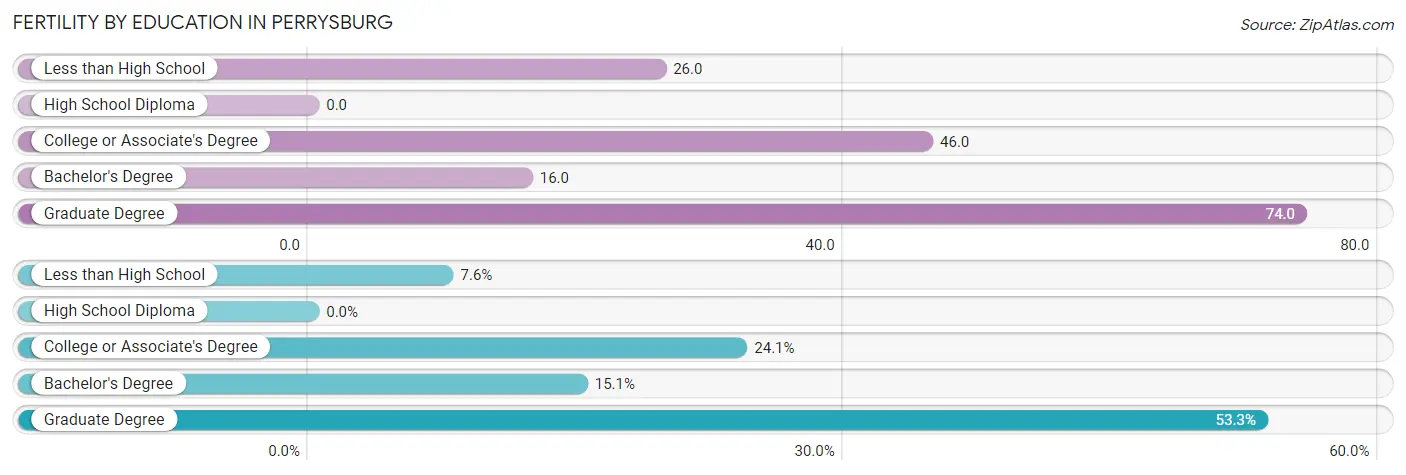
| Educational Attainment | Women with Births | Births / 1,000 Women |
| Less than High School | 16 (7.5%) | 26.0 |
| High School Diploma | 0 (0.0%) | 0.0 |
| College or Associate's Degree | 51 (24.1%) | 46.0 |
| Bachelor's Degree | 32 (15.1%) | 16.0 |
| Graduate Degree | 113 (53.3%) | 74.0 |
| Total | 212 (100.0%) | 38.0 |
Fertility by Education by Marriage Status in Perrysburg
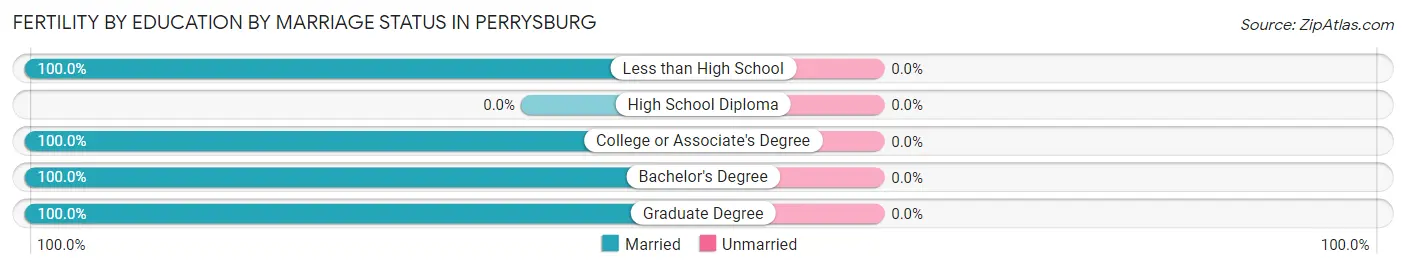
| Educational Attainment | Married | Unmarried |
| Less than High School | 16 (100.0%) | 0 (0.0%) |
| High School Diploma | 0 (0.0%) | 0 (0.0%) |
| College or Associate's Degree | 51 (100.0%) | 0 (0.0%) |
| Bachelor's Degree | 32 (100.0%) | 0 (0.0%) |
| Graduate Degree | 113 (100.0%) | 0 (0.0%) |
| Total | 212 (100.0%) | 0 (0.0%) |
Employment Characteristics in Perrysburg
Employment by Class of Employer in Perrysburg
Among the 12,615 employed individuals in Perrysburg, private company employees (8,240 | 65.3%), not-for-profit organizations (1,415 | 11.2%), and local government employees (1,179 | 9.3%) make up the most common classes of employment.
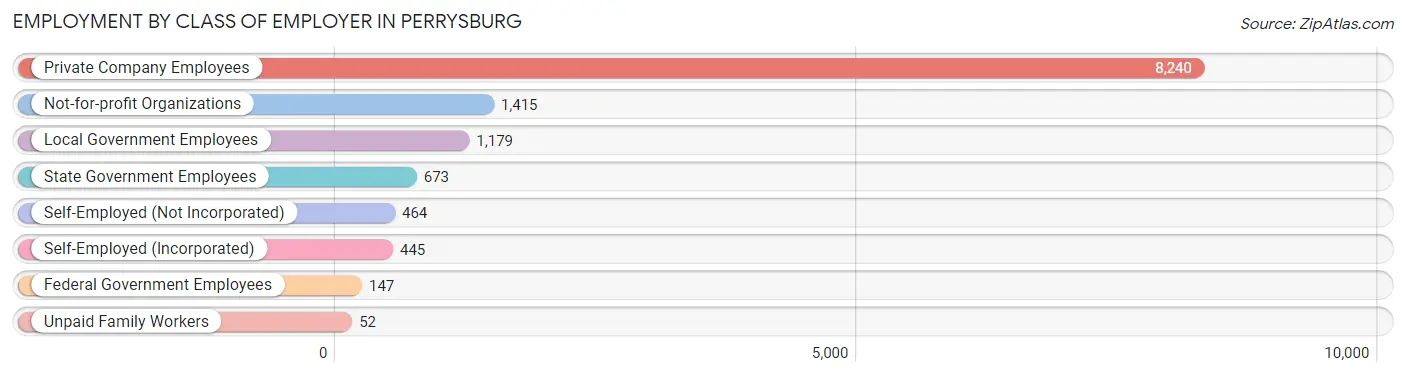
| Employer Class | # Employees | % Employees |
| Private Company Employees | 8,240 | 65.3% |
| Self-Employed (Incorporated) | 445 | 3.5% |
| Self-Employed (Not Incorporated) | 464 | 3.7% |
| Not-for-profit Organizations | 1,415 | 11.2% |
| Local Government Employees | 1,179 | 9.3% |
| State Government Employees | 673 | 5.3% |
| Federal Government Employees | 147 | 1.2% |
| Unpaid Family Workers | 52 | 0.4% |
| Total | 12,615 | 100.0% |
Employment Status by Age in Perrysburg
According to the labor force statistics for Perrysburg, out of the total population over 16 years of age (19,275), 69.3% or 13,358 individuals are in the labor force, with 4.1% or 548 of them unemployed. The age group with the highest labor force participation rate is 30 to 34 years, with 91.7% or 1,353 individuals in the labor force. Within the labor force, the 20 to 24 years age range has the highest percentage of unemployed individuals, with 26.4% or 286 of them being unemployed.
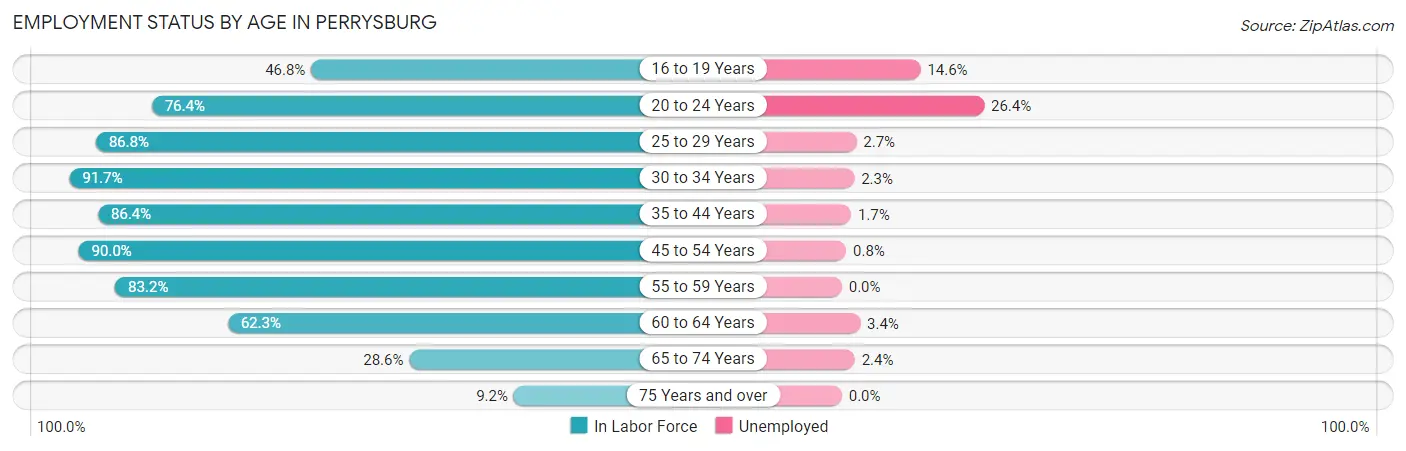
| Age Bracket | In Labor Force | Unemployed |
| 16 to 19 Years | 562 (46.8%) | 82 (14.6%) |
| 20 to 24 Years | 1,084 (76.4%) | 286 (26.4%) |
| 25 to 29 Years | 1,093 (86.8%) | 30 (2.7%) |
| 30 to 34 Years | 1,353 (91.7%) | 31 (2.3%) |
| 35 to 44 Years | 3,384 (86.4%) | 58 (1.7%) |
| 45 to 54 Years | 3,280 (90.0%) | 26 (0.8%) |
| 55 to 59 Years | 1,052 (83.2%) | 0 (0.0%) |
| 60 to 64 Years | 715 (62.3%) | 24 (3.4%) |
| 65 to 74 Years | 704 (28.6%) | 17 (2.4%) |
| 75 Years and over | 137 (9.2%) | 0 (0.0%) |
| Total | 13,358 (69.3%) | 548 (4.1%) |
Employment Status by Educational Attainment in Perrysburg
According to labor force statistics for Perrysburg, 85.6% of individuals (10,878) out of the total population between 25 and 64 years of age (12,708) are in the labor force, with 1.5% or 163 of them being unemployed. The group with the highest labor force participation rate are those with the educational attainment of bachelor's degree or higher, with 88.9% or 7,262 individuals in the labor force. Within the labor force, individuals with college / associate degree education have the highest percentage of unemployment, with 2.4% or 62 of them being unemployed.
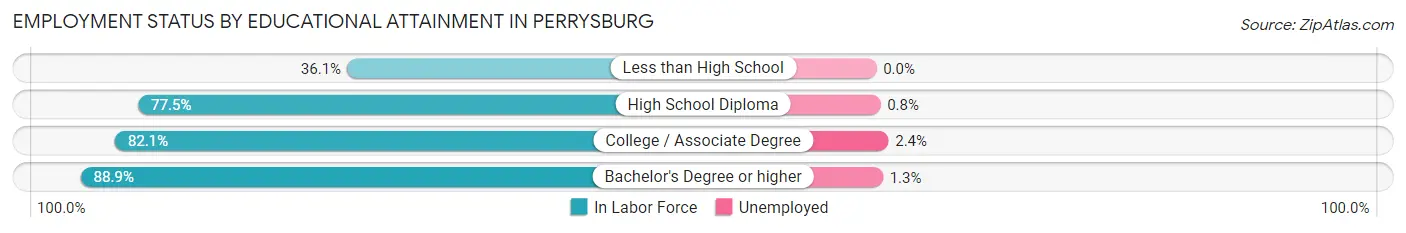
| Educational Attainment | In Labor Force | Unemployed |
| Less than High School | 43 (36.1%) | 0 (0.0%) |
| High School Diploma | 974 (77.5%) | 10 (0.8%) |
| College / Associate Degree | 2,597 (82.1%) | 76 (2.4%) |
| Bachelor's Degree or higher | 7,262 (88.9%) | 106 (1.3%) |
| Total | 10,878 (85.6%) | 191 (1.5%) |
Employment Occupations by Sex in Perrysburg
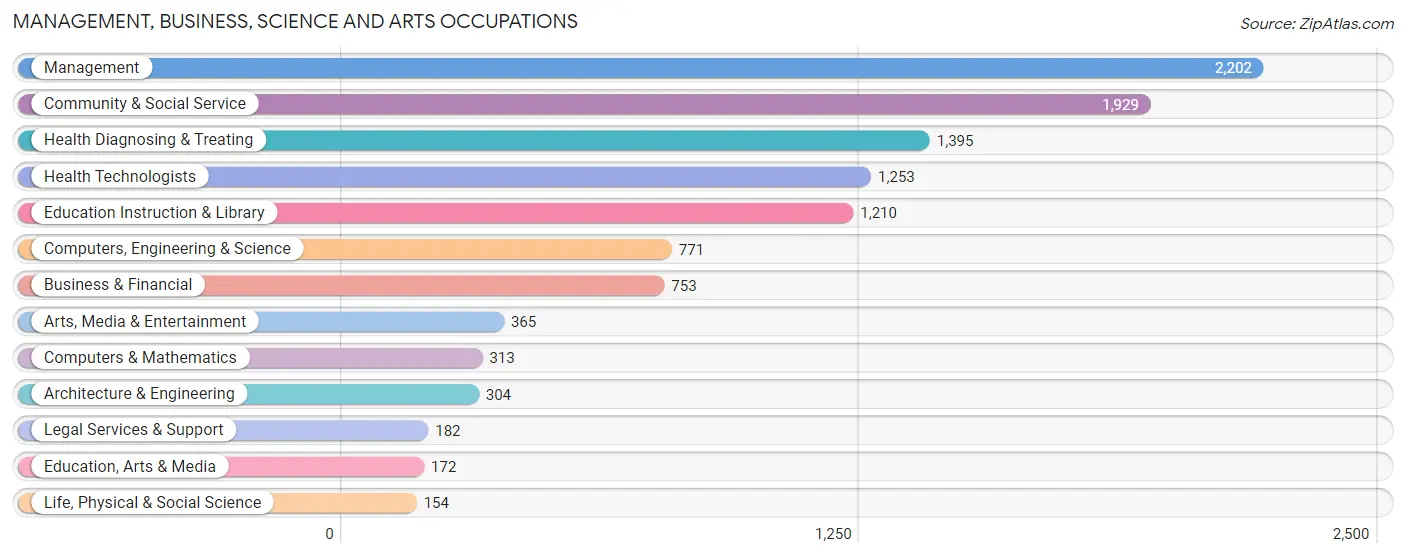
Management, Business, Science and Arts Occupations
The most common Management, Business, Science and Arts occupations in Perrysburg are Management (2,202 | 17.3%), Community & Social Service (1,929 | 15.1%), Health Diagnosing & Treating (1,395 | 10.9%), Health Technologists (1,253 | 9.8%), and Education Instruction & Library (1,210 | 9.5%).
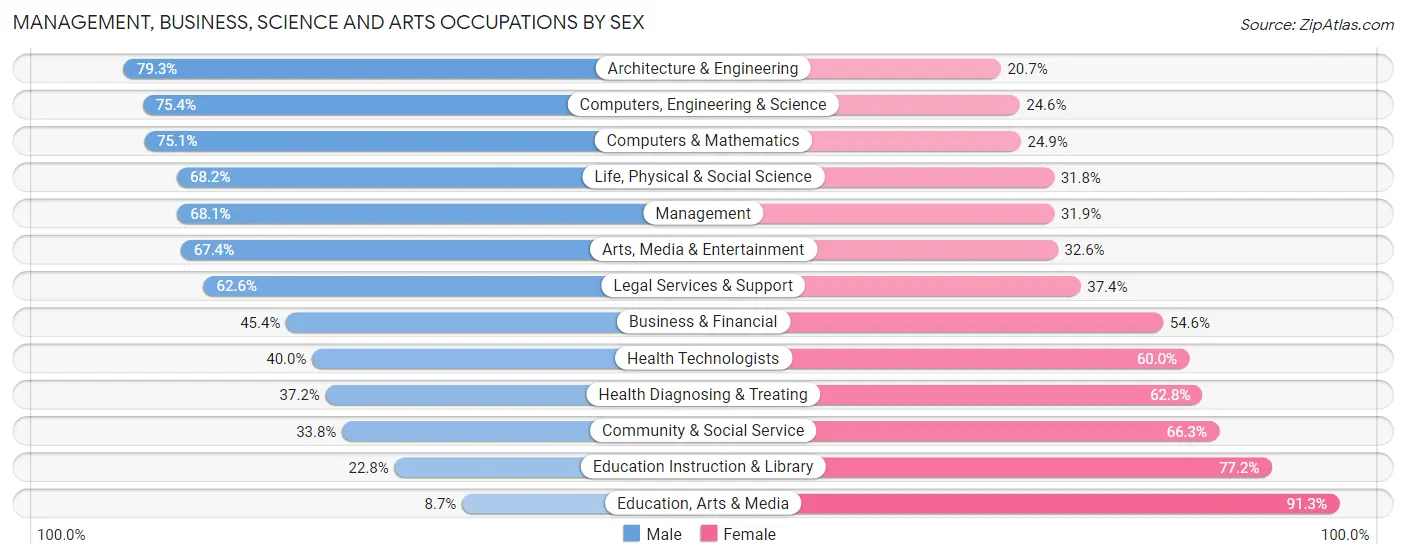
Management, Business, Science and Arts Occupations by Sex
Within the Management, Business, Science and Arts occupations in Perrysburg, the most male-oriented occupations are Architecture & Engineering (79.3%), Computers, Engineering & Science (75.4%), and Computers & Mathematics (75.1%), while the most female-oriented occupations are Education, Arts & Media (91.3%), Education Instruction & Library (77.2%), and Community & Social Service (66.2%).
| Occupation | Male | Female |
| Management | 1,500 (68.1%) | 702 (31.9%) |
| Business & Financial | 342 (45.4%) | 411 (54.6%) |
| Computers, Engineering & Science | 581 (75.4%) | 190 (24.6%) |
| Computers & Mathematics | 235 (75.1%) | 78 (24.9%) |
| Architecture & Engineering | 241 (79.3%) | 63 (20.7%) |
| Life, Physical & Social Science | 105 (68.2%) | 49 (31.8%) |
| Community & Social Service | 651 (33.8%) | 1,278 (66.2%) |
| Education, Arts & Media | 15 (8.7%) | 157 (91.3%) |
| Legal Services & Support | 114 (62.6%) | 68 (37.4%) |
| Education Instruction & Library | 276 (22.8%) | 934 (77.2%) |
| Arts, Media & Entertainment | 246 (67.4%) | 119 (32.6%) |
| Health Diagnosing & Treating | 519 (37.2%) | 876 (62.8%) |
| Health Technologists | 501 (40.0%) | 752 (60.0%) |
| Total (Category) | 3,593 (51.0%) | 3,457 (49.0%) |
| Total (Overall) | 6,840 (53.6%) | 5,909 (46.4%) |
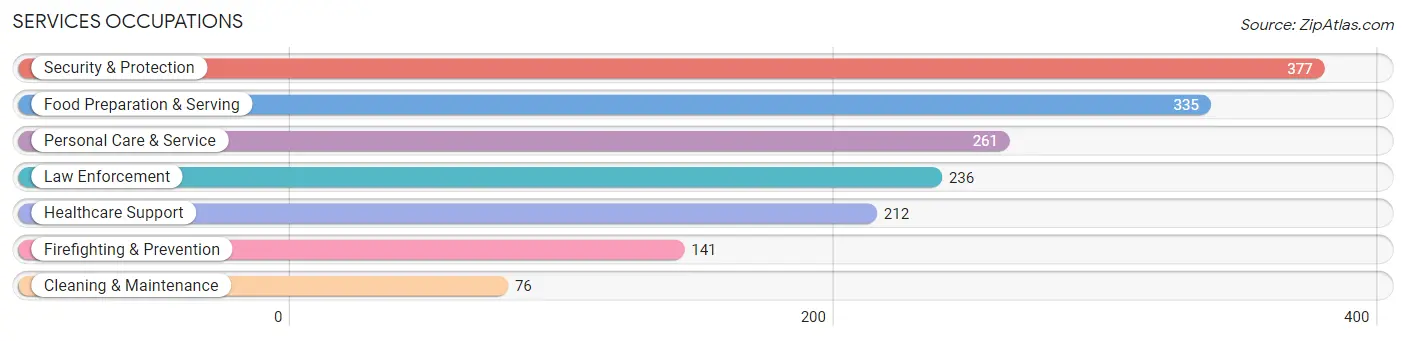
Services Occupations
The most common Services occupations in Perrysburg are Security & Protection (377 | 3.0%), Food Preparation & Serving (335 | 2.6%), Personal Care & Service (261 | 2.1%), Law Enforcement (236 | 1.8%), and Healthcare Support (212 | 1.7%).
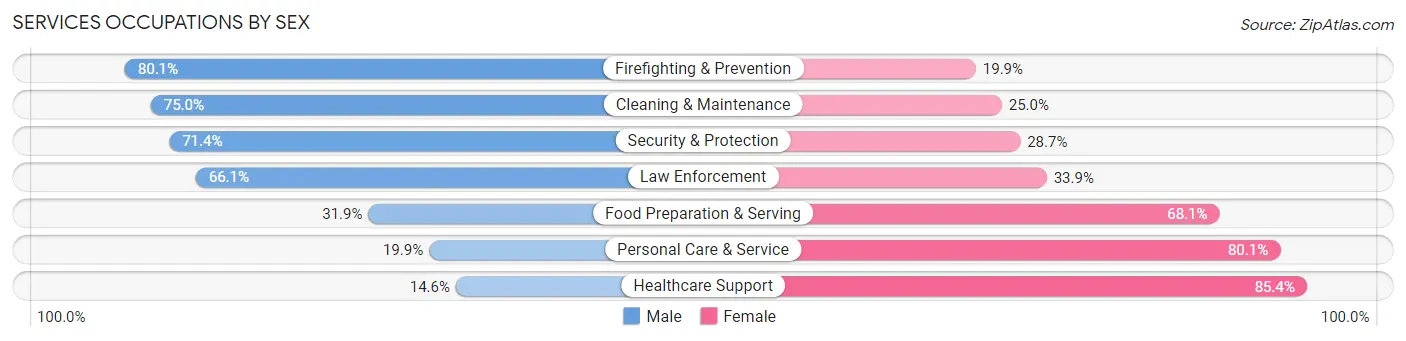
Services Occupations by Sex
Within the Services occupations in Perrysburg, the most male-oriented occupations are Firefighting & Prevention (80.1%), Cleaning & Maintenance (75.0%), and Security & Protection (71.4%), while the most female-oriented occupations are Healthcare Support (85.4%), Personal Care & Service (80.1%), and Food Preparation & Serving (68.1%).
| Occupation | Male | Female |
| Healthcare Support | 31 (14.6%) | 181 (85.4%) |
| Security & Protection | 269 (71.4%) | 108 (28.6%) |
| Firefighting & Prevention | 113 (80.1%) | 28 (19.9%) |
| Law Enforcement | 156 (66.1%) | 80 (33.9%) |
| Food Preparation & Serving | 107 (31.9%) | 228 (68.1%) |
| Cleaning & Maintenance | 57 (75.0%) | 19 (25.0%) |
| Personal Care & Service | 52 (19.9%) | 209 (80.1%) |
| Total (Category) | 516 (40.9%) | 745 (59.1%) |
| Total (Overall) | 6,840 (53.6%) | 5,909 (46.4%) |
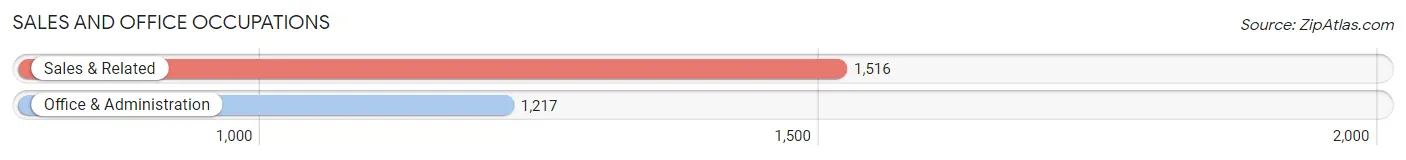
Sales and Office Occupations
The most common Sales and Office occupations in Perrysburg are Sales & Related (1,516 | 11.9%), and Office & Administration (1,217 | 9.6%).
Sales and Office Occupations by Sex
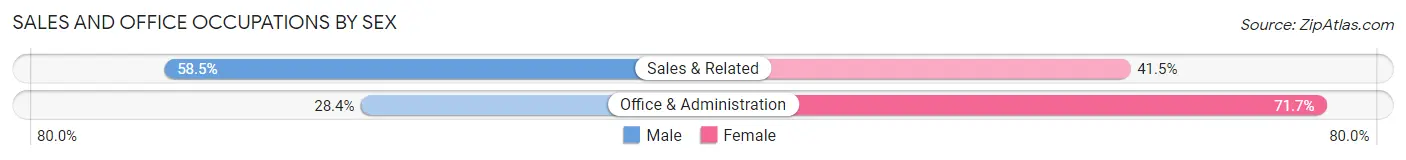
| Occupation | Male | Female |
| Sales & Related | 887 (58.5%) | 629 (41.5%) |
| Office & Administration | 345 (28.3%) | 872 (71.7%) |
| Total (Category) | 1,232 (45.1%) | 1,501 (54.9%) |
| Total (Overall) | 6,840 (53.6%) | 5,909 (46.4%) |
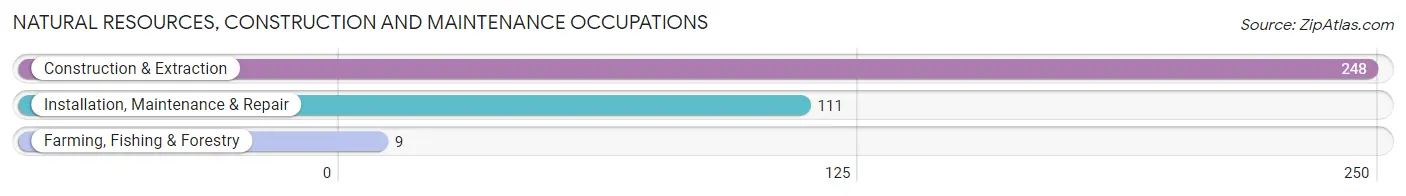
Natural Resources, Construction and Maintenance Occupations
The most common Natural Resources, Construction and Maintenance occupations in Perrysburg are Construction & Extraction (248 | 1.9%), Installation, Maintenance & Repair (111 | 0.9%), and Farming, Fishing & Forestry (9 | 0.1%).
Natural Resources, Construction and Maintenance Occupations by Sex
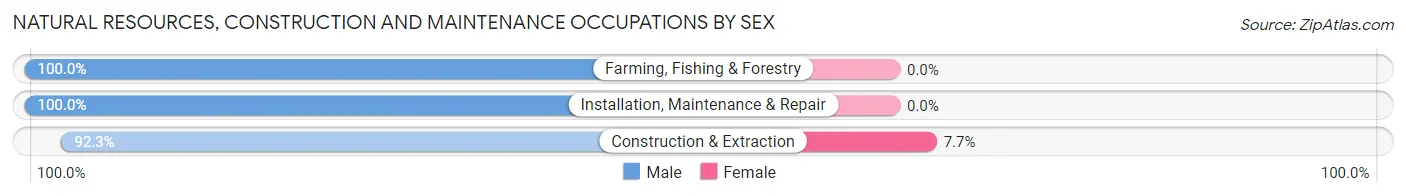
| Occupation | Male | Female |
| Farming, Fishing & Forestry | 9 (100.0%) | 0 (0.0%) |
| Construction & Extraction | 229 (92.3%) | 19 (7.7%) |
| Installation, Maintenance & Repair | 111 (100.0%) | 0 (0.0%) |
| Total (Category) | 349 (94.8%) | 19 (5.2%) |
| Total (Overall) | 6,840 (53.6%) | 5,909 (46.4%) |
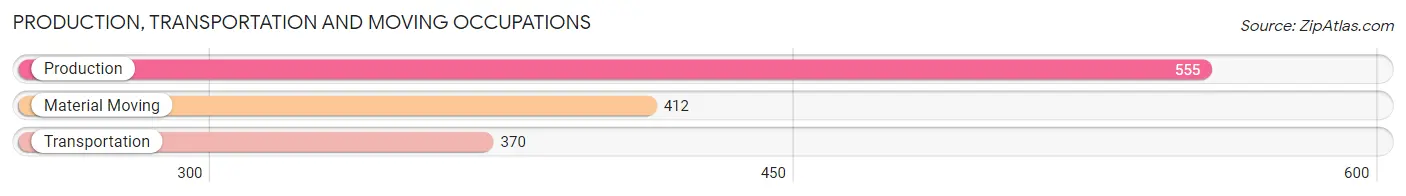
Production, Transportation and Moving Occupations
The most common Production, Transportation and Moving occupations in Perrysburg are Production (555 | 4.3%), Material Moving (412 | 3.2%), and Transportation (370 | 2.9%).
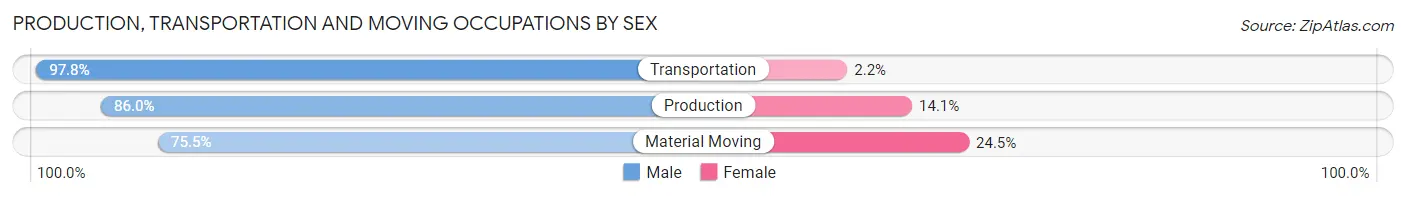
Production, Transportation and Moving Occupations by Sex
| Occupation | Male | Female |
| Production | 477 (86.0%) | 78 (14.1%) |
| Transportation | 362 (97.8%) | 8 (2.2%) |
| Material Moving | 311 (75.5%) | 101 (24.5%) |
| Total (Category) | 1,150 (86.0%) | 187 (14.0%) |
| Total (Overall) | 6,840 (53.6%) | 5,909 (46.4%) |
Employment Industries by Sex in Perrysburg
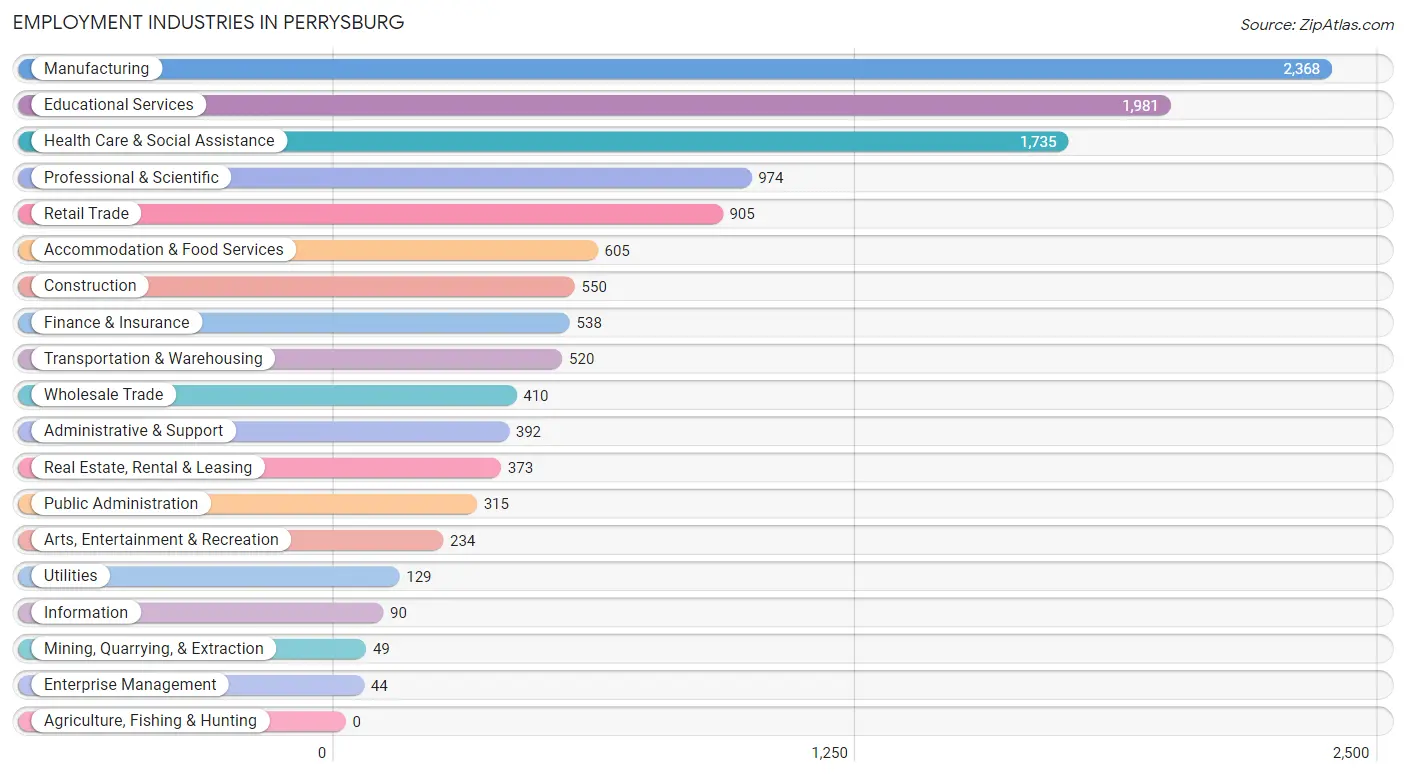
Employment Industries in Perrysburg
The major employment industries in Perrysburg include Manufacturing (2,368 | 18.6%), Educational Services (1,981 | 15.5%), Health Care & Social Assistance (1,735 | 13.6%), Professional & Scientific (974 | 7.6%), and Retail Trade (905 | 7.1%).
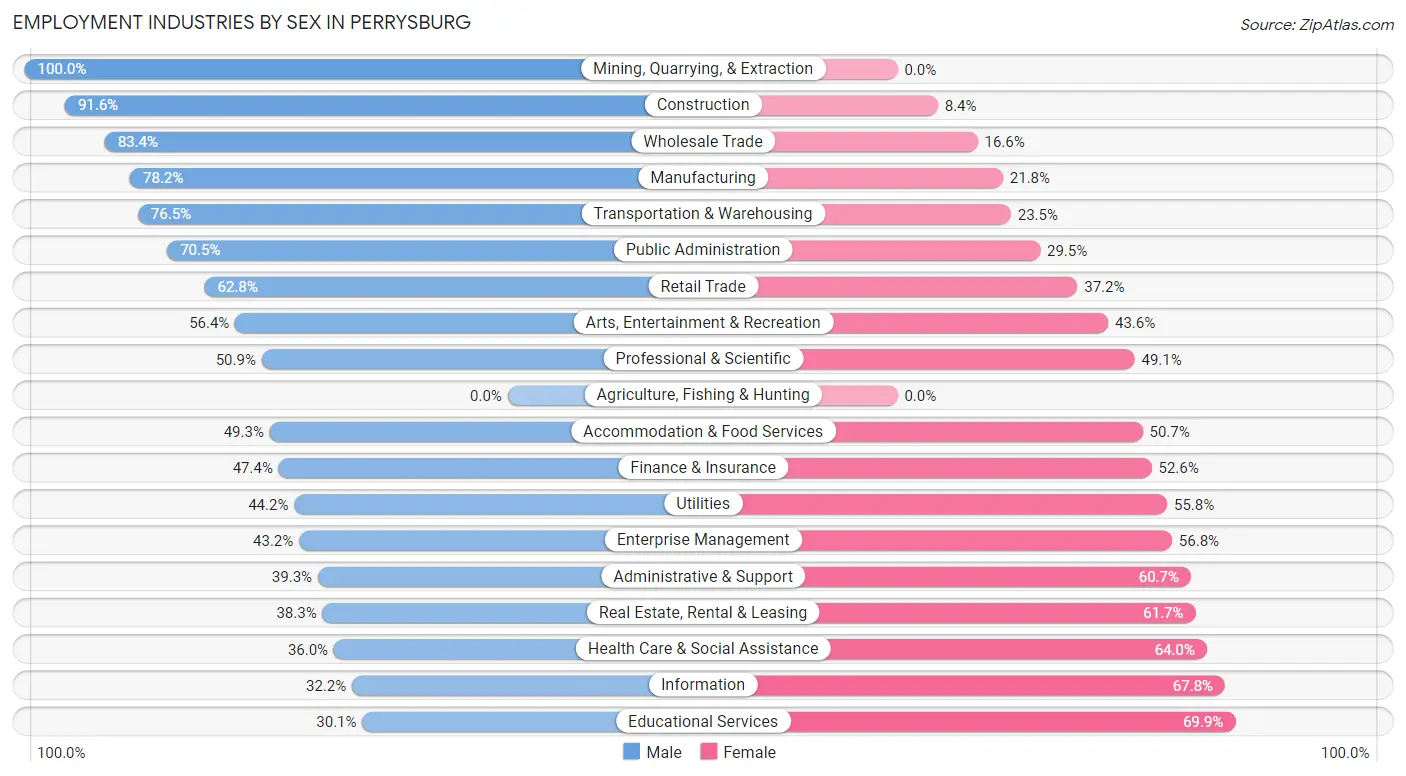
Employment Industries by Sex in Perrysburg
The Perrysburg industries that see more men than women are Mining, Quarrying, & Extraction (100.0%), Construction (91.6%), and Wholesale Trade (83.4%), whereas the industries that tend to have a higher number of women are Educational Services (69.9%), Information (67.8%), and Health Care & Social Assistance (64.0%).
| Industry | Male | Female |
| Agriculture, Fishing & Hunting | 0 (0.0%) | 0 (0.0%) |
| Mining, Quarrying, & Extraction | 49 (100.0%) | 0 (0.0%) |
| Construction | 504 (91.6%) | 46 (8.4%) |
| Manufacturing | 1,851 (78.2%) | 517 (21.8%) |
| Wholesale Trade | 342 (83.4%) | 68 (16.6%) |
| Retail Trade | 568 (62.8%) | 337 (37.2%) |
| Transportation & Warehousing | 398 (76.5%) | 122 (23.5%) |
| Utilities | 57 (44.2%) | 72 (55.8%) |
| Information | 29 (32.2%) | 61 (67.8%) |
| Finance & Insurance | 255 (47.4%) | 283 (52.6%) |
| Real Estate, Rental & Leasing | 143 (38.3%) | 230 (61.7%) |
| Professional & Scientific | 496 (50.9%) | 478 (49.1%) |
| Enterprise Management | 19 (43.2%) | 25 (56.8%) |
| Administrative & Support | 154 (39.3%) | 238 (60.7%) |
| Educational Services | 596 (30.1%) | 1,385 (69.9%) |
| Health Care & Social Assistance | 624 (36.0%) | 1,111 (64.0%) |
| Arts, Entertainment & Recreation | 132 (56.4%) | 102 (43.6%) |
| Accommodation & Food Services | 298 (49.3%) | 307 (50.7%) |
| Public Administration | 222 (70.5%) | 93 (29.5%) |
| Total | 6,840 (53.6%) | 5,909 (46.4%) |
Education in Perrysburg
School Enrollment in Perrysburg
The most common levels of schooling among the 7,136 students in Perrysburg are middle school (1,758 | 24.6%), high school (1,576 | 22.1%), and elementary school (1,456 | 20.4%).
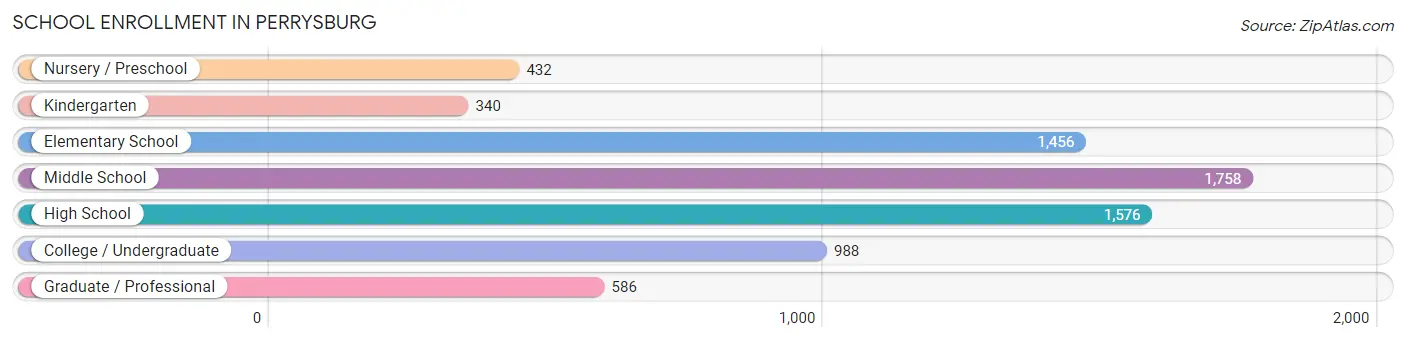
| School Level | # Students | % Students |
| Nursery / Preschool | 432 | 6.0% |
| Kindergarten | 340 | 4.8% |
| Elementary School | 1,456 | 20.4% |
| Middle School | 1,758 | 24.6% |
| High School | 1,576 | 22.1% |
| College / Undergraduate | 988 | 13.9% |
| Graduate / Professional | 586 | 8.2% |
| Total | 7,136 | 100.0% |
School Enrollment by Age by Funding Source in Perrysburg
Out of a total of 7,136 students who are enrolled in schools in Perrysburg, 1,192 (16.7%) attend a private institution, while the remaining 5,944 (83.3%) are enrolled in public schools. The age group of 3 to 4 year olds has the highest likelihood of being enrolled in private schools, with 164 (61.4% in the age bracket) enrolled. Conversely, the age group of 18 to 19 year olds has the lowest likelihood of being enrolled in a private school, with 231 (100.0% in the age bracket) attending a public institution.
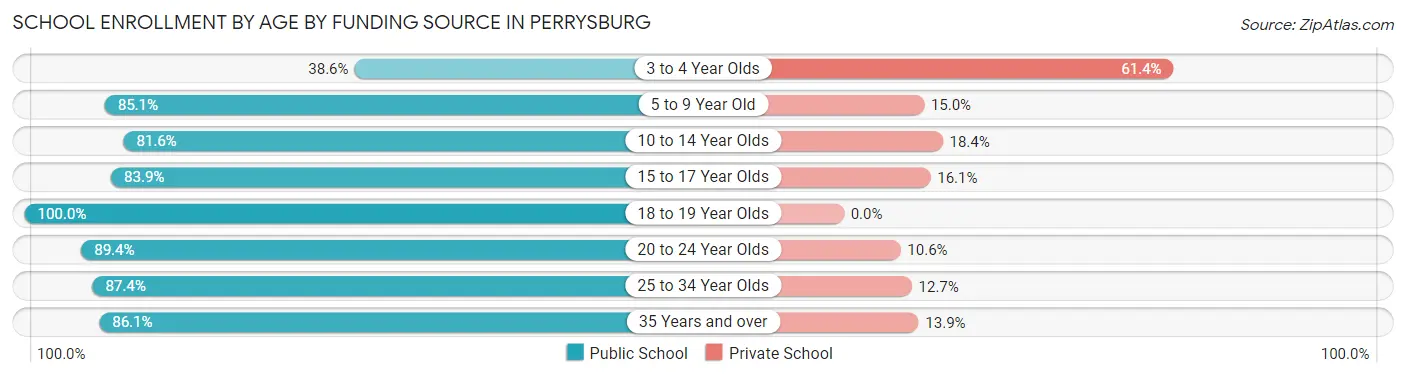
| Age Bracket | Public School | Private School |
| 3 to 4 Year Olds | 103 (38.6%) | 164 (61.4%) |
| 5 to 9 Year Old | 1,468 (85.1%) | 258 (14.9%) |
| 10 to 14 Year Olds | 1,701 (81.6%) | 384 (18.4%) |
| 15 to 17 Year Olds | 1,040 (83.9%) | 200 (16.1%) |
| 18 to 19 Year Olds | 231 (100.0%) | 0 (0.0%) |
| 20 to 24 Year Olds | 846 (89.4%) | 100 (10.6%) |
| 25 to 34 Year Olds | 290 (87.4%) | 42 (12.7%) |
| 35 Years and over | 266 (86.1%) | 43 (13.9%) |
| Total | 5,944 (83.3%) | 1,192 (16.7%) |
Educational Attainment by Field of Study in Perrysburg
Business (2,491 | 23.9%), education (1,410 | 13.5%), science & technology (1,402 | 13.5%), engineering (922 | 8.8%), and communications (624 | 6.0%) are the most common fields of study among 10,414 individuals in Perrysburg who have obtained a bachelor's degree or higher.
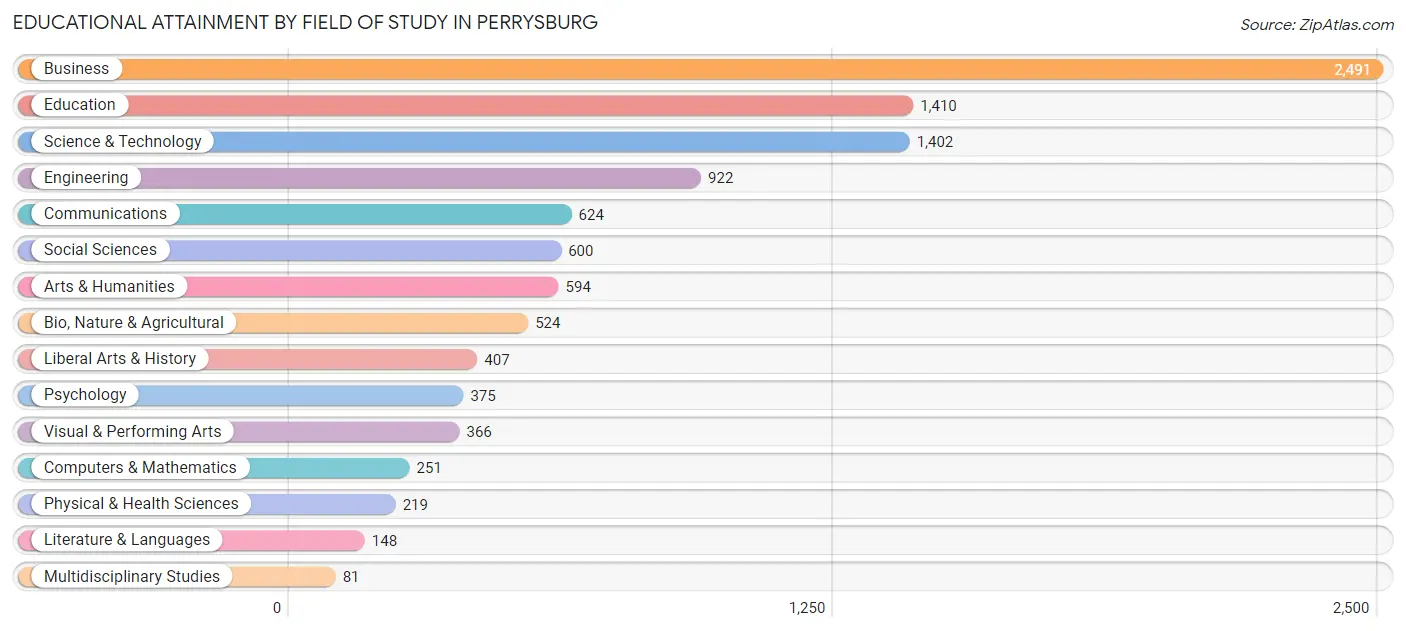
| Field of Study | # Graduates | % Graduates |
| Computers & Mathematics | 251 | 2.4% |
| Bio, Nature & Agricultural | 524 | 5.0% |
| Physical & Health Sciences | 219 | 2.1% |
| Psychology | 375 | 3.6% |
| Social Sciences | 600 | 5.8% |
| Engineering | 922 | 8.8% |
| Multidisciplinary Studies | 81 | 0.8% |
| Science & Technology | 1,402 | 13.5% |
| Business | 2,491 | 23.9% |
| Education | 1,410 | 13.5% |
| Literature & Languages | 148 | 1.4% |
| Liberal Arts & History | 407 | 3.9% |
| Visual & Performing Arts | 366 | 3.5% |
| Communications | 624 | 6.0% |
| Arts & Humanities | 594 | 5.7% |
| Total | 10,414 | 100.0% |
Transportation & Commute in Perrysburg
Vehicle Availability by Sex in Perrysburg
The most prevalent vehicle ownership categories in Perrysburg are males with 2 vehicles (3,308, accounting for 48.5%) and females with 2 vehicles (2,547, making up 57.3%).
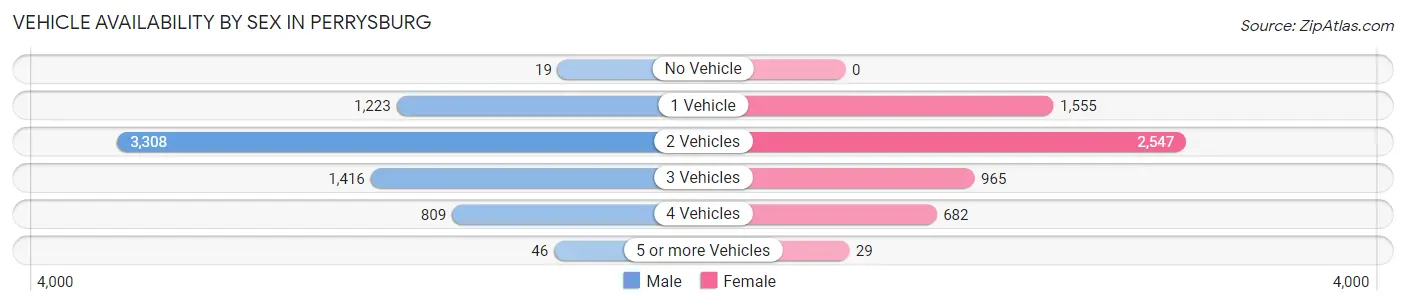
| Vehicles Available | Male | Female |
| No Vehicle | 19 (0.3%) | 0 (0.0%) |
| 1 Vehicle | 1,223 (17.9%) | 1,555 (26.9%) |
| 2 Vehicles | 3,308 (48.5%) | 2,547 (44.1%) |
| 3 Vehicles | 1,416 (20.8%) | 965 (16.7%) |
| 4 Vehicles | 809 (11.9%) | 682 (11.8%) |
| 5 or more Vehicles | 46 (0.7%) | 29 (0.5%) |
| Total | 6,821 (100.0%) | 5,778 (100.0%) |
Commute Time in Perrysburg
The most frequently occuring commute durations in Perrysburg are 20 to 24 minutes (2,044 commuters, 18.9%), 15 to 19 minutes (1,904 commuters, 17.6%), and 5 to 9 minutes (1,743 commuters, 16.1%).
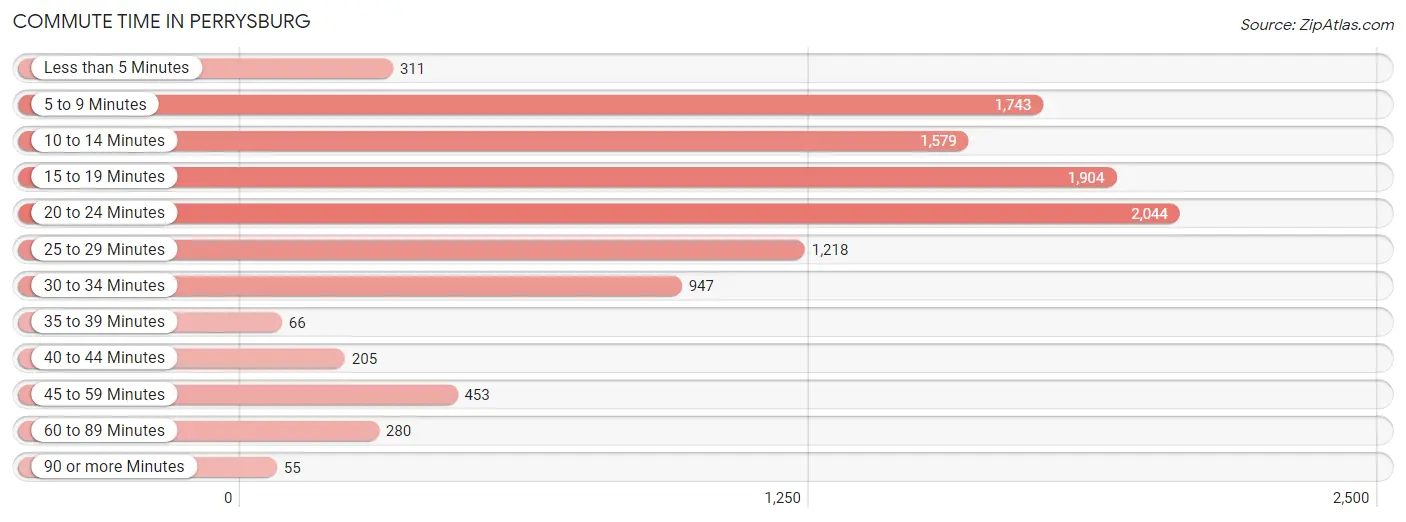
| Commute Time | # Commuters | % Commuters |
| Less than 5 Minutes | 311 | 2.9% |
| 5 to 9 Minutes | 1,743 | 16.1% |
| 10 to 14 Minutes | 1,579 | 14.6% |
| 15 to 19 Minutes | 1,904 | 17.6% |
| 20 to 24 Minutes | 2,044 | 18.9% |
| 25 to 29 Minutes | 1,218 | 11.3% |
| 30 to 34 Minutes | 947 | 8.8% |
| 35 to 39 Minutes | 66 | 0.6% |
| 40 to 44 Minutes | 205 | 1.9% |
| 45 to 59 Minutes | 453 | 4.2% |
| 60 to 89 Minutes | 280 | 2.6% |
| 90 or more Minutes | 55 | 0.5% |
Commute Time by Sex in Perrysburg
The most common commute times in Perrysburg are 20 to 24 minutes (1,244 commuters, 20.7%) for males and 5 to 9 minutes (1,124 commuters, 23.4%) for females.
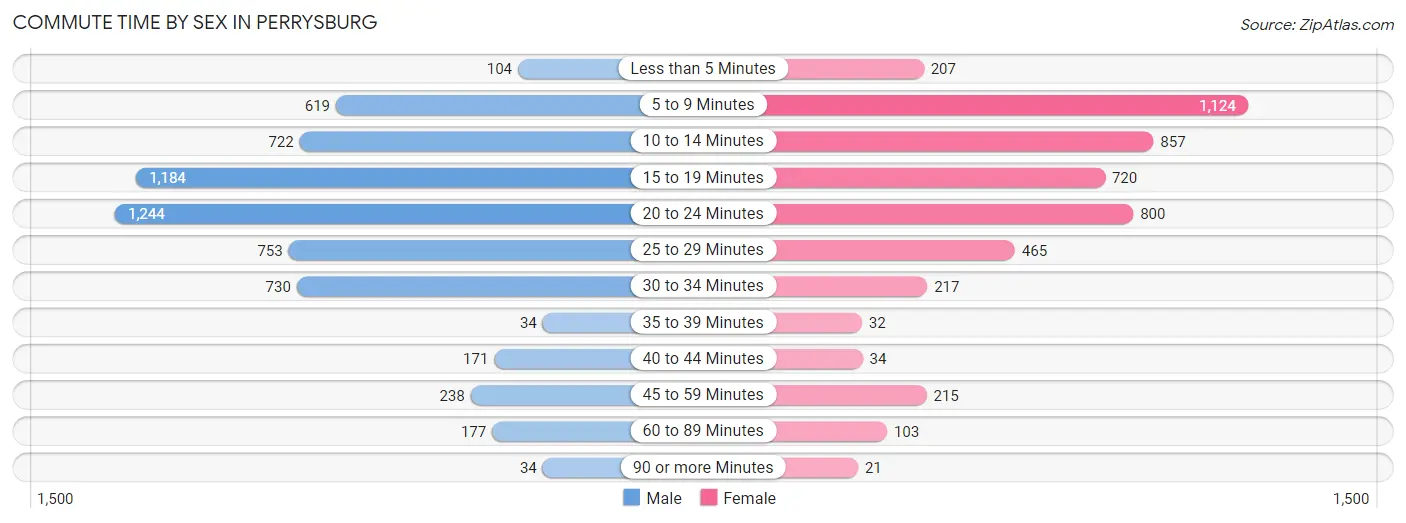
| Commute Time | Male | Female |
| Less than 5 Minutes | 104 (1.7%) | 207 (4.3%) |
| 5 to 9 Minutes | 619 (10.3%) | 1,124 (23.4%) |
| 10 to 14 Minutes | 722 (12.0%) | 857 (17.9%) |
| 15 to 19 Minutes | 1,184 (19.7%) | 720 (15.0%) |
| 20 to 24 Minutes | 1,244 (20.7%) | 800 (16.7%) |
| 25 to 29 Minutes | 753 (12.5%) | 465 (9.7%) |
| 30 to 34 Minutes | 730 (12.1%) | 217 (4.5%) |
| 35 to 39 Minutes | 34 (0.6%) | 32 (0.7%) |
| 40 to 44 Minutes | 171 (2.9%) | 34 (0.7%) |
| 45 to 59 Minutes | 238 (4.0%) | 215 (4.5%) |
| 60 to 89 Minutes | 177 (2.9%) | 103 (2.1%) |
| 90 or more Minutes | 34 (0.6%) | 21 (0.4%) |
Time of Departure to Work by Sex in Perrysburg
The most frequent times of departure to work in Perrysburg are 7:00 AM to 7:29 AM (1,101, 18.3%) for males and 7:30 AM to 7:59 AM (935, 19.5%) for females.
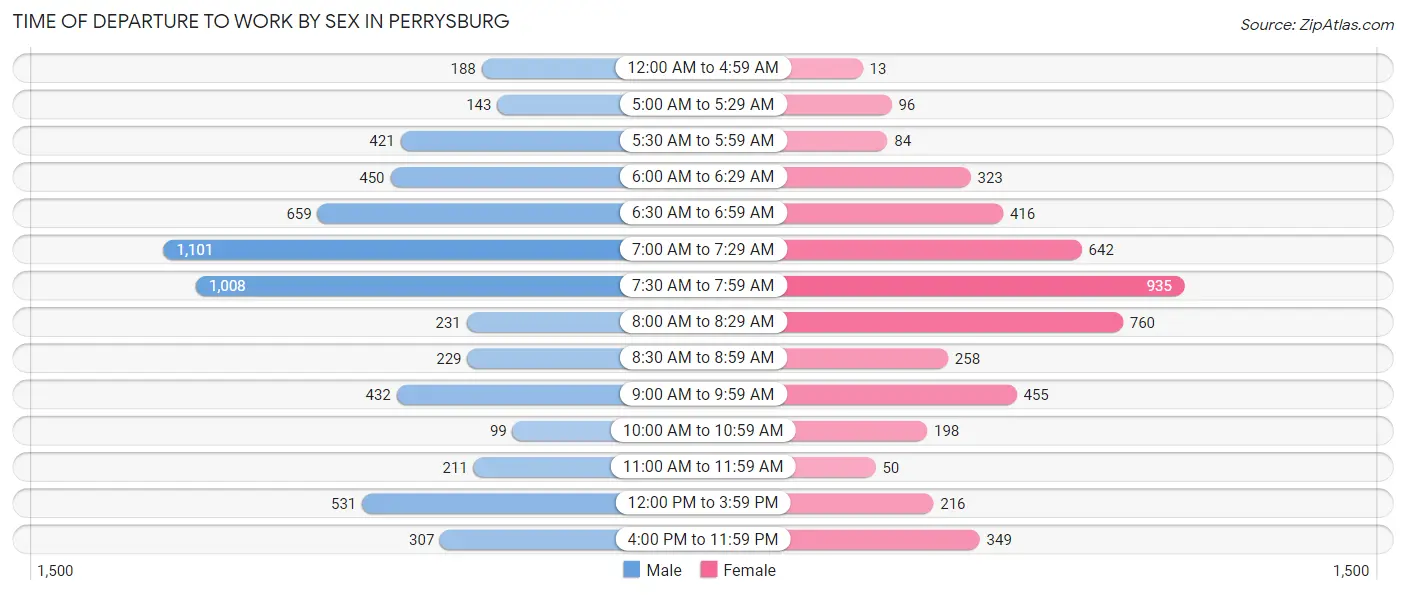
| Time of Departure | Male | Female |
| 12:00 AM to 4:59 AM | 188 (3.1%) | 13 (0.3%) |
| 5:00 AM to 5:29 AM | 143 (2.4%) | 96 (2.0%) |
| 5:30 AM to 5:59 AM | 421 (7.0%) | 84 (1.8%) |
| 6:00 AM to 6:29 AM | 450 (7.5%) | 323 (6.7%) |
| 6:30 AM to 6:59 AM | 659 (11.0%) | 416 (8.7%) |
| 7:00 AM to 7:29 AM | 1,101 (18.3%) | 642 (13.4%) |
| 7:30 AM to 7:59 AM | 1,008 (16.8%) | 935 (19.5%) |
| 8:00 AM to 8:29 AM | 231 (3.8%) | 760 (15.9%) |
| 8:30 AM to 8:59 AM | 229 (3.8%) | 258 (5.4%) |
| 9:00 AM to 9:59 AM | 432 (7.2%) | 455 (9.5%) |
| 10:00 AM to 10:59 AM | 99 (1.7%) | 198 (4.1%) |
| 11:00 AM to 11:59 AM | 211 (3.5%) | 50 (1.0%) |
| 12:00 PM to 3:59 PM | 531 (8.8%) | 216 (4.5%) |
| 4:00 PM to 11:59 PM | 307 (5.1%) | 349 (7.3%) |
| Total | 6,010 (100.0%) | 4,795 (100.0%) |
Housing Occupancy in Perrysburg
Occupancy by Ownership in Perrysburg
Of the total 10,424 dwellings in Perrysburg, owner-occupied units account for 6,473 (62.1%), while renter-occupied units make up 3,951 (37.9%).
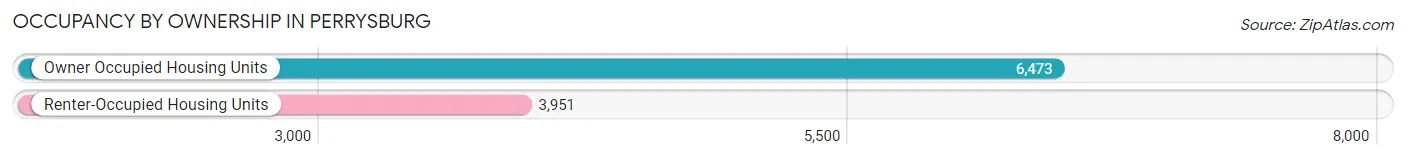
| Occupancy | # Housing Units | % Housing Units |
| Owner Occupied Housing Units | 6,473 | 62.1% |
| Renter-Occupied Housing Units | 3,951 | 37.9% |
| Total Occupied Housing Units | 10,424 | 100.0% |
Occupancy by Household Size in Perrysburg
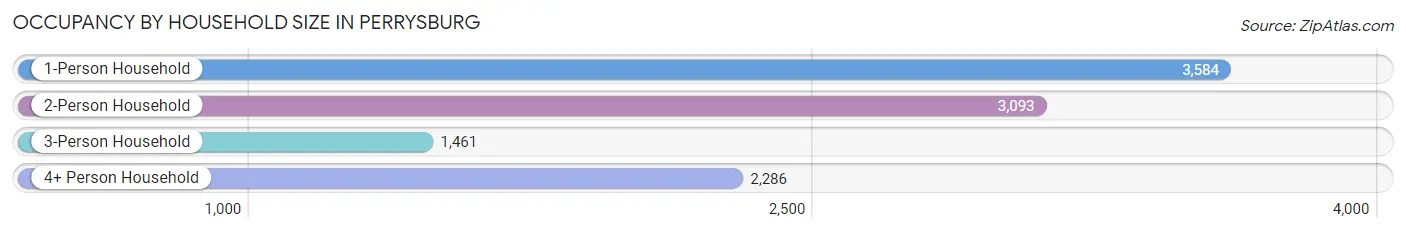
| Household Size | # Housing Units | % Housing Units |
| 1-Person Household | 3,584 | 34.4% |
| 2-Person Household | 3,093 | 29.7% |
| 3-Person Household | 1,461 | 14.0% |
| 4+ Person Household | 2,286 | 21.9% |
| Total Housing Units | 10,424 | 100.0% |
Occupancy by Ownership by Household Size in Perrysburg
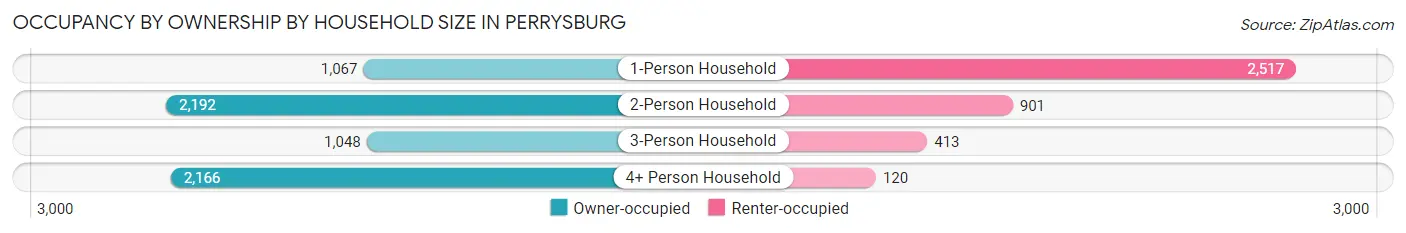
| Household Size | Owner-occupied | Renter-occupied |
| 1-Person Household | 1,067 (29.8%) | 2,517 (70.2%) |
| 2-Person Household | 2,192 (70.9%) | 901 (29.1%) |
| 3-Person Household | 1,048 (71.7%) | 413 (28.3%) |
| 4+ Person Household | 2,166 (94.8%) | 120 (5.2%) |
| Total Housing Units | 6,473 (62.1%) | 3,951 (37.9%) |
Occupancy by Educational Attainment in Perrysburg
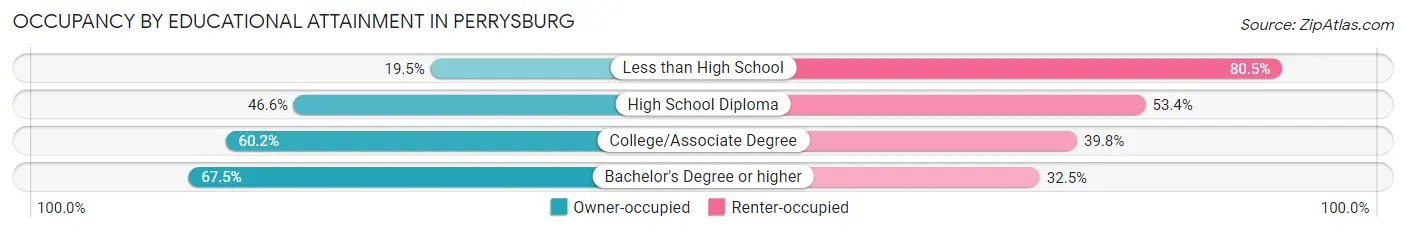
| Household Size | Owner-occupied | Renter-occupied |
| Less than High School | 41 (19.5%) | 169 (80.5%) |
| High School Diploma | 637 (46.6%) | 730 (53.4%) |
| College/Associate Degree | 1,469 (60.2%) | 973 (39.8%) |
| Bachelor's Degree or higher | 4,326 (67.5%) | 2,079 (32.5%) |
Occupancy by Age of Householder in Perrysburg
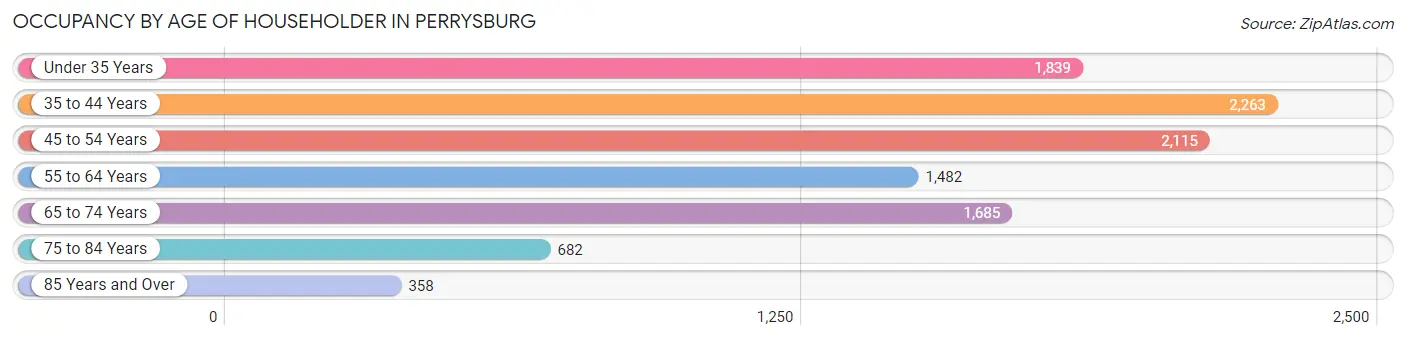
| Age Bracket | # Households | % Households |
| Under 35 Years | 1,839 | 17.6% |
| 35 to 44 Years | 2,263 | 21.7% |
| 45 to 54 Years | 2,115 | 20.3% |
| 55 to 64 Years | 1,482 | 14.2% |
| 65 to 74 Years | 1,685 | 16.2% |
| 75 to 84 Years | 682 | 6.5% |
| 85 Years and Over | 358 | 3.4% |
| Total | 10,424 | 100.0% |
Housing Finances in Perrysburg
Median Income by Occupancy in Perrysburg
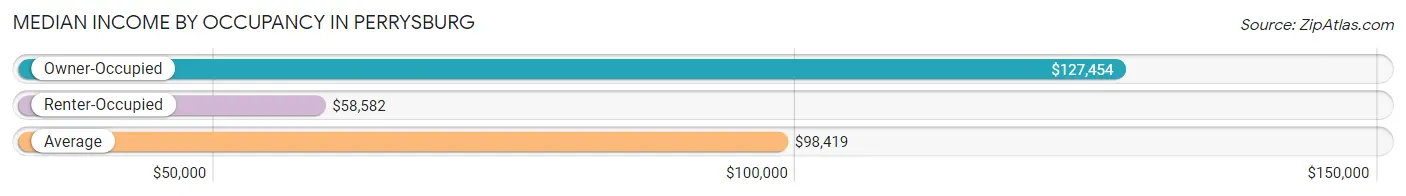
| Occupancy Type | # Households | Median Income |
| Owner-Occupied | 6,473 (62.1%) | $127,454 |
| Renter-Occupied | 3,951 (37.9%) | $58,582 |
| Average | 10,424 (100.0%) | $98,419 |
Occupancy by Householder Income Bracket in Perrysburg
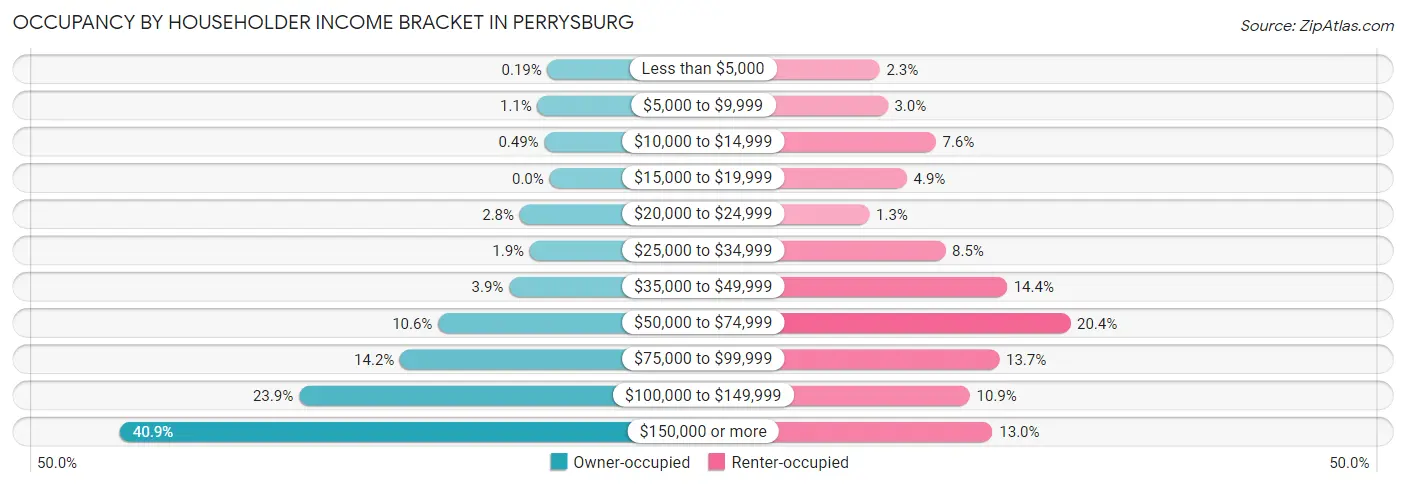
| Income Bracket | Owner-occupied | Renter-occupied |
| Less than $5,000 | 12 (0.2%) | 90 (2.3%) |
| $5,000 to $9,999 | 74 (1.1%) | 120 (3.0%) |
| $10,000 to $14,999 | 32 (0.5%) | 301 (7.6%) |
| $15,000 to $19,999 | 0 (0.0%) | 192 (4.9%) |
| $20,000 to $24,999 | 183 (2.8%) | 51 (1.3%) |
| $25,000 to $34,999 | 121 (1.9%) | 337 (8.5%) |
| $35,000 to $49,999 | 249 (3.8%) | 569 (14.4%) |
| $50,000 to $74,999 | 687 (10.6%) | 807 (20.4%) |
| $75,000 to $99,999 | 921 (14.2%) | 540 (13.7%) |
| $100,000 to $149,999 | 1,545 (23.9%) | 429 (10.9%) |
| $150,000 or more | 2,649 (40.9%) | 515 (13.0%) |
| Total | 6,473 (100.0%) | 3,951 (100.0%) |
Monthly Housing Cost Tiers in Perrysburg
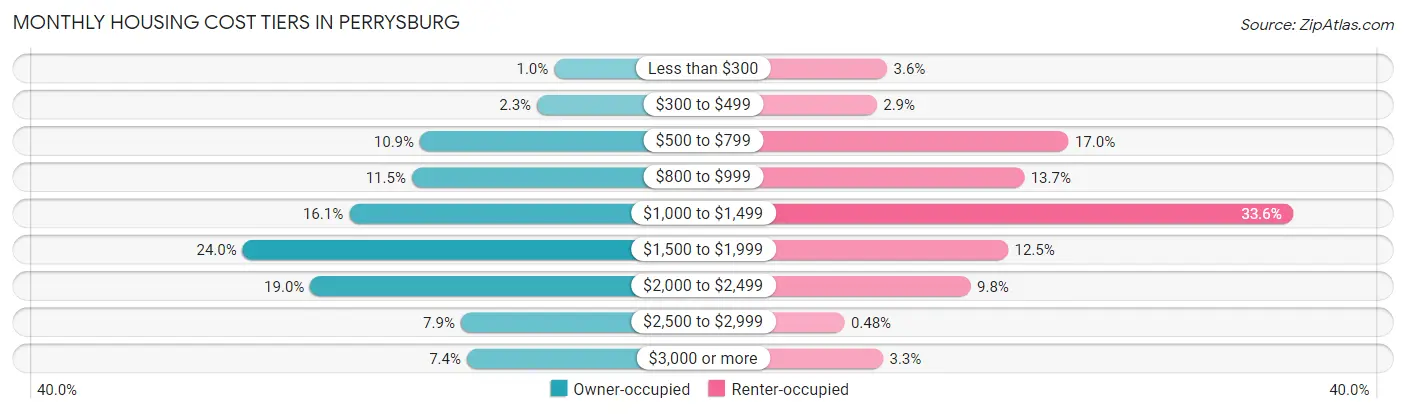
| Monthly Cost | Owner-occupied | Renter-occupied |
| Less than $300 | 65 (1.0%) | 143 (3.6%) |
| $300 to $499 | 147 (2.3%) | 113 (2.9%) |
| $500 to $799 | 705 (10.9%) | 671 (17.0%) |
| $800 to $999 | 744 (11.5%) | 542 (13.7%) |
| $1,000 to $1,499 | 1,043 (16.1%) | 1,327 (33.6%) |
| $1,500 to $1,999 | 1,550 (23.9%) | 495 (12.5%) |
| $2,000 to $2,499 | 1,228 (19.0%) | 386 (9.8%) |
| $2,500 to $2,999 | 510 (7.9%) | 19 (0.5%) |
| $3,000 or more | 481 (7.4%) | 131 (3.3%) |
| Total | 6,473 (100.0%) | 3,951 (100.0%) |
Physical Housing Characteristics in Perrysburg
Housing Structures in Perrysburg
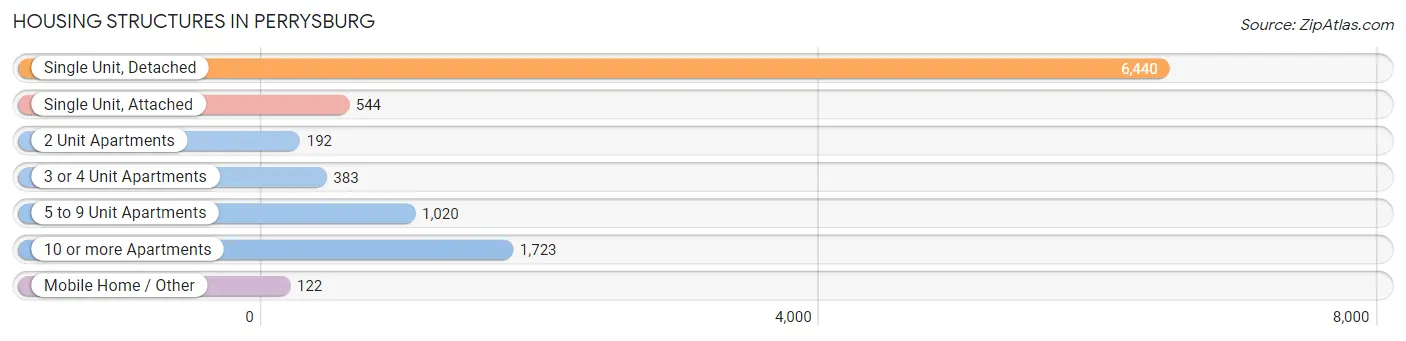
| Structure Type | # Housing Units | % Housing Units |
| Single Unit, Detached | 6,440 | 61.8% |
| Single Unit, Attached | 544 | 5.2% |
| 2 Unit Apartments | 192 | 1.8% |
| 3 or 4 Unit Apartments | 383 | 3.7% |
| 5 to 9 Unit Apartments | 1,020 | 9.8% |
| 10 or more Apartments | 1,723 | 16.5% |
| Mobile Home / Other | 122 | 1.2% |
| Total | 10,424 | 100.0% |
Housing Structures by Occupancy in Perrysburg
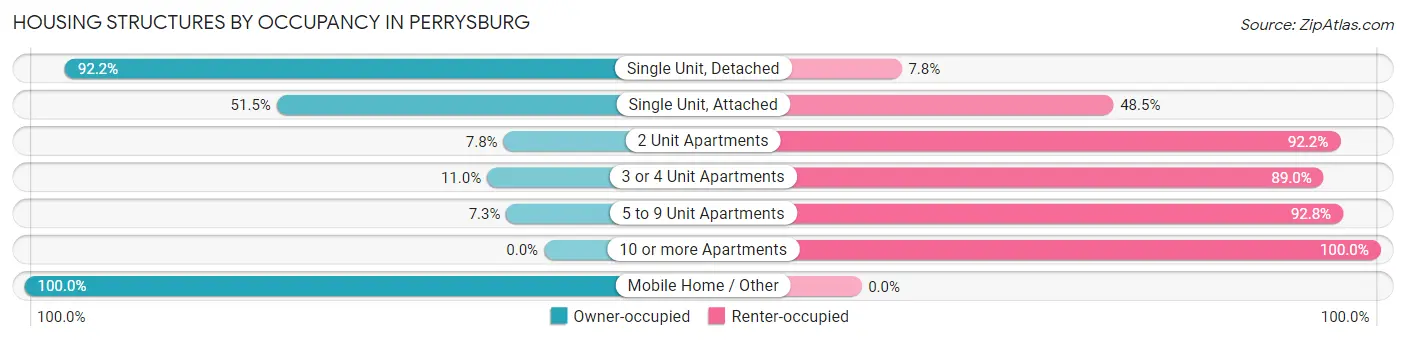
| Structure Type | Owner-occupied | Renter-occupied |
| Single Unit, Detached | 5,940 (92.2%) | 500 (7.8%) |
| Single Unit, Attached | 280 (51.5%) | 264 (48.5%) |
| 2 Unit Apartments | 15 (7.8%) | 177 (92.2%) |
| 3 or 4 Unit Apartments | 42 (11.0%) | 341 (89.0%) |
| 5 to 9 Unit Apartments | 74 (7.2%) | 946 (92.7%) |
| 10 or more Apartments | 0 (0.0%) | 1,723 (100.0%) |
| Mobile Home / Other | 122 (100.0%) | 0 (0.0%) |
| Total | 6,473 (62.1%) | 3,951 (37.9%) |
Housing Structures by Number of Rooms in Perrysburg
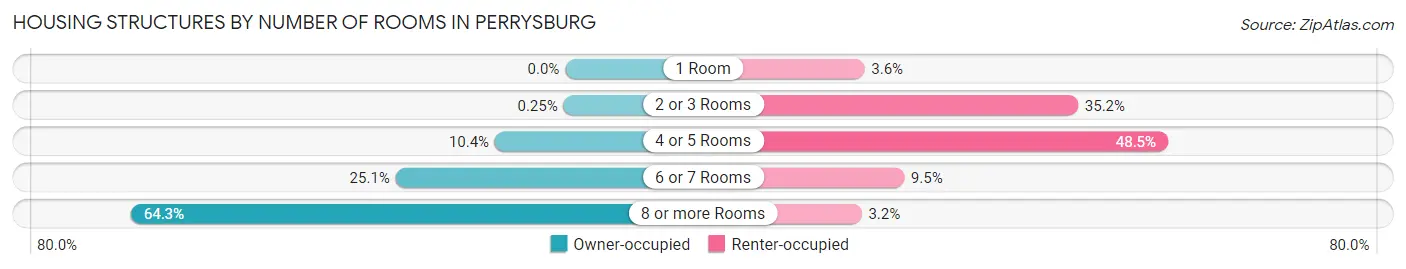
| Number of Rooms | Owner-occupied | Renter-occupied |
| 1 Room | 0 (0.0%) | 143 (3.6%) |
| 2 or 3 Rooms | 16 (0.3%) | 1,391 (35.2%) |
| 4 or 5 Rooms | 673 (10.4%) | 1,917 (48.5%) |
| 6 or 7 Rooms | 1,624 (25.1%) | 374 (9.5%) |
| 8 or more Rooms | 4,160 (64.3%) | 126 (3.2%) |
| Total | 6,473 (100.0%) | 3,951 (100.0%) |
Housing Structure by Heating Type in Perrysburg
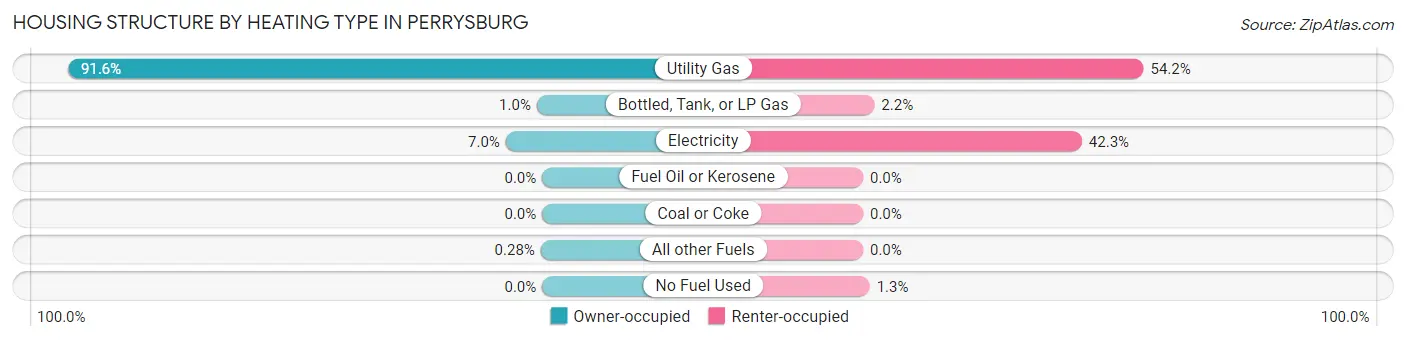
| Heating Type | Owner-occupied | Renter-occupied |
| Utility Gas | 5,932 (91.6%) | 2,142 (54.2%) |
| Bottled, Tank, or LP Gas | 67 (1.0%) | 87 (2.2%) |
| Electricity | 456 (7.0%) | 1,671 (42.3%) |
| Fuel Oil or Kerosene | 0 (0.0%) | 0 (0.0%) |
| Coal or Coke | 0 (0.0%) | 0 (0.0%) |
| All other Fuels | 18 (0.3%) | 0 (0.0%) |
| No Fuel Used | 0 (0.0%) | 51 (1.3%) |
| Total | 6,473 (100.0%) | 3,951 (100.0%) |
Household Vehicle Usage in Perrysburg
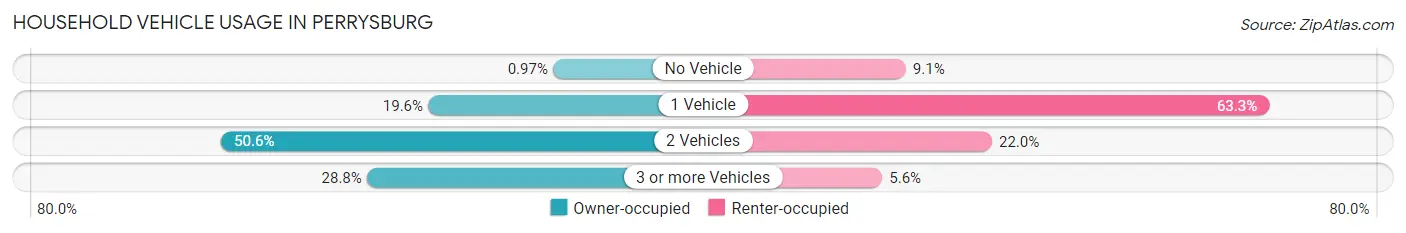
| Vehicles per Household | Owner-occupied | Renter-occupied |
| No Vehicle | 63 (1.0%) | 360 (9.1%) |
| 1 Vehicle | 1,270 (19.6%) | 2,502 (63.3%) |
| 2 Vehicles | 3,278 (50.6%) | 868 (22.0%) |
| 3 or more Vehicles | 1,862 (28.8%) | 221 (5.6%) |
| Total | 6,473 (100.0%) | 3,951 (100.0%) |
Real Estate & Mortgages in Perrysburg
Real Estate and Mortgage Overview in Perrysburg
| Characteristic | Without Mortgage | With Mortgage |
| Housing Units | 1,622 | 4,851 |
| Median Property Value | $276,700 | $272,600 |
| Median Household Income | $107,829 | $2,121 |
| Monthly Housing Costs | $819 | $481 |
| Real Estate Taxes | $4,732 | $21 |
Property Value by Mortgage Status in Perrysburg
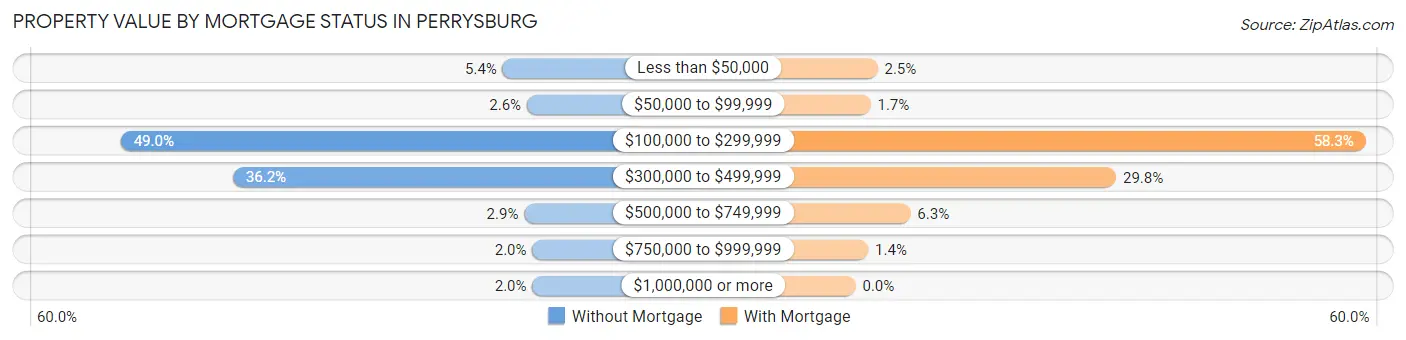
| Property Value | Without Mortgage | With Mortgage |
| Less than $50,000 | 87 (5.4%) | 122 (2.5%) |
| $50,000 to $99,999 | 42 (2.6%) | 83 (1.7%) |
| $100,000 to $299,999 | 795 (49.0%) | 2,828 (58.3%) |
| $300,000 to $499,999 | 587 (36.2%) | 1,444 (29.8%) |
| $500,000 to $749,999 | 47 (2.9%) | 304 (6.3%) |
| $750,000 to $999,999 | 32 (2.0%) | 70 (1.4%) |
| $1,000,000 or more | 32 (2.0%) | 0 (0.0%) |
| Total | 1,622 (100.0%) | 4,851 (100.0%) |
Household Income by Mortgage Status in Perrysburg
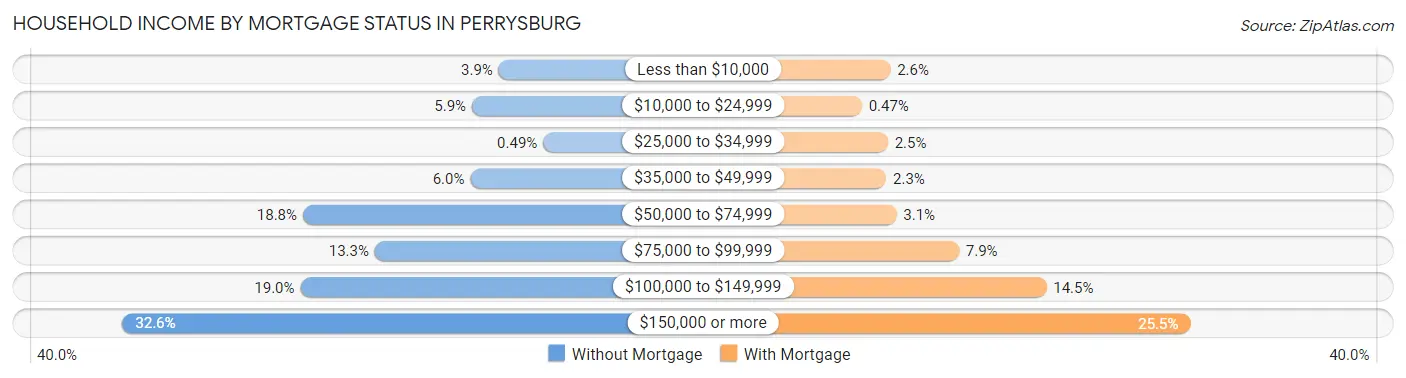
| Household Income | Without Mortgage | With Mortgage |
| Less than $10,000 | 63 (3.9%) | 128 (2.6%) |
| $10,000 to $24,999 | 96 (5.9%) | 23 (0.5%) |
| $25,000 to $34,999 | 8 (0.5%) | 119 (2.5%) |
| $35,000 to $49,999 | 98 (6.0%) | 113 (2.3%) |
| $50,000 to $74,999 | 305 (18.8%) | 151 (3.1%) |
| $75,000 to $99,999 | 216 (13.3%) | 382 (7.9%) |
| $100,000 to $149,999 | 308 (19.0%) | 705 (14.5%) |
| $150,000 or more | 528 (32.6%) | 1,237 (25.5%) |
| Total | 1,622 (100.0%) | 4,851 (100.0%) |
Property Value to Household Income Ratio in Perrysburg
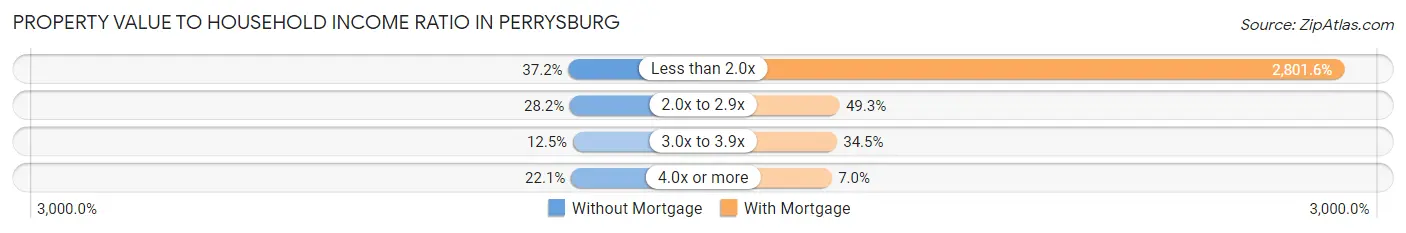
| Value-to-Income Ratio | Without Mortgage | With Mortgage |
| Less than 2.0x | 604 (37.2%) | 135,907 (2,801.6%) |
| 2.0x to 2.9x | 457 (28.2%) | 2,390 (49.3%) |
| 3.0x to 3.9x | 202 (12.4%) | 1,674 (34.5%) |
| 4.0x or more | 359 (22.1%) | 338 (7.0%) |
| Total | 1,622 (100.0%) | 4,851 (100.0%) |
Real Estate Taxes by Mortgage Status in Perrysburg
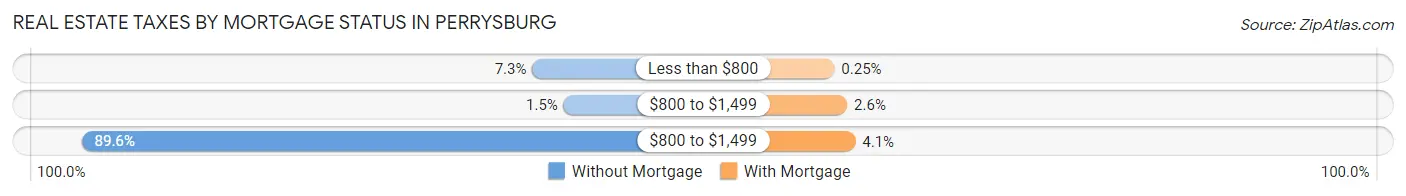
| Property Taxes | Without Mortgage | With Mortgage |
| Less than $800 | 118 (7.3%) | 12 (0.3%) |
| $800 to $1,499 | 25 (1.5%) | 125 (2.6%) |
| $800 to $1,499 | 1,453 (89.6%) | 198 (4.1%) |
| Total | 1,622 (100.0%) | 4,851 (100.0%) |
Health & Disability in Perrysburg
Health Insurance Coverage by Age in Perrysburg
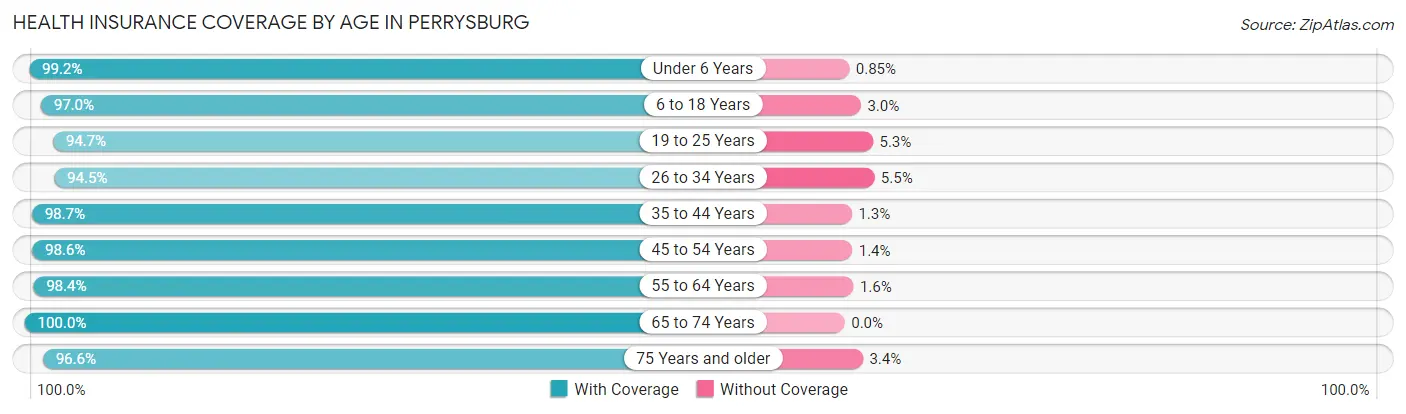
| Age Bracket | With Coverage | Without Coverage |
| Under 6 Years | 1,632 (99.2%) | 14 (0.9%) |
| 6 to 18 Years | 4,815 (97.0%) | 150 (3.0%) |
| 19 to 25 Years | 1,744 (94.7%) | 97 (5.3%) |
| 26 to 34 Years | 2,310 (94.5%) | 135 (5.5%) |
| 35 to 44 Years | 3,828 (98.7%) | 52 (1.3%) |
| 45 to 54 Years | 3,594 (98.6%) | 51 (1.4%) |
| 55 to 64 Years | 2,367 (98.4%) | 39 (1.6%) |
| 65 to 74 Years | 2,375 (100.0%) | 0 (0.0%) |
| 75 Years and older | 1,311 (96.6%) | 46 (3.4%) |
| Total | 23,976 (97.6%) | 584 (2.4%) |
Health Insurance Coverage by Citizenship Status in Perrysburg
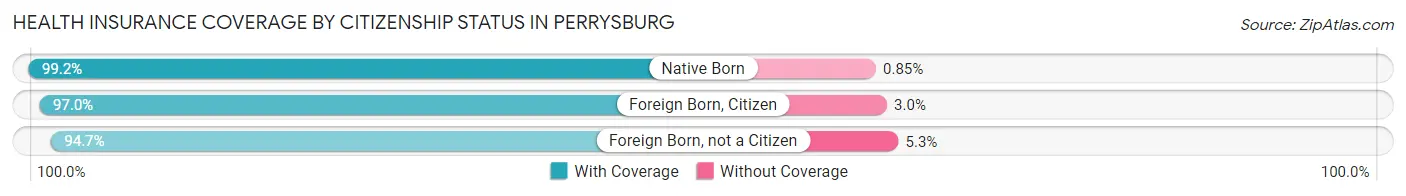
| Citizenship Status | With Coverage | Without Coverage |
| Native Born | 1,632 (99.2%) | 14 (0.9%) |
| Foreign Born, Citizen | 4,815 (97.0%) | 150 (3.0%) |
| Foreign Born, not a Citizen | 1,744 (94.7%) | 97 (5.3%) |
Health Insurance Coverage by Household Income in Perrysburg
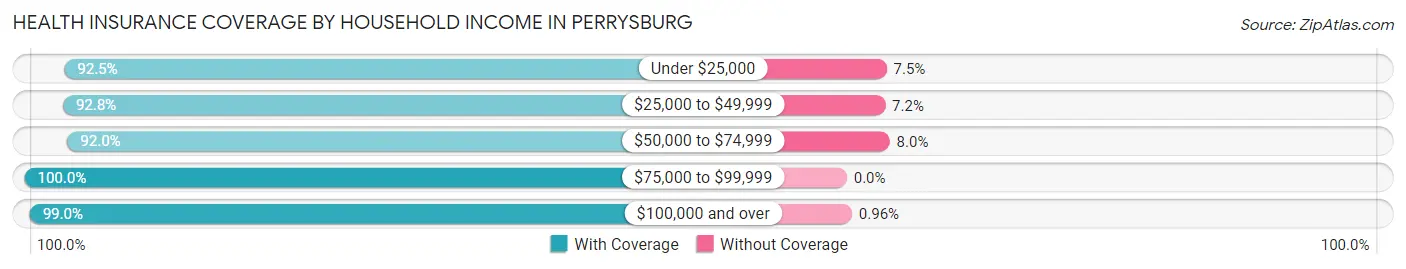
| Household Income | With Coverage | Without Coverage |
| Under $25,000 | 1,129 (92.5%) | 91 (7.5%) |
| $25,000 to $49,999 | 1,871 (92.8%) | 145 (7.2%) |
| $50,000 to $74,999 | 2,268 (92.0%) | 198 (8.0%) |
| $75,000 to $99,999 | 3,491 (100.0%) | 0 (0.0%) |
| $100,000 and over | 15,181 (99.0%) | 147 (1.0%) |
Public vs Private Health Insurance Coverage by Age in Perrysburg
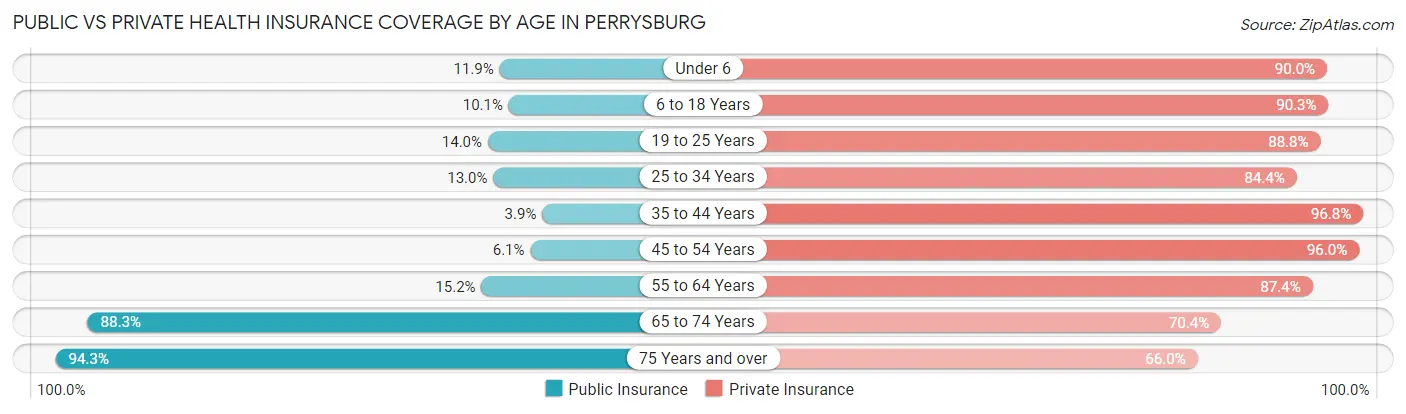
| Age Bracket | Public Insurance | Private Insurance |
| Under 6 | 195 (11.8%) | 1,482 (90.0%) |
| 6 to 18 Years | 503 (10.1%) | 4,484 (90.3%) |
| 19 to 25 Years | 258 (14.0%) | 1,635 (88.8%) |
| 25 to 34 Years | 318 (13.0%) | 2,064 (84.4%) |
| 35 to 44 Years | 152 (3.9%) | 3,754 (96.8%) |
| 45 to 54 Years | 223 (6.1%) | 3,499 (96.0%) |
| 55 to 64 Years | 366 (15.2%) | 2,102 (87.4%) |
| 65 to 74 Years | 2,097 (88.3%) | 1,672 (70.4%) |
| 75 Years and over | 1,279 (94.3%) | 896 (66.0%) |
| Total | 5,391 (22.0%) | 21,588 (87.9%) |
Disability Status by Sex by Age in Perrysburg
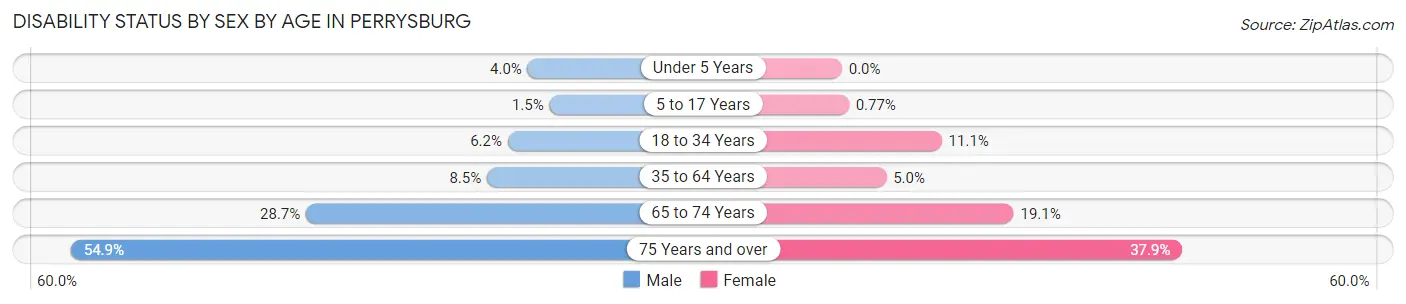
| Age Bracket | Male | Female |
| Under 5 Years | 28 (4.0%) | 0 (0.0%) |
| 5 to 17 Years | 42 (1.5%) | 18 (0.8%) |
| 18 to 34 Years | 136 (6.2%) | 251 (11.1%) |
| 35 to 64 Years | 437 (8.5%) | 237 (5.0%) |
| 65 to 74 Years | 318 (28.6%) | 242 (19.1%) |
| 75 Years and over | 277 (54.8%) | 323 (37.9%) |
Disability Class by Sex by Age in Perrysburg
Disability Class: Hearing Difficulty
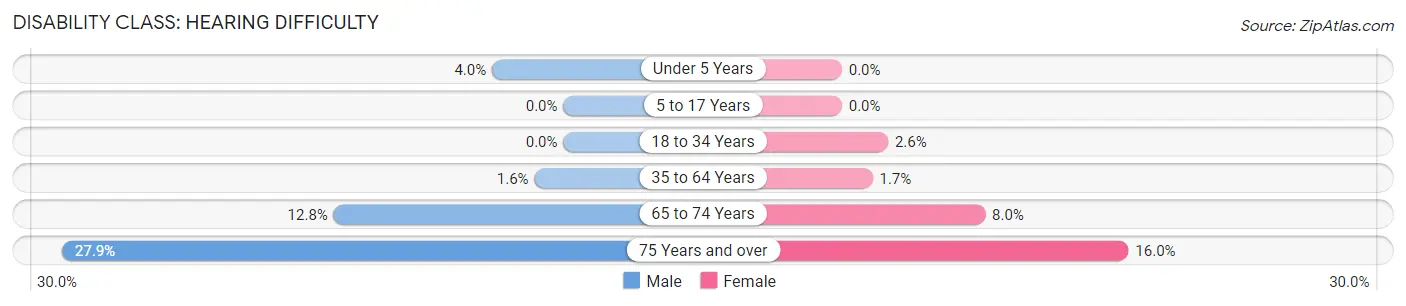
| Age Bracket | Male | Female |
| Under 5 Years | 28 (4.0%) | 0 (0.0%) |
| 5 to 17 Years | 0 (0.0%) | 0 (0.0%) |
| 18 to 34 Years | 0 (0.0%) | 58 (2.6%) |
| 35 to 64 Years | 83 (1.6%) | 82 (1.7%) |
| 65 to 74 Years | 142 (12.8%) | 101 (8.0%) |
| 75 Years and over | 141 (27.9%) | 136 (16.0%) |
Disability Class: Vision Difficulty
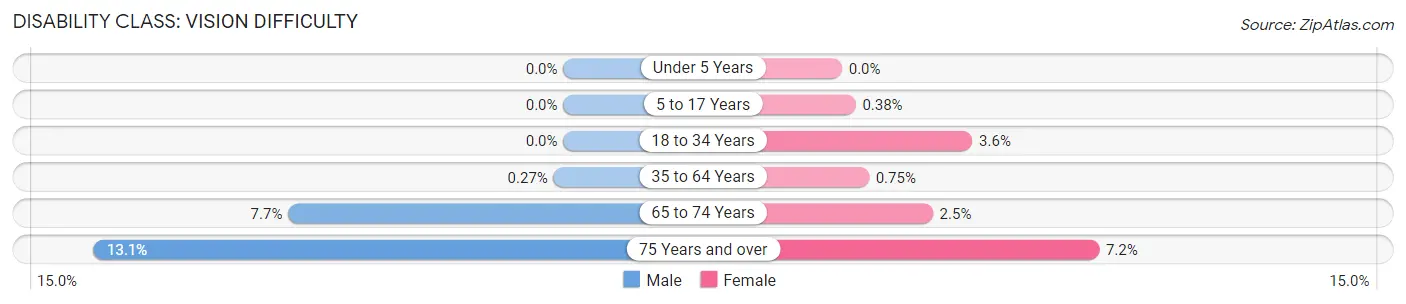
| Age Bracket | Male | Female |
| Under 5 Years | 0 (0.0%) | 0 (0.0%) |
| 5 to 17 Years | 0 (0.0%) | 9 (0.4%) |
| 18 to 34 Years | 0 (0.0%) | 82 (3.6%) |
| 35 to 64 Years | 14 (0.3%) | 36 (0.7%) |
| 65 to 74 Years | 85 (7.7%) | 32 (2.5%) |
| 75 Years and over | 66 (13.1%) | 61 (7.2%) |
Disability Class: Cognitive Difficulty
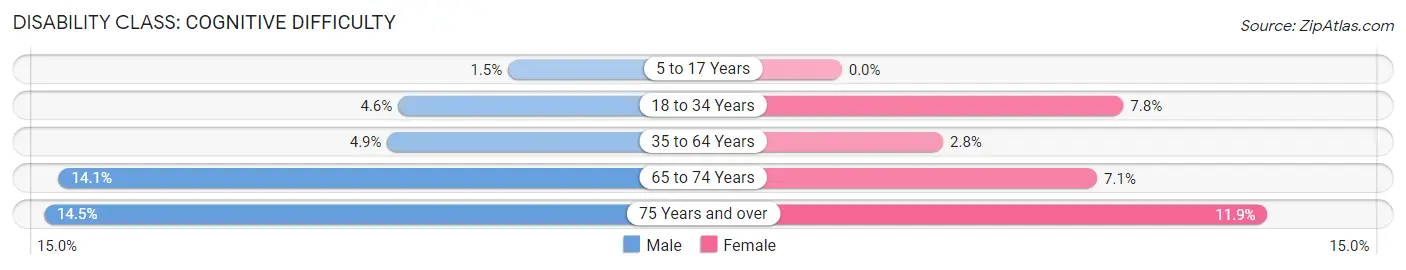
| Age Bracket | Male | Female |
| 5 to 17 Years | 42 (1.5%) | 0 (0.0%) |
| 18 to 34 Years | 101 (4.6%) | 177 (7.8%) |
| 35 to 64 Years | 252 (4.9%) | 135 (2.8%) |
| 65 to 74 Years | 156 (14.1%) | 90 (7.1%) |
| 75 Years and over | 73 (14.5%) | 101 (11.8%) |
Disability Class: Ambulatory Difficulty
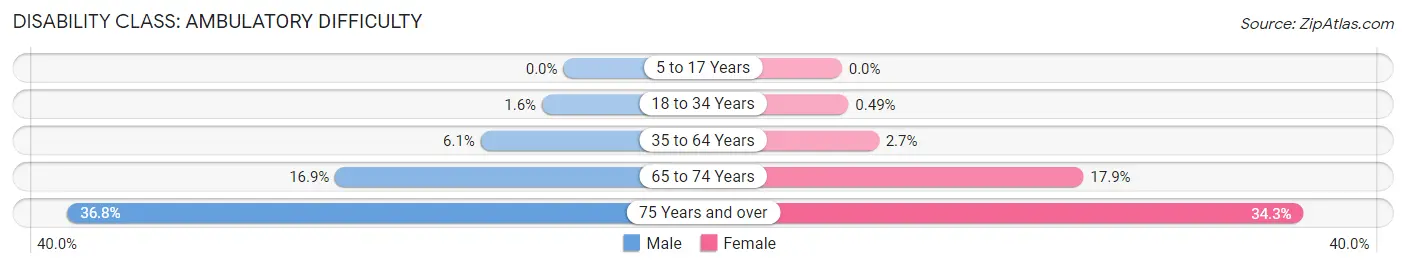
| Age Bracket | Male | Female |
| 5 to 17 Years | 0 (0.0%) | 0 (0.0%) |
| 18 to 34 Years | 35 (1.6%) | 11 (0.5%) |
| 35 to 64 Years | 316 (6.1%) | 131 (2.7%) |
| 65 to 74 Years | 188 (16.9%) | 227 (17.9%) |
| 75 Years and over | 186 (36.8%) | 292 (34.3%) |
Disability Class: Self-Care Difficulty
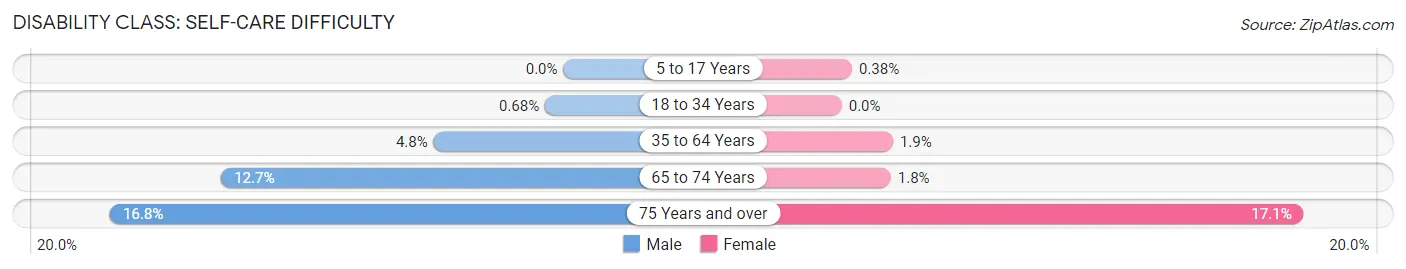
| Age Bracket | Male | Female |
| 5 to 17 Years | 0 (0.0%) | 9 (0.4%) |
| 18 to 34 Years | 15 (0.7%) | 0 (0.0%) |
| 35 to 64 Years | 248 (4.8%) | 91 (1.9%) |
| 65 to 74 Years | 141 (12.7%) | 23 (1.8%) |
| 75 Years and over | 85 (16.8%) | 146 (17.1%) |
Technology Access in Perrysburg
Computing Device Access in Perrysburg
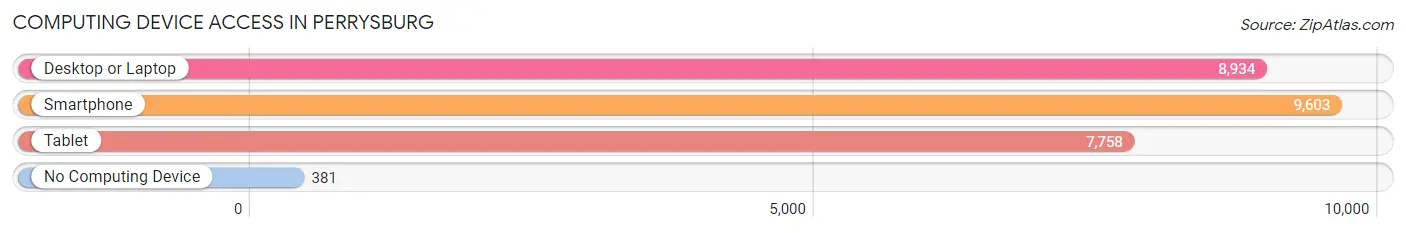
| Device Type | # Households | % Households |
| Desktop or Laptop | 8,934 | 85.7% |
| Smartphone | 9,603 | 92.1% |
| Tablet | 7,758 | 74.4% |
| No Computing Device | 381 | 3.7% |
| Total | 10,424 | 100.0% |
Internet Access in Perrysburg
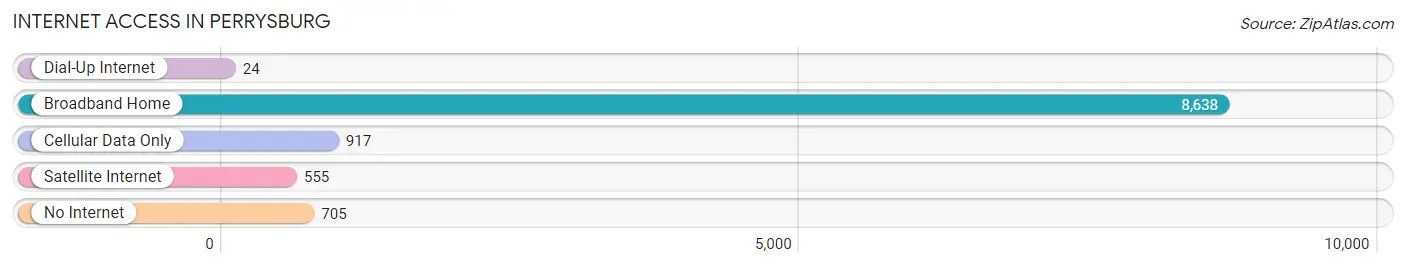
| Internet Type | # Households | % Households |
| Dial-Up Internet | 24 | 0.2% |
| Broadband Home | 8,638 | 82.9% |
| Cellular Data Only | 917 | 8.8% |
| Satellite Internet | 555 | 5.3% |
| No Internet | 705 | 6.8% |
| Total | 10,424 | 100.0% |
Perrysburg Summary
Perrysburg, Ohio is a city located in Wood County, Ohio, United States. It is situated along the Maumee River, approximately 10 miles south of Toledo. The city has a population of 20,623 as of the 2010 census.
History
Perrysburg was founded in 1816 by William Oliver, a Revolutionary War veteran. The city was named after Commodore Oliver Hazard Perry, a hero of the War of 1812. Perrysburg was incorporated as a village in 1838 and as a city in 1941.
Geography
Perrysburg is located at 41°35'25" North, 83°37'17" West (41.590278, -83.621389). According to the United States Census Bureau, the city has a total area of 8.7 square miles, of which 8.6 square miles is land and 0.1 square miles is water.
Economy
Perrysburg is home to several large employers, including ProMedica, Owens Corning, and the University of Toledo Medical Center. The city also has a thriving retail sector, with many restaurants, shops, and other businesses located in the downtown area.
Demographics
As of the 2010 census, there were 20,623 people, 8,093 households, and 5,541 families residing in the city. The population density was 2,387.2 people per square mile. The racial makeup of the city was 87.2% White, 6.3% African American, 0.3% Native American, 2.7% Asian, 0.1% Pacific Islander, 1.2% from other races, and 2.4% from two or more races. Hispanic or Latino of any race were 4.2% of the population.
The median income for a household in the city was $54,945, and the median income for a family was $68,945. The per capita income for the city was $27,945. About 4.2% of families and 6.2% of the population were below the poverty line, including 8.2% of those under age 18 and 4.2% of those age 65 or over.
Conclusion
Perrysburg, Ohio is a city located in Wood County, Ohio, United States. It is situated along the Maumee River, approximately 10 miles south of Toledo. The city has a population of 20,623 as of the 2010 census. Perrysburg was founded in 1816 by William Oliver, a Revolutionary War veteran. The city was named after Commodore Oliver Hazard Perry, a hero of the War of 1812. Perrysburg was incorporated as a village in 1838 and as a city in 1941. The city is home to several large employers, including ProMedica, Owens Corning, and the University of Toledo Medical Center. The racial makeup of the city was 87.2% White, 6.3% African American, 0.3% Native American, 2.7% Asian, 0.1% Pacific Islander, 1.2% from other races, and 2.4% from two or more races. The median income for a household in the city was $54,945, and the median income for a family was $68,945. The per capita income for the city was $27,945. Perrysburg is a vibrant city with a rich history and a diverse population.
Common Questions
What is Per Capita Income in Perrysburg?
Per Capita income in Perrysburg is $58,062.
What is the Median Family Income in Perrysburg?
Median Family Income in Perrysburg is $139,415.
What is the Median Household income in Perrysburg?
Median Household Income in Perrysburg is $98,419.
What is Income or Wage Gap in Perrysburg?
Income or Wage Gap in Perrysburg is 34.1%.
Women in Perrysburg earn 65.9 cents for every dollar earned by a man.
What is Inequality or Gini Index in Perrysburg?
Inequality or Gini Index in Perrysburg is 0.46.
What is the Total Population of Perrysburg?
Total Population of Perrysburg is 24,855.
What is the Total Male Population of Perrysburg?
Total Male Population of Perrysburg is 12,479.
What is the Total Female Population of Perrysburg?
Total Female Population of Perrysburg is 12,376.
What is the Ratio of Males per 100 Females in Perrysburg?
There are 100.83 Males per 100 Females in Perrysburg.
What is the Ratio of Females per 100 Males in Perrysburg?
There are 99.17 Females per 100 Males in Perrysburg.
What is the Median Population Age in Perrysburg?
Median Population Age in Perrysburg is 38.9 Years.
What is the Average Family Size in Perrysburg
Average Family Size in Perrysburg is 3.1 People.
What is the Average Household Size in Perrysburg
Average Household Size in Perrysburg is 2.4 People.
How Large is the Labor Force in Perrysburg?
There are 13,358 People in the Labor Forcein in Perrysburg.
What is the Percentage of People in the Labor Force in Perrysburg?
69.3% of People are in the Labor Force in Perrysburg.
What is the Unemployment Rate in Perrysburg?
Unemployment Rate in Perrysburg is 4.1%.