Shaker Heights, OH Map & Demographics
Shaker Heights Map
Shaker Heights Overview
$69,086
PER CAPITA INCOME
$128,048
AVG FAMILY INCOME
$96,494
AVG HOUSEHOLD INCOME
41.3%
WAGE / INCOME GAP [ % ]
58.7¢/ $1
WAGE / INCOME GAP [ $ ]
$8,637
FAMILY INCOME DEFICIT
0.54
INEQUALITY / GINI INDEX
29,157
TOTAL POPULATION
13,373
MALE POPULATION
15,784
FEMALE POPULATION
84.73
MALES / 100 FEMALES
118.03
FEMALES / 100 MALES
41.1
MEDIAN AGE
3.0
AVG FAMILY SIZE
2.3
AVG HOUSEHOLD SIZE
15,461
LABOR FORCE [ PEOPLE ]
66.2%
PERCENT IN LABOR FORCE
5.1%
UNEMPLOYMENT RATE
Shaker Heights Area Codes
Income in Shaker Heights
Income Overview in Shaker Heights
Per Capita Income in Shaker Heights is $69,086, while median incomes of families and households are $128,048 and $96,494 respectively.
| Characteristic | Number | Measure |
| Per Capita Income | 29,157 | $69,086 |
| Median Family Income | 7,506 | $128,048 |
| Mean Family Income | 7,506 | $200,382 |
| Median Household Income | 12,826 | $96,494 |
| Mean Household Income | 12,826 | $157,024 |
| Income Deficit | 7,506 | $8,637 |
| Wage / Income Gap (%) | 29,157 | 41.32% |
| Wage / Income Gap ($) | 29,157 | 58.68¢ per $1 |
| Gini / Inequality Index | 29,157 | 0.54 |
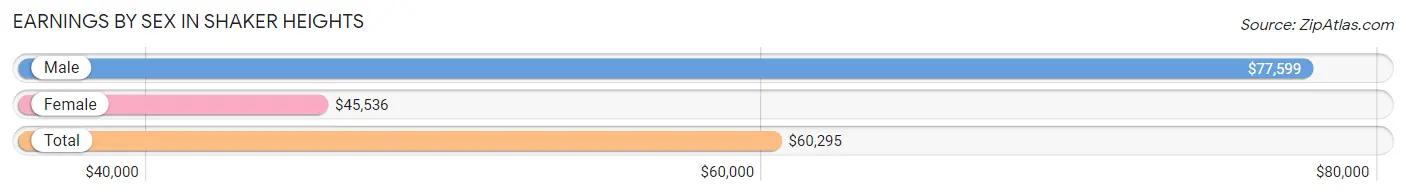
Earnings by Sex in Shaker Heights
Average Earnings in Shaker Heights are $60,295, $77,599 for men and $45,536 for women, a difference of 41.3%.
| Sex | Number | Average Earnings |
| Male | 7,749 (48.8%) | $77,599 |
| Female | 8,144 (51.2%) | $45,536 |
| Total | 15,893 (100.0%) | $60,295 |
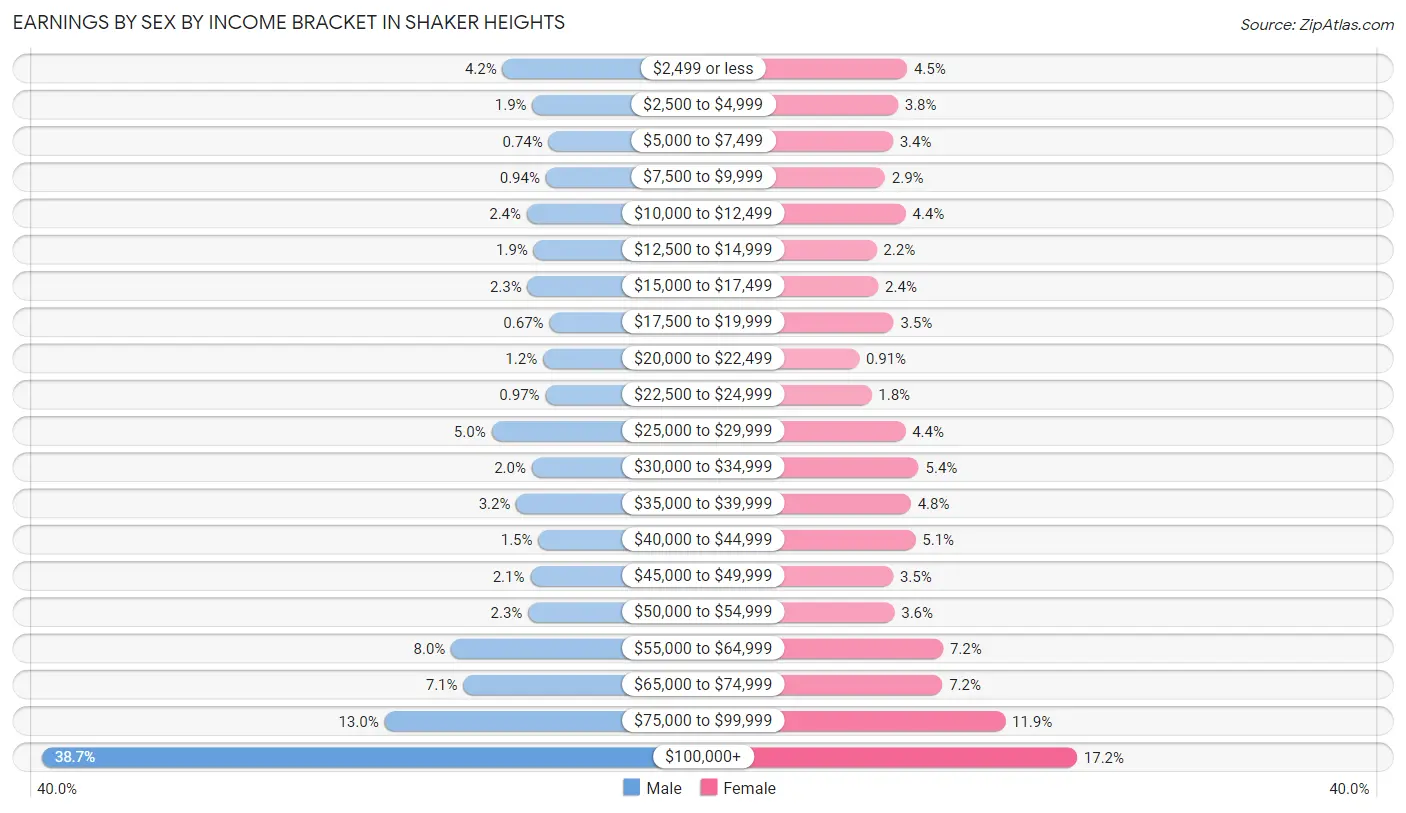
Earnings by Sex by Income Bracket in Shaker Heights
The most common earnings brackets in Shaker Heights are $100,000+ for men (3,000 | 38.7%) and $100,000+ for women (1,404 | 17.2%).
| Income | Male | Female |
| $2,499 or less | 324 (4.2%) | 367 (4.5%) |
| $2,500 to $4,999 | 150 (1.9%) | 311 (3.8%) |
| $5,000 to $7,499 | 57 (0.7%) | 280 (3.4%) |
| $7,500 to $9,999 | 73 (0.9%) | 232 (2.9%) |
| $10,000 to $12,499 | 183 (2.4%) | 358 (4.4%) |
| $12,500 to $14,999 | 143 (1.8%) | 181 (2.2%) |
| $15,000 to $17,499 | 179 (2.3%) | 191 (2.4%) |
| $17,500 to $19,999 | 52 (0.7%) | 285 (3.5%) |
| $20,000 to $22,499 | 89 (1.1%) | 74 (0.9%) |
| $22,500 to $24,999 | 75 (1.0%) | 150 (1.8%) |
| $25,000 to $29,999 | 388 (5.0%) | 357 (4.4%) |
| $30,000 to $34,999 | 154 (2.0%) | 438 (5.4%) |
| $35,000 to $39,999 | 244 (3.2%) | 390 (4.8%) |
| $40,000 to $44,999 | 116 (1.5%) | 419 (5.1%) |
| $45,000 to $49,999 | 163 (2.1%) | 282 (3.5%) |
| $50,000 to $54,999 | 175 (2.3%) | 290 (3.6%) |
| $55,000 to $64,999 | 622 (8.0%) | 587 (7.2%) |
| $65,000 to $74,999 | 552 (7.1%) | 582 (7.1%) |
| $75,000 to $99,999 | 1,010 (13.0%) | 966 (11.9%) |
| $100,000+ | 3,000 (38.7%) | 1,404 (17.2%) |
| Total | 7,749 (100.0%) | 8,144 (100.0%) |
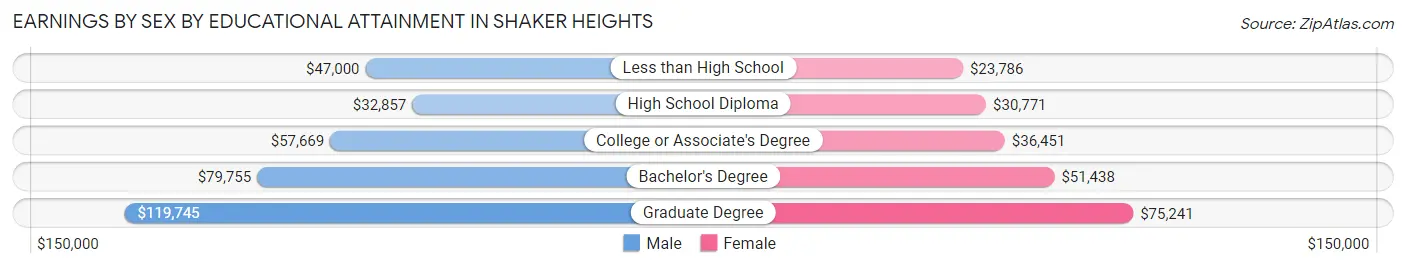
Earnings by Sex by Educational Attainment in Shaker Heights
Average earnings in Shaker Heights are $86,615 for men and $55,777 for women, a difference of 35.6%. Men with an educational attainment of graduate degree enjoy the highest average annual earnings of $119,745, while those with high school diploma education earn the least with $32,857. Women with an educational attainment of graduate degree earn the most with the average annual earnings of $75,241, while those with less than high school education have the smallest earnings of $23,786.
| Educational Attainment | Male Income | Female Income |
| Less than High School | $47,000 | $23,786 |
| High School Diploma | $32,857 | $30,771 |
| College or Associate's Degree | $57,669 | $36,451 |
| Bachelor's Degree | $79,755 | $51,438 |
| Graduate Degree | $119,745 | $75,241 |
| Total | $86,615 | $55,777 |
Family Income in Shaker Heights
Family Income Brackets in Shaker Heights
According to the Shaker Heights family income data, there are 2,387 families falling into the $200,000+ income range, which is the most common income bracket and makes up 31.8% of all families. Conversely, the less than $10,000 income bracket is the least frequent group with only 113 families (1.5%) belonging to this category.
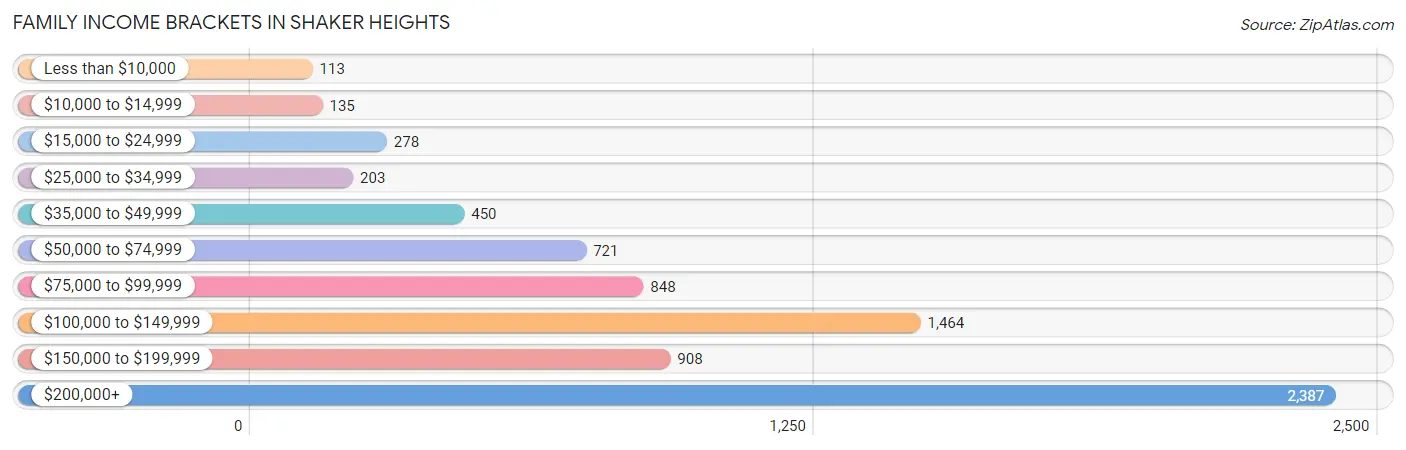
| Income Bracket | # Families | % Families |
| Less than $10,000 | 113 | 1.5% |
| $10,000 to $14,999 | 135 | 1.8% |
| $15,000 to $24,999 | 278 | 3.7% |
| $25,000 to $34,999 | 203 | 2.7% |
| $35,000 to $49,999 | 450 | 6.0% |
| $50,000 to $74,999 | 721 | 9.6% |
| $75,000 to $99,999 | 848 | 11.3% |
| $100,000 to $149,999 | 1,464 | 19.5% |
| $150,000 to $199,999 | 908 | 12.1% |
| $200,000+ | 2,387 | 31.8% |
Family Income by Famaliy Size in Shaker Heights
5-person families (597 | 8.0%) account for the highest median family income in Shaker Heights with $181,125 per family, while 2-person families (3,678 | 49.0%) have the highest median income of $52,120 per family member.
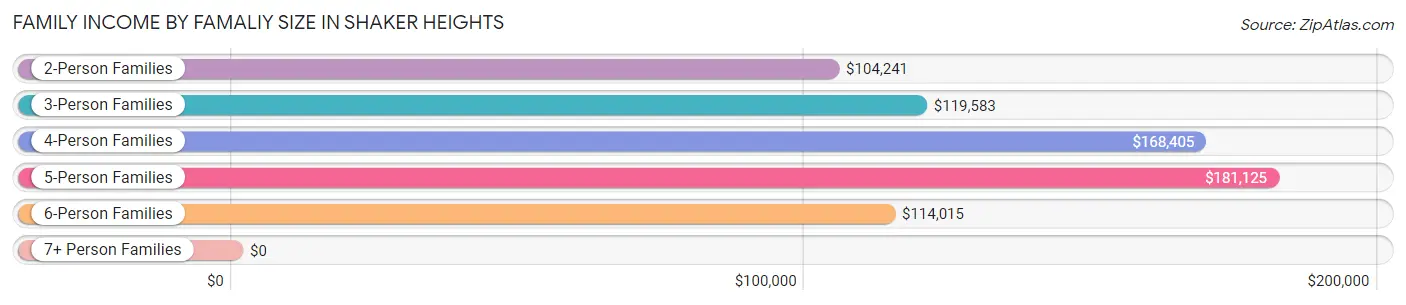
| Income Bracket | # Families | Median Income |
| 2-Person Families | 3,678 (49.0%) | $104,241 |
| 3-Person Families | 1,595 (21.2%) | $119,583 |
| 4-Person Families | 1,517 (20.2%) | $168,405 |
| 5-Person Families | 597 (8.0%) | $181,125 |
| 6-Person Families | 100 (1.3%) | $114,015 |
| 7+ Person Families | 19 (0.3%) | $0 |
| Total | 7,506 (100.0%) | $128,048 |
Family Income by Number of Earners in Shaker Heights
The median family income in Shaker Heights is $128,048, with families comprising 3+ earners (549) having the highest median family income of $201,780, while families with 1 earner (2,359) have the lowest median family income of $88,368, accounting for 7.3% and 31.4% of families, respectively.
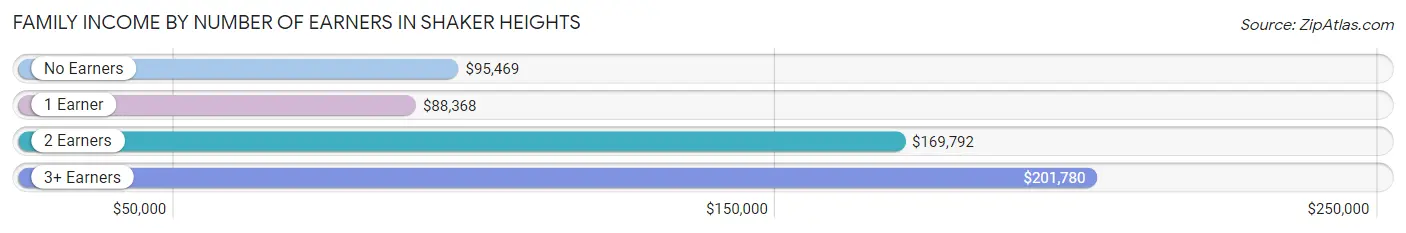
| Number of Earners | # Families | Median Income |
| No Earners | 988 (13.2%) | $95,469 |
| 1 Earner | 2,359 (31.4%) | $88,368 |
| 2 Earners | 3,610 (48.1%) | $169,792 |
| 3+ Earners | 549 (7.3%) | $201,780 |
| Total | 7,506 (100.0%) | $128,048 |
Household Income in Shaker Heights
Household Income Brackets in Shaker Heights
With 2,937 households falling in the category, the $200,000+ income range is the most frequent in Shaker Heights, accounting for 22.9% of all households. In contrast, only 295 households (2.3%) fall into the $10,000 to $14,999 income bracket, making it the least populous group.
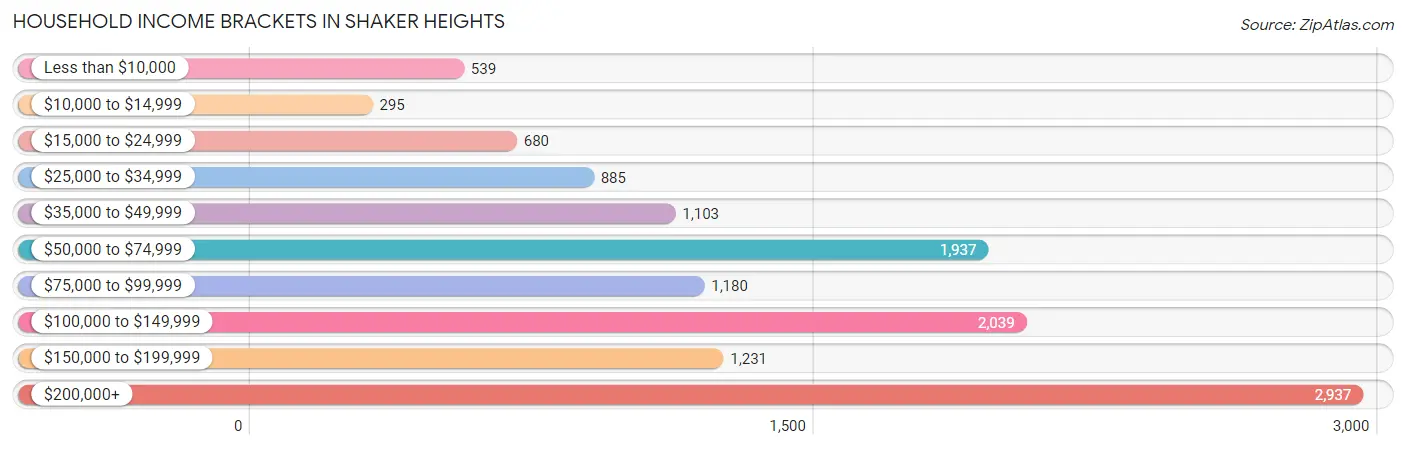
| Income Bracket | # Households | % Households |
| Less than $10,000 | 539 | 4.2% |
| $10,000 to $14,999 | 295 | 2.3% |
| $15,000 to $24,999 | 680 | 5.3% |
| $25,000 to $34,999 | 885 | 6.9% |
| $35,000 to $49,999 | 1,103 | 8.6% |
| $50,000 to $74,999 | 1,937 | 15.1% |
| $75,000 to $99,999 | 1,180 | 9.2% |
| $100,000 to $149,999 | 2,039 | 15.9% |
| $150,000 to $199,999 | 1,231 | 9.6% |
| $200,000+ | 2,937 | 22.9% |
Household Income by Householder Age in Shaker Heights
The median household income in Shaker Heights is $96,494, with the highest median household income of $130,000 found in the 45 to 64 years age bracket for the primary householder. A total of 4,238 households (33.0%) fall into this category. Meanwhile, the 15 to 24 years age bracket for the primary householder has the lowest median household income of $50,389, with 379 households (2.9%) in this group.
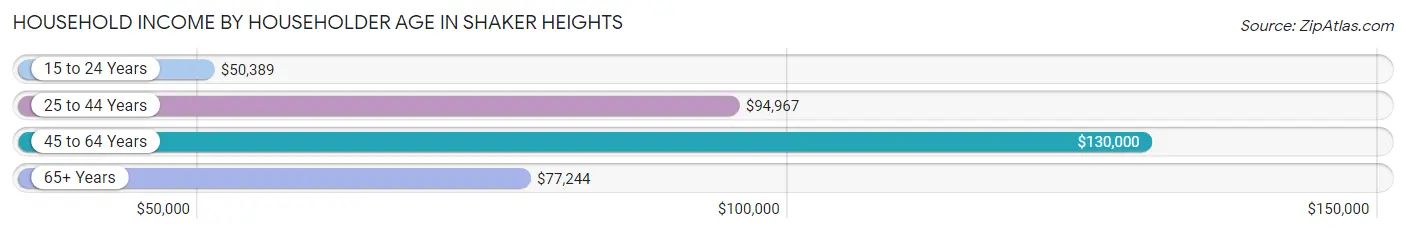
| Income Bracket | # Households | Median Income |
| 15 to 24 Years | 379 (2.9%) | $50,389 |
| 25 to 44 Years | 3,883 (30.3%) | $94,967 |
| 45 to 64 Years | 4,238 (33.0%) | $130,000 |
| 65+ Years | 4,326 (33.7%) | $77,244 |
| Total | 12,826 (100.0%) | $96,494 |
Poverty in Shaker Heights
Income Below Poverty by Sex and Age in Shaker Heights
With 6.9% poverty level for males and 9.6% for females among the residents of Shaker Heights, 15 year old males and 15 year old females are the most vulnerable to poverty, with 31 males (16.4%) and 56 females (24.1%) in their respective age groups living below the poverty level.
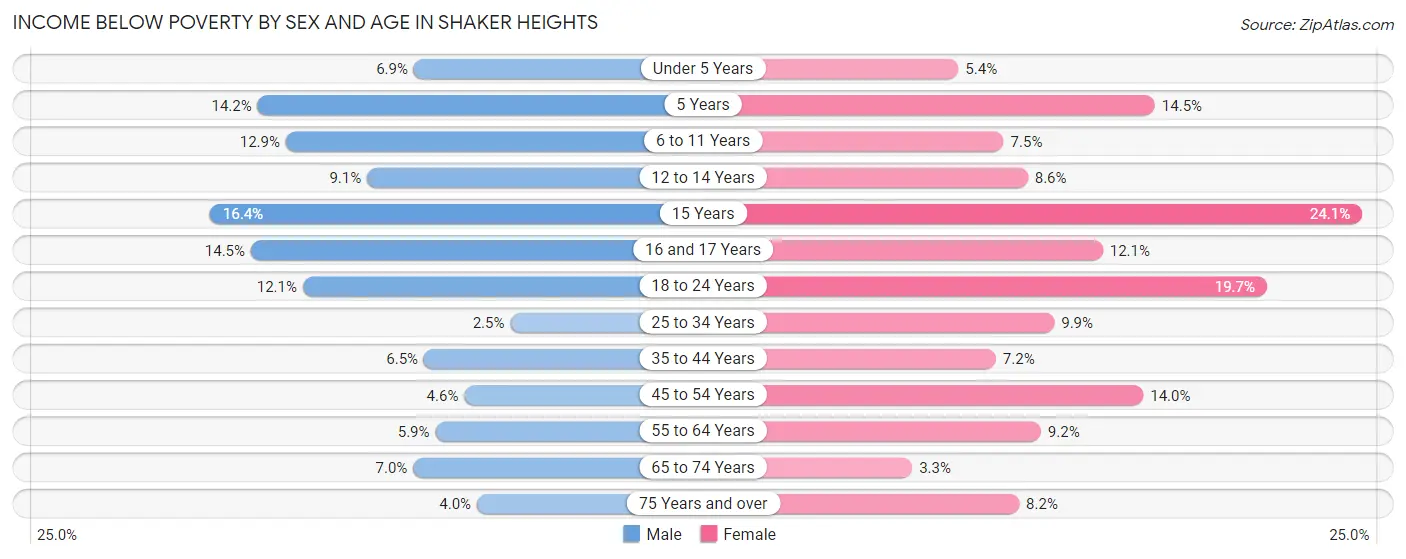
| Age Bracket | Male | Female |
| Under 5 Years | 71 (6.9%) | 44 (5.4%) |
| 5 Years | 21 (14.2%) | 26 (14.5%) |
| 6 to 11 Years | 126 (12.9%) | 74 (7.5%) |
| 12 to 14 Years | 44 (9.1%) | 63 (8.6%) |
| 15 Years | 31 (16.4%) | 56 (24.1%) |
| 16 and 17 Years | 59 (14.5%) | 47 (12.1%) |
| 18 to 24 Years | 99 (12.1%) | 254 (19.7%) |
| 25 to 34 Years | 42 (2.5%) | 149 (9.9%) |
| 35 to 44 Years | 108 (6.5%) | 162 (7.1%) |
| 45 to 54 Years | 87 (4.6%) | 262 (14.0%) |
| 55 to 64 Years | 84 (5.9%) | 166 (9.2%) |
| 65 to 74 Years | 105 (7.0%) | 59 (3.3%) |
| 75 Years and over | 43 (4.0%) | 151 (8.2%) |
| Total | 920 (6.9%) | 1,513 (9.6%) |
Income Above Poverty by Sex and Age in Shaker Heights
According to the poverty statistics in Shaker Heights, males aged 25 to 34 years and females aged 65 to 74 years are the age groups that are most secure financially, with 97.5% of males and 96.7% of females in these age groups living above the poverty line.
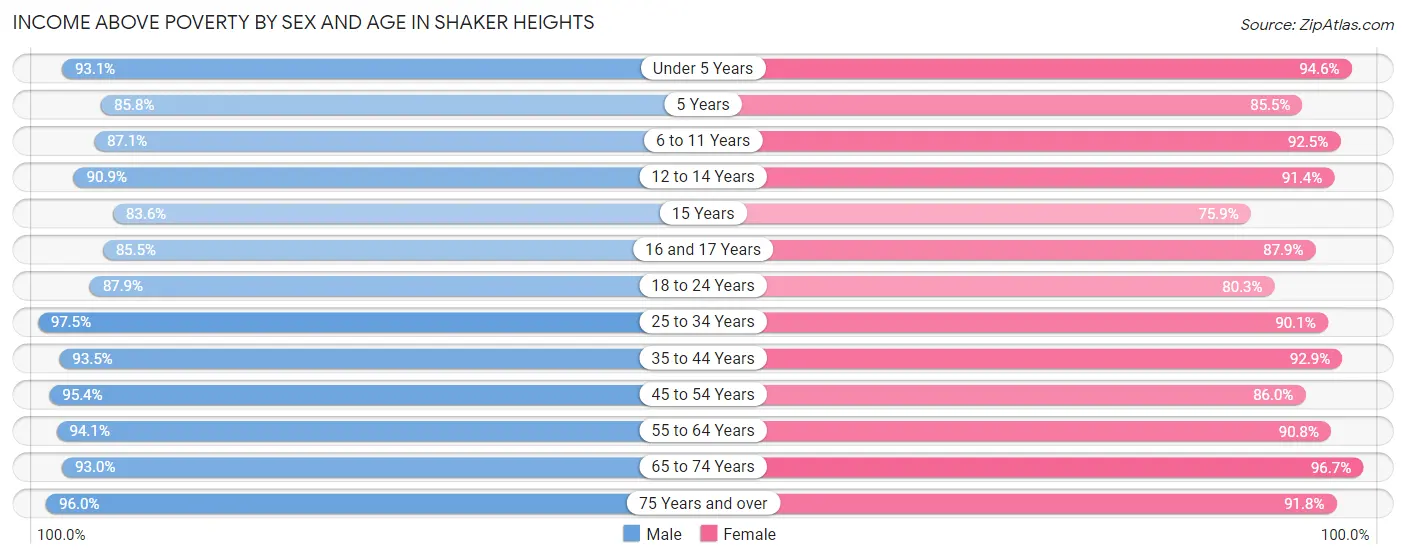
| Age Bracket | Male | Female |
| Under 5 Years | 952 (93.1%) | 770 (94.6%) |
| 5 Years | 127 (85.8%) | 153 (85.5%) |
| 6 to 11 Years | 852 (87.1%) | 912 (92.5%) |
| 12 to 14 Years | 439 (90.9%) | 667 (91.4%) |
| 15 Years | 158 (83.6%) | 176 (75.9%) |
| 16 and 17 Years | 348 (85.5%) | 341 (87.9%) |
| 18 to 24 Years | 720 (87.9%) | 1,034 (80.3%) |
| 25 to 34 Years | 1,665 (97.5%) | 1,362 (90.1%) |
| 35 to 44 Years | 1,562 (93.5%) | 2,103 (92.8%) |
| 45 to 54 Years | 1,806 (95.4%) | 1,611 (86.0%) |
| 55 to 64 Years | 1,330 (94.1%) | 1,631 (90.8%) |
| 65 to 74 Years | 1,402 (93.0%) | 1,743 (96.7%) |
| 75 Years and over | 1,028 (96.0%) | 1,683 (91.8%) |
| Total | 12,389 (93.1%) | 14,186 (90.4%) |
Income Below Poverty Among Married-Couple Families in Shaker Heights
The poverty statistics for married-couple families in Shaker Heights show that 3.2% or 174 of the total 5,442 families live below the poverty line. Families with 3 or 4 children have the highest poverty rate of 10.2%, comprising of 51 families. On the other hand, families with 1 or 2 children have the lowest poverty rate of 0.7%, which includes 13 families.
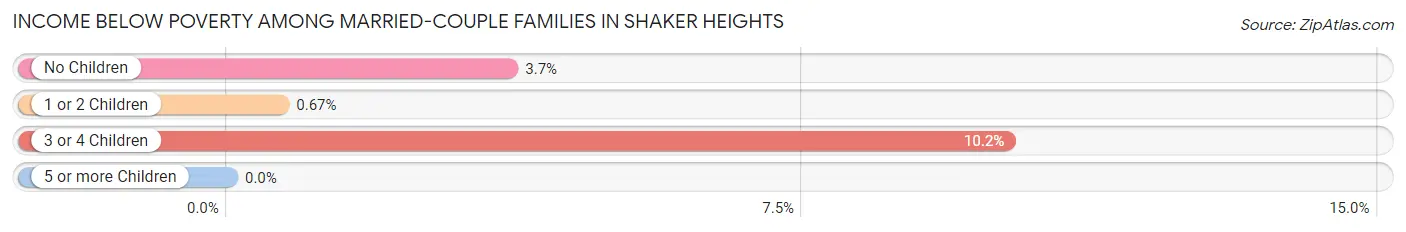
| Children | Above Poverty | Below Poverty |
| No Children | 2,899 (96.3%) | 110 (3.7%) |
| 1 or 2 Children | 1,918 (99.3%) | 13 (0.7%) |
| 3 or 4 Children | 451 (89.8%) | 51 (10.2%) |
| 5 or more Children | 0 (0.0%) | 0 (0.0%) |
| Total | 5,268 (96.8%) | 174 (3.2%) |
Income Below Poverty Among Single-Parent Households in Shaker Heights
According to the poverty data in Shaker Heights, 6.3% or 28 single-father households and 16.0% or 260 single-mother households are living below the poverty line. Among single-father households, those with 3 or 4 children have the highest poverty rate, with 3 households (100.0%) experiencing poverty. Likewise, among single-mother households, those with 3 or 4 children have the highest poverty rate, with 38 households (31.1%) falling below the poverty line.
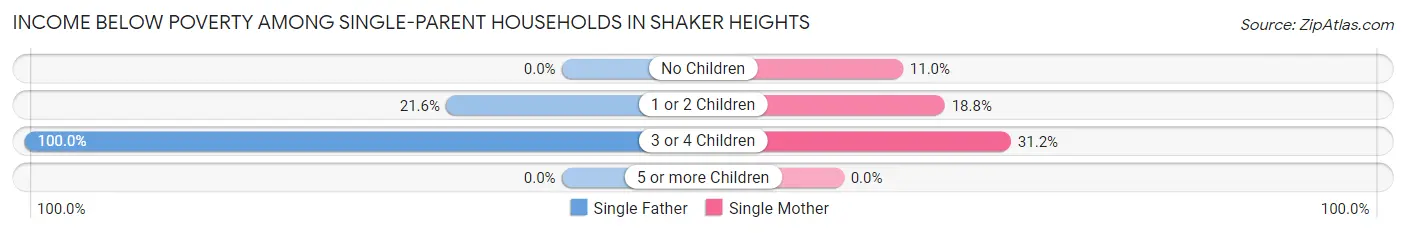
| Children | Single Father | Single Mother |
| No Children | 0 (0.0%) | 85 (11.0%) |
| 1 or 2 Children | 25 (21.5%) | 137 (18.8%) |
| 3 or 4 Children | 3 (100.0%) | 38 (31.1%) |
| 5 or more Children | 0 (0.0%) | 0 (0.0%) |
| Total | 28 (6.3%) | 260 (16.0%) |
Income Below Poverty Among Married-Couple vs Single-Parent Households in Shaker Heights
The poverty data for Shaker Heights shows that 174 of the married-couple family households (3.2%) and 288 of the single-parent households (14.0%) are living below the poverty level. Within the married-couple family households, those with 3 or 4 children have the highest poverty rate, with 51 households (10.2%) falling below the poverty line. Among the single-parent households, those with 3 or 4 children have the highest poverty rate, with 41 household (32.8%) living below poverty.
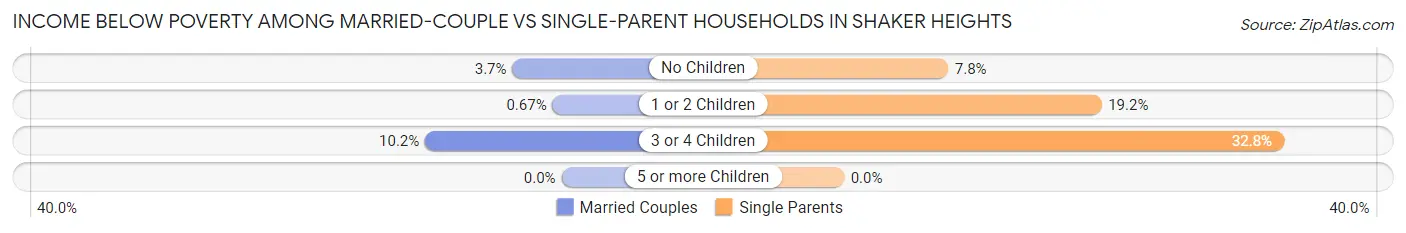
| Children | Married-Couple Families | Single-Parent Households |
| No Children | 110 (3.7%) | 85 (7.8%) |
| 1 or 2 Children | 13 (0.7%) | 162 (19.2%) |
| 3 or 4 Children | 51 (10.2%) | 41 (32.8%) |
| 5 or more Children | 0 (0.0%) | 0 (0.0%) |
| Total | 174 (3.2%) | 288 (14.0%) |
Race in Shaker Heights
The most populous races in Shaker Heights are White / Caucasian (15,821 | 54.3%), Black / African American (10,379 | 35.6%), and Two or more Races (1,369 | 4.7%).
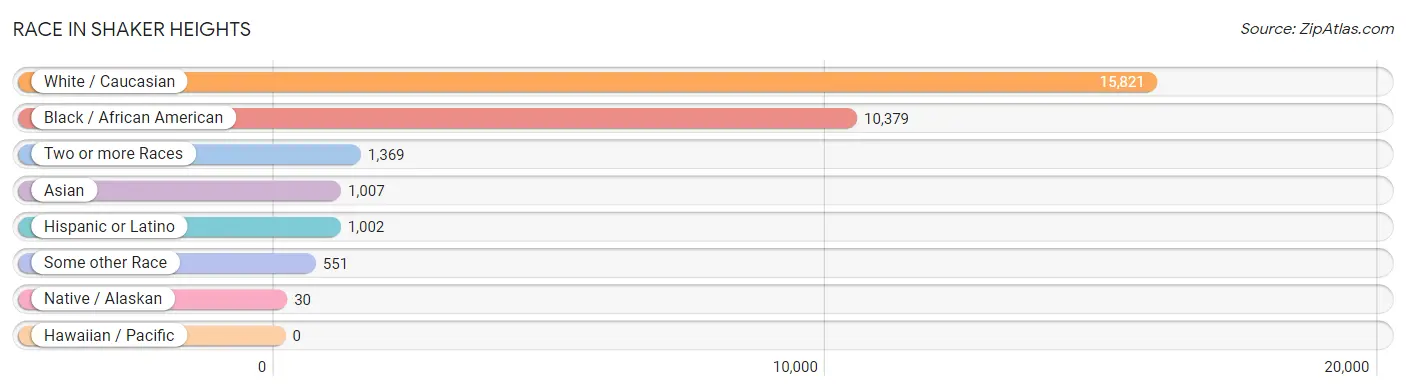
| Race | # Population | % Population |
| Asian | 1,007 | 3.5% |
| Black / African American | 10,379 | 35.6% |
| Hawaiian / Pacific | 0 | 0.0% |
| Hispanic or Latino | 1,002 | 3.4% |
| Native / Alaskan | 30 | 0.1% |
| White / Caucasian | 15,821 | 54.3% |
| Two or more Races | 1,369 | 4.7% |
| Some other Race | 551 | 1.9% |
| Total | 29,157 | 100.0% |
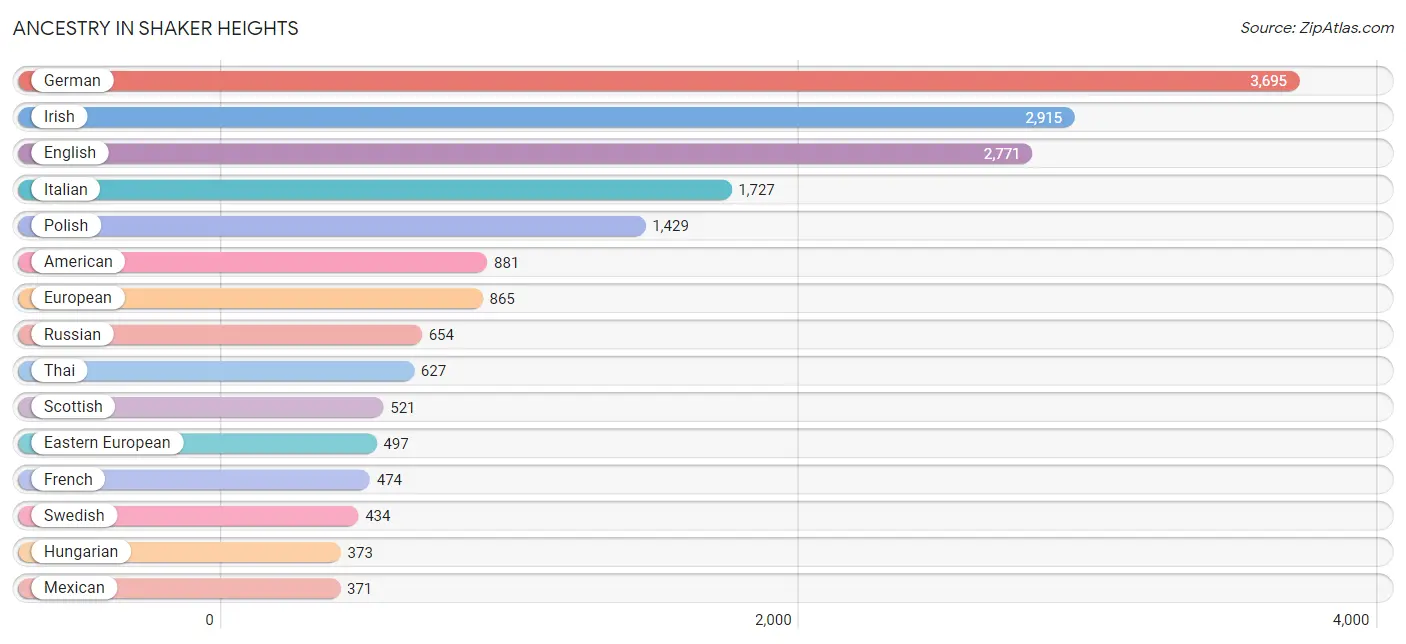
Ancestry in Shaker Heights
The most populous ancestries reported in Shaker Heights are German (3,695 | 12.7%), Irish (2,915 | 10.0%), English (2,771 | 9.5%), Italian (1,727 | 5.9%), and Polish (1,429 | 4.9%), together accounting for 43.0% of all Shaker Heights residents.
| Ancestry | # Population | % Population |
| African | 214 | 0.7% |
| Albanian | 37 | 0.1% |
| American | 881 | 3.0% |
| Arab | 252 | 0.9% |
| Argentinean | 15 | 0.1% |
| Armenian | 10 | 0.0% |
| Austrian | 146 | 0.5% |
| Bahamian | 6 | 0.0% |
| Belgian | 25 | 0.1% |
| Belizean | 17 | 0.1% |
| Bhutanese | 159 | 0.5% |
| Blackfeet | 21 | 0.1% |
| Bolivian | 9 | 0.0% |
| British | 171 | 0.6% |
| Bulgarian | 45 | 0.2% |
| Burmese | 110 | 0.4% |
| Cajun | 6 | 0.0% |
| Canadian | 76 | 0.3% |
| Cape Verdean | 31 | 0.1% |
| Carpatho Rusyn | 21 | 0.1% |
| Central American | 80 | 0.3% |
| Central American Indian | 7 | 0.0% |
| Cherokee | 94 | 0.3% |
| Chickasaw | 15 | 0.1% |
| Chilean | 141 | 0.5% |
| Choctaw | 33 | 0.1% |
| Colombian | 8 | 0.0% |
| Croatian | 110 | 0.4% |
| Cuban | 7 | 0.0% |
| Czech | 219 | 0.7% |
| Czechoslovakian | 27 | 0.1% |
| Danish | 122 | 0.4% |
| Dominican | 37 | 0.1% |
| Dutch | 246 | 0.8% |
| Eastern European | 497 | 1.7% |
| Ecuadorian | 100 | 0.3% |
| Egyptian | 9 | 0.0% |
| English | 2,771 | 9.5% |
| Estonian | 15 | 0.1% |
| European | 865 | 3.0% |
| Filipino | 3 | 0.0% |
| Finnish | 34 | 0.1% |
| French | 474 | 1.6% |
| French Canadian | 167 | 0.6% |
| German | 3,695 | 12.7% |
| Greek | 126 | 0.4% |
| Guatemalan | 10 | 0.0% |
| Guyanese | 50 | 0.2% |
| Haitian | 10 | 0.0% |
| Hungarian | 373 | 1.3% |
| Indian (Asian) | 360 | 1.2% |
| Indonesian | 27 | 0.1% |
| Iranian | 57 | 0.2% |
| Iraqi | 13 | 0.0% |
| Irish | 2,915 | 10.0% |
| Israeli | 21 | 0.1% |
| Italian | 1,727 | 5.9% |
| Jamaican | 74 | 0.3% |
| Korean | 100 | 0.3% |
| Lebanese | 57 | 0.2% |
| Liberian | 46 | 0.2% |
| Lithuanian | 153 | 0.5% |
| Lumbee | 70 | 0.2% |
| Luxembourger | 5 | 0.0% |
| Macedonian | 6 | 0.0% |
| Mexican | 371 | 1.3% |
| Moroccan | 20 | 0.1% |
| New Zealander | 27 | 0.1% |
| Nigerian | 75 | 0.3% |
| Northern European | 110 | 0.4% |
| Norwegian | 72 | 0.3% |
| Pakistani | 52 | 0.2% |
| Pennsylvania German | 16 | 0.1% |
| Peruvian | 9 | 0.0% |
| Polish | 1,429 | 4.9% |
| Portuguese | 52 | 0.2% |
| Potawatomi | 7 | 0.0% |
| Puerto Rican | 64 | 0.2% |
| Romanian | 224 | 0.8% |
| Russian | 654 | 2.2% |
| Salvadoran | 70 | 0.2% |
| Samoan | 7 | 0.0% |
| Scandinavian | 4 | 0.0% |
| Scotch-Irish | 184 | 0.6% |
| Scottish | 521 | 1.8% |
| Seminole | 60 | 0.2% |
| Serbian | 47 | 0.2% |
| Sioux | 5 | 0.0% |
| Slavic | 4 | 0.0% |
| Slovak | 176 | 0.6% |
| Slovene | 133 | 0.5% |
| South African | 6 | 0.0% |
| South American | 282 | 1.0% |
| South American Indian | 27 | 0.1% |
| Spaniard | 16 | 0.1% |
| Spanish | 32 | 0.1% |
| Subsaharan African | 364 | 1.3% |
| Swedish | 434 | 1.5% |
| Swiss | 57 | 0.2% |
| Taiwanese | 22 | 0.1% |
| Thai | 627 | 2.1% |
| Trinidadian and Tobagonian | 50 | 0.2% |
| Ukrainian | 103 | 0.4% |
| Welsh | 171 | 0.6% |
| West Indian | 5 | 0.0% | View All 105 Rows |
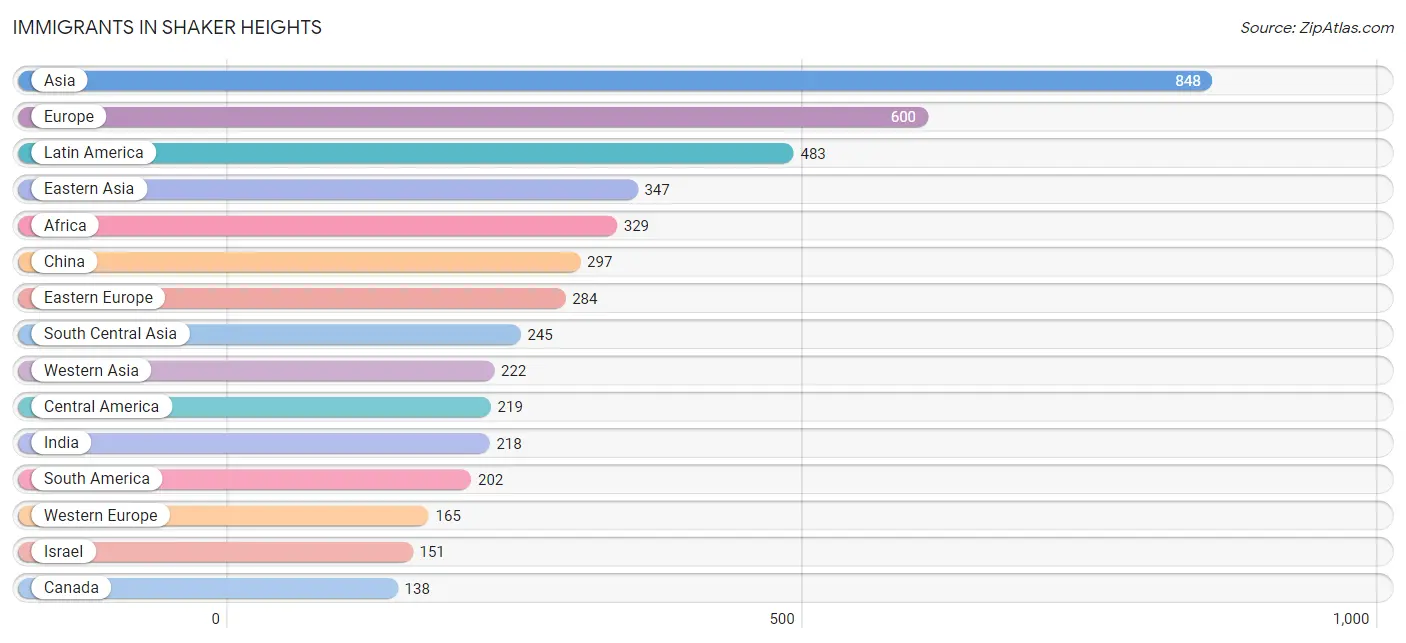
Immigrants in Shaker Heights
The most numerous immigrant groups reported in Shaker Heights came from Asia (848 | 2.9%), Europe (600 | 2.1%), Latin America (483 | 1.7%), Eastern Asia (347 | 1.2%), and Africa (329 | 1.1%), together accounting for 8.9% of all Shaker Heights residents.
| Immigration Origin | # Population | % Population |
| Africa | 329 | 1.1% |
| Albania | 13 | 0.0% |
| Argentina | 118 | 0.4% |
| Asia | 848 | 2.9% |
| Belize | 8 | 0.0% |
| Brazil | 57 | 0.2% |
| Bulgaria | 21 | 0.1% |
| Canada | 138 | 0.5% |
| Caribbean | 62 | 0.2% |
| Central America | 219 | 0.7% |
| Chile | 19 | 0.1% |
| China | 297 | 1.0% |
| Colombia | 8 | 0.0% |
| Czechoslovakia | 18 | 0.1% |
| Denmark | 24 | 0.1% |
| Eastern Africa | 114 | 0.4% |
| Eastern Asia | 347 | 1.2% |
| Eastern Europe | 284 | 1.0% |
| El Salvador | 64 | 0.2% |
| England | 67 | 0.2% |
| Europe | 600 | 2.1% |
| France | 107 | 0.4% |
| Germany | 48 | 0.2% |
| Guatemala | 10 | 0.0% |
| Hong Kong | 14 | 0.1% |
| Hungary | 33 | 0.1% |
| India | 218 | 0.7% |
| Iran | 12 | 0.0% |
| Israel | 151 | 0.5% |
| Italy | 10 | 0.0% |
| Jamaica | 62 | 0.2% |
| Japan | 34 | 0.1% |
| Kenya | 99 | 0.3% |
| Korea | 16 | 0.1% |
| Latin America | 483 | 1.7% |
| Lebanon | 10 | 0.0% |
| Liberia | 18 | 0.1% |
| Mexico | 137 | 0.5% |
| Moldova | 9 | 0.0% |
| Morocco | 10 | 0.0% |
| Nepal | 15 | 0.1% |
| Netherlands | 10 | 0.0% |
| Nigeria | 17 | 0.1% |
| Northern Africa | 54 | 0.2% |
| Northern Europe | 122 | 0.4% |
| Philippines | 5 | 0.0% |
| Poland | 53 | 0.2% |
| Romania | 73 | 0.3% |
| Russia | 22 | 0.1% |
| Serbia | 7 | 0.0% |
| South Africa | 50 | 0.2% |
| South America | 202 | 0.7% |
| South Central Asia | 245 | 0.8% |
| South Eastern Asia | 34 | 0.1% |
| Southern Europe | 10 | 0.0% |
| Sweden | 12 | 0.0% |
| Syria | 12 | 0.0% |
| Taiwan | 30 | 0.1% |
| Thailand | 19 | 0.1% |
| Western Africa | 111 | 0.4% |
| Western Asia | 222 | 0.8% |
| Western Europe | 165 | 0.6% | View All 62 Rows |
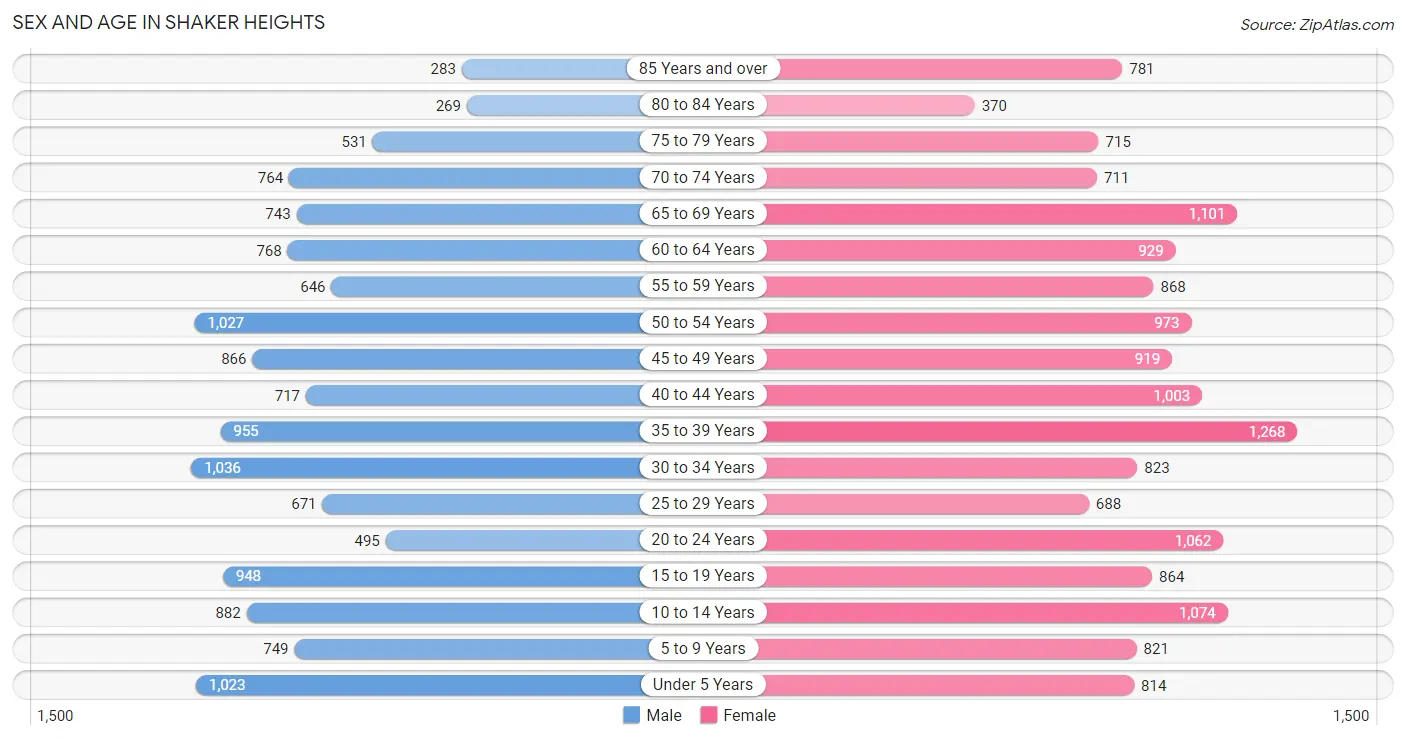
Sex and Age in Shaker Heights
Sex and Age in Shaker Heights
The most populous age groups in Shaker Heights are 30 to 34 Years (1,036 | 7.7%) for men and 35 to 39 Years (1,268 | 8.0%) for women.
| Age Bracket | Male | Female |
| Under 5 Years | 1,023 (7.6%) | 814 (5.2%) |
| 5 to 9 Years | 749 (5.6%) | 821 (5.2%) |
| 10 to 14 Years | 882 (6.6%) | 1,074 (6.8%) |
| 15 to 19 Years | 948 (7.1%) | 864 (5.5%) |
| 20 to 24 Years | 495 (3.7%) | 1,062 (6.7%) |
| 25 to 29 Years | 671 (5.0%) | 688 (4.4%) |
| 30 to 34 Years | 1,036 (7.7%) | 823 (5.2%) |
| 35 to 39 Years | 955 (7.1%) | 1,268 (8.0%) |
| 40 to 44 Years | 717 (5.4%) | 1,003 (6.4%) |
| 45 to 49 Years | 866 (6.5%) | 919 (5.8%) |
| 50 to 54 Years | 1,027 (7.7%) | 973 (6.2%) |
| 55 to 59 Years | 646 (4.8%) | 868 (5.5%) |
| 60 to 64 Years | 768 (5.7%) | 929 (5.9%) |
| 65 to 69 Years | 743 (5.6%) | 1,101 (7.0%) |
| 70 to 74 Years | 764 (5.7%) | 711 (4.5%) |
| 75 to 79 Years | 531 (4.0%) | 715 (4.5%) |
| 80 to 84 Years | 269 (2.0%) | 370 (2.3%) |
| 85 Years and over | 283 (2.1%) | 781 (5.0%) |
| Total | 13,373 (100.0%) | 15,784 (100.0%) |
Families and Households in Shaker Heights
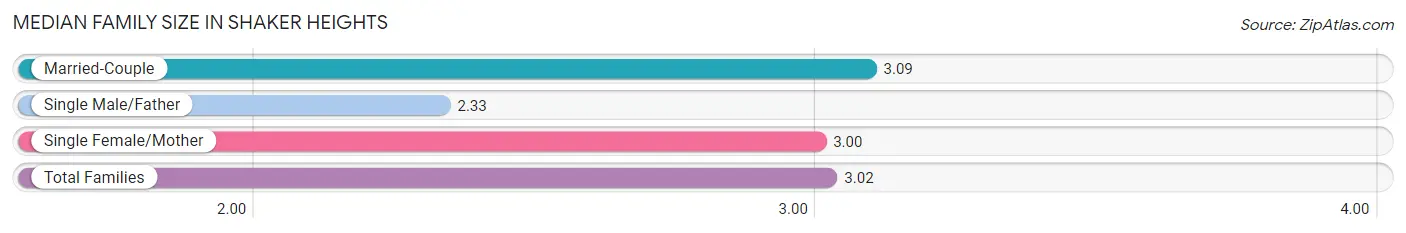
Median Family Size in Shaker Heights
The median family size in Shaker Heights is 3.02 persons per family, with married-couple families (5,442 | 72.5%) accounting for the largest median family size of 3.09 persons per family. On the other hand, single male/father families (443 | 5.9%) represent the smallest median family size with 2.33 persons per family.
| Family Type | # Families | Family Size |
| Married-Couple | 5,442 (72.5%) | 3.09 |
| Single Male/Father | 443 (5.9%) | 2.33 |
| Single Female/Mother | 1,621 (21.6%) | 3.00 |
| Total Families | 7,506 (100.0%) | 3.02 |
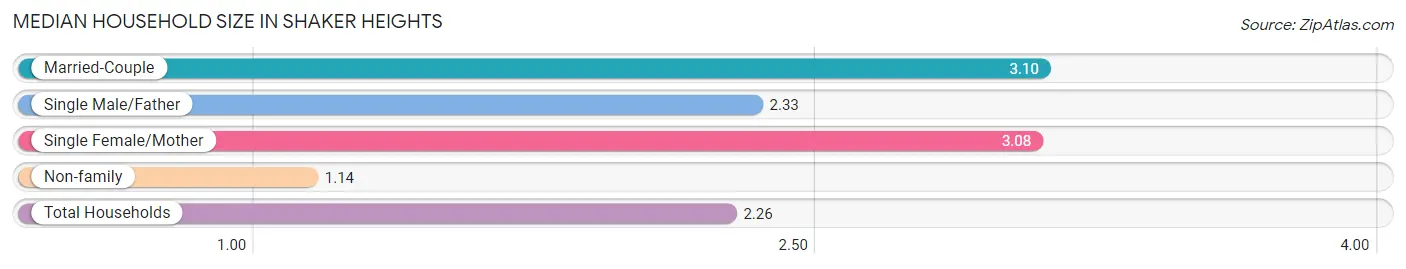
Median Household Size in Shaker Heights
The median household size in Shaker Heights is 2.26 persons per household, with married-couple households (5,442 | 42.4%) accounting for the largest median household size of 3.1 persons per household. non-family households (5,320 | 41.5%) represent the smallest median household size with 1.14 persons per household.
| Household Type | # Households | Household Size |
| Married-Couple | 5,442 (42.4%) | 3.10 |
| Single Male/Father | 443 (3.5%) | 2.33 |
| Single Female/Mother | 1,621 (12.6%) | 3.08 |
| Non-family | 5,320 (41.5%) | 1.14 |
| Total Households | 12,826 (100.0%) | 2.26 |
Household Size by Marriage Status in Shaker Heights
Out of a total of 12,826 households in Shaker Heights, 7,506 (58.5%) are family households, while 5,320 (41.5%) are nonfamily households. The most numerous type of family households are 2-person households, comprising 3,616, and the most common type of nonfamily households are 1-person households, comprising 4,626.
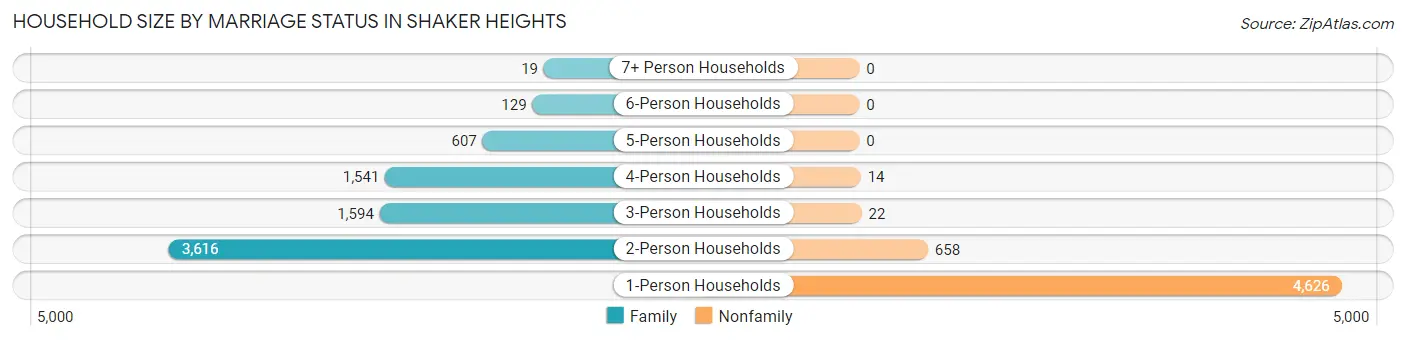
| Household Size | Family Households | Nonfamily Households |
| 1-Person Households | - | 4,626 (36.1%) |
| 2-Person Households | 3,616 (28.2%) | 658 (5.1%) |
| 3-Person Households | 1,594 (12.4%) | 22 (0.2%) |
| 4-Person Households | 1,541 (12.0%) | 14 (0.1%) |
| 5-Person Households | 607 (4.7%) | 0 (0.0%) |
| 6-Person Households | 129 (1.0%) | 0 (0.0%) |
| 7+ Person Households | 19 (0.2%) | 0 (0.0%) |
| Total | 7,506 (58.5%) | 5,320 (41.5%) |
Female Fertility in Shaker Heights
Fertility by Age in Shaker Heights
Average fertility rate in Shaker Heights is 44.0 births per 1,000 women. Women in the age bracket of 20 to 34 years have the highest fertility rate with 62.0 births per 1,000 women. Women in the age bracket of 20 to 34 years acount for 52.0% of all women with births.
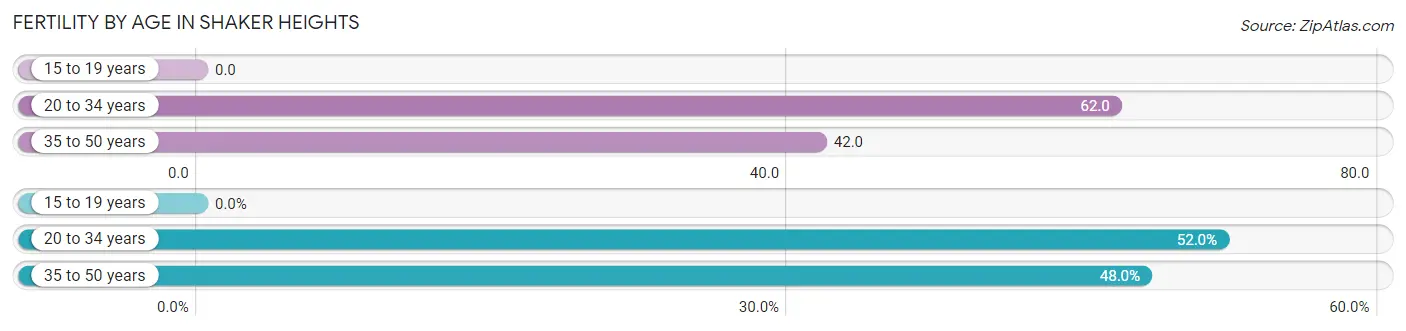
| Age Bracket | Women with Births | Births / 1,000 Women |
| 15 to 19 years | 0 (0.0%) | 0.0 |
| 20 to 34 years | 159 (52.0%) | 62.0 |
| 35 to 50 years | 147 (48.0%) | 42.0 |
| Total | 306 (100.0%) | 44.0 |
Fertility by Age by Marriage Status in Shaker Heights
91.5% of women with births (306) in Shaker Heights are married. The highest percentage of unmarried women with births falls into 35 to 50 years age bracket with 17.7% of them unmarried at the time of birth, while the lowest percentage of unmarried women with births belong to 20 to 34 years age bracket with 0.0% of them unmarried.
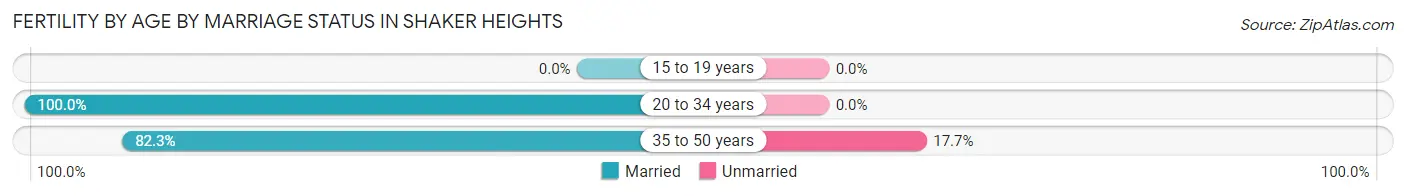
| Age Bracket | Married | Unmarried |
| 15 to 19 years | 0 (0.0%) | 0 (0.0%) |
| 20 to 34 years | 159 (100.0%) | 0 (0.0%) |
| 35 to 50 years | 121 (82.3%) | 26 (17.7%) |
| Total | 280 (91.5%) | 26 (8.5%) |
Fertility by Education in Shaker Heights
Average fertility rate in Shaker Heights is 44.0 births per 1,000 women. Women with the education attainment of graduate degree have the highest fertility rate of 75.0 births per 1,000 women, while women with the education attainment of less than high school have the lowest fertility at 4.0 births per 1,000 women. Women with the education attainment of graduate degree represent 52.3% of all women with births.
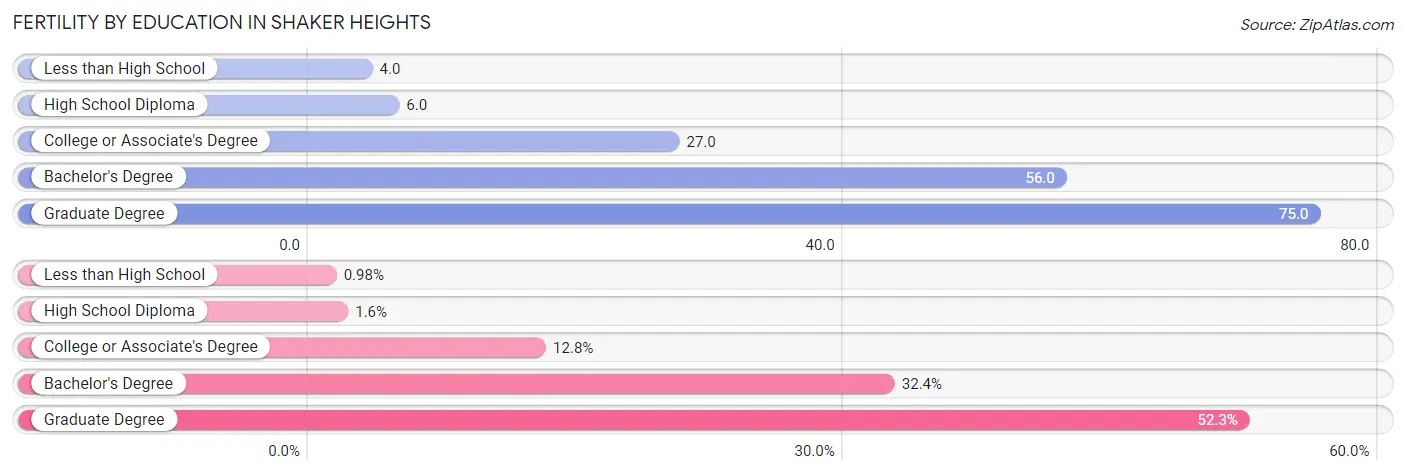
| Educational Attainment | Women with Births | Births / 1,000 Women |
| Less than High School | 3 (1.0%) | 4.0 |
| High School Diploma | 5 (1.6%) | 6.0 |
| College or Associate's Degree | 39 (12.8%) | 27.0 |
| Bachelor's Degree | 99 (32.4%) | 56.0 |
| Graduate Degree | 160 (52.3%) | 75.0 |
| Total | 306 (100.0%) | 44.0 |
Fertility by Education by Marriage Status in Shaker Heights
8.5% of women with births in Shaker Heights are unmarried. Women with the educational attainment of less than high school are most likely to be married with 100.0% of them married at childbirth, while women with the educational attainment of bachelor's degree are least likely to be married with 26.3% of them unmarried at childbirth.
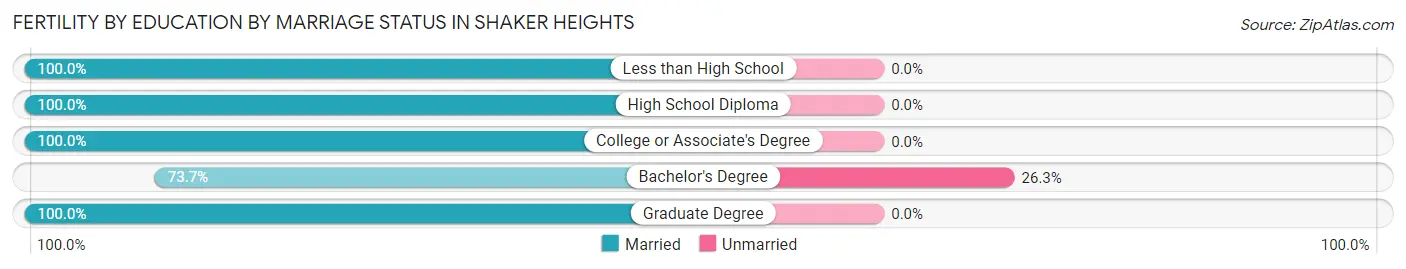
| Educational Attainment | Married | Unmarried |
| Less than High School | 3 (100.0%) | 0 (0.0%) |
| High School Diploma | 5 (100.0%) | 0 (0.0%) |
| College or Associate's Degree | 39 (100.0%) | 0 (0.0%) |
| Bachelor's Degree | 73 (73.7%) | 26 (26.3%) |
| Graduate Degree | 160 (100.0%) | 0 (0.0%) |
| Total | 280 (91.5%) | 26 (8.5%) |
Employment Characteristics in Shaker Heights
Employment by Class of Employer in Shaker Heights
Among the 14,326 employed individuals in Shaker Heights, private company employees (7,253 | 50.6%), not-for-profit organizations (3,694 | 25.8%), and local government employees (1,331 | 9.3%) make up the most common classes of employment.
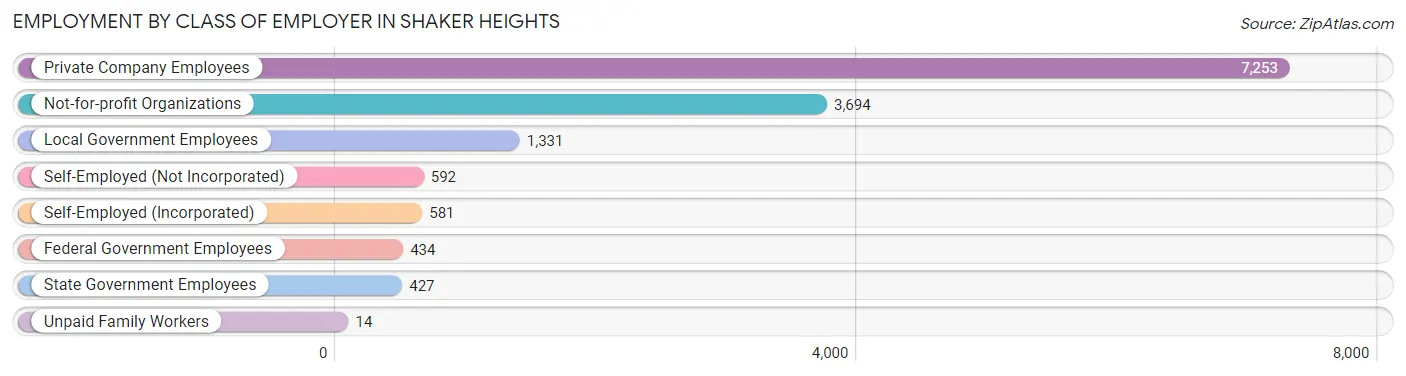
| Employer Class | # Employees | % Employees |
| Private Company Employees | 7,253 | 50.6% |
| Self-Employed (Incorporated) | 581 | 4.1% |
| Self-Employed (Not Incorporated) | 592 | 4.1% |
| Not-for-profit Organizations | 3,694 | 25.8% |
| Local Government Employees | 1,331 | 9.3% |
| State Government Employees | 427 | 3.0% |
| Federal Government Employees | 434 | 3.0% |
| Unpaid Family Workers | 14 | 0.1% |
| Total | 14,326 | 100.0% |
Employment Status by Age in Shaker Heights
According to the labor force statistics for Shaker Heights, out of the total population over 16 years of age (23,355), 66.2% or 15,461 individuals are in the labor force, with 5.1% or 789 of them unemployed. The age group with the highest labor force participation rate is 30 to 34 years, with 87.9% or 1,634 individuals in the labor force. Within the labor force, the 16 to 19 years age range has the highest percentage of unemployed individuals, with 15.4% or 81 of them being unemployed.
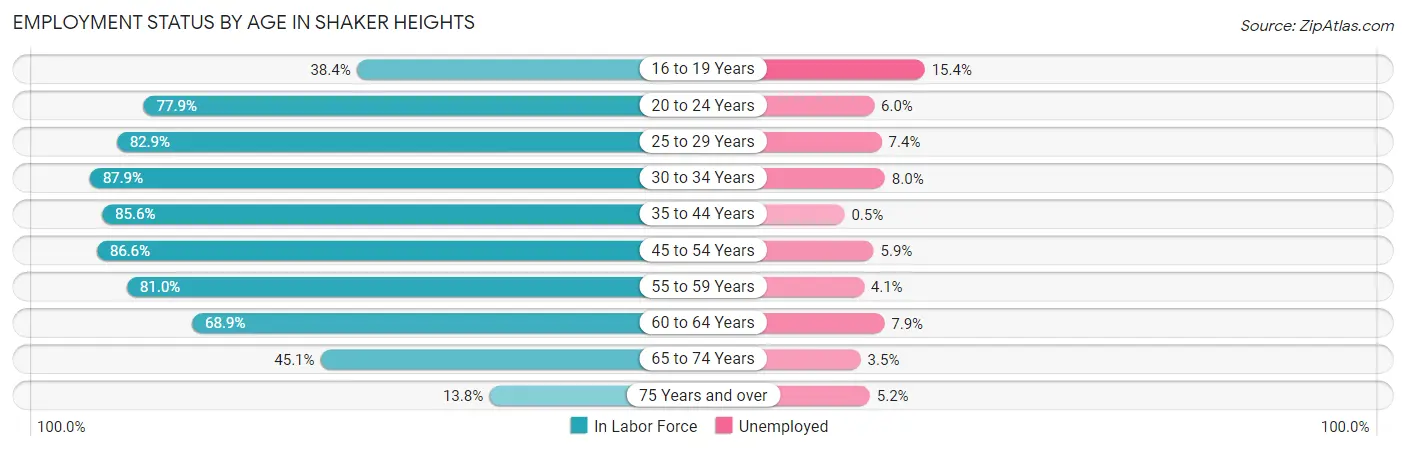
| Age Bracket | In Labor Force | Unemployed |
| 16 to 19 Years | 527 (38.4%) | 81 (15.4%) |
| 20 to 24 Years | 1,213 (77.9%) | 73 (6.0%) |
| 25 to 29 Years | 1,127 (82.9%) | 83 (7.4%) |
| 30 to 34 Years | 1,634 (87.9%) | 131 (8.0%) |
| 35 to 44 Years | 3,375 (85.6%) | 17 (0.5%) |
| 45 to 54 Years | 3,278 (86.6%) | 193 (5.9%) |
| 55 to 59 Years | 1,226 (81.0%) | 50 (4.1%) |
| 60 to 64 Years | 1,169 (68.9%) | 92 (7.9%) |
| 65 to 74 Years | 1,497 (45.1%) | 52 (3.5%) |
| 75 Years and over | 407 (13.8%) | 21 (5.2%) |
| Total | 15,461 (66.2%) | 789 (5.1%) |
Employment Status by Educational Attainment in Shaker Heights
According to labor force statistics for Shaker Heights, 83.4% of individuals (11,807) out of the total population between 25 and 64 years of age (14,157) are in the labor force, with 4.8% or 567 of them being unemployed. The group with the highest labor force participation rate are those with the educational attainment of bachelor's degree or higher, with 87.4% or 8,964 individuals in the labor force. Within the labor force, individuals with less than high school education have the highest percentage of unemployment, with 32.9% or 24 of them being unemployed.
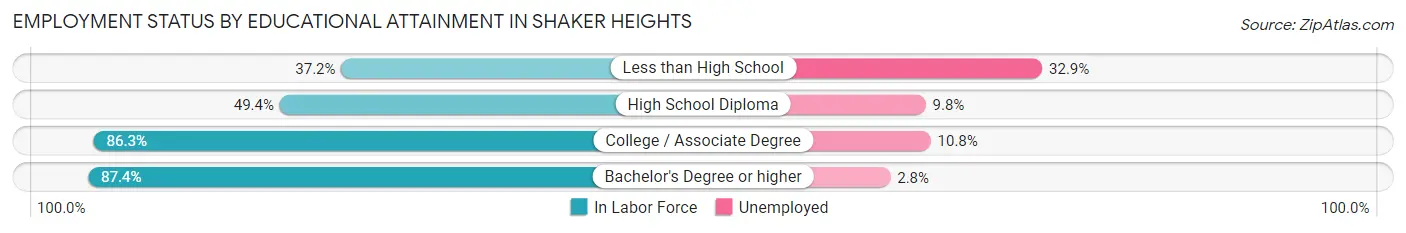
| Educational Attainment | In Labor Force | Unemployed |
| Less than High School | 73 (37.2%) | 64 (32.9%) |
| High School Diploma | 569 (49.4%) | 113 (9.8%) |
| College / Associate Degree | 2,204 (86.3%) | 276 (10.8%) |
| Bachelor's Degree or higher | 8,964 (87.4%) | 287 (2.8%) |
| Total | 11,807 (83.4%) | 680 (4.8%) |
Employment Occupations by Sex in Shaker Heights
Management, Business, Science and Arts Occupations
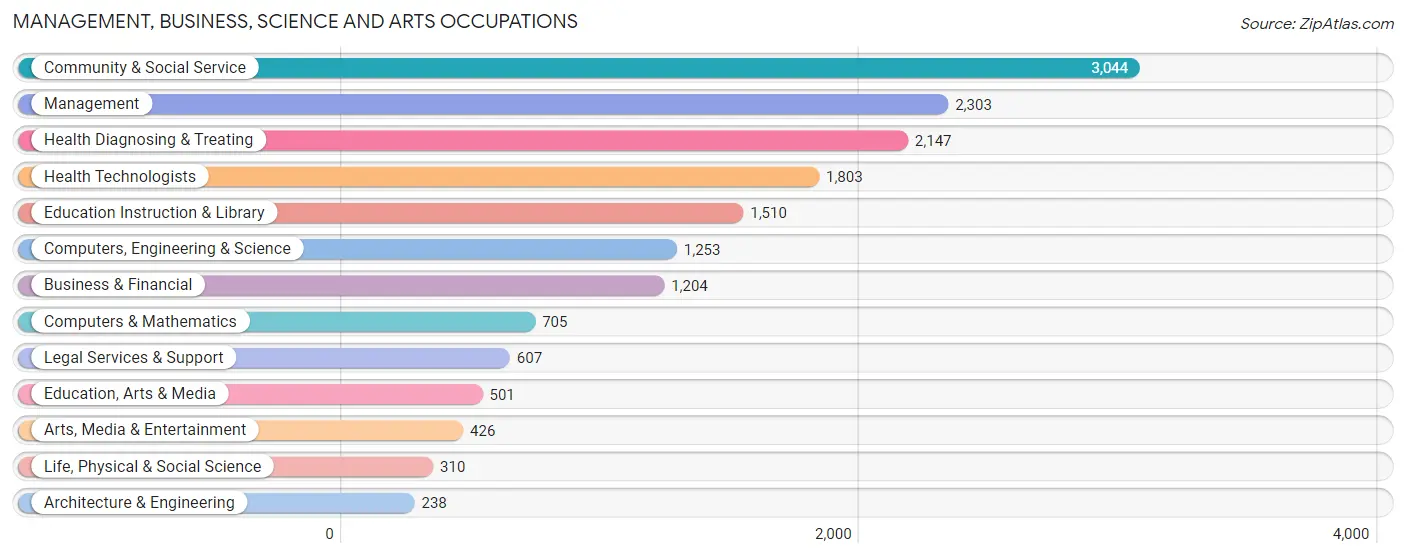
The most common Management, Business, Science and Arts occupations in Shaker Heights are Community & Social Service (3,044 | 20.8%), Management (2,303 | 15.8%), Health Diagnosing & Treating (2,147 | 14.7%), Health Technologists (1,803 | 12.3%), and Education Instruction & Library (1,510 | 10.3%).
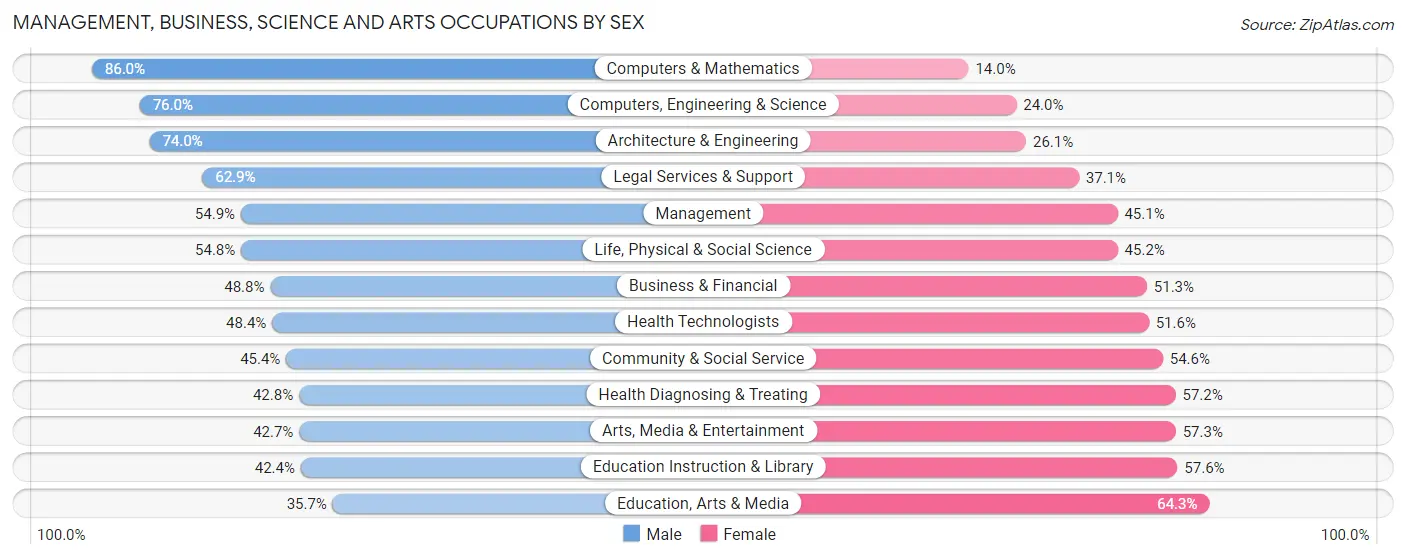
Management, Business, Science and Arts Occupations by Sex
Within the Management, Business, Science and Arts occupations in Shaker Heights, the most male-oriented occupations are Computers & Mathematics (86.0%), Computers, Engineering & Science (76.0%), and Architecture & Engineering (74.0%), while the most female-oriented occupations are Education, Arts & Media (64.3%), Education Instruction & Library (57.6%), and Arts, Media & Entertainment (57.3%).
| Occupation | Male | Female |
| Management | 1,264 (54.9%) | 1,039 (45.1%) |
| Business & Financial | 587 (48.7%) | 617 (51.2%) |
| Computers, Engineering & Science | 952 (76.0%) | 301 (24.0%) |
| Computers & Mathematics | 606 (86.0%) | 99 (14.0%) |
| Architecture & Engineering | 176 (74.0%) | 62 (26.1%) |
| Life, Physical & Social Science | 170 (54.8%) | 140 (45.2%) |
| Community & Social Service | 1,383 (45.4%) | 1,661 (54.6%) |
| Education, Arts & Media | 179 (35.7%) | 322 (64.3%) |
| Legal Services & Support | 382 (62.9%) | 225 (37.1%) |
| Education Instruction & Library | 640 (42.4%) | 870 (57.6%) |
| Arts, Media & Entertainment | 182 (42.7%) | 244 (57.3%) |
| Health Diagnosing & Treating | 918 (42.8%) | 1,229 (57.2%) |
| Health Technologists | 872 (48.4%) | 931 (51.6%) |
| Total (Category) | 5,104 (51.3%) | 4,847 (48.7%) |
| Total (Overall) | 7,163 (49.0%) | 7,455 (51.0%) |
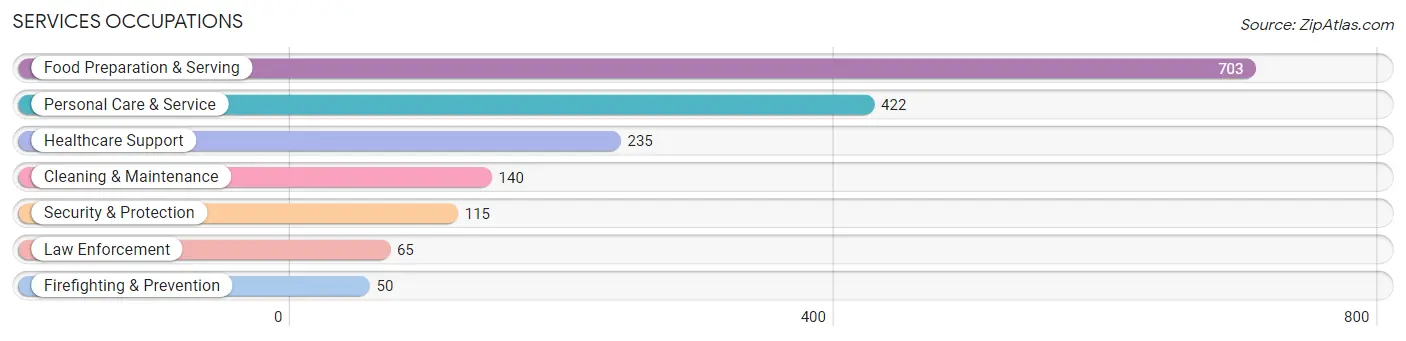
Services Occupations
The most common Services occupations in Shaker Heights are Food Preparation & Serving (703 | 4.8%), Personal Care & Service (422 | 2.9%), Healthcare Support (235 | 1.6%), Cleaning & Maintenance (140 | 1.0%), and Security & Protection (115 | 0.8%).
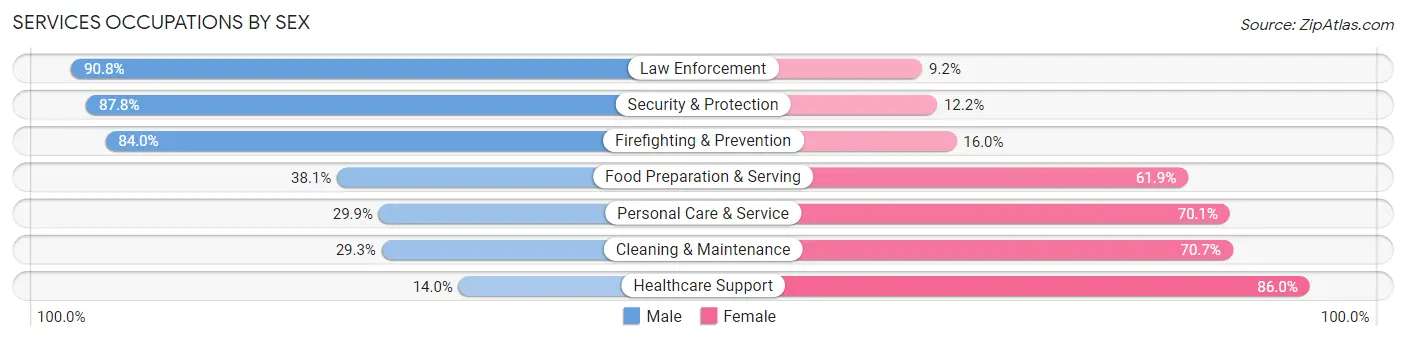
Services Occupations by Sex
Within the Services occupations in Shaker Heights, the most male-oriented occupations are Law Enforcement (90.8%), Security & Protection (87.8%), and Firefighting & Prevention (84.0%), while the most female-oriented occupations are Healthcare Support (86.0%), Cleaning & Maintenance (70.7%), and Personal Care & Service (70.1%).
| Occupation | Male | Female |
| Healthcare Support | 33 (14.0%) | 202 (86.0%) |
| Security & Protection | 101 (87.8%) | 14 (12.2%) |
| Firefighting & Prevention | 42 (84.0%) | 8 (16.0%) |
| Law Enforcement | 59 (90.8%) | 6 (9.2%) |
| Food Preparation & Serving | 268 (38.1%) | 435 (61.9%) |
| Cleaning & Maintenance | 41 (29.3%) | 99 (70.7%) |
| Personal Care & Service | 126 (29.9%) | 296 (70.1%) |
| Total (Category) | 569 (35.2%) | 1,046 (64.8%) |
| Total (Overall) | 7,163 (49.0%) | 7,455 (51.0%) |
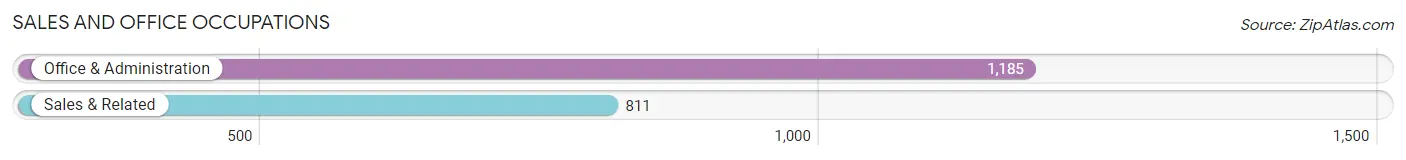
Sales and Office Occupations
The most common Sales and Office occupations in Shaker Heights are Office & Administration (1,185 | 8.1%), and Sales & Related (811 | 5.6%).
Sales and Office Occupations by Sex
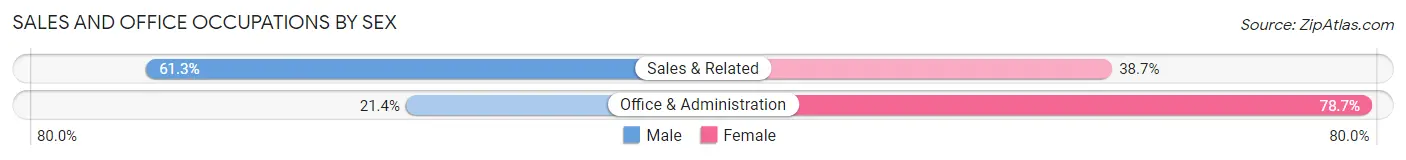
| Occupation | Male | Female |
| Sales & Related | 497 (61.3%) | 314 (38.7%) |
| Office & Administration | 253 (21.3%) | 932 (78.6%) |
| Total (Category) | 750 (37.6%) | 1,246 (62.4%) |
| Total (Overall) | 7,163 (49.0%) | 7,455 (51.0%) |
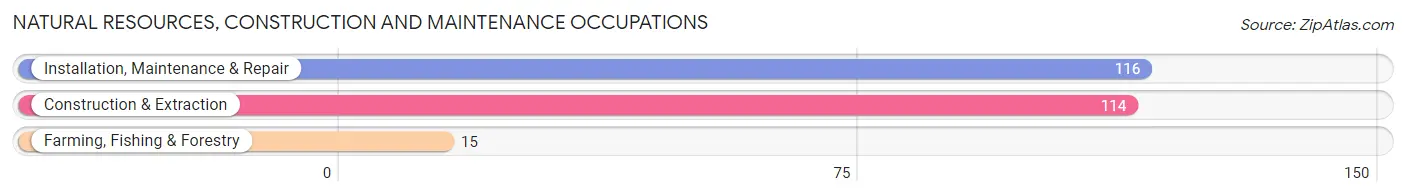
Natural Resources, Construction and Maintenance Occupations
The most common Natural Resources, Construction and Maintenance occupations in Shaker Heights are Installation, Maintenance & Repair (116 | 0.8%), Construction & Extraction (114 | 0.8%), and Farming, Fishing & Forestry (15 | 0.1%).
Natural Resources, Construction and Maintenance Occupations by Sex
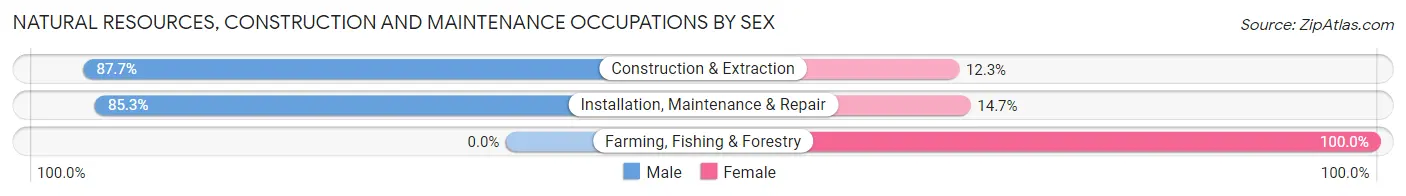
| Occupation | Male | Female |
| Farming, Fishing & Forestry | 0 (0.0%) | 15 (100.0%) |
| Construction & Extraction | 100 (87.7%) | 14 (12.3%) |
| Installation, Maintenance & Repair | 99 (85.3%) | 17 (14.7%) |
| Total (Category) | 199 (81.2%) | 46 (18.8%) |
| Total (Overall) | 7,163 (49.0%) | 7,455 (51.0%) |
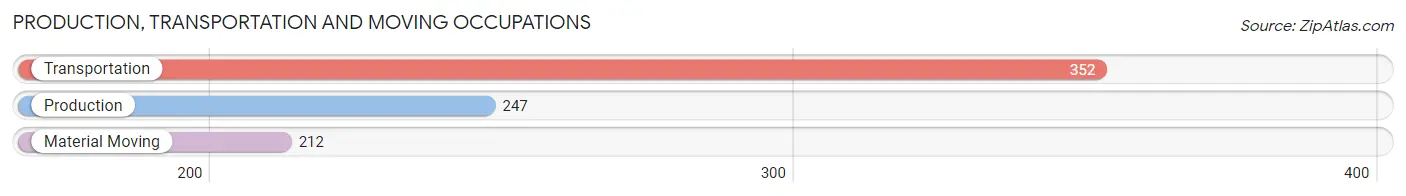
Production, Transportation and Moving Occupations
The most common Production, Transportation and Moving occupations in Shaker Heights are Transportation (352 | 2.4%), Production (247 | 1.7%), and Material Moving (212 | 1.5%).
Production, Transportation and Moving Occupations by Sex
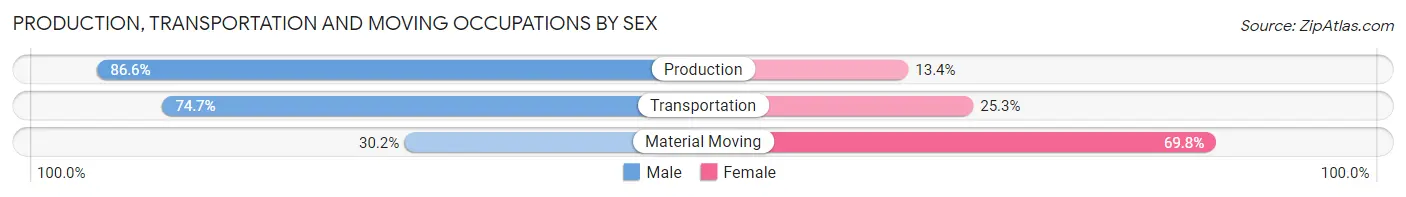
| Occupation | Male | Female |
| Production | 214 (86.6%) | 33 (13.4%) |
| Transportation | 263 (74.7%) | 89 (25.3%) |
| Material Moving | 64 (30.2%) | 148 (69.8%) |
| Total (Category) | 541 (66.7%) | 270 (33.3%) |
| Total (Overall) | 7,163 (49.0%) | 7,455 (51.0%) |
Employment Industries by Sex in Shaker Heights
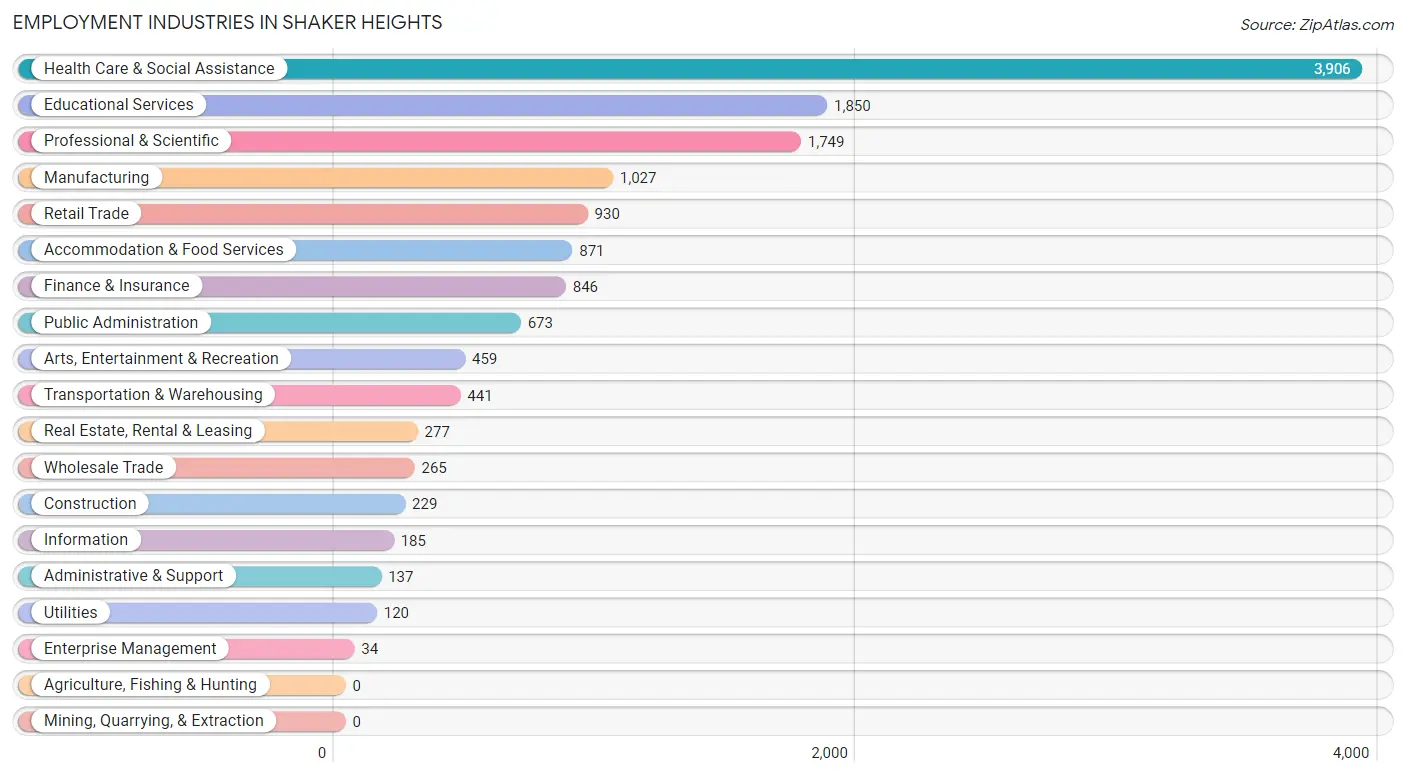
Employment Industries in Shaker Heights
The major employment industries in Shaker Heights include Health Care & Social Assistance (3,906 | 26.7%), Educational Services (1,850 | 12.7%), Professional & Scientific (1,749 | 12.0%), Manufacturing (1,027 | 7.0%), and Retail Trade (930 | 6.4%).
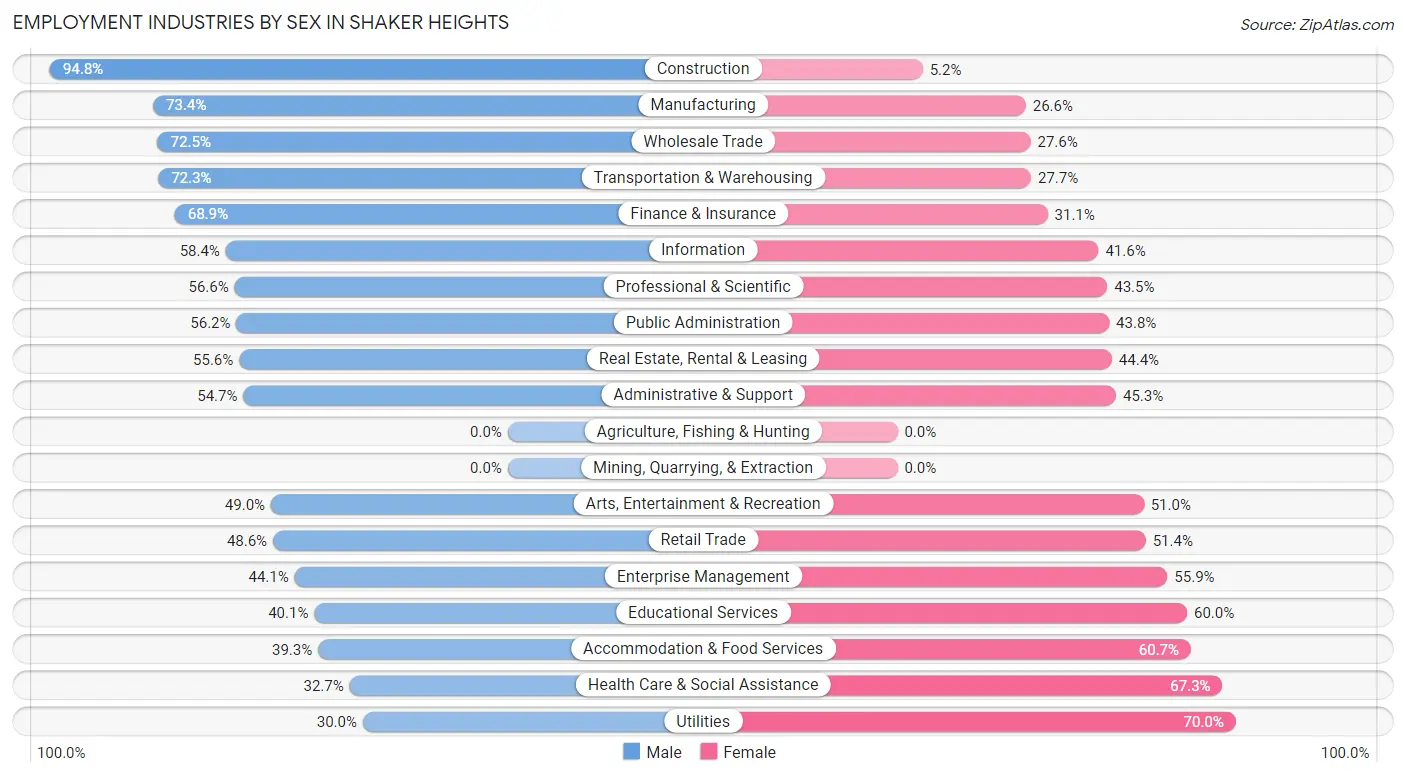
Employment Industries by Sex in Shaker Heights
The Shaker Heights industries that see more men than women are Construction (94.8%), Manufacturing (73.4%), and Wholesale Trade (72.5%), whereas the industries that tend to have a higher number of women are Utilities (70.0%), Health Care & Social Assistance (67.3%), and Accommodation & Food Services (60.7%).
| Industry | Male | Female |
| Agriculture, Fishing & Hunting | 0 (0.0%) | 0 (0.0%) |
| Mining, Quarrying, & Extraction | 0 (0.0%) | 0 (0.0%) |
| Construction | 217 (94.8%) | 12 (5.2%) |
| Manufacturing | 754 (73.4%) | 273 (26.6%) |
| Wholesale Trade | 192 (72.5%) | 73 (27.6%) |
| Retail Trade | 452 (48.6%) | 478 (51.4%) |
| Transportation & Warehousing | 319 (72.3%) | 122 (27.7%) |
| Utilities | 36 (30.0%) | 84 (70.0%) |
| Information | 108 (58.4%) | 77 (41.6%) |
| Finance & Insurance | 583 (68.9%) | 263 (31.1%) |
| Real Estate, Rental & Leasing | 154 (55.6%) | 123 (44.4%) |
| Professional & Scientific | 989 (56.6%) | 760 (43.4%) |
| Enterprise Management | 15 (44.1%) | 19 (55.9%) |
| Administrative & Support | 75 (54.7%) | 62 (45.3%) |
| Educational Services | 741 (40.1%) | 1,109 (60.0%) |
| Health Care & Social Assistance | 1,279 (32.7%) | 2,627 (67.3%) |
| Arts, Entertainment & Recreation | 225 (49.0%) | 234 (51.0%) |
| Accommodation & Food Services | 342 (39.3%) | 529 (60.7%) |
| Public Administration | 378 (56.2%) | 295 (43.8%) |
| Total | 7,163 (49.0%) | 7,455 (51.0%) |
Education in Shaker Heights
School Enrollment in Shaker Heights
The most common levels of schooling among the 7,107 students in Shaker Heights are high school (1,593 | 22.4%), middle school (1,575 | 22.2%), and elementary school (1,240 | 17.4%).
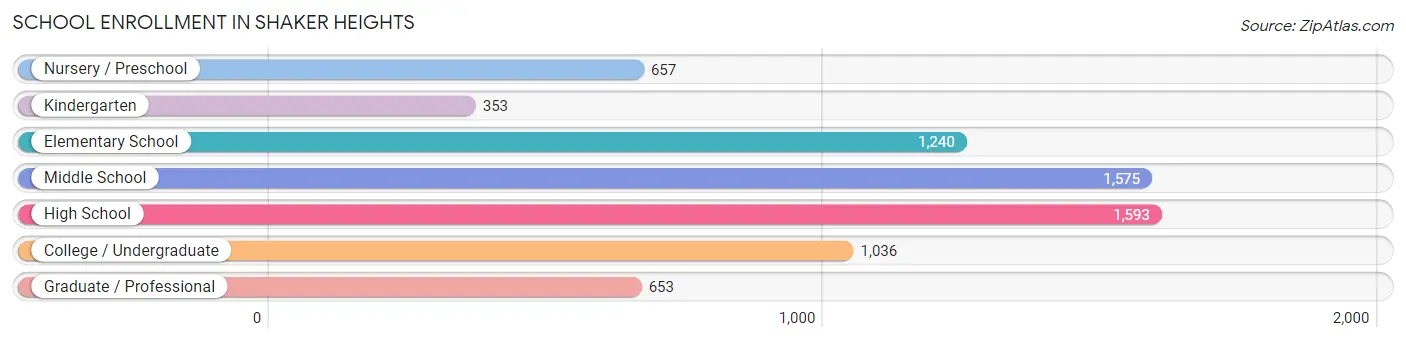
| School Level | # Students | % Students |
| Nursery / Preschool | 657 | 9.2% |
| Kindergarten | 353 | 5.0% |
| Elementary School | 1,240 | 17.4% |
| Middle School | 1,575 | 22.2% |
| High School | 1,593 | 22.4% |
| College / Undergraduate | 1,036 | 14.6% |
| Graduate / Professional | 653 | 9.2% |
| Total | 7,107 | 100.0% |
School Enrollment by Age by Funding Source in Shaker Heights
Out of a total of 7,107 students who are enrolled in schools in Shaker Heights, 2,047 (28.8%) attend a private institution, while the remaining 5,060 (71.2%) are enrolled in public schools. The age group of 3 to 4 year olds has the highest likelihood of being enrolled in private schools, with 355 (70.4% in the age bracket) enrolled. Conversely, the age group of 15 to 17 year olds has the lowest likelihood of being enrolled in a private school, with 1,035 (83.5% in the age bracket) attending a public institution.
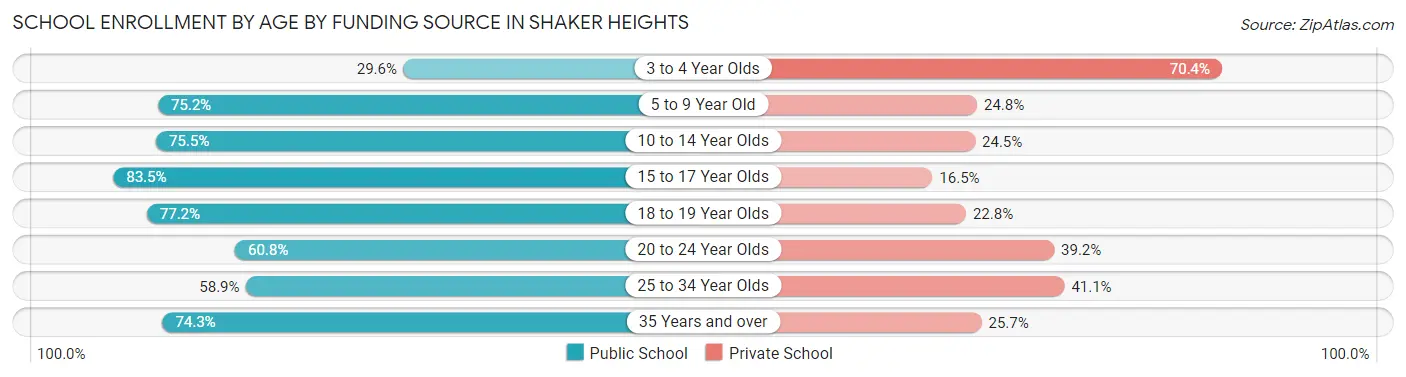
| Age Bracket | Public School | Private School |
| 3 to 4 Year Olds | 149 (29.6%) | 355 (70.4%) |
| 5 to 9 Year Old | 1,165 (75.2%) | 385 (24.8%) |
| 10 to 14 Year Olds | 1,462 (75.5%) | 474 (24.5%) |
| 15 to 17 Year Olds | 1,035 (83.5%) | 205 (16.5%) |
| 18 to 19 Year Olds | 261 (77.2%) | 77 (22.8%) |
| 20 to 24 Year Olds | 408 (60.8%) | 263 (39.2%) |
| 25 to 34 Year Olds | 252 (58.9%) | 176 (41.1%) |
| 35 Years and over | 327 (74.3%) | 113 (25.7%) |
| Total | 5,060 (71.2%) | 2,047 (28.8%) |
Educational Attainment by Field of Study in Shaker Heights
Business (2,024 | 12.6%), social sciences (1,851 | 11.6%), science & technology (1,315 | 8.2%), education (1,309 | 8.2%), and bio, nature & agricultural (1,256 | 7.8%) are the most common fields of study among 16,019 individuals in Shaker Heights who have obtained a bachelor's degree or higher.
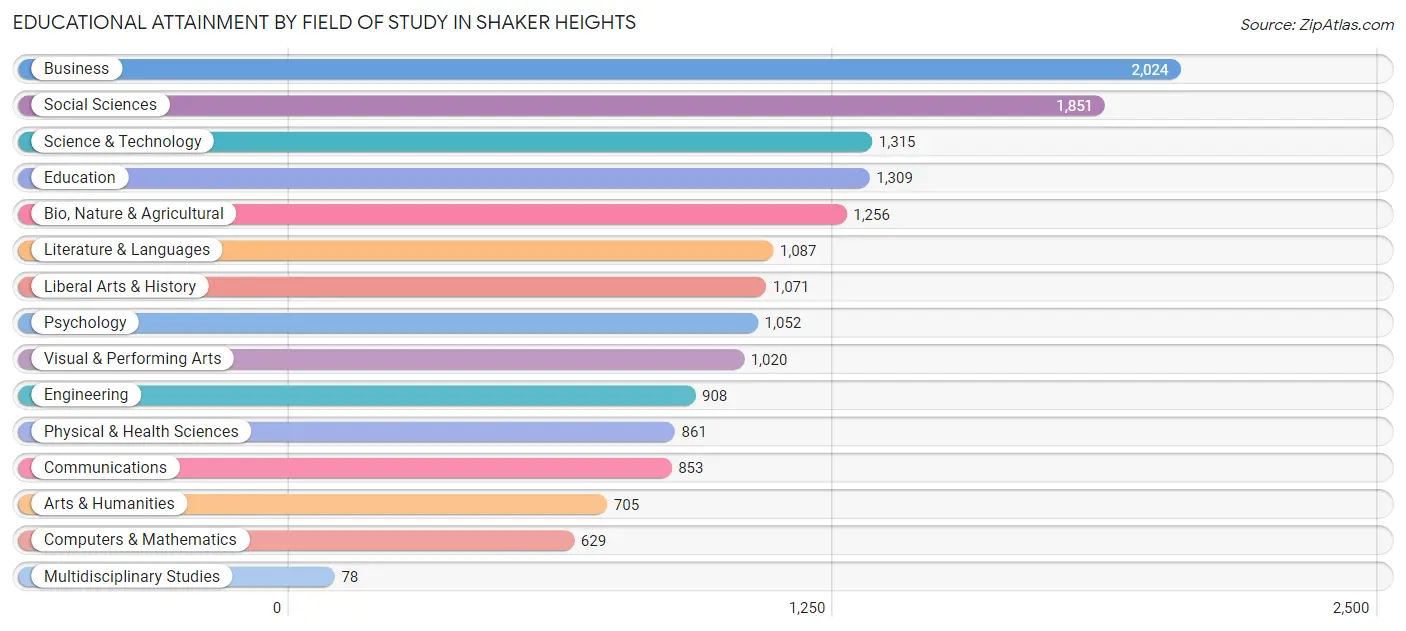
| Field of Study | # Graduates | % Graduates |
| Computers & Mathematics | 629 | 3.9% |
| Bio, Nature & Agricultural | 1,256 | 7.8% |
| Physical & Health Sciences | 861 | 5.4% |
| Psychology | 1,052 | 6.6% |
| Social Sciences | 1,851 | 11.6% |
| Engineering | 908 | 5.7% |
| Multidisciplinary Studies | 78 | 0.5% |
| Science & Technology | 1,315 | 8.2% |
| Business | 2,024 | 12.6% |
| Education | 1,309 | 8.2% |
| Literature & Languages | 1,087 | 6.8% |
| Liberal Arts & History | 1,071 | 6.7% |
| Visual & Performing Arts | 1,020 | 6.4% |
| Communications | 853 | 5.3% |
| Arts & Humanities | 705 | 4.4% |
| Total | 16,019 | 100.0% |
Transportation & Commute in Shaker Heights
Vehicle Availability by Sex in Shaker Heights
The most prevalent vehicle ownership categories in Shaker Heights are males with 2 vehicles (4,116, accounting for 58.3%) and females with 2 vehicles (3,630, making up 56.7%).
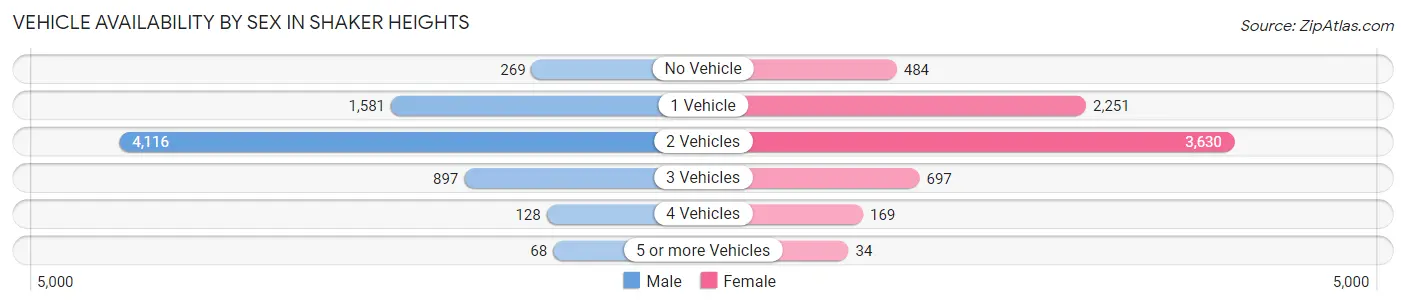
| Vehicles Available | Male | Female |
| No Vehicle | 269 (3.8%) | 484 (6.7%) |
| 1 Vehicle | 1,581 (22.4%) | 2,251 (31.0%) |
| 2 Vehicles | 4,116 (58.3%) | 3,630 (50.0%) |
| 3 Vehicles | 897 (12.7%) | 697 (9.6%) |
| 4 Vehicles | 128 (1.8%) | 169 (2.3%) |
| 5 or more Vehicles | 68 (1.0%) | 34 (0.5%) |
| Total | 7,059 (100.0%) | 7,265 (100.0%) |
Commute Time in Shaker Heights
The most frequently occuring commute durations in Shaker Heights are 20 to 24 minutes (2,471 commuters, 20.7%), 15 to 19 minutes (1,870 commuters, 15.6%), and 30 to 34 minutes (1,671 commuters, 14.0%).
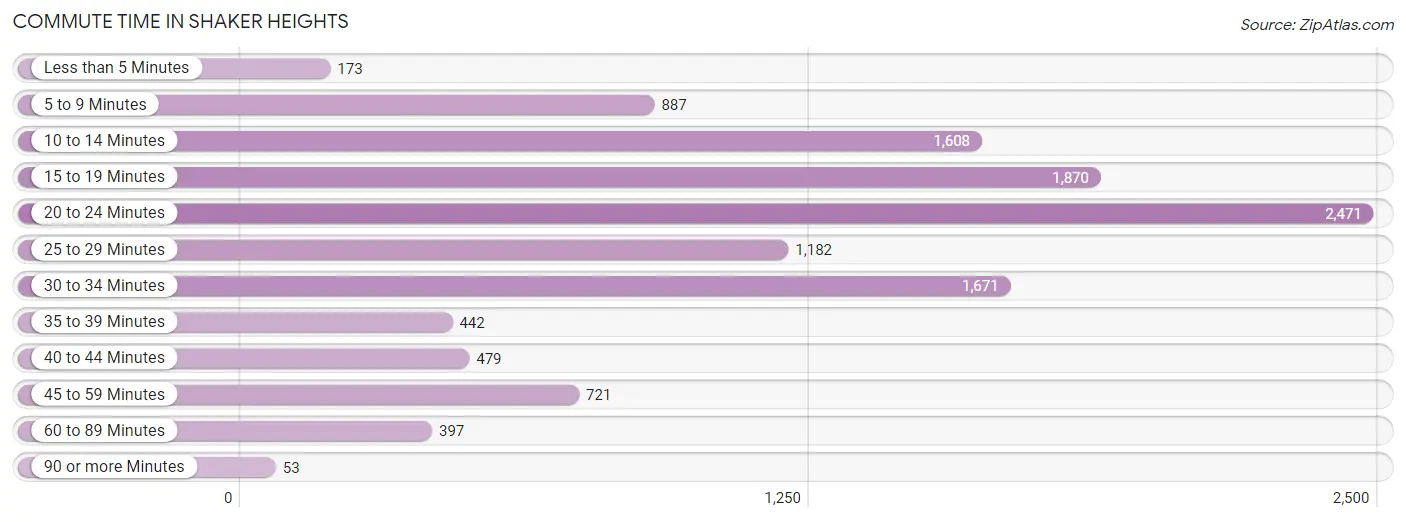
| Commute Time | # Commuters | % Commuters |
| Less than 5 Minutes | 173 | 1.5% |
| 5 to 9 Minutes | 887 | 7.4% |
| 10 to 14 Minutes | 1,608 | 13.5% |
| 15 to 19 Minutes | 1,870 | 15.6% |
| 20 to 24 Minutes | 2,471 | 20.7% |
| 25 to 29 Minutes | 1,182 | 9.9% |
| 30 to 34 Minutes | 1,671 | 14.0% |
| 35 to 39 Minutes | 442 | 3.7% |
| 40 to 44 Minutes | 479 | 4.0% |
| 45 to 59 Minutes | 721 | 6.0% |
| 60 to 89 Minutes | 397 | 3.3% |
| 90 or more Minutes | 53 | 0.4% |
Commute Time by Sex in Shaker Heights
The most common commute times in Shaker Heights are 20 to 24 minutes (1,204 commuters, 20.0%) for males and 20 to 24 minutes (1,267 commuters, 21.4%) for females.
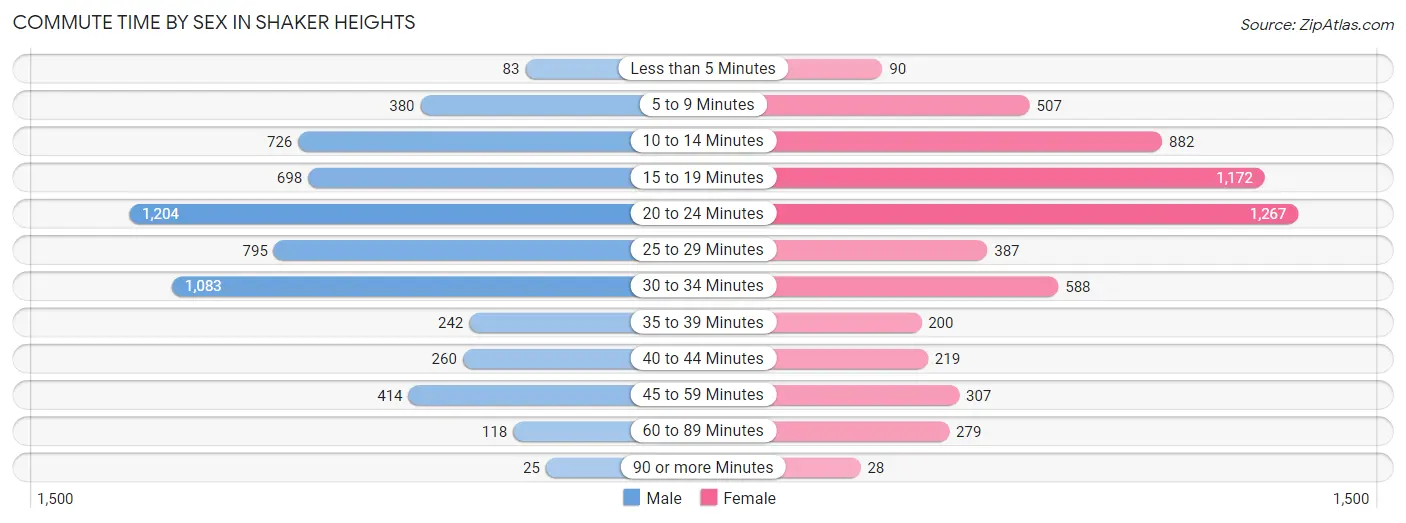
| Commute Time | Male | Female |
| Less than 5 Minutes | 83 (1.4%) | 90 (1.5%) |
| 5 to 9 Minutes | 380 (6.3%) | 507 (8.6%) |
| 10 to 14 Minutes | 726 (12.0%) | 882 (14.9%) |
| 15 to 19 Minutes | 698 (11.6%) | 1,172 (19.8%) |
| 20 to 24 Minutes | 1,204 (20.0%) | 1,267 (21.4%) |
| 25 to 29 Minutes | 795 (13.2%) | 387 (6.5%) |
| 30 to 34 Minutes | 1,083 (18.0%) | 588 (9.9%) |
| 35 to 39 Minutes | 242 (4.0%) | 200 (3.4%) |
| 40 to 44 Minutes | 260 (4.3%) | 219 (3.7%) |
| 45 to 59 Minutes | 414 (6.9%) | 307 (5.2%) |
| 60 to 89 Minutes | 118 (2.0%) | 279 (4.7%) |
| 90 or more Minutes | 25 (0.4%) | 28 (0.5%) |
Time of Departure to Work by Sex in Shaker Heights
The most frequent times of departure to work in Shaker Heights are 8:00 AM to 8:29 AM (983, 16.3%) for males and 8:00 AM to 8:29 AM (1,118, 18.9%) for females.
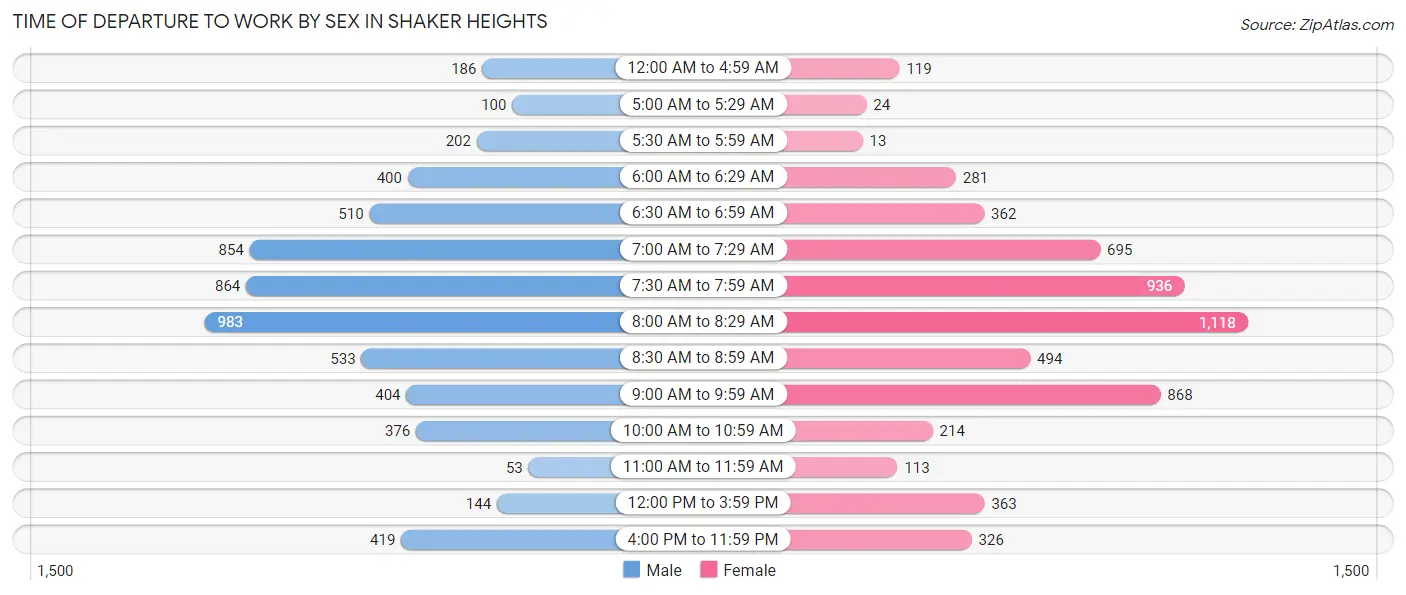
| Time of Departure | Male | Female |
| 12:00 AM to 4:59 AM | 186 (3.1%) | 119 (2.0%) |
| 5:00 AM to 5:29 AM | 100 (1.7%) | 24 (0.4%) |
| 5:30 AM to 5:59 AM | 202 (3.4%) | 13 (0.2%) |
| 6:00 AM to 6:29 AM | 400 (6.6%) | 281 (4.7%) |
| 6:30 AM to 6:59 AM | 510 (8.5%) | 362 (6.1%) |
| 7:00 AM to 7:29 AM | 854 (14.2%) | 695 (11.7%) |
| 7:30 AM to 7:59 AM | 864 (14.3%) | 936 (15.8%) |
| 8:00 AM to 8:29 AM | 983 (16.3%) | 1,118 (18.9%) |
| 8:30 AM to 8:59 AM | 533 (8.8%) | 494 (8.3%) |
| 9:00 AM to 9:59 AM | 404 (6.7%) | 868 (14.6%) |
| 10:00 AM to 10:59 AM | 376 (6.2%) | 214 (3.6%) |
| 11:00 AM to 11:59 AM | 53 (0.9%) | 113 (1.9%) |
| 12:00 PM to 3:59 PM | 144 (2.4%) | 363 (6.1%) |
| 4:00 PM to 11:59 PM | 419 (7.0%) | 326 (5.5%) |
| Total | 6,028 (100.0%) | 5,926 (100.0%) |
Housing Occupancy in Shaker Heights
Occupancy by Ownership in Shaker Heights
Of the total 12,826 dwellings in Shaker Heights, owner-occupied units account for 7,634 (59.5%), while renter-occupied units make up 5,192 (40.5%).
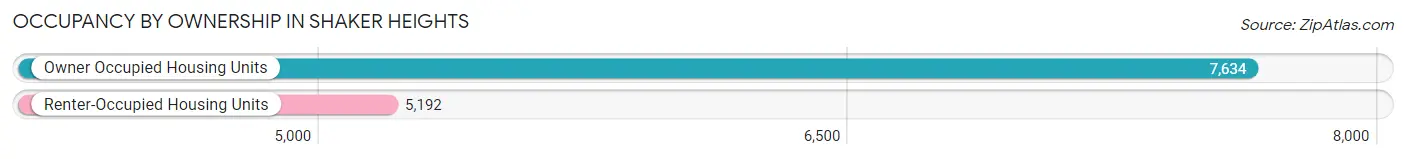
| Occupancy | # Housing Units | % Housing Units |
| Owner Occupied Housing Units | 7,634 | 59.5% |
| Renter-Occupied Housing Units | 5,192 | 40.5% |
| Total Occupied Housing Units | 12,826 | 100.0% |
Occupancy by Household Size in Shaker Heights
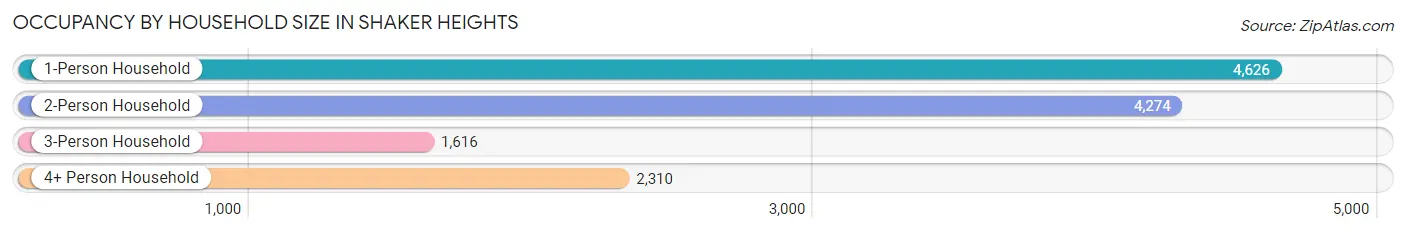
| Household Size | # Housing Units | % Housing Units |
| 1-Person Household | 4,626 | 36.1% |
| 2-Person Household | 4,274 | 33.3% |
| 3-Person Household | 1,616 | 12.6% |
| 4+ Person Household | 2,310 | 18.0% |
| Total Housing Units | 12,826 | 100.0% |
Occupancy by Ownership by Household Size in Shaker Heights
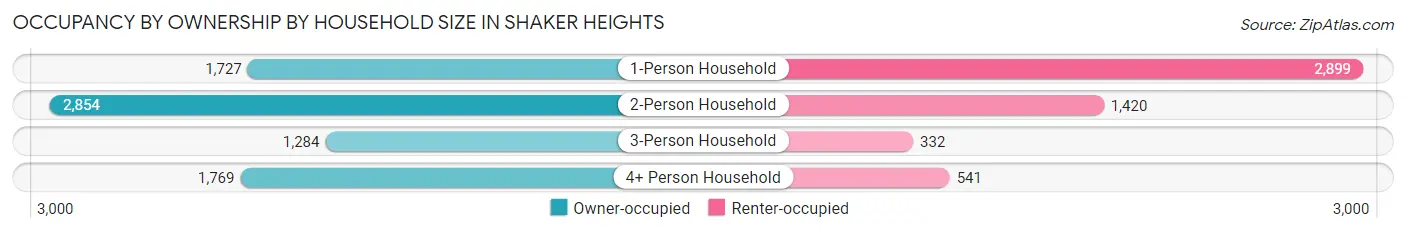
| Household Size | Owner-occupied | Renter-occupied |
| 1-Person Household | 1,727 (37.3%) | 2,899 (62.7%) |
| 2-Person Household | 2,854 (66.8%) | 1,420 (33.2%) |
| 3-Person Household | 1,284 (79.5%) | 332 (20.5%) |
| 4+ Person Household | 1,769 (76.6%) | 541 (23.4%) |
| Total Housing Units | 7,634 (59.5%) | 5,192 (40.5%) |
Occupancy by Educational Attainment in Shaker Heights
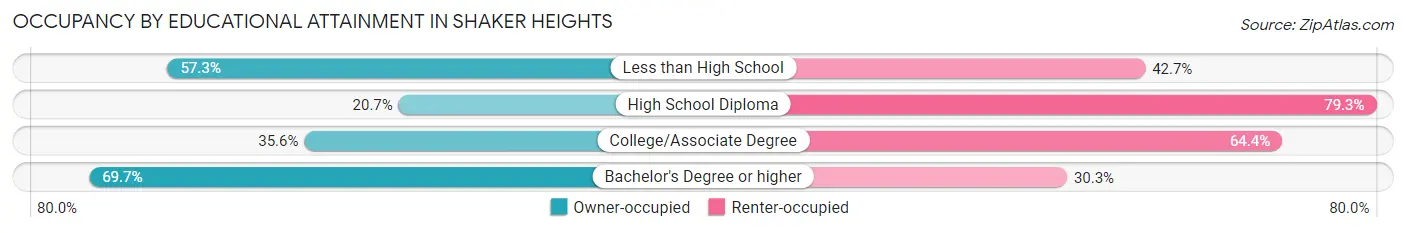
| Household Size | Owner-occupied | Renter-occupied |
| Less than High School | 172 (57.3%) | 128 (42.7%) |
| High School Diploma | 159 (20.7%) | 610 (79.3%) |
| College/Associate Degree | 937 (35.6%) | 1,692 (64.4%) |
| Bachelor's Degree or higher | 6,366 (69.7%) | 2,762 (30.3%) |
Occupancy by Age of Householder in Shaker Heights
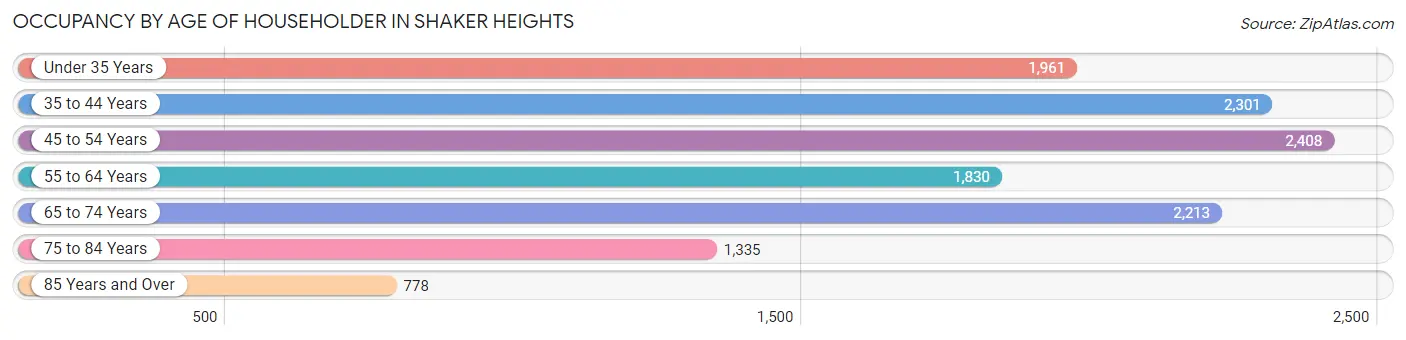
| Age Bracket | # Households | % Households |
| Under 35 Years | 1,961 | 15.3% |
| 35 to 44 Years | 2,301 | 17.9% |
| 45 to 54 Years | 2,408 | 18.8% |
| 55 to 64 Years | 1,830 | 14.3% |
| 65 to 74 Years | 2,213 | 17.2% |
| 75 to 84 Years | 1,335 | 10.4% |
| 85 Years and Over | 778 | 6.1% |
| Total | 12,826 | 100.0% |
Housing Finances in Shaker Heights
Median Income by Occupancy in Shaker Heights
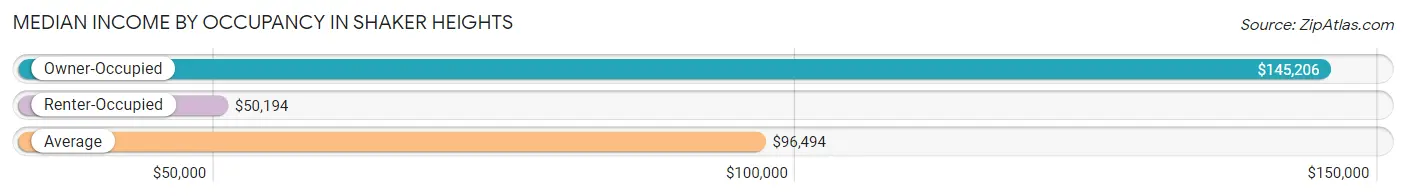
| Occupancy Type | # Households | Median Income |
| Owner-Occupied | 7,634 (59.5%) | $145,206 |
| Renter-Occupied | 5,192 (40.5%) | $50,194 |
| Average | 12,826 (100.0%) | $96,494 |
Occupancy by Householder Income Bracket in Shaker Heights
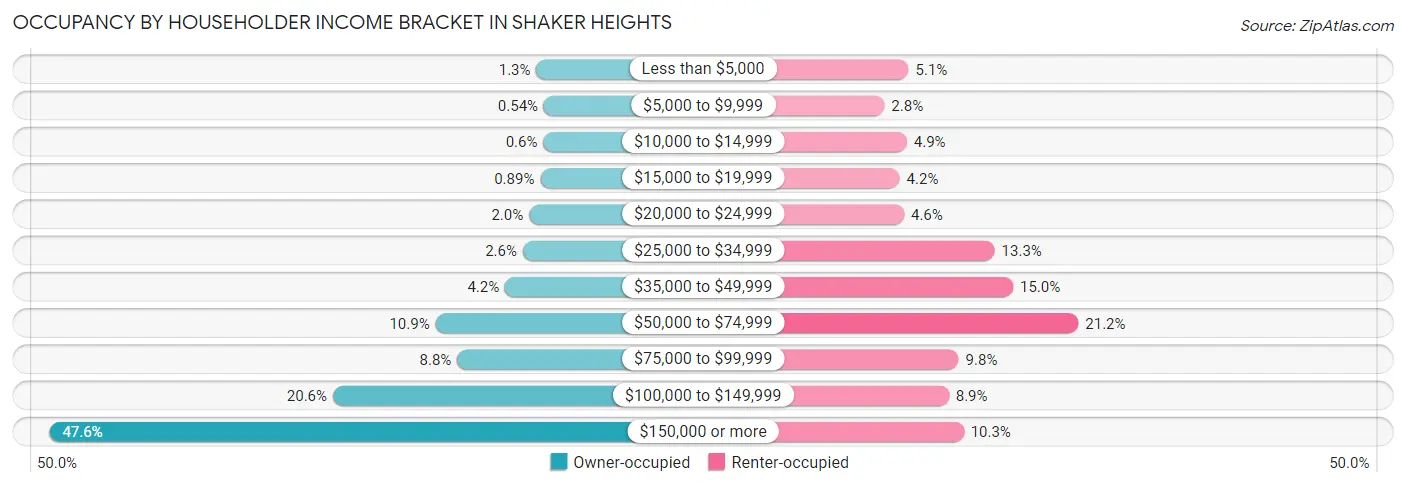
| Income Bracket | Owner-occupied | Renter-occupied |
| Less than $5,000 | 96 (1.3%) | 262 (5.1%) |
| $5,000 to $9,999 | 41 (0.5%) | 143 (2.8%) |
| $10,000 to $14,999 | 46 (0.6%) | 254 (4.9%) |
| $15,000 to $19,999 | 68 (0.9%) | 218 (4.2%) |
| $20,000 to $24,999 | 150 (2.0%) | 240 (4.6%) |
| $25,000 to $34,999 | 195 (2.5%) | 688 (13.3%) |
| $35,000 to $49,999 | 324 (4.2%) | 779 (15.0%) |
| $50,000 to $74,999 | 830 (10.9%) | 1,102 (21.2%) |
| $75,000 to $99,999 | 672 (8.8%) | 510 (9.8%) |
| $100,000 to $149,999 | 1,576 (20.6%) | 461 (8.9%) |
| $150,000 or more | 3,636 (47.6%) | 535 (10.3%) |
| Total | 7,634 (100.0%) | 5,192 (100.0%) |
Monthly Housing Cost Tiers in Shaker Heights
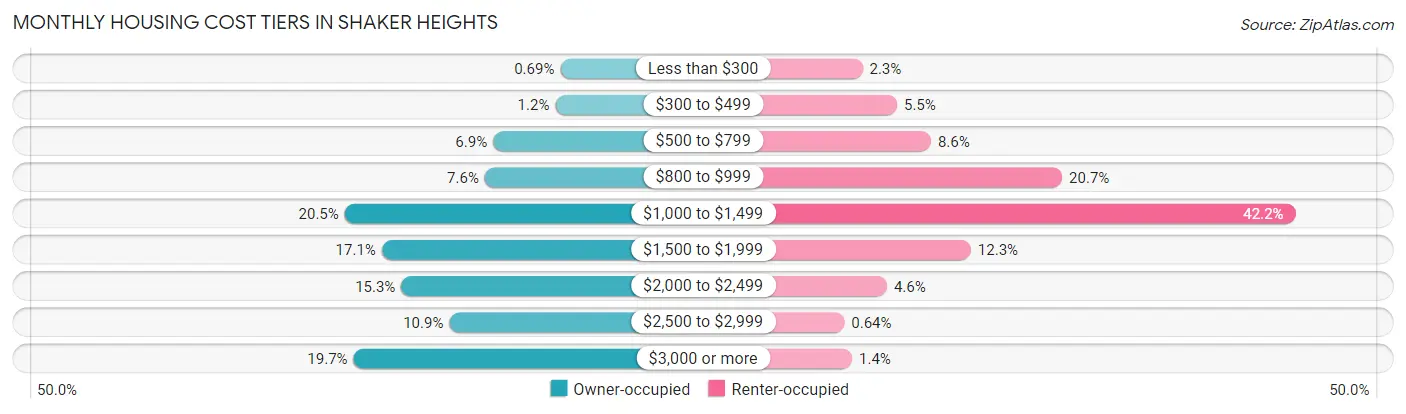
| Monthly Cost | Owner-occupied | Renter-occupied |
| Less than $300 | 53 (0.7%) | 120 (2.3%) |
| $300 to $499 | 88 (1.1%) | 285 (5.5%) |
| $500 to $799 | 525 (6.9%) | 447 (8.6%) |
| $800 to $999 | 583 (7.6%) | 1,074 (20.7%) |
| $1,000 to $1,499 | 1,568 (20.5%) | 2,189 (42.2%) |
| $1,500 to $1,999 | 1,308 (17.1%) | 638 (12.3%) |
| $2,000 to $2,499 | 1,170 (15.3%) | 237 (4.6%) |
| $2,500 to $2,999 | 833 (10.9%) | 33 (0.6%) |
| $3,000 or more | 1,506 (19.7%) | 70 (1.3%) |
| Total | 7,634 (100.0%) | 5,192 (100.0%) |
Physical Housing Characteristics in Shaker Heights
Housing Structures in Shaker Heights
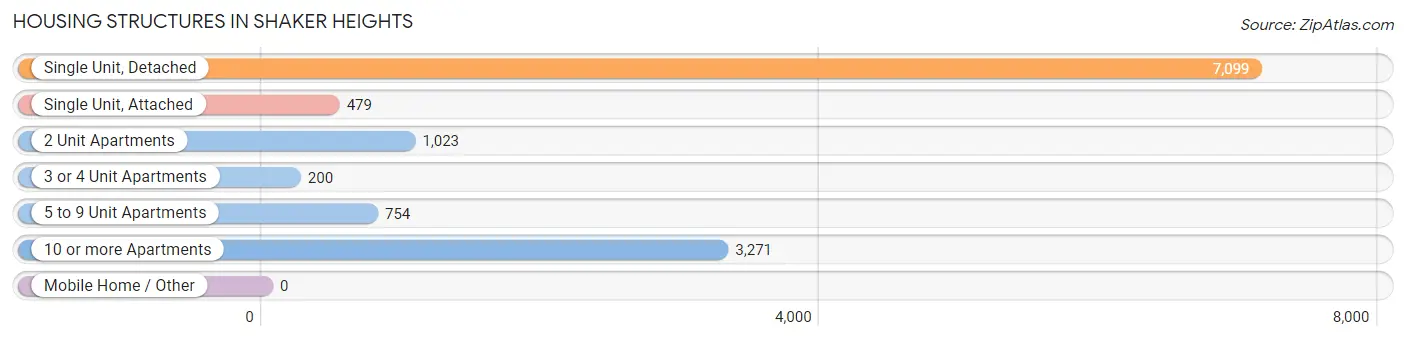
| Structure Type | # Housing Units | % Housing Units |
| Single Unit, Detached | 7,099 | 55.3% |
| Single Unit, Attached | 479 | 3.7% |
| 2 Unit Apartments | 1,023 | 8.0% |
| 3 or 4 Unit Apartments | 200 | 1.6% |
| 5 to 9 Unit Apartments | 754 | 5.9% |
| 10 or more Apartments | 3,271 | 25.5% |
| Mobile Home / Other | 0 | 0.0% |
| Total | 12,826 | 100.0% |
Housing Structures by Occupancy in Shaker Heights
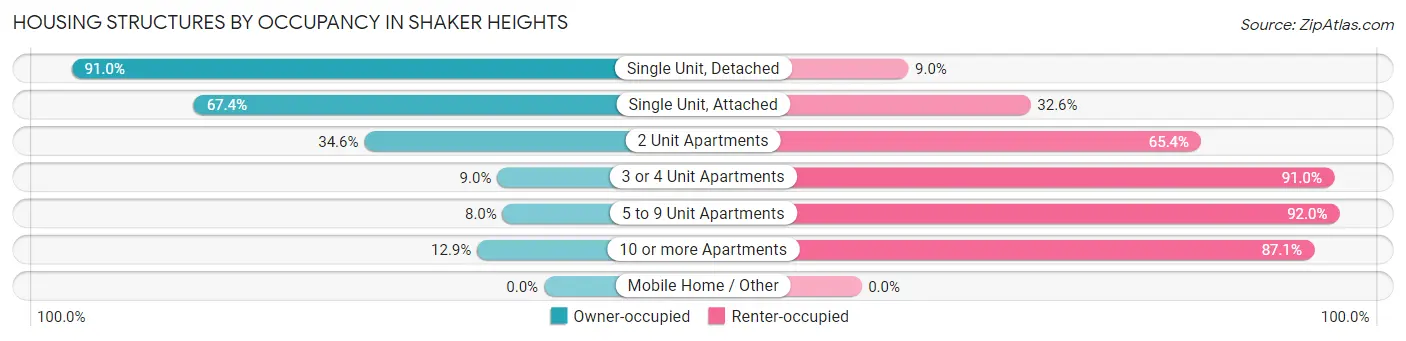
| Structure Type | Owner-occupied | Renter-occupied |
| Single Unit, Detached | 6,458 (91.0%) | 641 (9.0%) |
| Single Unit, Attached | 323 (67.4%) | 156 (32.6%) |
| 2 Unit Apartments | 354 (34.6%) | 669 (65.4%) |
| 3 or 4 Unit Apartments | 18 (9.0%) | 182 (91.0%) |
| 5 to 9 Unit Apartments | 60 (8.0%) | 694 (92.0%) |
| 10 or more Apartments | 421 (12.9%) | 2,850 (87.1%) |
| Mobile Home / Other | 0 (0.0%) | 0 (0.0%) |
| Total | 7,634 (59.5%) | 5,192 (40.5%) |
Housing Structures by Number of Rooms in Shaker Heights
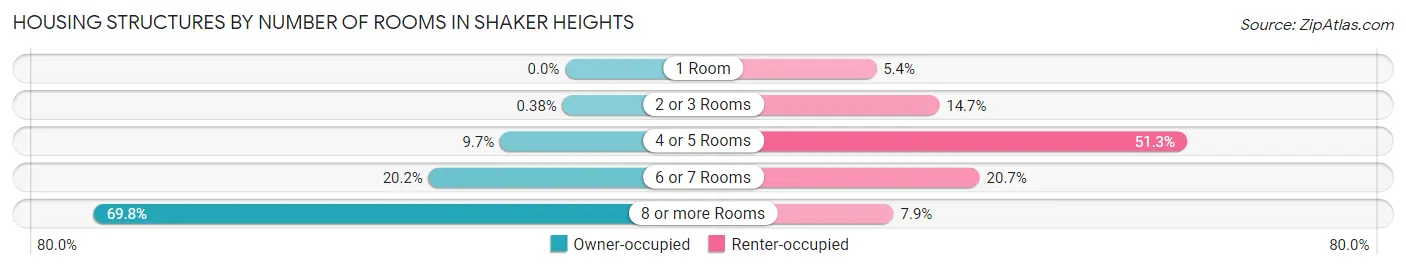
| Number of Rooms | Owner-occupied | Renter-occupied |
| 1 Room | 0 (0.0%) | 279 (5.4%) |
| 2 or 3 Rooms | 29 (0.4%) | 763 (14.7%) |
| 4 or 5 Rooms | 737 (9.7%) | 2,665 (51.3%) |
| 6 or 7 Rooms | 1,542 (20.2%) | 1,073 (20.7%) |
| 8 or more Rooms | 5,326 (69.8%) | 412 (7.9%) |
| Total | 7,634 (100.0%) | 5,192 (100.0%) |
Housing Structure by Heating Type in Shaker Heights
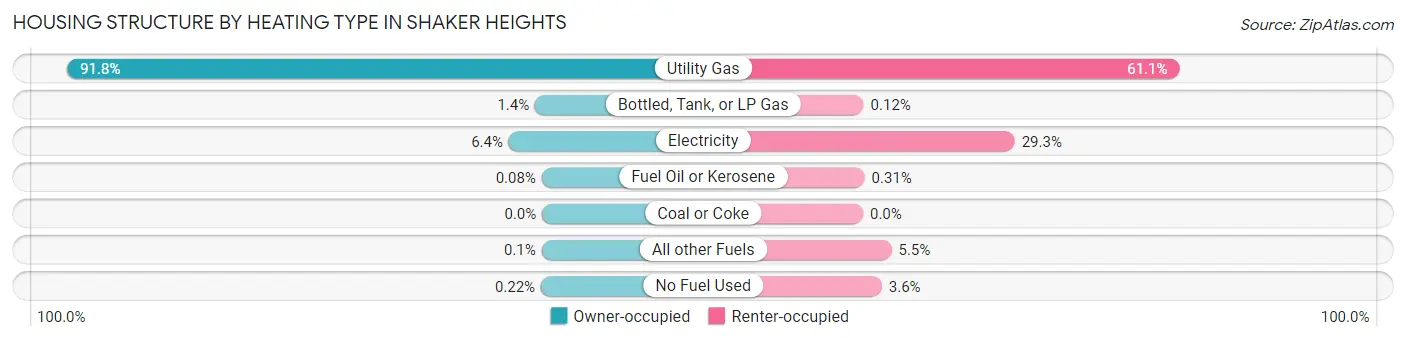
| Heating Type | Owner-occupied | Renter-occupied |
| Utility Gas | 7,007 (91.8%) | 3,173 (61.1%) |
| Bottled, Tank, or LP Gas | 104 (1.4%) | 6 (0.1%) |
| Electricity | 492 (6.4%) | 1,522 (29.3%) |
| Fuel Oil or Kerosene | 6 (0.1%) | 16 (0.3%) |
| Coal or Coke | 0 (0.0%) | 0 (0.0%) |
| All other Fuels | 8 (0.1%) | 286 (5.5%) |
| No Fuel Used | 17 (0.2%) | 189 (3.6%) |
| Total | 7,634 (100.0%) | 5,192 (100.0%) |
Household Vehicle Usage in Shaker Heights
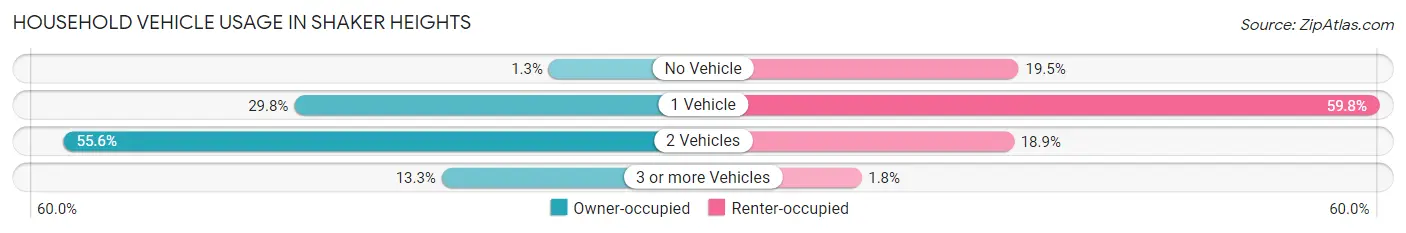
| Vehicles per Household | Owner-occupied | Renter-occupied |
| No Vehicle | 98 (1.3%) | 1,010 (19.5%) |
| 1 Vehicle | 2,275 (29.8%) | 3,105 (59.8%) |
| 2 Vehicles | 4,247 (55.6%) | 982 (18.9%) |
| 3 or more Vehicles | 1,014 (13.3%) | 95 (1.8%) |
| Total | 7,634 (100.0%) | 5,192 (100.0%) |
Real Estate & Mortgages in Shaker Heights
Real Estate and Mortgage Overview in Shaker Heights
| Characteristic | Without Mortgage | With Mortgage |
| Housing Units | 2,752 | 4,882 |
| Median Property Value | $247,900 | $281,500 |
| Median Household Income | $113,125 | $2,533 |
| Monthly Housing Costs | $1,246 | $1,397 |
| Real Estate Taxes | $8,703 | $0 |
Property Value by Mortgage Status in Shaker Heights
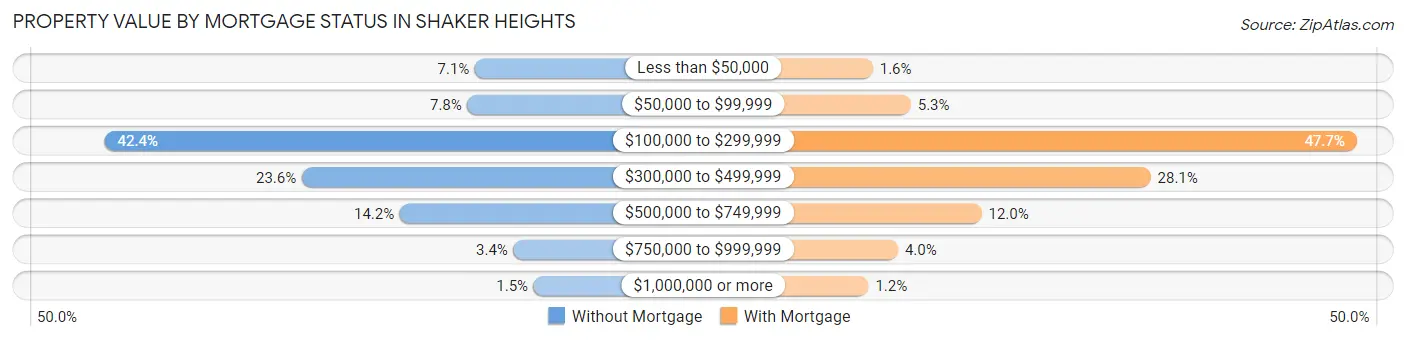
| Property Value | Without Mortgage | With Mortgage |
| Less than $50,000 | 195 (7.1%) | 80 (1.6%) |
| $50,000 to $99,999 | 215 (7.8%) | 257 (5.3%) |
| $100,000 to $299,999 | 1,166 (42.4%) | 2,330 (47.7%) |
| $300,000 to $499,999 | 649 (23.6%) | 1,372 (28.1%) |
| $500,000 to $749,999 | 392 (14.2%) | 586 (12.0%) |
| $750,000 to $999,999 | 94 (3.4%) | 197 (4.0%) |
| $1,000,000 or more | 41 (1.5%) | 60 (1.2%) |
| Total | 2,752 (100.0%) | 4,882 (100.0%) |
Household Income by Mortgage Status in Shaker Heights
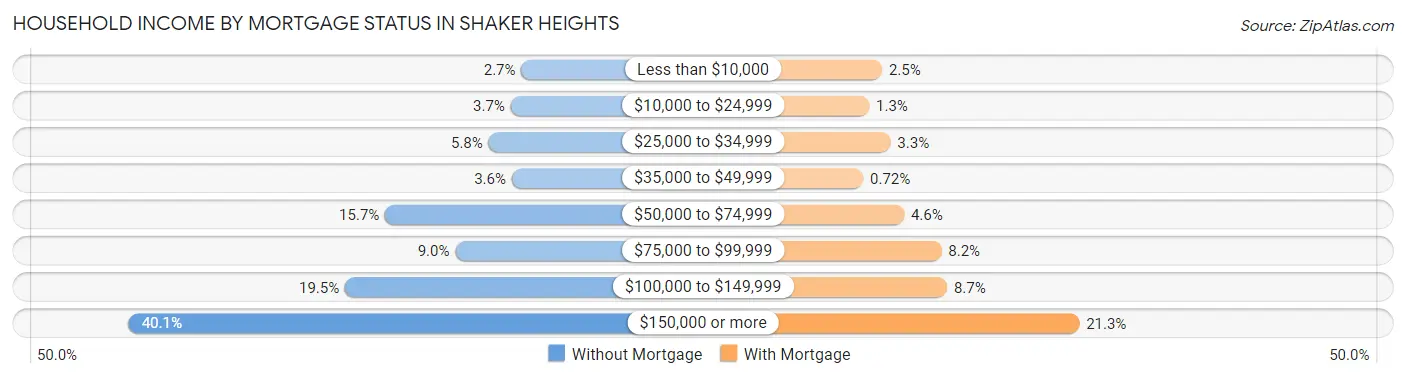
| Household Income | Without Mortgage | With Mortgage |
| Less than $10,000 | 74 (2.7%) | 123 (2.5%) |
| $10,000 to $24,999 | 102 (3.7%) | 63 (1.3%) |
| $25,000 to $34,999 | 160 (5.8%) | 162 (3.3%) |
| $35,000 to $49,999 | 99 (3.6%) | 35 (0.7%) |
| $50,000 to $74,999 | 431 (15.7%) | 225 (4.6%) |
| $75,000 to $99,999 | 247 (9.0%) | 399 (8.2%) |
| $100,000 to $149,999 | 536 (19.5%) | 425 (8.7%) |
| $150,000 or more | 1,103 (40.1%) | 1,040 (21.3%) |
| Total | 2,752 (100.0%) | 4,882 (100.0%) |
Property Value to Household Income Ratio in Shaker Heights
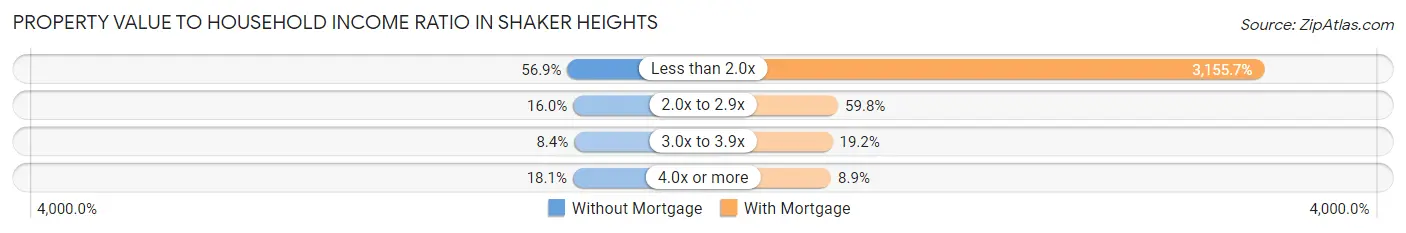
| Value-to-Income Ratio | Without Mortgage | With Mortgage |
| Less than 2.0x | 1,566 (56.9%) | 154,063 (3,155.7%) |
| 2.0x to 2.9x | 439 (16.0%) | 2,919 (59.8%) |
| 3.0x to 3.9x | 231 (8.4%) | 938 (19.2%) |
| 4.0x or more | 497 (18.1%) | 432 (8.8%) |
| Total | 2,752 (100.0%) | 4,882 (100.0%) |
Real Estate Taxes by Mortgage Status in Shaker Heights
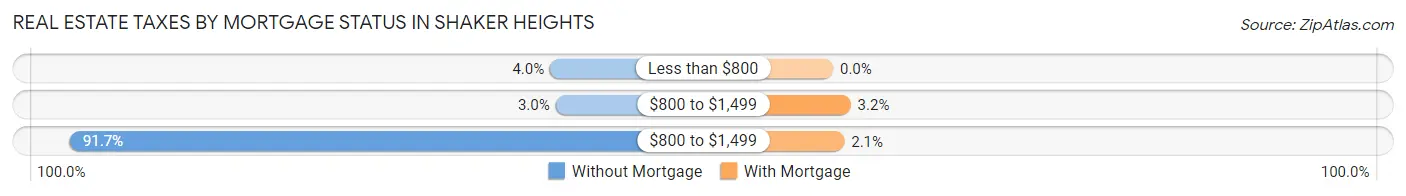
| Property Taxes | Without Mortgage | With Mortgage |
| Less than $800 | 111 (4.0%) | 0 (0.0%) |
| $800 to $1,499 | 83 (3.0%) | 157 (3.2%) |
| $800 to $1,499 | 2,524 (91.7%) | 100 (2.1%) |
| Total | 2,752 (100.0%) | 4,882 (100.0%) |
Health & Disability in Shaker Heights
Health Insurance Coverage by Age in Shaker Heights
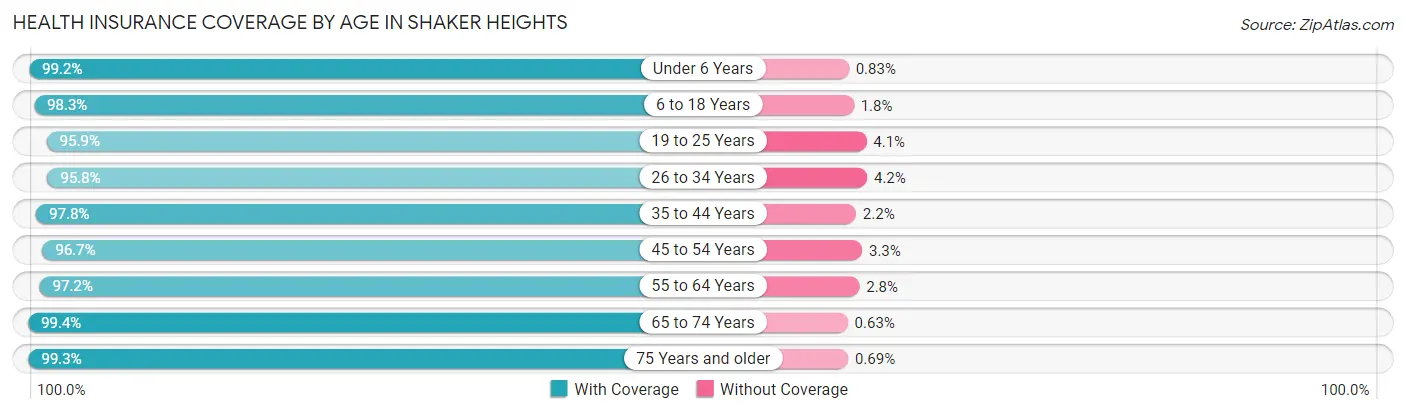
| Age Bracket | With Coverage | Without Coverage |
| Under 6 Years | 2,146 (99.2%) | 18 (0.8%) |
| 6 to 18 Years | 4,613 (98.3%) | 82 (1.8%) |
| 19 to 25 Years | 1,938 (95.9%) | 83 (4.1%) |
| 26 to 34 Years | 2,890 (95.8%) | 128 (4.2%) |
| 35 to 44 Years | 3,850 (97.8%) | 85 (2.2%) |
| 45 to 54 Years | 3,597 (96.7%) | 123 (3.3%) |
| 55 to 64 Years | 3,121 (97.2%) | 90 (2.8%) |
| 65 to 74 Years | 3,288 (99.4%) | 21 (0.6%) |
| 75 Years and older | 2,885 (99.3%) | 20 (0.7%) |
| Total | 28,328 (97.8%) | 650 (2.2%) |
Health Insurance Coverage by Citizenship Status in Shaker Heights
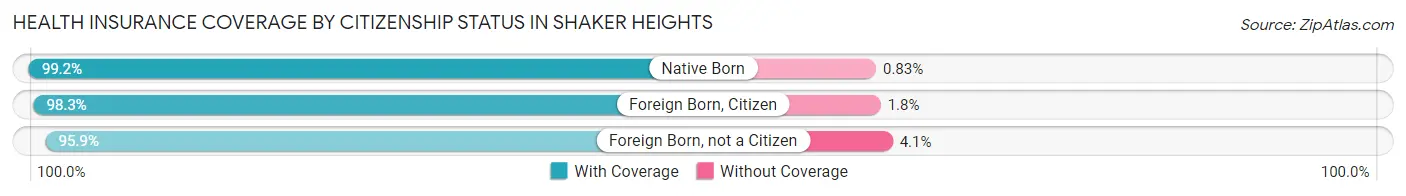
| Citizenship Status | With Coverage | Without Coverage |
| Native Born | 2,146 (99.2%) | 18 (0.8%) |
| Foreign Born, Citizen | 4,613 (98.3%) | 82 (1.8%) |
| Foreign Born, not a Citizen | 1,938 (95.9%) | 83 (4.1%) |
Health Insurance Coverage by Household Income in Shaker Heights
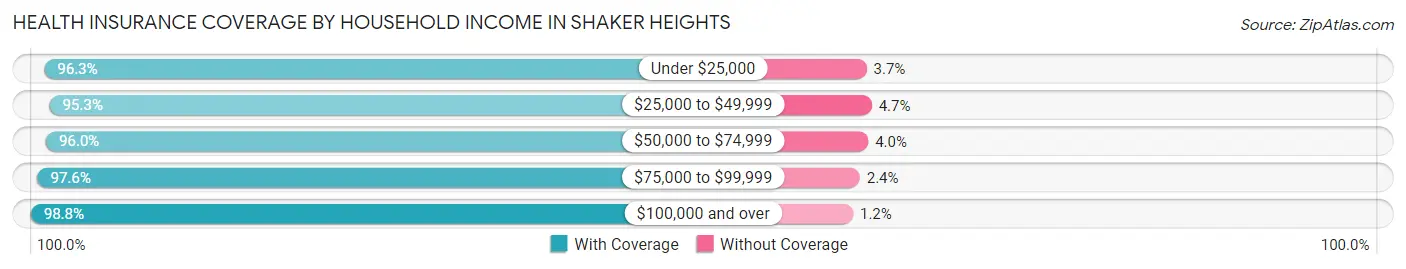
| Household Income | With Coverage | Without Coverage |
| Under $25,000 | 2,390 (96.3%) | 92 (3.7%) |
| $25,000 to $49,999 | 3,065 (95.3%) | 150 (4.7%) |
| $50,000 to $74,999 | 3,325 (96.0%) | 139 (4.0%) |
| $75,000 to $99,999 | 2,811 (97.6%) | 70 (2.4%) |
| $100,000 and over | 16,696 (98.8%) | 198 (1.2%) |
Public vs Private Health Insurance Coverage by Age in Shaker Heights
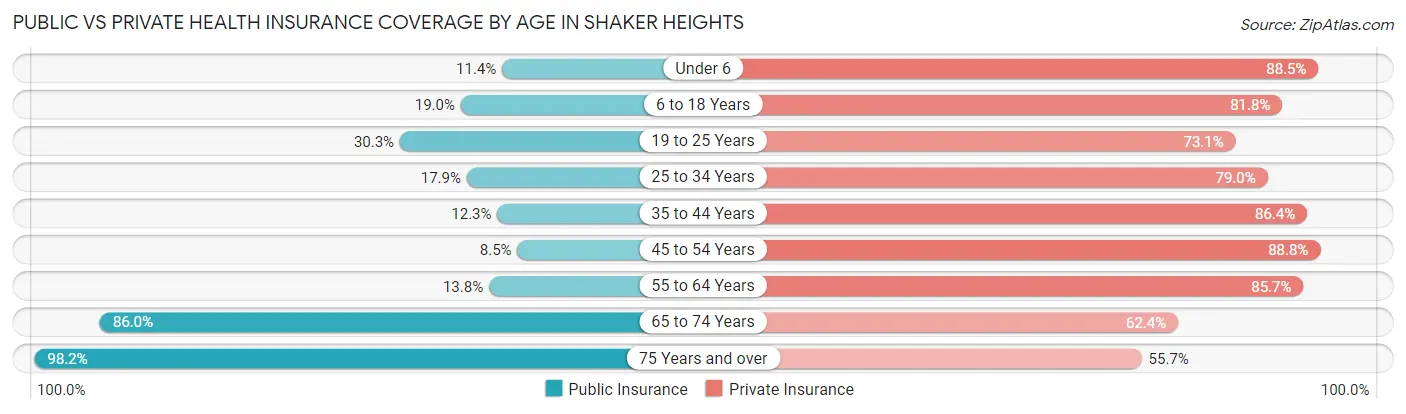
| Age Bracket | Public Insurance | Private Insurance |
| Under 6 | 246 (11.4%) | 1,914 (88.4%) |
| 6 to 18 Years | 894 (19.0%) | 3,838 (81.8%) |
| 19 to 25 Years | 613 (30.3%) | 1,477 (73.1%) |
| 25 to 34 Years | 541 (17.9%) | 2,385 (79.0%) |
| 35 to 44 Years | 482 (12.2%) | 3,398 (86.4%) |
| 45 to 54 Years | 317 (8.5%) | 3,303 (88.8%) |
| 55 to 64 Years | 443 (13.8%) | 2,751 (85.7%) |
| 65 to 74 Years | 2,847 (86.0%) | 2,065 (62.4%) |
| 75 Years and over | 2,852 (98.2%) | 1,617 (55.7%) |
| Total | 9,235 (31.9%) | 22,748 (78.5%) |
Disability Status by Sex by Age in Shaker Heights
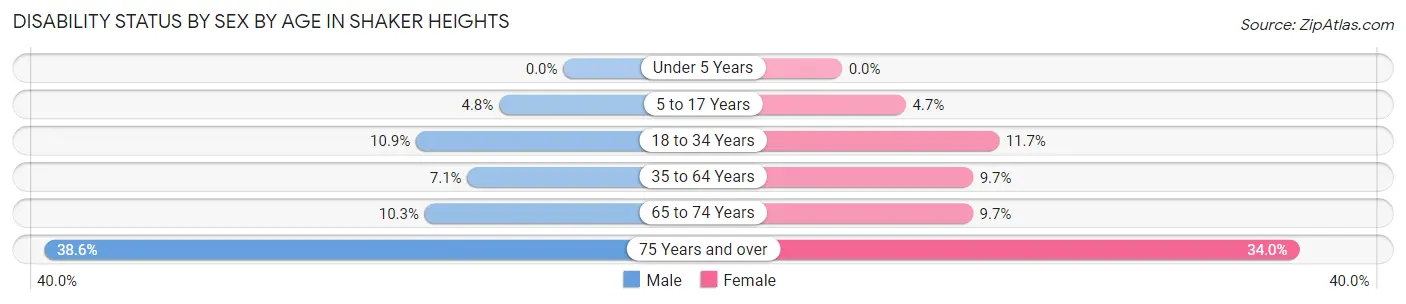
| Age Bracket | Male | Female |
| Under 5 Years | 0 (0.0%) | 0 (0.0%) |
| 5 to 17 Years | 106 (4.8%) | 119 (4.7%) |
| 18 to 34 Years | 276 (10.9%) | 326 (11.7%) |
| 35 to 64 Years | 351 (7.1%) | 577 (9.7%) |
| 65 to 74 Years | 155 (10.3%) | 175 (9.7%) |
| 75 Years and over | 413 (38.6%) | 623 (34.0%) |
Disability Class by Sex by Age in Shaker Heights
Disability Class: Hearing Difficulty
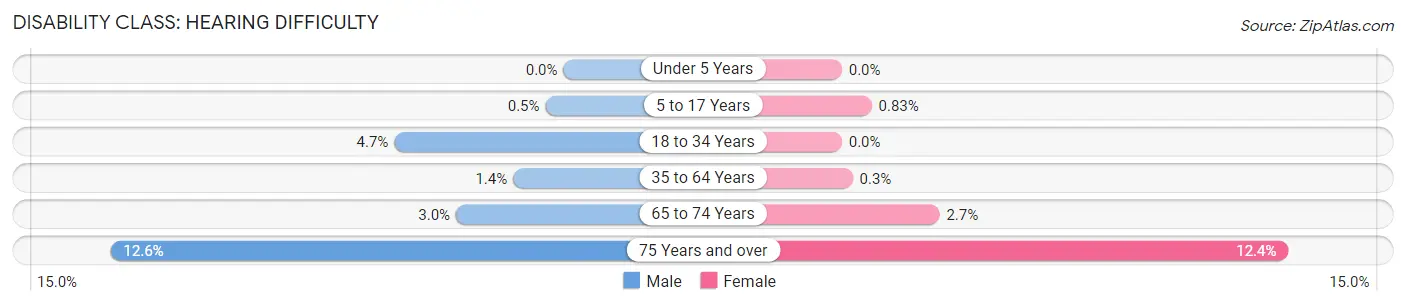
| Age Bracket | Male | Female |
| Under 5 Years | 0 (0.0%) | 0 (0.0%) |
| 5 to 17 Years | 11 (0.5%) | 21 (0.8%) |
| 18 to 34 Years | 119 (4.7%) | 0 (0.0%) |
| 35 to 64 Years | 69 (1.4%) | 18 (0.3%) |
| 65 to 74 Years | 45 (3.0%) | 49 (2.7%) |
| 75 Years and over | 135 (12.6%) | 228 (12.4%) |
Disability Class: Vision Difficulty
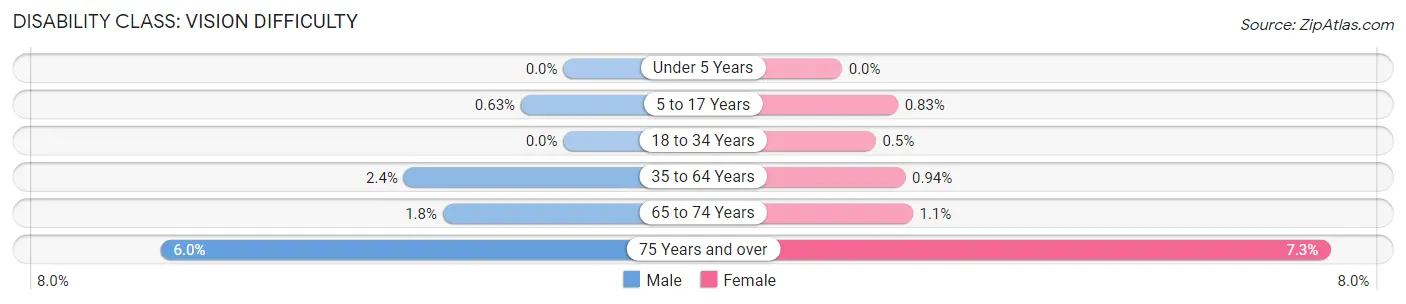
| Age Bracket | Male | Female |
| Under 5 Years | 0 (0.0%) | 0 (0.0%) |
| 5 to 17 Years | 14 (0.6%) | 21 (0.8%) |
| 18 to 34 Years | 0 (0.0%) | 14 (0.5%) |
| 35 to 64 Years | 117 (2.4%) | 56 (0.9%) |
| 65 to 74 Years | 27 (1.8%) | 19 (1.1%) |
| 75 Years and over | 64 (6.0%) | 133 (7.2%) |
Disability Class: Cognitive Difficulty
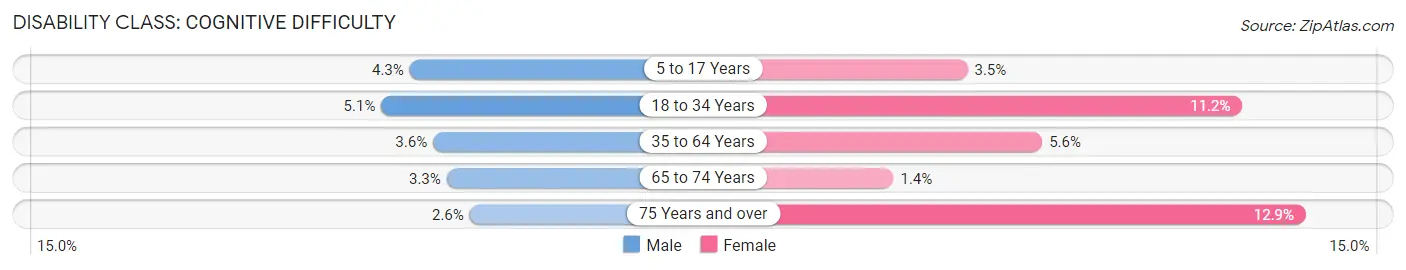
| Age Bracket | Male | Female |
| 5 to 17 Years | 95 (4.3%) | 88 (3.5%) |
| 18 to 34 Years | 128 (5.1%) | 312 (11.2%) |
| 35 to 64 Years | 179 (3.6%) | 331 (5.6%) |
| 65 to 74 Years | 49 (3.3%) | 26 (1.4%) |
| 75 Years and over | 28 (2.6%) | 237 (12.9%) |
Disability Class: Ambulatory Difficulty
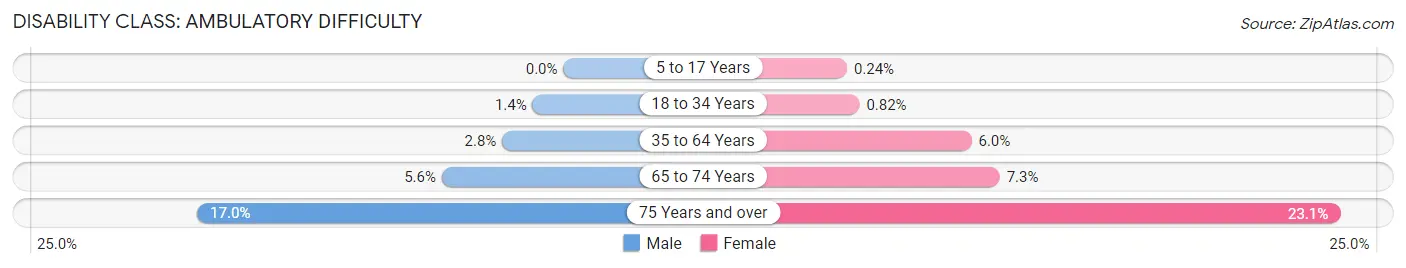
| Age Bracket | Male | Female |
| 5 to 17 Years | 0 (0.0%) | 6 (0.2%) |
| 18 to 34 Years | 36 (1.4%) | 23 (0.8%) |
| 35 to 64 Years | 140 (2.8%) | 357 (6.0%) |
| 65 to 74 Years | 85 (5.6%) | 132 (7.3%) |
| 75 Years and over | 182 (17.0%) | 424 (23.1%) |
Disability Class: Self-Care Difficulty
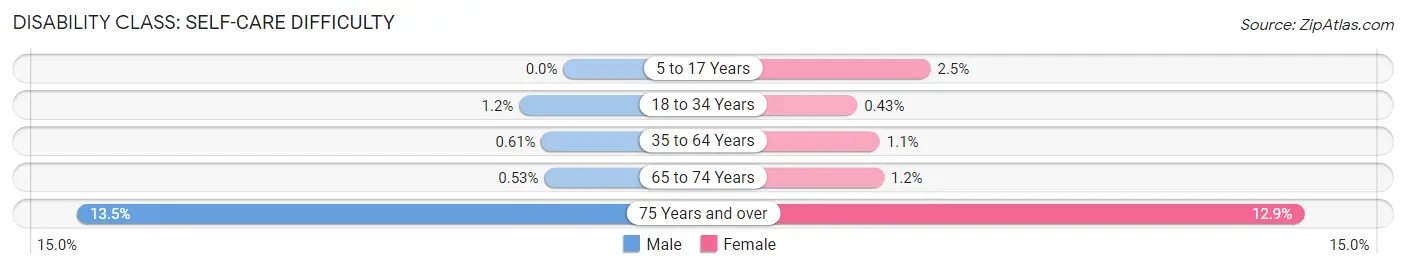
| Age Bracket | Male | Female |
| 5 to 17 Years | 0 (0.0%) | 62 (2.5%) |
| 18 to 34 Years | 31 (1.2%) | 12 (0.4%) |
| 35 to 64 Years | 30 (0.6%) | 63 (1.1%) |
| 65 to 74 Years | 8 (0.5%) | 21 (1.2%) |
| 75 Years and over | 145 (13.5%) | 236 (12.9%) |
Technology Access in Shaker Heights
Computing Device Access in Shaker Heights
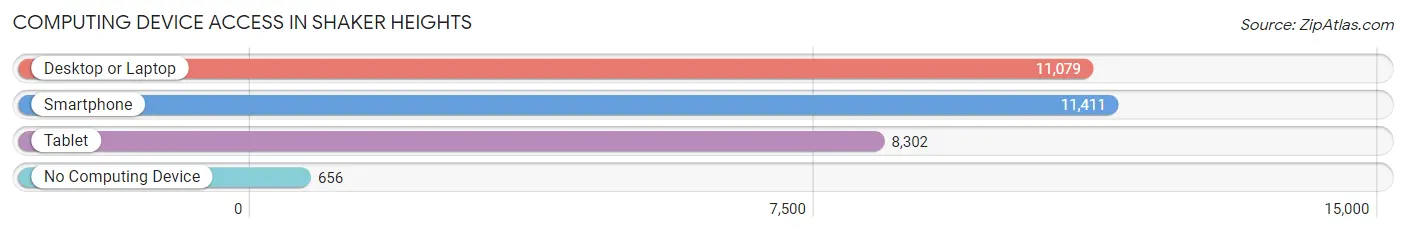
| Device Type | # Households | % Households |
| Desktop or Laptop | 11,079 | 86.4% |
| Smartphone | 11,411 | 89.0% |
| Tablet | 8,302 | 64.7% |
| No Computing Device | 656 | 5.1% |
| Total | 12,826 | 100.0% |
Internet Access in Shaker Heights
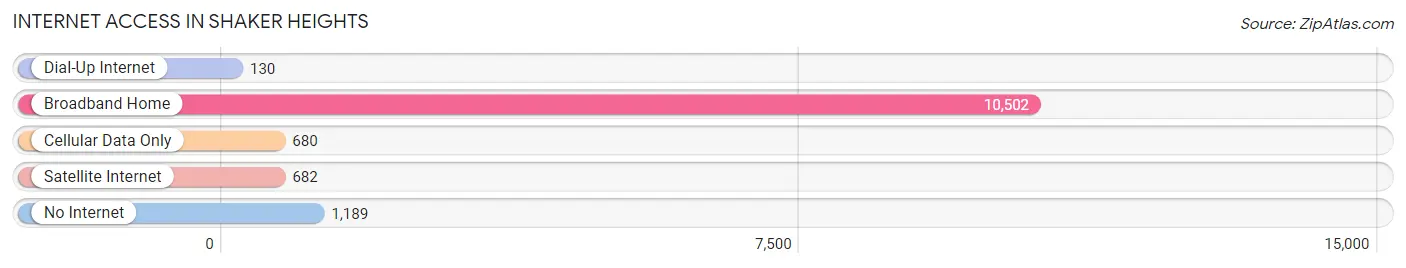
| Internet Type | # Households | % Households |
| Dial-Up Internet | 130 | 1.0% |
| Broadband Home | 10,502 | 81.9% |
| Cellular Data Only | 680 | 5.3% |
| Satellite Internet | 682 | 5.3% |
| No Internet | 1,189 | 9.3% |
| Total | 12,826 | 100.0% |
Shaker Heights Summary
Shaker Heights is a city located in Cuyahoga County, Ohio, United States. It is an inner-ring suburb of Cleveland, located approximately 10 miles east of downtown. As of the 2010 census, the city had a total population of 28,448.
History
Shaker Heights was founded in 1912 by members of the North Union Shakers, a religious sect that had settled in the area in 1822. The Shakers had a strong belief in communal living and self-sufficiency, and the city was designed to reflect their values. The city was planned with wide streets, ample green space, and a variety of housing types. The city was also designed to be racially and economically integrated, with a variety of housing types and income levels.
The city was incorporated in 1912, and the first mayor was elected in 1913. The city quickly grew, and by 1920, the population had reached over 10,000. The city continued to grow throughout the 20th century, and by the 2000 census, the population had reached 28,448.
Geography
Shaker Heights is located in Cuyahoga County, Ohio, approximately 10 miles east of downtown Cleveland. The city is situated on a plateau, with an elevation of 830 feet above sea level. The city covers an area of 8.3 square miles, and is bordered by Cleveland Heights to the north, University Heights to the east, Beachwood to the south, and Cleveland to the west.
The city is divided into four distinct neighborhoods: North Shaker, South Shaker, East Shaker, and West Shaker. Each neighborhood has its own distinct character and amenities.
Economy
Shaker Heights is home to a variety of businesses and industries. The city is home to several corporate headquarters, including the Eaton Corporation, KeyCorp, and the Cleveland Clinic. The city is also home to a number of retail and service businesses, including restaurants, banks, and medical offices.
The city is also home to a number of educational institutions, including the University of Cleveland, Case Western Reserve University, and Cleveland State University.
Demographics
As of the 2010 census, the population of Shaker Heights was 28,448. The racial makeup of the city was 79.2% White, 14.3% African American, 0.2% Native American, 3.2% Asian, 0.1% Pacific Islander, and 2.9% from other races. Hispanic or Latino of any race were 3.7% of the population.
The median household income in Shaker Heights was $76,837, and the median family income was $90,945. The per capita income was $41,945. About 5.2% of families and 7.2% of the population were below the poverty line.
Shaker Heights is a diverse city, with a variety of cultures and backgrounds represented. The city is home to a variety of religious institutions, including churches, synagogues, and mosques. The city is also home to a variety of cultural institutions, including the Cleveland Museum of Art, the Cleveland Orchestra, and the Cleveland Play House.
Common Questions
What is Per Capita Income in Shaker Heights?
Per Capita income in Shaker Heights is $69,086.
What is the Median Family Income in Shaker Heights?
Median Family Income in Shaker Heights is $128,048.
What is the Median Household income in Shaker Heights?
Median Household Income in Shaker Heights is $96,494.
What is Income or Wage Gap in Shaker Heights?
Income or Wage Gap in Shaker Heights is 41.3%.
Women in Shaker Heights earn 58.7 cents for every dollar earned by a man.
What is Family Income Deficit in Shaker Heights?
Family Income Deficit in Shaker Heights is $8,637.
Families that are below poverty line in Shaker Heights earn $8,637 less on average than the poverty threshold level.
What is Inequality or Gini Index in Shaker Heights?
Inequality or Gini Index in Shaker Heights is 0.54.
What is the Total Population of Shaker Heights?
Total Population of Shaker Heights is 29,157.
What is the Total Male Population of Shaker Heights?
Total Male Population of Shaker Heights is 13,373.
What is the Total Female Population of Shaker Heights?
Total Female Population of Shaker Heights is 15,784.
What is the Ratio of Males per 100 Females in Shaker Heights?
There are 84.73 Males per 100 Females in Shaker Heights.
What is the Ratio of Females per 100 Males in Shaker Heights?
There are 118.03 Females per 100 Males in Shaker Heights.
What is the Median Population Age in Shaker Heights?
Median Population Age in Shaker Heights is 41.1 Years.
What is the Average Family Size in Shaker Heights
Average Family Size in Shaker Heights is 3.0 People.
What is the Average Household Size in Shaker Heights
Average Household Size in Shaker Heights is 2.3 People.
How Large is the Labor Force in Shaker Heights?
There are 15,461 People in the Labor Forcein in Shaker Heights.
What is the Percentage of People in the Labor Force in Shaker Heights?
66.2% of People are in the Labor Force in Shaker Heights.
What is the Unemployment Rate in Shaker Heights?
Unemployment Rate in Shaker Heights is 5.1%.