Loveland Park, OH Map & Demographics
Loveland Park Map
Loveland Park Overview
$77,546
PER CAPITA INCOME
$135,500
AVG FAMILY INCOME
$119,547
AVG HOUSEHOLD INCOME
15.9%
WAGE / INCOME GAP [ % ]
84.1¢/ $1
WAGE / INCOME GAP [ $ ]
0.43
INEQUALITY / GINI INDEX
1,824
TOTAL POPULATION
889
MALE POPULATION
935
FEMALE POPULATION
95.08
MALES / 100 FEMALES
105.17
FEMALES / 100 MALES
53.0
MEDIAN AGE
2.7
AVG FAMILY SIZE
2.5
AVG HOUSEHOLD SIZE
1,098
LABOR FORCE [ PEOPLE ]
70.9%
PERCENT IN LABOR FORCE
Income in Loveland Park
Income Overview in Loveland Park
Per Capita Income in Loveland Park is $77,546, while median incomes of families and households are $135,500 and $119,547 respectively.
| Characteristic | Number | Measure |
| Per Capita Income | 1,824 | $77,546 |
| Median Family Income | 606 | $135,500 |
| Mean Family Income | 606 | $213,406 |
| Median Household Income | 733 | $119,547 |
| Mean Household Income | 733 | $193,027 |
| Income Deficit | 606 | $0 |
| Wage / Income Gap (%) | 1,824 | 15.90% |
| Wage / Income Gap ($) | 1,824 | 84.10¢ per $1 |
| Gini / Inequality Index | 1,824 | 0.43 |
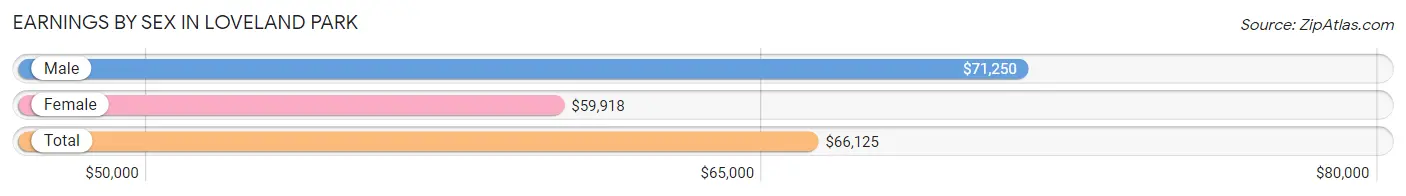
Earnings by Sex in Loveland Park
Average Earnings in Loveland Park are $66,125, $71,250 for men and $59,918 for women, a difference of 15.9%.
| Sex | Number | Average Earnings |
| Male | 642 (56.5%) | $71,250 |
| Female | 495 (43.5%) | $59,918 |
| Total | 1,137 (100.0%) | $66,125 |
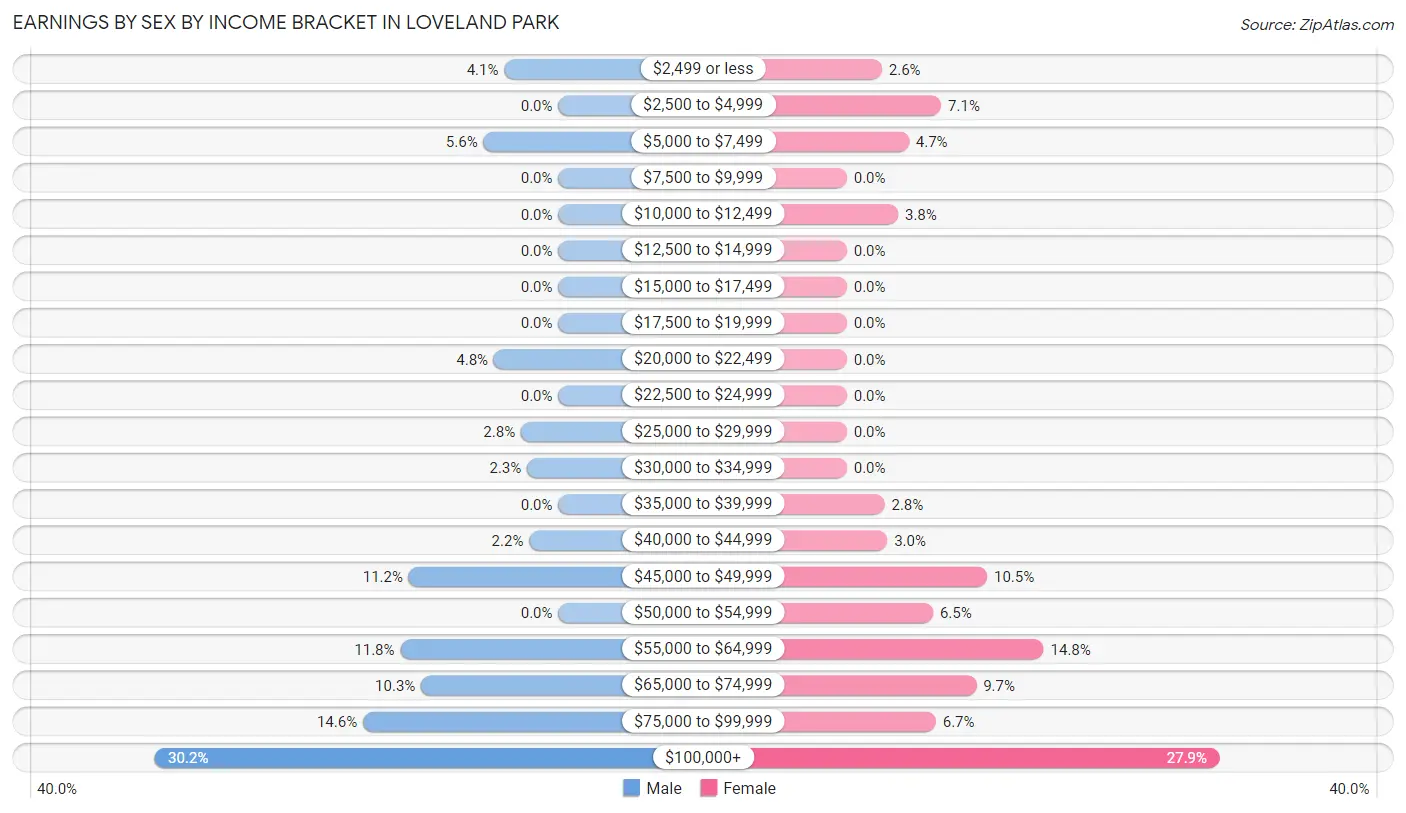
Earnings by Sex by Income Bracket in Loveland Park
The most common earnings brackets in Loveland Park are $100,000+ for men (194 | 30.2%) and $100,000+ for women (138 | 27.9%).
| Income | Male | Female |
| $2,499 or less | 26 (4.1%) | 13 (2.6%) |
| $2,500 to $4,999 | 0 (0.0%) | 35 (7.1%) |
| $5,000 to $7,499 | 36 (5.6%) | 23 (4.6%) |
| $7,500 to $9,999 | 0 (0.0%) | 0 (0.0%) |
| $10,000 to $12,499 | 0 (0.0%) | 19 (3.8%) |
| $12,500 to $14,999 | 0 (0.0%) | 0 (0.0%) |
| $15,000 to $17,499 | 0 (0.0%) | 0 (0.0%) |
| $17,500 to $19,999 | 0 (0.0%) | 0 (0.0%) |
| $20,000 to $22,499 | 31 (4.8%) | 0 (0.0%) |
| $22,500 to $24,999 | 0 (0.0%) | 0 (0.0%) |
| $25,000 to $29,999 | 18 (2.8%) | 0 (0.0%) |
| $30,000 to $34,999 | 15 (2.3%) | 0 (0.0%) |
| $35,000 to $39,999 | 0 (0.0%) | 14 (2.8%) |
| $40,000 to $44,999 | 14 (2.2%) | 15 (3.0%) |
| $45,000 to $49,999 | 72 (11.2%) | 52 (10.5%) |
| $50,000 to $54,999 | 0 (0.0%) | 32 (6.5%) |
| $55,000 to $64,999 | 76 (11.8%) | 73 (14.7%) |
| $65,000 to $74,999 | 66 (10.3%) | 48 (9.7%) |
| $75,000 to $99,999 | 94 (14.6%) | 33 (6.7%) |
| $100,000+ | 194 (30.2%) | 138 (27.9%) |
| Total | 642 (100.0%) | 495 (100.0%) |
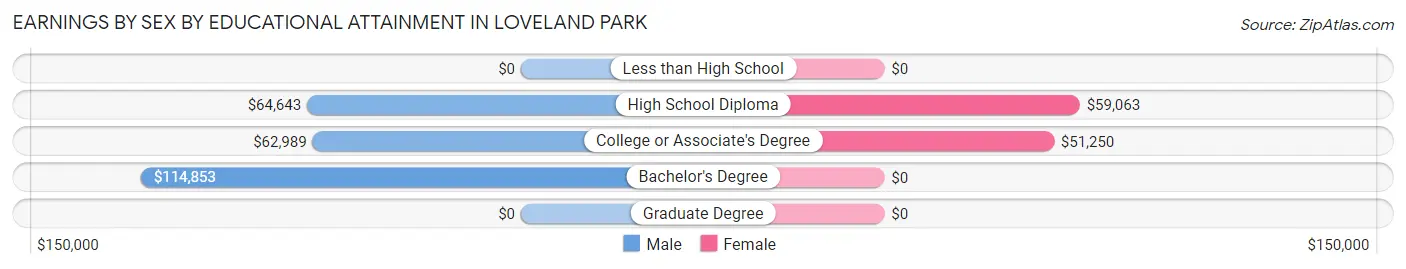
Earnings by Sex by Educational Attainment in Loveland Park
Average earnings in Loveland Park are $89,886 for men and $63,333 for women, a difference of 29.5%. Men with an educational attainment of bachelor's degree enjoy the highest average annual earnings of $114,853, while those with college or associate's degree education earn the least with $62,989. Women with an educational attainment of high school diploma earn the most with the average annual earnings of $59,063, while those with college or associate's degree education have the smallest earnings of $51,250.
| Educational Attainment | Male Income | Female Income |
| Less than High School | - | - |
| High School Diploma | $64,643 | $59,063 |
| College or Associate's Degree | $62,989 | $51,250 |
| Bachelor's Degree | $114,853 | $0 |
| Graduate Degree | - | - |
| Total | $89,886 | $63,333 |
Family Income in Loveland Park
Family Income Brackets in Loveland Park
According to the Loveland Park family income data, there are 199 families falling into the $100,000 to $149,999 income range, which is the most common income bracket and makes up 32.8% of all families.
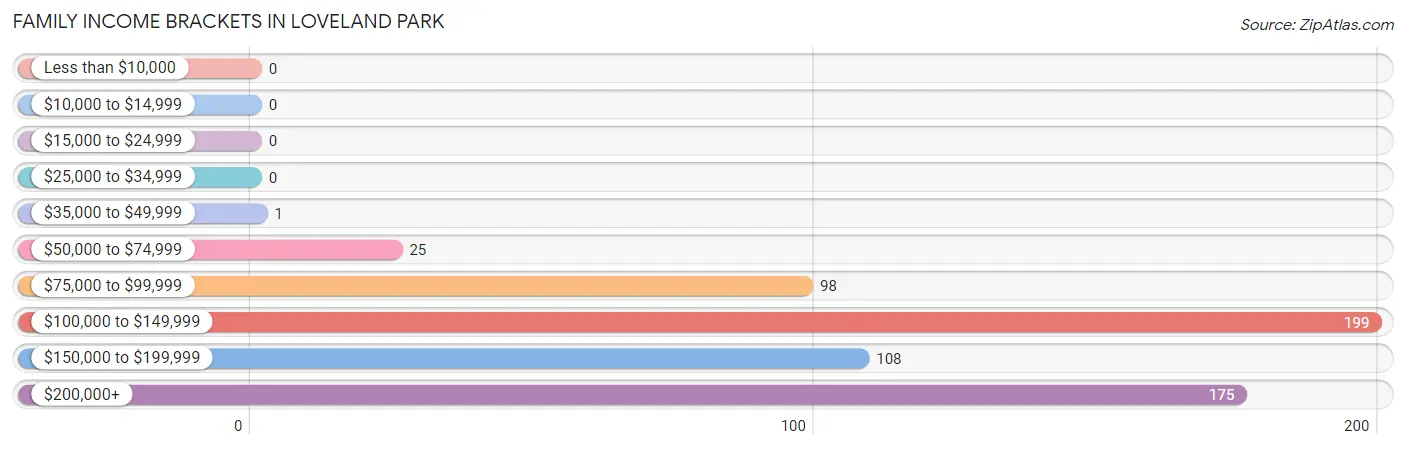
| Income Bracket | # Families | % Families |
| Less than $10,000 | 0 | 0.0% |
| $10,000 to $14,999 | 0 | 0.0% |
| $15,000 to $24,999 | 0 | 0.0% |
| $25,000 to $34,999 | 0 | 0.0% |
| $35,000 to $49,999 | 1 | 0.2% |
| $50,000 to $74,999 | 25 | 4.1% |
| $75,000 to $99,999 | 98 | 16.2% |
| $100,000 to $149,999 | 199 | 32.8% |
| $150,000 to $199,999 | 108 | 17.8% |
| $200,000+ | 175 | 28.9% |
Family Income by Famaliy Size in Loveland Park
5-person families (65 | 10.7%) account for the highest median family income in Loveland Park with $250,001 per family, while 3-person families (187 | 30.9%) have the highest median income of $63,274 per family member.
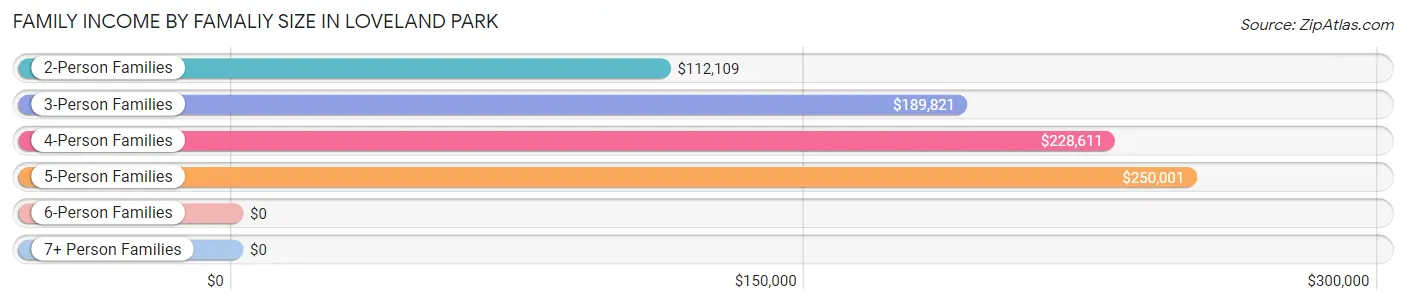
| Income Bracket | # Families | Median Income |
| 2-Person Families | 316 (52.1%) | $112,109 |
| 3-Person Families | 187 (30.9%) | $189,821 |
| 4-Person Families | 38 (6.3%) | $228,611 |
| 5-Person Families | 65 (10.7%) | $250,001 |
| 6-Person Families | 0 (0.0%) | $0 |
| 7+ Person Families | 0 (0.0%) | $0 |
| Total | 606 (100.0%) | $135,500 |
Family Income by Number of Earners in Loveland Park
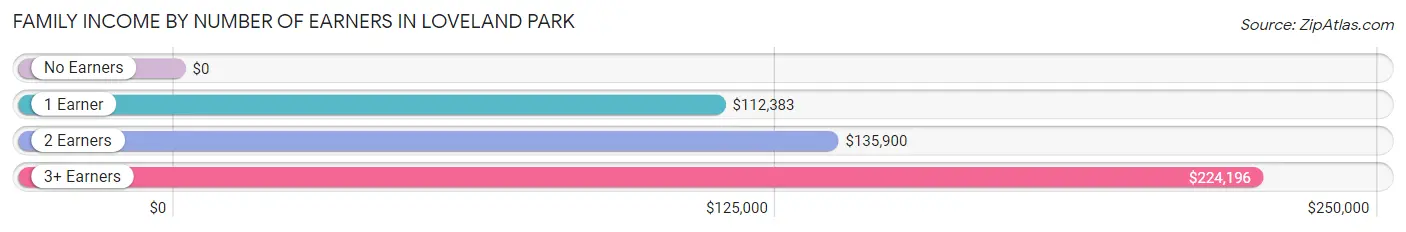
| Number of Earners | # Families | Median Income |
| No Earners | 31 (5.1%) | $0 |
| 1 Earner | 248 (40.9%) | $112,383 |
| 2 Earners | 218 (36.0%) | $135,900 |
| 3+ Earners | 109 (18.0%) | $224,196 |
| Total | 606 (100.0%) | $135,500 |
Household Income in Loveland Park
Household Income Brackets in Loveland Park
With 211 households falling in the category, the $200,000+ income range is the most frequent in Loveland Park, accounting for 28.8% of all households.
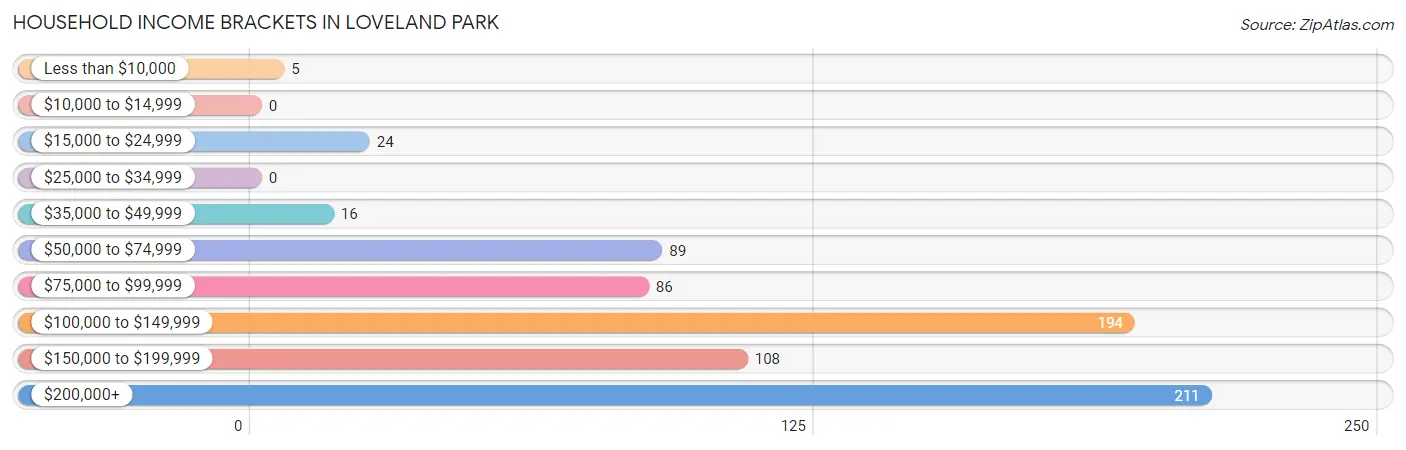
| Income Bracket | # Households | % Households |
| Less than $10,000 | 5 | 0.7% |
| $10,000 to $14,999 | 0 | 0.0% |
| $15,000 to $24,999 | 24 | 3.3% |
| $25,000 to $34,999 | 0 | 0.0% |
| $35,000 to $49,999 | 16 | 2.2% |
| $50,000 to $74,999 | 89 | 12.1% |
| $75,000 to $99,999 | 86 | 11.7% |
| $100,000 to $149,999 | 194 | 26.5% |
| $150,000 to $199,999 | 108 | 14.7% |
| $200,000+ | 211 | 28.8% |
Household Income by Householder Age in Loveland Park
The median household income in Loveland Park is $119,547, with the highest median household income of $187,893 found in the 45 to 64 years age bracket for the primary householder. A total of 431 households (58.8%) fall into this category.
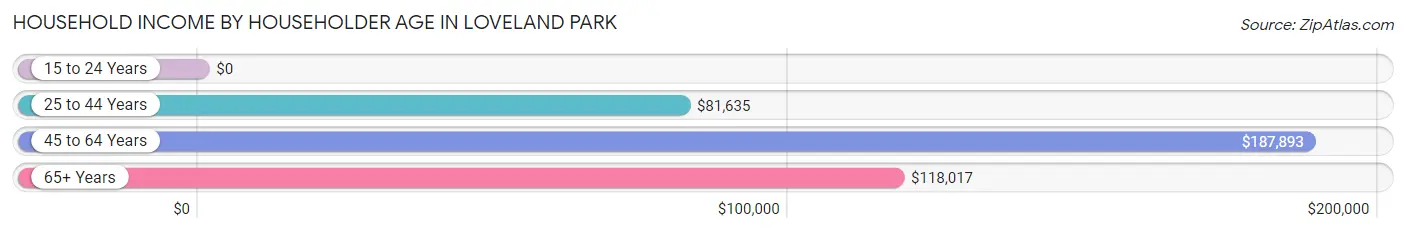
| Income Bracket | # Households | Median Income |
| 15 to 24 Years | 0 (0.0%) | $0 |
| 25 to 44 Years | 174 (23.7%) | $81,635 |
| 45 to 64 Years | 431 (58.8%) | $187,893 |
| 65+ Years | 128 (17.5%) | $118,017 |
| Total | 733 (100.0%) | $119,547 |
Poverty in Loveland Park
Income Below Poverty by Sex and Age in Loveland Park
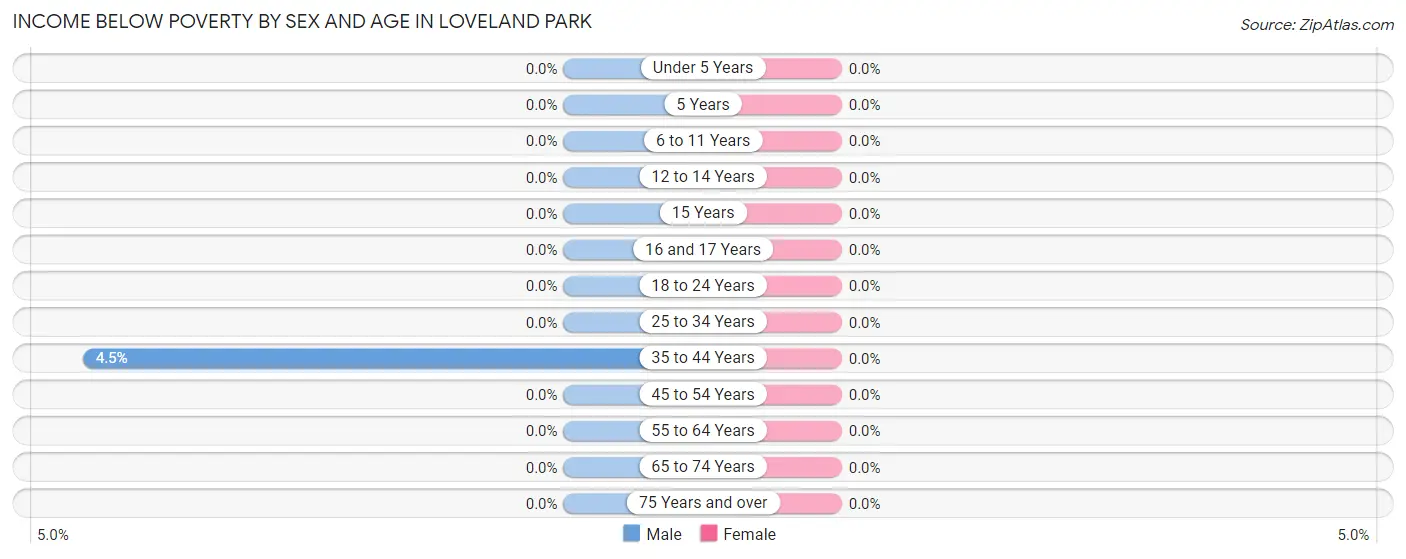
| Age Bracket | Male | Female |
| Under 5 Years | 0 (0.0%) | 0 (0.0%) |
| 5 Years | 0 (0.0%) | 0 (0.0%) |
| 6 to 11 Years | 0 (0.0%) | 0 (0.0%) |
| 12 to 14 Years | 0 (0.0%) | 0 (0.0%) |
| 15 Years | 0 (0.0%) | 0 (0.0%) |
| 16 and 17 Years | 0 (0.0%) | 0 (0.0%) |
| 18 to 24 Years | 0 (0.0%) | 0 (0.0%) |
| 25 to 34 Years | 0 (0.0%) | 0 (0.0%) |
| 35 to 44 Years | 5 (4.5%) | 0 (0.0%) |
| 45 to 54 Years | 0 (0.0%) | 0 (0.0%) |
| 55 to 64 Years | 0 (0.0%) | 0 (0.0%) |
| 65 to 74 Years | 0 (0.0%) | 0 (0.0%) |
| 75 Years and over | 0 (0.0%) | 0 (0.0%) |
| Total | 5 (0.6%) | 0 (0.0%) |
Income Above Poverty by Sex and Age in Loveland Park
According to the poverty statistics in Loveland Park, males aged under 5 years and females aged under 5 years are the age groups that are most secure financially, with 100.0% of males and 100.0% of females in these age groups living above the poverty line.
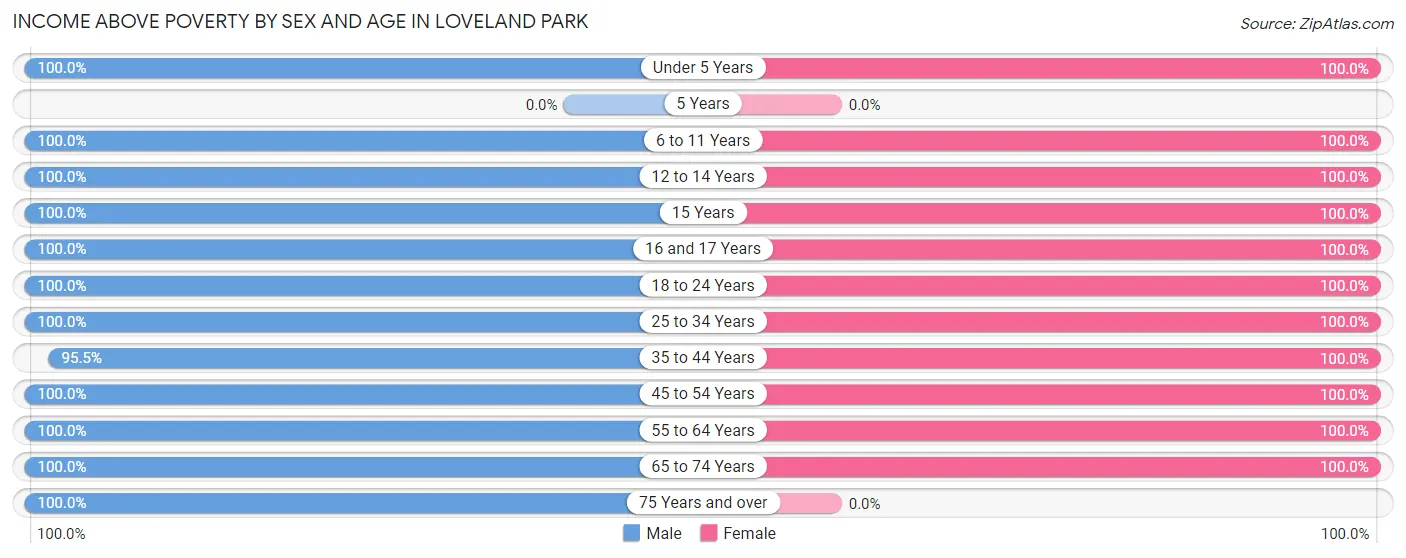
| Age Bracket | Male | Female |
| Under 5 Years | 20 (100.0%) | 105 (100.0%) |
| 5 Years | 0 (0.0%) | 0 (0.0%) |
| 6 to 11 Years | 18 (100.0%) | 7 (100.0%) |
| 12 to 14 Years | 19 (100.0%) | 28 (100.0%) |
| 15 Years | 52 (100.0%) | 26 (100.0%) |
| 16 and 17 Years | 15 (100.0%) | 10 (100.0%) |
| 18 to 24 Years | 87 (100.0%) | 76 (100.0%) |
| 25 to 34 Years | 41 (100.0%) | 49 (100.0%) |
| 35 to 44 Years | 107 (95.5%) | 86 (100.0%) |
| 45 to 54 Years | 48 (100.0%) | 155 (100.0%) |
| 55 to 64 Years | 333 (100.0%) | 268 (100.0%) |
| 65 to 74 Years | 107 (100.0%) | 125 (100.0%) |
| 75 Years and over | 37 (100.0%) | 0 (0.0%) |
| Total | 884 (99.4%) | 935 (100.0%) |
Income Below Poverty Among Married-Couple Families in Loveland Park
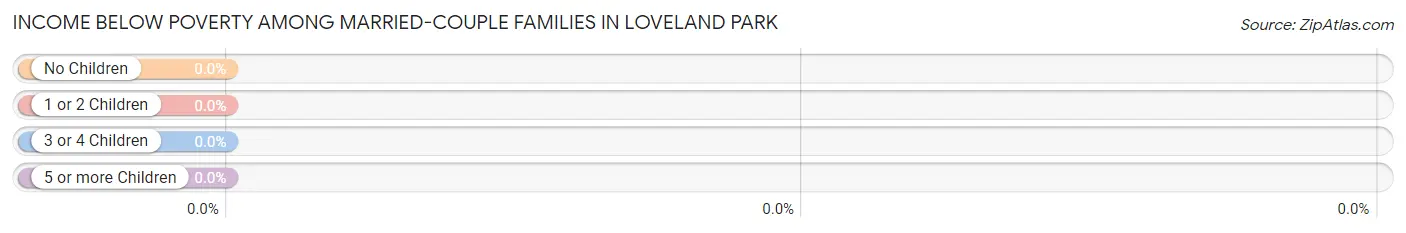
| Children | Above Poverty | Below Poverty |
| No Children | 408 (100.0%) | 0 (0.0%) |
| 1 or 2 Children | 149 (100.0%) | 0 (0.0%) |
| 3 or 4 Children | 20 (100.0%) | 0 (0.0%) |
| 5 or more Children | 0 (0.0%) | 0 (0.0%) |
| Total | 577 (100.0%) | 0 (0.0%) |
Income Below Poverty Among Single-Parent Households in Loveland Park
| Children | Single Father | Single Mother |
| No Children | 0 (0.0%) | 0 (0.0%) |
| 1 or 2 Children | 0 (0.0%) | 0 (0.0%) |
| 3 or 4 Children | 0 (0.0%) | 0 (0.0%) |
| 5 or more Children | 0 (0.0%) | 0 (0.0%) |
| Total | 0 (0.0%) | 0 (0.0%) |
Income Below Poverty Among Married-Couple vs Single-Parent Households in Loveland Park
| Children | Married-Couple Families | Single-Parent Households |
| No Children | 0 (0.0%) | 0 (0.0%) |
| 1 or 2 Children | 0 (0.0%) | 0 (0.0%) |
| 3 or 4 Children | 0 (0.0%) | 0 (0.0%) |
| 5 or more Children | 0 (0.0%) | 0 (0.0%) |
| Total | 0 (0.0%) | 0 (0.0%) |
Race in Loveland Park
The most populous races in Loveland Park are White / Caucasian (1,748 | 95.8%), Hispanic or Latino (66 | 3.6%), and Two or more Races (47 | 2.6%).
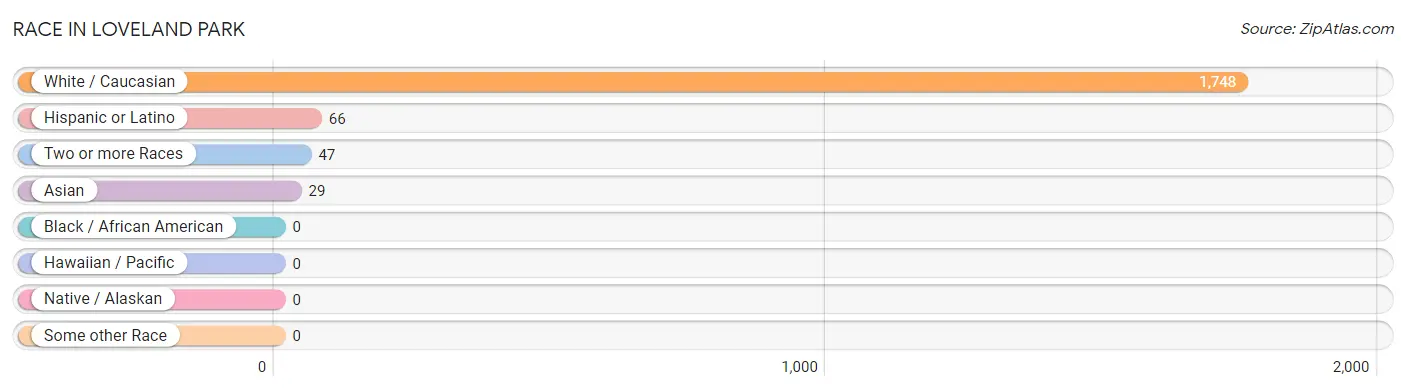
| Race | # Population | % Population |
| Asian | 29 | 1.6% |
| Black / African American | 0 | 0.0% |
| Hawaiian / Pacific | 0 | 0.0% |
| Hispanic or Latino | 66 | 3.6% |
| Native / Alaskan | 0 | 0.0% |
| White / Caucasian | 1,748 | 95.8% |
| Two or more Races | 47 | 2.6% |
| Some other Race | 0 | 0.0% |
| Total | 1,824 | 100.0% |
Ancestry in Loveland Park
The most populous ancestries reported in Loveland Park are German (569 | 31.2%), Irish (380 | 20.8%), English (222 | 12.2%), American (125 | 6.9%), and Scottish (115 | 6.3%), together accounting for 77.4% of all Loveland Park residents.
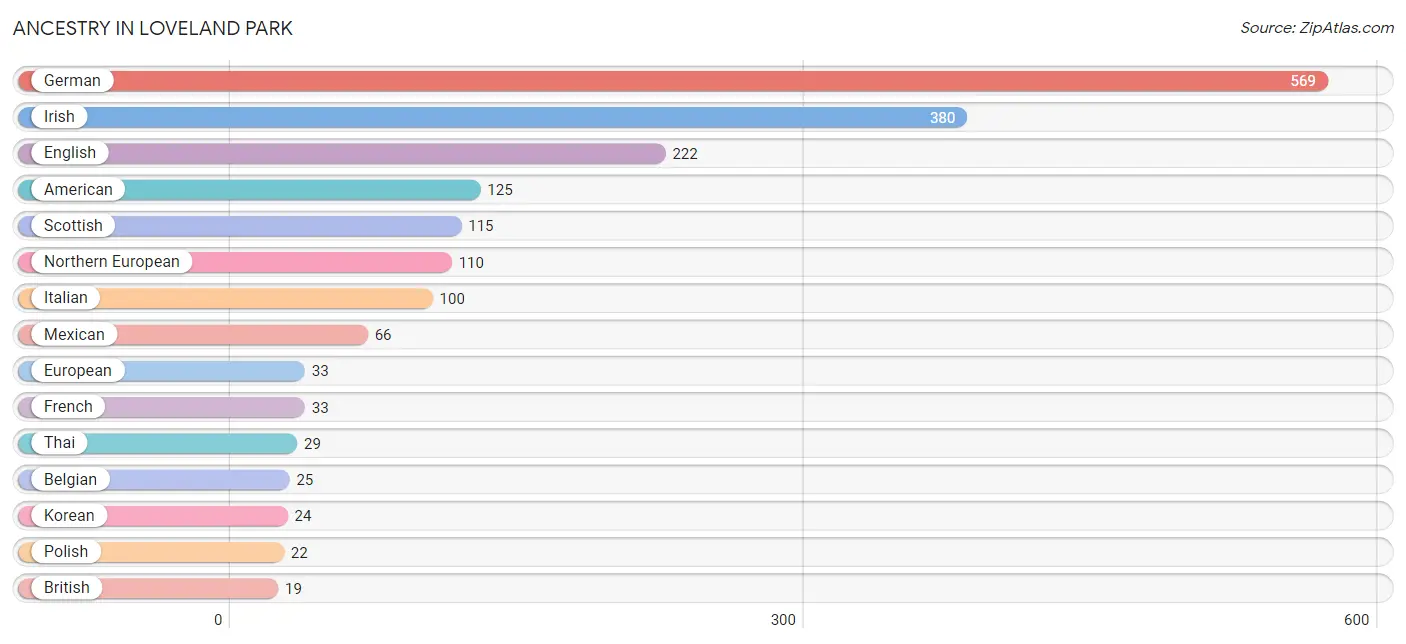
| Ancestry | # Population | % Population |
| American | 125 | 6.9% |
| Belgian | 25 | 1.4% |
| British | 19 | 1.0% |
| Danish | 18 | 1.0% |
| English | 222 | 12.2% |
| European | 33 | 1.8% |
| French | 33 | 1.8% |
| German | 569 | 31.2% |
| Irish | 380 | 20.8% |
| Italian | 100 | 5.5% |
| Korean | 24 | 1.3% |
| Mexican | 66 | 3.6% |
| Native Hawaiian | 18 | 1.0% |
| Northern European | 110 | 6.0% |
| Polish | 22 | 1.2% |
| Scottish | 115 | 6.3% |
| Swedish | 15 | 0.8% |
| Thai | 29 | 1.6% |
| Ukrainian | 17 | 0.9% | View All 19 Rows |
Immigrants in Loveland Park
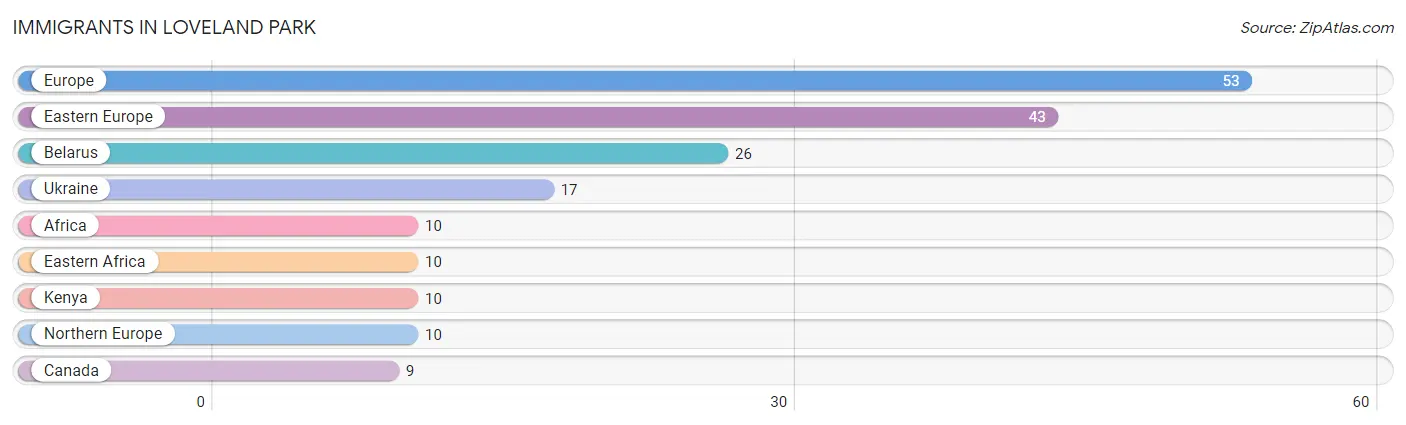
The most numerous immigrant groups reported in Loveland Park came from Europe (53 | 2.9%), Eastern Europe (43 | 2.4%), Belarus (26 | 1.4%), Ukraine (17 | 0.9%), and Africa (10 | 0.5%), together accounting for 8.2% of all Loveland Park residents.
| Immigration Origin | # Population | % Population |
| Africa | 10 | 0.5% |
| Belarus | 26 | 1.4% |
| Canada | 9 | 0.5% |
| Eastern Africa | 10 | 0.5% |
| Eastern Europe | 43 | 2.4% |
| Europe | 53 | 2.9% |
| Kenya | 10 | 0.5% |
| Northern Europe | 10 | 0.5% |
| Ukraine | 17 | 0.9% | View All 9 Rows |
Sex and Age in Loveland Park
Sex and Age in Loveland Park
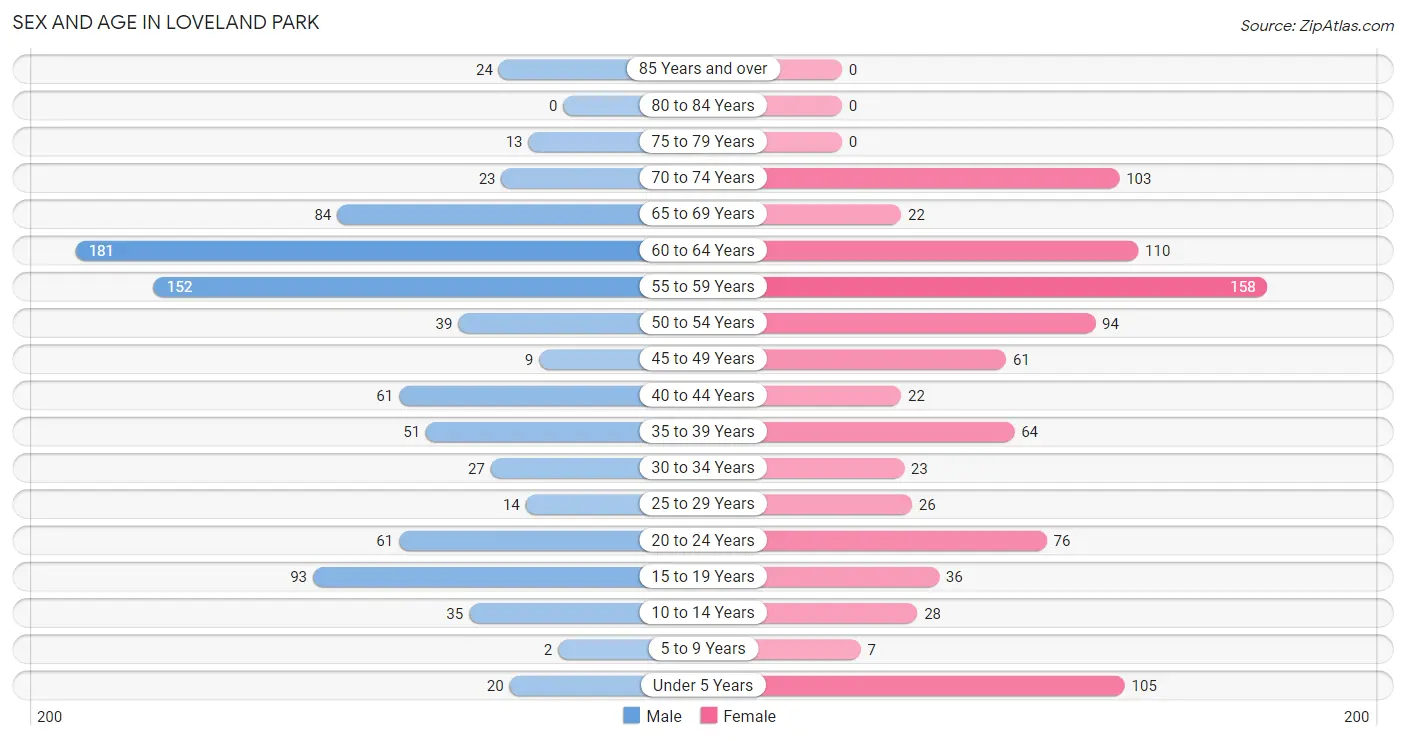
The most populous age groups in Loveland Park are 60 to 64 Years (181 | 20.4%) for men and 55 to 59 Years (158 | 16.9%) for women.
| Age Bracket | Male | Female |
| Under 5 Years | 20 (2.2%) | 105 (11.2%) |
| 5 to 9 Years | 2 (0.2%) | 7 (0.7%) |
| 10 to 14 Years | 35 (3.9%) | 28 (3.0%) |
| 15 to 19 Years | 93 (10.5%) | 36 (3.8%) |
| 20 to 24 Years | 61 (6.9%) | 76 (8.1%) |
| 25 to 29 Years | 14 (1.6%) | 26 (2.8%) |
| 30 to 34 Years | 27 (3.0%) | 23 (2.5%) |
| 35 to 39 Years | 51 (5.7%) | 64 (6.8%) |
| 40 to 44 Years | 61 (6.9%) | 22 (2.4%) |
| 45 to 49 Years | 9 (1.0%) | 61 (6.5%) |
| 50 to 54 Years | 39 (4.4%) | 94 (10.1%) |
| 55 to 59 Years | 152 (17.1%) | 158 (16.9%) |
| 60 to 64 Years | 181 (20.4%) | 110 (11.8%) |
| 65 to 69 Years | 84 (9.5%) | 22 (2.4%) |
| 70 to 74 Years | 23 (2.6%) | 103 (11.0%) |
| 75 to 79 Years | 13 (1.5%) | 0 (0.0%) |
| 80 to 84 Years | 0 (0.0%) | 0 (0.0%) |
| 85 Years and over | 24 (2.7%) | 0 (0.0%) |
| Total | 889 (100.0%) | 935 (100.0%) |
Families and Households in Loveland Park
Median Family Size in Loveland Park
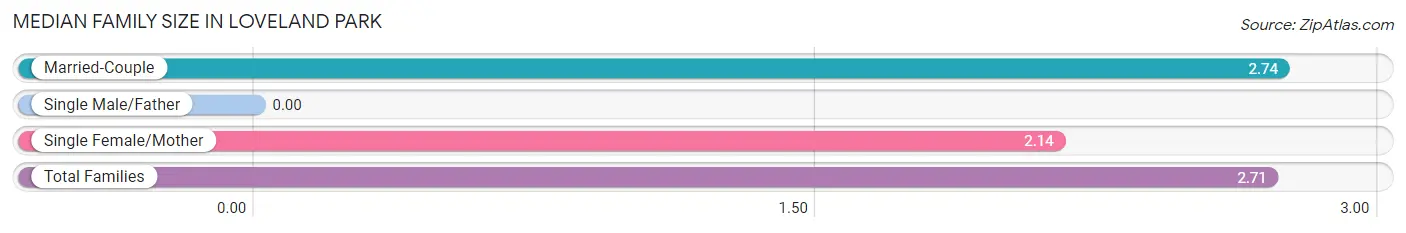
| Family Type | # Families | Family Size |
| Married-Couple | 577 (95.2%) | 2.74 |
| Single Male/Father | 0 (0.0%) | - |
| Single Female/Mother | 29 (4.8%) | 2.14 |
| Total Families | 606 (100.0%) | 2.71 |
Median Household Size in Loveland Park
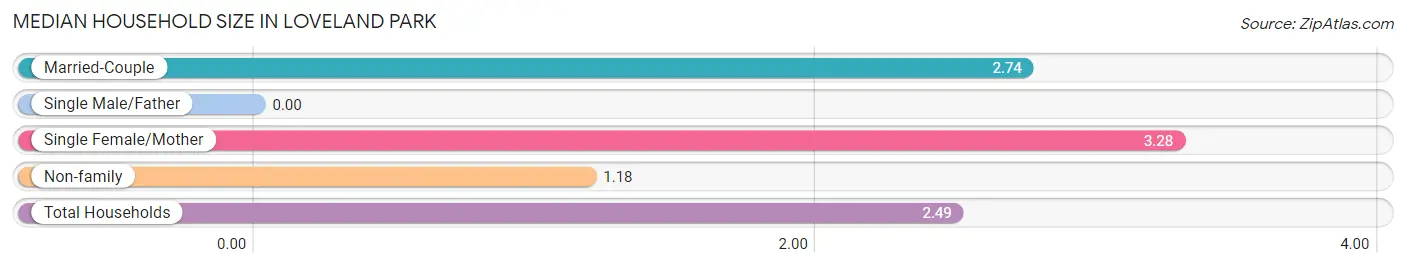
| Household Type | # Households | Household Size |
| Married-Couple | 577 (78.7%) | 2.74 |
| Single Male/Father | 0 (0.0%) | - |
| Single Female/Mother | 29 (4.0%) | 3.28 |
| Non-family | 127 (17.3%) | 1.18 |
| Total Households | 733 (100.0%) | 2.49 |
Household Size by Marriage Status in Loveland Park
Out of a total of 733 households in Loveland Park, 606 (82.7%) are family households, while 127 (17.3%) are nonfamily households. The most numerous type of family households are 2-person households, comprising 287, and the most common type of nonfamily households are 1-person households, comprising 108.
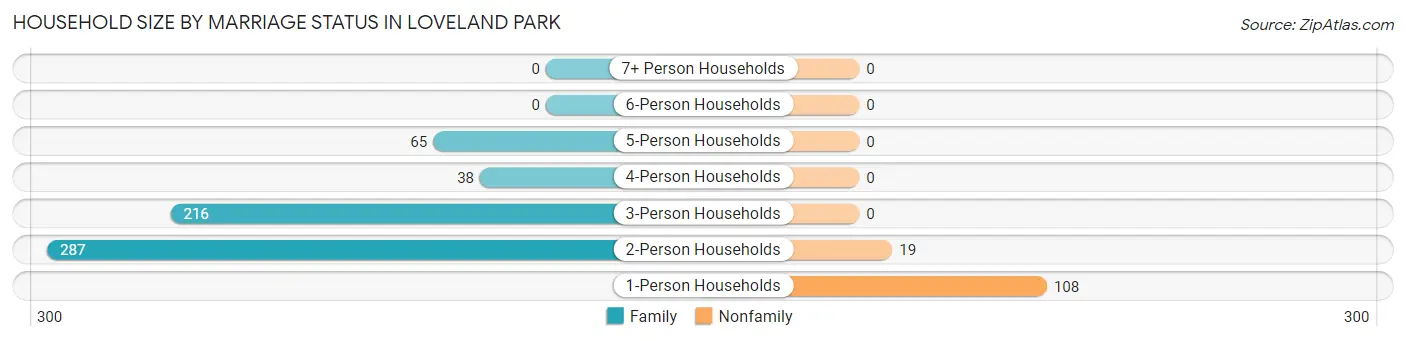
| Household Size | Family Households | Nonfamily Households |
| 1-Person Households | - | 108 (14.7%) |
| 2-Person Households | 287 (39.2%) | 19 (2.6%) |
| 3-Person Households | 216 (29.5%) | 0 (0.0%) |
| 4-Person Households | 38 (5.2%) | 0 (0.0%) |
| 5-Person Households | 65 (8.9%) | 0 (0.0%) |
| 6-Person Households | 0 (0.0%) | 0 (0.0%) |
| 7+ Person Households | 0 (0.0%) | 0 (0.0%) |
| Total | 606 (82.7%) | 127 (17.3%) |
Female Fertility in Loveland Park
Fertility by Age in Loveland Park
Average fertility rate in Loveland Park is 125.0 births per 1,000 women. Women in the age bracket of 20 to 34 years have the highest fertility rate with 328.0 births per 1,000 women. Women in the age bracket of 20 to 34 years acount for 100.0% of all women with births.
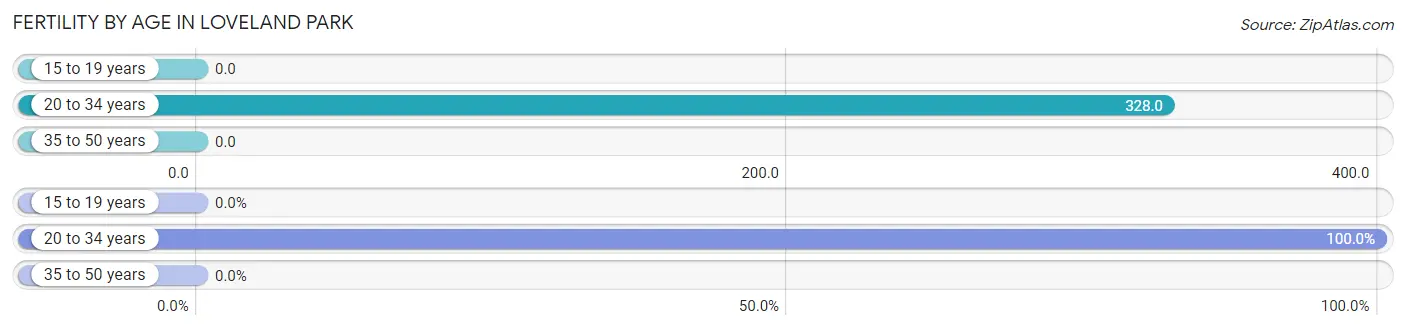
| Age Bracket | Women with Births | Births / 1,000 Women |
| 15 to 19 years | 0 (0.0%) | 0.0 |
| 20 to 34 years | 41 (100.0%) | 328.0 |
| 35 to 50 years | 0 (0.0%) | 0.0 |
| Total | 41 (100.0%) | 125.0 |
Fertility by Age by Marriage Status in Loveland Park
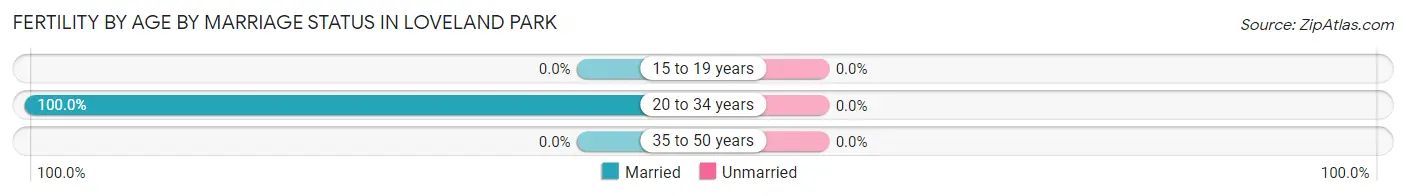
| Age Bracket | Married | Unmarried |
| 15 to 19 years | 0 (0.0%) | 0 (0.0%) |
| 20 to 34 years | 41 (100.0%) | 0 (0.0%) |
| 35 to 50 years | 0 (0.0%) | 0 (0.0%) |
| Total | 41 (100.0%) | 0 (0.0%) |
Fertility by Education in Loveland Park
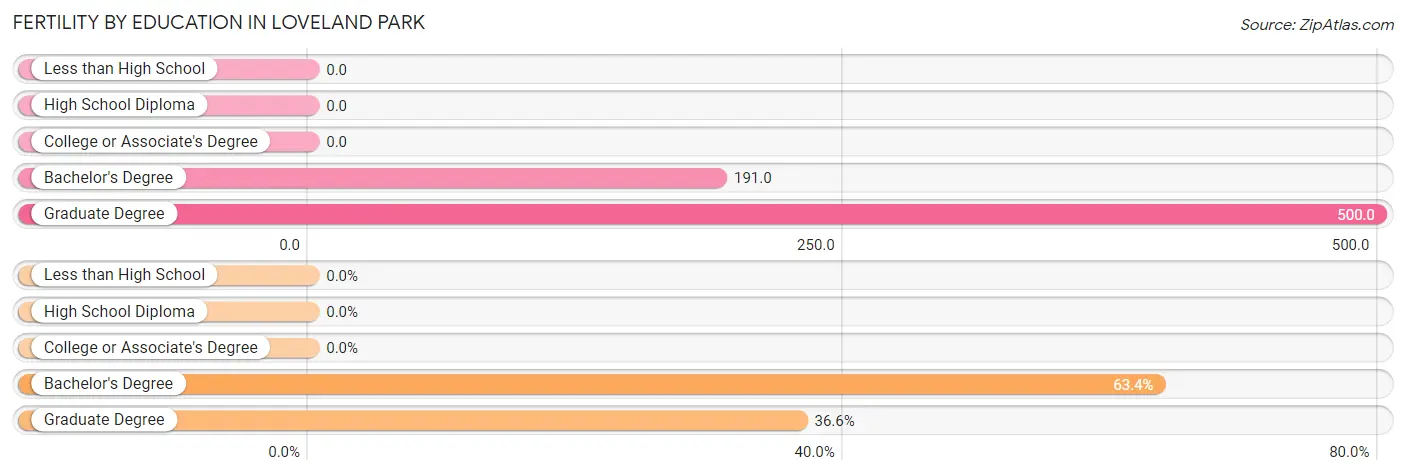
| Educational Attainment | Women with Births | Births / 1,000 Women |
| Less than High School | 0 (0.0%) | 0.0 |
| High School Diploma | 0 (0.0%) | 0.0 |
| College or Associate's Degree | 0 (0.0%) | 0.0 |
| Bachelor's Degree | 26 (63.4%) | 191.0 |
| Graduate Degree | 15 (36.6%) | 500.0 |
| Total | 41 (100.0%) | 125.0 |
Fertility by Education by Marriage Status in Loveland Park
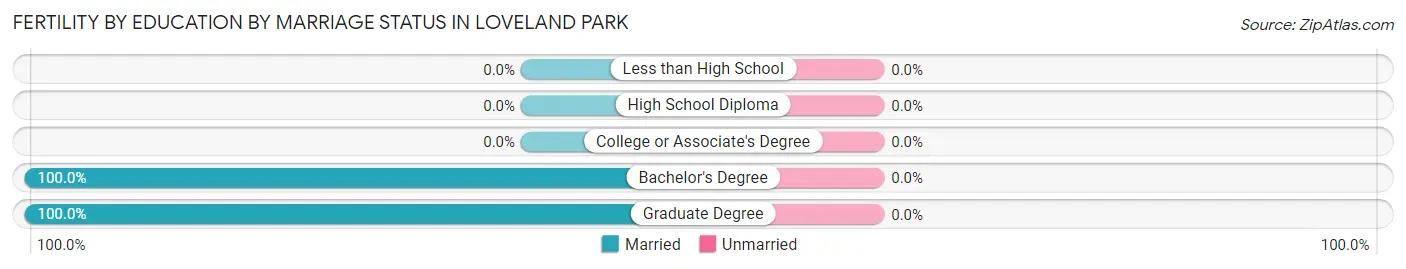
| Educational Attainment | Married | Unmarried |
| Less than High School | 0 (0.0%) | 0 (0.0%) |
| High School Diploma | 0 (0.0%) | 0 (0.0%) |
| College or Associate's Degree | 0 (0.0%) | 0 (0.0%) |
| Bachelor's Degree | 26 (100.0%) | 0 (0.0%) |
| Graduate Degree | 15 (100.0%) | 0 (0.0%) |
| Total | 41 (100.0%) | 0 (0.0%) |
Employment Characteristics in Loveland Park
Employment by Class of Employer in Loveland Park
Among the 1,060 employed individuals in Loveland Park, private company employees (745 | 70.3%), self-employed (incorporated) (116 | 10.9%), and not-for-profit organizations (85 | 8.0%) make up the most common classes of employment.
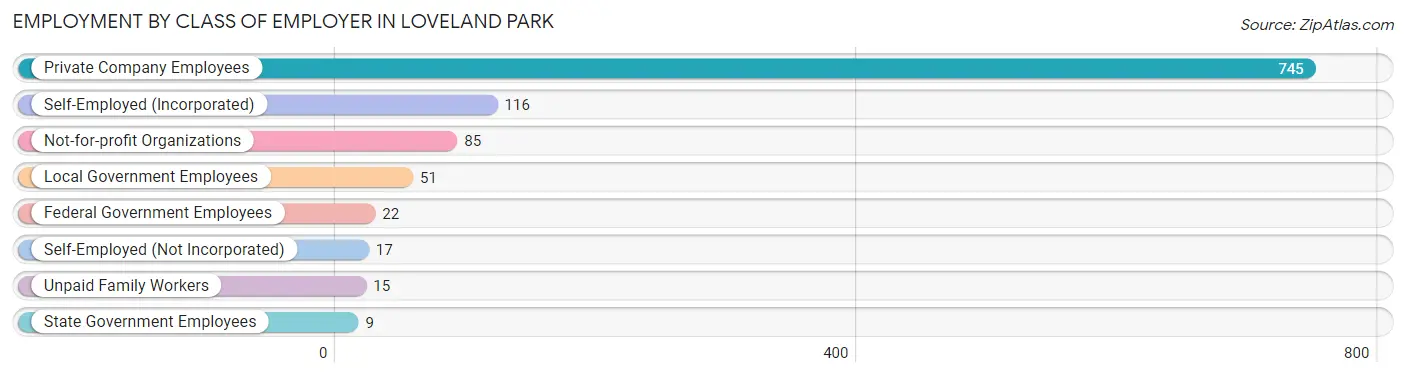
| Employer Class | # Employees | % Employees |
| Private Company Employees | 745 | 70.3% |
| Self-Employed (Incorporated) | 116 | 10.9% |
| Self-Employed (Not Incorporated) | 17 | 1.6% |
| Not-for-profit Organizations | 85 | 8.0% |
| Local Government Employees | 51 | 4.8% |
| State Government Employees | 9 | 0.9% |
| Federal Government Employees | 22 | 2.1% |
| Unpaid Family Workers | 15 | 1.4% |
| Total | 1,060 | 100.0% |
Employment Status by Age in Loveland Park
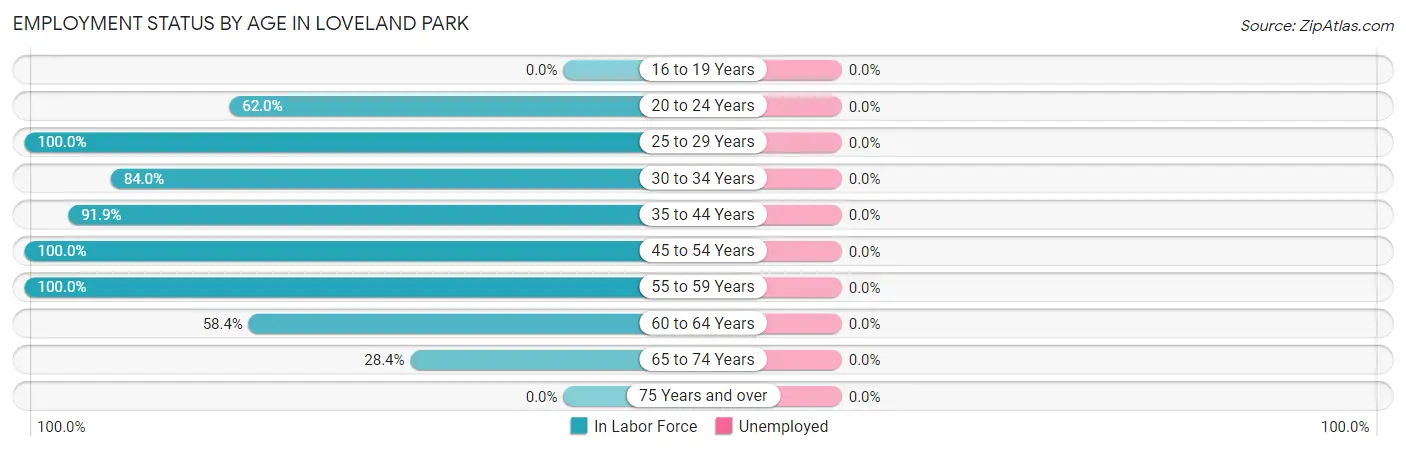
| Age Bracket | In Labor Force | Unemployed |
| 16 to 19 Years | 0 (0.0%) | 0 (0.0%) |
| 20 to 24 Years | 85 (62.0%) | 0 (0.0%) |
| 25 to 29 Years | 40 (100.0%) | 0 (0.0%) |
| 30 to 34 Years | 42 (84.0%) | 0 (0.0%) |
| 35 to 44 Years | 182 (91.9%) | 0 (0.0%) |
| 45 to 54 Years | 203 (100.0%) | 0 (0.0%) |
| 55 to 59 Years | 310 (100.0%) | 0 (0.0%) |
| 60 to 64 Years | 170 (58.4%) | 0 (0.0%) |
| 65 to 74 Years | 66 (28.4%) | 0 (0.0%) |
| 75 Years and over | 0 (0.0%) | 0 (0.0%) |
| Total | 1,098 (70.9%) | 0 (0.0%) |
Employment Status by Educational Attainment in Loveland Park
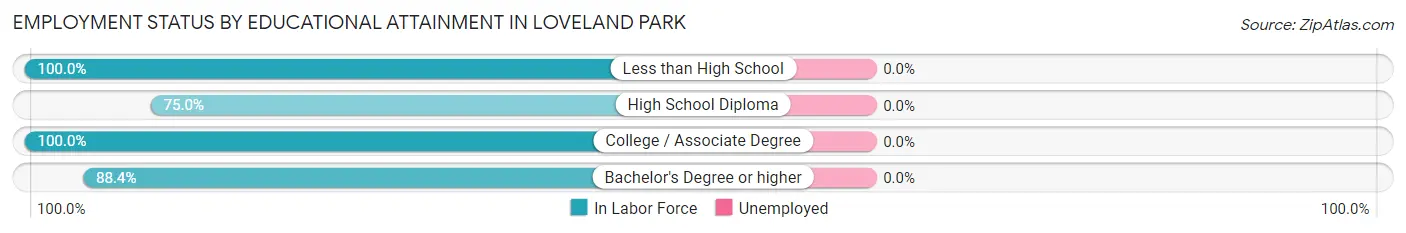
| Educational Attainment | In Labor Force | Unemployed |
| Less than High School | 5 (100.0%) | 0 (0.0%) |
| High School Diploma | 255 (75.0%) | 0 (0.0%) |
| College / Associate Degree | 229 (100.0%) | 0 (0.0%) |
| Bachelor's Degree or higher | 458 (88.4%) | 0 (0.0%) |
| Total | 947 (86.7%) | 0 (0.0%) |
Employment Occupations by Sex in Loveland Park
Management, Business, Science and Arts Occupations
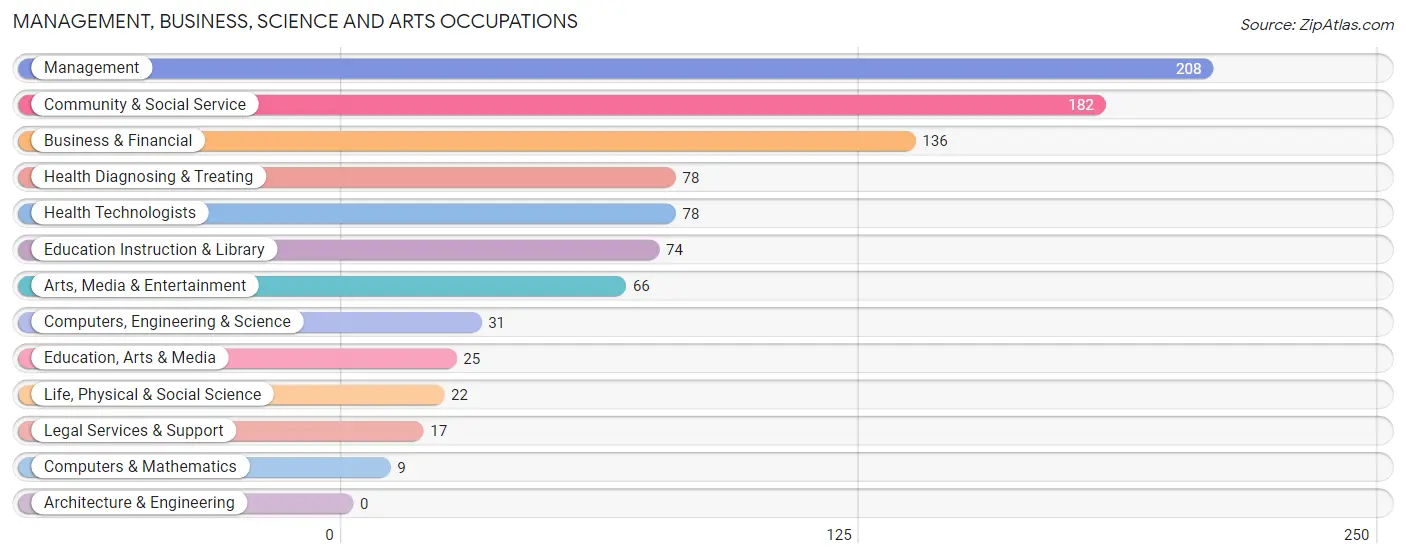
The most common Management, Business, Science and Arts occupations in Loveland Park are Management (208 | 18.9%), Community & Social Service (182 | 16.6%), Business & Financial (136 | 12.4%), Health Diagnosing & Treating (78 | 7.1%), and Health Technologists (78 | 7.1%).
Management, Business, Science and Arts Occupations by Sex
Within the Management, Business, Science and Arts occupations in Loveland Park, the most male-oriented occupations are Computers & Mathematics (100.0%), Education, Arts & Media (100.0%), and Legal Services & Support (100.0%), while the most female-oriented occupations are Life, Physical & Social Science (100.0%), Education Instruction & Library (100.0%), and Computers, Engineering & Science (71.0%).
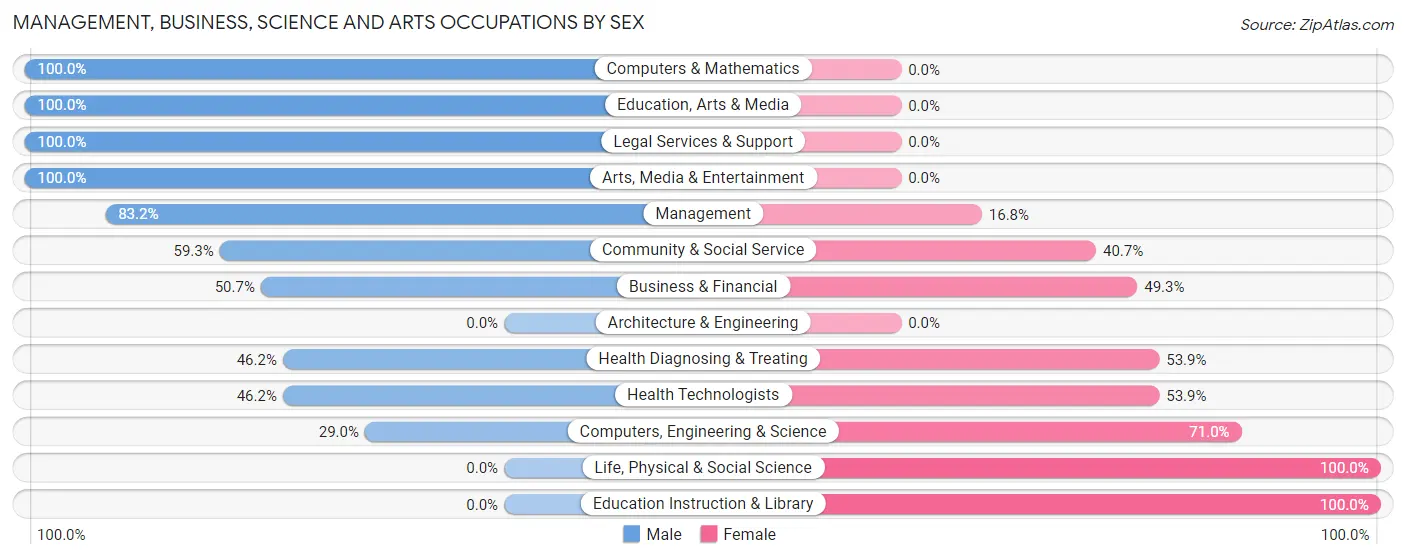
| Occupation | Male | Female |
| Management | 173 (83.2%) | 35 (16.8%) |
| Business & Financial | 69 (50.7%) | 67 (49.3%) |
| Computers, Engineering & Science | 9 (29.0%) | 22 (71.0%) |
| Computers & Mathematics | 9 (100.0%) | 0 (0.0%) |
| Architecture & Engineering | 0 (0.0%) | 0 (0.0%) |
| Life, Physical & Social Science | 0 (0.0%) | 22 (100.0%) |
| Community & Social Service | 108 (59.3%) | 74 (40.7%) |
| Education, Arts & Media | 25 (100.0%) | 0 (0.0%) |
| Legal Services & Support | 17 (100.0%) | 0 (0.0%) |
| Education Instruction & Library | 0 (0.0%) | 74 (100.0%) |
| Arts, Media & Entertainment | 66 (100.0%) | 0 (0.0%) |
| Health Diagnosing & Treating | 36 (46.2%) | 42 (53.8%) |
| Health Technologists | 36 (46.2%) | 42 (53.8%) |
| Total (Category) | 395 (62.2%) | 240 (37.8%) |
| Total (Overall) | 616 (56.1%) | 482 (43.9%) |
Services Occupations
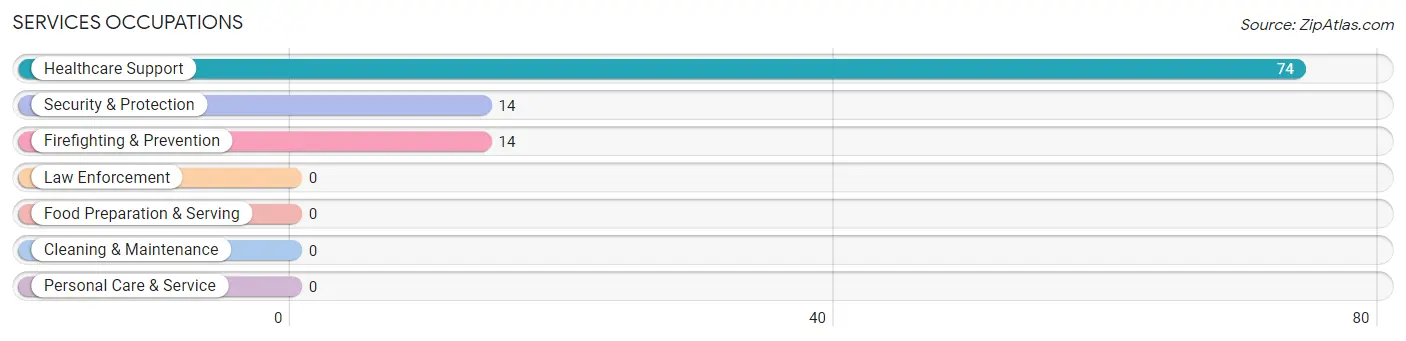
The most common Services occupations in Loveland Park are Healthcare Support (74 | 6.7%), Security & Protection (14 | 1.3%), and Firefighting & Prevention (14 | 1.3%).
Services Occupations by Sex
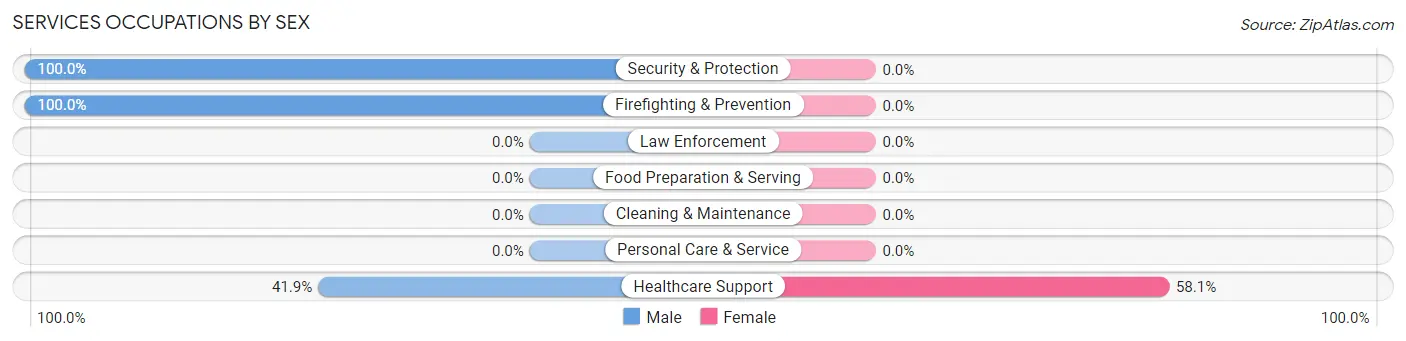
| Occupation | Male | Female |
| Healthcare Support | 31 (41.9%) | 43 (58.1%) |
| Security & Protection | 14 (100.0%) | 0 (0.0%) |
| Firefighting & Prevention | 14 (100.0%) | 0 (0.0%) |
| Law Enforcement | 0 (0.0%) | 0 (0.0%) |
| Food Preparation & Serving | 0 (0.0%) | 0 (0.0%) |
| Cleaning & Maintenance | 0 (0.0%) | 0 (0.0%) |
| Personal Care & Service | 0 (0.0%) | 0 (0.0%) |
| Total (Category) | 45 (51.1%) | 43 (48.9%) |
| Total (Overall) | 616 (56.1%) | 482 (43.9%) |
Sales and Office Occupations
The most common Sales and Office occupations in Loveland Park are Office & Administration (144 | 13.1%), and Sales & Related (103 | 9.4%).
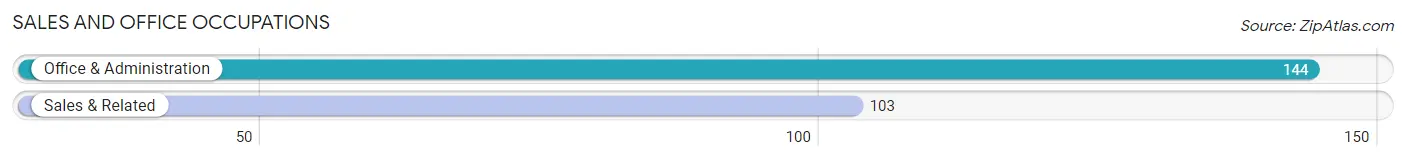
Sales and Office Occupations by Sex
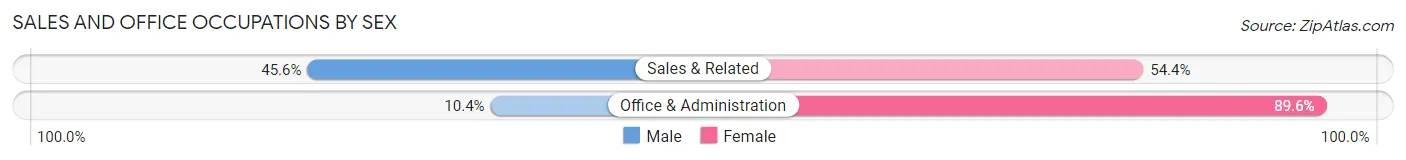
| Occupation | Male | Female |
| Sales & Related | 47 (45.6%) | 56 (54.4%) |
| Office & Administration | 15 (10.4%) | 129 (89.6%) |
| Total (Category) | 62 (25.1%) | 185 (74.9%) |
| Total (Overall) | 616 (56.1%) | 482 (43.9%) |
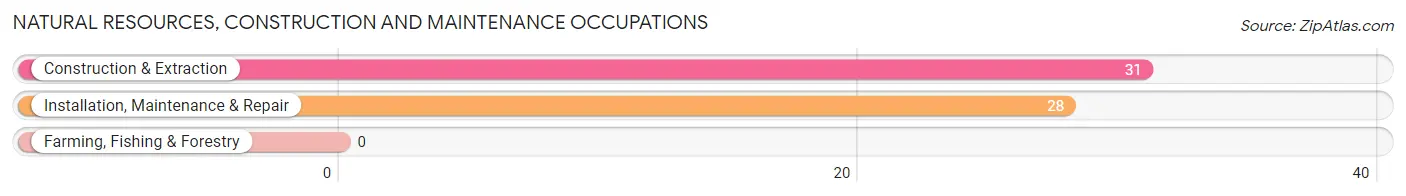
Natural Resources, Construction and Maintenance Occupations
The most common Natural Resources, Construction and Maintenance occupations in Loveland Park are Construction & Extraction (31 | 2.8%), and Installation, Maintenance & Repair (28 | 2.5%).
Natural Resources, Construction and Maintenance Occupations by Sex
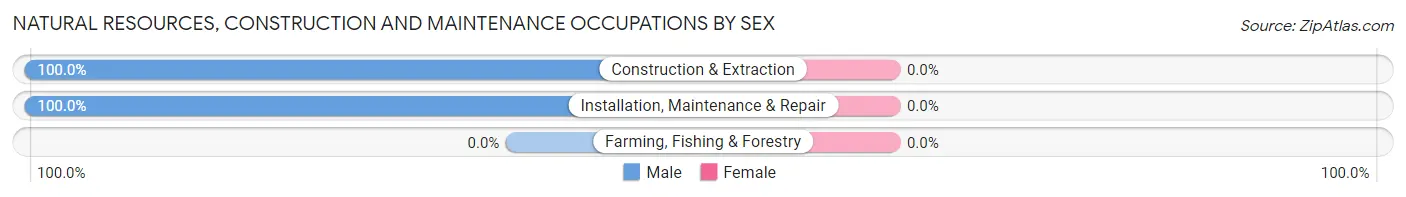
| Occupation | Male | Female |
| Farming, Fishing & Forestry | 0 (0.0%) | 0 (0.0%) |
| Construction & Extraction | 31 (100.0%) | 0 (0.0%) |
| Installation, Maintenance & Repair | 28 (100.0%) | 0 (0.0%) |
| Total (Category) | 59 (100.0%) | 0 (0.0%) |
| Total (Overall) | 616 (56.1%) | 482 (43.9%) |
Production, Transportation and Moving Occupations
The most common Production, Transportation and Moving occupations in Loveland Park are Material Moving (42 | 3.8%), and Production (27 | 2.5%).
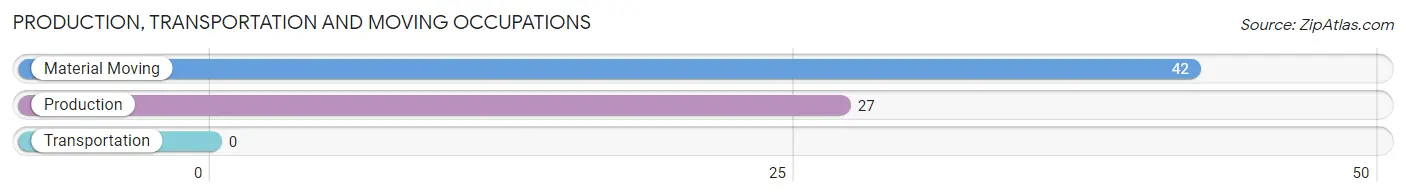
Production, Transportation and Moving Occupations by Sex
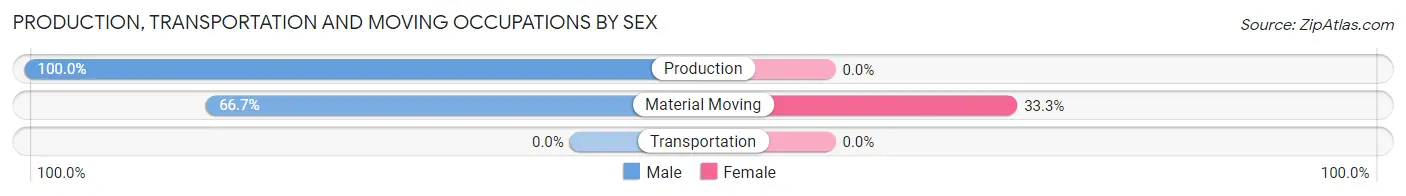
| Occupation | Male | Female |
| Production | 27 (100.0%) | 0 (0.0%) |
| Transportation | 0 (0.0%) | 0 (0.0%) |
| Material Moving | 28 (66.7%) | 14 (33.3%) |
| Total (Category) | 55 (79.7%) | 14 (20.3%) |
| Total (Overall) | 616 (56.1%) | 482 (43.9%) |
Employment Industries by Sex in Loveland Park
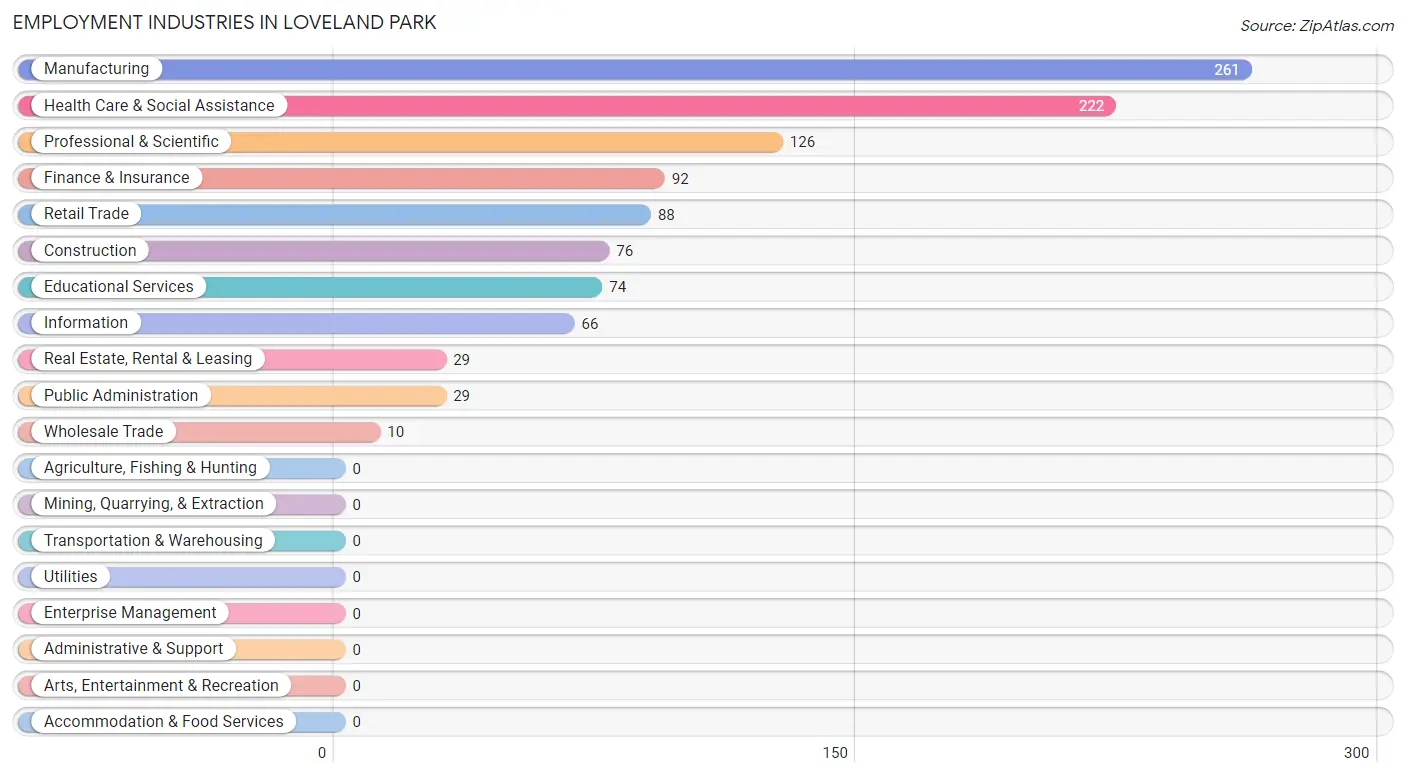
Employment Industries in Loveland Park
The major employment industries in Loveland Park include Manufacturing (261 | 23.8%), Health Care & Social Assistance (222 | 20.2%), Professional & Scientific (126 | 11.5%), Finance & Insurance (92 | 8.4%), and Retail Trade (88 | 8.0%).
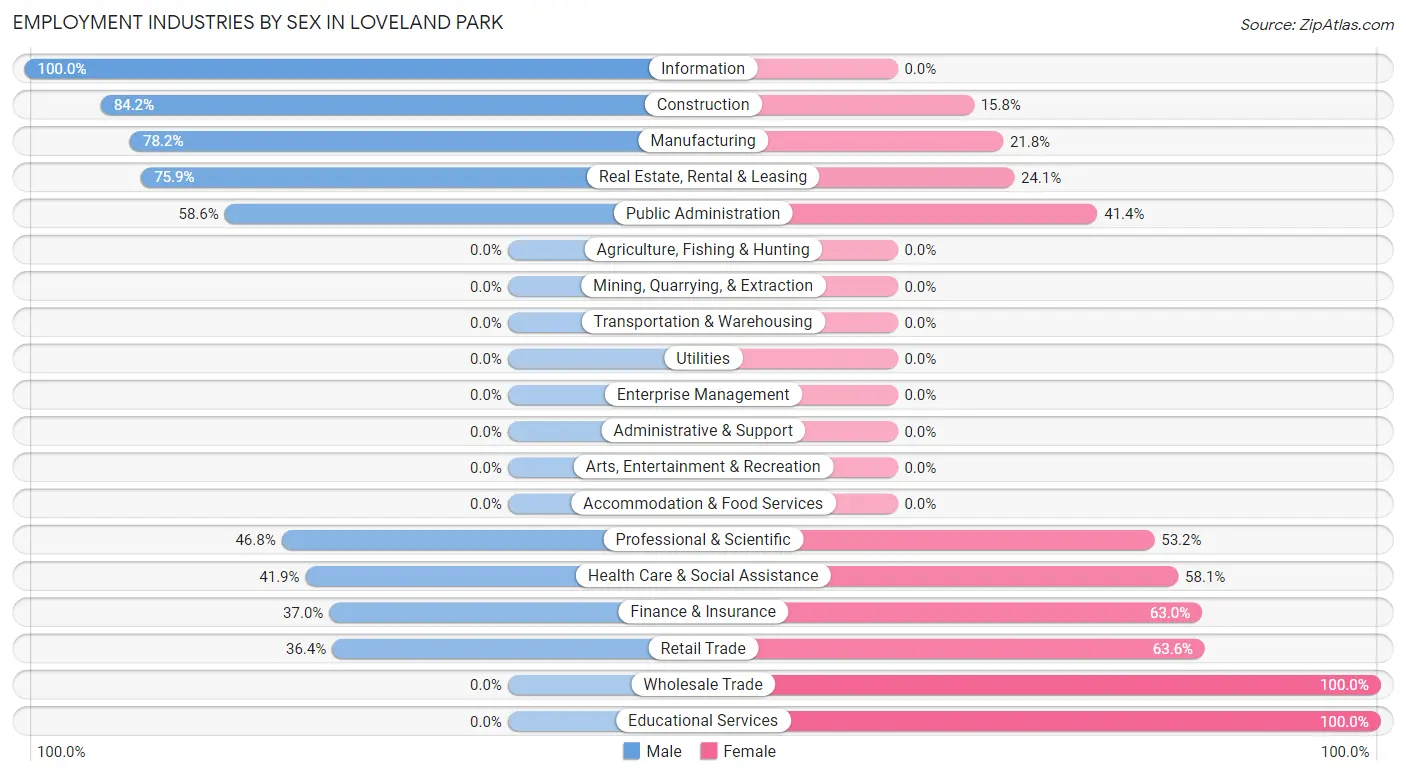
Employment Industries by Sex in Loveland Park
The Loveland Park industries that see more men than women are Information (100.0%), Construction (84.2%), and Manufacturing (78.2%), whereas the industries that tend to have a higher number of women are Wholesale Trade (100.0%), Educational Services (100.0%), and Retail Trade (63.6%).
| Industry | Male | Female |
| Agriculture, Fishing & Hunting | 0 (0.0%) | 0 (0.0%) |
| Mining, Quarrying, & Extraction | 0 (0.0%) | 0 (0.0%) |
| Construction | 64 (84.2%) | 12 (15.8%) |
| Manufacturing | 204 (78.2%) | 57 (21.8%) |
| Wholesale Trade | 0 (0.0%) | 10 (100.0%) |
| Retail Trade | 32 (36.4%) | 56 (63.6%) |
| Transportation & Warehousing | 0 (0.0%) | 0 (0.0%) |
| Utilities | 0 (0.0%) | 0 (0.0%) |
| Information | 66 (100.0%) | 0 (0.0%) |
| Finance & Insurance | 34 (37.0%) | 58 (63.0%) |
| Real Estate, Rental & Leasing | 22 (75.9%) | 7 (24.1%) |
| Professional & Scientific | 59 (46.8%) | 67 (53.2%) |
| Enterprise Management | 0 (0.0%) | 0 (0.0%) |
| Administrative & Support | 0 (0.0%) | 0 (0.0%) |
| Educational Services | 0 (0.0%) | 74 (100.0%) |
| Health Care & Social Assistance | 93 (41.9%) | 129 (58.1%) |
| Arts, Entertainment & Recreation | 0 (0.0%) | 0 (0.0%) |
| Accommodation & Food Services | 0 (0.0%) | 0 (0.0%) |
| Public Administration | 17 (58.6%) | 12 (41.4%) |
| Total | 616 (56.1%) | 482 (43.9%) |
Education in Loveland Park
School Enrollment in Loveland Park
The most common levels of schooling among the 240 students in Loveland Park are high school (129 | 53.7%), middle school (63 | 26.3%), and college / undergraduate (39 | 16.3%).
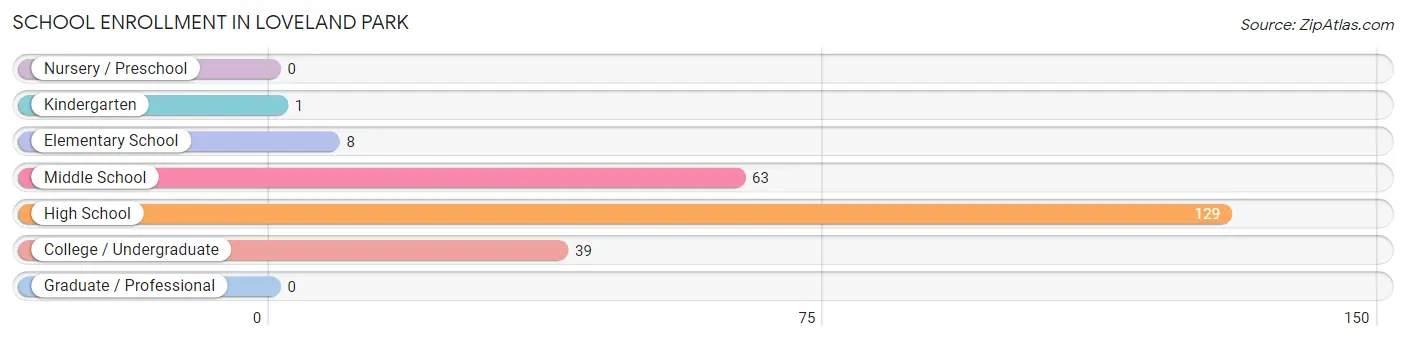
| School Level | # Students | % Students |
| Nursery / Preschool | 0 | 0.0% |
| Kindergarten | 1 | 0.4% |
| Elementary School | 8 | 3.3% |
| Middle School | 63 | 26.3% |
| High School | 129 | 53.7% |
| College / Undergraduate | 39 | 16.3% |
| Graduate / Professional | 0 | 0.0% |
| Total | 240 | 100.0% |
School Enrollment by Age by Funding Source in Loveland Park
Out of a total of 240 students who are enrolled in schools in Loveland Park, 74 (30.8%) attend a private institution, while the remaining 166 (69.2%) are enrolled in public schools. The age group of 10 to 14 year olds has the highest likelihood of being enrolled in private schools, with 29 (46.0% in the age bracket) enrolled. Conversely, the age group of 5 to 9 year old has the lowest likelihood of being enrolled in a private school, with 9 (100.0% in the age bracket) attending a public institution.
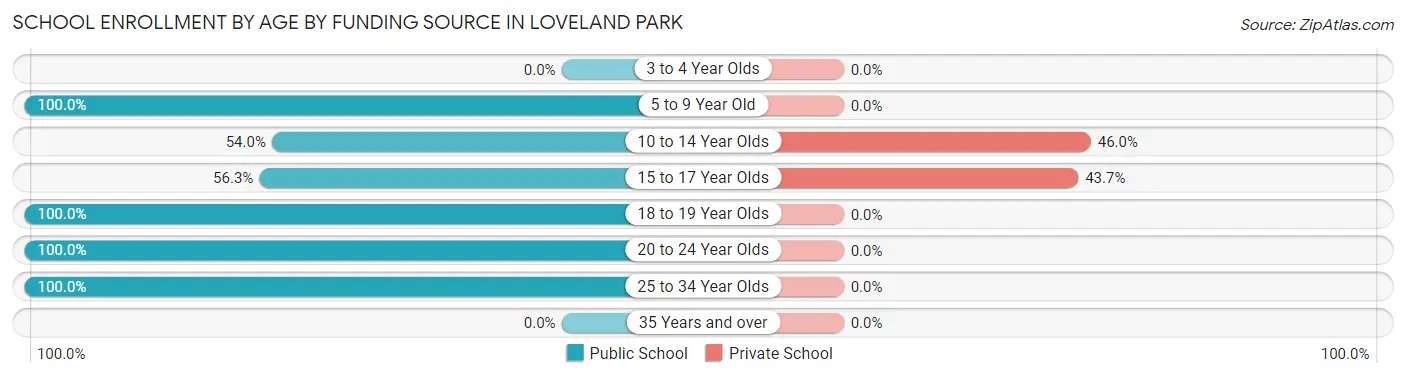
| Age Bracket | Public School | Private School |
| 3 to 4 Year Olds | 0 (0.0%) | 0 (0.0%) |
| 5 to 9 Year Old | 9 (100.0%) | 0 (0.0%) |
| 10 to 14 Year Olds | 34 (54.0%) | 29 (46.0%) |
| 15 to 17 Year Olds | 58 (56.3%) | 45 (43.7%) |
| 18 to 19 Year Olds | 26 (100.0%) | 0 (0.0%) |
| 20 to 24 Year Olds | 13 (100.0%) | 0 (0.0%) |
| 25 to 34 Year Olds | 26 (100.0%) | 0 (0.0%) |
| 35 Years and over | 0 (0.0%) | 0 (0.0%) |
| Total | 166 (69.2%) | 74 (30.8%) |
Educational Attainment by Field of Study in Loveland Park
Business (278 | 44.8%), engineering (63 | 10.2%), bio, nature & agricultural (62 | 10.0%), education (48 | 7.7%), and science & technology (44 | 7.1%) are the most common fields of study among 620 individuals in Loveland Park who have obtained a bachelor's degree or higher.
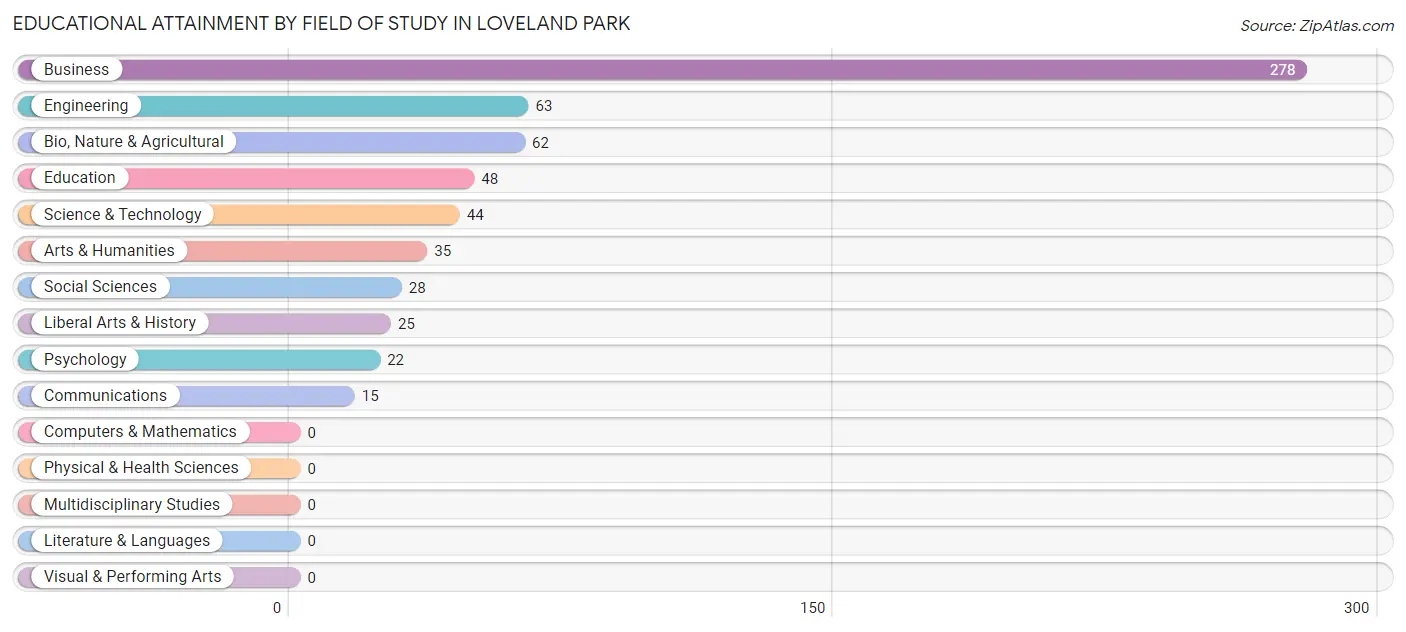
| Field of Study | # Graduates | % Graduates |
| Computers & Mathematics | 0 | 0.0% |
| Bio, Nature & Agricultural | 62 | 10.0% |
| Physical & Health Sciences | 0 | 0.0% |
| Psychology | 22 | 3.5% |
| Social Sciences | 28 | 4.5% |
| Engineering | 63 | 10.2% |
| Multidisciplinary Studies | 0 | 0.0% |
| Science & Technology | 44 | 7.1% |
| Business | 278 | 44.8% |
| Education | 48 | 7.7% |
| Literature & Languages | 0 | 0.0% |
| Liberal Arts & History | 25 | 4.0% |
| Visual & Performing Arts | 0 | 0.0% |
| Communications | 15 | 2.4% |
| Arts & Humanities | 35 | 5.7% |
| Total | 620 | 100.0% |
Transportation & Commute in Loveland Park
Vehicle Availability by Sex in Loveland Park
The most prevalent vehicle ownership categories in Loveland Park are males with 2 vehicles (275, accounting for 45.8%) and females with 2 vehicles (172, making up 59.9%).
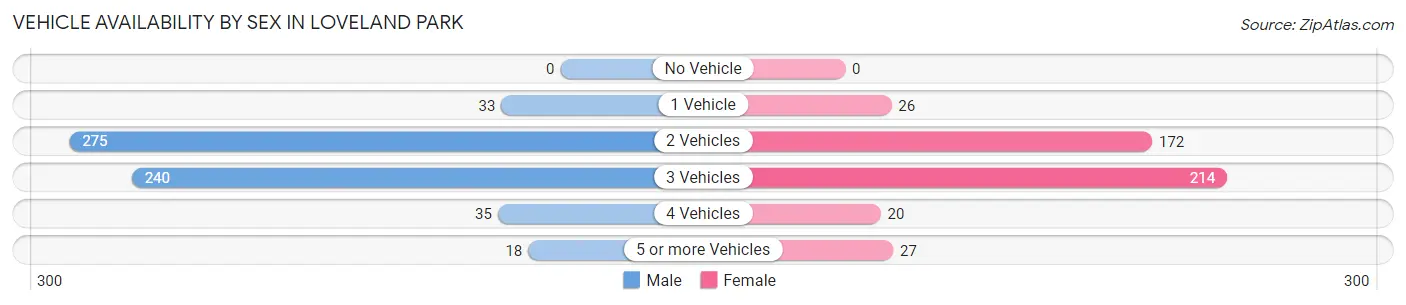
| Vehicles Available | Male | Female |
| No Vehicle | 0 (0.0%) | 0 (0.0%) |
| 1 Vehicle | 33 (5.5%) | 26 (5.7%) |
| 2 Vehicles | 275 (45.8%) | 172 (37.5%) |
| 3 Vehicles | 240 (39.9%) | 214 (46.6%) |
| 4 Vehicles | 35 (5.8%) | 20 (4.4%) |
| 5 or more Vehicles | 18 (3.0%) | 27 (5.9%) |
| Total | 601 (100.0%) | 459 (100.0%) |
Commute Time in Loveland Park
The most frequently occuring commute durations in Loveland Park are 15 to 19 minutes (216 commuters, 25.8%), 25 to 29 minutes (131 commuters, 15.6%), and 20 to 24 minutes (120 commuters, 14.3%).
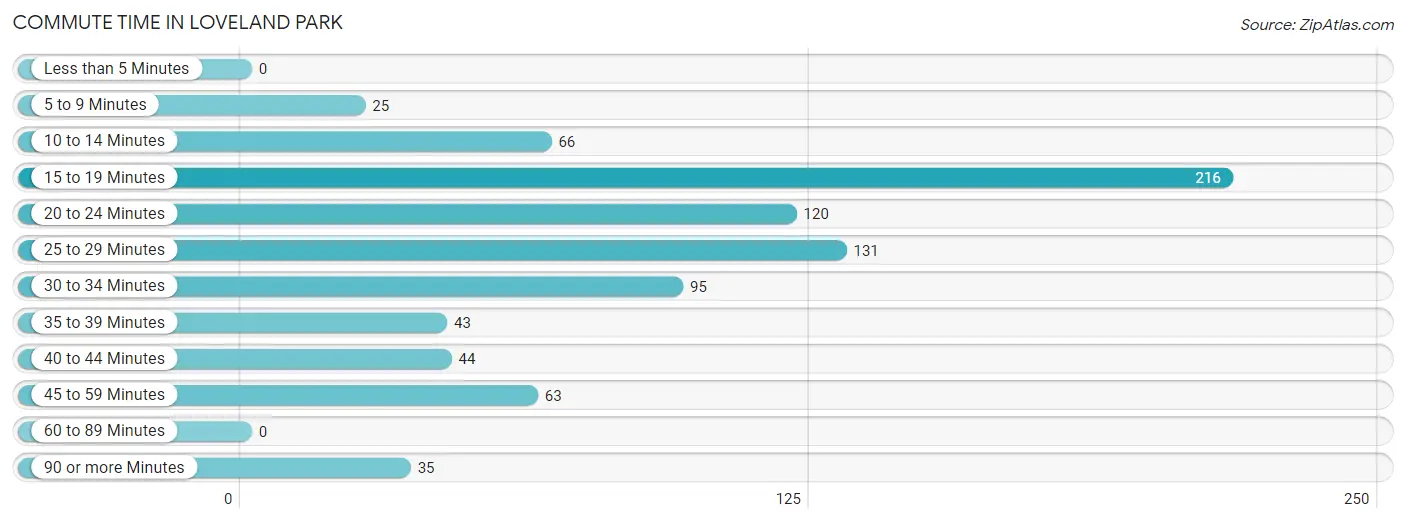
| Commute Time | # Commuters | % Commuters |
| Less than 5 Minutes | 0 | 0.0% |
| 5 to 9 Minutes | 25 | 3.0% |
| 10 to 14 Minutes | 66 | 7.9% |
| 15 to 19 Minutes | 216 | 25.8% |
| 20 to 24 Minutes | 120 | 14.3% |
| 25 to 29 Minutes | 131 | 15.6% |
| 30 to 34 Minutes | 95 | 11.3% |
| 35 to 39 Minutes | 43 | 5.1% |
| 40 to 44 Minutes | 44 | 5.2% |
| 45 to 59 Minutes | 63 | 7.5% |
| 60 to 89 Minutes | 0 | 0.0% |
| 90 or more Minutes | 35 | 4.2% |
Commute Time by Sex in Loveland Park
The most common commute times in Loveland Park are 15 to 19 minutes (117 commuters, 24.8%) for males and 15 to 19 minutes (99 commuters, 27.0%) for females.
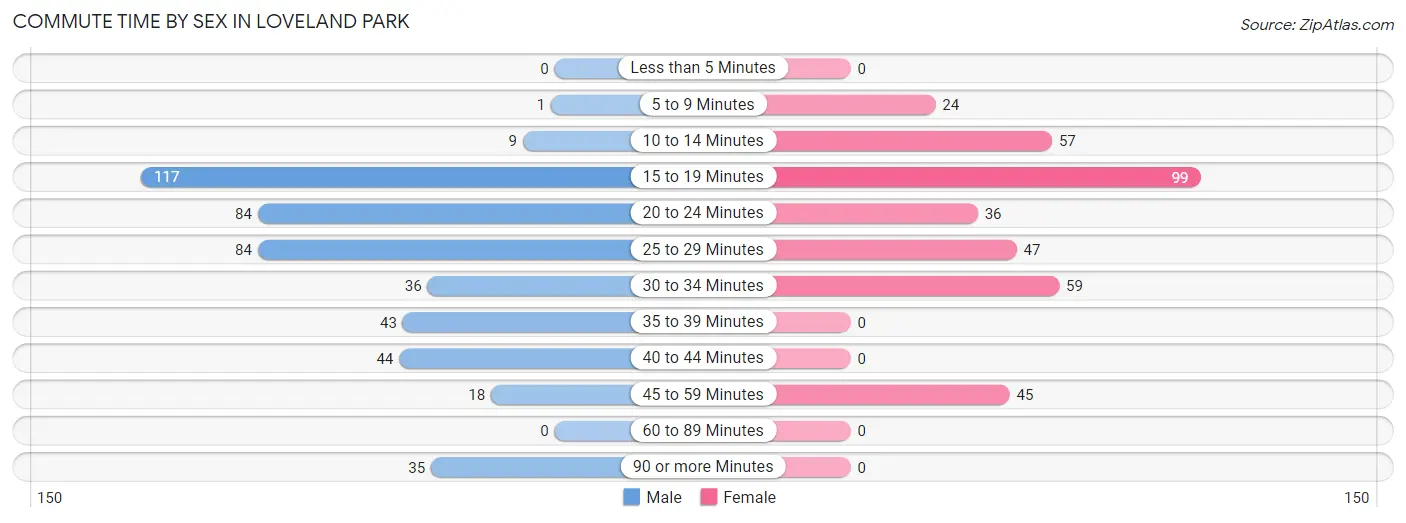
| Commute Time | Male | Female |
| Less than 5 Minutes | 0 (0.0%) | 0 (0.0%) |
| 5 to 9 Minutes | 1 (0.2%) | 24 (6.5%) |
| 10 to 14 Minutes | 9 (1.9%) | 57 (15.5%) |
| 15 to 19 Minutes | 117 (24.8%) | 99 (27.0%) |
| 20 to 24 Minutes | 84 (17.8%) | 36 (9.8%) |
| 25 to 29 Minutes | 84 (17.8%) | 47 (12.8%) |
| 30 to 34 Minutes | 36 (7.6%) | 59 (16.1%) |
| 35 to 39 Minutes | 43 (9.1%) | 0 (0.0%) |
| 40 to 44 Minutes | 44 (9.3%) | 0 (0.0%) |
| 45 to 59 Minutes | 18 (3.8%) | 45 (12.3%) |
| 60 to 89 Minutes | 0 (0.0%) | 0 (0.0%) |
| 90 or more Minutes | 35 (7.4%) | 0 (0.0%) |
Time of Departure to Work by Sex in Loveland Park
The most frequent times of departure to work in Loveland Park are 6:30 AM to 6:59 AM (132, 28.0%) for males and 6:30 AM to 6:59 AM (69, 18.8%) for females.
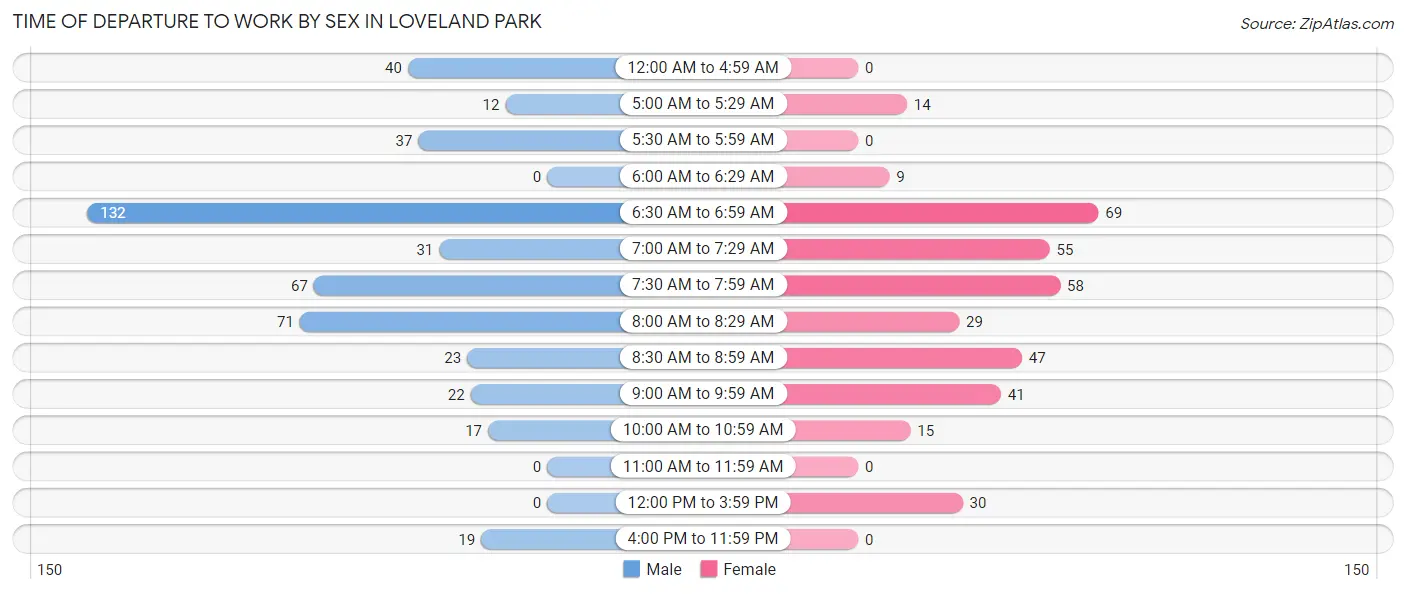
| Time of Departure | Male | Female |
| 12:00 AM to 4:59 AM | 40 (8.5%) | 0 (0.0%) |
| 5:00 AM to 5:29 AM | 12 (2.5%) | 14 (3.8%) |
| 5:30 AM to 5:59 AM | 37 (7.9%) | 0 (0.0%) |
| 6:00 AM to 6:29 AM | 0 (0.0%) | 9 (2.5%) |
| 6:30 AM to 6:59 AM | 132 (28.0%) | 69 (18.8%) |
| 7:00 AM to 7:29 AM | 31 (6.6%) | 55 (15.0%) |
| 7:30 AM to 7:59 AM | 67 (14.2%) | 58 (15.8%) |
| 8:00 AM to 8:29 AM | 71 (15.1%) | 29 (7.9%) |
| 8:30 AM to 8:59 AM | 23 (4.9%) | 47 (12.8%) |
| 9:00 AM to 9:59 AM | 22 (4.7%) | 41 (11.2%) |
| 10:00 AM to 10:59 AM | 17 (3.6%) | 15 (4.1%) |
| 11:00 AM to 11:59 AM | 0 (0.0%) | 0 (0.0%) |
| 12:00 PM to 3:59 PM | 0 (0.0%) | 30 (8.2%) |
| 4:00 PM to 11:59 PM | 19 (4.0%) | 0 (0.0%) |
| Total | 471 (100.0%) | 367 (100.0%) |
Housing Occupancy in Loveland Park
Occupancy by Ownership in Loveland Park
Of the total 733 dwellings in Loveland Park, owner-occupied units account for 712 (97.1%), while renter-occupied units make up 21 (2.9%).
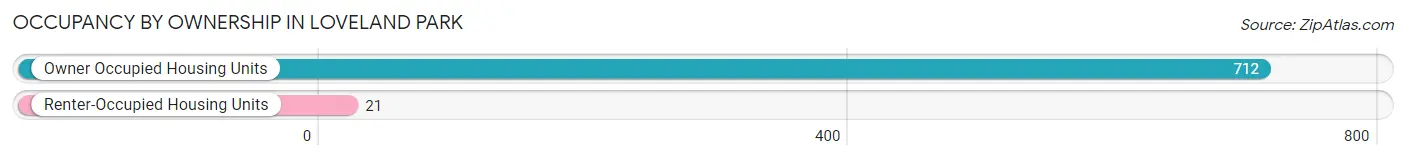
| Occupancy | # Housing Units | % Housing Units |
| Owner Occupied Housing Units | 712 | 97.1% |
| Renter-Occupied Housing Units | 21 | 2.9% |
| Total Occupied Housing Units | 733 | 100.0% |
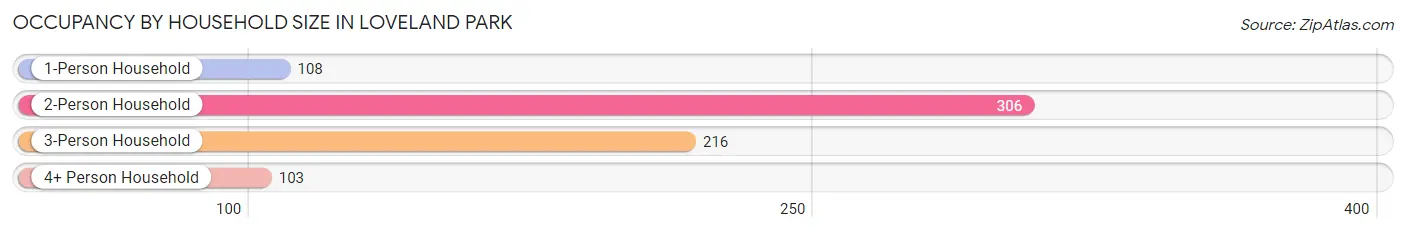
Occupancy by Household Size in Loveland Park
| Household Size | # Housing Units | % Housing Units |
| 1-Person Household | 108 | 14.7% |
| 2-Person Household | 306 | 41.7% |
| 3-Person Household | 216 | 29.5% |
| 4+ Person Household | 103 | 14.1% |
| Total Housing Units | 733 | 100.0% |
Occupancy by Ownership by Household Size in Loveland Park
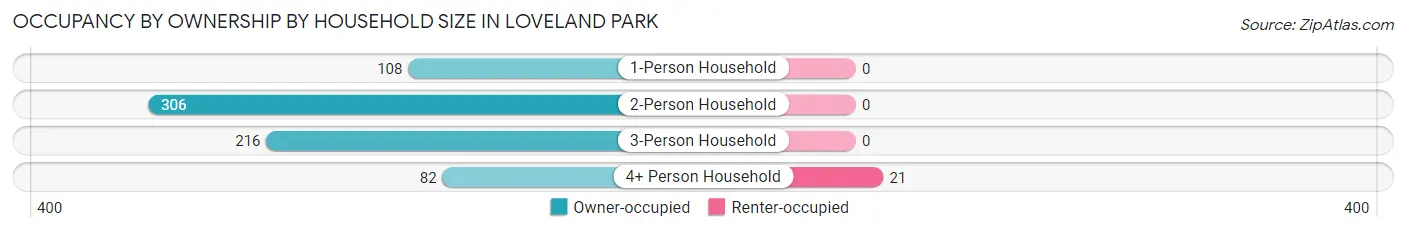
| Household Size | Owner-occupied | Renter-occupied |
| 1-Person Household | 108 (100.0%) | 0 (0.0%) |
| 2-Person Household | 306 (100.0%) | 0 (0.0%) |
| 3-Person Household | 216 (100.0%) | 0 (0.0%) |
| 4+ Person Household | 82 (79.6%) | 21 (20.4%) |
| Total Housing Units | 712 (97.1%) | 21 (2.9%) |
Occupancy by Educational Attainment in Loveland Park

| Household Size | Owner-occupied | Renter-occupied |
| Less than High School | 5 (100.0%) | 0 (0.0%) |
| High School Diploma | 233 (95.9%) | 10 (4.1%) |
| College/Associate Degree | 177 (100.0%) | 0 (0.0%) |
| Bachelor's Degree or higher | 297 (96.4%) | 11 (3.6%) |
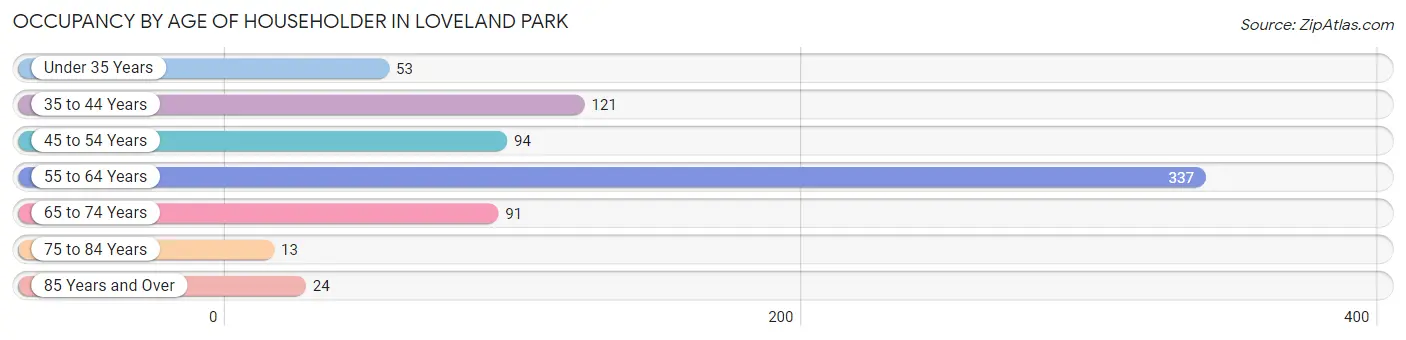
Occupancy by Age of Householder in Loveland Park
| Age Bracket | # Households | % Households |
| Under 35 Years | 53 | 7.2% |
| 35 to 44 Years | 121 | 16.5% |
| 45 to 54 Years | 94 | 12.8% |
| 55 to 64 Years | 337 | 46.0% |
| 65 to 74 Years | 91 | 12.4% |
| 75 to 84 Years | 13 | 1.8% |
| 85 Years and Over | 24 | 3.3% |
| Total | 733 | 100.0% |
Housing Finances in Loveland Park
Median Income by Occupancy in Loveland Park
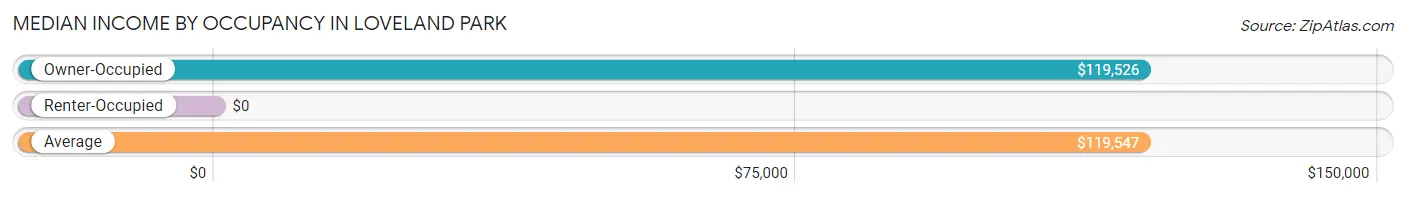
| Occupancy Type | # Households | Median Income |
| Owner-Occupied | 712 (97.1%) | $119,526 |
| Renter-Occupied | 21 (2.9%) | $0 |
| Average | 733 (100.0%) | $119,547 |
Occupancy by Householder Income Bracket in Loveland Park
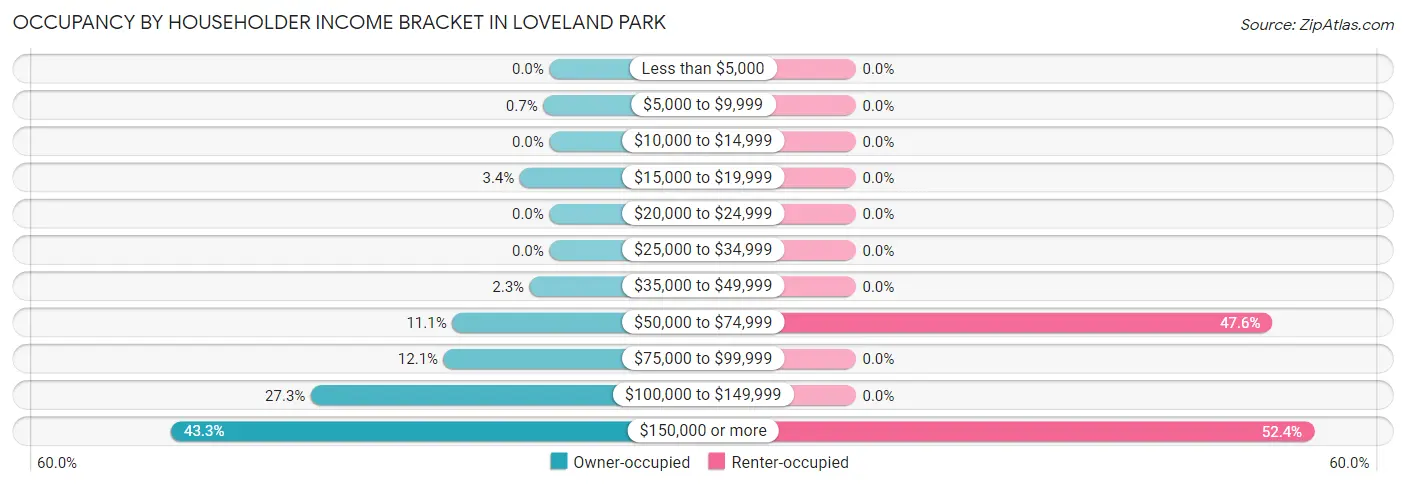
| Income Bracket | Owner-occupied | Renter-occupied |
| Less than $5,000 | 0 (0.0%) | 0 (0.0%) |
| $5,000 to $9,999 | 5 (0.7%) | 0 (0.0%) |
| $10,000 to $14,999 | 0 (0.0%) | 0 (0.0%) |
| $15,000 to $19,999 | 24 (3.4%) | 0 (0.0%) |
| $20,000 to $24,999 | 0 (0.0%) | 0 (0.0%) |
| $25,000 to $34,999 | 0 (0.0%) | 0 (0.0%) |
| $35,000 to $49,999 | 16 (2.2%) | 0 (0.0%) |
| $50,000 to $74,999 | 79 (11.1%) | 10 (47.6%) |
| $75,000 to $99,999 | 86 (12.1%) | 0 (0.0%) |
| $100,000 to $149,999 | 194 (27.3%) | 0 (0.0%) |
| $150,000 or more | 308 (43.3%) | 11 (52.4%) |
| Total | 712 (100.0%) | 21 (100.0%) |
Monthly Housing Cost Tiers in Loveland Park
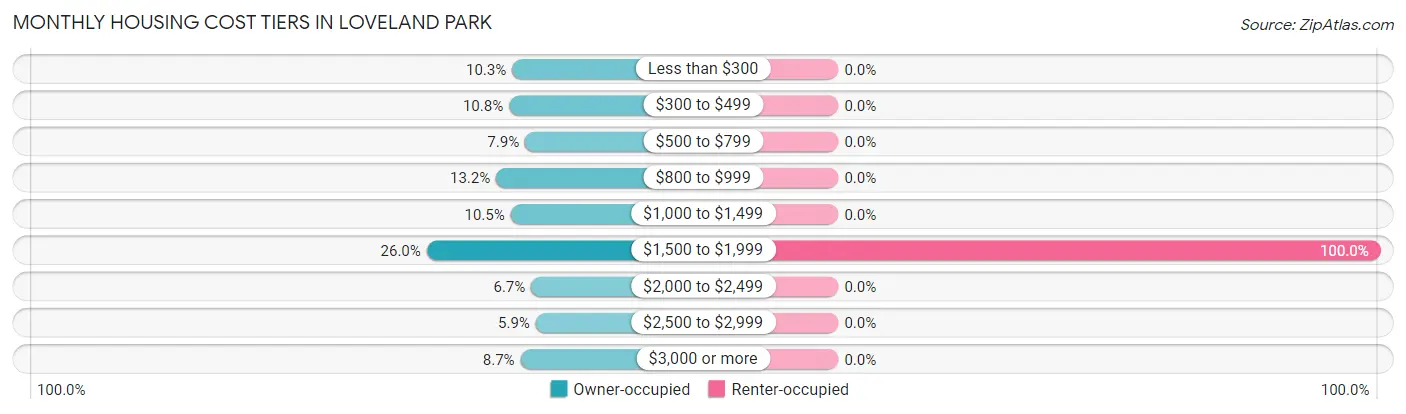
| Monthly Cost | Owner-occupied | Renter-occupied |
| Less than $300 | 73 (10.2%) | 0 (0.0%) |
| $300 to $499 | 77 (10.8%) | 0 (0.0%) |
| $500 to $799 | 56 (7.9%) | 0 (0.0%) |
| $800 to $999 | 94 (13.2%) | 0 (0.0%) |
| $1,000 to $1,499 | 75 (10.5%) | 0 (0.0%) |
| $1,500 to $1,999 | 185 (26.0%) | 21 (100.0%) |
| $2,000 to $2,499 | 48 (6.7%) | 0 (0.0%) |
| $2,500 to $2,999 | 42 (5.9%) | 0 (0.0%) |
| $3,000 or more | 62 (8.7%) | 0 (0.0%) |
| Total | 712 (100.0%) | 21 (100.0%) |
Physical Housing Characteristics in Loveland Park
Housing Structures in Loveland Park
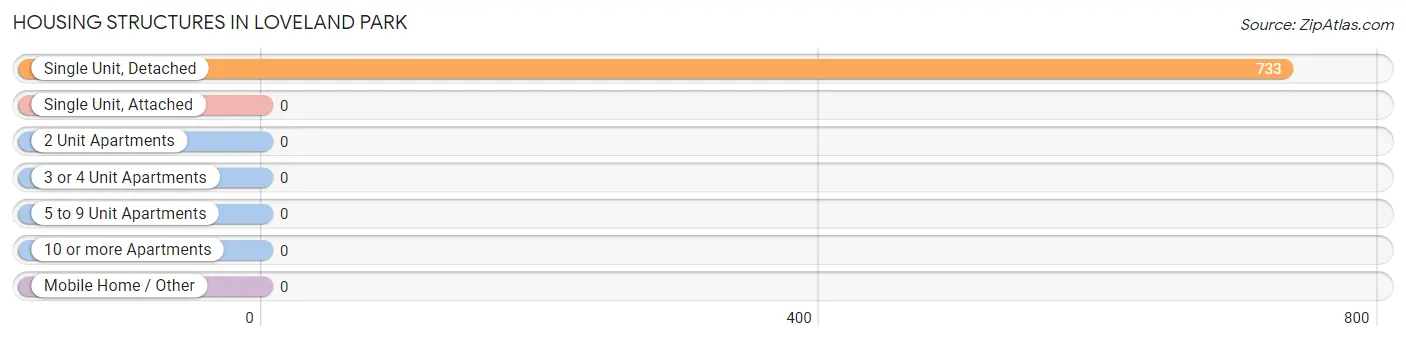
| Structure Type | # Housing Units | % Housing Units |
| Single Unit, Detached | 733 | 100.0% |
| Single Unit, Attached | 0 | 0.0% |
| 2 Unit Apartments | 0 | 0.0% |
| 3 or 4 Unit Apartments | 0 | 0.0% |
| 5 to 9 Unit Apartments | 0 | 0.0% |
| 10 or more Apartments | 0 | 0.0% |
| Mobile Home / Other | 0 | 0.0% |
| Total | 733 | 100.0% |
Housing Structures by Occupancy in Loveland Park
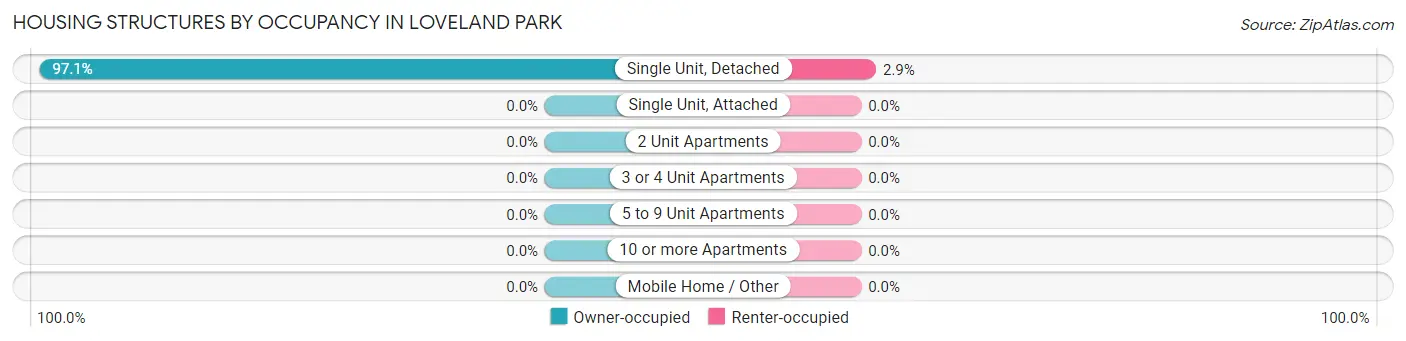
| Structure Type | Owner-occupied | Renter-occupied |
| Single Unit, Detached | 712 (97.1%) | 21 (2.9%) |
| Single Unit, Attached | 0 (0.0%) | 0 (0.0%) |
| 2 Unit Apartments | 0 (0.0%) | 0 (0.0%) |
| 3 or 4 Unit Apartments | 0 (0.0%) | 0 (0.0%) |
| 5 to 9 Unit Apartments | 0 (0.0%) | 0 (0.0%) |
| 10 or more Apartments | 0 (0.0%) | 0 (0.0%) |
| Mobile Home / Other | 0 (0.0%) | 0 (0.0%) |
| Total | 712 (97.1%) | 21 (2.9%) |
Housing Structures by Number of Rooms in Loveland Park
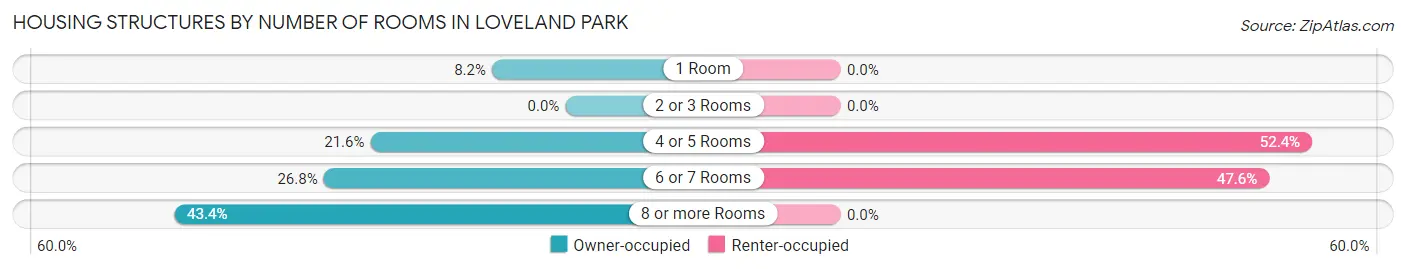
| Number of Rooms | Owner-occupied | Renter-occupied |
| 1 Room | 58 (8.2%) | 0 (0.0%) |
| 2 or 3 Rooms | 0 (0.0%) | 0 (0.0%) |
| 4 or 5 Rooms | 154 (21.6%) | 11 (52.4%) |
| 6 or 7 Rooms | 191 (26.8%) | 10 (47.6%) |
| 8 or more Rooms | 309 (43.4%) | 0 (0.0%) |
| Total | 712 (100.0%) | 21 (100.0%) |
Housing Structure by Heating Type in Loveland Park
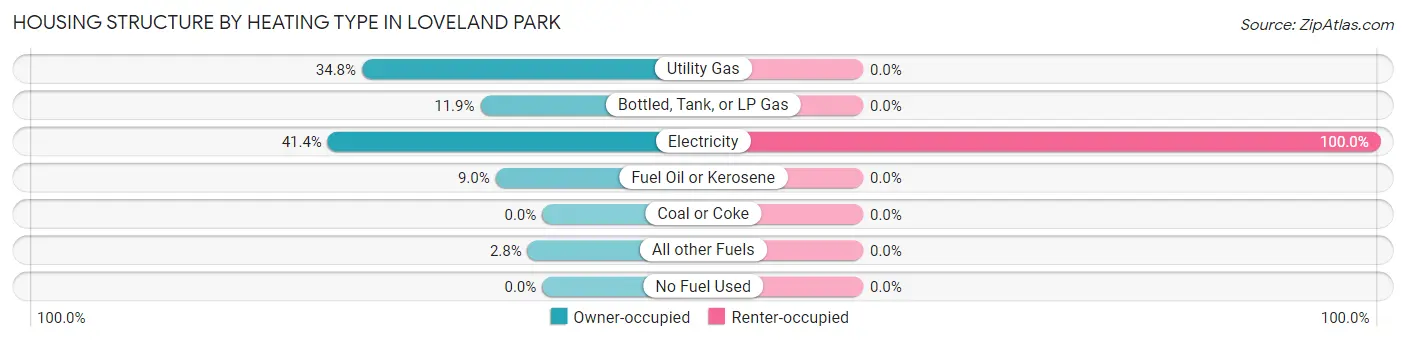
| Heating Type | Owner-occupied | Renter-occupied |
| Utility Gas | 248 (34.8%) | 0 (0.0%) |
| Bottled, Tank, or LP Gas | 85 (11.9%) | 0 (0.0%) |
| Electricity | 295 (41.4%) | 21 (100.0%) |
| Fuel Oil or Kerosene | 64 (9.0%) | 0 (0.0%) |
| Coal or Coke | 0 (0.0%) | 0 (0.0%) |
| All other Fuels | 20 (2.8%) | 0 (0.0%) |
| No Fuel Used | 0 (0.0%) | 0 (0.0%) |
| Total | 712 (100.0%) | 21 (100.0%) |
Household Vehicle Usage in Loveland Park
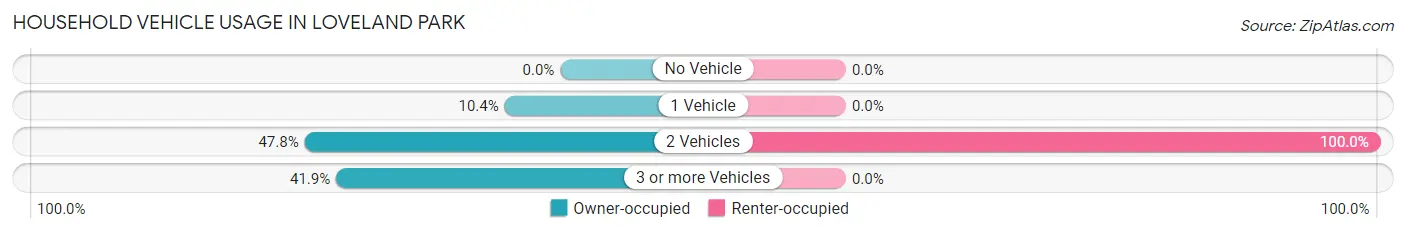
| Vehicles per Household | Owner-occupied | Renter-occupied |
| No Vehicle | 0 (0.0%) | 0 (0.0%) |
| 1 Vehicle | 74 (10.4%) | 0 (0.0%) |
| 2 Vehicles | 340 (47.7%) | 21 (100.0%) |
| 3 or more Vehicles | 298 (41.8%) | 0 (0.0%) |
| Total | 712 (100.0%) | 21 (100.0%) |
Real Estate & Mortgages in Loveland Park
Real Estate and Mortgage Overview in Loveland Park
| Characteristic | Without Mortgage | With Mortgage |
| Housing Units | 278 | 434 |
| Median Property Value | $160,300 | $281,300 |
| Median Household Income | $117,802 | $245 |
| Monthly Housing Costs | $478 | $62 |
| Real Estate Taxes | $2,286 | $0 |
Property Value by Mortgage Status in Loveland Park
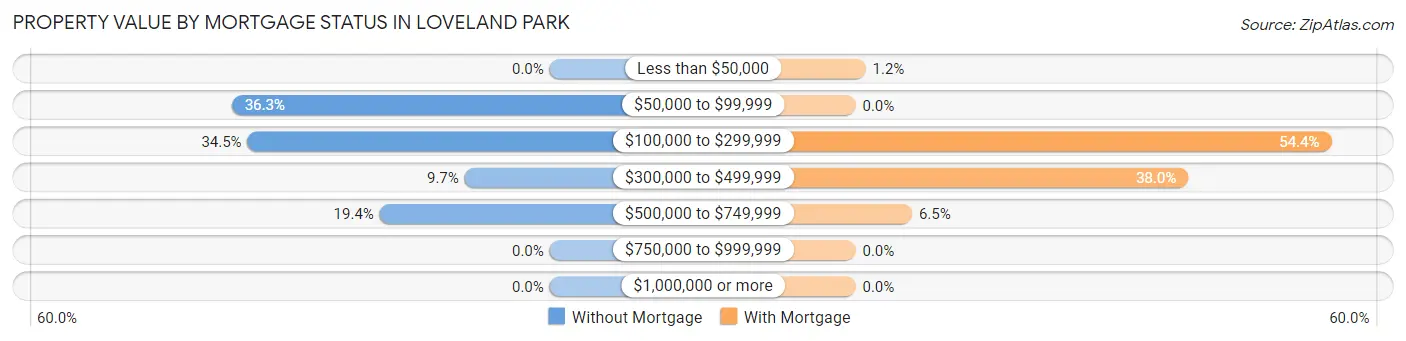
| Property Value | Without Mortgage | With Mortgage |
| Less than $50,000 | 0 (0.0%) | 5 (1.1%) |
| $50,000 to $99,999 | 101 (36.3%) | 0 (0.0%) |
| $100,000 to $299,999 | 96 (34.5%) | 236 (54.4%) |
| $300,000 to $499,999 | 27 (9.7%) | 165 (38.0%) |
| $500,000 to $749,999 | 54 (19.4%) | 28 (6.5%) |
| $750,000 to $999,999 | 0 (0.0%) | 0 (0.0%) |
| $1,000,000 or more | 0 (0.0%) | 0 (0.0%) |
| Total | 278 (100.0%) | 434 (100.0%) |
Household Income by Mortgage Status in Loveland Park
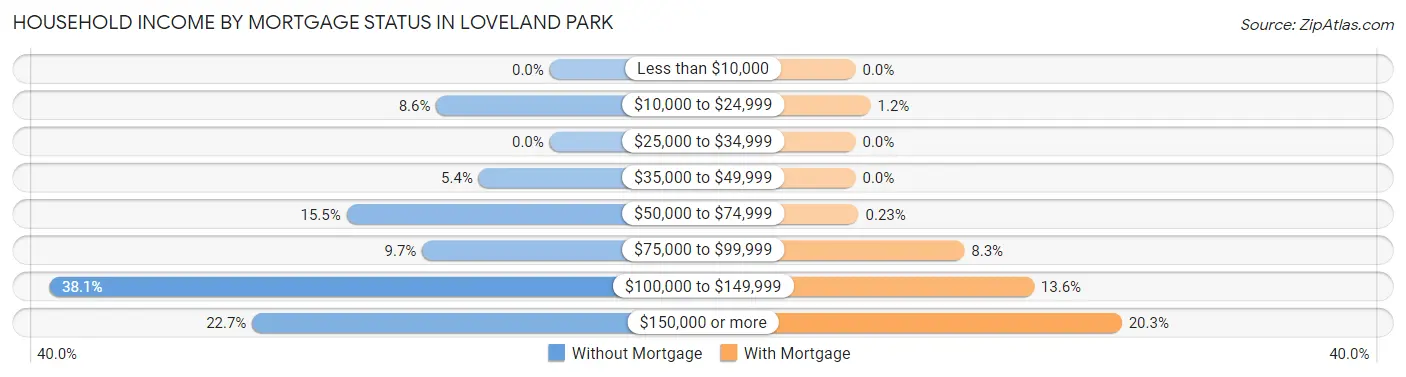
| Household Income | Without Mortgage | With Mortgage |
| Less than $10,000 | 0 (0.0%) | 0 (0.0%) |
| $10,000 to $24,999 | 24 (8.6%) | 5 (1.1%) |
| $25,000 to $34,999 | 0 (0.0%) | 0 (0.0%) |
| $35,000 to $49,999 | 15 (5.4%) | 0 (0.0%) |
| $50,000 to $74,999 | 43 (15.5%) | 1 (0.2%) |
| $75,000 to $99,999 | 27 (9.7%) | 36 (8.3%) |
| $100,000 to $149,999 | 106 (38.1%) | 59 (13.6%) |
| $150,000 or more | 63 (22.7%) | 88 (20.3%) |
| Total | 278 (100.0%) | 434 (100.0%) |
Property Value to Household Income Ratio in Loveland Park
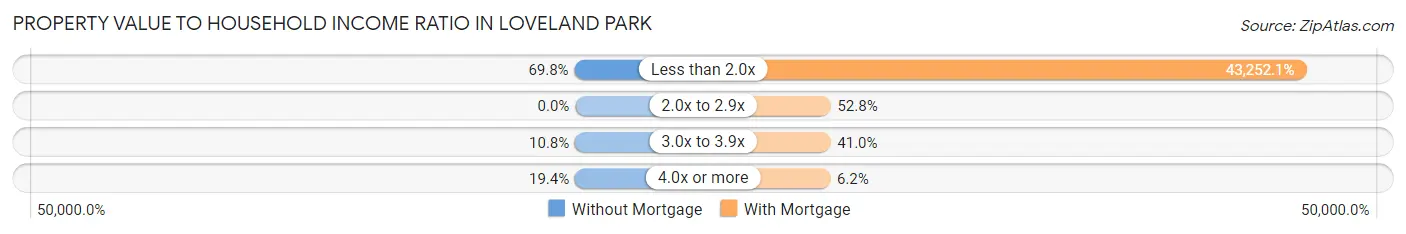
| Value-to-Income Ratio | Without Mortgage | With Mortgage |
| Less than 2.0x | 194 (69.8%) | 187,714 (43,252.1%) |
| 2.0x to 2.9x | 0 (0.0%) | 229 (52.8%) |
| 3.0x to 3.9x | 30 (10.8%) | 178 (41.0%) |
| 4.0x or more | 54 (19.4%) | 27 (6.2%) |
| Total | 278 (100.0%) | 434 (100.0%) |
Real Estate Taxes by Mortgage Status in Loveland Park
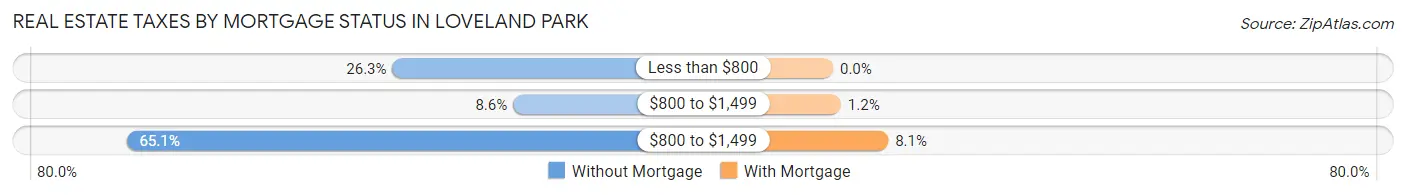
| Property Taxes | Without Mortgage | With Mortgage |
| Less than $800 | 73 (26.3%) | 0 (0.0%) |
| $800 to $1,499 | 24 (8.6%) | 5 (1.1%) |
| $800 to $1,499 | 181 (65.1%) | 35 (8.1%) |
| Total | 278 (100.0%) | 434 (100.0%) |
Health & Disability in Loveland Park
Health Insurance Coverage by Age in Loveland Park
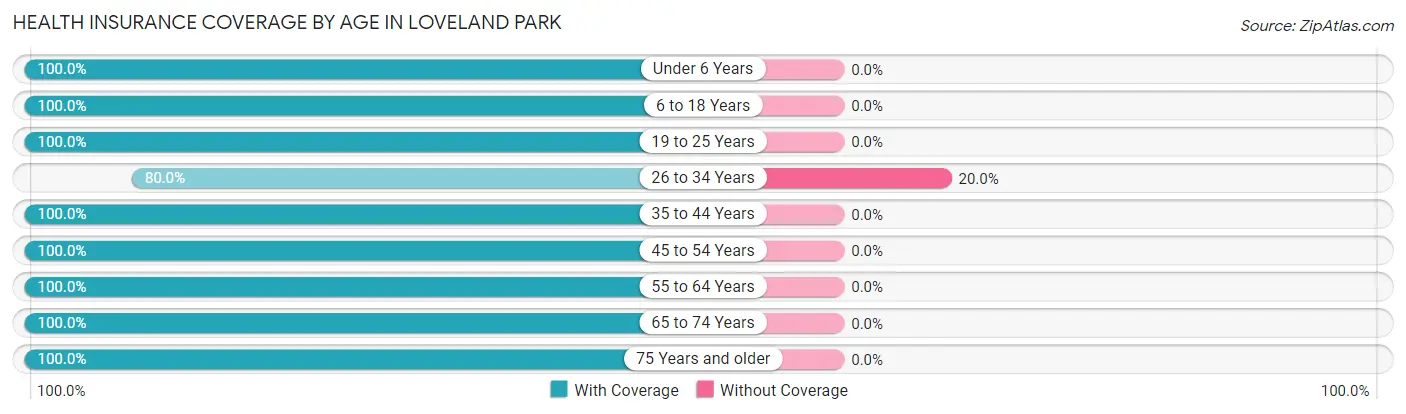
| Age Bracket | With Coverage | Without Coverage |
| Under 6 Years | 125 (100.0%) | 0 (0.0%) |
| 6 to 18 Years | 201 (100.0%) | 0 (0.0%) |
| 19 to 25 Years | 137 (100.0%) | 0 (0.0%) |
| 26 to 34 Years | 72 (80.0%) | 18 (20.0%) |
| 35 to 44 Years | 198 (100.0%) | 0 (0.0%) |
| 45 to 54 Years | 203 (100.0%) | 0 (0.0%) |
| 55 to 64 Years | 601 (100.0%) | 0 (0.0%) |
| 65 to 74 Years | 232 (100.0%) | 0 (0.0%) |
| 75 Years and older | 37 (100.0%) | 0 (0.0%) |
| Total | 1,806 (99.0%) | 18 (1.0%) |
Health Insurance Coverage by Citizenship Status in Loveland Park
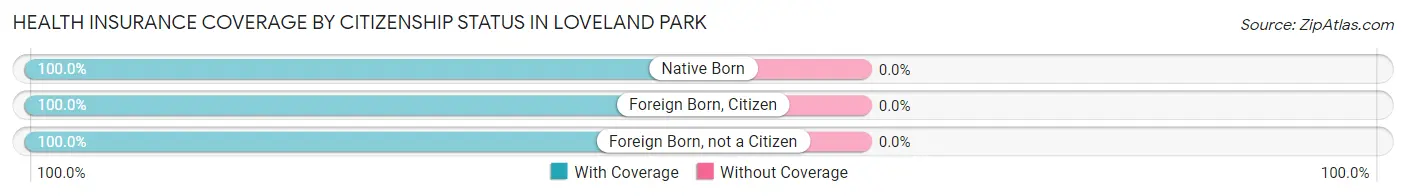
| Citizenship Status | With Coverage | Without Coverage |
| Native Born | 125 (100.0%) | 0 (0.0%) |
| Foreign Born, Citizen | 201 (100.0%) | 0 (0.0%) |
| Foreign Born, not a Citizen | 137 (100.0%) | 0 (0.0%) |
Health Insurance Coverage by Household Income in Loveland Park
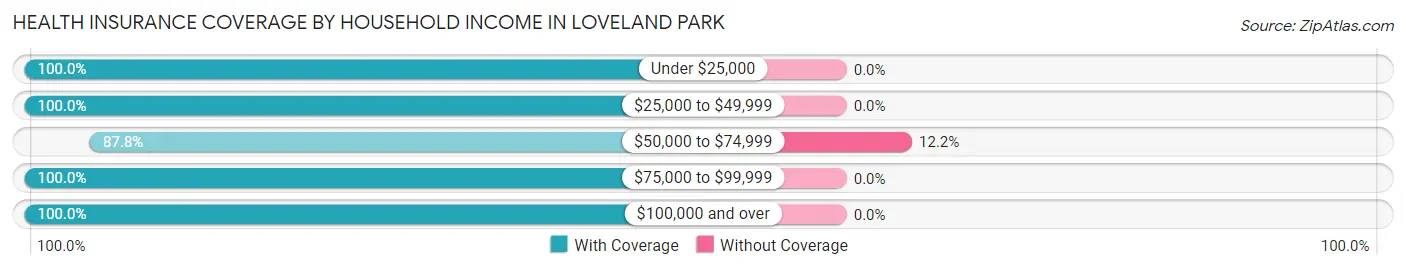
| Household Income | With Coverage | Without Coverage |
| Under $25,000 | 29 (100.0%) | 0 (0.0%) |
| $25,000 to $49,999 | 20 (100.0%) | 0 (0.0%) |
| $50,000 to $74,999 | 129 (87.8%) | 18 (12.2%) |
| $75,000 to $99,999 | 188 (100.0%) | 0 (0.0%) |
| $100,000 and over | 1,440 (100.0%) | 0 (0.0%) |
Public vs Private Health Insurance Coverage by Age in Loveland Park
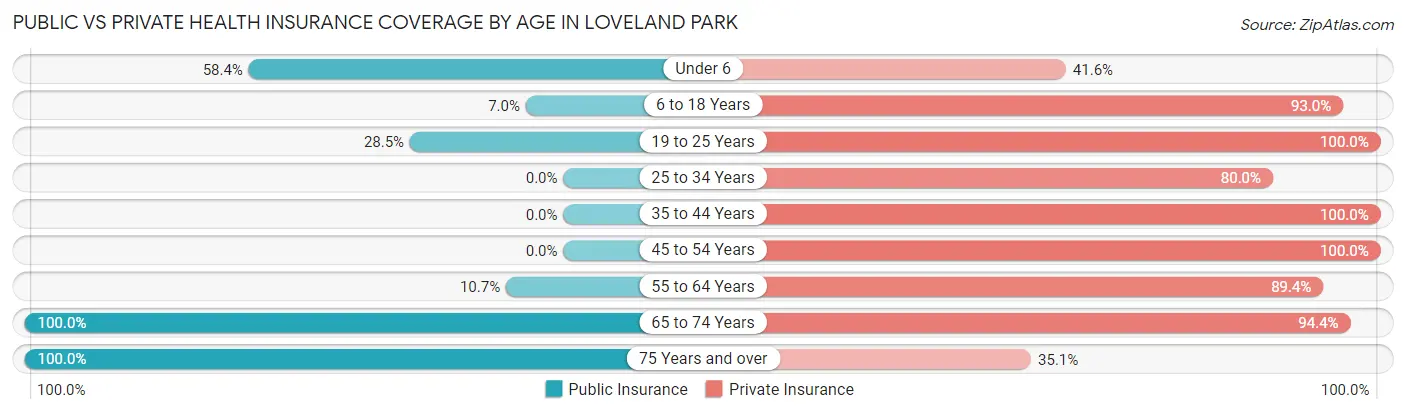
| Age Bracket | Public Insurance | Private Insurance |
| Under 6 | 73 (58.4%) | 52 (41.6%) |
| 6 to 18 Years | 14 (7.0%) | 187 (93.0%) |
| 19 to 25 Years | 39 (28.5%) | 137 (100.0%) |
| 25 to 34 Years | 0 (0.0%) | 72 (80.0%) |
| 35 to 44 Years | 0 (0.0%) | 198 (100.0%) |
| 45 to 54 Years | 0 (0.0%) | 203 (100.0%) |
| 55 to 64 Years | 64 (10.6%) | 537 (89.3%) |
| 65 to 74 Years | 232 (100.0%) | 219 (94.4%) |
| 75 Years and over | 37 (100.0%) | 13 (35.1%) |
| Total | 459 (25.2%) | 1,618 (88.7%) |
Disability Status by Sex by Age in Loveland Park
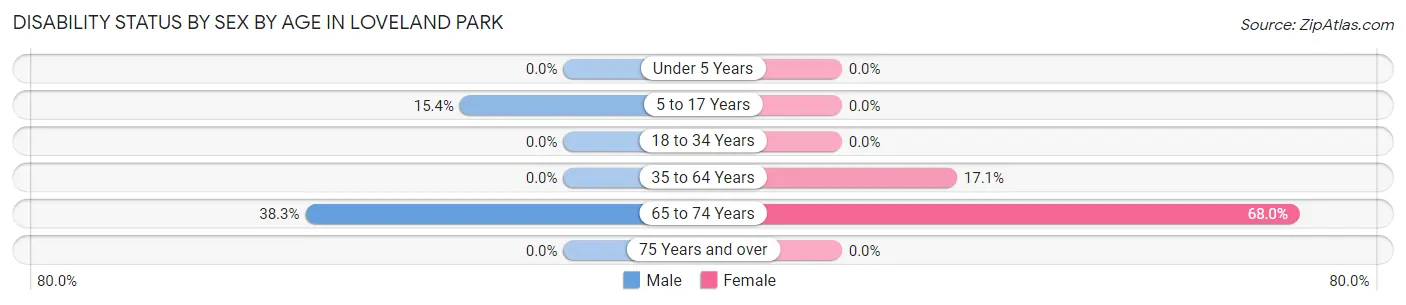
| Age Bracket | Male | Female |
| Under 5 Years | 0 (0.0%) | 0 (0.0%) |
| 5 to 17 Years | 16 (15.4%) | 0 (0.0%) |
| 18 to 34 Years | 0 (0.0%) | 0 (0.0%) |
| 35 to 64 Years | 0 (0.0%) | 87 (17.1%) |
| 65 to 74 Years | 41 (38.3%) | 85 (68.0%) |
| 75 Years and over | 0 (0.0%) | 0 (0.0%) |
Disability Class by Sex by Age in Loveland Park
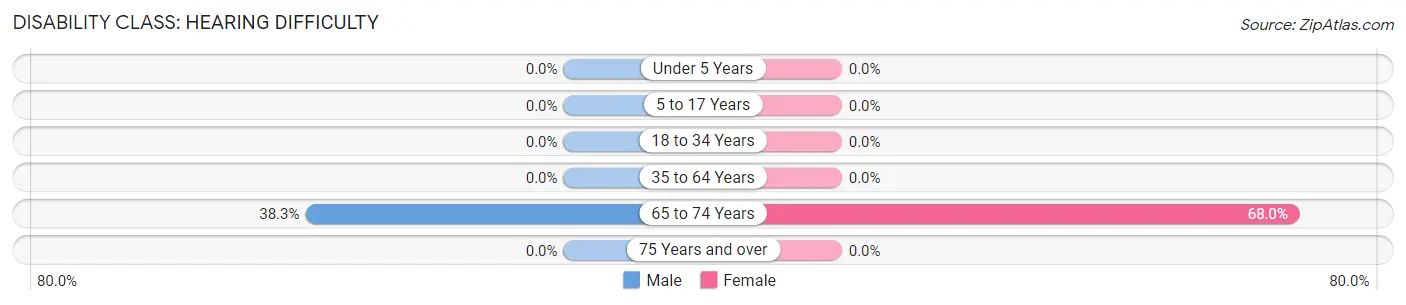
Disability Class: Hearing Difficulty
| Age Bracket | Male | Female |
| Under 5 Years | 0 (0.0%) | 0 (0.0%) |
| 5 to 17 Years | 0 (0.0%) | 0 (0.0%) |
| 18 to 34 Years | 0 (0.0%) | 0 (0.0%) |
| 35 to 64 Years | 0 (0.0%) | 0 (0.0%) |
| 65 to 74 Years | 41 (38.3%) | 85 (68.0%) |
| 75 Years and over | 0 (0.0%) | 0 (0.0%) |
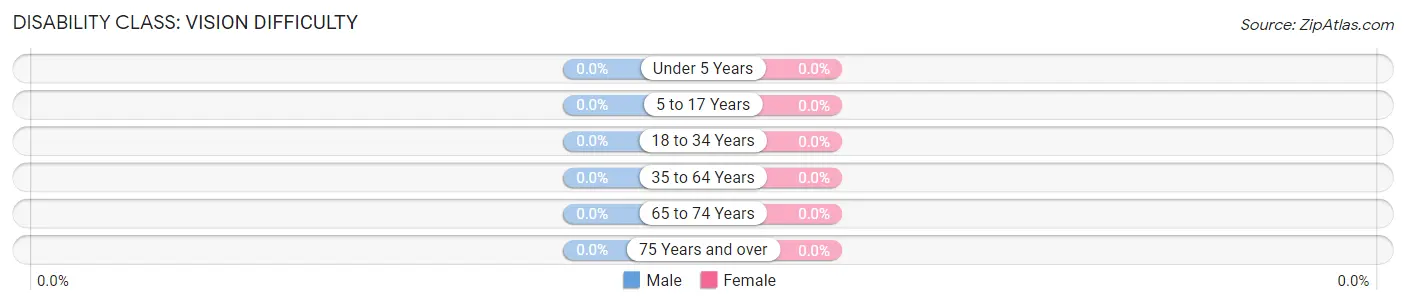
Disability Class: Vision Difficulty
| Age Bracket | Male | Female |
| Under 5 Years | 0 (0.0%) | 0 (0.0%) |
| 5 to 17 Years | 0 (0.0%) | 0 (0.0%) |
| 18 to 34 Years | 0 (0.0%) | 0 (0.0%) |
| 35 to 64 Years | 0 (0.0%) | 0 (0.0%) |
| 65 to 74 Years | 0 (0.0%) | 0 (0.0%) |
| 75 Years and over | 0 (0.0%) | 0 (0.0%) |
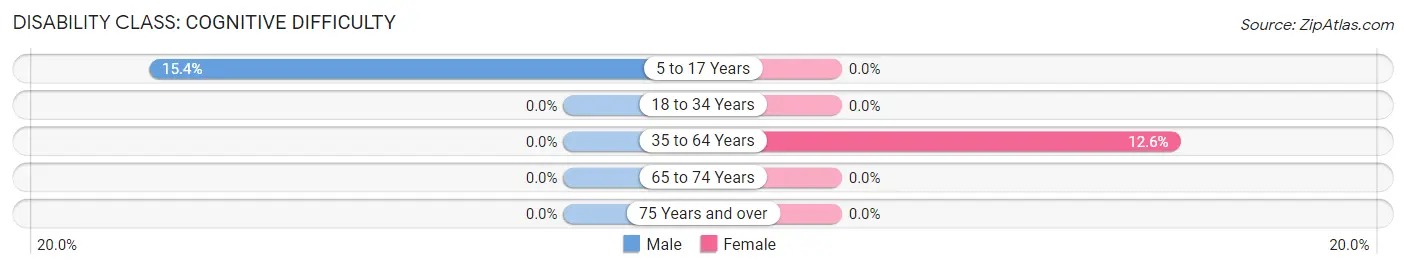
Disability Class: Cognitive Difficulty
| Age Bracket | Male | Female |
| 5 to 17 Years | 16 (15.4%) | 0 (0.0%) |
| 18 to 34 Years | 0 (0.0%) | 0 (0.0%) |
| 35 to 64 Years | 0 (0.0%) | 64 (12.6%) |
| 65 to 74 Years | 0 (0.0%) | 0 (0.0%) |
| 75 Years and over | 0 (0.0%) | 0 (0.0%) |
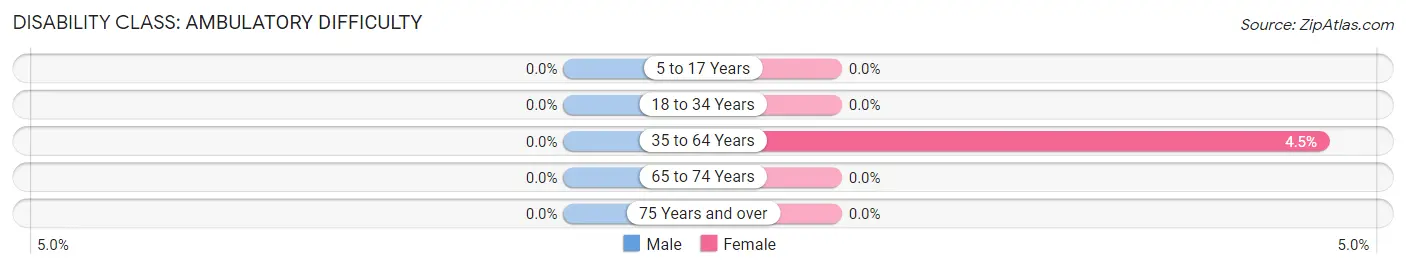
Disability Class: Ambulatory Difficulty
| Age Bracket | Male | Female |
| 5 to 17 Years | 0 (0.0%) | 0 (0.0%) |
| 18 to 34 Years | 0 (0.0%) | 0 (0.0%) |
| 35 to 64 Years | 0 (0.0%) | 23 (4.5%) |
| 65 to 74 Years | 0 (0.0%) | 0 (0.0%) |
| 75 Years and over | 0 (0.0%) | 0 (0.0%) |
Disability Class: Self-Care Difficulty
| Age Bracket | Male | Female |
| 5 to 17 Years | 0 (0.0%) | 0 (0.0%) |
| 18 to 34 Years | 0 (0.0%) | 0 (0.0%) |
| 35 to 64 Years | 0 (0.0%) | 0 (0.0%) |
| 65 to 74 Years | 0 (0.0%) | 0 (0.0%) |
| 75 Years and over | 0 (0.0%) | 0 (0.0%) |
Technology Access in Loveland Park
Computing Device Access in Loveland Park
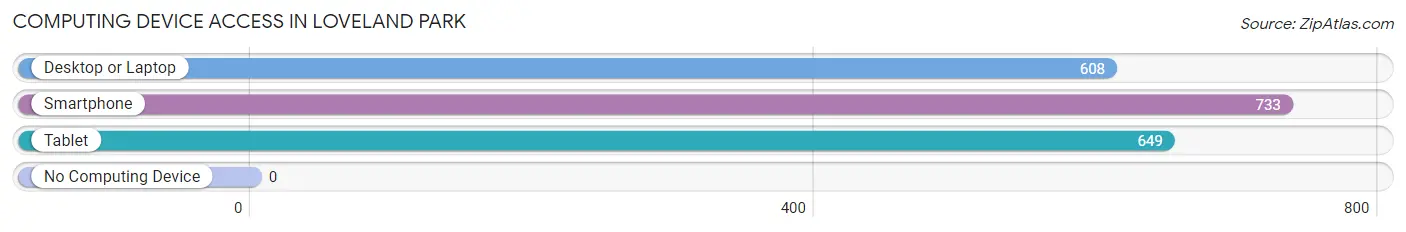
| Device Type | # Households | % Households |
| Desktop or Laptop | 608 | 83.0% |
| Smartphone | 733 | 100.0% |
| Tablet | 649 | 88.5% |
| No Computing Device | 0 | 0.0% |
| Total | 733 | 100.0% |
Internet Access in Loveland Park
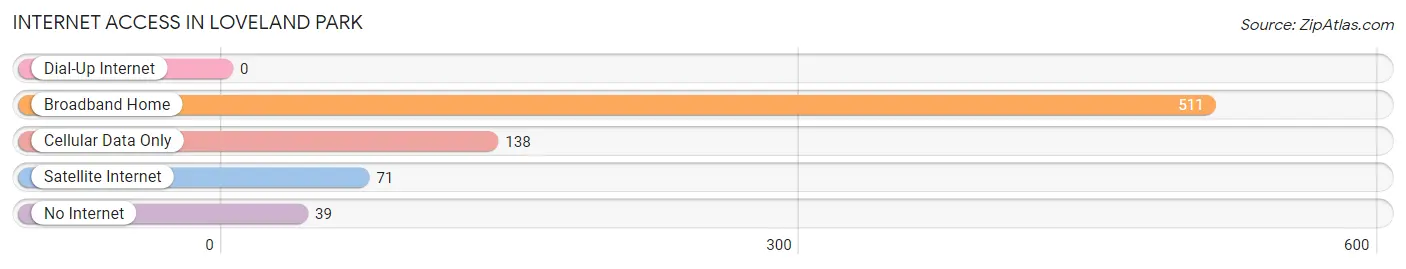
| Internet Type | # Households | % Households |
| Dial-Up Internet | 0 | 0.0% |
| Broadband Home | 511 | 69.7% |
| Cellular Data Only | 138 | 18.8% |
| Satellite Internet | 71 | 9.7% |
| No Internet | 39 | 5.3% |
| Total | 733 | 100.0% |
Loveland Park Summary
Loveland Park is a small village located in Hamilton County, Ohio. It is situated on the east side of the Little Miami River, just south of the city of Cincinnati. The village is home to approximately 1,000 people and is part of the Cincinnati Metropolitan Statistical Area.
History
Loveland Park was founded in 1845 by a group of settlers from the nearby town of Loveland. The settlers were looking for a place to build a new community and chose the area along the Little Miami River. The village was named after the nearby town of Loveland and was incorporated in 1853.
The village grew slowly over the years, but it was not until the late 19th century that it began to experience significant growth. This was due to the construction of the Little Miami Railroad, which connected Loveland Park to Cincinnati and other nearby towns. The railroad allowed for the transportation of goods and people, which helped to spur economic growth in the area.
In the early 20th century, Loveland Park experienced a period of rapid growth. This was due to the construction of the Loveland Park Dam, which was built to provide hydroelectric power to the area. The dam also created a lake, which became a popular recreational spot for locals and visitors alike.
Geography
Loveland Park is located in Hamilton County, Ohio. It is situated on the east side of the Little Miami River, just south of the city of Cincinnati. The village is bordered by the towns of Symmes Township to the north, Miami Township to the east, and Sycamore Township to the south.
The village covers an area of 1.2 square miles and is located at an elevation of 845 feet above sea level. The terrain is mostly flat, with some rolling hills in the northern part of the village. The climate is humid continental, with hot summers and cold winters.
Economy
The economy of Loveland Park is largely based on the service industry. The village is home to a variety of restaurants, retail stores, and other businesses. The village also has a number of manufacturing companies, including a plastics factory and a metal fabrication plant.
The village is also home to a number of small businesses, such as auto repair shops, hair salons, and other service-oriented businesses. The village is also home to a number of professional offices, such as lawyers and accountants.
Demographics
As of the 2010 census, the population of Loveland Park was 1,000. The racial makeup of the village was 97.2% White, 0.7% African American, 0.3% Native American, 0.3% Asian, and 1.5% from other races. The median household income was $50,000, and the median age was 40.
Conclusion
Loveland Park is a small village located in Hamilton County, Ohio. It is situated on the east side of the Little Miami River, just south of the city of Cincinnati. The village is home to approximately 1,000 people and is part of the Cincinnati Metropolitan Statistical Area. The economy of Loveland Park is largely based on the service industry, and the village is home to a variety of restaurants, retail stores, and other businesses. The racial makeup of the village is 97.2% White, 0.7% African American, 0.3% Native American, 0.3% Asian, and 1.5% from other races. The median household income was $50,000, and the median age was 40.
Common Questions
What is Per Capita Income in Loveland Park?
Per Capita income in Loveland Park is $77,546.
What is the Median Family Income in Loveland Park?
Median Family Income in Loveland Park is $135,500.
What is the Median Household income in Loveland Park?
Median Household Income in Loveland Park is $119,547.
What is Income or Wage Gap in Loveland Park?
Income or Wage Gap in Loveland Park is 15.9%.
Women in Loveland Park earn 84.1 cents for every dollar earned by a man.
What is Inequality or Gini Index in Loveland Park?
Inequality or Gini Index in Loveland Park is 0.43.
What is the Total Population of Loveland Park?
Total Population of Loveland Park is 1,824.
What is the Total Male Population of Loveland Park?
Total Male Population of Loveland Park is 889.
What is the Total Female Population of Loveland Park?
Total Female Population of Loveland Park is 935.
What is the Ratio of Males per 100 Females in Loveland Park?
There are 95.08 Males per 100 Females in Loveland Park.
What is the Ratio of Females per 100 Males in Loveland Park?
There are 105.17 Females per 100 Males in Loveland Park.
What is the Median Population Age in Loveland Park?
Median Population Age in Loveland Park is 53.0 Years.
What is the Average Family Size in Loveland Park
Average Family Size in Loveland Park is 2.7 People.
What is the Average Household Size in Loveland Park
Average Household Size in Loveland Park is 2.5 People.
How Large is the Labor Force in Loveland Park?
There are 1,098 People in the Labor Forcein in Loveland Park.
What is the Percentage of People in the Labor Force in Loveland Park?
70.9% of People are in the Labor Force in Loveland Park.