Thornport, OH Map & Demographics
Thornport Map
Thornport Overview
$52,873
PER CAPITA INCOME
$155,438
AVG FAMILY INCOME
$110,000
AVG HOUSEHOLD INCOME
0.39
INEQUALITY / GINI INDEX
1,040
TOTAL POPULATION
557
MALE POPULATION
483
FEMALE POPULATION
115.32
MALES / 100 FEMALES
86.71
FEMALES / 100 MALES
56.4
MEDIAN AGE
2.6
AVG FAMILY SIZE
2.2
AVG HOUSEHOLD SIZE
516
LABOR FORCE [ PEOPLE ]
53.9%
PERCENT IN LABOR FORCE
3.3%
UNEMPLOYMENT RATE
Income in Thornport
Income Overview in Thornport
Per Capita Income in Thornport is $52,873, while median incomes of families and households are $155,438 and $110,000 respectively.
| Characteristic | Number | Measure |
| Per Capita Income | 1,040 | $52,873 |
| Median Family Income | 356 | $155,438 |
| Mean Family Income | 356 | $154,379 |
| Median Household Income | 462 | $110,000 |
| Mean Household Income | 462 | $126,798 |
| Income Deficit | 356 | $0 |
| Wage / Income Gap (%) | 1,040 | 0.00% |
| Wage / Income Gap ($) | 1,040 | 100.00¢ per $1 |
| Gini / Inequality Index | 1,040 | 0.39 |
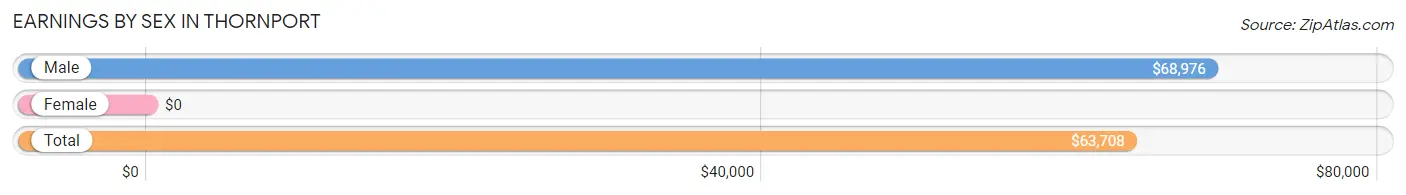
Earnings by Sex in Thornport
| Sex | Number | Average Earnings |
| Male | 287 (51.7%) | $68,976 |
| Female | 268 (48.3%) | $0 |
| Total | 555 (100.0%) | $63,708 |
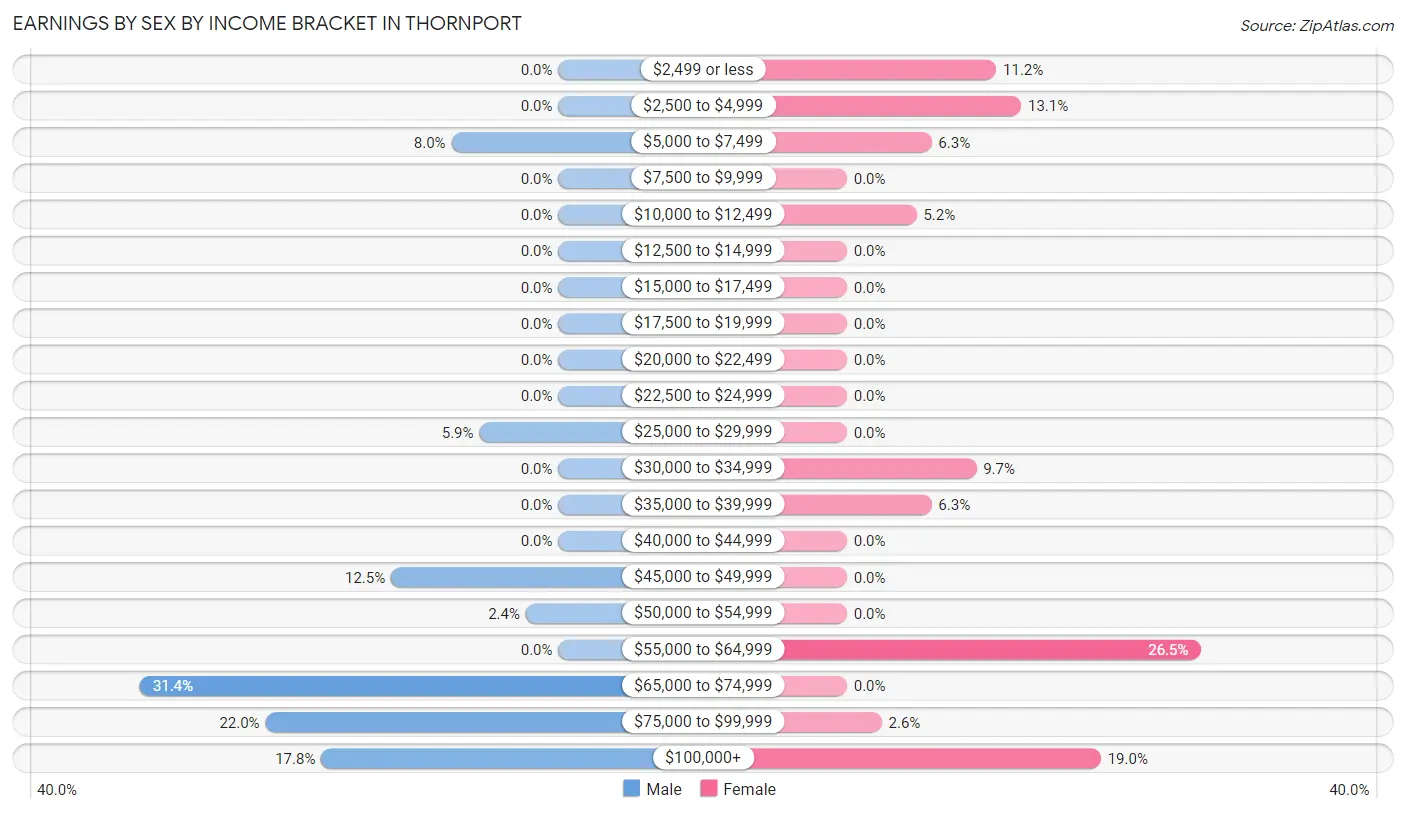
Earnings by Sex by Income Bracket in Thornport
The most common earnings brackets in Thornport are $65,000 to $74,999 for men (90 | 31.4%) and $55,000 to $64,999 for women (71 | 26.5%).
| Income | Male | Female |
| $2,499 or less | 0 (0.0%) | 30 (11.2%) |
| $2,500 to $4,999 | 0 (0.0%) | 35 (13.1%) |
| $5,000 to $7,499 | 23 (8.0%) | 17 (6.3%) |
| $7,500 to $9,999 | 0 (0.0%) | 0 (0.0%) |
| $10,000 to $12,499 | 0 (0.0%) | 14 (5.2%) |
| $12,500 to $14,999 | 0 (0.0%) | 0 (0.0%) |
| $15,000 to $17,499 | 0 (0.0%) | 0 (0.0%) |
| $17,500 to $19,999 | 0 (0.0%) | 0 (0.0%) |
| $20,000 to $22,499 | 0 (0.0%) | 0 (0.0%) |
| $22,500 to $24,999 | 0 (0.0%) | 0 (0.0%) |
| $25,000 to $29,999 | 17 (5.9%) | 0 (0.0%) |
| $30,000 to $34,999 | 0 (0.0%) | 26 (9.7%) |
| $35,000 to $39,999 | 0 (0.0%) | 17 (6.3%) |
| $40,000 to $44,999 | 0 (0.0%) | 0 (0.0%) |
| $45,000 to $49,999 | 36 (12.5%) | 0 (0.0%) |
| $50,000 to $54,999 | 7 (2.4%) | 0 (0.0%) |
| $55,000 to $64,999 | 0 (0.0%) | 71 (26.5%) |
| $65,000 to $74,999 | 90 (31.4%) | 0 (0.0%) |
| $75,000 to $99,999 | 63 (22.0%) | 7 (2.6%) |
| $100,000+ | 51 (17.8%) | 51 (19.0%) |
| Total | 287 (100.0%) | 268 (100.0%) |
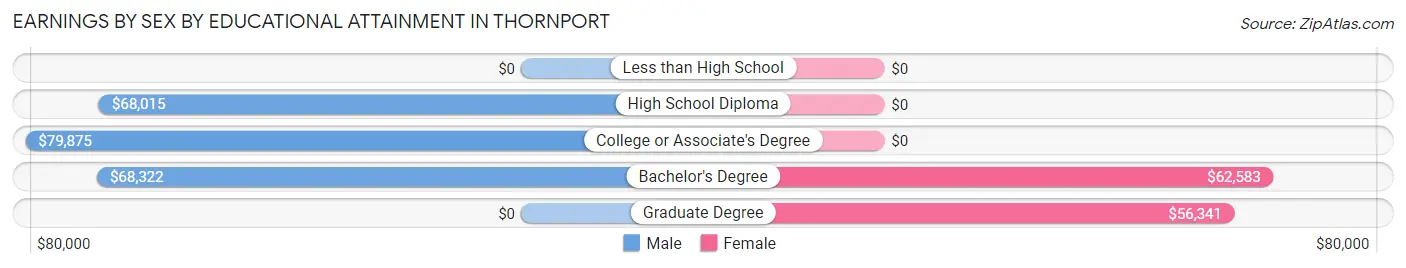
Earnings by Sex by Educational Attainment in Thornport
Average earnings in Thornport are $69,375 for men and $55,610 for women, a difference of 19.8%. Men with an educational attainment of college or associate's degree enjoy the highest average annual earnings of $79,875, while those with high school diploma education earn the least with $68,015. Women with an educational attainment of bachelor's degree earn the most with the average annual earnings of $62,583, while those with graduate degree education have the smallest earnings of $56,341.
| Educational Attainment | Male Income | Female Income |
| Less than High School | - | - |
| High School Diploma | $68,015 | $0 |
| College or Associate's Degree | $79,875 | $0 |
| Bachelor's Degree | $68,322 | $62,583 |
| Graduate Degree | - | - |
| Total | $69,375 | $55,610 |
Family Income in Thornport
Family Income Brackets in Thornport
According to the Thornport family income data, there are 94 families falling into the $150,000 to $199,999 income range, which is the most common income bracket and makes up 26.4% of all families.
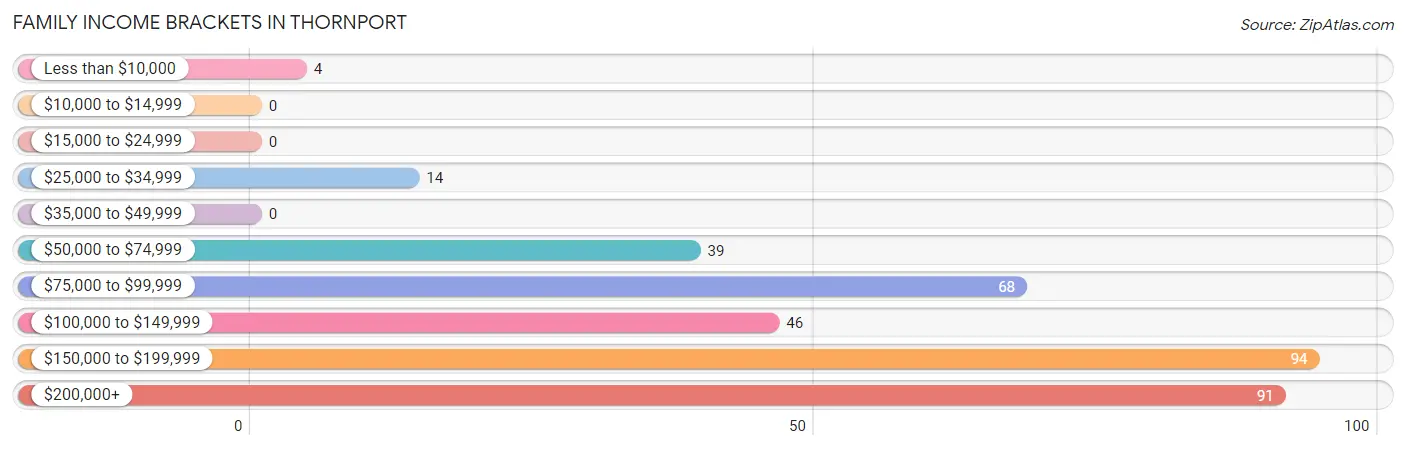
| Income Bracket | # Families | % Families |
| Less than $10,000 | 4 | 1.1% |
| $10,000 to $14,999 | 0 | 0.0% |
| $15,000 to $24,999 | 0 | 0.0% |
| $25,000 to $34,999 | 14 | 3.9% |
| $35,000 to $49,999 | 0 | 0.0% |
| $50,000 to $74,999 | 39 | 11.0% |
| $75,000 to $99,999 | 68 | 19.1% |
| $100,000 to $149,999 | 46 | 12.9% |
| $150,000 to $199,999 | 94 | 26.4% |
| $200,000+ | 91 | 25.6% |
Family Income by Famaliy Size in Thornport
3-person families (59 | 16.6%) account for the highest median family income in Thornport with $230,451 per family, while 2-person families (219 | 61.5%) have the highest median income of $77,610 per family member.
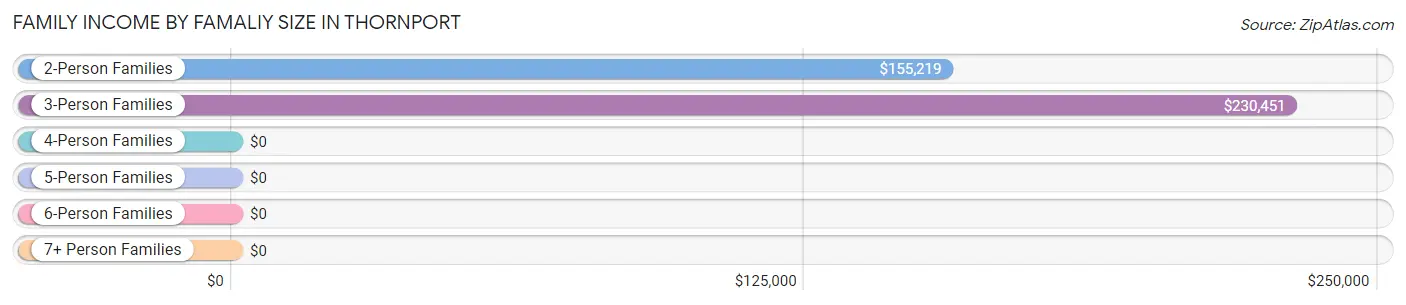
| Income Bracket | # Families | Median Income |
| 2-Person Families | 219 (61.5%) | $155,219 |
| 3-Person Families | 59 (16.6%) | $230,451 |
| 4-Person Families | 48 (13.5%) | $0 |
| 5-Person Families | 30 (8.4%) | $0 |
| 6-Person Families | 0 (0.0%) | $0 |
| 7+ Person Families | 0 (0.0%) | $0 |
| Total | 356 (100.0%) | $155,438 |
Family Income by Number of Earners in Thornport
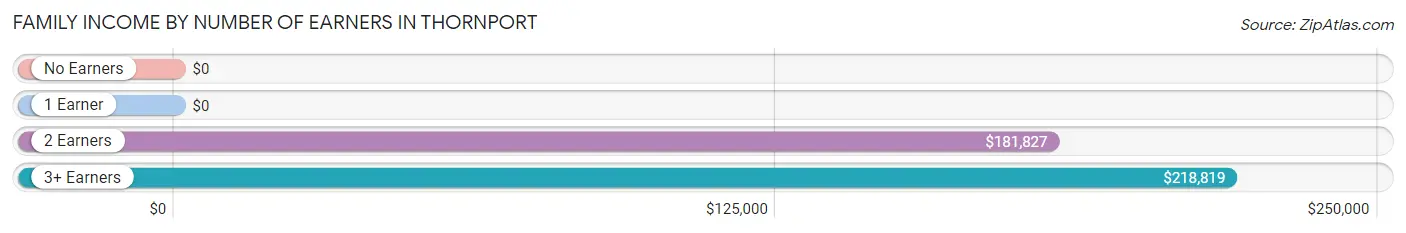
| Number of Earners | # Families | Median Income |
| No Earners | 94 (26.4%) | $0 |
| 1 Earner | 50 (14.0%) | $0 |
| 2 Earners | 123 (34.5%) | $181,827 |
| 3+ Earners | 89 (25.0%) | $218,819 |
| Total | 356 (100.0%) | $155,438 |
Household Income in Thornport
Household Income Brackets in Thornport
With 94 households falling in the category, the $150,000 to $199,999 income range is the most frequent in Thornport, accounting for 20.3% of all households.
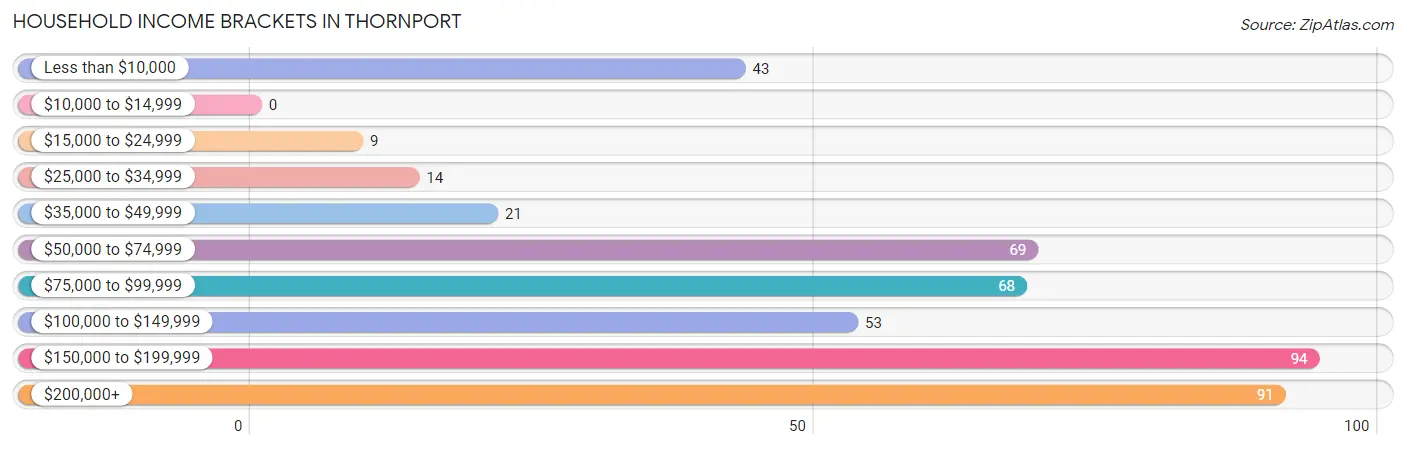
| Income Bracket | # Households | % Households |
| Less than $10,000 | 43 | 9.3% |
| $10,000 to $14,999 | 0 | 0.0% |
| $15,000 to $24,999 | 9 | 1.9% |
| $25,000 to $34,999 | 14 | 3.0% |
| $35,000 to $49,999 | 21 | 4.5% |
| $50,000 to $74,999 | 69 | 14.9% |
| $75,000 to $99,999 | 68 | 14.7% |
| $100,000 to $149,999 | 53 | 11.5% |
| $150,000 to $199,999 | 94 | 20.3% |
| $200,000+ | 91 | 19.7% |
Household Income by Householder Age in Thornport
The median household income in Thornport is $110,000, with the highest median household income of $175,000 found in the 45 to 64 years age bracket for the primary householder. A total of 182 households (39.4%) fall into this category.
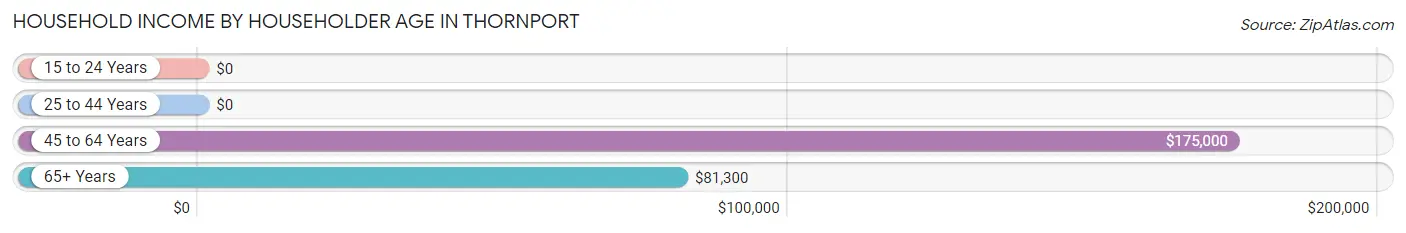
| Income Bracket | # Households | Median Income |
| 15 to 24 Years | 0 (0.0%) | $0 |
| 25 to 44 Years | 48 (10.4%) | $0 |
| 45 to 64 Years | 182 (39.4%) | $175,000 |
| 65+ Years | 232 (50.2%) | $81,300 |
| Total | 462 (100.0%) | $110,000 |
Poverty in Thornport
Income Below Poverty by Sex and Age in Thornport
With 0.9% poverty level for males and 8.9% for females among the residents of Thornport, 65 to 74 year old males and 55 to 64 year old females are the most vulnerable to poverty, with 5 males (5.1%) and 39 females (23.4%) in their respective age groups living below the poverty level.
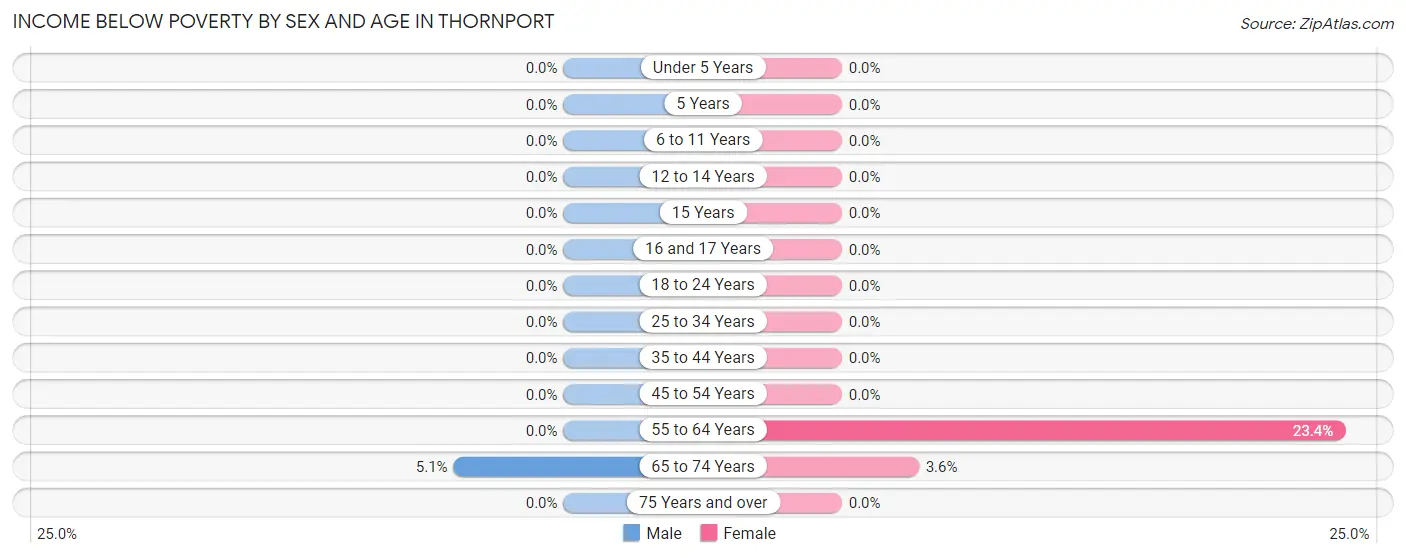
| Age Bracket | Male | Female |
| Under 5 Years | 0 (0.0%) | 0 (0.0%) |
| 5 Years | 0 (0.0%) | 0 (0.0%) |
| 6 to 11 Years | 0 (0.0%) | 0 (0.0%) |
| 12 to 14 Years | 0 (0.0%) | 0 (0.0%) |
| 15 Years | 0 (0.0%) | 0 (0.0%) |
| 16 and 17 Years | 0 (0.0%) | 0 (0.0%) |
| 18 to 24 Years | 0 (0.0%) | 0 (0.0%) |
| 25 to 34 Years | 0 (0.0%) | 0 (0.0%) |
| 35 to 44 Years | 0 (0.0%) | 0 (0.0%) |
| 45 to 54 Years | 0 (0.0%) | 0 (0.0%) |
| 55 to 64 Years | 0 (0.0%) | 39 (23.4%) |
| 65 to 74 Years | 5 (5.1%) | 4 (3.6%) |
| 75 Years and over | 0 (0.0%) | 0 (0.0%) |
| Total | 5 (0.9%) | 43 (8.9%) |
Income Above Poverty by Sex and Age in Thornport
According to the poverty statistics in Thornport, males aged 5 years and females aged under 5 years are the age groups that are most secure financially, with 100.0% of males and 100.0% of females in these age groups living above the poverty line.
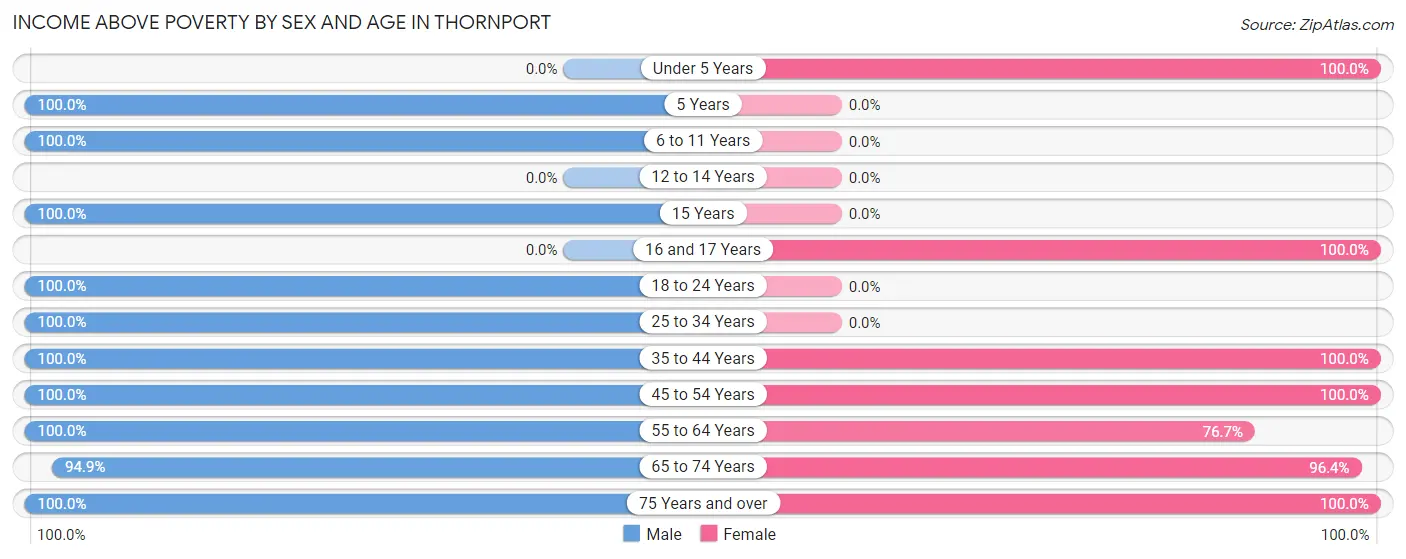
| Age Bracket | Male | Female |
| Under 5 Years | 0 (0.0%) | 23 (100.0%) |
| 5 Years | 27 (100.0%) | 0 (0.0%) |
| 6 to 11 Years | 15 (100.0%) | 0 (0.0%) |
| 12 to 14 Years | 0 (0.0%) | 0 (0.0%) |
| 15 Years | 18 (100.0%) | 0 (0.0%) |
| 16 and 17 Years | 0 (0.0%) | 30 (100.0%) |
| 18 to 24 Years | 23 (100.0%) | 0 (0.0%) |
| 25 to 34 Years | 126 (100.0%) | 0 (0.0%) |
| 35 to 44 Years | 13 (100.0%) | 52 (100.0%) |
| 45 to 54 Years | 96 (100.0%) | 52 (100.0%) |
| 55 to 64 Years | 54 (100.0%) | 128 (76.6%) |
| 65 to 74 Years | 93 (94.9%) | 108 (96.4%) |
| 75 Years and over | 87 (100.0%) | 47 (100.0%) |
| Total | 552 (99.1%) | 440 (91.1%) |
Income Below Poverty Among Married-Couple Families in Thornport
The poverty statistics for married-couple families in Thornport show that 1.1% or 4 of the total 351 families live below the poverty line. Families with no children have the highest poverty rate of 1.5%, comprising of 4 families. On the other hand, families with 1 or 2 children have the lowest poverty rate of 0.0%, which includes 0 families.
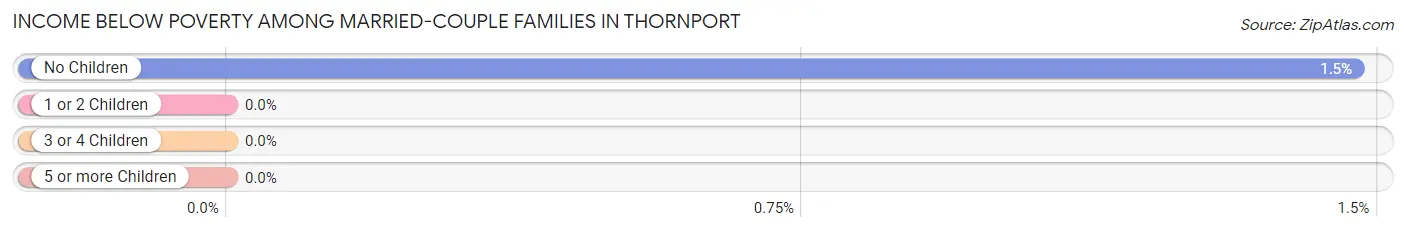
| Children | Above Poverty | Below Poverty |
| No Children | 269 (98.5%) | 4 (1.5%) |
| 1 or 2 Children | 78 (100.0%) | 0 (0.0%) |
| 3 or 4 Children | 0 (0.0%) | 0 (0.0%) |
| 5 or more Children | 0 (0.0%) | 0 (0.0%) |
| Total | 347 (98.9%) | 4 (1.1%) |
Income Below Poverty Among Single-Parent Households in Thornport
| Children | Single Father | Single Mother |
| No Children | 0 (0.0%) | 0 (0.0%) |
| 1 or 2 Children | 0 (0.0%) | 0 (0.0%) |
| 3 or 4 Children | 0 (0.0%) | 0 (0.0%) |
| 5 or more Children | 0 (0.0%) | 0 (0.0%) |
| Total | 0 (0.0%) | 0 (0.0%) |
Income Below Poverty Among Married-Couple vs Single-Parent Households in Thornport
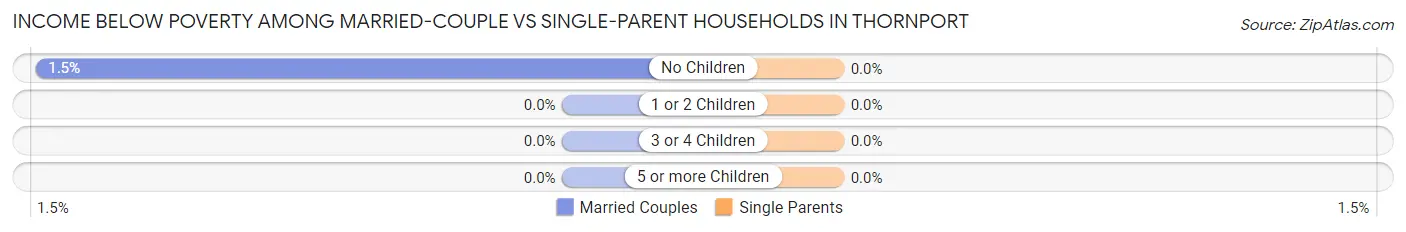
| Children | Married-Couple Families | Single-Parent Households |
| No Children | 4 (1.5%) | 0 (0.0%) |
| 1 or 2 Children | 0 (0.0%) | 0 (0.0%) |
| 3 or 4 Children | 0 (0.0%) | 0 (0.0%) |
| 5 or more Children | 0 (0.0%) | 0 (0.0%) |
| Total | 4 (1.1%) | 0 (0.0%) |
Race in Thornport
The most populous races in Thornport are White / Caucasian (901 | 86.6%), Two or more Races (139 | 13.4%), and Hispanic or Latino (121 | 11.6%).
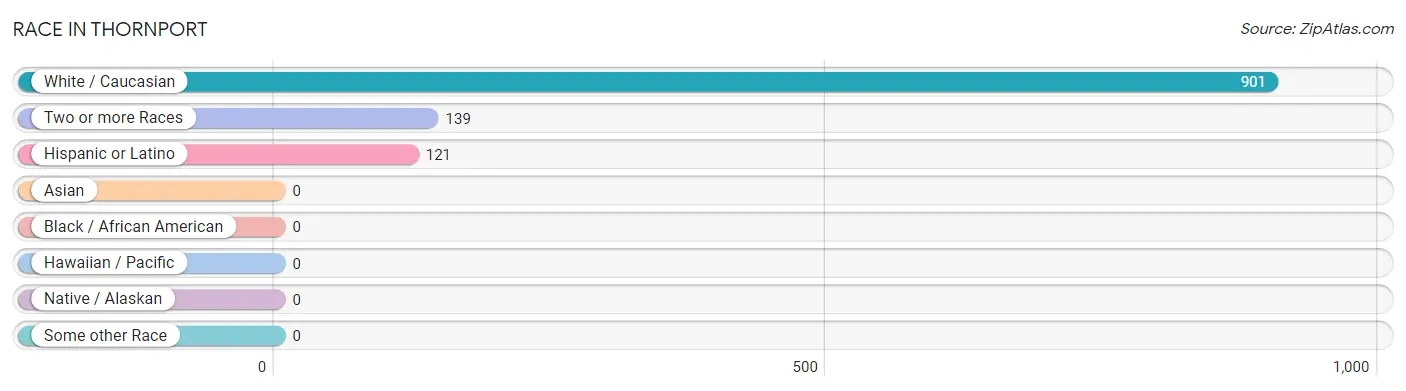
| Race | # Population | % Population |
| Asian | 0 | 0.0% |
| Black / African American | 0 | 0.0% |
| Hawaiian / Pacific | 0 | 0.0% |
| Hispanic or Latino | 121 | 11.6% |
| Native / Alaskan | 0 | 0.0% |
| White / Caucasian | 901 | 86.6% |
| Two or more Races | 139 | 13.4% |
| Some other Race | 0 | 0.0% |
| Total | 1,040 | 100.0% |
Ancestry in Thornport
The most populous ancestries reported in Thornport are Irish (172 | 16.5%), German (171 | 16.4%), American (169 | 16.3%), Mexican (121 | 11.6%), and English (92 | 8.8%), together accounting for 69.7% of all Thornport residents.
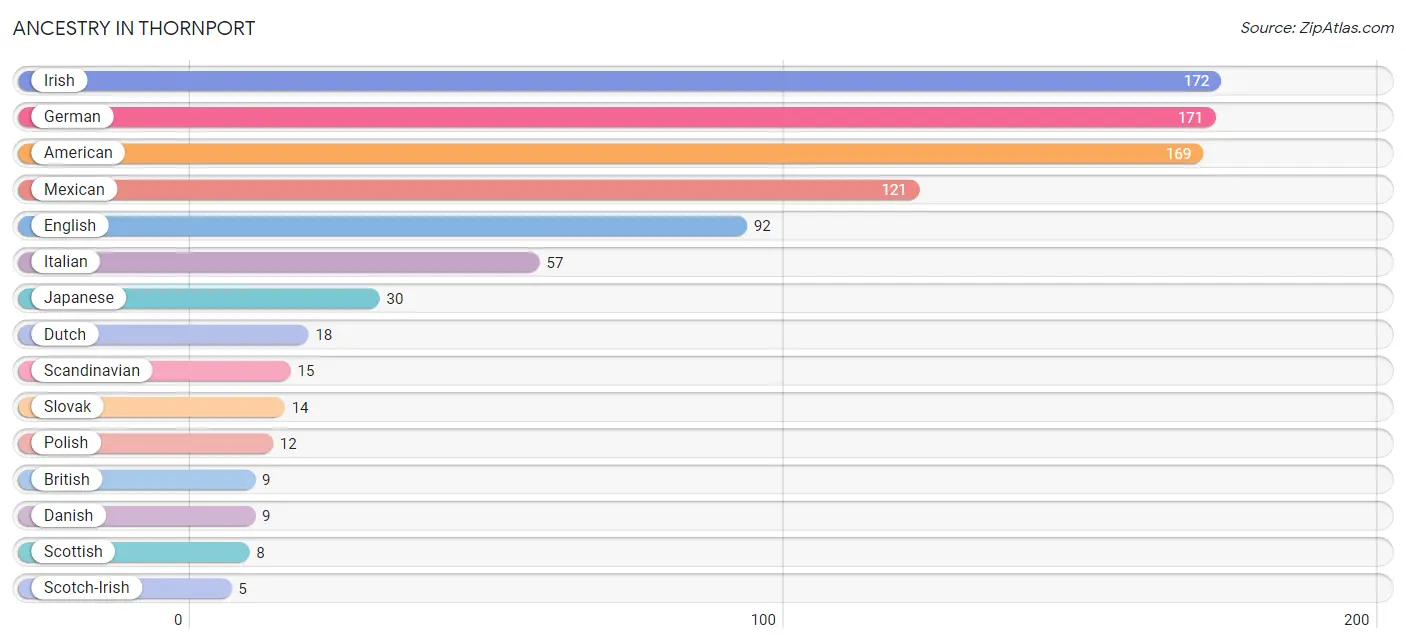
| Ancestry | # Population | % Population |
| American | 169 | 16.3% |
| British | 9 | 0.9% |
| Danish | 9 | 0.9% |
| Dutch | 18 | 1.7% |
| English | 92 | 8.8% |
| German | 171 | 16.4% |
| Irish | 172 | 16.5% |
| Italian | 57 | 5.5% |
| Japanese | 30 | 2.9% |
| Mexican | 121 | 11.6% |
| Polish | 12 | 1.1% |
| Scandinavian | 15 | 1.4% |
| Scotch-Irish | 5 | 0.5% |
| Scottish | 8 | 0.8% |
| Slovak | 14 | 1.3% | View All 15 Rows |
Immigrants in Thornport
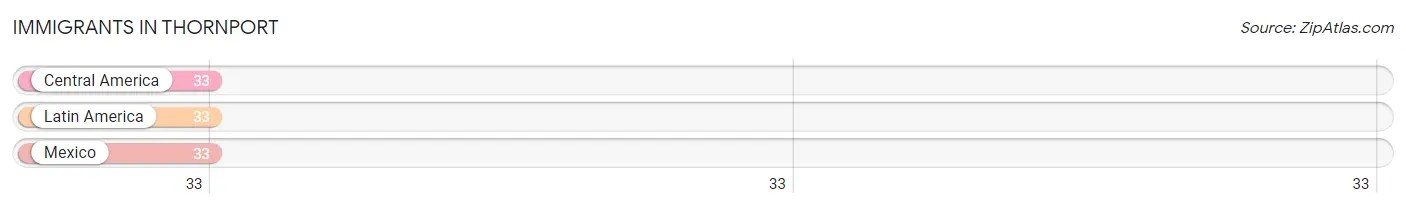
The most numerous immigrant groups reported in Thornport came from Central America (33 | 3.2%), Latin America (33 | 3.2%), and Mexico (33 | 3.2%), together accounting for 9.5% of all Thornport residents.
| Immigration Origin | # Population | % Population |
| Central America | 33 | 3.2% |
| Latin America | 33 | 3.2% |
| Mexico | 33 | 3.2% | View All 3 Rows |
Sex and Age in Thornport
Sex and Age in Thornport
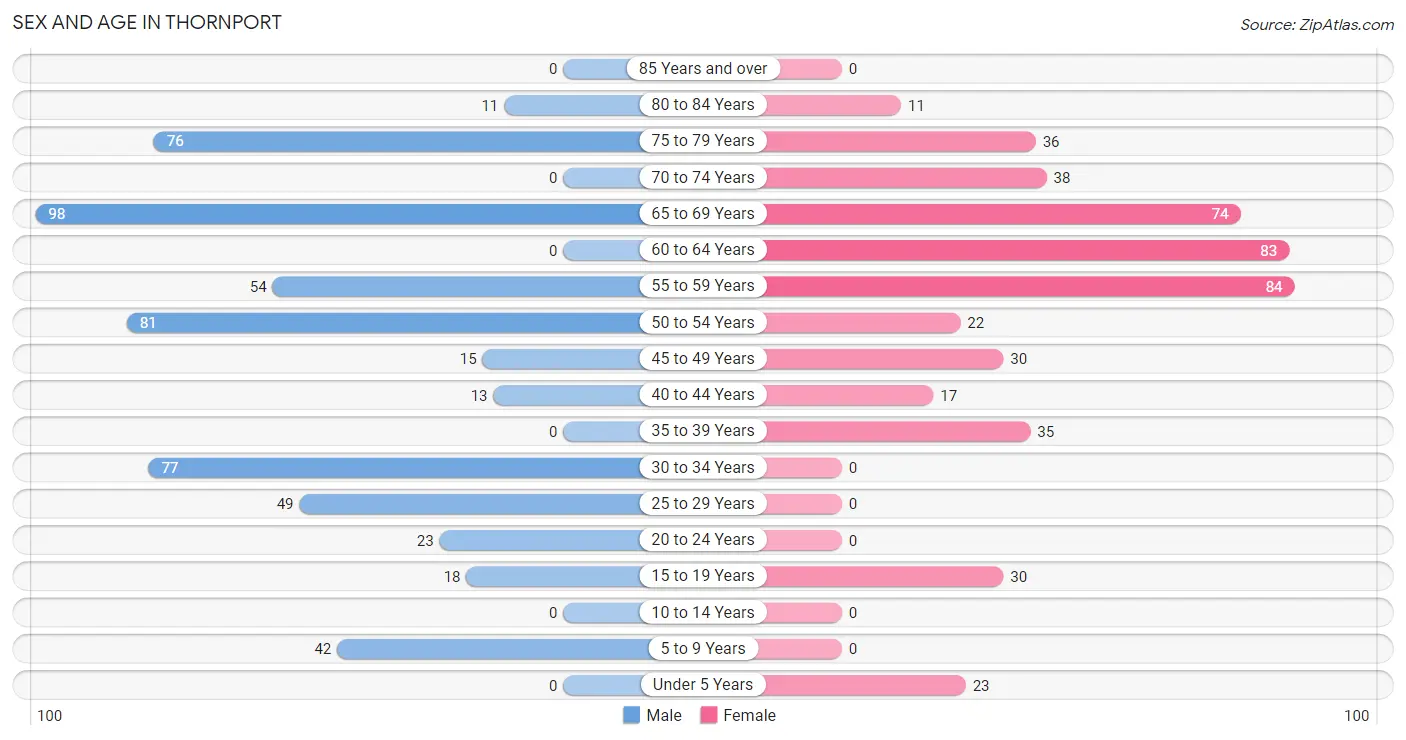
The most populous age groups in Thornport are 65 to 69 Years (98 | 17.6%) for men and 55 to 59 Years (84 | 17.4%) for women.
| Age Bracket | Male | Female |
| Under 5 Years | 0 (0.0%) | 23 (4.8%) |
| 5 to 9 Years | 42 (7.5%) | 0 (0.0%) |
| 10 to 14 Years | 0 (0.0%) | 0 (0.0%) |
| 15 to 19 Years | 18 (3.2%) | 30 (6.2%) |
| 20 to 24 Years | 23 (4.1%) | 0 (0.0%) |
| 25 to 29 Years | 49 (8.8%) | 0 (0.0%) |
| 30 to 34 Years | 77 (13.8%) | 0 (0.0%) |
| 35 to 39 Years | 0 (0.0%) | 35 (7.2%) |
| 40 to 44 Years | 13 (2.3%) | 17 (3.5%) |
| 45 to 49 Years | 15 (2.7%) | 30 (6.2%) |
| 50 to 54 Years | 81 (14.5%) | 22 (4.5%) |
| 55 to 59 Years | 54 (9.7%) | 84 (17.4%) |
| 60 to 64 Years | 0 (0.0%) | 83 (17.2%) |
| 65 to 69 Years | 98 (17.6%) | 74 (15.3%) |
| 70 to 74 Years | 0 (0.0%) | 38 (7.9%) |
| 75 to 79 Years | 76 (13.6%) | 36 (7.4%) |
| 80 to 84 Years | 11 (2.0%) | 11 (2.3%) |
| 85 Years and over | 0 (0.0%) | 0 (0.0%) |
| Total | 557 (100.0%) | 483 (100.0%) |
Families and Households in Thornport
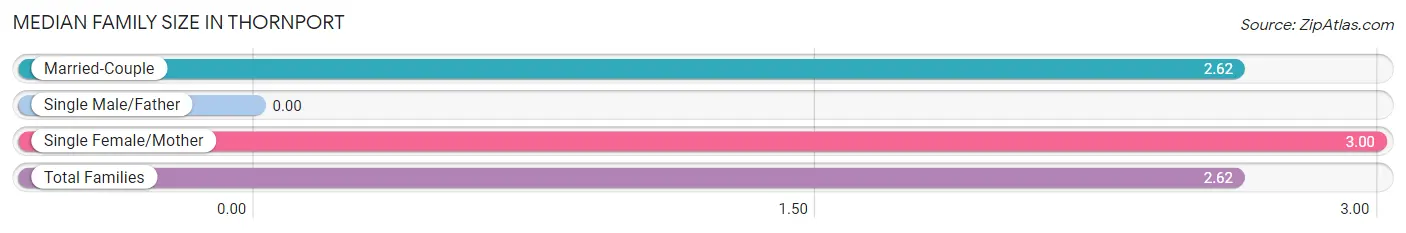
Median Family Size in Thornport
| Family Type | # Families | Family Size |
| Married-Couple | 351 (98.6%) | 2.62 |
| Single Male/Father | 0 (0.0%) | - |
| Single Female/Mother | 5 (1.4%) | 3.00 |
| Total Families | 356 (100.0%) | 2.62 |
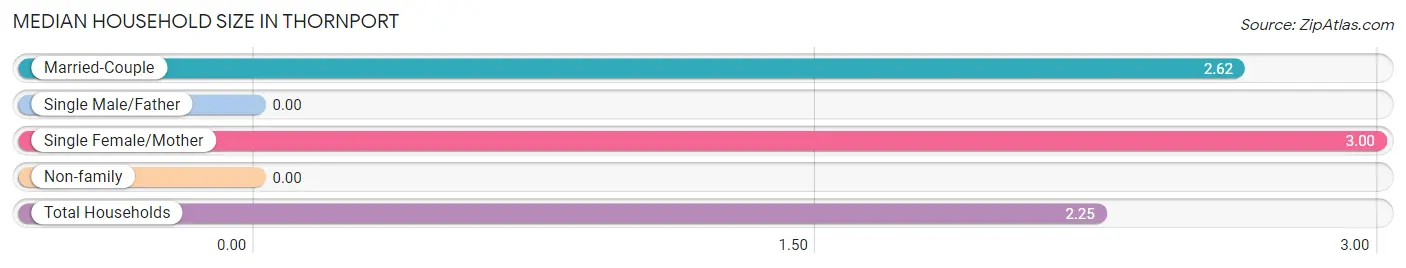
Median Household Size in Thornport
| Household Type | # Households | Household Size |
| Married-Couple | 351 (76.0%) | 2.62 |
| Single Male/Father | 0 (0.0%) | - |
| Single Female/Mother | 5 (1.1%) | 3.00 |
| Non-family | 106 (22.9%) | - |
| Total Households | 462 (100.0%) | 2.25 |
Household Size by Marriage Status in Thornport
Out of a total of 462 households in Thornport, 356 (77.1%) are family households, while 106 (22.9%) are nonfamily households. The most numerous type of family households are 2-person households, comprising 219, and the most common type of nonfamily households are 1-person households, comprising 106.
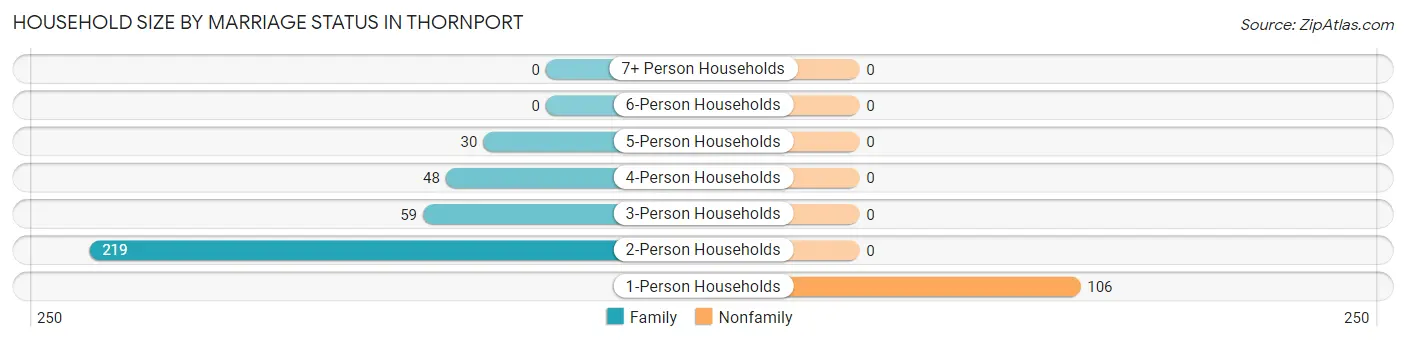
| Household Size | Family Households | Nonfamily Households |
| 1-Person Households | - | 106 (22.9%) |
| 2-Person Households | 219 (47.4%) | 0 (0.0%) |
| 3-Person Households | 59 (12.8%) | 0 (0.0%) |
| 4-Person Households | 48 (10.4%) | 0 (0.0%) |
| 5-Person Households | 30 (6.5%) | 0 (0.0%) |
| 6-Person Households | 0 (0.0%) | 0 (0.0%) |
| 7+ Person Households | 0 (0.0%) | 0 (0.0%) |
| Total | 356 (77.1%) | 106 (22.9%) |
Female Fertility in Thornport
Fertility by Age in Thornport
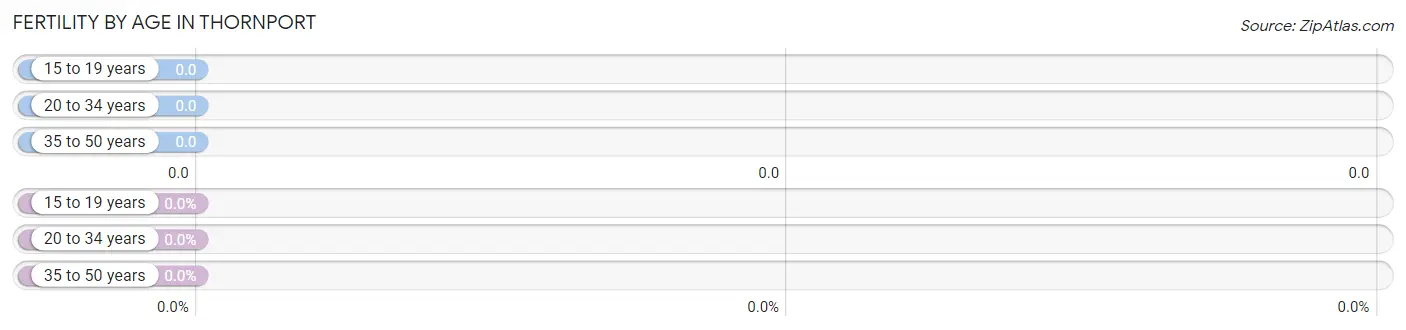
| Age Bracket | Women with Births | Births / 1,000 Women |
| 15 to 19 years | 0 (0.0%) | 0.0 |
| 20 to 34 years | 0 (0.0%) | 0.0 |
| 35 to 50 years | 0 (0.0%) | 0.0 |
| Total | 0 (0.0%) | 0.0 |
Fertility by Age by Marriage Status in Thornport
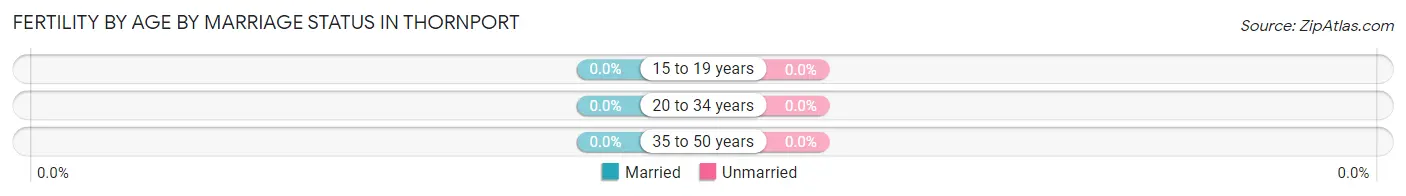
| Age Bracket | Married | Unmarried |
| 15 to 19 years | 0 (0.0%) | 0 (0.0%) |
| 20 to 34 years | 0 (0.0%) | 0 (0.0%) |
| 35 to 50 years | 0 (0.0%) | 0 (0.0%) |
| Total | 0 (0.0%) | 0 (0.0%) |
Fertility by Education in Thornport
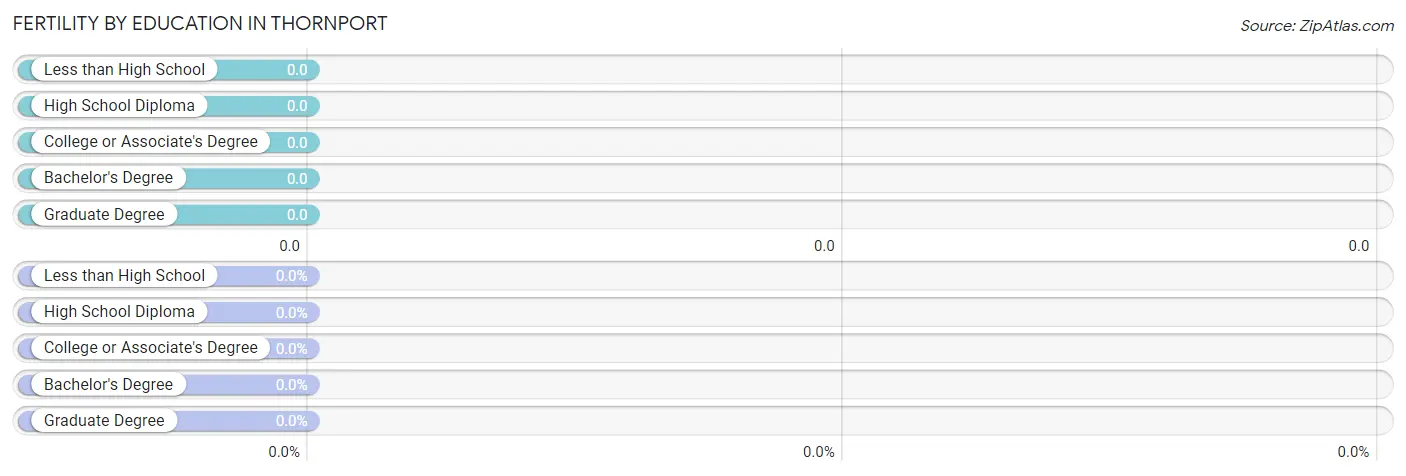
| Educational Attainment | Women with Births | Births / 1,000 Women |
| Less than High School | 0 (0.0%) | 0.0 |
| High School Diploma | 0 (0.0%) | 0.0 |
| College or Associate's Degree | 0 (0.0%) | 0.0 |
| Bachelor's Degree | 0 (0.0%) | 0.0 |
| Graduate Degree | 0 (0.0%) | 0.0 |
| Total | 0 (0.0%) | 0.0 |
Fertility by Education by Marriage Status in Thornport
| Educational Attainment | Married | Unmarried |
| Less than High School | 0 (0.0%) | 0 (0.0%) |
| High School Diploma | 0 (0.0%) | 0 (0.0%) |
| College or Associate's Degree | 0 (0.0%) | 0 (0.0%) |
| Bachelor's Degree | 0 (0.0%) | 0 (0.0%) |
| Graduate Degree | 0 (0.0%) | 0 (0.0%) |
| Total | 0 (0.0%) | 0 (0.0%) |
Employment Characteristics in Thornport
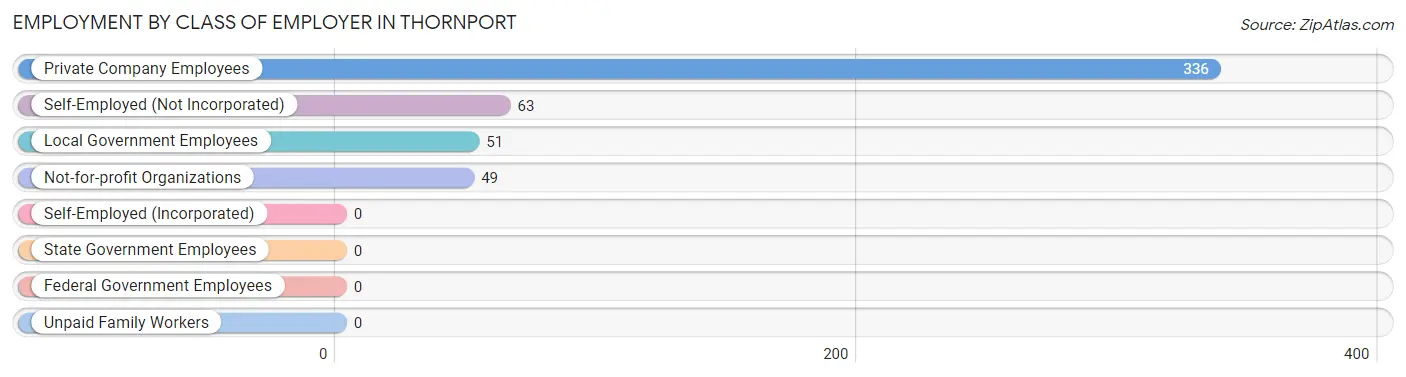
Employment by Class of Employer in Thornport
Among the 499 employed individuals in Thornport, private company employees (336 | 67.3%), self-employed (not incorporated) (63 | 12.6%), and local government employees (51 | 10.2%) make up the most common classes of employment.
| Employer Class | # Employees | % Employees |
| Private Company Employees | 336 | 67.3% |
| Self-Employed (Incorporated) | 0 | 0.0% |
| Self-Employed (Not Incorporated) | 63 | 12.6% |
| Not-for-profit Organizations | 49 | 9.8% |
| Local Government Employees | 51 | 10.2% |
| State Government Employees | 0 | 0.0% |
| Federal Government Employees | 0 | 0.0% |
| Unpaid Family Workers | 0 | 0.0% |
| Total | 499 | 100.0% |
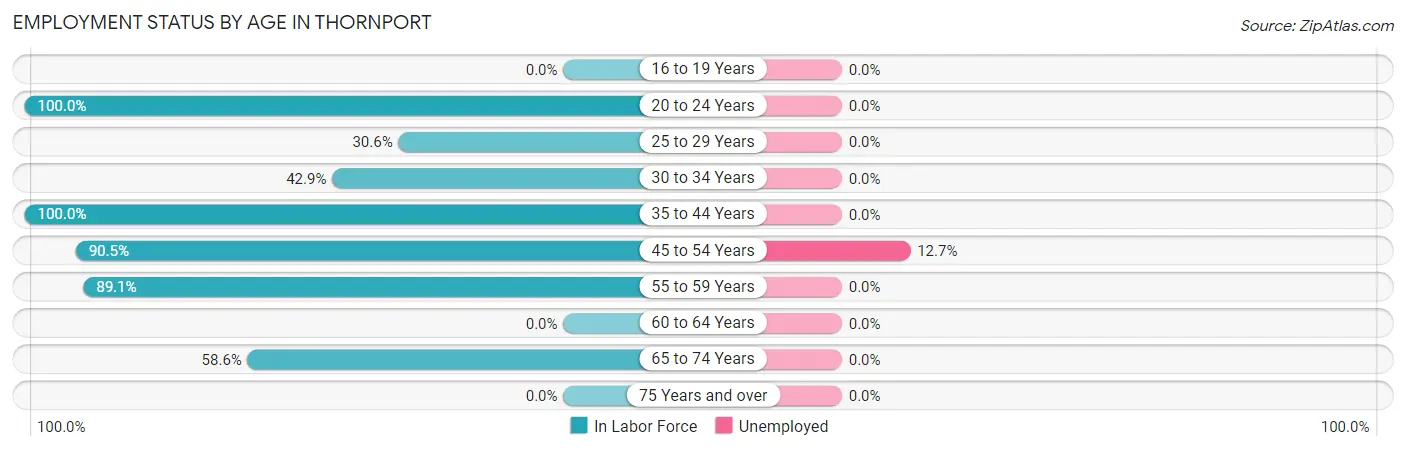
Employment Status by Age in Thornport
According to the labor force statistics for Thornport, out of the total population over 16 years of age (957), 53.9% or 516 individuals are in the labor force, with 3.3% or 17 of them unemployed. The age group with the highest labor force participation rate is 20 to 24 years, with 100.0% or 23 individuals in the labor force. Within the labor force, the 45 to 54 years age range has the highest percentage of unemployed individuals, with 12.7% or 17 of them being unemployed.
| Age Bracket | In Labor Force | Unemployed |
| 16 to 19 Years | 0 (0.0%) | 0 (0.0%) |
| 20 to 24 Years | 23 (100.0%) | 0 (0.0%) |
| 25 to 29 Years | 15 (30.6%) | 0 (0.0%) |
| 30 to 34 Years | 33 (42.9%) | 0 (0.0%) |
| 35 to 44 Years | 65 (100.0%) | 0 (0.0%) |
| 45 to 54 Years | 134 (90.5%) | 17 (12.7%) |
| 55 to 59 Years | 123 (89.1%) | 0 (0.0%) |
| 60 to 64 Years | 0 (0.0%) | 0 (0.0%) |
| 65 to 74 Years | 123 (58.6%) | 0 (0.0%) |
| 75 Years and over | 0 (0.0%) | 0 (0.0%) |
| Total | 516 (53.9%) | 17 (3.3%) |
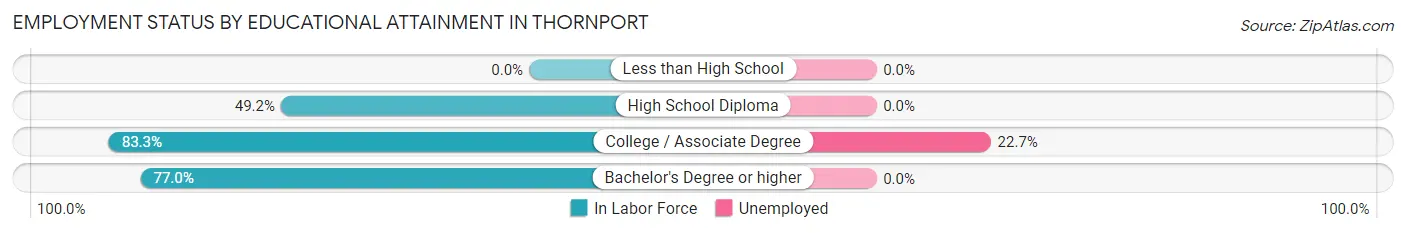
Employment Status by Educational Attainment in Thornport
According to labor force statistics for Thornport, 66.1% of individuals (370) out of the total population between 25 and 64 years of age (560) are in the labor force, with 4.6% or 17 of them being unemployed. The group with the highest labor force participation rate are those with the educational attainment of college / associate degree, with 83.3% or 75 individuals in the labor force. Within the labor force, individuals with college / associate degree education have the highest percentage of unemployment, with 22.7% or 17 of them being unemployed.
| Educational Attainment | In Labor Force | Unemployed |
| Less than High School | 0 (0.0%) | 0 (0.0%) |
| High School Diploma | 118 (49.2%) | 0 (0.0%) |
| College / Associate Degree | 75 (83.3%) | 20 (22.7%) |
| Bachelor's Degree or higher | 177 (77.0%) | 0 (0.0%) |
| Total | 370 (66.1%) | 26 (4.6%) |
Employment Occupations by Sex in Thornport
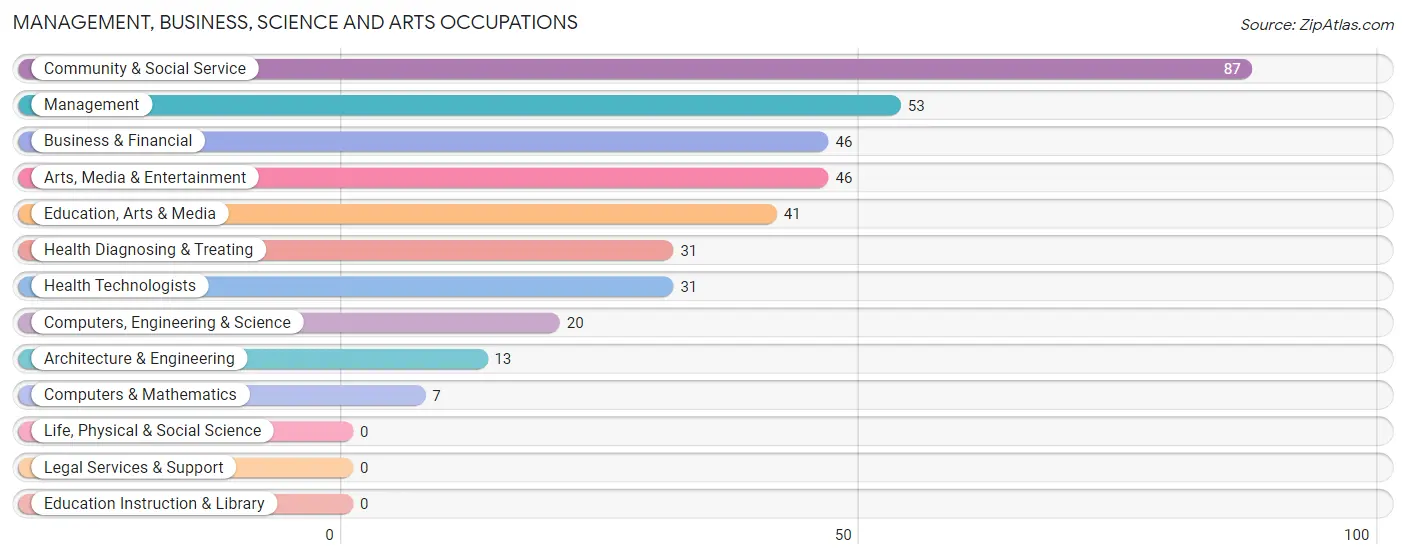
Management, Business, Science and Arts Occupations
The most common Management, Business, Science and Arts occupations in Thornport are Community & Social Service (87 | 17.4%), Management (53 | 10.6%), Business & Financial (46 | 9.2%), Arts, Media & Entertainment (46 | 9.2%), and Education, Arts & Media (41 | 8.2%).
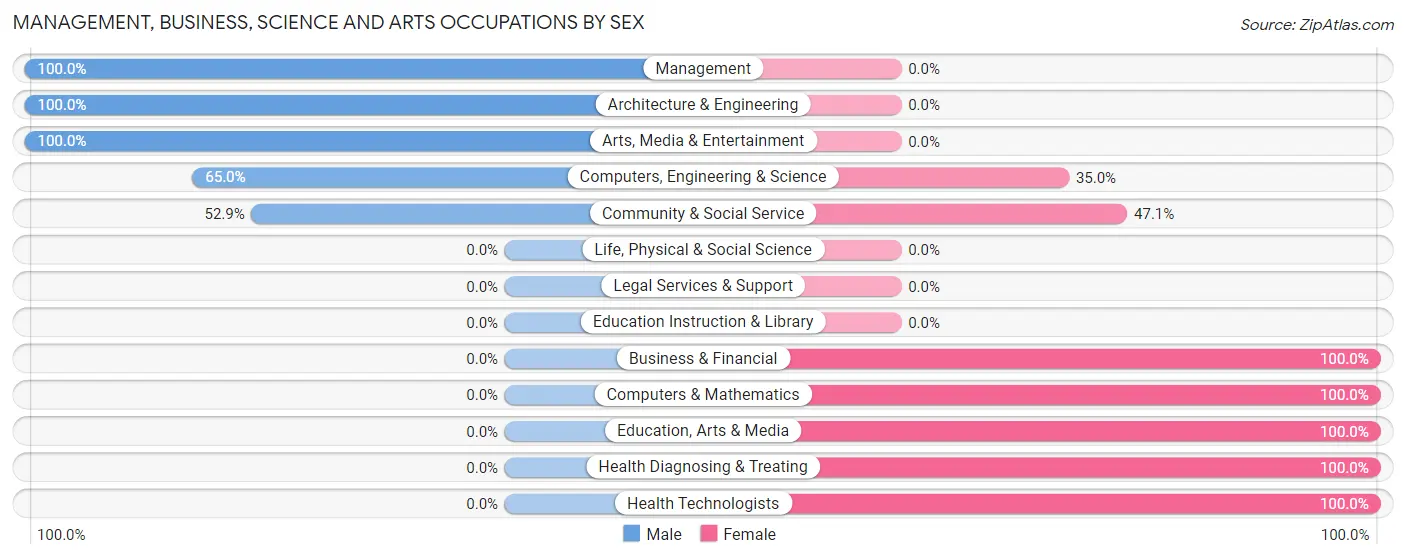
Management, Business, Science and Arts Occupations by Sex
Within the Management, Business, Science and Arts occupations in Thornport, the most male-oriented occupations are Management (100.0%), Architecture & Engineering (100.0%), and Arts, Media & Entertainment (100.0%), while the most female-oriented occupations are Business & Financial (100.0%), Computers & Mathematics (100.0%), and Education, Arts & Media (100.0%).
| Occupation | Male | Female |
| Management | 53 (100.0%) | 0 (0.0%) |
| Business & Financial | 0 (0.0%) | 46 (100.0%) |
| Computers, Engineering & Science | 13 (65.0%) | 7 (35.0%) |
| Computers & Mathematics | 0 (0.0%) | 7 (100.0%) |
| Architecture & Engineering | 13 (100.0%) | 0 (0.0%) |
| Life, Physical & Social Science | 0 (0.0%) | 0 (0.0%) |
| Community & Social Service | 46 (52.9%) | 41 (47.1%) |
| Education, Arts & Media | 0 (0.0%) | 41 (100.0%) |
| Legal Services & Support | 0 (0.0%) | 0 (0.0%) |
| Education Instruction & Library | 0 (0.0%) | 0 (0.0%) |
| Arts, Media & Entertainment | 46 (100.0%) | 0 (0.0%) |
| Health Diagnosing & Treating | 0 (0.0%) | 31 (100.0%) |
| Health Technologists | 0 (0.0%) | 31 (100.0%) |
| Total (Category) | 112 (47.3%) | 125 (52.7%) |
| Total (Overall) | 270 (54.1%) | 229 (45.9%) |
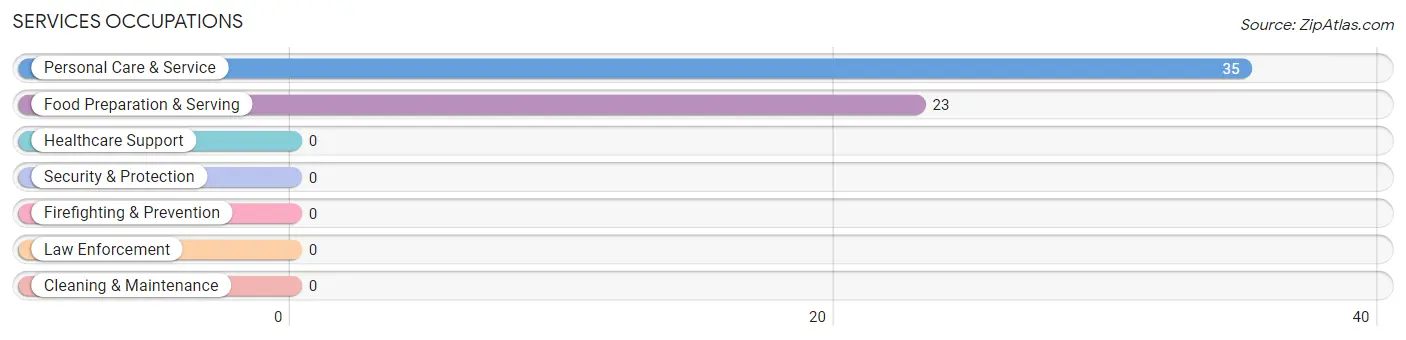
Services Occupations
The most common Services occupations in Thornport are Personal Care & Service (35 | 7.0%), and Food Preparation & Serving (23 | 4.6%).
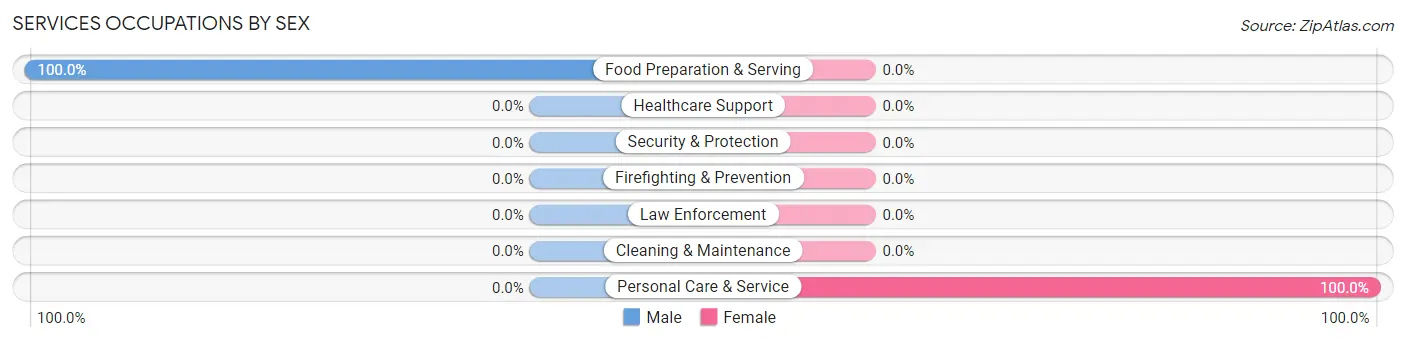
Services Occupations by Sex
| Occupation | Male | Female |
| Healthcare Support | 0 (0.0%) | 0 (0.0%) |
| Security & Protection | 0 (0.0%) | 0 (0.0%) |
| Firefighting & Prevention | 0 (0.0%) | 0 (0.0%) |
| Law Enforcement | 0 (0.0%) | 0 (0.0%) |
| Food Preparation & Serving | 23 (100.0%) | 0 (0.0%) |
| Cleaning & Maintenance | 0 (0.0%) | 0 (0.0%) |
| Personal Care & Service | 0 (0.0%) | 35 (100.0%) |
| Total (Category) | 23 (39.7%) | 35 (60.3%) |
| Total (Overall) | 270 (54.1%) | 229 (45.9%) |
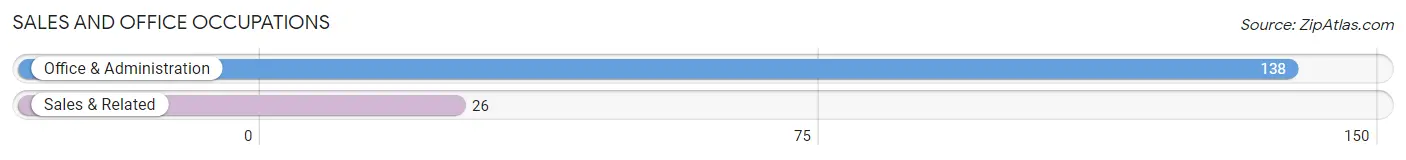
Sales and Office Occupations
The most common Sales and Office occupations in Thornport are Office & Administration (138 | 27.7%), and Sales & Related (26 | 5.2%).
Sales and Office Occupations by Sex
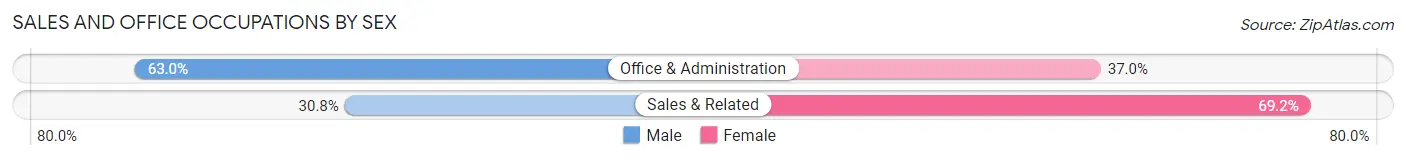
| Occupation | Male | Female |
| Sales & Related | 8 (30.8%) | 18 (69.2%) |
| Office & Administration | 87 (63.0%) | 51 (37.0%) |
| Total (Category) | 95 (57.9%) | 69 (42.1%) |
| Total (Overall) | 270 (54.1%) | 229 (45.9%) |
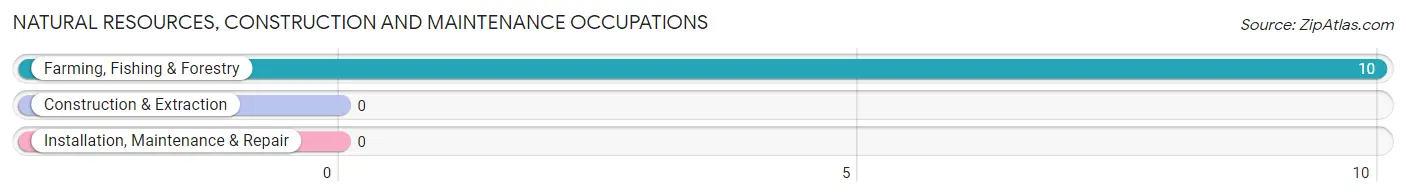
Natural Resources, Construction and Maintenance Occupations
The most common Natural Resources, Construction and Maintenance occupations in Thornport are , and Farming, Fishing & Forestry (10 | 2.0%).
Natural Resources, Construction and Maintenance Occupations by Sex
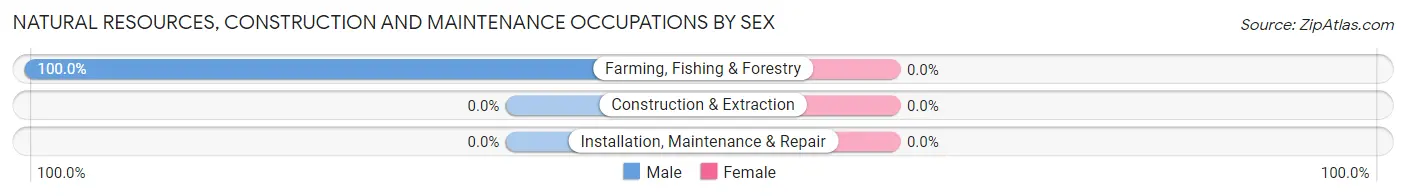
| Occupation | Male | Female |
| Farming, Fishing & Forestry | 10 (100.0%) | 0 (0.0%) |
| Construction & Extraction | 0 (0.0%) | 0 (0.0%) |
| Installation, Maintenance & Repair | 0 (0.0%) | 0 (0.0%) |
| Total (Category) | 10 (100.0%) | 0 (0.0%) |
| Total (Overall) | 270 (54.1%) | 229 (45.9%) |
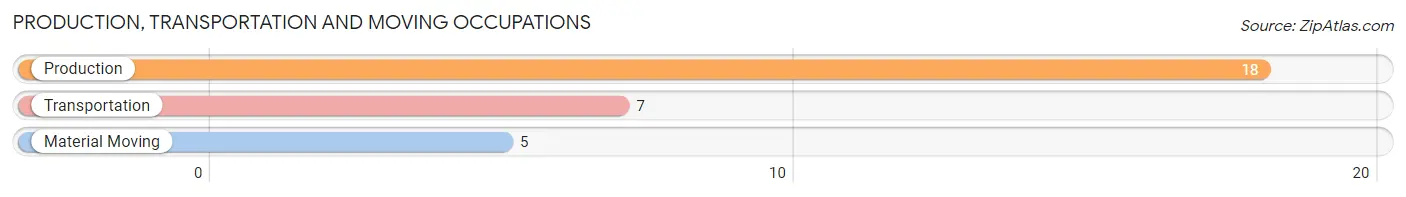
Production, Transportation and Moving Occupations
The most common Production, Transportation and Moving occupations in Thornport are Production (18 | 3.6%), Transportation (7 | 1.4%), and Material Moving (5 | 1.0%).
Production, Transportation and Moving Occupations by Sex
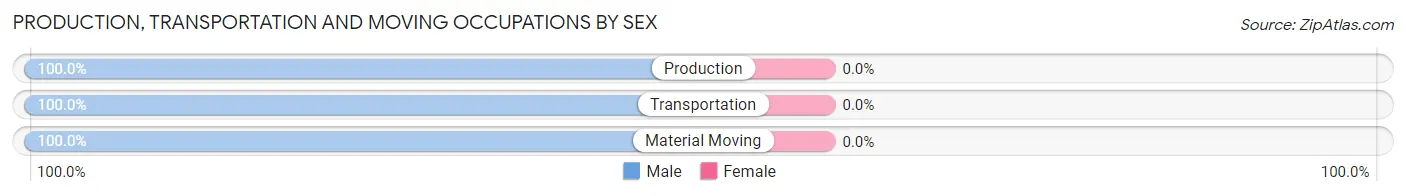
| Occupation | Male | Female |
| Production | 18 (100.0%) | 0 (0.0%) |
| Transportation | 7 (100.0%) | 0 (0.0%) |
| Material Moving | 5 (100.0%) | 0 (0.0%) |
| Total (Category) | 30 (100.0%) | 0 (0.0%) |
| Total (Overall) | 270 (54.1%) | 229 (45.9%) |
Employment Industries by Sex in Thornport
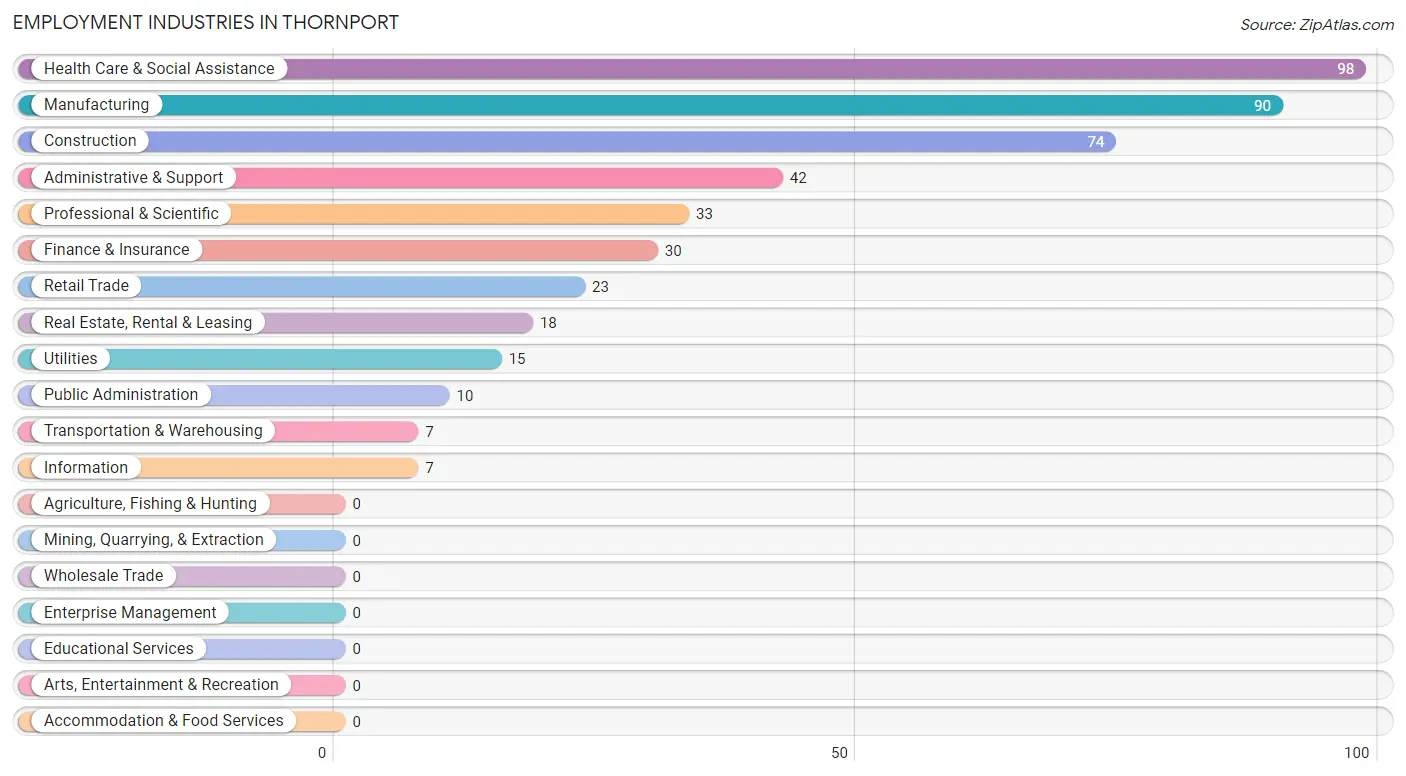
Employment Industries in Thornport
The major employment industries in Thornport include Health Care & Social Assistance (98 | 19.6%), Manufacturing (90 | 18.0%), Construction (74 | 14.8%), Administrative & Support (42 | 8.4%), and Professional & Scientific (33 | 6.6%).
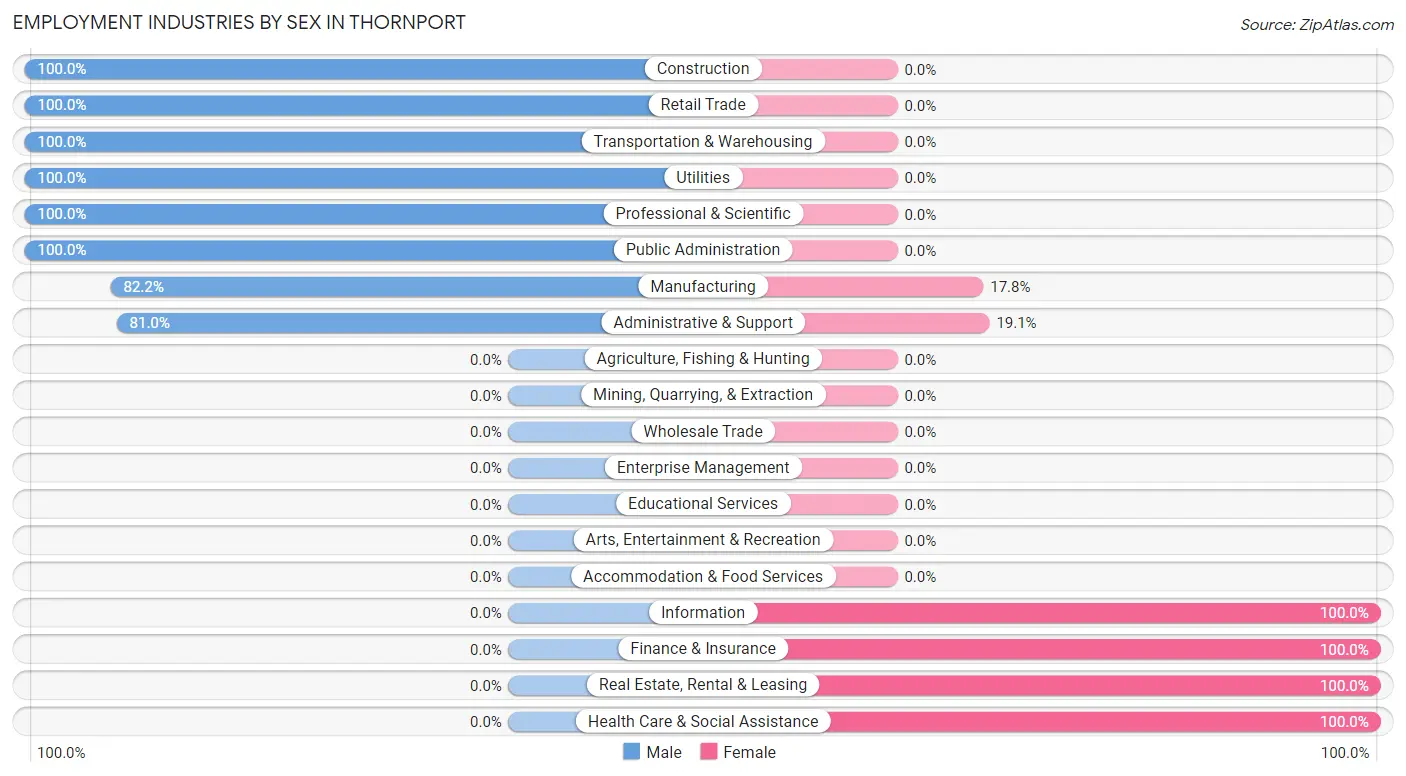
Employment Industries by Sex in Thornport
The Thornport industries that see more men than women are Construction (100.0%), Retail Trade (100.0%), and Transportation & Warehousing (100.0%), whereas the industries that tend to have a higher number of women are Information (100.0%), Finance & Insurance (100.0%), and Real Estate, Rental & Leasing (100.0%).
| Industry | Male | Female |
| Agriculture, Fishing & Hunting | 0 (0.0%) | 0 (0.0%) |
| Mining, Quarrying, & Extraction | 0 (0.0%) | 0 (0.0%) |
| Construction | 74 (100.0%) | 0 (0.0%) |
| Manufacturing | 74 (82.2%) | 16 (17.8%) |
| Wholesale Trade | 0 (0.0%) | 0 (0.0%) |
| Retail Trade | 23 (100.0%) | 0 (0.0%) |
| Transportation & Warehousing | 7 (100.0%) | 0 (0.0%) |
| Utilities | 15 (100.0%) | 0 (0.0%) |
| Information | 0 (0.0%) | 7 (100.0%) |
| Finance & Insurance | 0 (0.0%) | 30 (100.0%) |
| Real Estate, Rental & Leasing | 0 (0.0%) | 18 (100.0%) |
| Professional & Scientific | 33 (100.0%) | 0 (0.0%) |
| Enterprise Management | 0 (0.0%) | 0 (0.0%) |
| Administrative & Support | 34 (80.9%) | 8 (19.1%) |
| Educational Services | 0 (0.0%) | 0 (0.0%) |
| Health Care & Social Assistance | 0 (0.0%) | 98 (100.0%) |
| Arts, Entertainment & Recreation | 0 (0.0%) | 0 (0.0%) |
| Accommodation & Food Services | 0 (0.0%) | 0 (0.0%) |
| Public Administration | 10 (100.0%) | 0 (0.0%) |
| Total | 270 (54.1%) | 229 (45.9%) |
Education in Thornport
School Enrollment in Thornport
The most common levels of schooling among the 126 students in Thornport are high school (71 | 56.4%), nursery / preschool (27 | 21.4%), and elementary school (15 | 11.9%).
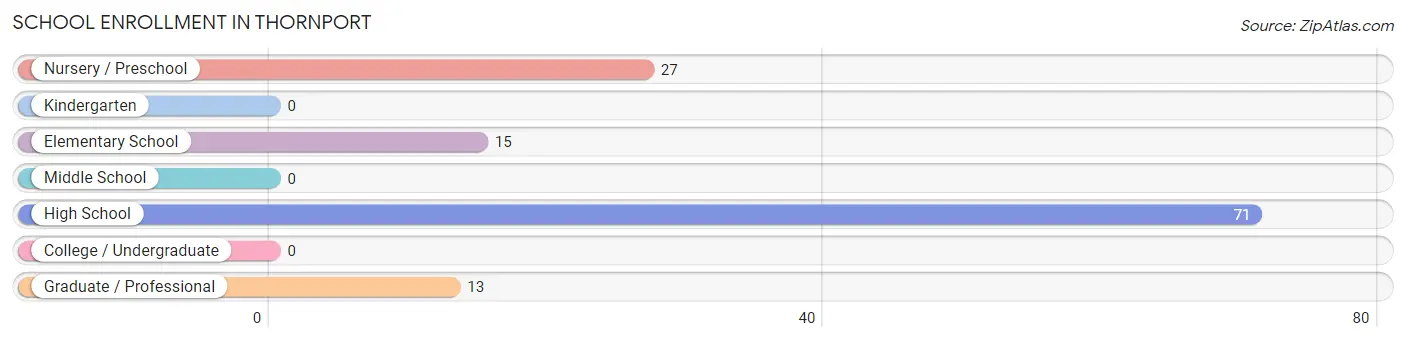
| School Level | # Students | % Students |
| Nursery / Preschool | 27 | 21.4% |
| Kindergarten | 0 | 0.0% |
| Elementary School | 15 | 11.9% |
| Middle School | 0 | 0.0% |
| High School | 71 | 56.4% |
| College / Undergraduate | 0 | 0.0% |
| Graduate / Professional | 13 | 10.3% |
| Total | 126 | 100.0% |
School Enrollment by Age by Funding Source in Thornport
Out of a total of 126 students who are enrolled in schools in Thornport, 30 (23.8%) attend a private institution, while the remaining 96 (76.2%) are enrolled in public schools. The age group of 15 to 17 year olds has the highest likelihood of being enrolled in private schools, with 30 (62.5% in the age bracket) enrolled. Conversely, the age group of 5 to 9 year old has the lowest likelihood of being enrolled in a private school, with 42 (100.0% in the age bracket) attending a public institution.
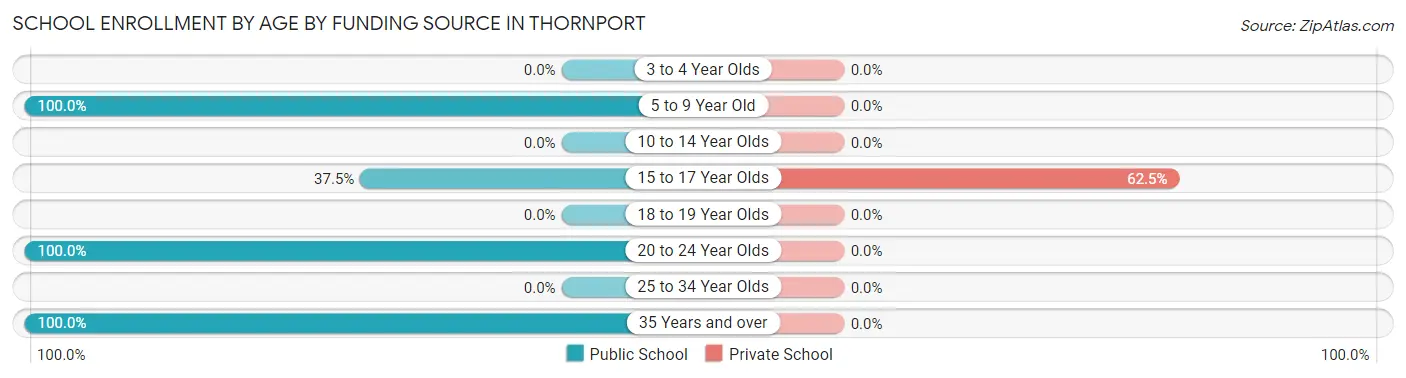
| Age Bracket | Public School | Private School |
| 3 to 4 Year Olds | 0 (0.0%) | 0 (0.0%) |
| 5 to 9 Year Old | 42 (100.0%) | 0 (0.0%) |
| 10 to 14 Year Olds | 0 (0.0%) | 0 (0.0%) |
| 15 to 17 Year Olds | 18 (37.5%) | 30 (62.5%) |
| 18 to 19 Year Olds | 0 (0.0%) | 0 (0.0%) |
| 20 to 24 Year Olds | 23 (100.0%) | 0 (0.0%) |
| 25 to 34 Year Olds | 0 (0.0%) | 0 (0.0%) |
| 35 Years and over | 13 (100.0%) | 0 (0.0%) |
| Total | 96 (76.2%) | 30 (23.8%) |
Educational Attainment by Field of Study in Thornport
Education (177 | 41.4%), business (168 | 39.3%), engineering (33 | 7.7%), literature & languages (19 | 4.4%), and science & technology (14 | 3.3%) are the most common fields of study among 428 individuals in Thornport who have obtained a bachelor's degree or higher.
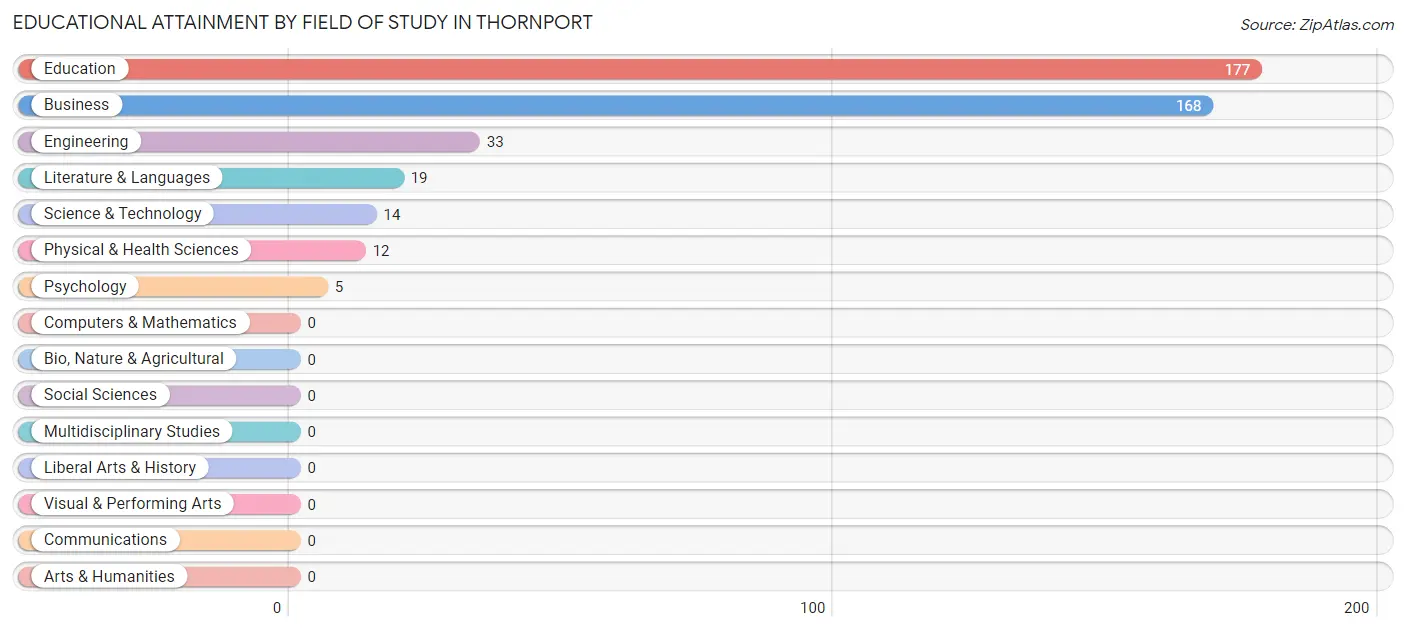
| Field of Study | # Graduates | % Graduates |
| Computers & Mathematics | 0 | 0.0% |
| Bio, Nature & Agricultural | 0 | 0.0% |
| Physical & Health Sciences | 12 | 2.8% |
| Psychology | 5 | 1.2% |
| Social Sciences | 0 | 0.0% |
| Engineering | 33 | 7.7% |
| Multidisciplinary Studies | 0 | 0.0% |
| Science & Technology | 14 | 3.3% |
| Business | 168 | 39.3% |
| Education | 177 | 41.4% |
| Literature & Languages | 19 | 4.4% |
| Liberal Arts & History | 0 | 0.0% |
| Visual & Performing Arts | 0 | 0.0% |
| Communications | 0 | 0.0% |
| Arts & Humanities | 0 | 0.0% |
| Total | 428 | 100.0% |
Transportation & Commute in Thornport
Vehicle Availability by Sex in Thornport
The most prevalent vehicle ownership categories in Thornport are males with 2 vehicles (133, accounting for 49.3%) and females with 2 vehicles (139, making up 58.1%).
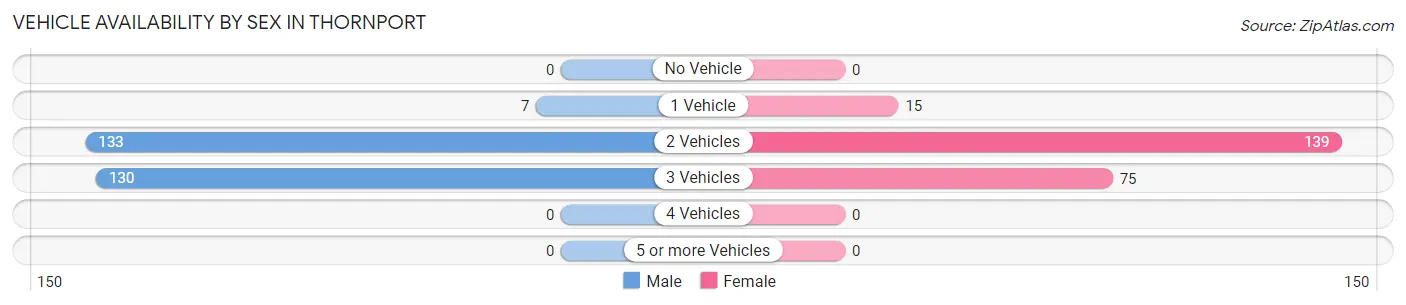
| Vehicles Available | Male | Female |
| No Vehicle | 0 (0.0%) | 0 (0.0%) |
| 1 Vehicle | 7 (2.6%) | 15 (6.6%) |
| 2 Vehicles | 133 (49.3%) | 139 (60.7%) |
| 3 Vehicles | 130 (48.1%) | 75 (32.8%) |
| 4 Vehicles | 0 (0.0%) | 0 (0.0%) |
| 5 or more Vehicles | 0 (0.0%) | 0 (0.0%) |
| Total | 270 (100.0%) | 229 (100.0%) |
Commute Time in Thornport
The most frequently occuring commute durations in Thornport are 30 to 34 minutes (105 commuters, 24.9%), 20 to 24 minutes (96 commuters, 22.8%), and 45 to 59 minutes (85 commuters, 20.1%).
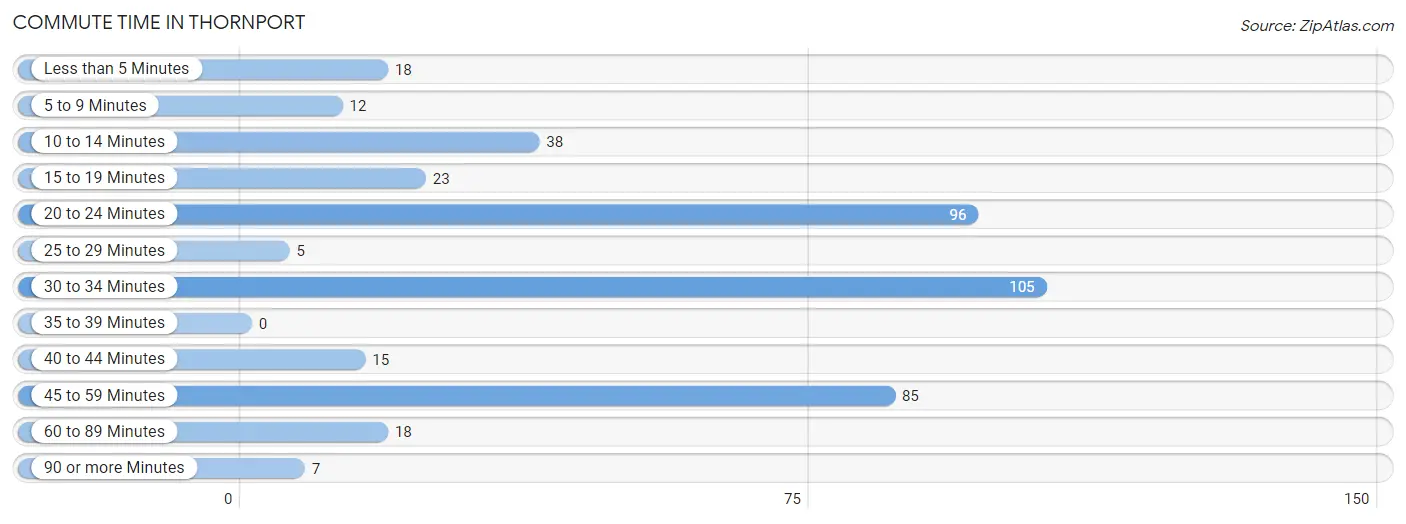
| Commute Time | # Commuters | % Commuters |
| Less than 5 Minutes | 18 | 4.3% |
| 5 to 9 Minutes | 12 | 2.8% |
| 10 to 14 Minutes | 38 | 9.0% |
| 15 to 19 Minutes | 23 | 5.4% |
| 20 to 24 Minutes | 96 | 22.8% |
| 25 to 29 Minutes | 5 | 1.2% |
| 30 to 34 Minutes | 105 | 24.9% |
| 35 to 39 Minutes | 0 | 0.0% |
| 40 to 44 Minutes | 15 | 3.5% |
| 45 to 59 Minutes | 85 | 20.1% |
| 60 to 89 Minutes | 18 | 4.3% |
| 90 or more Minutes | 7 | 1.7% |
Commute Time by Sex in Thornport
The most common commute times in Thornport are 20 to 24 minutes (79 commuters, 32.9%) for males and 45 to 59 minutes (51 commuters, 28.0%) for females.
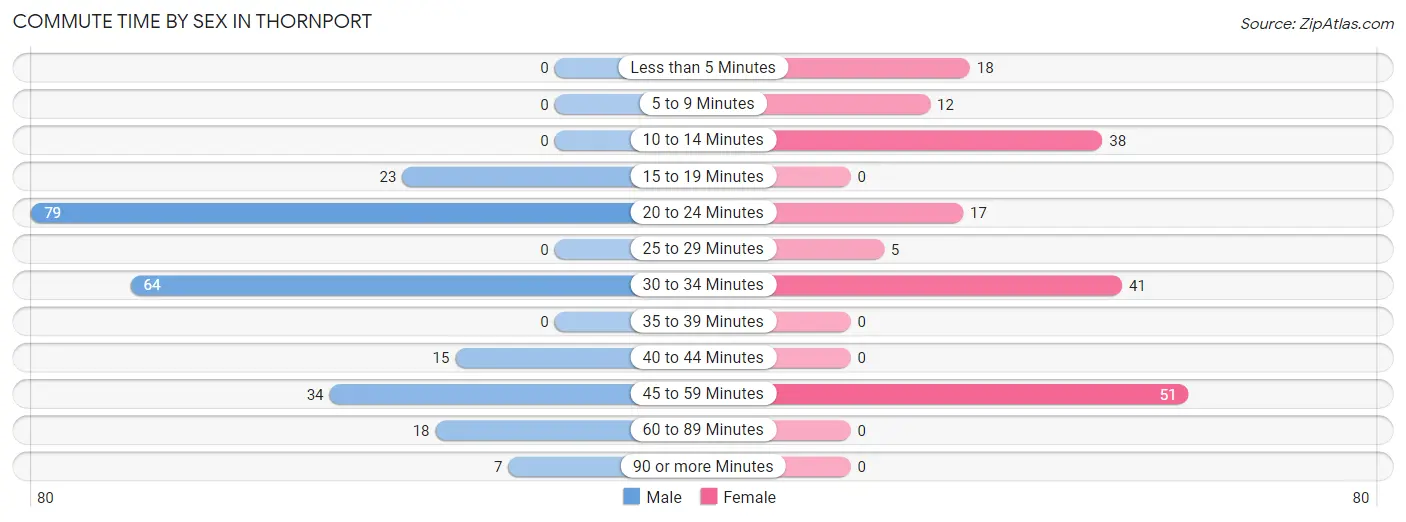
| Commute Time | Male | Female |
| Less than 5 Minutes | 0 (0.0%) | 18 (9.9%) |
| 5 to 9 Minutes | 0 (0.0%) | 12 (6.6%) |
| 10 to 14 Minutes | 0 (0.0%) | 38 (20.9%) |
| 15 to 19 Minutes | 23 (9.6%) | 0 (0.0%) |
| 20 to 24 Minutes | 79 (32.9%) | 17 (9.3%) |
| 25 to 29 Minutes | 0 (0.0%) | 5 (2.8%) |
| 30 to 34 Minutes | 64 (26.7%) | 41 (22.5%) |
| 35 to 39 Minutes | 0 (0.0%) | 0 (0.0%) |
| 40 to 44 Minutes | 15 (6.2%) | 0 (0.0%) |
| 45 to 59 Minutes | 34 (14.2%) | 51 (28.0%) |
| 60 to 89 Minutes | 18 (7.5%) | 0 (0.0%) |
| 90 or more Minutes | 7 (2.9%) | 0 (0.0%) |
Time of Departure to Work by Sex in Thornport
The most frequent times of departure to work in Thornport are 5:00 AM to 5:29 AM (72, 30.0%) for males and 7:00 AM to 7:29 AM (56, 30.8%) for females.
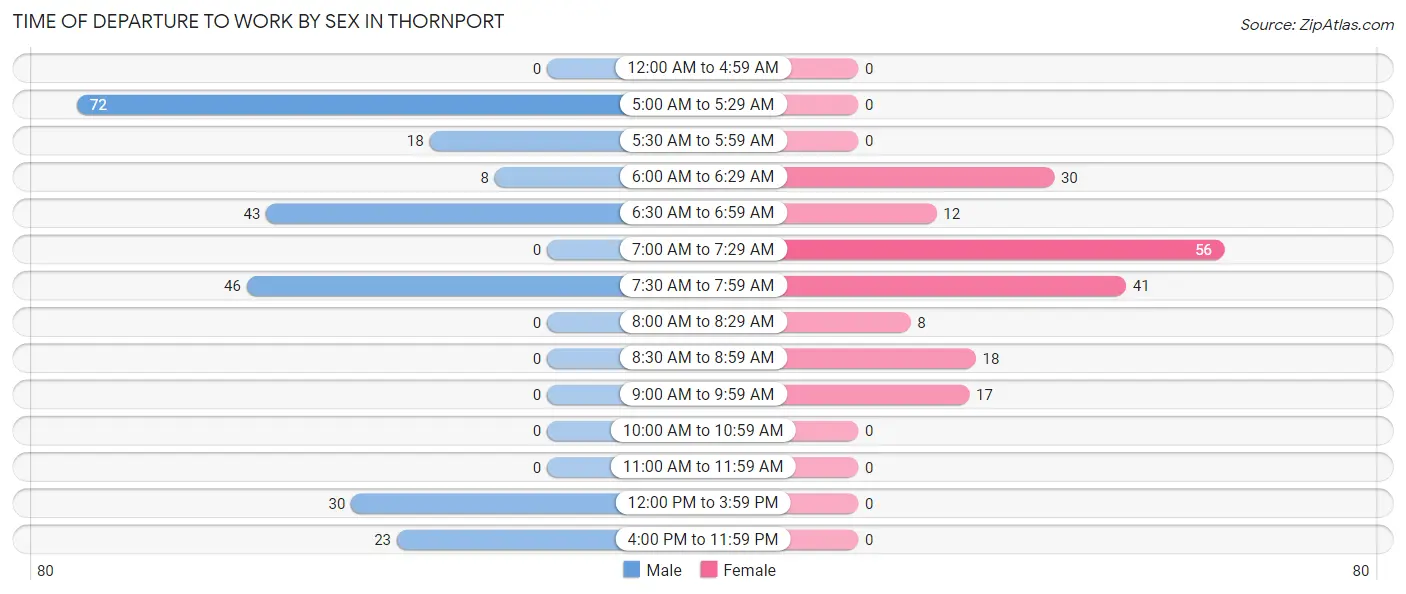
| Time of Departure | Male | Female |
| 12:00 AM to 4:59 AM | 0 (0.0%) | 0 (0.0%) |
| 5:00 AM to 5:29 AM | 72 (30.0%) | 0 (0.0%) |
| 5:30 AM to 5:59 AM | 18 (7.5%) | 0 (0.0%) |
| 6:00 AM to 6:29 AM | 8 (3.3%) | 30 (16.5%) |
| 6:30 AM to 6:59 AM | 43 (17.9%) | 12 (6.6%) |
| 7:00 AM to 7:29 AM | 0 (0.0%) | 56 (30.8%) |
| 7:30 AM to 7:59 AM | 46 (19.2%) | 41 (22.5%) |
| 8:00 AM to 8:29 AM | 0 (0.0%) | 8 (4.4%) |
| 8:30 AM to 8:59 AM | 0 (0.0%) | 18 (9.9%) |
| 9:00 AM to 9:59 AM | 0 (0.0%) | 17 (9.3%) |
| 10:00 AM to 10:59 AM | 0 (0.0%) | 0 (0.0%) |
| 11:00 AM to 11:59 AM | 0 (0.0%) | 0 (0.0%) |
| 12:00 PM to 3:59 PM | 30 (12.5%) | 0 (0.0%) |
| 4:00 PM to 11:59 PM | 23 (9.6%) | 0 (0.0%) |
| Total | 240 (100.0%) | 182 (100.0%) |
Housing Occupancy in Thornport
Occupancy by Ownership in Thornport
Of the total 462 dwellings in Thornport, owner-occupied units account for 462 (100.0%), while renter-occupied units make up 0 (0.0%).
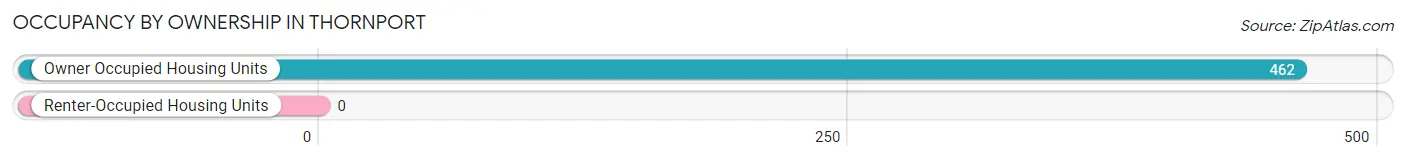
| Occupancy | # Housing Units | % Housing Units |
| Owner Occupied Housing Units | 462 | 100.0% |
| Renter-Occupied Housing Units | 0 | 0.0% |
| Total Occupied Housing Units | 462 | 100.0% |
Occupancy by Household Size in Thornport
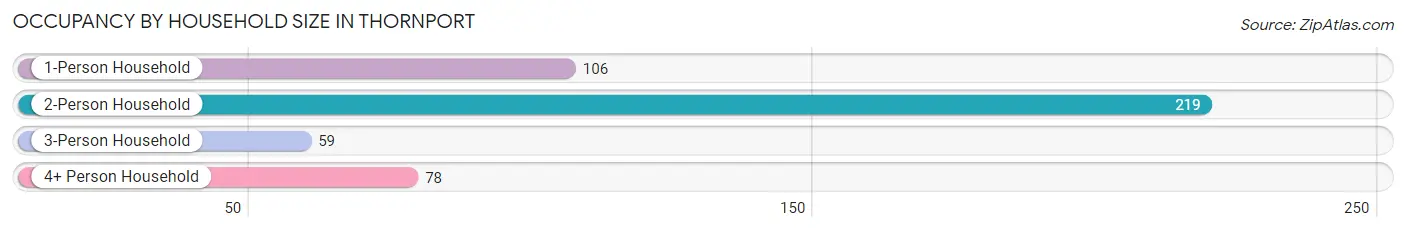
| Household Size | # Housing Units | % Housing Units |
| 1-Person Household | 106 | 22.9% |
| 2-Person Household | 219 | 47.4% |
| 3-Person Household | 59 | 12.8% |
| 4+ Person Household | 78 | 16.9% |
| Total Housing Units | 462 | 100.0% |
Occupancy by Ownership by Household Size in Thornport
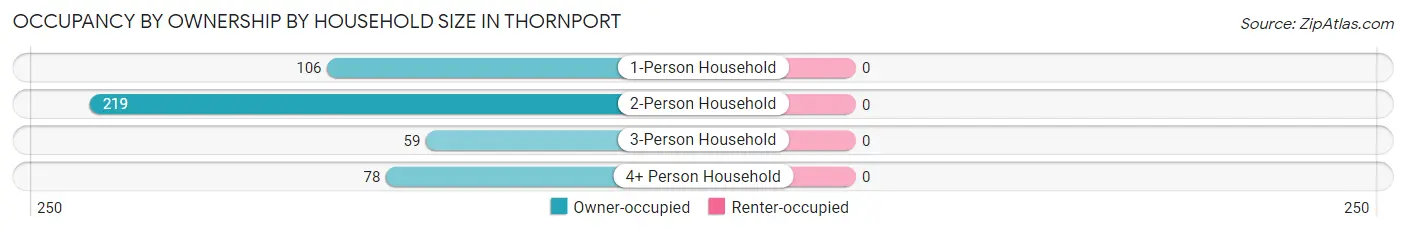
| Household Size | Owner-occupied | Renter-occupied |
| 1-Person Household | 106 (100.0%) | 0 (0.0%) |
| 2-Person Household | 219 (100.0%) | 0 (0.0%) |
| 3-Person Household | 59 (100.0%) | 0 (0.0%) |
| 4+ Person Household | 78 (100.0%) | 0 (0.0%) |
| Total Housing Units | 462 (100.0%) | 0 (0.0%) |
Occupancy by Educational Attainment in Thornport
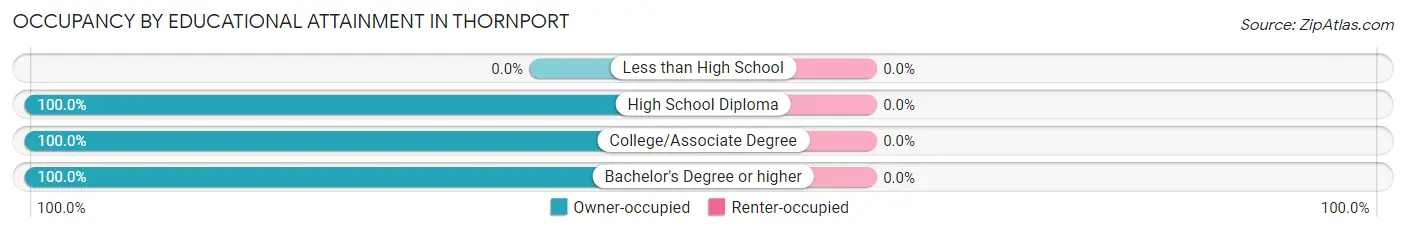
| Household Size | Owner-occupied | Renter-occupied |
| Less than High School | 0 (0.0%) | 0 (0.0%) |
| High School Diploma | 148 (100.0%) | 0 (0.0%) |
| College/Associate Degree | 20 (100.0%) | 0 (0.0%) |
| Bachelor's Degree or higher | 294 (100.0%) | 0 (0.0%) |
Occupancy by Age of Householder in Thornport
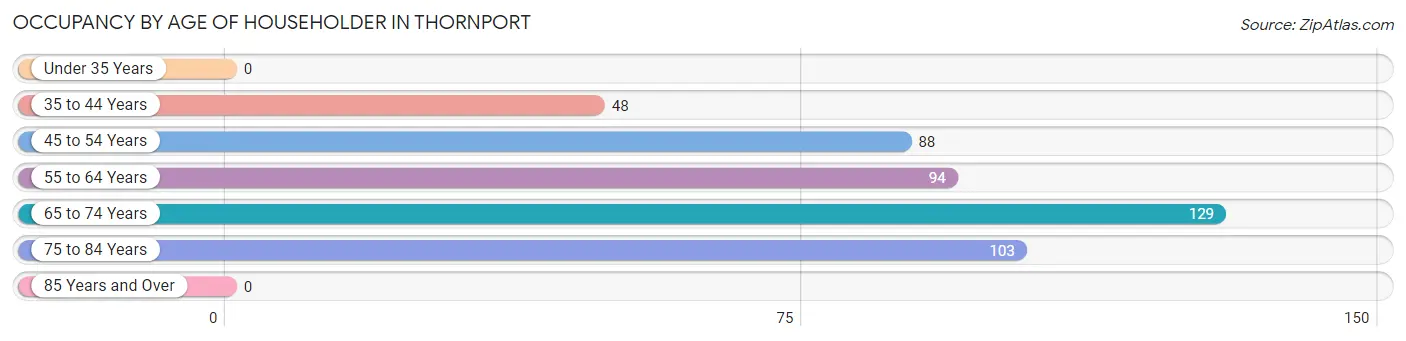
| Age Bracket | # Households | % Households |
| Under 35 Years | 0 | 0.0% |
| 35 to 44 Years | 48 | 10.4% |
| 45 to 54 Years | 88 | 19.1% |
| 55 to 64 Years | 94 | 20.3% |
| 65 to 74 Years | 129 | 27.9% |
| 75 to 84 Years | 103 | 22.3% |
| 85 Years and Over | 0 | 0.0% |
| Total | 462 | 100.0% |
Housing Finances in Thornport
Median Income by Occupancy in Thornport
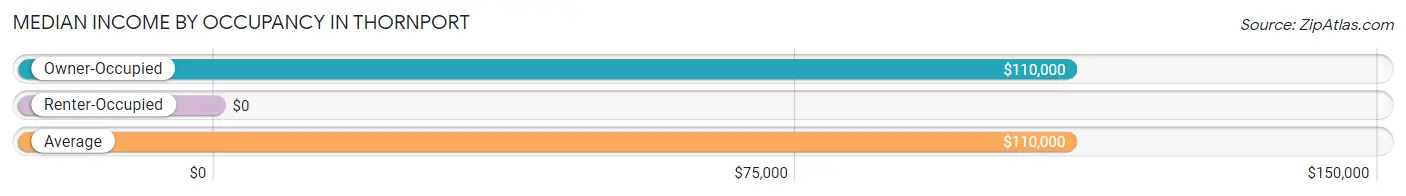
| Occupancy Type | # Households | Median Income |
| Owner-Occupied | 462 (100.0%) | $110,000 |
| Renter-Occupied | 0 (0.0%) | $0 |
| Average | 462 (100.0%) | $110,000 |
Occupancy by Householder Income Bracket in Thornport
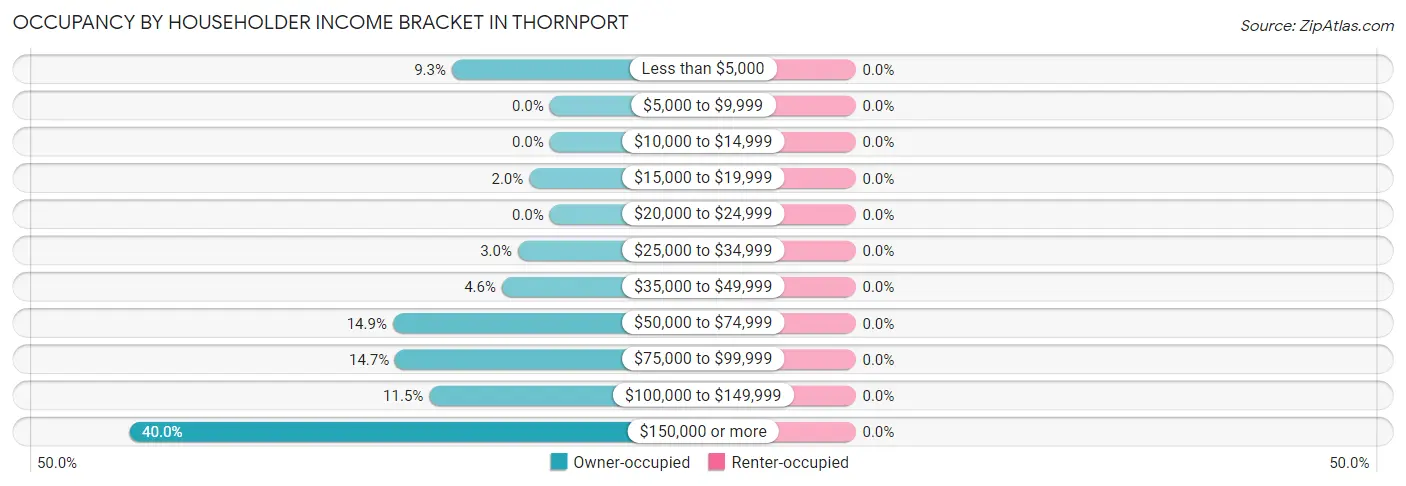
| Income Bracket | Owner-occupied | Renter-occupied |
| Less than $5,000 | 43 (9.3%) | 0 (0.0%) |
| $5,000 to $9,999 | 0 (0.0%) | 0 (0.0%) |
| $10,000 to $14,999 | 0 (0.0%) | 0 (0.0%) |
| $15,000 to $19,999 | 9 (1.9%) | 0 (0.0%) |
| $20,000 to $24,999 | 0 (0.0%) | 0 (0.0%) |
| $25,000 to $34,999 | 14 (3.0%) | 0 (0.0%) |
| $35,000 to $49,999 | 21 (4.5%) | 0 (0.0%) |
| $50,000 to $74,999 | 69 (14.9%) | 0 (0.0%) |
| $75,000 to $99,999 | 68 (14.7%) | 0 (0.0%) |
| $100,000 to $149,999 | 53 (11.5%) | 0 (0.0%) |
| $150,000 or more | 185 (40.0%) | 0 (0.0%) |
| Total | 462 (100.0%) | 0 (0.0%) |
Monthly Housing Cost Tiers in Thornport
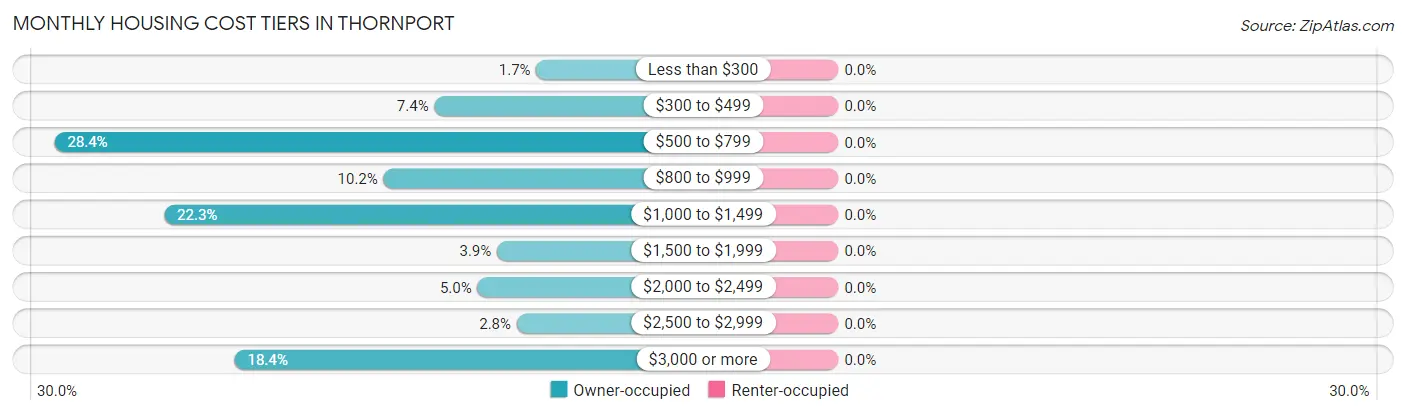
| Monthly Cost | Owner-occupied | Renter-occupied |
| Less than $300 | 8 (1.7%) | 0 (0.0%) |
| $300 to $499 | 34 (7.4%) | 0 (0.0%) |
| $500 to $799 | 131 (28.3%) | 0 (0.0%) |
| $800 to $999 | 47 (10.2%) | 0 (0.0%) |
| $1,000 to $1,499 | 103 (22.3%) | 0 (0.0%) |
| $1,500 to $1,999 | 18 (3.9%) | 0 (0.0%) |
| $2,000 to $2,499 | 23 (5.0%) | 0 (0.0%) |
| $2,500 to $2,999 | 13 (2.8%) | 0 (0.0%) |
| $3,000 or more | 85 (18.4%) | 0 (0.0%) |
| Total | 462 (100.0%) | 0 (0.0%) |
Physical Housing Characteristics in Thornport
Housing Structures in Thornport
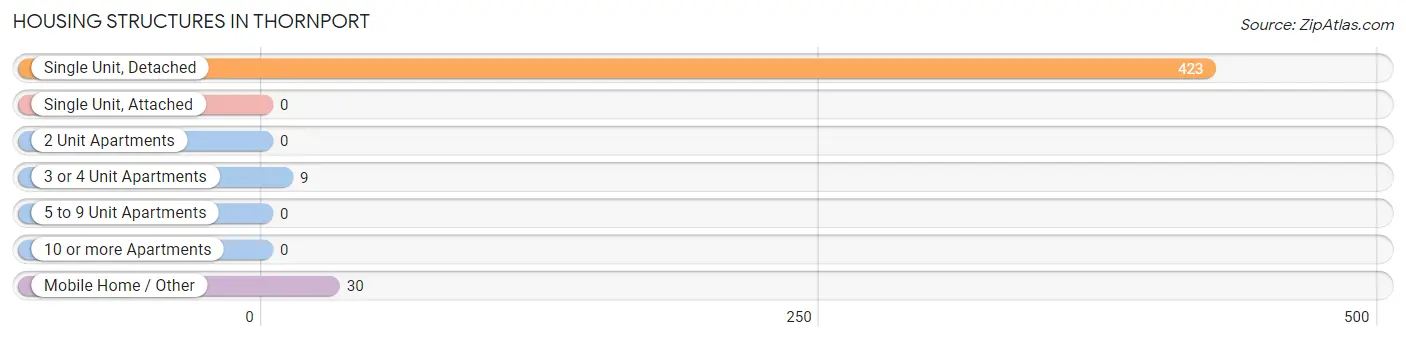
| Structure Type | # Housing Units | % Housing Units |
| Single Unit, Detached | 423 | 91.6% |
| Single Unit, Attached | 0 | 0.0% |
| 2 Unit Apartments | 0 | 0.0% |
| 3 or 4 Unit Apartments | 9 | 1.9% |
| 5 to 9 Unit Apartments | 0 | 0.0% |
| 10 or more Apartments | 0 | 0.0% |
| Mobile Home / Other | 30 | 6.5% |
| Total | 462 | 100.0% |
Housing Structures by Occupancy in Thornport
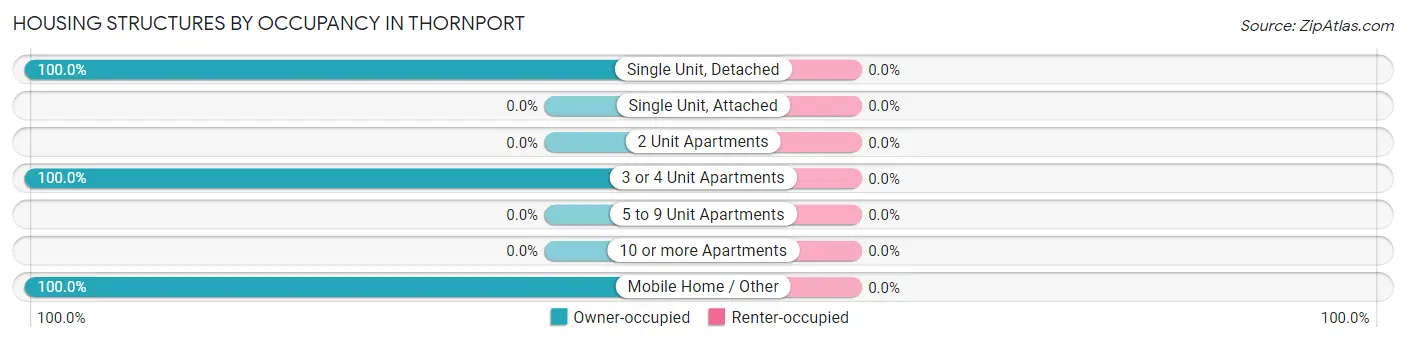
| Structure Type | Owner-occupied | Renter-occupied |
| Single Unit, Detached | 423 (100.0%) | 0 (0.0%) |
| Single Unit, Attached | 0 (0.0%) | 0 (0.0%) |
| 2 Unit Apartments | 0 (0.0%) | 0 (0.0%) |
| 3 or 4 Unit Apartments | 9 (100.0%) | 0 (0.0%) |
| 5 to 9 Unit Apartments | 0 (0.0%) | 0 (0.0%) |
| 10 or more Apartments | 0 (0.0%) | 0 (0.0%) |
| Mobile Home / Other | 30 (100.0%) | 0 (0.0%) |
| Total | 462 (100.0%) | 0 (0.0%) |
Housing Structures by Number of Rooms in Thornport
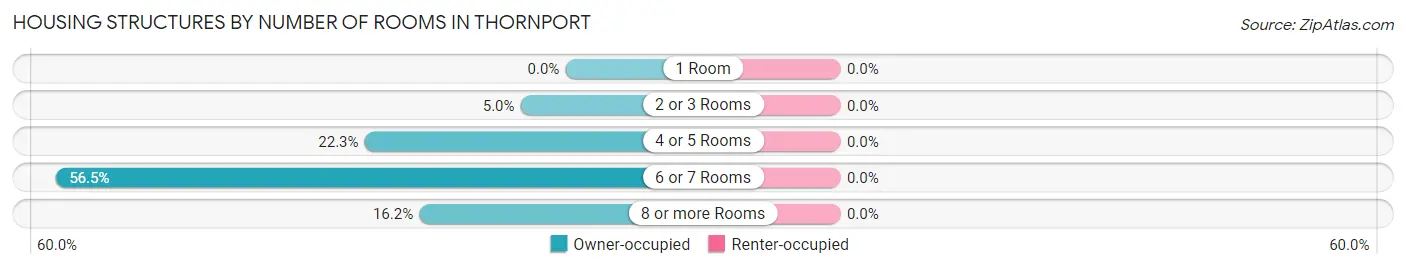
| Number of Rooms | Owner-occupied | Renter-occupied |
| 1 Room | 0 (0.0%) | 0 (0.0%) |
| 2 or 3 Rooms | 23 (5.0%) | 0 (0.0%) |
| 4 or 5 Rooms | 103 (22.3%) | 0 (0.0%) |
| 6 or 7 Rooms | 261 (56.5%) | 0 (0.0%) |
| 8 or more Rooms | 75 (16.2%) | 0 (0.0%) |
| Total | 462 (100.0%) | 0 (0.0%) |
Housing Structure by Heating Type in Thornport
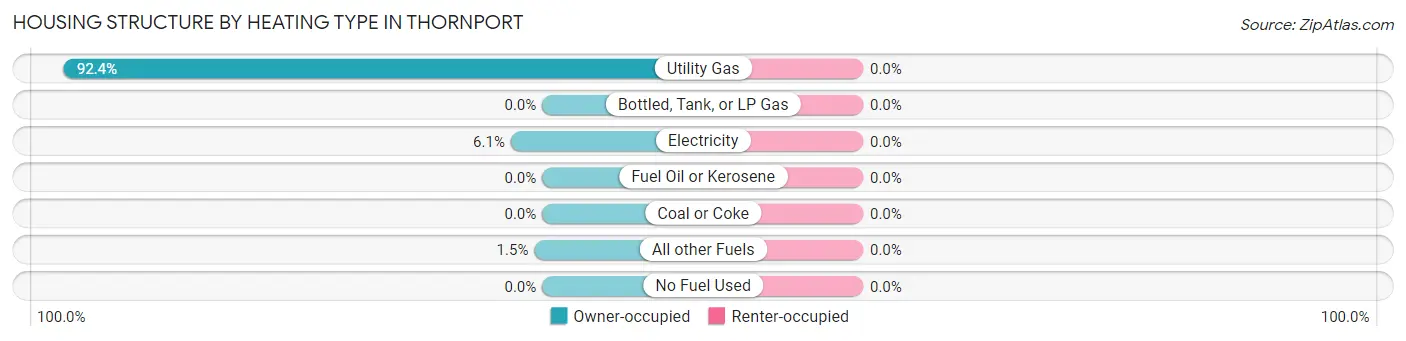
| Heating Type | Owner-occupied | Renter-occupied |
| Utility Gas | 427 (92.4%) | 0 (0.0%) |
| Bottled, Tank, or LP Gas | 0 (0.0%) | 0 (0.0%) |
| Electricity | 28 (6.1%) | 0 (0.0%) |
| Fuel Oil or Kerosene | 0 (0.0%) | 0 (0.0%) |
| Coal or Coke | 0 (0.0%) | 0 (0.0%) |
| All other Fuels | 7 (1.5%) | 0 (0.0%) |
| No Fuel Used | 0 (0.0%) | 0 (0.0%) |
| Total | 462 (100.0%) | 0 (0.0%) |
Household Vehicle Usage in Thornport
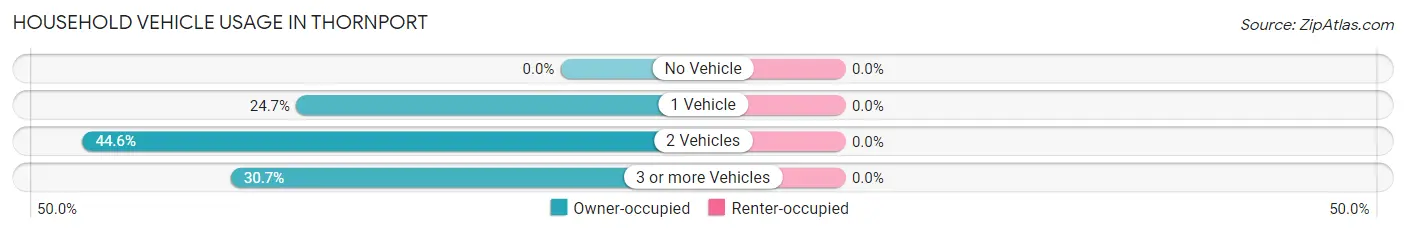
| Vehicles per Household | Owner-occupied | Renter-occupied |
| No Vehicle | 0 (0.0%) | 0 (0.0%) |
| 1 Vehicle | 114 (24.7%) | 0 (0.0%) |
| 2 Vehicles | 206 (44.6%) | 0 (0.0%) |
| 3 or more Vehicles | 142 (30.7%) | 0 (0.0%) |
| Total | 462 (100.0%) | 0 (0.0%) |
Real Estate & Mortgages in Thornport
Real Estate and Mortgage Overview in Thornport
| Characteristic | Without Mortgage | With Mortgage |
| Housing Units | 298 | 164 |
| Median Property Value | $422,500 | $430,500 |
| Median Household Income | $90,313 | $86 |
| Monthly Housing Costs | $677 | $85 |
| Real Estate Taxes | $3,535 | $0 |
Property Value by Mortgage Status in Thornport
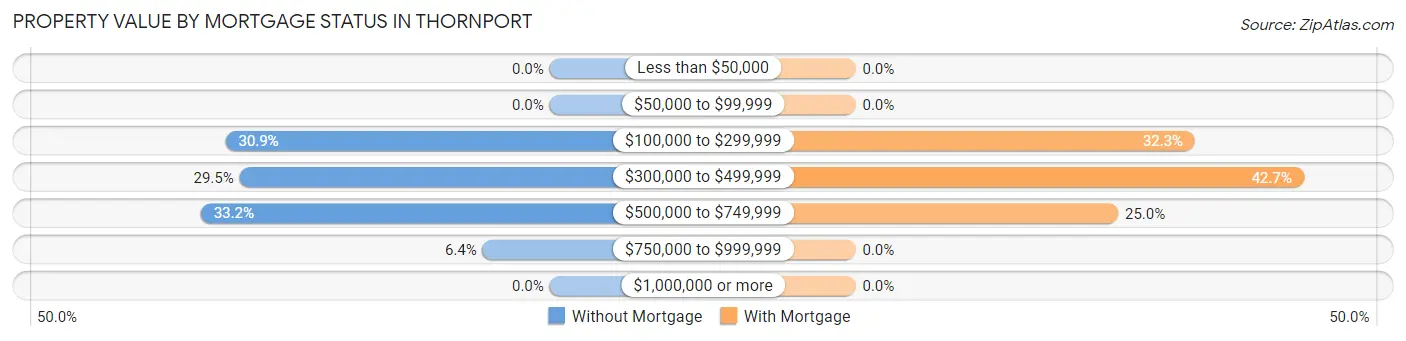
| Property Value | Without Mortgage | With Mortgage |
| Less than $50,000 | 0 (0.0%) | 0 (0.0%) |
| $50,000 to $99,999 | 0 (0.0%) | 0 (0.0%) |
| $100,000 to $299,999 | 92 (30.9%) | 53 (32.3%) |
| $300,000 to $499,999 | 88 (29.5%) | 70 (42.7%) |
| $500,000 to $749,999 | 99 (33.2%) | 41 (25.0%) |
| $750,000 to $999,999 | 19 (6.4%) | 0 (0.0%) |
| $1,000,000 or more | 0 (0.0%) | 0 (0.0%) |
| Total | 298 (100.0%) | 164 (100.0%) |
Household Income by Mortgage Status in Thornport
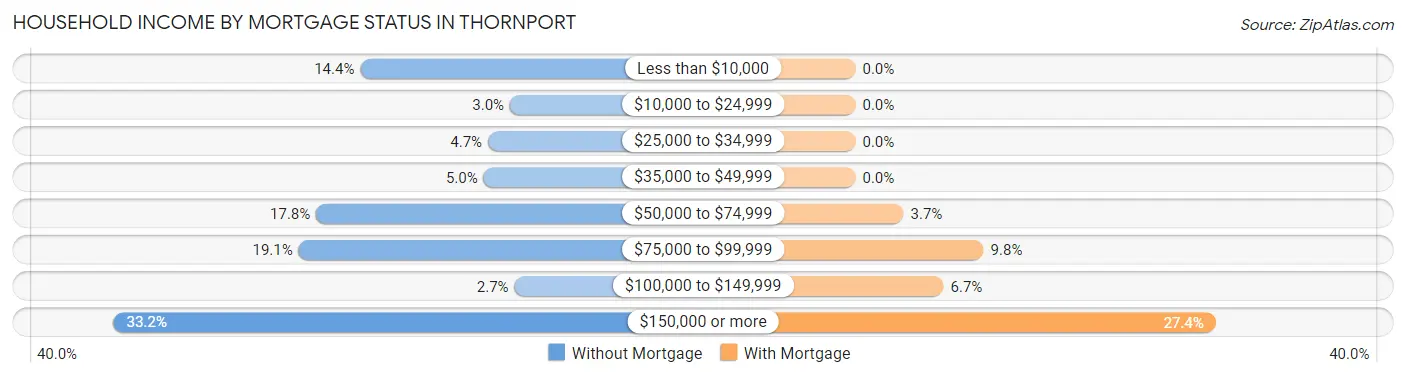
| Household Income | Without Mortgage | With Mortgage |
| Less than $10,000 | 43 (14.4%) | 0 (0.0%) |
| $10,000 to $24,999 | 9 (3.0%) | 0 (0.0%) |
| $25,000 to $34,999 | 14 (4.7%) | 0 (0.0%) |
| $35,000 to $49,999 | 15 (5.0%) | 0 (0.0%) |
| $50,000 to $74,999 | 53 (17.8%) | 6 (3.7%) |
| $75,000 to $99,999 | 57 (19.1%) | 16 (9.8%) |
| $100,000 to $149,999 | 8 (2.7%) | 11 (6.7%) |
| $150,000 or more | 99 (33.2%) | 45 (27.4%) |
| Total | 298 (100.0%) | 164 (100.0%) |
Property Value to Household Income Ratio in Thornport
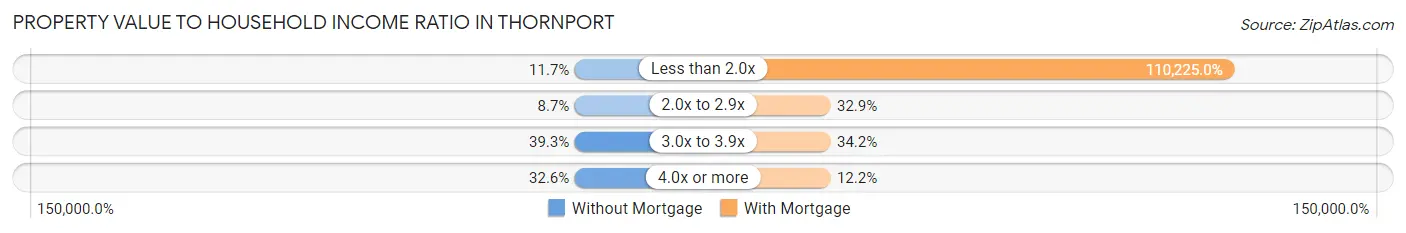
| Value-to-Income Ratio | Without Mortgage | With Mortgage |
| Less than 2.0x | 35 (11.7%) | 180,769 (110,225.0%) |
| 2.0x to 2.9x | 26 (8.7%) | 54 (32.9%) |
| 3.0x to 3.9x | 117 (39.3%) | 56 (34.2%) |
| 4.0x or more | 97 (32.6%) | 20 (12.2%) |
| Total | 298 (100.0%) | 164 (100.0%) |
Real Estate Taxes by Mortgage Status in Thornport
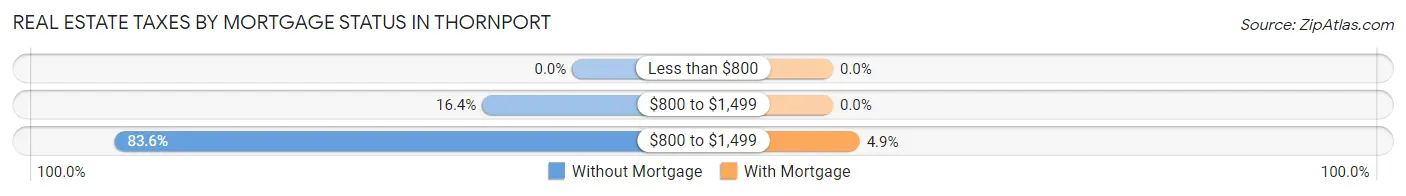
| Property Taxes | Without Mortgage | With Mortgage |
| Less than $800 | 0 (0.0%) | 0 (0.0%) |
| $800 to $1,499 | 49 (16.4%) | 0 (0.0%) |
| $800 to $1,499 | 249 (83.6%) | 8 (4.9%) |
| Total | 298 (100.0%) | 164 (100.0%) |
Health & Disability in Thornport
Health Insurance Coverage by Age in Thornport
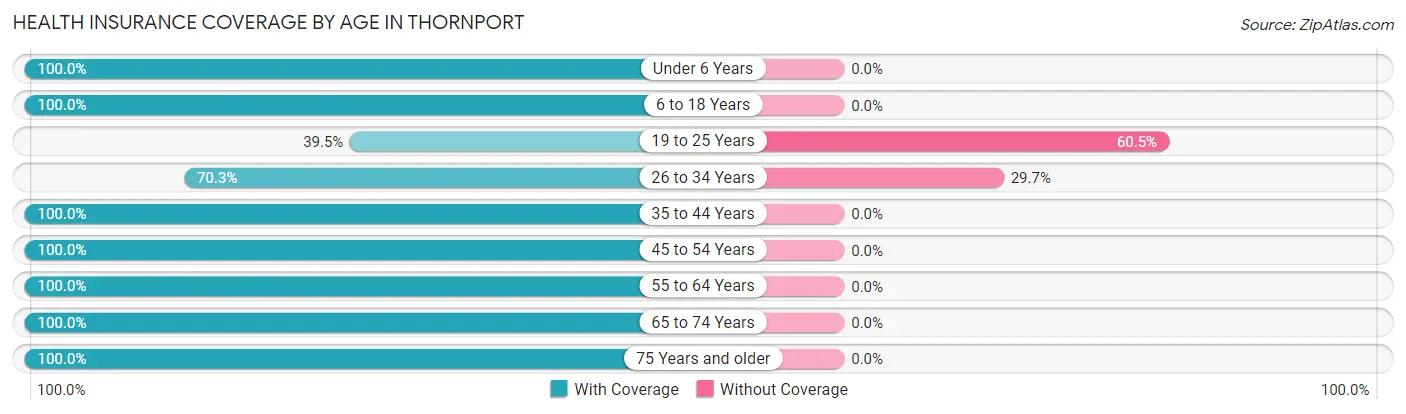
| Age Bracket | With Coverage | Without Coverage |
| Under 6 Years | 50 (100.0%) | 0 (0.0%) |
| 6 to 18 Years | 63 (100.0%) | 0 (0.0%) |
| 19 to 25 Years | 15 (39.5%) | 23 (60.5%) |
| 26 to 34 Years | 78 (70.3%) | 33 (29.7%) |
| 35 to 44 Years | 65 (100.0%) | 0 (0.0%) |
| 45 to 54 Years | 148 (100.0%) | 0 (0.0%) |
| 55 to 64 Years | 221 (100.0%) | 0 (0.0%) |
| 65 to 74 Years | 210 (100.0%) | 0 (0.0%) |
| 75 Years and older | 134 (100.0%) | 0 (0.0%) |
| Total | 984 (94.6%) | 56 (5.4%) |
Health Insurance Coverage by Citizenship Status in Thornport
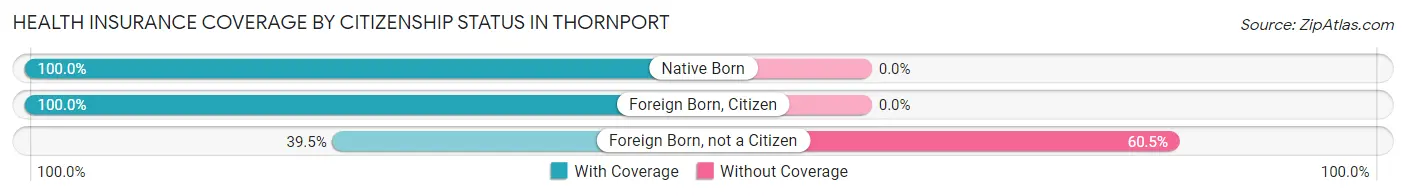
| Citizenship Status | With Coverage | Without Coverage |
| Native Born | 50 (100.0%) | 0 (0.0%) |
| Foreign Born, Citizen | 63 (100.0%) | 0 (0.0%) |
| Foreign Born, not a Citizen | 15 (39.5%) | 23 (60.5%) |
Health Insurance Coverage by Household Income in Thornport
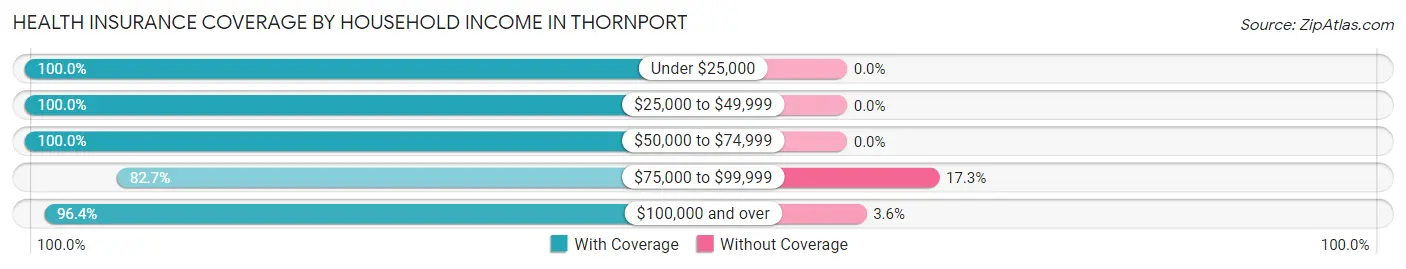
| Household Income | With Coverage | Without Coverage |
| Under $25,000 | 57 (100.0%) | 0 (0.0%) |
| $25,000 to $49,999 | 52 (100.0%) | 0 (0.0%) |
| $50,000 to $74,999 | 106 (100.0%) | 0 (0.0%) |
| $75,000 to $99,999 | 158 (82.7%) | 33 (17.3%) |
| $100,000 and over | 611 (96.4%) | 23 (3.6%) |
Public vs Private Health Insurance Coverage by Age in Thornport
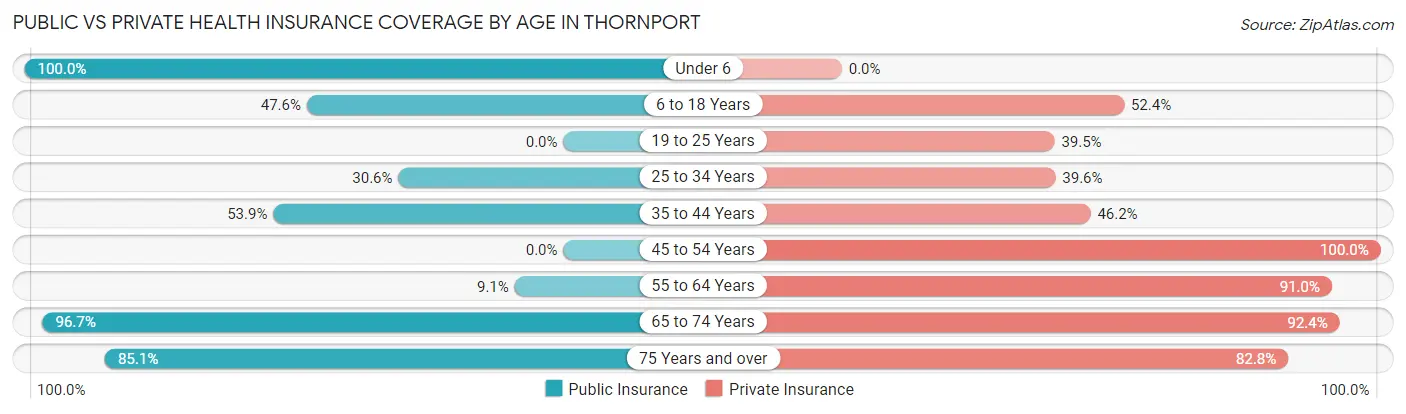
| Age Bracket | Public Insurance | Private Insurance |
| Under 6 | 50 (100.0%) | 0 (0.0%) |
| 6 to 18 Years | 30 (47.6%) | 33 (52.4%) |
| 19 to 25 Years | 0 (0.0%) | 15 (39.5%) |
| 25 to 34 Years | 34 (30.6%) | 44 (39.6%) |
| 35 to 44 Years | 35 (53.8%) | 30 (46.2%) |
| 45 to 54 Years | 0 (0.0%) | 148 (100.0%) |
| 55 to 64 Years | 20 (9.0%) | 201 (90.9%) |
| 65 to 74 Years | 203 (96.7%) | 194 (92.4%) |
| 75 Years and over | 114 (85.1%) | 111 (82.8%) |
| Total | 486 (46.7%) | 776 (74.6%) |
Disability Status by Sex by Age in Thornport
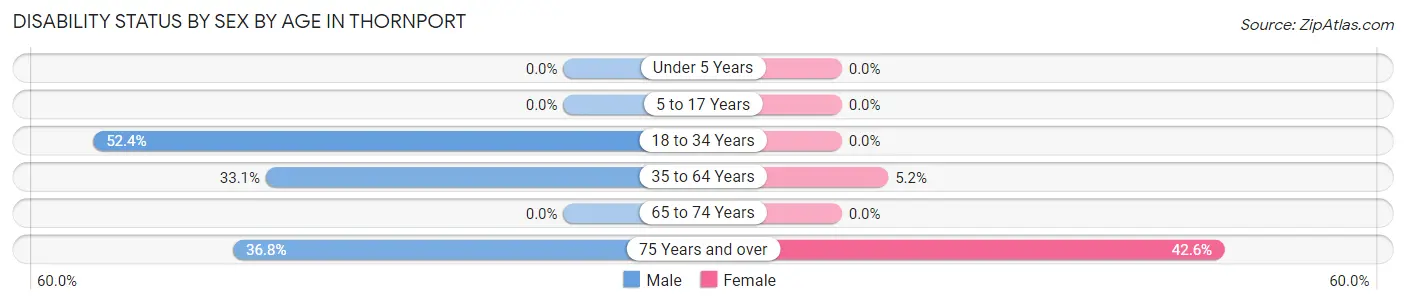
| Age Bracket | Male | Female |
| Under 5 Years | 0 (0.0%) | 0 (0.0%) |
| 5 to 17 Years | 0 (0.0%) | 0 (0.0%) |
| 18 to 34 Years | 78 (52.3%) | 0 (0.0%) |
| 35 to 64 Years | 54 (33.1%) | 14 (5.2%) |
| 65 to 74 Years | 0 (0.0%) | 0 (0.0%) |
| 75 Years and over | 32 (36.8%) | 20 (42.5%) |
Disability Class by Sex by Age in Thornport
Disability Class: Hearing Difficulty
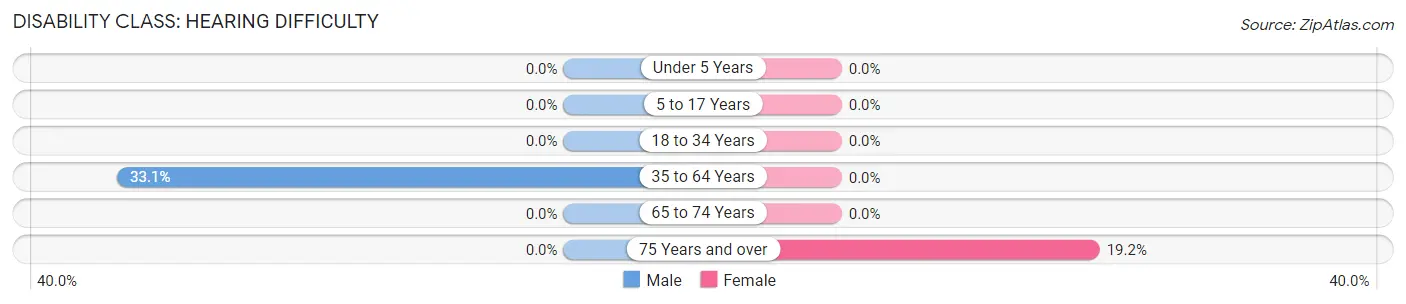
| Age Bracket | Male | Female |
| Under 5 Years | 0 (0.0%) | 0 (0.0%) |
| 5 to 17 Years | 0 (0.0%) | 0 (0.0%) |
| 18 to 34 Years | 0 (0.0%) | 0 (0.0%) |
| 35 to 64 Years | 54 (33.1%) | 0 (0.0%) |
| 65 to 74 Years | 0 (0.0%) | 0 (0.0%) |
| 75 Years and over | 0 (0.0%) | 9 (19.2%) |
Disability Class: Vision Difficulty
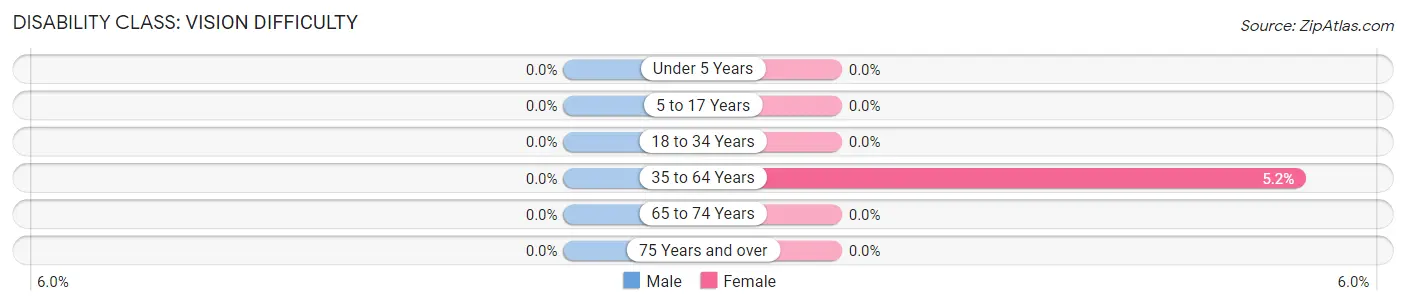
| Age Bracket | Male | Female |
| Under 5 Years | 0 (0.0%) | 0 (0.0%) |
| 5 to 17 Years | 0 (0.0%) | 0 (0.0%) |
| 18 to 34 Years | 0 (0.0%) | 0 (0.0%) |
| 35 to 64 Years | 0 (0.0%) | 14 (5.2%) |
| 65 to 74 Years | 0 (0.0%) | 0 (0.0%) |
| 75 Years and over | 0 (0.0%) | 0 (0.0%) |
Disability Class: Cognitive Difficulty
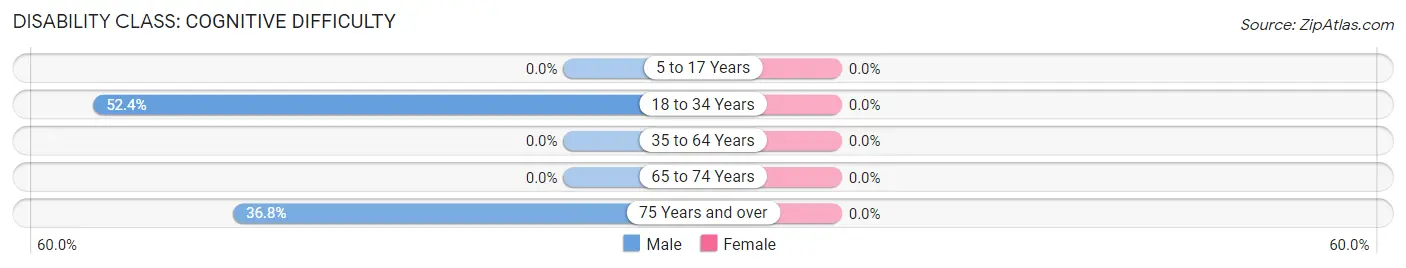
| Age Bracket | Male | Female |
| 5 to 17 Years | 0 (0.0%) | 0 (0.0%) |
| 18 to 34 Years | 78 (52.3%) | 0 (0.0%) |
| 35 to 64 Years | 0 (0.0%) | 0 (0.0%) |
| 65 to 74 Years | 0 (0.0%) | 0 (0.0%) |
| 75 Years and over | 32 (36.8%) | 0 (0.0%) |
Disability Class: Ambulatory Difficulty
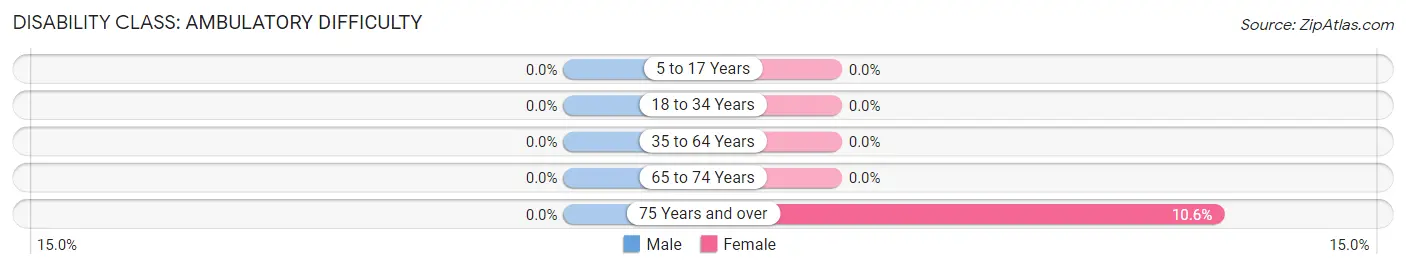
| Age Bracket | Male | Female |
| 5 to 17 Years | 0 (0.0%) | 0 (0.0%) |
| 18 to 34 Years | 0 (0.0%) | 0 (0.0%) |
| 35 to 64 Years | 0 (0.0%) | 0 (0.0%) |
| 65 to 74 Years | 0 (0.0%) | 0 (0.0%) |
| 75 Years and over | 0 (0.0%) | 5 (10.6%) |
Disability Class: Self-Care Difficulty
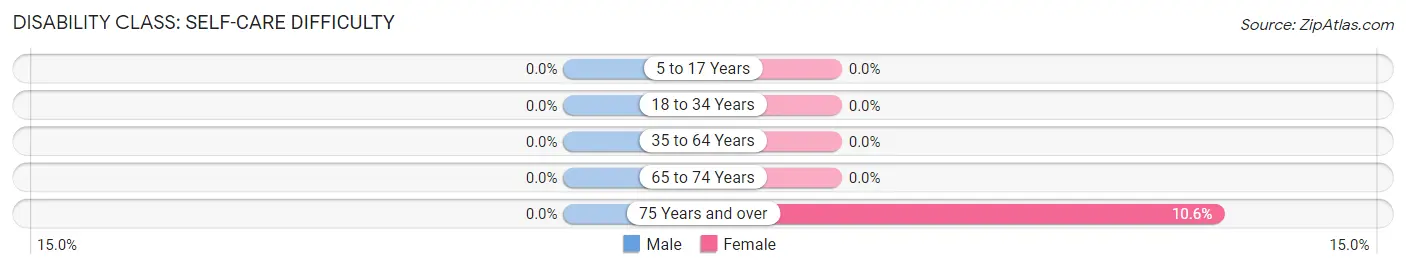
| Age Bracket | Male | Female |
| 5 to 17 Years | 0 (0.0%) | 0 (0.0%) |
| 18 to 34 Years | 0 (0.0%) | 0 (0.0%) |
| 35 to 64 Years | 0 (0.0%) | 0 (0.0%) |
| 65 to 74 Years | 0 (0.0%) | 0 (0.0%) |
| 75 Years and over | 0 (0.0%) | 5 (10.6%) |
Technology Access in Thornport
Computing Device Access in Thornport
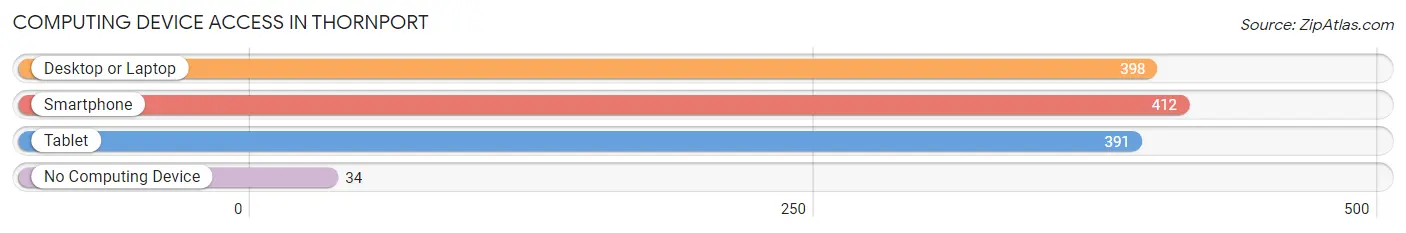
| Device Type | # Households | % Households |
| Desktop or Laptop | 398 | 86.2% |
| Smartphone | 412 | 89.2% |
| Tablet | 391 | 84.6% |
| No Computing Device | 34 | 7.4% |
| Total | 462 | 100.0% |
Internet Access in Thornport
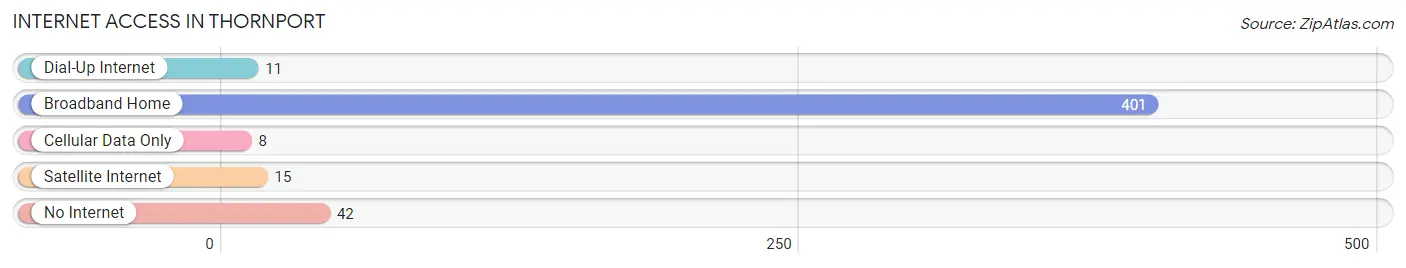
| Internet Type | # Households | % Households |
| Dial-Up Internet | 11 | 2.4% |
| Broadband Home | 401 | 86.8% |
| Cellular Data Only | 8 | 1.7% |
| Satellite Internet | 15 | 3.3% |
| No Internet | 42 | 9.1% |
| Total | 462 | 100.0% |
Thornport Summary
Thornport is a small village located in the southeastern corner of Ohio, in the county of Perry. It is situated on the banks of the Muskingum River, and is surrounded by rolling hills and farmland. The village has a population of approximately 1,000 people, and is a part of the larger Zanesville-Zanesville Metropolitan Statistical Area.
History
Thornport was founded in 1812 by a group of settlers from Pennsylvania. The village was named after the nearby Thorn Creek, which was named after the thorns that grew along its banks. The settlers were attracted to the area due to its fertile soil and abundant natural resources. The village quickly grew and became a thriving agricultural community.
In the late 19th century, the village began to experience a period of industrialization. The Muskingum River was used to power several mills and factories, and the village became a hub for the production of textiles, furniture, and other goods. The village also became a popular destination for tourists, who were drawn to the area's natural beauty and recreational opportunities.
Geography
Thornport is located in the southeastern corner of Ohio, in the county of Perry. It is situated on the banks of the Muskingum River, and is surrounded by rolling hills and farmland. The village is located approximately 30 miles east of Columbus, and is part of the larger Zanesville-Zanesville Metropolitan Statistical Area.
The village is located in a humid continental climate zone, with hot summers and cold winters. The average annual temperature is around 50 degrees Fahrenheit, and the average annual precipitation is around 40 inches.
Economy
Thornport's economy is largely based on agriculture and tourism. The village is home to several farms, which produce a variety of crops, including corn, soybeans, and wheat. The village is also home to several wineries, which produce a variety of wines.
The village is also a popular destination for tourists, who are drawn to the area's natural beauty and recreational opportunities. The village is home to several parks, including the Thornport State Park, which offers camping, fishing, and hiking opportunities. The village is also home to several golf courses, and is a popular destination for boating and water sports.
Demographics
As of the 2010 census, the population of Thornport was 1,000 people. The racial makeup of the village was 97.2% White, 0.7% African American, 0.3% Native American, 0.3% Asian, and 1.5% from other races. The median household income was $37,500, and the median family income was $45,000. The per capita income was $19,000.
Thornport is a small, rural village with a close-knit community. The village is home to several churches, and is a popular destination for outdoor recreation. The village is also home to several small businesses, including restaurants, shops, and other services.
Common Questions
What is Per Capita Income in Thornport?
Per Capita income in Thornport is $52,873.
What is the Median Family Income in Thornport?
Median Family Income in Thornport is $155,438.
What is the Median Household income in Thornport?
Median Household Income in Thornport is $110,000.
What is Inequality or Gini Index in Thornport?
Inequality or Gini Index in Thornport is 0.39.
What is the Total Population of Thornport?
Total Population of Thornport is 1,040.
What is the Total Male Population of Thornport?
Total Male Population of Thornport is 557.
What is the Total Female Population of Thornport?
Total Female Population of Thornport is 483.
What is the Ratio of Males per 100 Females in Thornport?
There are 115.32 Males per 100 Females in Thornport.
What is the Ratio of Females per 100 Males in Thornport?
There are 86.71 Females per 100 Males in Thornport.
What is the Median Population Age in Thornport?
Median Population Age in Thornport is 56.4 Years.
What is the Average Family Size in Thornport
Average Family Size in Thornport is 2.6 People.
What is the Average Household Size in Thornport
Average Household Size in Thornport is 2.2 People.
How Large is the Labor Force in Thornport?
There are 516 People in the Labor Forcein in Thornport.
What is the Percentage of People in the Labor Force in Thornport?
53.9% of People are in the Labor Force in Thornport.
What is the Unemployment Rate in Thornport?
Unemployment Rate in Thornport is 3.3%.