Bay Village, OH Map & Demographics
Bay Village Map
Bay Village Overview
$59,920
PER CAPITA INCOME
$144,186
AVG FAMILY INCOME
$118,816
AVG HOUSEHOLD INCOME
29.9%
WAGE / INCOME GAP [ % ]
70.1¢/ $1
WAGE / INCOME GAP [ $ ]
0.44
INEQUALITY / GINI INDEX
16,047
TOTAL POPULATION
8,138
MALE POPULATION
7,909
FEMALE POPULATION
102.90
MALES / 100 FEMALES
97.19
FEMALES / 100 MALES
42.8
MEDIAN AGE
3.2
AVG FAMILY SIZE
2.6
AVG HOUSEHOLD SIZE
8,221
LABOR FORCE [ PEOPLE ]
67.3%
PERCENT IN LABOR FORCE
2.2%
UNEMPLOYMENT RATE
Bay Village Zip Codes
Bay Village Area Codes
Income in Bay Village
Income Overview in Bay Village
Per Capita Income in Bay Village is $59,920, while median incomes of families and households are $144,186 and $118,816 respectively.
| Characteristic | Number | Measure |
| Per Capita Income | 16,047 | $59,920 |
| Median Family Income | 4,346 | $144,186 |
| Mean Family Income | 4,346 | $184,976 |
| Median Household Income | 6,086 | $118,816 |
| Mean Household Income | 6,086 | $156,563 |
| Income Deficit | 4,346 | $0 |
| Wage / Income Gap (%) | 16,047 | 29.88% |
| Wage / Income Gap ($) | 16,047 | 70.12¢ per $1 |
| Gini / Inequality Index | 16,047 | 0.44 |
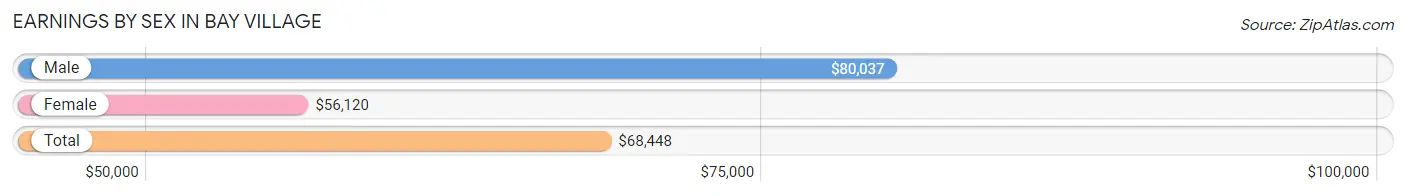
Earnings by Sex in Bay Village
Average Earnings in Bay Village are $68,448, $80,037 for men and $56,120 for women, a difference of 29.9%.
| Sex | Number | Average Earnings |
| Male | 4,521 (52.6%) | $80,037 |
| Female | 4,077 (47.4%) | $56,120 |
| Total | 8,598 (100.0%) | $68,448 |
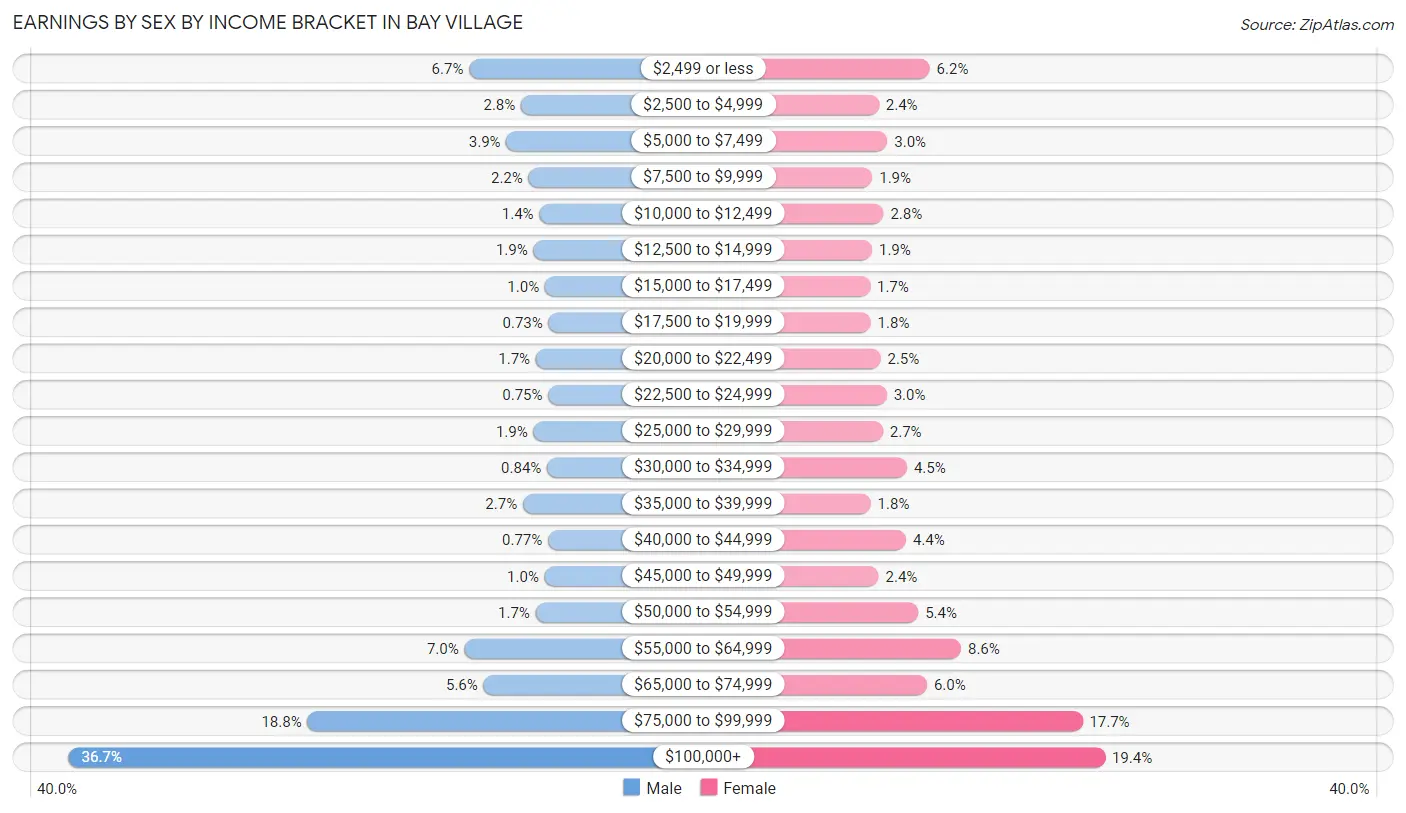
Earnings by Sex by Income Bracket in Bay Village
The most common earnings brackets in Bay Village are $100,000+ for men (1,659 | 36.7%) and $100,000+ for women (789 | 19.4%).
| Income | Male | Female |
| $2,499 or less | 302 (6.7%) | 253 (6.2%) |
| $2,500 to $4,999 | 126 (2.8%) | 98 (2.4%) |
| $5,000 to $7,499 | 176 (3.9%) | 124 (3.0%) |
| $7,500 to $9,999 | 101 (2.2%) | 78 (1.9%) |
| $10,000 to $12,499 | 64 (1.4%) | 112 (2.8%) |
| $12,500 to $14,999 | 84 (1.9%) | 77 (1.9%) |
| $15,000 to $17,499 | 45 (1.0%) | 71 (1.7%) |
| $17,500 to $19,999 | 33 (0.7%) | 73 (1.8%) |
| $20,000 to $22,499 | 76 (1.7%) | 103 (2.5%) |
| $22,500 to $24,999 | 34 (0.7%) | 122 (3.0%) |
| $25,000 to $29,999 | 84 (1.9%) | 110 (2.7%) |
| $30,000 to $34,999 | 38 (0.8%) | 184 (4.5%) |
| $35,000 to $39,999 | 120 (2.6%) | 73 (1.8%) |
| $40,000 to $44,999 | 35 (0.8%) | 181 (4.4%) |
| $45,000 to $49,999 | 46 (1.0%) | 97 (2.4%) |
| $50,000 to $54,999 | 77 (1.7%) | 218 (5.3%) |
| $55,000 to $64,999 | 318 (7.0%) | 349 (8.6%) |
| $65,000 to $74,999 | 253 (5.6%) | 245 (6.0%) |
| $75,000 to $99,999 | 850 (18.8%) | 720 (17.7%) |
| $100,000+ | 1,659 (36.7%) | 789 (19.4%) |
| Total | 4,521 (100.0%) | 4,077 (100.0%) |
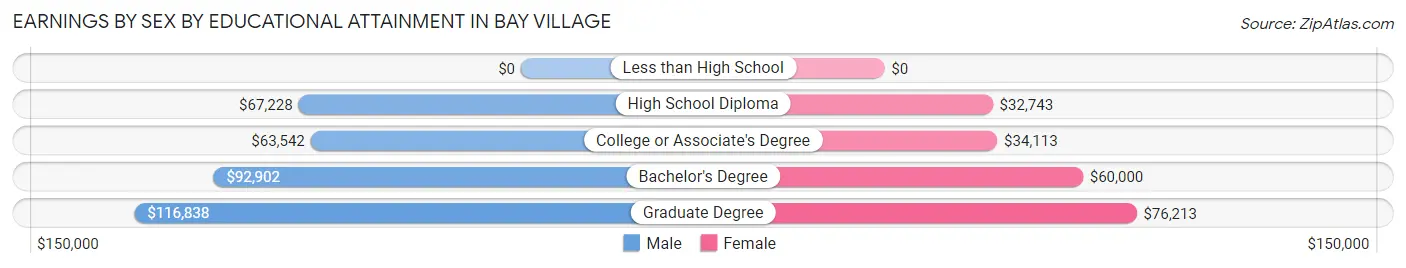
Earnings by Sex by Educational Attainment in Bay Village
Average earnings in Bay Village are $88,950 for men and $59,063 for women, a difference of 33.6%. Men with an educational attainment of graduate degree enjoy the highest average annual earnings of $116,838, while those with college or associate's degree education earn the least with $63,542. Women with an educational attainment of graduate degree earn the most with the average annual earnings of $76,213, while those with high school diploma education have the smallest earnings of $32,743.
| Educational Attainment | Male Income | Female Income |
| Less than High School | - | - |
| High School Diploma | $67,228 | $32,743 |
| College or Associate's Degree | $63,542 | $34,113 |
| Bachelor's Degree | $92,902 | $60,000 |
| Graduate Degree | $116,838 | $76,213 |
| Total | $88,950 | $59,063 |
Family Income in Bay Village
Family Income Brackets in Bay Village
According to the Bay Village family income data, there are 1,321 families falling into the $200,000+ income range, which is the most common income bracket and makes up 30.4% of all families. Conversely, the $15,000 to $24,999 income bracket is the least frequent group with only 26 families (0.6%) belonging to this category.
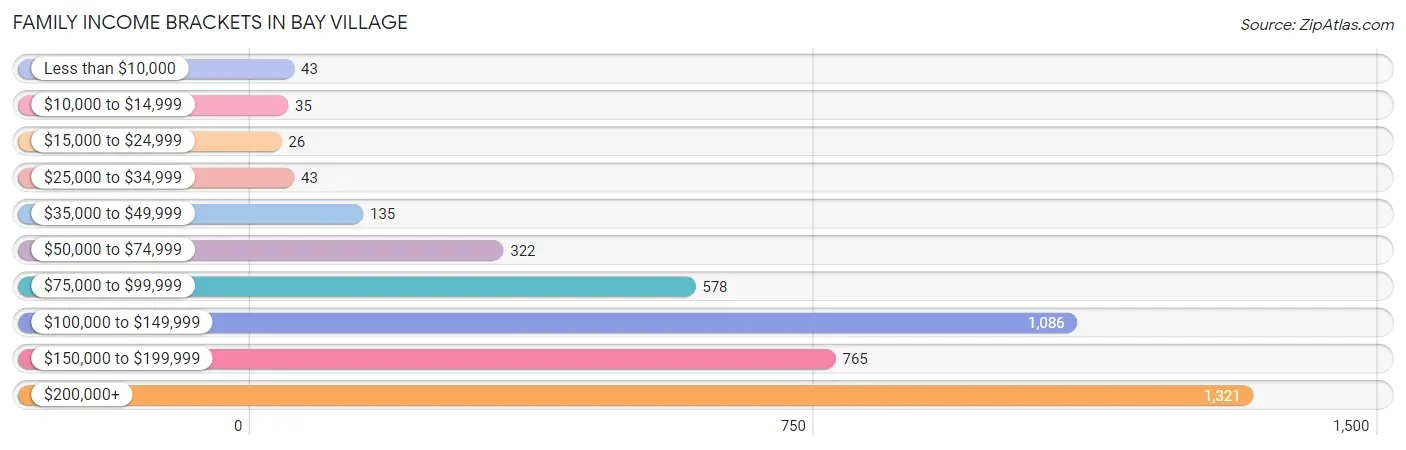
| Income Bracket | # Families | % Families |
| Less than $10,000 | 43 | 1.0% |
| $10,000 to $14,999 | 35 | 0.8% |
| $15,000 to $24,999 | 26 | 0.6% |
| $25,000 to $34,999 | 43 | 1.0% |
| $35,000 to $49,999 | 135 | 3.1% |
| $50,000 to $74,999 | 322 | 7.4% |
| $75,000 to $99,999 | 578 | 13.3% |
| $100,000 to $149,999 | 1,086 | 25.0% |
| $150,000 to $199,999 | 765 | 17.6% |
| $200,000+ | 1,321 | 30.4% |
Family Income by Famaliy Size in Bay Village
6-person families (175 | 4.0%) account for the highest median family income in Bay Village with $226,361 per family, while 2-person families (1,785 | 41.1%) have the highest median income of $57,676 per family member.
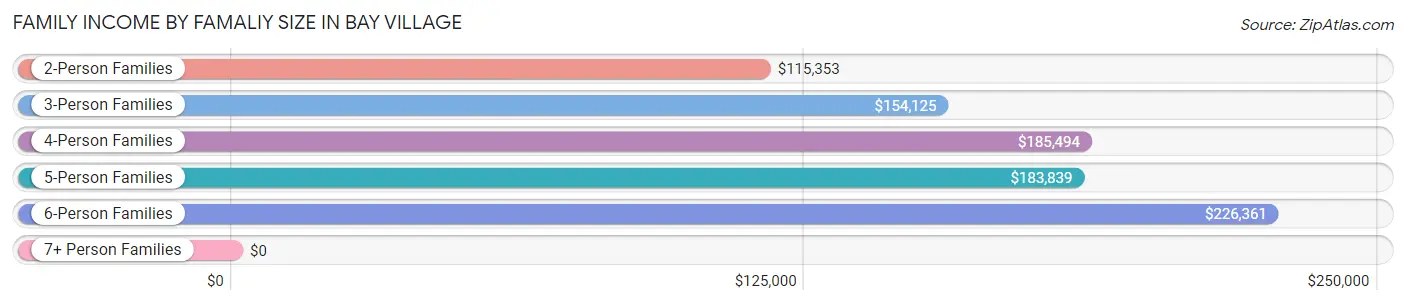
| Income Bracket | # Families | Median Income |
| 2-Person Families | 1,785 (41.1%) | $115,353 |
| 3-Person Families | 921 (21.2%) | $154,125 |
| 4-Person Families | 1,203 (27.7%) | $185,494 |
| 5-Person Families | 245 (5.6%) | $183,839 |
| 6-Person Families | 175 (4.0%) | $226,361 |
| 7+ Person Families | 17 (0.4%) | $0 |
| Total | 4,346 (100.0%) | $144,186 |
Family Income by Number of Earners in Bay Village
The median family income in Bay Village is $144,186, with families comprising 3+ earners (552) having the highest median family income of $201,875, while families with no earners (477) have the lowest median family income of $85,781, accounting for 12.7% and 11.0% of families, respectively.
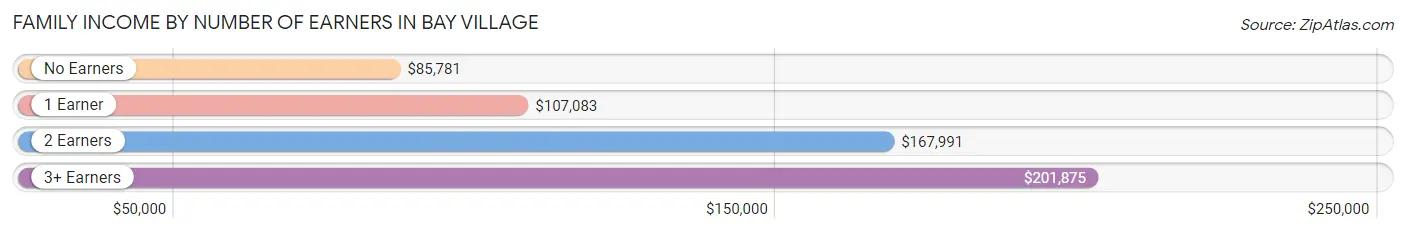
| Number of Earners | # Families | Median Income |
| No Earners | 477 (11.0%) | $85,781 |
| 1 Earner | 1,117 (25.7%) | $107,083 |
| 2 Earners | 2,200 (50.6%) | $167,991 |
| 3+ Earners | 552 (12.7%) | $201,875 |
| Total | 4,346 (100.0%) | $144,186 |
Household Income in Bay Village
Household Income Brackets in Bay Village
With 1,461 households falling in the category, the $200,000+ income range is the most frequent in Bay Village, accounting for 24.0% of all households. In contrast, only 128 households (2.1%) fall into the $10,000 to $14,999 income bracket, making it the least populous group.
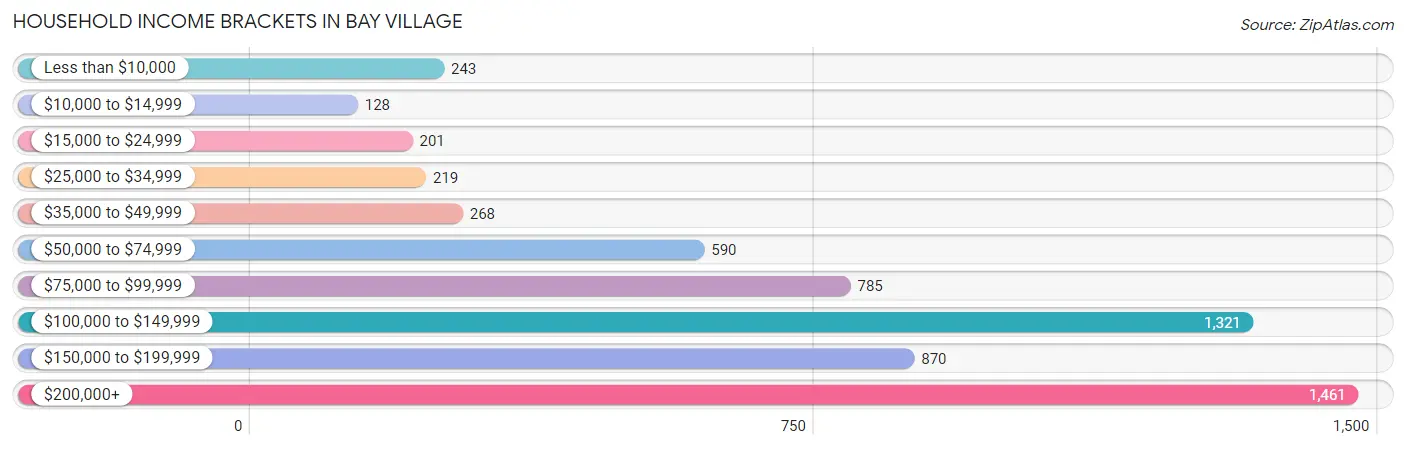
| Income Bracket | # Households | % Households |
| Less than $10,000 | 243 | 4.0% |
| $10,000 to $14,999 | 128 | 2.1% |
| $15,000 to $24,999 | 201 | 3.3% |
| $25,000 to $34,999 | 219 | 3.6% |
| $35,000 to $49,999 | 268 | 4.4% |
| $50,000 to $74,999 | 590 | 9.7% |
| $75,000 to $99,999 | 785 | 12.9% |
| $100,000 to $149,999 | 1,321 | 21.7% |
| $150,000 to $199,999 | 870 | 14.3% |
| $200,000+ | 1,461 | 24.0% |
Household Income by Householder Age in Bay Village
The median household income in Bay Village is $118,816, with the highest median household income of $155,333 found in the 45 to 64 years age bracket for the primary householder. A total of 2,456 households (40.4%) fall into this category.
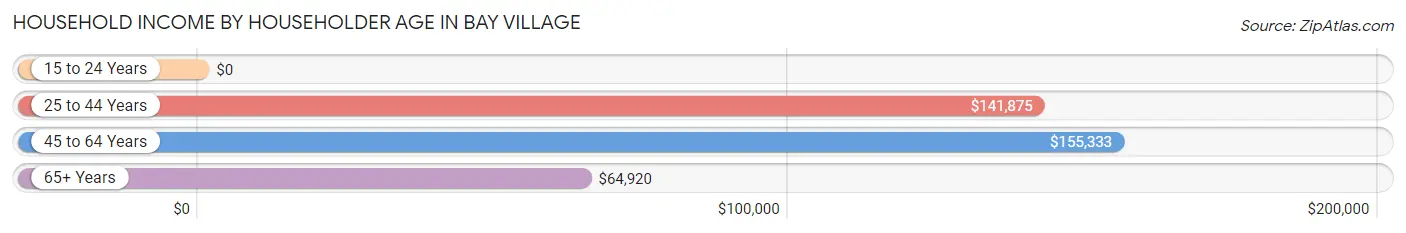
| Income Bracket | # Households | Median Income |
| 15 to 24 Years | 0 (0.0%) | $0 |
| 25 to 44 Years | 1,749 (28.7%) | $141,875 |
| 45 to 64 Years | 2,456 (40.4%) | $155,333 |
| 65+ Years | 1,881 (30.9%) | $64,920 |
| Total | 6,086 (100.0%) | $118,816 |
Poverty in Bay Village
Income Below Poverty by Sex and Age in Bay Village
With 3.4% poverty level for males and 5.7% for females among the residents of Bay Village, 65 to 74 year old males and 75 year old and over females are the most vulnerable to poverty, with 89 males (9.5%) and 96 females (15.2%) in their respective age groups living below the poverty level.
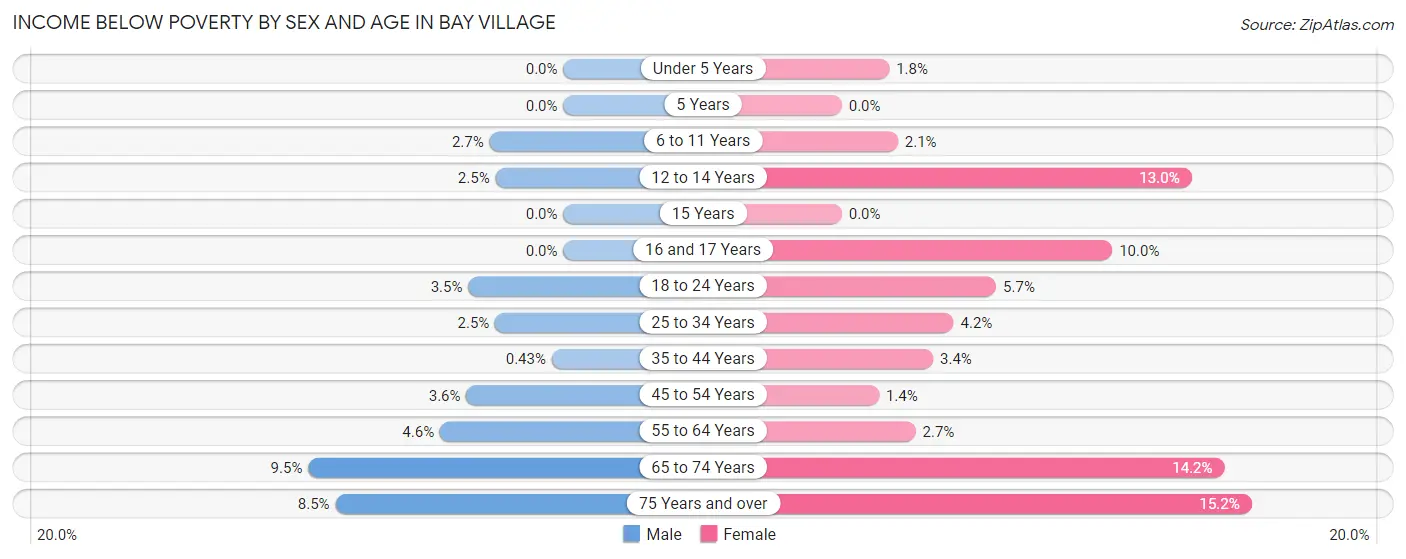
| Age Bracket | Male | Female |
| Under 5 Years | 0 (0.0%) | 8 (1.8%) |
| 5 Years | 0 (0.0%) | 0 (0.0%) |
| 6 to 11 Years | 22 (2.7%) | 12 (2.1%) |
| 12 to 14 Years | 11 (2.5%) | 51 (13.0%) |
| 15 Years | 0 (0.0%) | 0 (0.0%) |
| 16 and 17 Years | 0 (0.0%) | 26 (10.0%) |
| 18 to 24 Years | 17 (3.5%) | 16 (5.7%) |
| 25 to 34 Years | 14 (2.5%) | 23 (4.2%) |
| 35 to 44 Years | 5 (0.4%) | 42 (3.4%) |
| 45 to 54 Years | 41 (3.6%) | 18 (1.4%) |
| 55 to 64 Years | 43 (4.6%) | 27 (2.7%) |
| 65 to 74 Years | 89 (9.5%) | 124 (14.2%) |
| 75 Years and over | 33 (8.5%) | 96 (15.2%) |
| Total | 275 (3.4%) | 443 (5.7%) |
Income Above Poverty by Sex and Age in Bay Village
According to the poverty statistics in Bay Village, males aged under 5 years and females aged 5 years are the age groups that are most secure financially, with 100.0% of males and 100.0% of females in these age groups living above the poverty line.
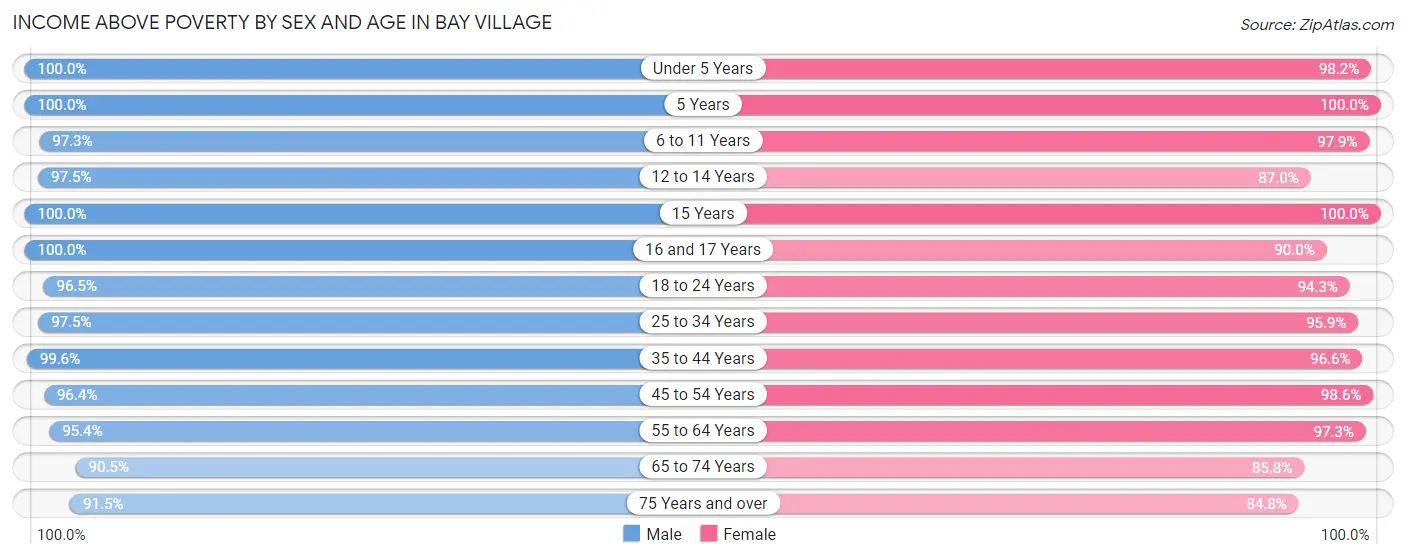
| Age Bracket | Male | Female |
| Under 5 Years | 688 (100.0%) | 447 (98.2%) |
| 5 Years | 108 (100.0%) | 50 (100.0%) |
| 6 to 11 Years | 781 (97.3%) | 565 (97.9%) |
| 12 to 14 Years | 425 (97.5%) | 342 (87.0%) |
| 15 Years | 123 (100.0%) | 176 (100.0%) |
| 16 and 17 Years | 303 (100.0%) | 233 (90.0%) |
| 18 to 24 Years | 465 (96.5%) | 263 (94.3%) |
| 25 to 34 Years | 540 (97.5%) | 531 (95.9%) |
| 35 to 44 Years | 1,152 (99.6%) | 1,197 (96.6%) |
| 45 to 54 Years | 1,098 (96.4%) | 1,291 (98.6%) |
| 55 to 64 Years | 895 (95.4%) | 960 (97.3%) |
| 65 to 74 Years | 851 (90.5%) | 749 (85.8%) |
| 75 Years and over | 357 (91.5%) | 535 (84.8%) |
| Total | 7,786 (96.6%) | 7,339 (94.3%) |
Income Below Poverty Among Married-Couple Families in Bay Village
The poverty statistics for married-couple families in Bay Village show that 2.3% or 87 of the total 3,837 families live below the poverty line. Families with 3 or 4 children have the highest poverty rate of 7.6%, comprising of 19 families. On the other hand, families with 5 or more children have the lowest poverty rate of 0.0%, which includes 0 families.
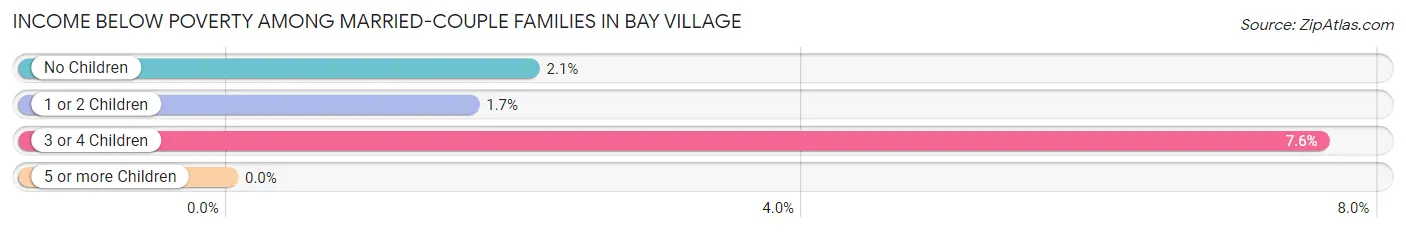
| Children | Above Poverty | Below Poverty |
| No Children | 1,864 (97.9%) | 40 (2.1%) |
| 1 or 2 Children | 1,638 (98.3%) | 28 (1.7%) |
| 3 or 4 Children | 231 (92.4%) | 19 (7.6%) |
| 5 or more Children | 17 (100.0%) | 0 (0.0%) |
| Total | 3,750 (97.7%) | 87 (2.3%) |
Income Below Poverty Among Single-Parent Households in Bay Village
According to the poverty data in Bay Village, 7.7% or 10 single-father households and 2.6% or 10 single-mother households are living below the poverty line. Among single-father households, those with 1 or 2 children have the highest poverty rate, with 10 households (13.7%) experiencing poverty. Likewise, among single-mother households, those with 1 or 2 children have the highest poverty rate, with 10 households (4.7%) falling below the poverty line.
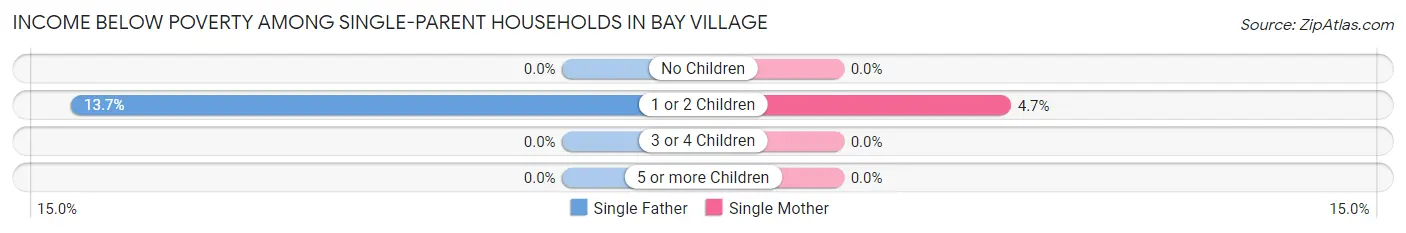
| Children | Single Father | Single Mother |
| No Children | 0 (0.0%) | 0 (0.0%) |
| 1 or 2 Children | 10 (13.7%) | 10 (4.7%) |
| 3 or 4 Children | 0 (0.0%) | 0 (0.0%) |
| 5 or more Children | 0 (0.0%) | 0 (0.0%) |
| Total | 10 (7.7%) | 10 (2.6%) |
Income Below Poverty Among Married-Couple vs Single-Parent Households in Bay Village
The poverty data for Bay Village shows that 87 of the married-couple family households (2.3%) and 20 of the single-parent households (3.9%) are living below the poverty level. Within the married-couple family households, those with 3 or 4 children have the highest poverty rate, with 19 households (7.6%) falling below the poverty line. Among the single-parent households, those with 1 or 2 children have the highest poverty rate, with 20 household (7.0%) living below poverty.
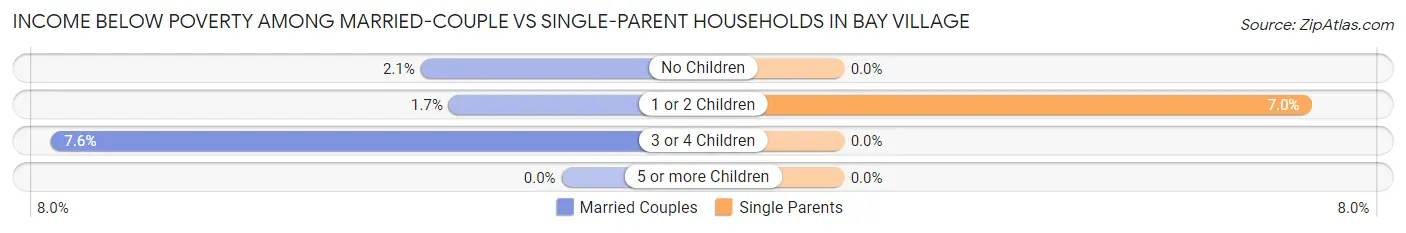
| Children | Married-Couple Families | Single-Parent Households |
| No Children | 40 (2.1%) | 0 (0.0%) |
| 1 or 2 Children | 28 (1.7%) | 20 (7.0%) |
| 3 or 4 Children | 19 (7.6%) | 0 (0.0%) |
| 5 or more Children | 0 (0.0%) | 0 (0.0%) |
| Total | 87 (2.3%) | 20 (3.9%) |
Race in Bay Village
The most populous races in Bay Village are White / Caucasian (15,124 | 94.3%), Two or more Races (537 | 3.4%), and Hispanic or Latino (449 | 2.8%).
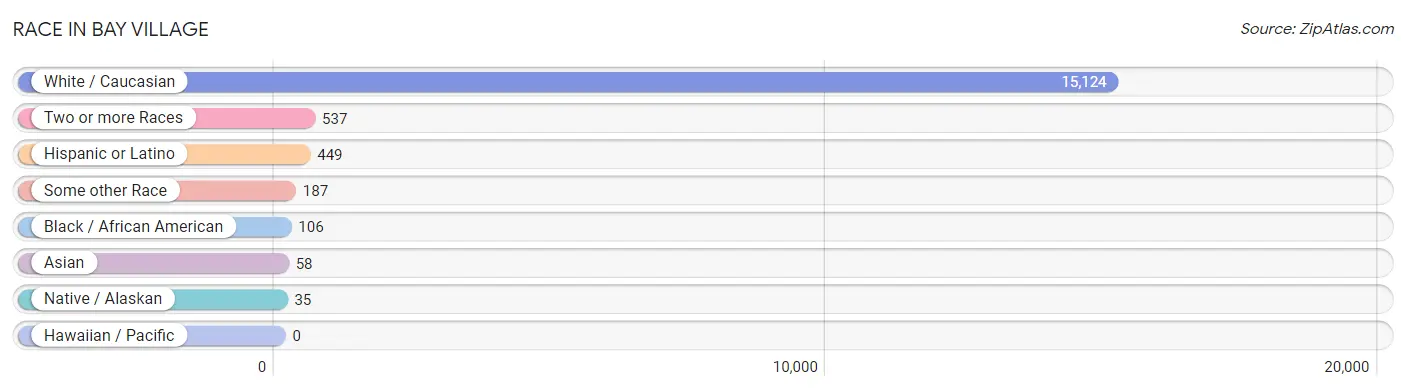
| Race | # Population | % Population |
| Asian | 58 | 0.4% |
| Black / African American | 106 | 0.7% |
| Hawaiian / Pacific | 0 | 0.0% |
| Hispanic or Latino | 449 | 2.8% |
| Native / Alaskan | 35 | 0.2% |
| White / Caucasian | 15,124 | 94.3% |
| Two or more Races | 537 | 3.4% |
| Some other Race | 187 | 1.2% |
| Total | 16,047 | 100.0% |
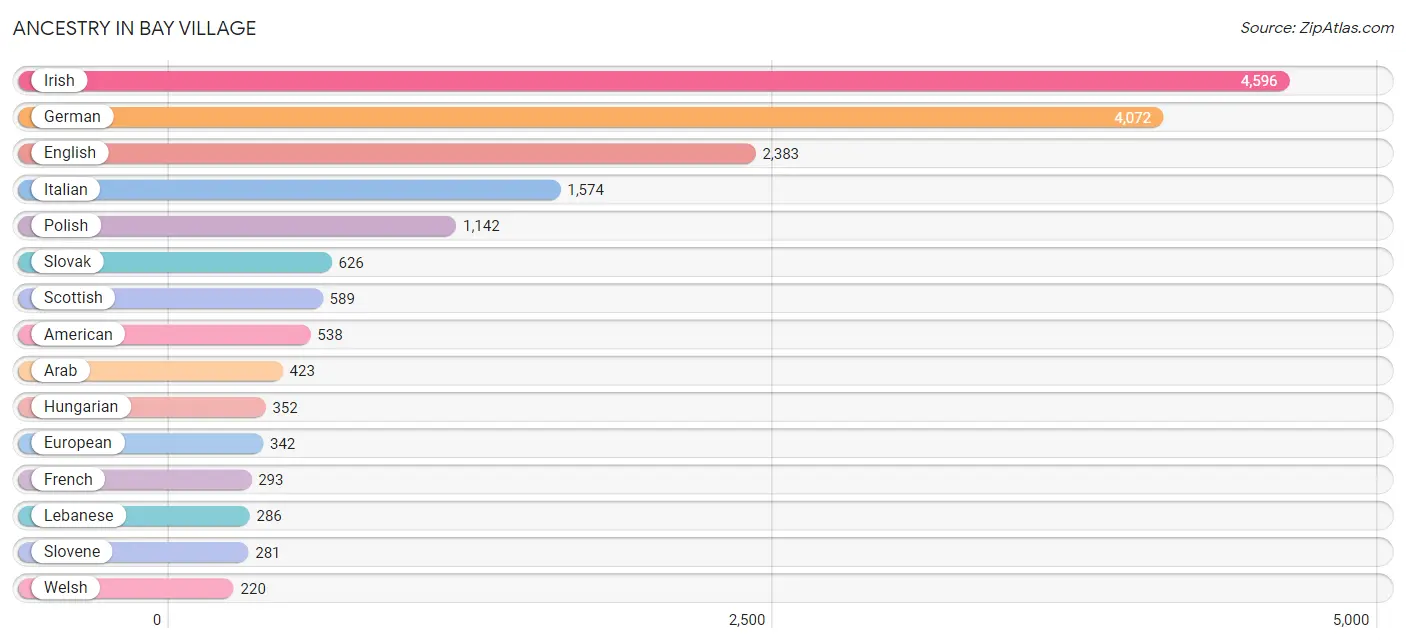
Ancestry in Bay Village
The most populous ancestries reported in Bay Village are Irish (4,596 | 28.6%), German (4,072 | 25.4%), English (2,383 | 14.8%), Italian (1,574 | 9.8%), and Polish (1,142 | 7.1%), together accounting for 85.8% of all Bay Village residents.
| Ancestry | # Population | % Population |
| Albanian | 60 | 0.4% |
| American | 538 | 3.4% |
| Arab | 423 | 2.6% |
| Austrian | 119 | 0.7% |
| British | 61 | 0.4% |
| Burmese | 87 | 0.5% |
| Canadian | 27 | 0.2% |
| Central American | 61 | 0.4% |
| Central American Indian | 61 | 0.4% |
| Cherokee | 6 | 0.0% |
| Choctaw | 16 | 0.1% |
| Croatian | 61 | 0.4% |
| Cuban | 33 | 0.2% |
| Czech | 184 | 1.1% |
| Czechoslovakian | 50 | 0.3% |
| Danish | 71 | 0.4% |
| Dutch | 159 | 1.0% |
| Eastern European | 167 | 1.0% |
| Ecuadorian | 23 | 0.1% |
| Egyptian | 20 | 0.1% |
| English | 2,383 | 14.8% |
| European | 342 | 2.1% |
| Finnish | 60 | 0.4% |
| French | 293 | 1.8% |
| French Canadian | 44 | 0.3% |
| German | 4,072 | 25.4% |
| Greek | 189 | 1.2% |
| Guatemalan | 61 | 0.4% |
| Hungarian | 352 | 2.2% |
| Indian (Asian) | 44 | 0.3% |
| Irish | 4,596 | 28.6% |
| Italian | 1,574 | 9.8% |
| Jordanian | 67 | 0.4% |
| Korean | 51 | 0.3% |
| Latvian | 94 | 0.6% |
| Lebanese | 286 | 1.8% |
| Lithuanian | 90 | 0.6% |
| Macedonian | 9 | 0.1% |
| Mexican | 104 | 0.6% |
| Mexican American Indian | 37 | 0.2% |
| Moroccan | 9 | 0.1% |
| Native Hawaiian | 9 | 0.1% |
| Northern European | 40 | 0.3% |
| Norwegian | 99 | 0.6% |
| Palestinian | 67 | 0.4% |
| Peruvian | 17 | 0.1% |
| Polish | 1,142 | 7.1% |
| Portuguese | 10 | 0.1% |
| Puerto Rican | 211 | 1.3% |
| Romanian | 71 | 0.4% |
| Russian | 81 | 0.5% |
| Scandinavian | 20 | 0.1% |
| Scotch-Irish | 177 | 1.1% |
| Scottish | 589 | 3.7% |
| Serbian | 45 | 0.3% |
| Sioux | 14 | 0.1% |
| Slovak | 626 | 3.9% |
| Slovene | 281 | 1.8% |
| South American | 40 | 0.3% |
| Soviet Union | 7 | 0.0% |
| Swedish | 167 | 1.0% |
| Swiss | 94 | 0.6% |
| Thai | 22 | 0.1% |
| Ukrainian | 48 | 0.3% |
| Welsh | 220 | 1.4% |
| Yugoslavian | 14 | 0.1% | View All 66 Rows |
Immigrants in Bay Village
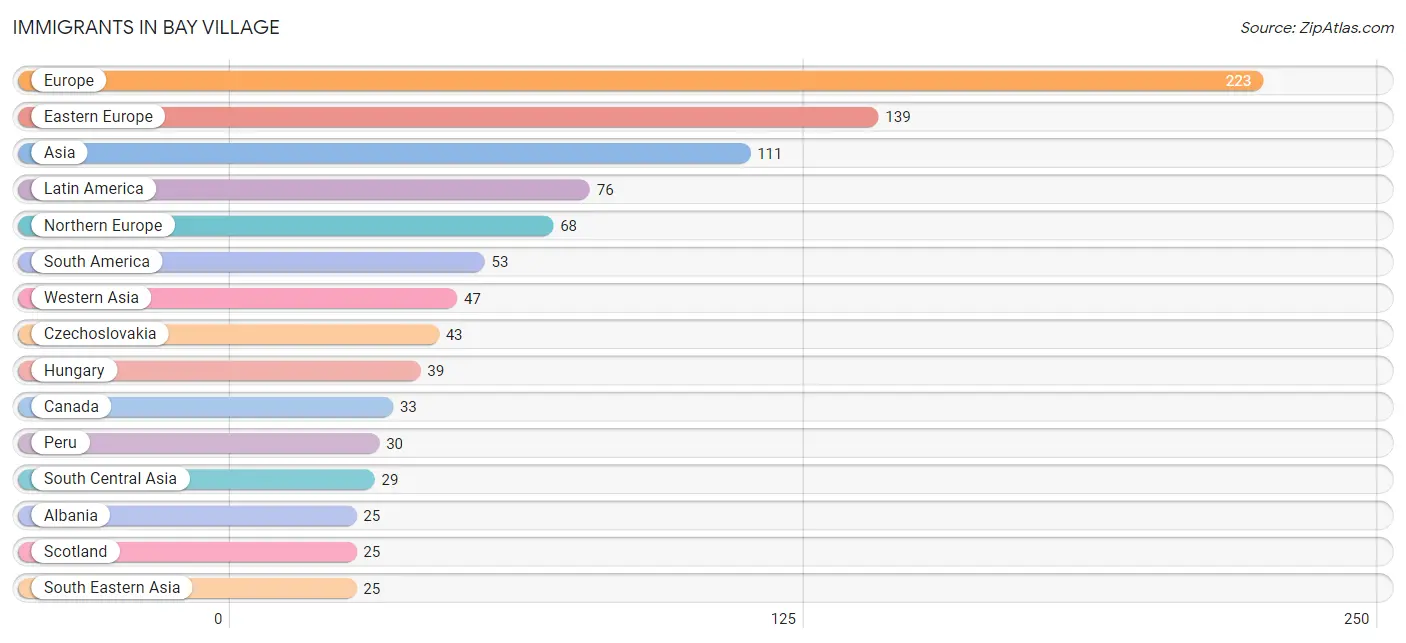
The most numerous immigrant groups reported in Bay Village came from Europe (223 | 1.4%), Eastern Europe (139 | 0.9%), Asia (111 | 0.7%), Latin America (76 | 0.5%), and Northern Europe (68 | 0.4%), together accounting for 3.8% of all Bay Village residents.
| Immigration Origin | # Population | % Population |
| Africa | 19 | 0.1% |
| Albania | 25 | 0.2% |
| Asia | 111 | 0.7% |
| Canada | 33 | 0.2% |
| Central America | 23 | 0.1% |
| China | 4 | 0.0% |
| Czechoslovakia | 43 | 0.3% |
| Eastern Asia | 10 | 0.1% |
| Eastern Europe | 139 | 0.9% |
| Ecuador | 8 | 0.1% |
| Egypt | 10 | 0.1% |
| England | 14 | 0.1% |
| Europe | 223 | 1.4% |
| Greece | 6 | 0.0% |
| Guatemala | 23 | 0.1% |
| Guyana | 15 | 0.1% |
| Hungary | 39 | 0.2% |
| India | 8 | 0.1% |
| Ireland | 22 | 0.1% |
| Israel | 21 | 0.1% |
| Italy | 10 | 0.1% |
| Jordan | 11 | 0.1% |
| Korea | 6 | 0.0% |
| Latin America | 76 | 0.5% |
| Lebanon | 15 | 0.1% |
| Lithuania | 9 | 0.1% |
| Morocco | 9 | 0.1% |
| Northern Africa | 19 | 0.1% |
| Northern Europe | 68 | 0.4% |
| Peru | 30 | 0.2% |
| Philippines | 11 | 0.1% |
| Poland | 11 | 0.1% |
| Scotland | 25 | 0.2% |
| Serbia | 12 | 0.1% |
| South America | 53 | 0.3% |
| South Central Asia | 29 | 0.2% |
| South Eastern Asia | 25 | 0.2% |
| Southern Europe | 16 | 0.1% |
| Uzbekistan | 21 | 0.1% |
| Vietnam | 14 | 0.1% |
| Western Asia | 47 | 0.3% | View All 41 Rows |
Sex and Age in Bay Village
Sex and Age in Bay Village
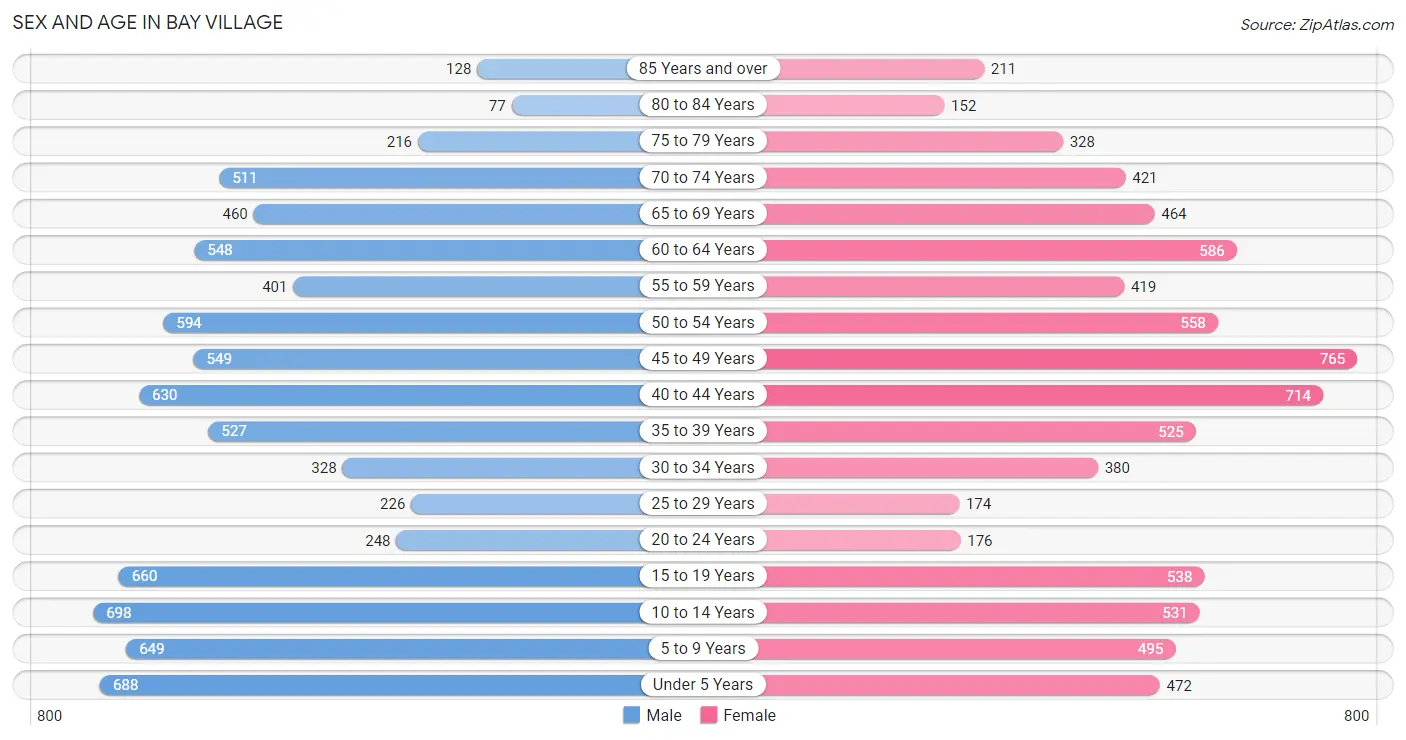
The most populous age groups in Bay Village are 10 to 14 Years (698 | 8.6%) for men and 45 to 49 Years (765 | 9.7%) for women.
| Age Bracket | Male | Female |
| Under 5 Years | 688 (8.5%) | 472 (6.0%) |
| 5 to 9 Years | 649 (8.0%) | 495 (6.3%) |
| 10 to 14 Years | 698 (8.6%) | 531 (6.7%) |
| 15 to 19 Years | 660 (8.1%) | 538 (6.8%) |
| 20 to 24 Years | 248 (3.0%) | 176 (2.2%) |
| 25 to 29 Years | 226 (2.8%) | 174 (2.2%) |
| 30 to 34 Years | 328 (4.0%) | 380 (4.8%) |
| 35 to 39 Years | 527 (6.5%) | 525 (6.6%) |
| 40 to 44 Years | 630 (7.7%) | 714 (9.0%) |
| 45 to 49 Years | 549 (6.8%) | 765 (9.7%) |
| 50 to 54 Years | 594 (7.3%) | 558 (7.1%) |
| 55 to 59 Years | 401 (4.9%) | 419 (5.3%) |
| 60 to 64 Years | 548 (6.7%) | 586 (7.4%) |
| 65 to 69 Years | 460 (5.7%) | 464 (5.9%) |
| 70 to 74 Years | 511 (6.3%) | 421 (5.3%) |
| 75 to 79 Years | 216 (2.6%) | 328 (4.2%) |
| 80 to 84 Years | 77 (0.9%) | 152 (1.9%) |
| 85 Years and over | 128 (1.6%) | 211 (2.7%) |
| Total | 8,138 (100.0%) | 7,909 (100.0%) |
Families and Households in Bay Village
Median Family Size in Bay Village
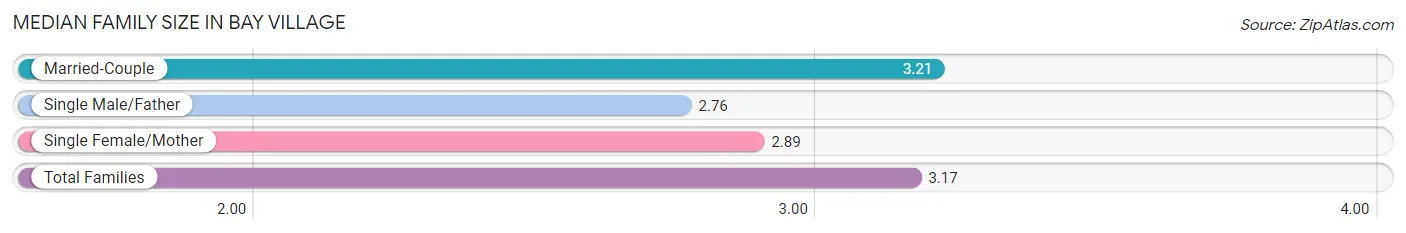
The median family size in Bay Village is 3.17 persons per family, with married-couple families (3,837 | 88.3%) accounting for the largest median family size of 3.21 persons per family. On the other hand, single male/father families (129 | 3.0%) represent the smallest median family size with 2.76 persons per family.
| Family Type | # Families | Family Size |
| Married-Couple | 3,837 (88.3%) | 3.21 |
| Single Male/Father | 129 (3.0%) | 2.76 |
| Single Female/Mother | 380 (8.7%) | 2.89 |
| Total Families | 4,346 (100.0%) | 3.17 |
Median Household Size in Bay Village
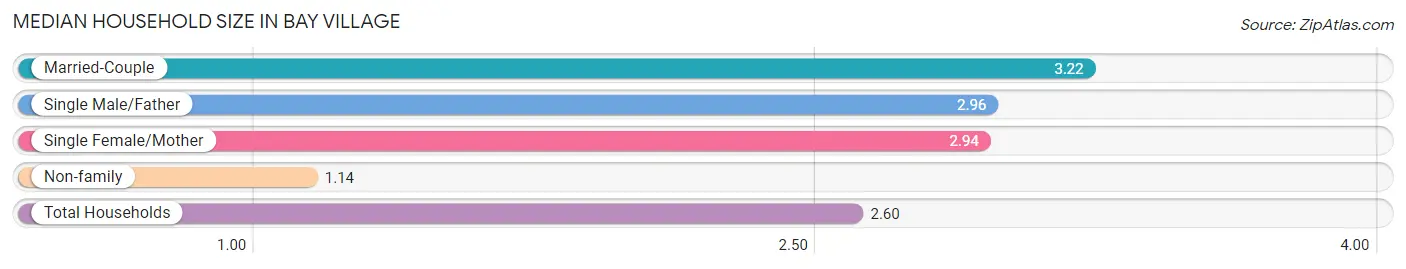
The median household size in Bay Village is 2.60 persons per household, with married-couple households (3,837 | 63.0%) accounting for the largest median household size of 3.22 persons per household. non-family households (1,740 | 28.6%) represent the smallest median household size with 1.14 persons per household.
| Household Type | # Households | Household Size |
| Married-Couple | 3,837 (63.0%) | 3.22 |
| Single Male/Father | 129 (2.1%) | 2.96 |
| Single Female/Mother | 380 (6.2%) | 2.94 |
| Non-family | 1,740 (28.6%) | 1.14 |
| Total Households | 6,086 (100.0%) | 2.60 |
Household Size by Marriage Status in Bay Village
Out of a total of 6,086 households in Bay Village, 4,346 (71.4%) are family households, while 1,740 (28.6%) are nonfamily households. The most numerous type of family households are 2-person households, comprising 1,748, and the most common type of nonfamily households are 1-person households, comprising 1,501.
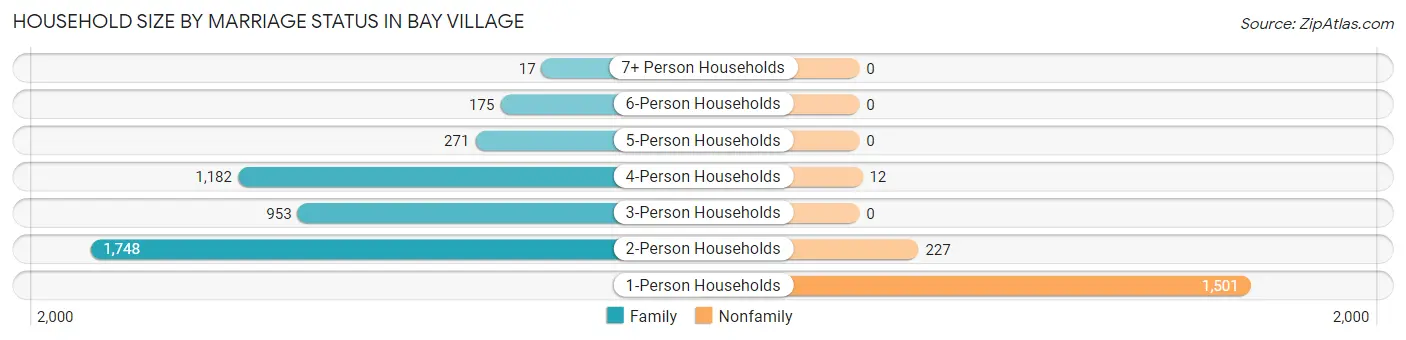
| Household Size | Family Households | Nonfamily Households |
| 1-Person Households | - | 1,501 (24.7%) |
| 2-Person Households | 1,748 (28.7%) | 227 (3.7%) |
| 3-Person Households | 953 (15.7%) | 0 (0.0%) |
| 4-Person Households | 1,182 (19.4%) | 12 (0.2%) |
| 5-Person Households | 271 (4.4%) | 0 (0.0%) |
| 6-Person Households | 175 (2.9%) | 0 (0.0%) |
| 7+ Person Households | 17 (0.3%) | 0 (0.0%) |
| Total | 4,346 (71.4%) | 1,740 (28.6%) |
Female Fertility in Bay Village
Fertility by Age in Bay Village
Average fertility rate in Bay Village is 53.0 births per 1,000 women. Women in the age bracket of 20 to 34 years have the highest fertility rate with 148.0 births per 1,000 women. Women in the age bracket of 20 to 34 years acount for 59.7% of all women with births.
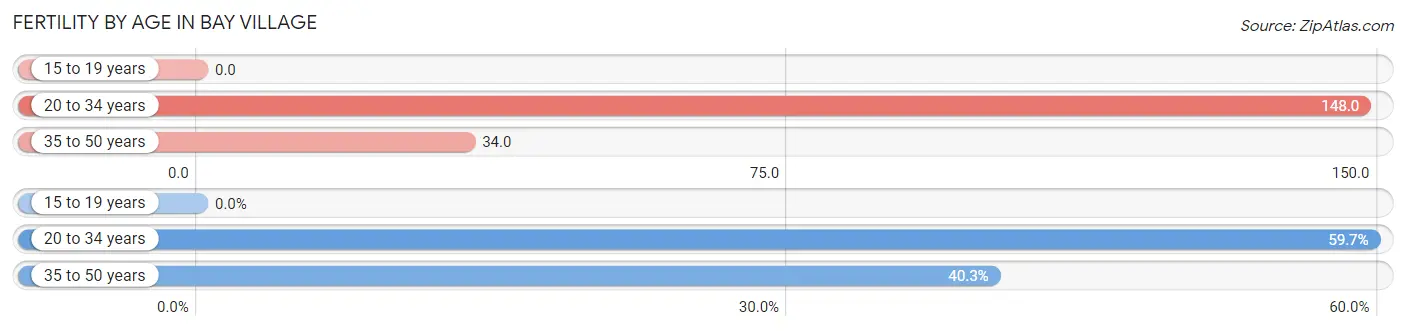
| Age Bracket | Women with Births | Births / 1,000 Women |
| 15 to 19 years | 0 (0.0%) | 0.0 |
| 20 to 34 years | 108 (59.7%) | 148.0 |
| 35 to 50 years | 73 (40.3%) | 34.0 |
| Total | 181 (100.0%) | 53.0 |
Fertility by Age by Marriage Status in Bay Village
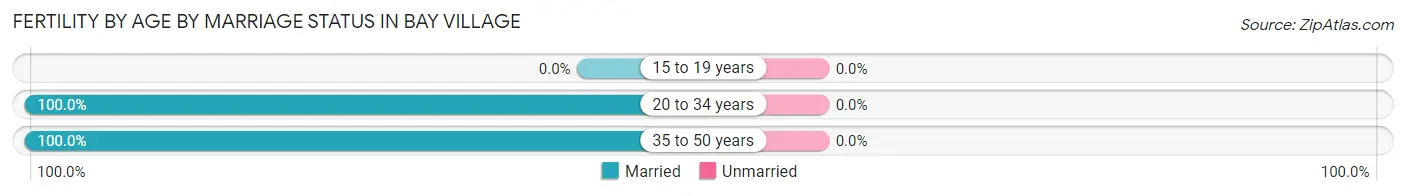
| Age Bracket | Married | Unmarried |
| 15 to 19 years | 0 (0.0%) | 0 (0.0%) |
| 20 to 34 years | 108 (100.0%) | 0 (0.0%) |
| 35 to 50 years | 73 (100.0%) | 0 (0.0%) |
| Total | 181 (100.0%) | 0 (0.0%) |
Fertility by Education in Bay Village
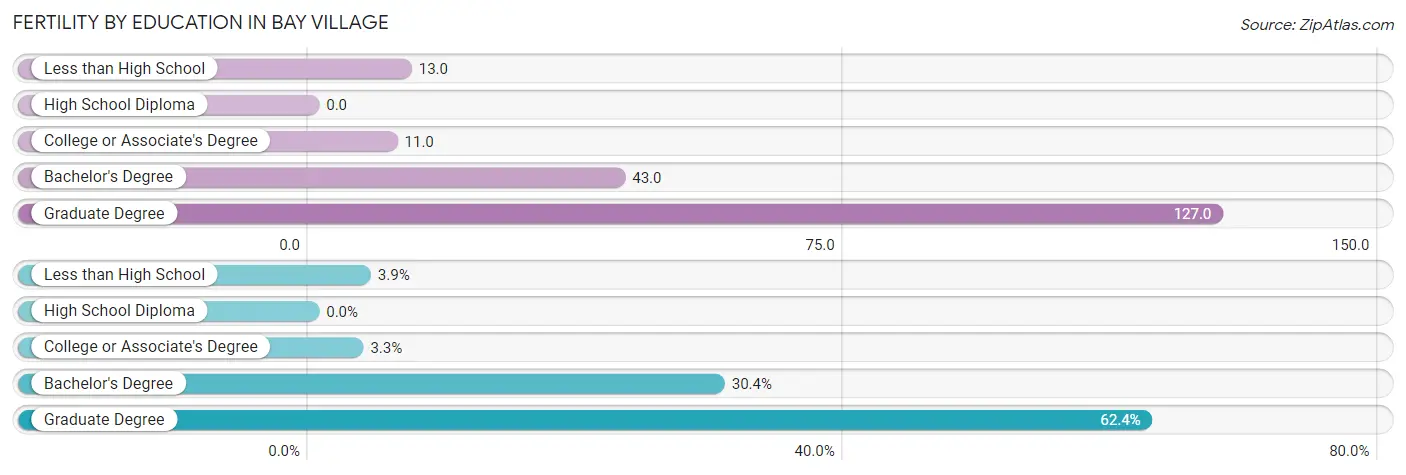
| Educational Attainment | Women with Births | Births / 1,000 Women |
| Less than High School | 7 (3.9%) | 13.0 |
| High School Diploma | 0 (0.0%) | 0.0 |
| College or Associate's Degree | 6 (3.3%) | 11.0 |
| Bachelor's Degree | 55 (30.4%) | 43.0 |
| Graduate Degree | 113 (62.4%) | 127.0 |
| Total | 181 (100.0%) | 53.0 |
Fertility by Education by Marriage Status in Bay Village
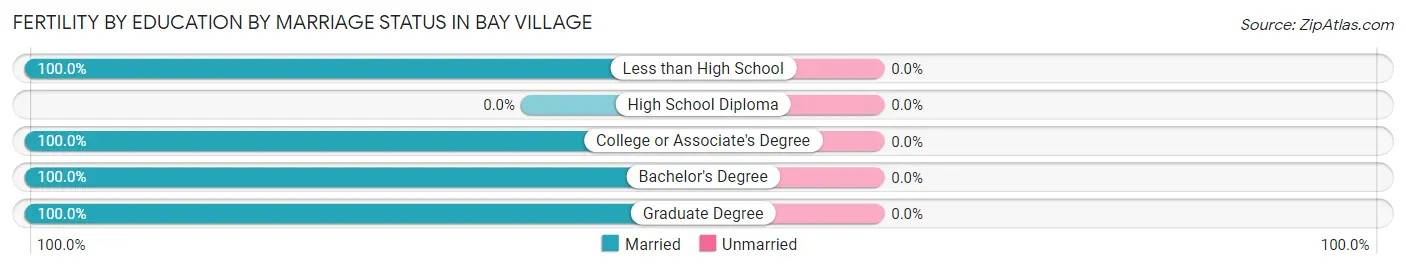
| Educational Attainment | Married | Unmarried |
| Less than High School | 7 (100.0%) | 0 (0.0%) |
| High School Diploma | 0 (0.0%) | 0 (0.0%) |
| College or Associate's Degree | 6 (100.0%) | 0 (0.0%) |
| Bachelor's Degree | 55 (100.0%) | 0 (0.0%) |
| Graduate Degree | 113 (100.0%) | 0 (0.0%) |
| Total | 181 (100.0%) | 0 (0.0%) |
Employment Characteristics in Bay Village
Employment by Class of Employer in Bay Village
Among the 7,949 employed individuals in Bay Village, private company employees (5,228 | 65.8%), not-for-profit organizations (904 | 11.4%), and local government employees (828 | 10.4%) make up the most common classes of employment.
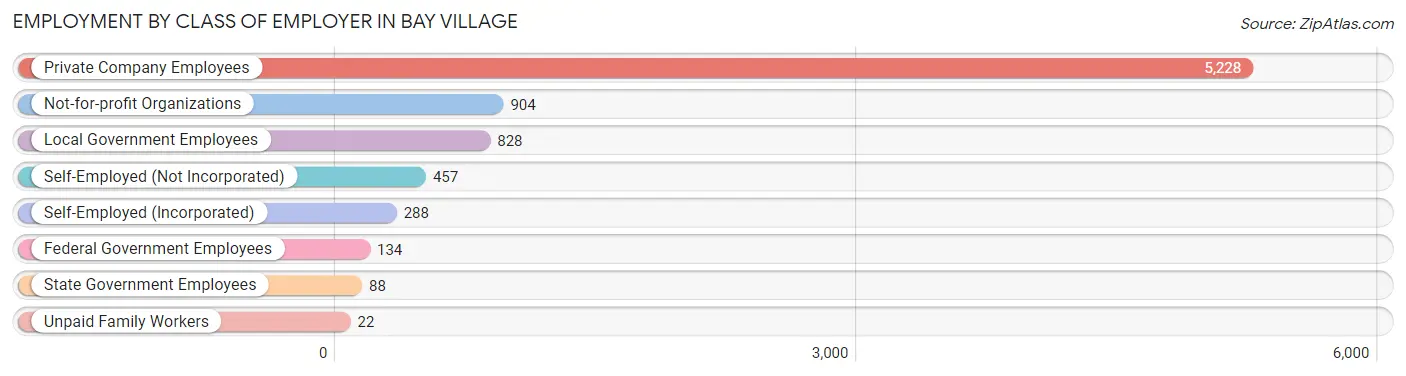
| Employer Class | # Employees | % Employees |
| Private Company Employees | 5,228 | 65.8% |
| Self-Employed (Incorporated) | 288 | 3.6% |
| Self-Employed (Not Incorporated) | 457 | 5.8% |
| Not-for-profit Organizations | 904 | 11.4% |
| Local Government Employees | 828 | 10.4% |
| State Government Employees | 88 | 1.1% |
| Federal Government Employees | 134 | 1.7% |
| Unpaid Family Workers | 22 | 0.3% |
| Total | 7,949 | 100.0% |
Employment Status by Age in Bay Village
According to the labor force statistics for Bay Village, out of the total population over 16 years of age (12,215), 67.3% or 8,221 individuals are in the labor force, with 2.2% or 181 of them unemployed. The age group with the highest labor force participation rate is 30 to 34 years, with 94.9% or 672 individuals in the labor force. Within the labor force, the 16 to 19 years age range has the highest percentage of unemployed individuals, with 10.0% or 40 of them being unemployed.
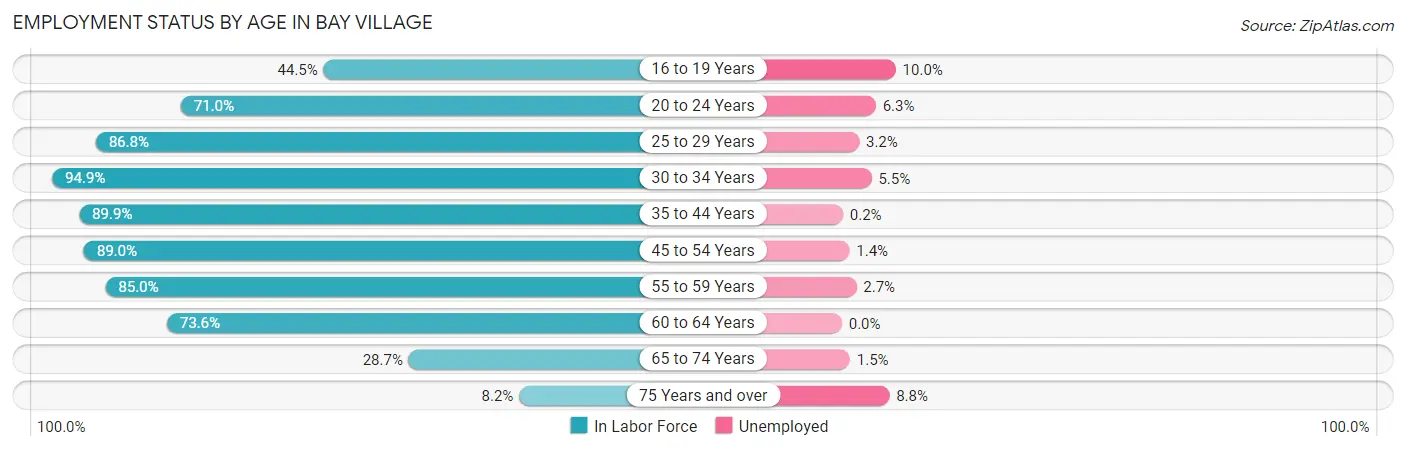
| Age Bracket | In Labor Force | Unemployed |
| 16 to 19 Years | 400 (44.5%) | 40 (10.0%) |
| 20 to 24 Years | 301 (71.0%) | 19 (6.3%) |
| 25 to 29 Years | 347 (86.8%) | 11 (3.2%) |
| 30 to 34 Years | 672 (94.9%) | 37 (5.5%) |
| 35 to 44 Years | 2,154 (89.9%) | 4 (0.2%) |
| 45 to 54 Years | 2,195 (89.0%) | 31 (1.4%) |
| 55 to 59 Years | 697 (85.0%) | 19 (2.7%) |
| 60 to 64 Years | 835 (73.6%) | 0 (0.0%) |
| 65 to 74 Years | 533 (28.7%) | 8 (1.5%) |
| 75 Years and over | 91 (8.2%) | 8 (8.8%) |
| Total | 8,221 (67.3%) | 181 (2.2%) |
Employment Status by Educational Attainment in Bay Village
According to labor force statistics for Bay Village, 87.1% of individuals (6,902) out of the total population between 25 and 64 years of age (7,924) are in the labor force, with 1.5% or 104 of them being unemployed. The group with the highest labor force participation rate are those with the educational attainment of high school diploma, with 89.8% or 650 individuals in the labor force. Within the labor force, individuals with college / associate degree education have the highest percentage of unemployment, with 2.7% or 34 of them being unemployed.
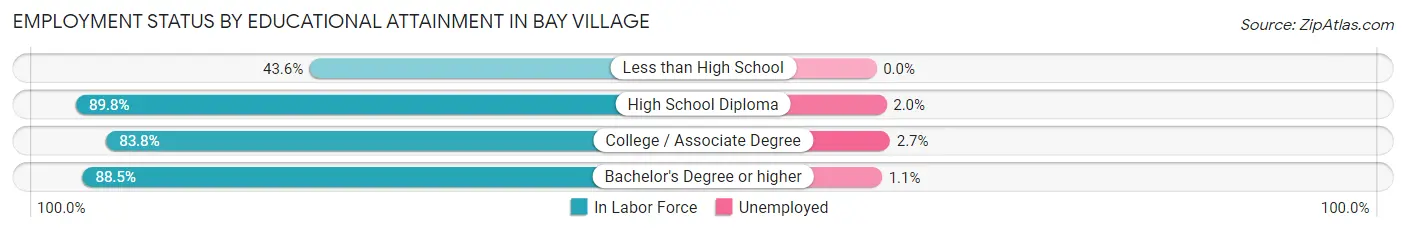
| Educational Attainment | In Labor Force | Unemployed |
| Less than High School | 48 (43.6%) | 0 (0.0%) |
| High School Diploma | 650 (89.8%) | 14 (2.0%) |
| College / Associate Degree | 1,244 (83.8%) | 40 (2.7%) |
| Bachelor's Degree or higher | 4,960 (88.5%) | 62 (1.1%) |
| Total | 6,902 (87.1%) | 119 (1.5%) |
Employment Occupations by Sex in Bay Village
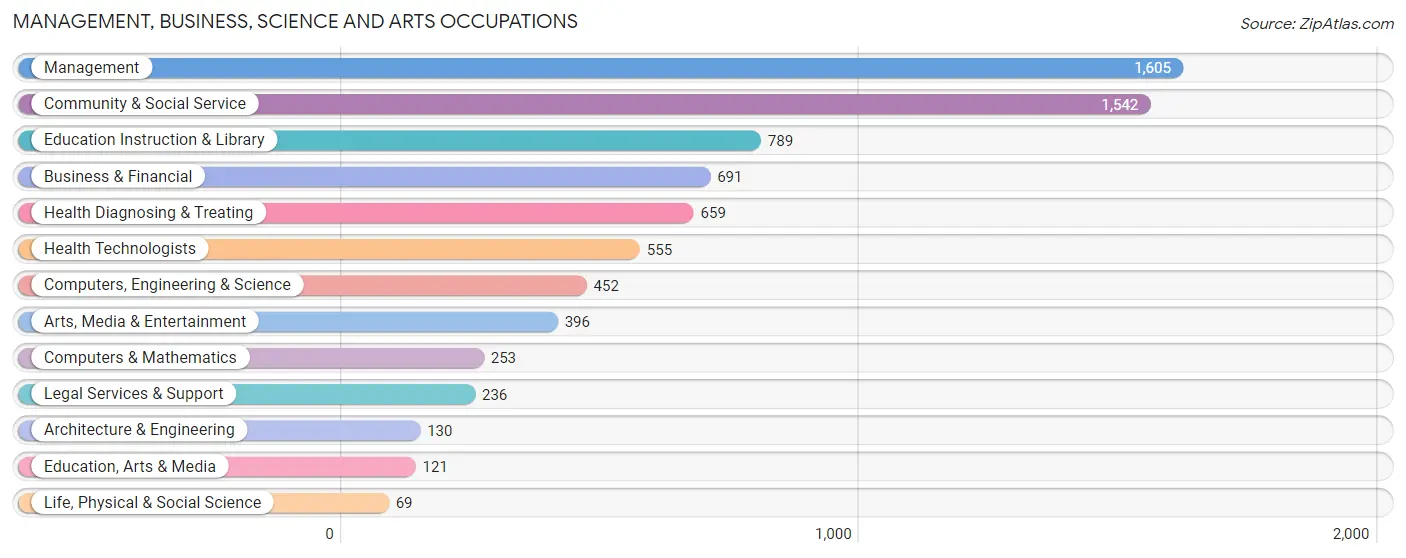
Management, Business, Science and Arts Occupations
The most common Management, Business, Science and Arts occupations in Bay Village are Management (1,605 | 20.0%), Community & Social Service (1,542 | 19.2%), Education Instruction & Library (789 | 9.8%), Business & Financial (691 | 8.6%), and Health Diagnosing & Treating (659 | 8.2%).
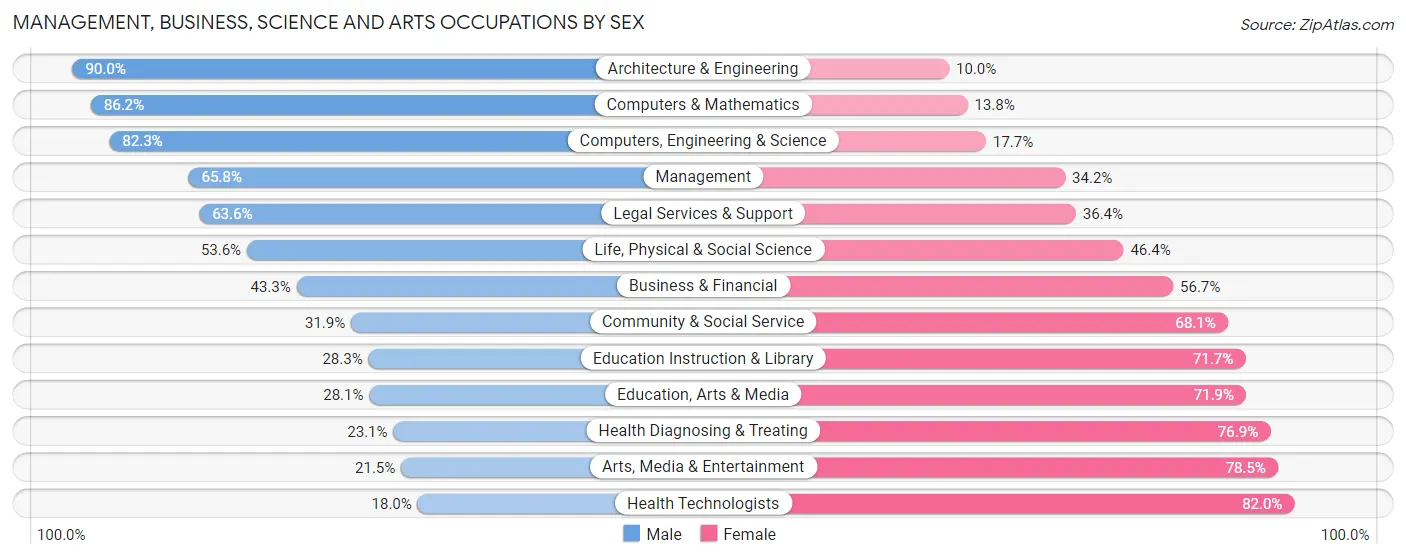
Management, Business, Science and Arts Occupations by Sex
Within the Management, Business, Science and Arts occupations in Bay Village, the most male-oriented occupations are Architecture & Engineering (90.0%), Computers & Mathematics (86.2%), and Computers, Engineering & Science (82.3%), while the most female-oriented occupations are Health Technologists (82.0%), Arts, Media & Entertainment (78.5%), and Health Diagnosing & Treating (76.9%).
| Occupation | Male | Female |
| Management | 1,056 (65.8%) | 549 (34.2%) |
| Business & Financial | 299 (43.3%) | 392 (56.7%) |
| Computers, Engineering & Science | 372 (82.3%) | 80 (17.7%) |
| Computers & Mathematics | 218 (86.2%) | 35 (13.8%) |
| Architecture & Engineering | 117 (90.0%) | 13 (10.0%) |
| Life, Physical & Social Science | 37 (53.6%) | 32 (46.4%) |
| Community & Social Service | 492 (31.9%) | 1,050 (68.1%) |
| Education, Arts & Media | 34 (28.1%) | 87 (71.9%) |
| Legal Services & Support | 150 (63.6%) | 86 (36.4%) |
| Education Instruction & Library | 223 (28.3%) | 566 (71.7%) |
| Arts, Media & Entertainment | 85 (21.5%) | 311 (78.5%) |
| Health Diagnosing & Treating | 152 (23.1%) | 507 (76.9%) |
| Health Technologists | 100 (18.0%) | 455 (82.0%) |
| Total (Category) | 2,371 (47.9%) | 2,578 (52.1%) |
| Total (Overall) | 4,243 (52.8%) | 3,798 (47.2%) |
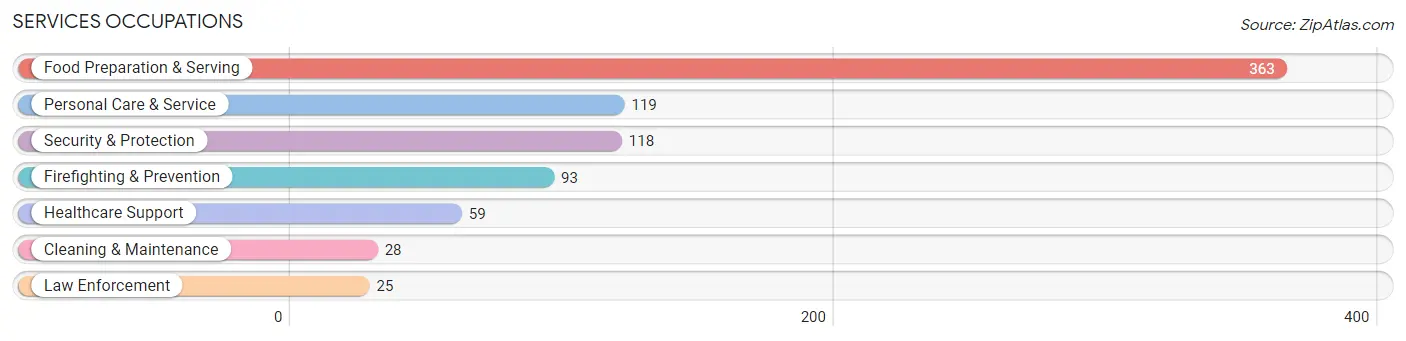
Services Occupations
The most common Services occupations in Bay Village are Food Preparation & Serving (363 | 4.5%), Personal Care & Service (119 | 1.5%), Security & Protection (118 | 1.5%), Firefighting & Prevention (93 | 1.2%), and Healthcare Support (59 | 0.7%).
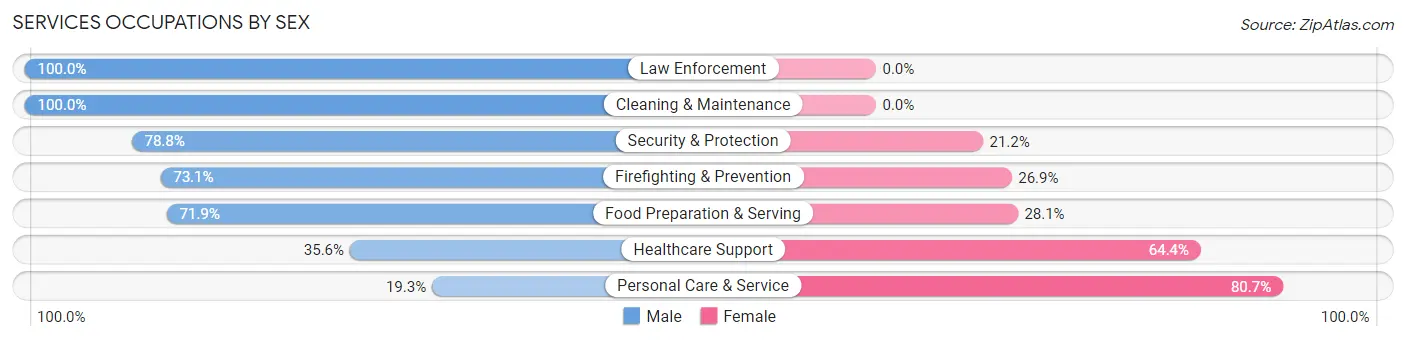
Services Occupations by Sex
Within the Services occupations in Bay Village, the most male-oriented occupations are Law Enforcement (100.0%), Cleaning & Maintenance (100.0%), and Security & Protection (78.8%), while the most female-oriented occupations are Personal Care & Service (80.7%), Healthcare Support (64.4%), and Food Preparation & Serving (28.1%).
| Occupation | Male | Female |
| Healthcare Support | 21 (35.6%) | 38 (64.4%) |
| Security & Protection | 93 (78.8%) | 25 (21.2%) |
| Firefighting & Prevention | 68 (73.1%) | 25 (26.9%) |
| Law Enforcement | 25 (100.0%) | 0 (0.0%) |
| Food Preparation & Serving | 261 (71.9%) | 102 (28.1%) |
| Cleaning & Maintenance | 28 (100.0%) | 0 (0.0%) |
| Personal Care & Service | 23 (19.3%) | 96 (80.7%) |
| Total (Category) | 426 (62.0%) | 261 (38.0%) |
| Total (Overall) | 4,243 (52.8%) | 3,798 (47.2%) |
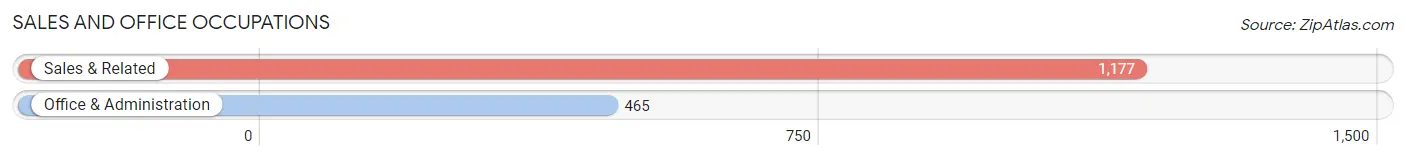
Sales and Office Occupations
The most common Sales and Office occupations in Bay Village are Sales & Related (1,177 | 14.6%), and Office & Administration (465 | 5.8%).
Sales and Office Occupations by Sex
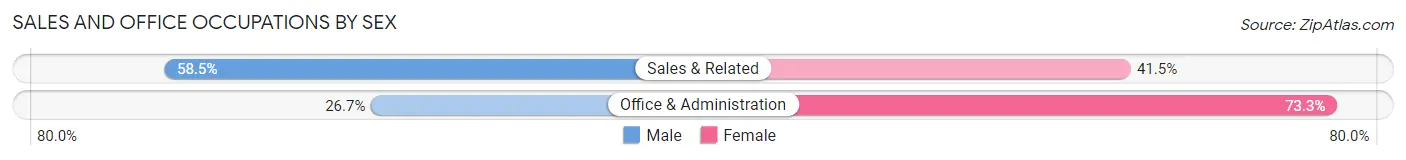
| Occupation | Male | Female |
| Sales & Related | 689 (58.5%) | 488 (41.5%) |
| Office & Administration | 124 (26.7%) | 341 (73.3%) |
| Total (Category) | 813 (49.5%) | 829 (50.5%) |
| Total (Overall) | 4,243 (52.8%) | 3,798 (47.2%) |
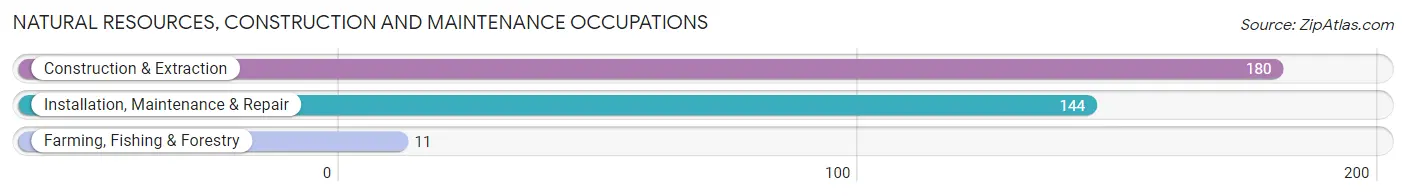
Natural Resources, Construction and Maintenance Occupations
The most common Natural Resources, Construction and Maintenance occupations in Bay Village are Construction & Extraction (180 | 2.2%), Installation, Maintenance & Repair (144 | 1.8%), and Farming, Fishing & Forestry (11 | 0.1%).
Natural Resources, Construction and Maintenance Occupations by Sex
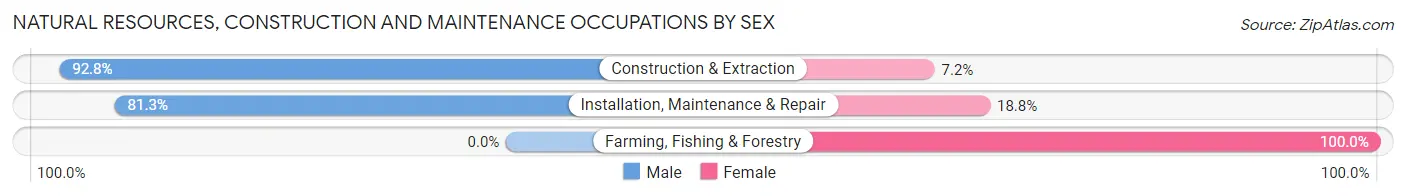
| Occupation | Male | Female |
| Farming, Fishing & Forestry | 0 (0.0%) | 11 (100.0%) |
| Construction & Extraction | 167 (92.8%) | 13 (7.2%) |
| Installation, Maintenance & Repair | 117 (81.2%) | 27 (18.8%) |
| Total (Category) | 284 (84.8%) | 51 (15.2%) |
| Total (Overall) | 4,243 (52.8%) | 3,798 (47.2%) |
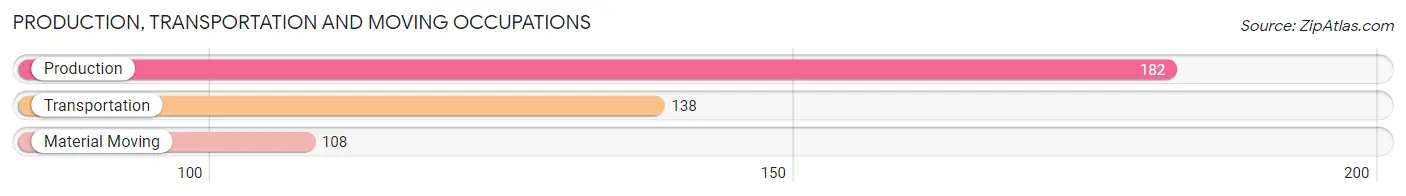
Production, Transportation and Moving Occupations
The most common Production, Transportation and Moving occupations in Bay Village are Production (182 | 2.3%), Transportation (138 | 1.7%), and Material Moving (108 | 1.3%).
Production, Transportation and Moving Occupations by Sex
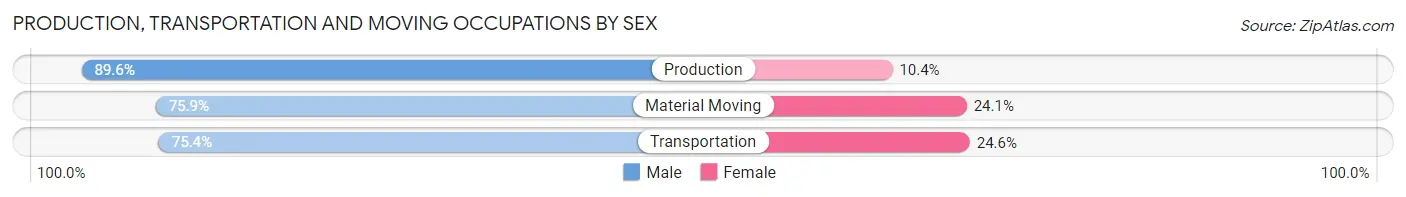
| Occupation | Male | Female |
| Production | 163 (89.6%) | 19 (10.4%) |
| Transportation | 104 (75.4%) | 34 (24.6%) |
| Material Moving | 82 (75.9%) | 26 (24.1%) |
| Total (Category) | 349 (81.5%) | 79 (18.5%) |
| Total (Overall) | 4,243 (52.8%) | 3,798 (47.2%) |
Employment Industries by Sex in Bay Village
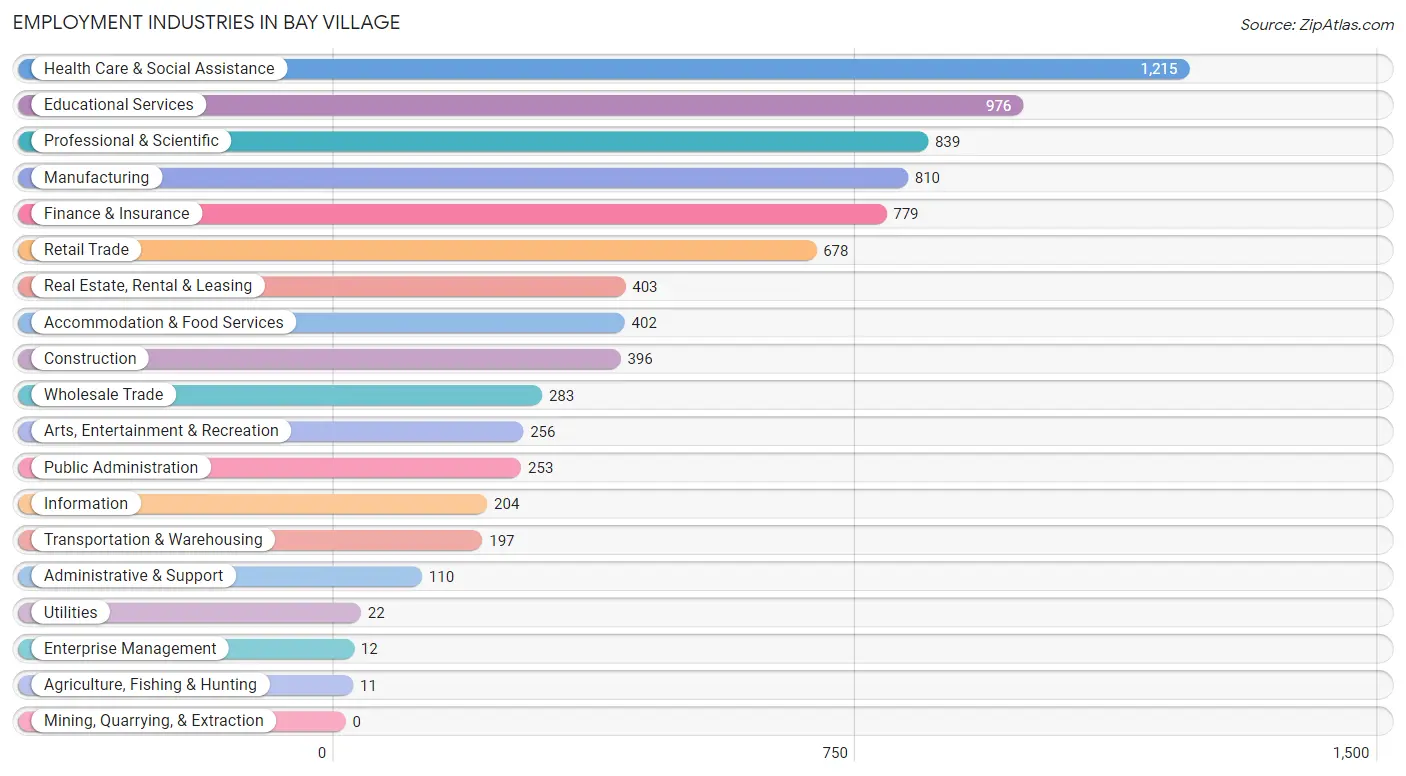
Employment Industries in Bay Village
The major employment industries in Bay Village include Health Care & Social Assistance (1,215 | 15.1%), Educational Services (976 | 12.1%), Professional & Scientific (839 | 10.4%), Manufacturing (810 | 10.1%), and Finance & Insurance (779 | 9.7%).
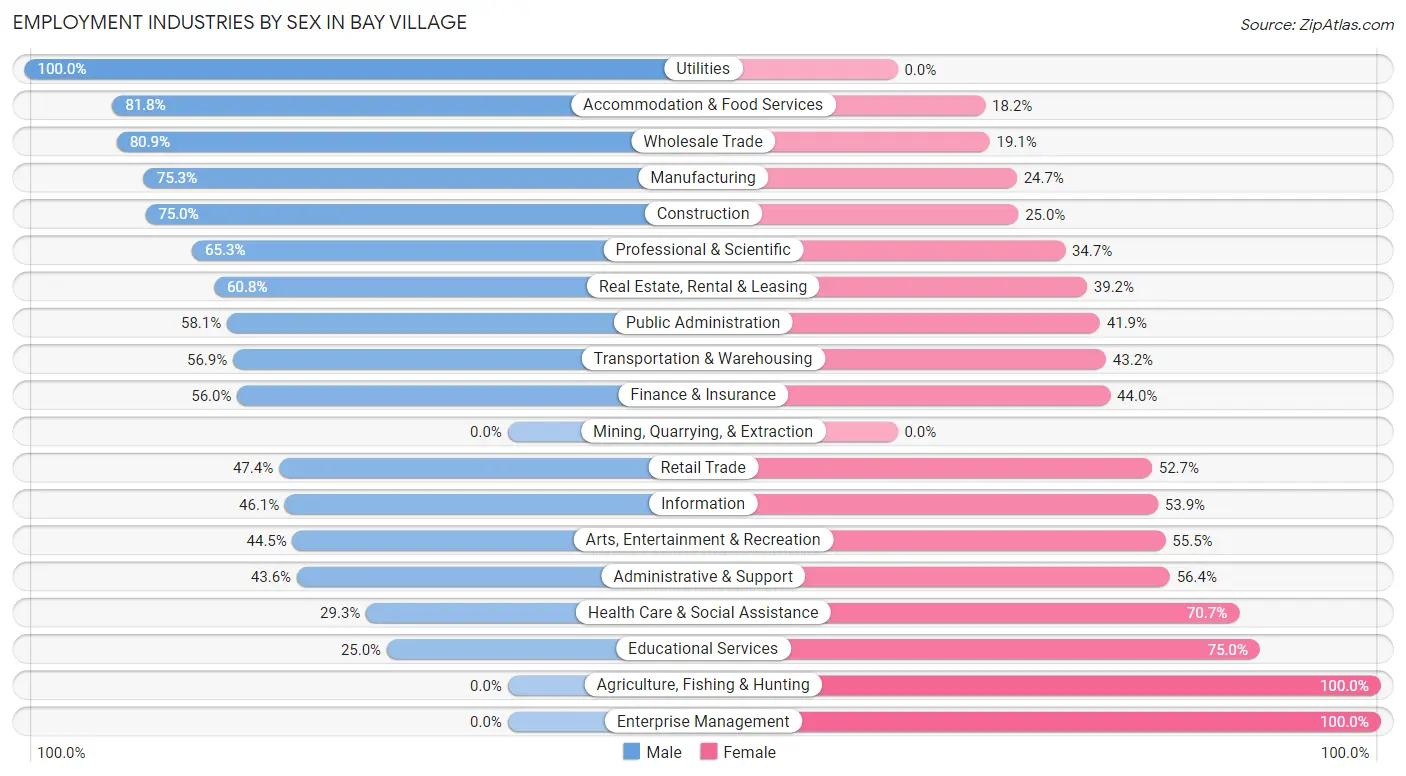
Employment Industries by Sex in Bay Village
The Bay Village industries that see more men than women are Utilities (100.0%), Accommodation & Food Services (81.8%), and Wholesale Trade (80.9%), whereas the industries that tend to have a higher number of women are Agriculture, Fishing & Hunting (100.0%), Enterprise Management (100.0%), and Educational Services (75.0%).
| Industry | Male | Female |
| Agriculture, Fishing & Hunting | 0 (0.0%) | 11 (100.0%) |
| Mining, Quarrying, & Extraction | 0 (0.0%) | 0 (0.0%) |
| Construction | 297 (75.0%) | 99 (25.0%) |
| Manufacturing | 610 (75.3%) | 200 (24.7%) |
| Wholesale Trade | 229 (80.9%) | 54 (19.1%) |
| Retail Trade | 321 (47.3%) | 357 (52.6%) |
| Transportation & Warehousing | 112 (56.9%) | 85 (43.1%) |
| Utilities | 22 (100.0%) | 0 (0.0%) |
| Information | 94 (46.1%) | 110 (53.9%) |
| Finance & Insurance | 436 (56.0%) | 343 (44.0%) |
| Real Estate, Rental & Leasing | 245 (60.8%) | 158 (39.2%) |
| Professional & Scientific | 548 (65.3%) | 291 (34.7%) |
| Enterprise Management | 0 (0.0%) | 12 (100.0%) |
| Administrative & Support | 48 (43.6%) | 62 (56.4%) |
| Educational Services | 244 (25.0%) | 732 (75.0%) |
| Health Care & Social Assistance | 356 (29.3%) | 859 (70.7%) |
| Arts, Entertainment & Recreation | 114 (44.5%) | 142 (55.5%) |
| Accommodation & Food Services | 329 (81.8%) | 73 (18.2%) |
| Public Administration | 147 (58.1%) | 106 (41.9%) |
| Total | 4,243 (52.8%) | 3,798 (47.2%) |
Education in Bay Village
School Enrollment in Bay Village
The most common levels of schooling among the 4,479 students in Bay Village are high school (1,081 | 24.1%), middle school (1,036 | 23.1%), and elementary school (945 | 21.1%).
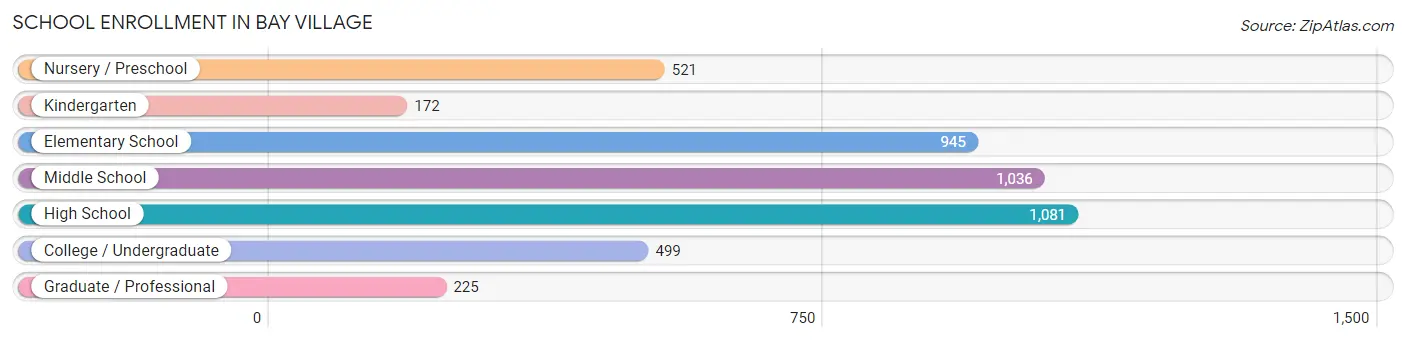
| School Level | # Students | % Students |
| Nursery / Preschool | 521 | 11.6% |
| Kindergarten | 172 | 3.8% |
| Elementary School | 945 | 21.1% |
| Middle School | 1,036 | 23.1% |
| High School | 1,081 | 24.1% |
| College / Undergraduate | 499 | 11.1% |
| Graduate / Professional | 225 | 5.0% |
| Total | 4,479 | 100.0% |
School Enrollment by Age by Funding Source in Bay Village
Out of a total of 4,479 students who are enrolled in schools in Bay Village, 1,200 (26.8%) attend a private institution, while the remaining 3,279 (73.2%) are enrolled in public schools. The age group of 3 to 4 year olds has the highest likelihood of being enrolled in private schools, with 302 (69.8% in the age bracket) enrolled. Conversely, the age group of 15 to 17 year olds has the lowest likelihood of being enrolled in a private school, with 725 (86.3% in the age bracket) attending a public institution.
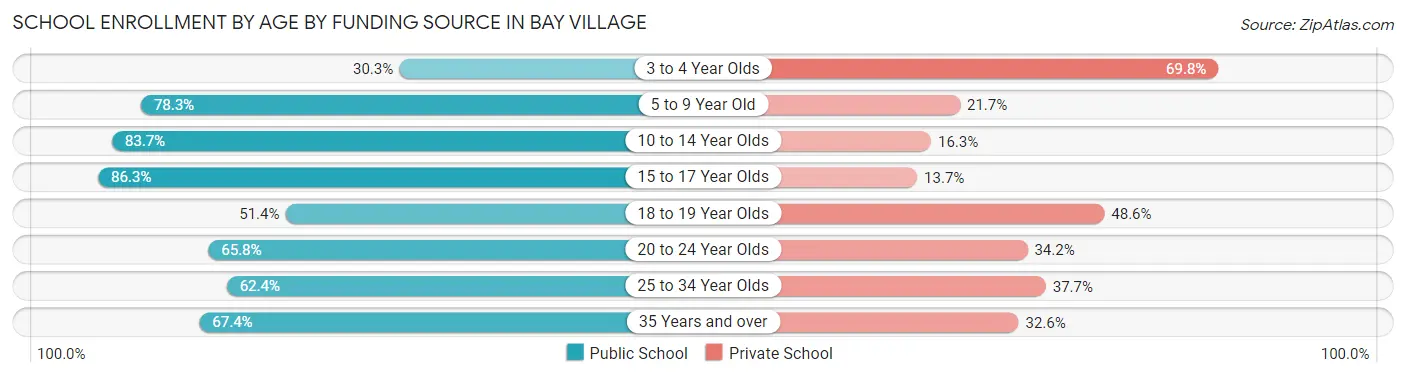
| Age Bracket | Public School | Private School |
| 3 to 4 Year Olds | 131 (30.2%) | 302 (69.8%) |
| 5 to 9 Year Old | 874 (78.3%) | 242 (21.7%) |
| 10 to 14 Year Olds | 1,019 (83.7%) | 198 (16.3%) |
| 15 to 17 Year Olds | 725 (86.3%) | 115 (13.7%) |
| 18 to 19 Year Olds | 161 (51.4%) | 152 (48.6%) |
| 20 to 24 Year Olds | 169 (65.8%) | 88 (34.2%) |
| 25 to 34 Year Olds | 53 (62.4%) | 32 (37.7%) |
| 35 Years and over | 147 (67.4%) | 71 (32.6%) |
| Total | 3,279 (73.2%) | 1,200 (26.8%) |
Educational Attainment by Field of Study in Bay Village
Business (1,685 | 21.5%), education (1,015 | 13.0%), communications (910 | 11.6%), science & technology (736 | 9.4%), and engineering (490 | 6.2%) are the most common fields of study among 7,838 individuals in Bay Village who have obtained a bachelor's degree or higher.
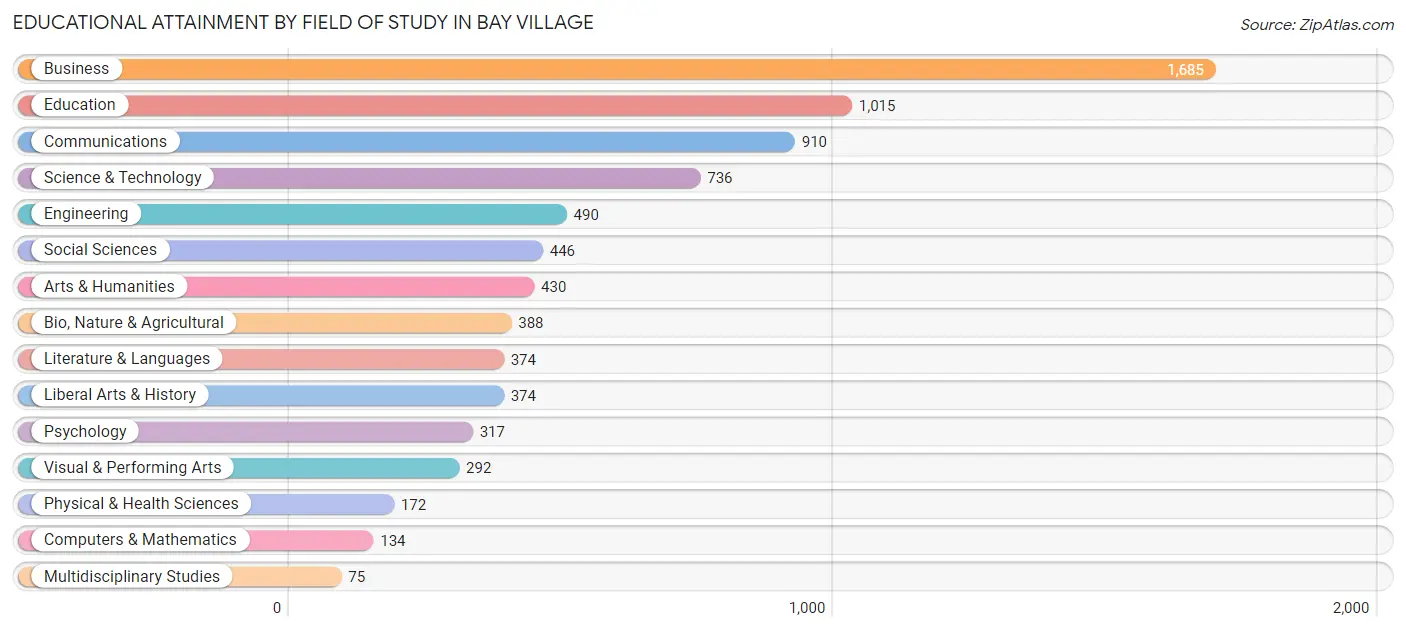
| Field of Study | # Graduates | % Graduates |
| Computers & Mathematics | 134 | 1.7% |
| Bio, Nature & Agricultural | 388 | 5.0% |
| Physical & Health Sciences | 172 | 2.2% |
| Psychology | 317 | 4.0% |
| Social Sciences | 446 | 5.7% |
| Engineering | 490 | 6.2% |
| Multidisciplinary Studies | 75 | 1.0% |
| Science & Technology | 736 | 9.4% |
| Business | 1,685 | 21.5% |
| Education | 1,015 | 13.0% |
| Literature & Languages | 374 | 4.8% |
| Liberal Arts & History | 374 | 4.8% |
| Visual & Performing Arts | 292 | 3.7% |
| Communications | 910 | 11.6% |
| Arts & Humanities | 430 | 5.5% |
| Total | 7,838 | 100.0% |
Transportation & Commute in Bay Village
Vehicle Availability by Sex in Bay Village
The most prevalent vehicle ownership categories in Bay Village are males with 2 vehicles (2,343, accounting for 55.6%) and females with 2 vehicles (1,979, making up 62.8%).
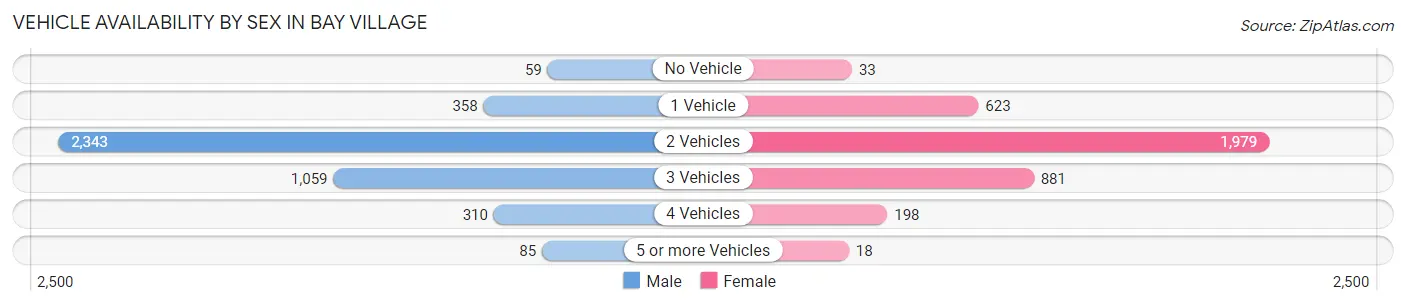
| Vehicles Available | Male | Female |
| No Vehicle | 59 (1.4%) | 33 (0.9%) |
| 1 Vehicle | 358 (8.5%) | 623 (16.7%) |
| 2 Vehicles | 2,343 (55.6%) | 1,979 (53.0%) |
| 3 Vehicles | 1,059 (25.1%) | 881 (23.6%) |
| 4 Vehicles | 310 (7.4%) | 198 (5.3%) |
| 5 or more Vehicles | 85 (2.0%) | 18 (0.5%) |
| Total | 4,214 (100.0%) | 3,732 (100.0%) |
Commute Time in Bay Village
The most frequently occuring commute durations in Bay Village are 30 to 34 minutes (1,087 commuters, 17.2%), 5 to 9 minutes (942 commuters, 14.9%), and 15 to 19 minutes (825 commuters, 13.1%).
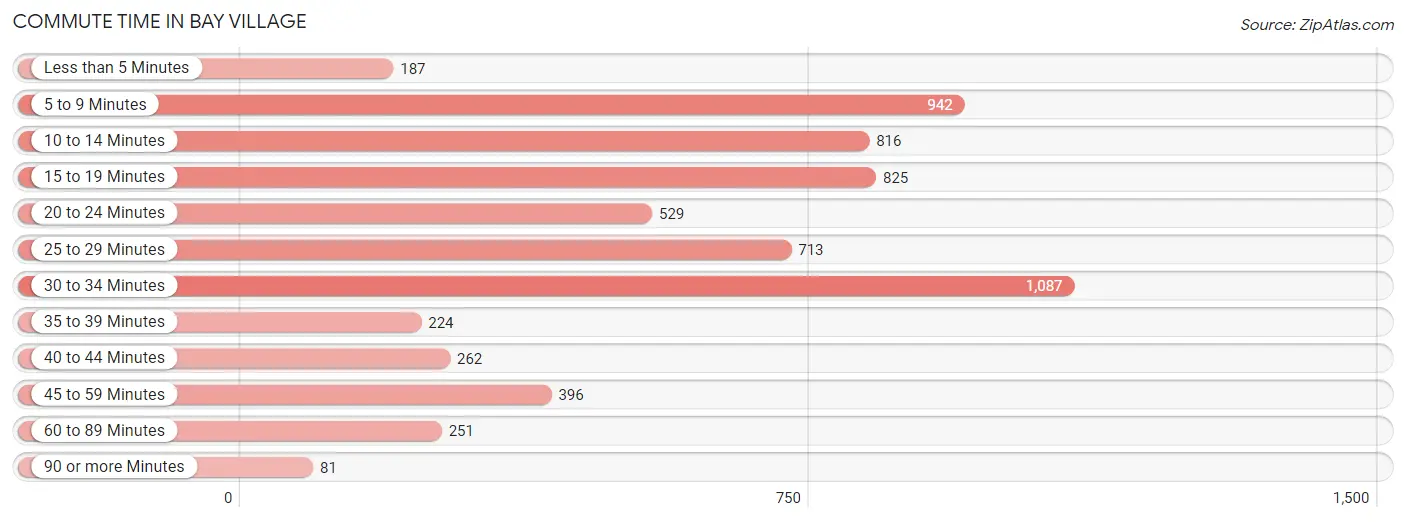
| Commute Time | # Commuters | % Commuters |
| Less than 5 Minutes | 187 | 3.0% |
| 5 to 9 Minutes | 942 | 14.9% |
| 10 to 14 Minutes | 816 | 12.9% |
| 15 to 19 Minutes | 825 | 13.1% |
| 20 to 24 Minutes | 529 | 8.4% |
| 25 to 29 Minutes | 713 | 11.3% |
| 30 to 34 Minutes | 1,087 | 17.2% |
| 35 to 39 Minutes | 224 | 3.5% |
| 40 to 44 Minutes | 262 | 4.2% |
| 45 to 59 Minutes | 396 | 6.3% |
| 60 to 89 Minutes | 251 | 4.0% |
| 90 or more Minutes | 81 | 1.3% |
Commute Time by Sex in Bay Village
The most common commute times in Bay Village are 30 to 34 minutes (713 commuters, 20.6%) for males and 15 to 19 minutes (536 commuters, 18.7%) for females.
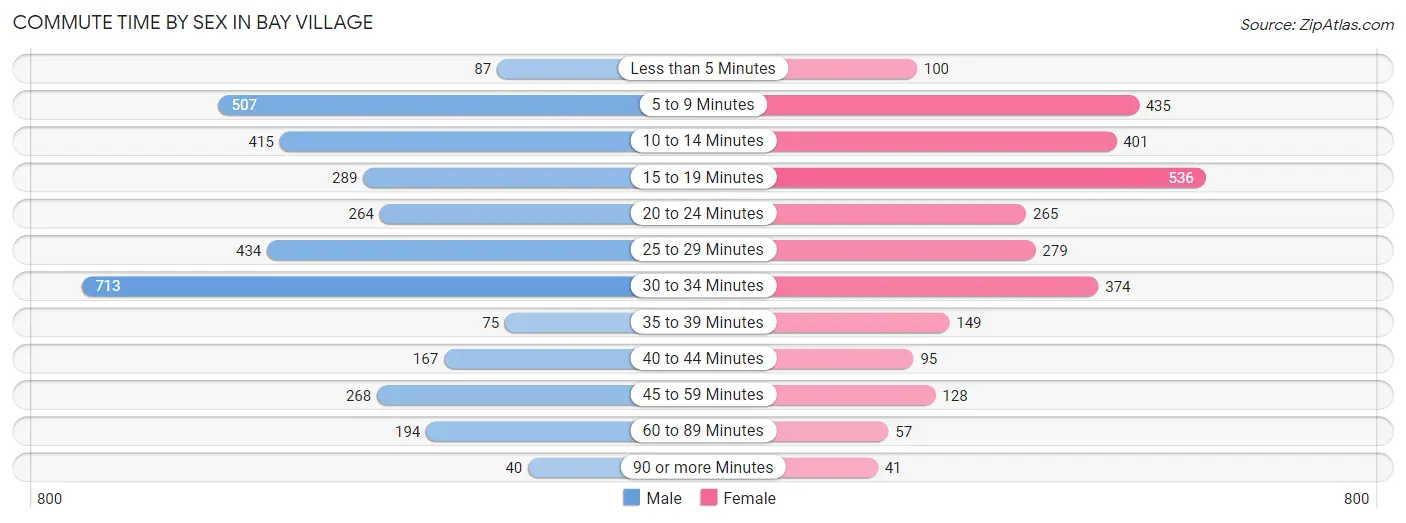
| Commute Time | Male | Female |
| Less than 5 Minutes | 87 (2.5%) | 100 (3.5%) |
| 5 to 9 Minutes | 507 (14.7%) | 435 (15.2%) |
| 10 to 14 Minutes | 415 (12.0%) | 401 (14.0%) |
| 15 to 19 Minutes | 289 (8.4%) | 536 (18.7%) |
| 20 to 24 Minutes | 264 (7.6%) | 265 (9.3%) |
| 25 to 29 Minutes | 434 (12.6%) | 279 (9.8%) |
| 30 to 34 Minutes | 713 (20.6%) | 374 (13.1%) |
| 35 to 39 Minutes | 75 (2.2%) | 149 (5.2%) |
| 40 to 44 Minutes | 167 (4.8%) | 95 (3.3%) |
| 45 to 59 Minutes | 268 (7.8%) | 128 (4.5%) |
| 60 to 89 Minutes | 194 (5.6%) | 57 (2.0%) |
| 90 or more Minutes | 40 (1.2%) | 41 (1.4%) |
Time of Departure to Work by Sex in Bay Village
The most frequent times of departure to work in Bay Village are 7:00 AM to 7:29 AM (781, 22.6%) for males and 8:00 AM to 8:29 AM (621, 21.7%) for females.
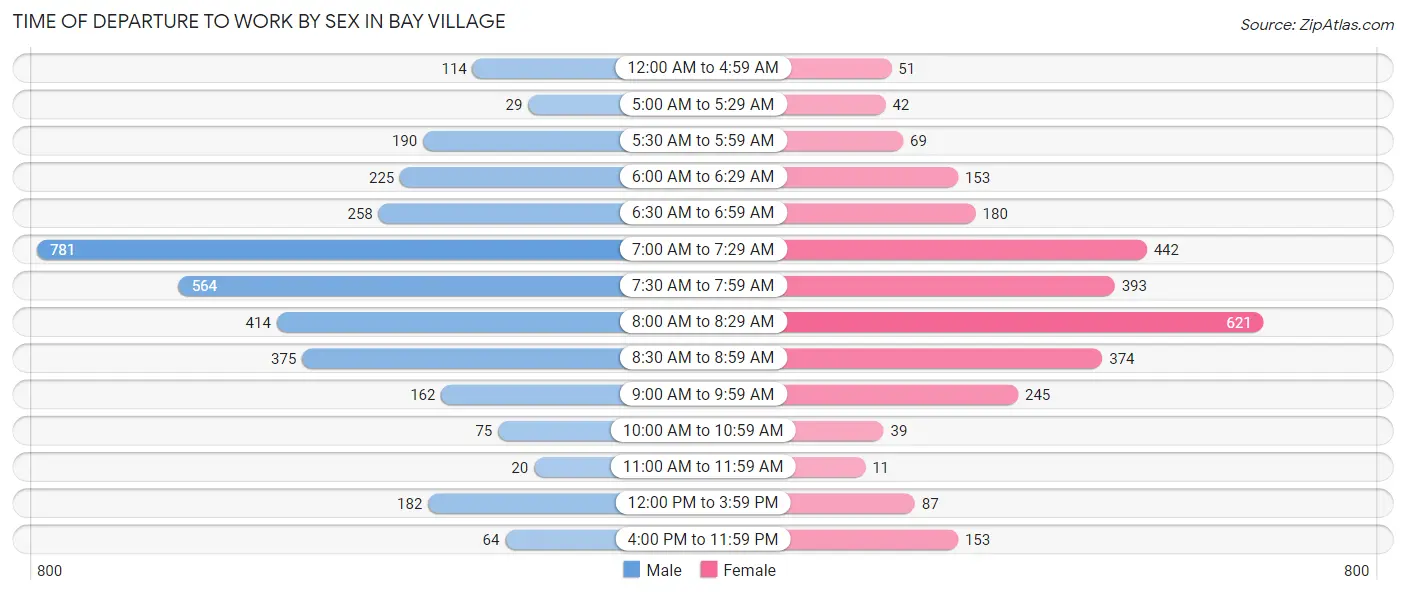
| Time of Departure | Male | Female |
| 12:00 AM to 4:59 AM | 114 (3.3%) | 51 (1.8%) |
| 5:00 AM to 5:29 AM | 29 (0.8%) | 42 (1.5%) |
| 5:30 AM to 5:59 AM | 190 (5.5%) | 69 (2.4%) |
| 6:00 AM to 6:29 AM | 225 (6.5%) | 153 (5.3%) |
| 6:30 AM to 6:59 AM | 258 (7.5%) | 180 (6.3%) |
| 7:00 AM to 7:29 AM | 781 (22.6%) | 442 (15.4%) |
| 7:30 AM to 7:59 AM | 564 (16.3%) | 393 (13.7%) |
| 8:00 AM to 8:29 AM | 414 (12.0%) | 621 (21.7%) |
| 8:30 AM to 8:59 AM | 375 (10.9%) | 374 (13.1%) |
| 9:00 AM to 9:59 AM | 162 (4.7%) | 245 (8.6%) |
| 10:00 AM to 10:59 AM | 75 (2.2%) | 39 (1.4%) |
| 11:00 AM to 11:59 AM | 20 (0.6%) | 11 (0.4%) |
| 12:00 PM to 3:59 PM | 182 (5.3%) | 87 (3.0%) |
| 4:00 PM to 11:59 PM | 64 (1.8%) | 153 (5.3%) |
| Total | 3,453 (100.0%) | 2,860 (100.0%) |
Housing Occupancy in Bay Village
Occupancy by Ownership in Bay Village
Of the total 6,086 dwellings in Bay Village, owner-occupied units account for 5,600 (92.0%), while renter-occupied units make up 486 (8.0%).
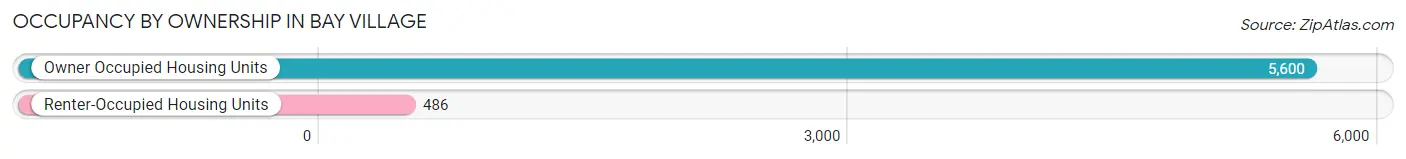
| Occupancy | # Housing Units | % Housing Units |
| Owner Occupied Housing Units | 5,600 | 92.0% |
| Renter-Occupied Housing Units | 486 | 8.0% |
| Total Occupied Housing Units | 6,086 | 100.0% |
Occupancy by Household Size in Bay Village
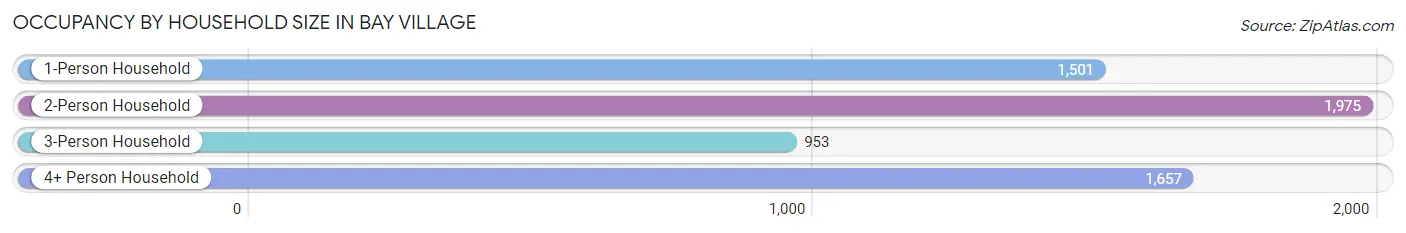
| Household Size | # Housing Units | % Housing Units |
| 1-Person Household | 1,501 | 24.7% |
| 2-Person Household | 1,975 | 32.5% |
| 3-Person Household | 953 | 15.7% |
| 4+ Person Household | 1,657 | 27.2% |
| Total Housing Units | 6,086 | 100.0% |
Occupancy by Ownership by Household Size in Bay Village
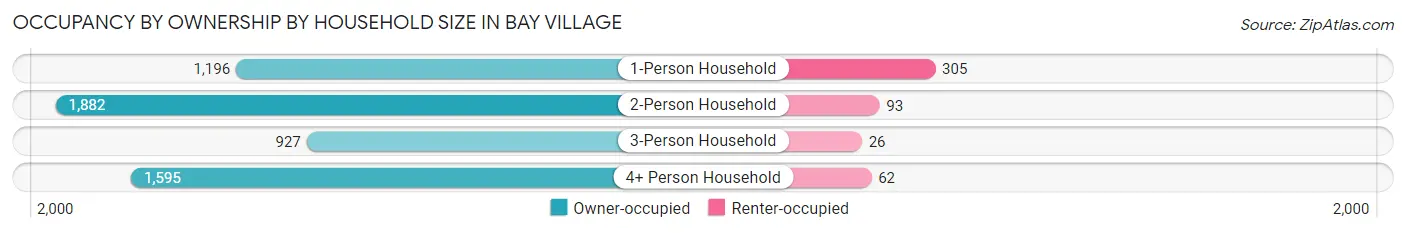
| Household Size | Owner-occupied | Renter-occupied |
| 1-Person Household | 1,196 (79.7%) | 305 (20.3%) |
| 2-Person Household | 1,882 (95.3%) | 93 (4.7%) |
| 3-Person Household | 927 (97.3%) | 26 (2.7%) |
| 4+ Person Household | 1,595 (96.3%) | 62 (3.7%) |
| Total Housing Units | 5,600 (92.0%) | 486 (8.0%) |
Occupancy by Educational Attainment in Bay Village
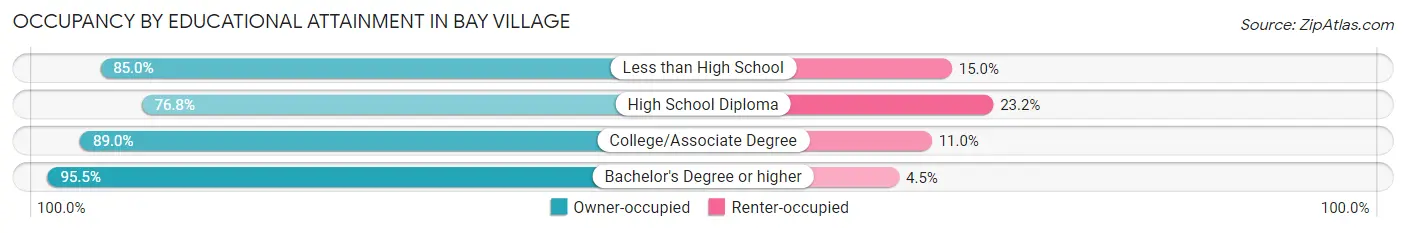
| Household Size | Owner-occupied | Renter-occupied |
| Less than High School | 68 (85.0%) | 12 (15.0%) |
| High School Diploma | 490 (76.8%) | 148 (23.2%) |
| College/Associate Degree | 1,132 (89.0%) | 140 (11.0%) |
| Bachelor's Degree or higher | 3,910 (95.5%) | 186 (4.5%) |
Occupancy by Age of Householder in Bay Village
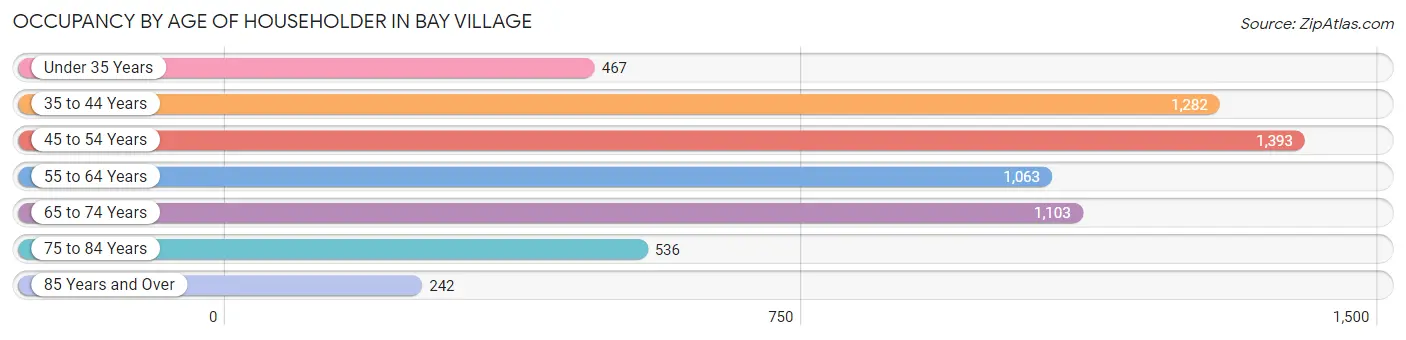
| Age Bracket | # Households | % Households |
| Under 35 Years | 467 | 7.7% |
| 35 to 44 Years | 1,282 | 21.1% |
| 45 to 54 Years | 1,393 | 22.9% |
| 55 to 64 Years | 1,063 | 17.5% |
| 65 to 74 Years | 1,103 | 18.1% |
| 75 to 84 Years | 536 | 8.8% |
| 85 Years and Over | 242 | 4.0% |
| Total | 6,086 | 100.0% |
Housing Finances in Bay Village
Median Income by Occupancy in Bay Village
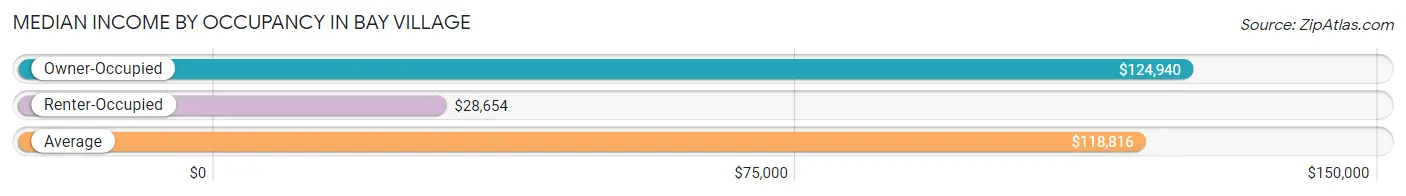
| Occupancy Type | # Households | Median Income |
| Owner-Occupied | 5,600 (92.0%) | $124,940 |
| Renter-Occupied | 486 (8.0%) | $28,654 |
| Average | 6,086 (100.0%) | $118,816 |
Occupancy by Householder Income Bracket in Bay Village
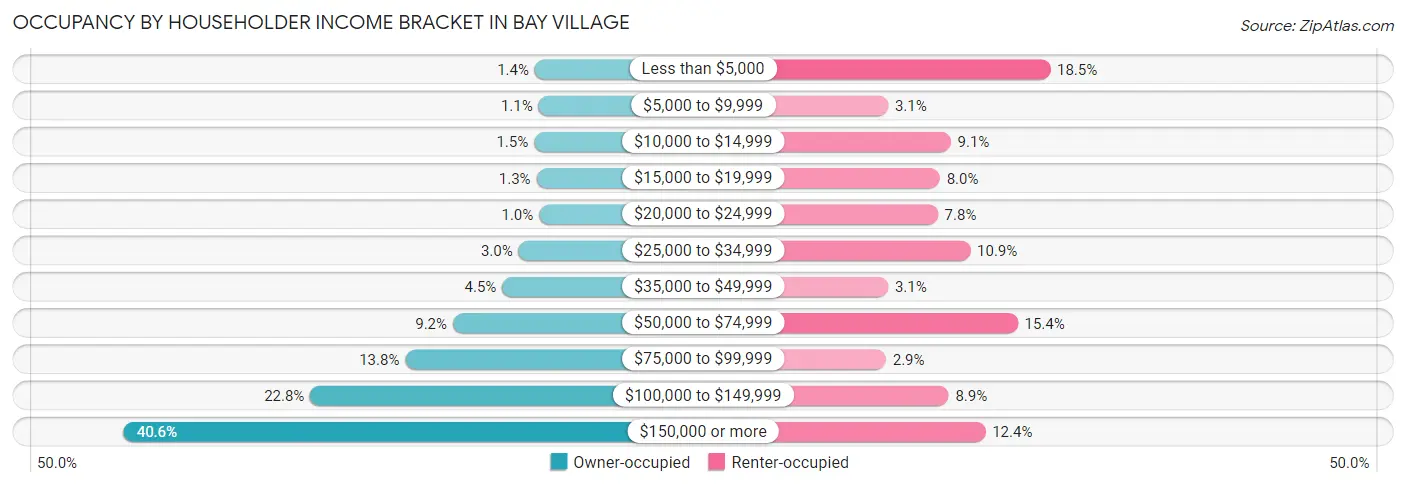
| Income Bracket | Owner-occupied | Renter-occupied |
| Less than $5,000 | 79 (1.4%) | 90 (18.5%) |
| $5,000 to $9,999 | 59 (1.1%) | 15 (3.1%) |
| $10,000 to $14,999 | 83 (1.5%) | 44 (9.0%) |
| $15,000 to $19,999 | 70 (1.3%) | 39 (8.0%) |
| $20,000 to $24,999 | 56 (1.0%) | 38 (7.8%) |
| $25,000 to $34,999 | 166 (3.0%) | 53 (10.9%) |
| $35,000 to $49,999 | 253 (4.5%) | 15 (3.1%) |
| $50,000 to $74,999 | 516 (9.2%) | 75 (15.4%) |
| $75,000 to $99,999 | 770 (13.8%) | 14 (2.9%) |
| $100,000 to $149,999 | 1,277 (22.8%) | 43 (8.8%) |
| $150,000 or more | 2,271 (40.6%) | 60 (12.3%) |
| Total | 5,600 (100.0%) | 486 (100.0%) |
Monthly Housing Cost Tiers in Bay Village
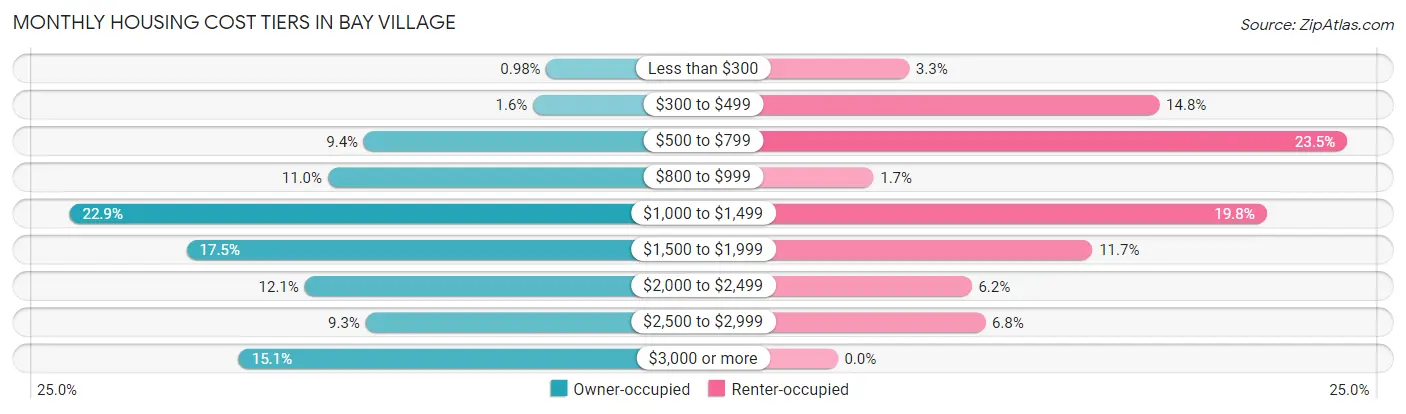
| Monthly Cost | Owner-occupied | Renter-occupied |
| Less than $300 | 55 (1.0%) | 16 (3.3%) |
| $300 to $499 | 89 (1.6%) | 72 (14.8%) |
| $500 to $799 | 525 (9.4%) | 114 (23.5%) |
| $800 to $999 | 618 (11.0%) | 8 (1.7%) |
| $1,000 to $1,499 | 1,284 (22.9%) | 96 (19.8%) |
| $1,500 to $1,999 | 982 (17.5%) | 57 (11.7%) |
| $2,000 to $2,499 | 678 (12.1%) | 30 (6.2%) |
| $2,500 to $2,999 | 521 (9.3%) | 33 (6.8%) |
| $3,000 or more | 848 (15.1%) | 0 (0.0%) |
| Total | 5,600 (100.0%) | 486 (100.0%) |
Physical Housing Characteristics in Bay Village
Housing Structures in Bay Village
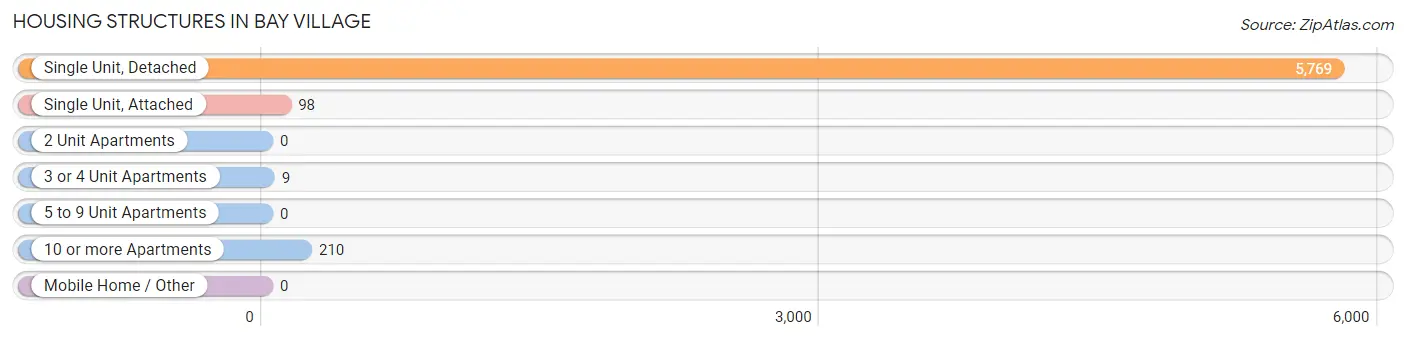
| Structure Type | # Housing Units | % Housing Units |
| Single Unit, Detached | 5,769 | 94.8% |
| Single Unit, Attached | 98 | 1.6% |
| 2 Unit Apartments | 0 | 0.0% |
| 3 or 4 Unit Apartments | 9 | 0.2% |
| 5 to 9 Unit Apartments | 0 | 0.0% |
| 10 or more Apartments | 210 | 3.5% |
| Mobile Home / Other | 0 | 0.0% |
| Total | 6,086 | 100.0% |
Housing Structures by Occupancy in Bay Village
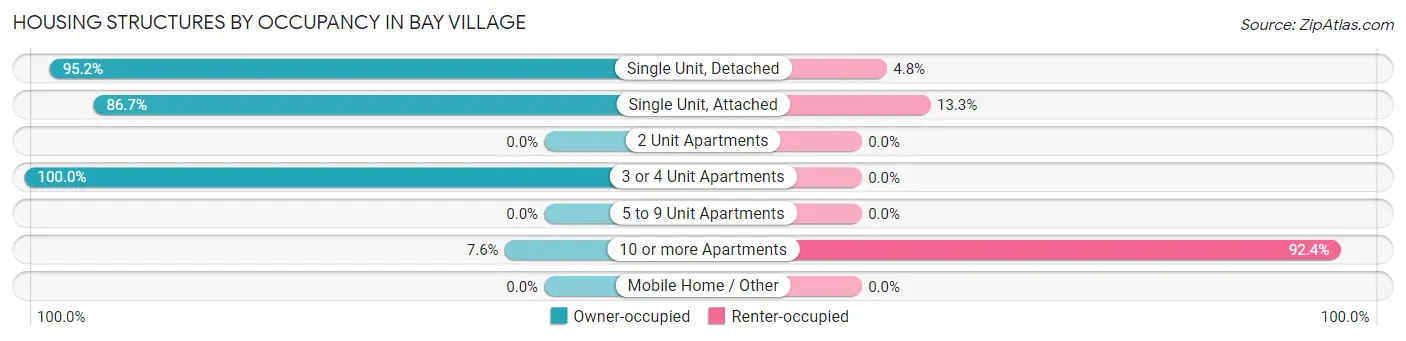
| Structure Type | Owner-occupied | Renter-occupied |
| Single Unit, Detached | 5,490 (95.2%) | 279 (4.8%) |
| Single Unit, Attached | 85 (86.7%) | 13 (13.3%) |
| 2 Unit Apartments | 0 (0.0%) | 0 (0.0%) |
| 3 or 4 Unit Apartments | 9 (100.0%) | 0 (0.0%) |
| 5 to 9 Unit Apartments | 0 (0.0%) | 0 (0.0%) |
| 10 or more Apartments | 16 (7.6%) | 194 (92.4%) |
| Mobile Home / Other | 0 (0.0%) | 0 (0.0%) |
| Total | 5,600 (92.0%) | 486 (8.0%) |
Housing Structures by Number of Rooms in Bay Village
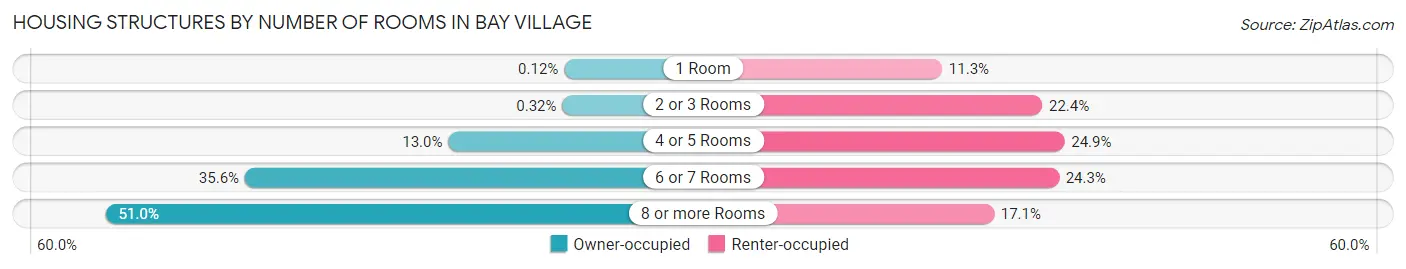
| Number of Rooms | Owner-occupied | Renter-occupied |
| 1 Room | 7 (0.1%) | 55 (11.3%) |
| 2 or 3 Rooms | 18 (0.3%) | 109 (22.4%) |
| 4 or 5 Rooms | 727 (13.0%) | 121 (24.9%) |
| 6 or 7 Rooms | 1,991 (35.5%) | 118 (24.3%) |
| 8 or more Rooms | 2,857 (51.0%) | 83 (17.1%) |
| Total | 5,600 (100.0%) | 486 (100.0%) |
Housing Structure by Heating Type in Bay Village
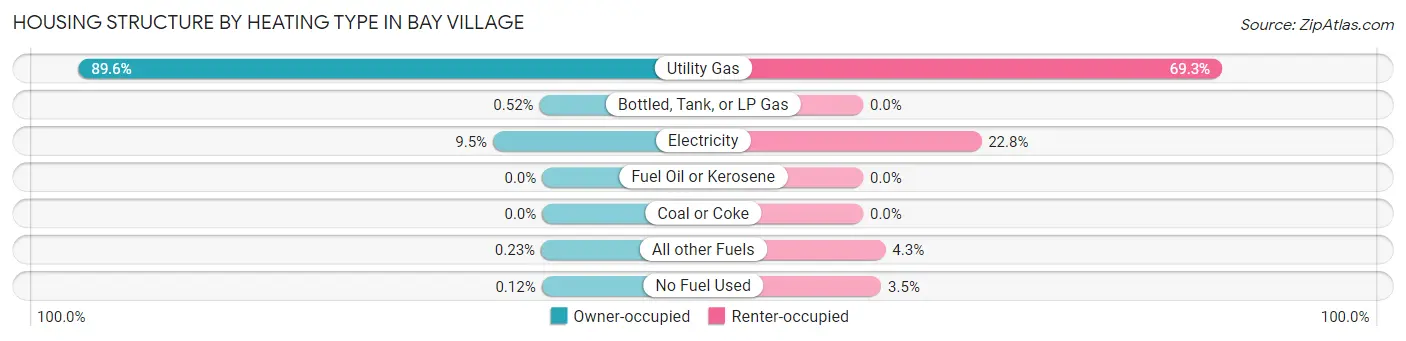
| Heating Type | Owner-occupied | Renter-occupied |
| Utility Gas | 5,019 (89.6%) | 337 (69.3%) |
| Bottled, Tank, or LP Gas | 29 (0.5%) | 0 (0.0%) |
| Electricity | 532 (9.5%) | 111 (22.8%) |
| Fuel Oil or Kerosene | 0 (0.0%) | 0 (0.0%) |
| Coal or Coke | 0 (0.0%) | 0 (0.0%) |
| All other Fuels | 13 (0.2%) | 21 (4.3%) |
| No Fuel Used | 7 (0.1%) | 17 (3.5%) |
| Total | 5,600 (100.0%) | 486 (100.0%) |
Household Vehicle Usage in Bay Village
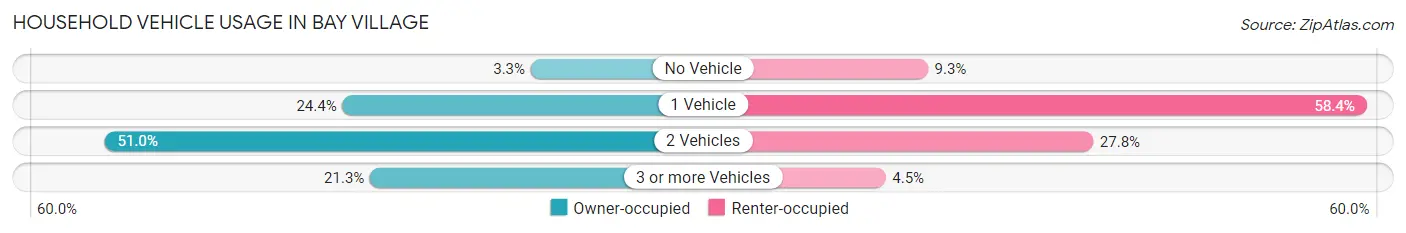
| Vehicles per Household | Owner-occupied | Renter-occupied |
| No Vehicle | 184 (3.3%) | 45 (9.3%) |
| 1 Vehicle | 1,366 (24.4%) | 284 (58.4%) |
| 2 Vehicles | 2,858 (51.0%) | 135 (27.8%) |
| 3 or more Vehicles | 1,192 (21.3%) | 22 (4.5%) |
| Total | 5,600 (100.0%) | 486 (100.0%) |
Real Estate & Mortgages in Bay Village
Real Estate and Mortgage Overview in Bay Village
| Characteristic | Without Mortgage | With Mortgage |
| Housing Units | 1,733 | 3,867 |
| Median Property Value | $293,400 | $321,900 |
| Median Household Income | $95,529 | $1,800 |
| Monthly Housing Costs | $911 | $829 |
| Real Estate Taxes | $6,462 | $30 |
Property Value by Mortgage Status in Bay Village
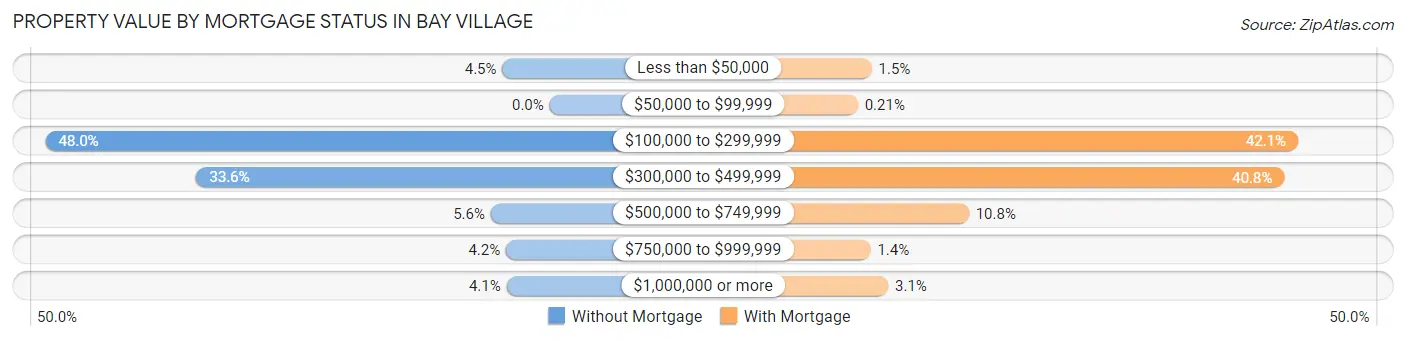
| Property Value | Without Mortgage | With Mortgage |
| Less than $50,000 | 78 (4.5%) | 59 (1.5%) |
| $50,000 to $99,999 | 0 (0.0%) | 8 (0.2%) |
| $100,000 to $299,999 | 832 (48.0%) | 1,629 (42.1%) |
| $300,000 to $499,999 | 583 (33.6%) | 1,579 (40.8%) |
| $500,000 to $749,999 | 97 (5.6%) | 417 (10.8%) |
| $750,000 to $999,999 | 72 (4.2%) | 55 (1.4%) |
| $1,000,000 or more | 71 (4.1%) | 120 (3.1%) |
| Total | 1,733 (100.0%) | 3,867 (100.0%) |
Household Income by Mortgage Status in Bay Village
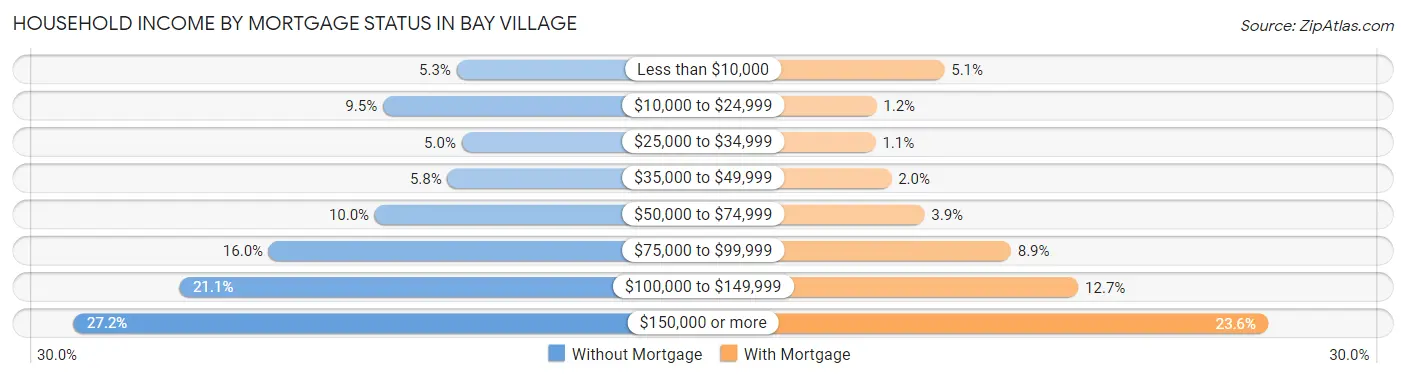
| Household Income | Without Mortgage | With Mortgage |
| Less than $10,000 | 92 (5.3%) | 196 (5.1%) |
| $10,000 to $24,999 | 165 (9.5%) | 46 (1.2%) |
| $25,000 to $34,999 | 87 (5.0%) | 44 (1.1%) |
| $35,000 to $49,999 | 101 (5.8%) | 79 (2.0%) |
| $50,000 to $74,999 | 173 (10.0%) | 152 (3.9%) |
| $75,000 to $99,999 | 278 (16.0%) | 343 (8.9%) |
| $100,000 to $149,999 | 366 (21.1%) | 492 (12.7%) |
| $150,000 or more | 471 (27.2%) | 911 (23.6%) |
| Total | 1,733 (100.0%) | 3,867 (100.0%) |
Property Value to Household Income Ratio in Bay Village
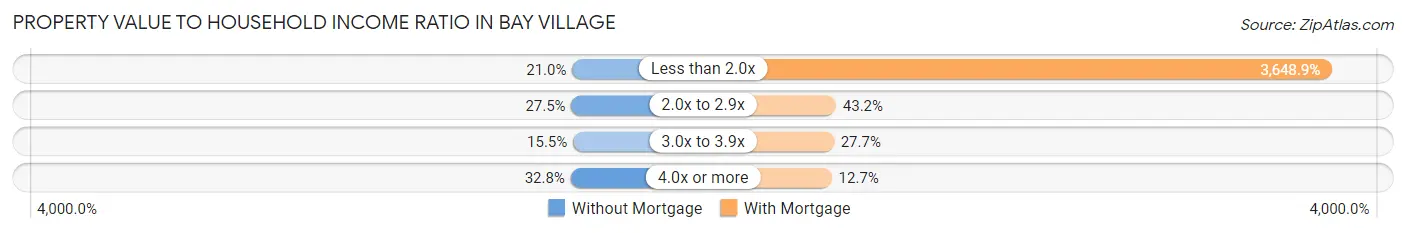
| Value-to-Income Ratio | Without Mortgage | With Mortgage |
| Less than 2.0x | 364 (21.0%) | 141,104 (3,648.9%) |
| 2.0x to 2.9x | 476 (27.5%) | 1,672 (43.2%) |
| 3.0x to 3.9x | 268 (15.5%) | 1,072 (27.7%) |
| 4.0x or more | 568 (32.8%) | 490 (12.7%) |
| Total | 1,733 (100.0%) | 3,867 (100.0%) |
Real Estate Taxes by Mortgage Status in Bay Village
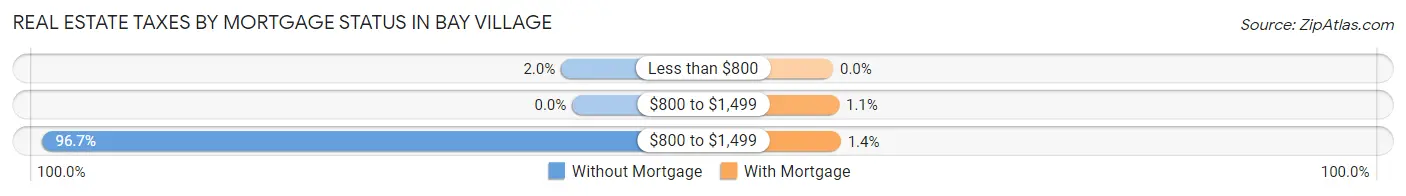
| Property Taxes | Without Mortgage | With Mortgage |
| Less than $800 | 35 (2.0%) | 0 (0.0%) |
| $800 to $1,499 | 0 (0.0%) | 42 (1.1%) |
| $800 to $1,499 | 1,676 (96.7%) | 54 (1.4%) |
| Total | 1,733 (100.0%) | 3,867 (100.0%) |
Health & Disability in Bay Village
Health Insurance Coverage by Age in Bay Village
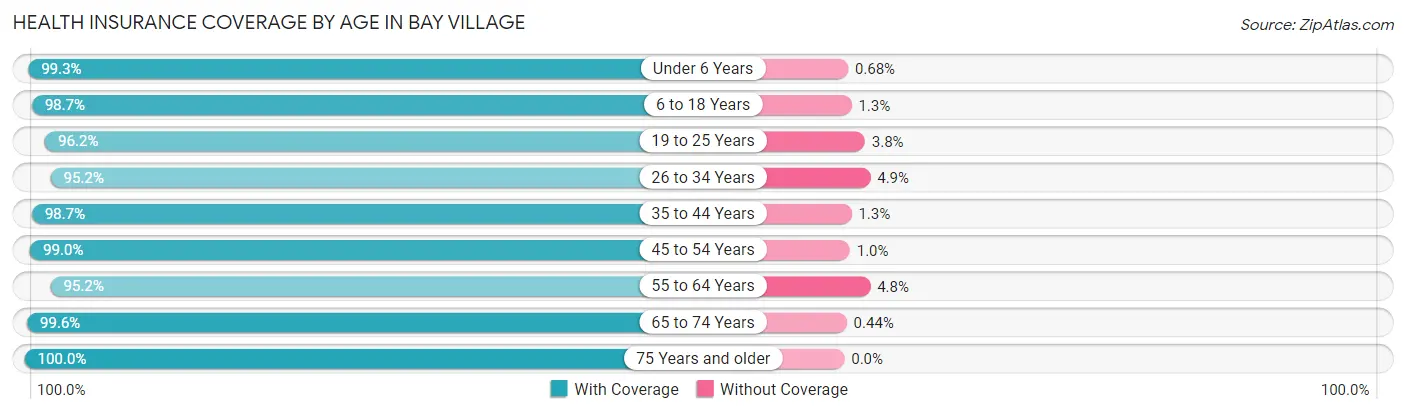
| Age Bracket | With Coverage | Without Coverage |
| Under 6 Years | 1,309 (99.3%) | 9 (0.7%) |
| 6 to 18 Years | 3,198 (98.7%) | 43 (1.3%) |
| 19 to 25 Years | 627 (96.2%) | 25 (3.8%) |
| 26 to 34 Years | 1,001 (95.2%) | 51 (4.9%) |
| 35 to 44 Years | 2,356 (98.7%) | 32 (1.3%) |
| 45 to 54 Years | 2,423 (99.0%) | 25 (1.0%) |
| 55 to 64 Years | 1,832 (95.2%) | 93 (4.8%) |
| 65 to 74 Years | 1,805 (99.6%) | 8 (0.4%) |
| 75 Years and older | 1,021 (100.0%) | 0 (0.0%) |
| Total | 15,572 (98.2%) | 286 (1.8%) |
Health Insurance Coverage by Citizenship Status in Bay Village
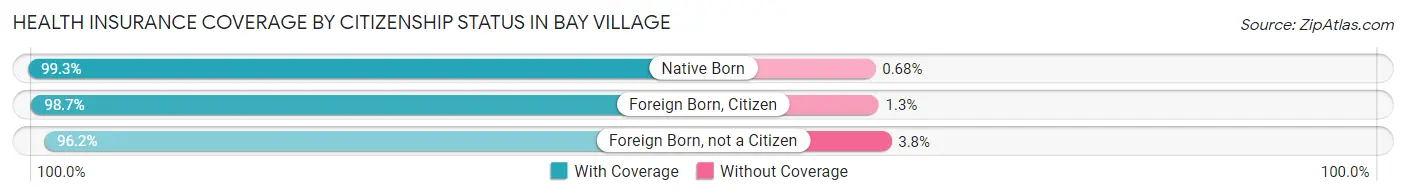
| Citizenship Status | With Coverage | Without Coverage |
| Native Born | 1,309 (99.3%) | 9 (0.7%) |
| Foreign Born, Citizen | 3,198 (98.7%) | 43 (1.3%) |
| Foreign Born, not a Citizen | 627 (96.2%) | 25 (3.8%) |
Health Insurance Coverage by Household Income in Bay Village
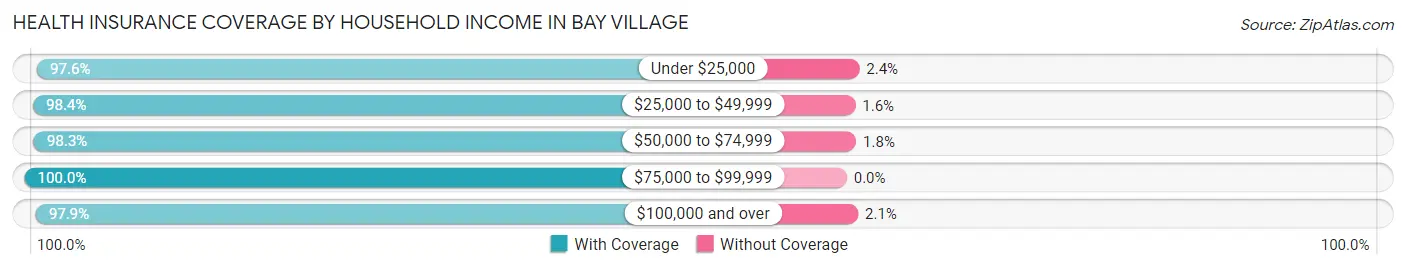
| Household Income | With Coverage | Without Coverage |
| Under $25,000 | 786 (97.6%) | 19 (2.4%) |
| $25,000 to $49,999 | 738 (98.4%) | 12 (1.6%) |
| $50,000 to $74,999 | 1,064 (98.3%) | 19 (1.8%) |
| $75,000 to $99,999 | 2,050 (100.0%) | 0 (0.0%) |
| $100,000 and over | 10,917 (97.9%) | 236 (2.1%) |
Public vs Private Health Insurance Coverage by Age in Bay Village
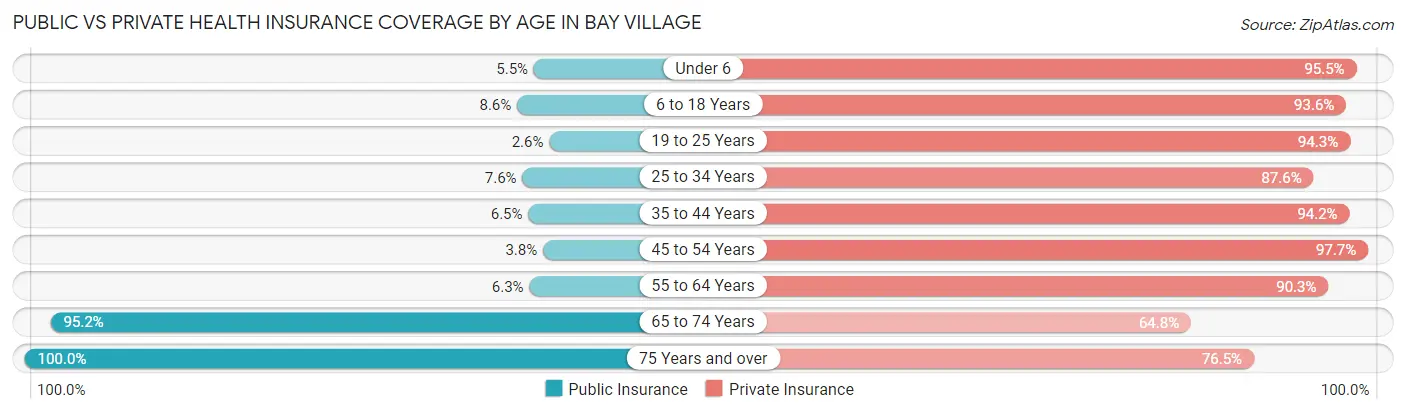
| Age Bracket | Public Insurance | Private Insurance |
| Under 6 | 72 (5.5%) | 1,259 (95.5%) |
| 6 to 18 Years | 278 (8.6%) | 3,034 (93.6%) |
| 19 to 25 Years | 17 (2.6%) | 615 (94.3%) |
| 25 to 34 Years | 80 (7.6%) | 921 (87.5%) |
| 35 to 44 Years | 155 (6.5%) | 2,250 (94.2%) |
| 45 to 54 Years | 92 (3.8%) | 2,391 (97.7%) |
| 55 to 64 Years | 121 (6.3%) | 1,738 (90.3%) |
| 65 to 74 Years | 1,726 (95.2%) | 1,175 (64.8%) |
| 75 Years and over | 1,021 (100.0%) | 781 (76.5%) |
| Total | 3,562 (22.5%) | 14,164 (89.3%) |
Disability Status by Sex by Age in Bay Village
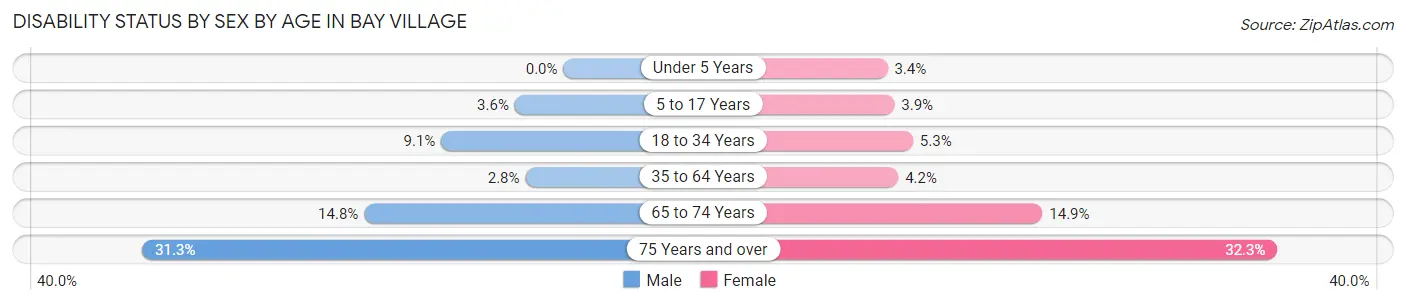
| Age Bracket | Male | Female |
| Under 5 Years | 0 (0.0%) | 16 (3.4%) |
| 5 to 17 Years | 64 (3.6%) | 57 (3.9%) |
| 18 to 34 Years | 94 (9.1%) | 44 (5.3%) |
| 35 to 64 Years | 91 (2.8%) | 148 (4.2%) |
| 65 to 74 Years | 139 (14.8%) | 130 (14.9%) |
| 75 Years and over | 122 (31.3%) | 204 (32.3%) |
Disability Class by Sex by Age in Bay Village
Disability Class: Hearing Difficulty
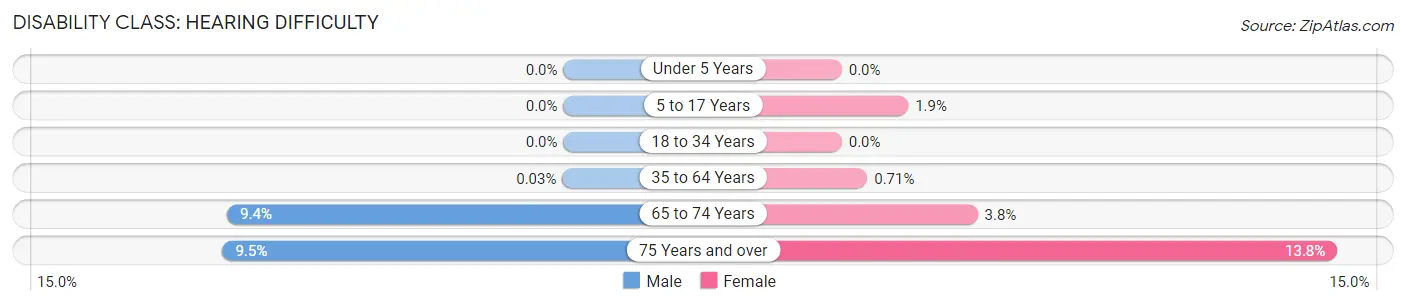
| Age Bracket | Male | Female |
| Under 5 Years | 0 (0.0%) | 0 (0.0%) |
| 5 to 17 Years | 0 (0.0%) | 27 (1.8%) |
| 18 to 34 Years | 0 (0.0%) | 0 (0.0%) |
| 35 to 64 Years | 1 (0.0%) | 25 (0.7%) |
| 65 to 74 Years | 88 (9.4%) | 33 (3.8%) |
| 75 Years and over | 37 (9.5%) | 87 (13.8%) |
Disability Class: Vision Difficulty
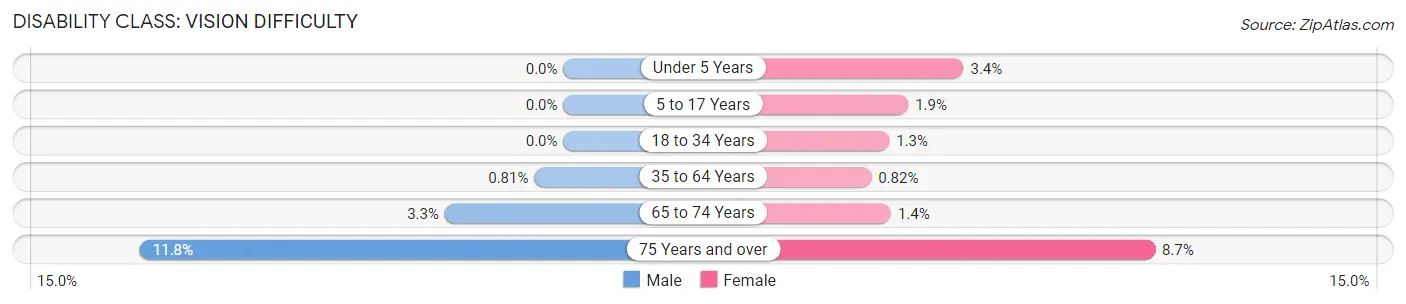
| Age Bracket | Male | Female |
| Under 5 Years | 0 (0.0%) | 16 (3.4%) |
| 5 to 17 Years | 0 (0.0%) | 27 (1.8%) |
| 18 to 34 Years | 0 (0.0%) | 11 (1.3%) |
| 35 to 64 Years | 26 (0.8%) | 29 (0.8%) |
| 65 to 74 Years | 31 (3.3%) | 12 (1.4%) |
| 75 Years and over | 46 (11.8%) | 55 (8.7%) |
Disability Class: Cognitive Difficulty
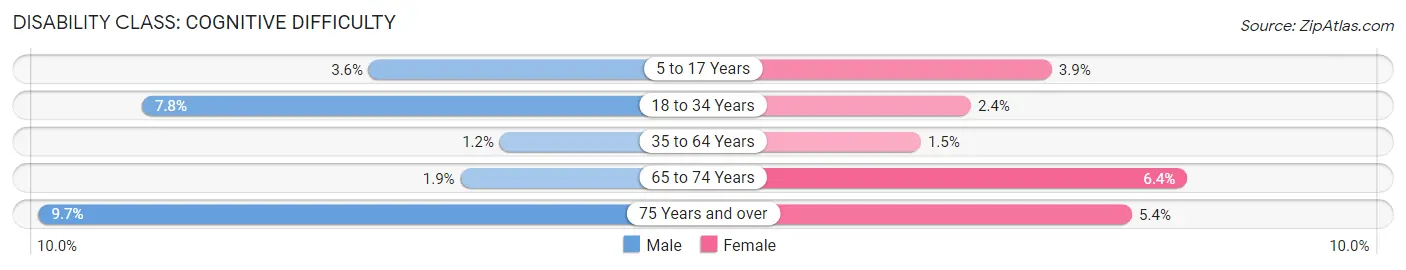
| Age Bracket | Male | Female |
| 5 to 17 Years | 64 (3.6%) | 57 (3.9%) |
| 18 to 34 Years | 81 (7.8%) | 20 (2.4%) |
| 35 to 64 Years | 38 (1.2%) | 52 (1.5%) |
| 65 to 74 Years | 18 (1.9%) | 56 (6.4%) |
| 75 Years and over | 38 (9.7%) | 34 (5.4%) |
Disability Class: Ambulatory Difficulty
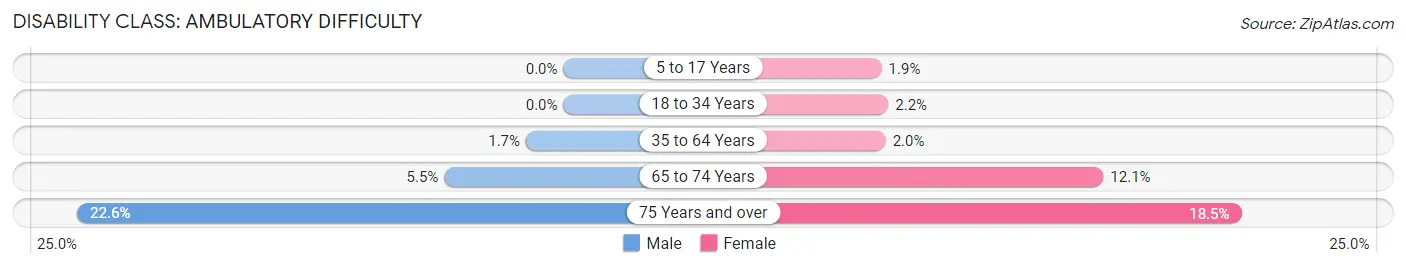
| Age Bracket | Male | Female |
| 5 to 17 Years | 0 (0.0%) | 27 (1.8%) |
| 18 to 34 Years | 0 (0.0%) | 18 (2.2%) |
| 35 to 64 Years | 56 (1.7%) | 72 (2.0%) |
| 65 to 74 Years | 52 (5.5%) | 106 (12.1%) |
| 75 Years and over | 88 (22.6%) | 117 (18.5%) |
Disability Class: Self-Care Difficulty
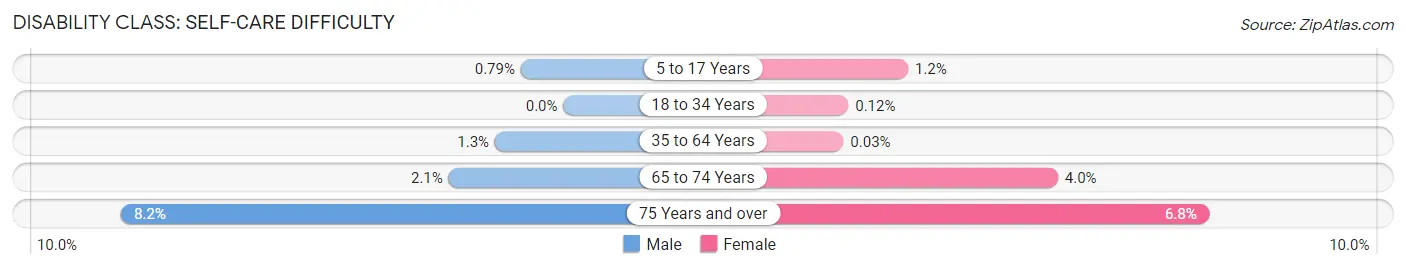
| Age Bracket | Male | Female |
| 5 to 17 Years | 14 (0.8%) | 18 (1.2%) |
| 18 to 34 Years | 0 (0.0%) | 1 (0.1%) |
| 35 to 64 Years | 41 (1.3%) | 1 (0.0%) |
| 65 to 74 Years | 20 (2.1%) | 35 (4.0%) |
| 75 Years and over | 32 (8.2%) | 43 (6.8%) |
Technology Access in Bay Village
Computing Device Access in Bay Village
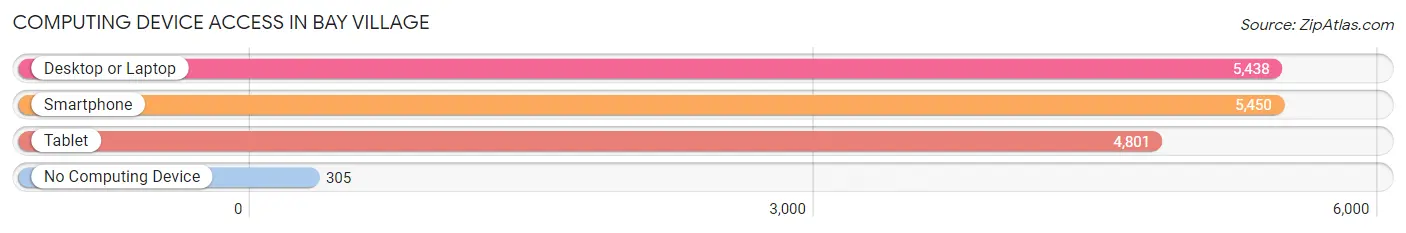
| Device Type | # Households | % Households |
| Desktop or Laptop | 5,438 | 89.3% |
| Smartphone | 5,450 | 89.5% |
| Tablet | 4,801 | 78.9% |
| No Computing Device | 305 | 5.0% |
| Total | 6,086 | 100.0% |
Internet Access in Bay Village
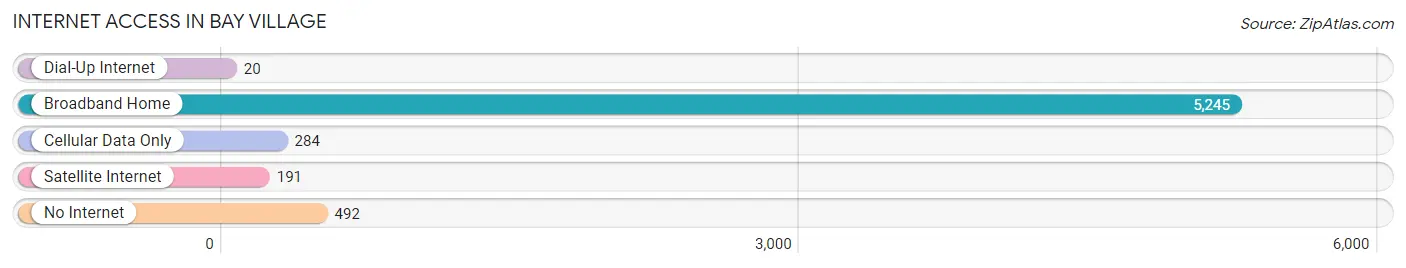
| Internet Type | # Households | % Households |
| Dial-Up Internet | 20 | 0.3% |
| Broadband Home | 5,245 | 86.2% |
| Cellular Data Only | 284 | 4.7% |
| Satellite Internet | 191 | 3.1% |
| No Internet | 492 | 8.1% |
| Total | 6,086 | 100.0% |
Bay Village Summary
Bay Village is a city located in Cuyahoga County, Ohio, United States. It is a suburb of Cleveland and is located on the shore of Lake Erie. The population was 15,651 at the 2010 census.
History
Bay Village was founded in 1810 by John Wilcox, a Revolutionary War veteran. Wilcox purchased land from the Connecticut Land Company and named the area Dover Township. The area was later renamed Bay Village in 1921.
The city was originally a farming community, but it began to grow in the late 19th century when the railroad was built. The railroad allowed for the transportation of goods and people to and from the city.
In the early 20th century, Bay Village became a popular summer resort destination for Clevelanders. The city was home to several amusement parks, including Euclid Beach Park, which was one of the most popular amusement parks in the area.
Geography
Bay Village is located at 41°27'25" North, 81°51'17" West (41.456944, -81.854722). According to the United States Census Bureau, the city has a total area of 8.2 square miles (21.2 km2), of which 7.9 square miles (20.5 km2) is land and 0.3 square miles (0.7 km2) is water.
Economy
Bay Village is a residential community with a strong economy. The city is home to several businesses, including a variety of retail stores, restaurants, and professional services. The city is also home to a number of corporate headquarters, including the headquarters of the Cleveland Clinic.
Demographics
As of the census of 2010, there were 15,651 people, 6,717 households, and 4,541 families residing in the city. The population density was 1,976.3 people per square mile (764.2/km2). There were 7,093 housing units at an average density of 894.3 per square mile (345.3/km2). The racial makeup of the city was 94.2% White, 1.7% African American, 0.2% Native American, 1.7% Asian, 0.1% Pacific Islander, 0.7% from other races, and 1.5% from two or more races. Hispanic or Latino of any race were 2.3% of the population.
There were 6,717 households, out of which 28.2% had children under the age of 18 living with them, 56.2% were married couples living together, 9.2% had a female householder with no husband present, and 31.2% were non-families. 26.3% of all households were made up of individuals, and 11.2% had someone living alone who was 65 years of age or older. The average household size was 2.32 and the average family size was 2.81.
In the city, the population was spread out, with 22.2% under the age of 18, 5.3% from 18 to 24, 25.2% from 25 to 44, 28.2% from 45 to 64, and 19.1% who were 65 years of age or older. The median age was 43 years. For every 100 females, there were 91.2 males. For every 100 females age 18 and over, there were 87.7 males.
The median income for a household in the city was $68,945, and the median income for a family was $81,945. Males had a median income of $60,945 versus $41,945 for females. The per capita income for the city was $35,945. About 2.2% of families and 3.2% of the population were below the poverty line, including 4.2% of those under age 18 and 3.2% of those age 65 or over.
Common Questions
What is Per Capita Income in Bay Village?
Per Capita income in Bay Village is $59,920.
What is the Median Family Income in Bay Village?
Median Family Income in Bay Village is $144,186.
What is the Median Household income in Bay Village?
Median Household Income in Bay Village is $118,816.
What is Income or Wage Gap in Bay Village?
Income or Wage Gap in Bay Village is 29.9%.
Women in Bay Village earn 70.1 cents for every dollar earned by a man.
What is Inequality or Gini Index in Bay Village?
Inequality or Gini Index in Bay Village is 0.44.
What is the Total Population of Bay Village?
Total Population of Bay Village is 16,047.
What is the Total Male Population of Bay Village?
Total Male Population of Bay Village is 8,138.
What is the Total Female Population of Bay Village?
Total Female Population of Bay Village is 7,909.
What is the Ratio of Males per 100 Females in Bay Village?
There are 102.90 Males per 100 Females in Bay Village.
What is the Ratio of Females per 100 Males in Bay Village?
There are 97.19 Females per 100 Males in Bay Village.
What is the Median Population Age in Bay Village?
Median Population Age in Bay Village is 42.8 Years.
What is the Average Family Size in Bay Village
Average Family Size in Bay Village is 3.2 People.
What is the Average Household Size in Bay Village
Average Household Size in Bay Village is 2.6 People.
How Large is the Labor Force in Bay Village?
There are 8,221 People in the Labor Forcein in Bay Village.
What is the Percentage of People in the Labor Force in Bay Village?
67.3% of People are in the Labor Force in Bay Village.
What is the Unemployment Rate in Bay Village?
Unemployment Rate in Bay Village is 2.2%.