Neapolis, OH Map & Demographics
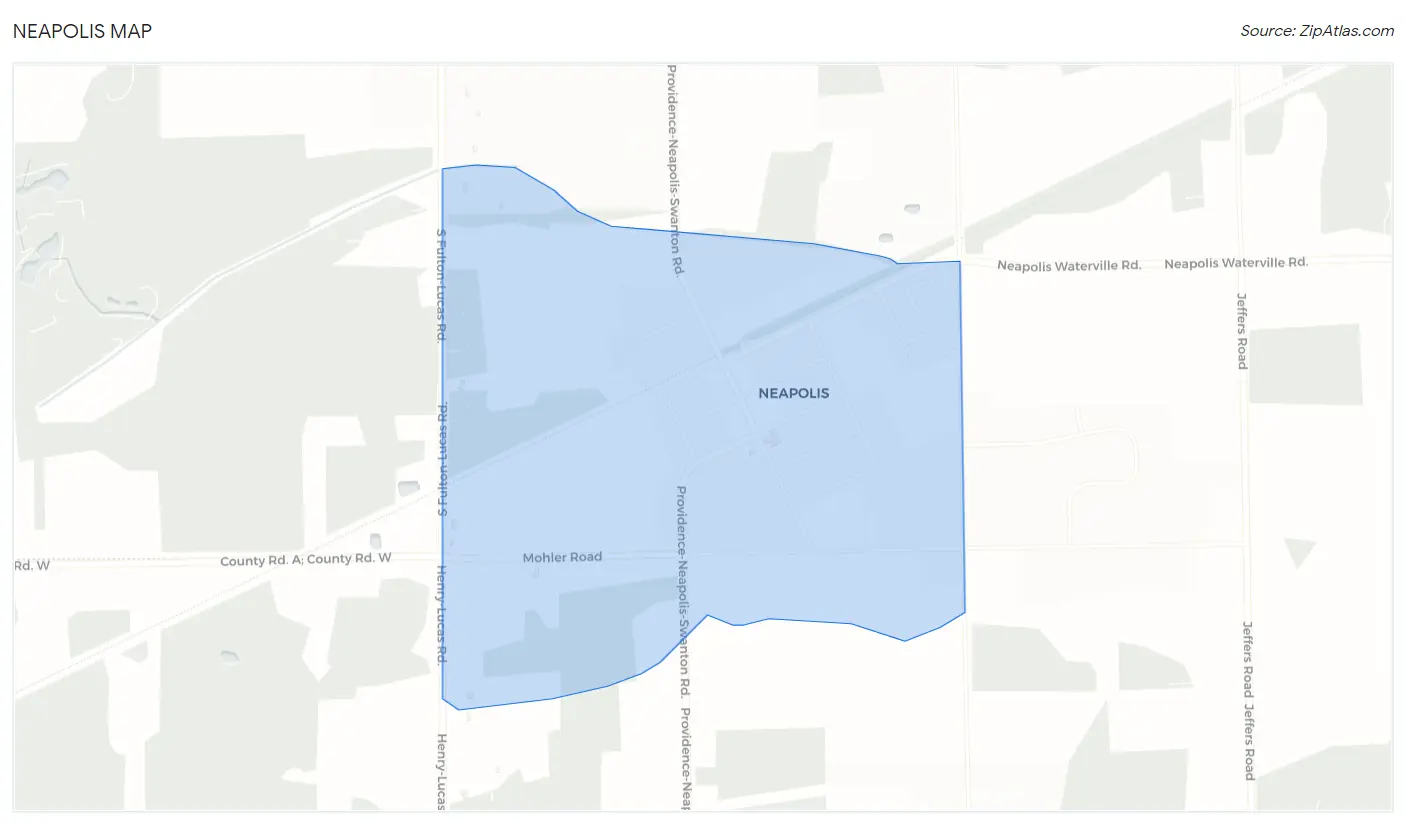
Neapolis Map
Neapolis Overview
$38,840
PER CAPITA INCOME
$101,797
AVG HOUSEHOLD INCOME
0.32
INEQUALITY / GINI INDEX
627
TOTAL POPULATION
321
MALE POPULATION
306
FEMALE POPULATION
104.90
MALES / 100 FEMALES
95.33
FEMALES / 100 MALES
49.2
MEDIAN AGE
3.9
AVG FAMILY SIZE
3.5
AVG HOUSEHOLD SIZE
538
LABOR FORCE [ PEOPLE ]
89.5%
PERCENT IN LABOR FORCE
11.2%
UNEMPLOYMENT RATE
Neapolis Zip Codes
Neapolis Area Codes
Income in Neapolis
Income Overview in Neapolis
| Characteristic | Number | Measure |
| Per Capita Income | 627 | $38,840 |
| Median Family Income | 148 | $0 |
| Mean Family Income | 148 | $139,319 |
| Median Household Income | 181 | $101,797 |
| Mean Household Income | 181 | $119,580 |
| Income Deficit | 148 | $0 |
| Wage / Income Gap (%) | 627 | 0.00% |
| Wage / Income Gap ($) | 627 | 100.00¢ per $1 |
| Gini / Inequality Index | 627 | 0.32 |
Earnings by Sex in Neapolis
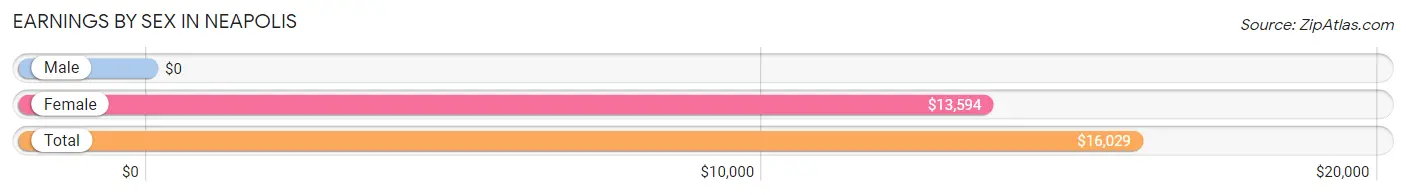
| Sex | Number | Average Earnings |
| Male | 273 (50.7%) | $0 |
| Female | 265 (49.3%) | $13,594 |
| Total | 538 (100.0%) | $16,029 |
Earnings by Sex by Income Bracket in Neapolis
The most common earnings brackets in Neapolis are $65,000 to $74,999 for men (109 | 39.9%) and $2,500 to $4,999 for women (104 | 39.3%).
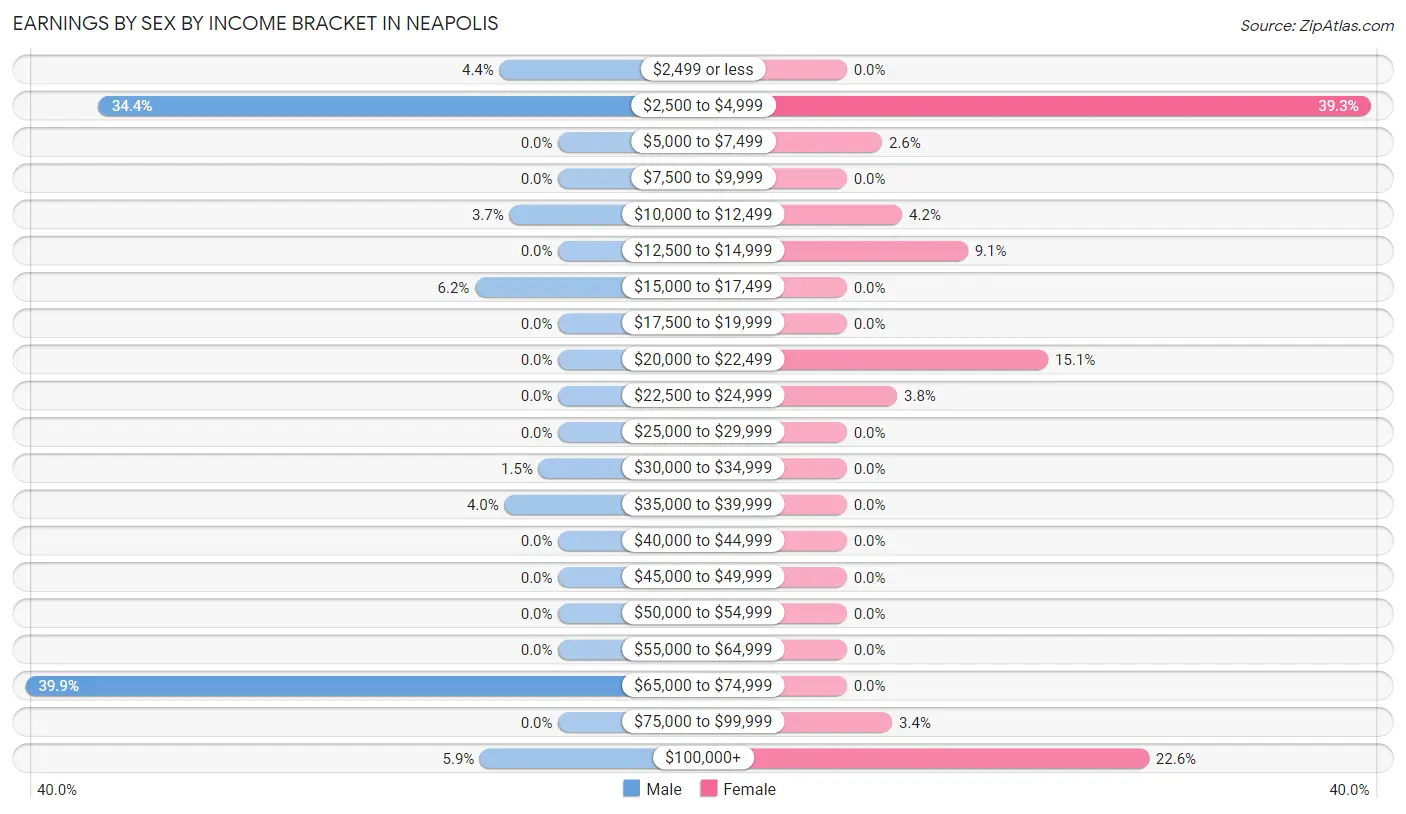
| Income | Male | Female |
| $2,499 or less | 12 (4.4%) | 0 (0.0%) |
| $2,500 to $4,999 | 94 (34.4%) | 104 (39.3%) |
| $5,000 to $7,499 | 0 (0.0%) | 7 (2.6%) |
| $7,500 to $9,999 | 0 (0.0%) | 0 (0.0%) |
| $10,000 to $12,499 | 10 (3.7%) | 11 (4.2%) |
| $12,500 to $14,999 | 0 (0.0%) | 24 (9.1%) |
| $15,000 to $17,499 | 17 (6.2%) | 0 (0.0%) |
| $17,500 to $19,999 | 0 (0.0%) | 0 (0.0%) |
| $20,000 to $22,499 | 0 (0.0%) | 40 (15.1%) |
| $22,500 to $24,999 | 0 (0.0%) | 10 (3.8%) |
| $25,000 to $29,999 | 0 (0.0%) | 0 (0.0%) |
| $30,000 to $34,999 | 4 (1.5%) | 0 (0.0%) |
| $35,000 to $39,999 | 11 (4.0%) | 0 (0.0%) |
| $40,000 to $44,999 | 0 (0.0%) | 0 (0.0%) |
| $45,000 to $49,999 | 0 (0.0%) | 0 (0.0%) |
| $50,000 to $54,999 | 0 (0.0%) | 0 (0.0%) |
| $55,000 to $64,999 | 0 (0.0%) | 0 (0.0%) |
| $65,000 to $74,999 | 109 (39.9%) | 0 (0.0%) |
| $75,000 to $99,999 | 0 (0.0%) | 9 (3.4%) |
| $100,000+ | 16 (5.9%) | 60 (22.6%) |
| Total | 273 (100.0%) | 265 (100.0%) |
Earnings by Sex by Educational Attainment in Neapolis
Average earnings in Neapolis are $68,343 for men and $14,219 for women, a difference of 79.2%. Men with an educational attainment of high school diploma enjoy the highest average annual earnings of $68,268, while those with high school diploma education earn the least with $68,268. Women with an educational attainment of high school diploma earn the most with the average annual earnings of $21,188, while those with less than high school education have the smallest earnings of $14,271.
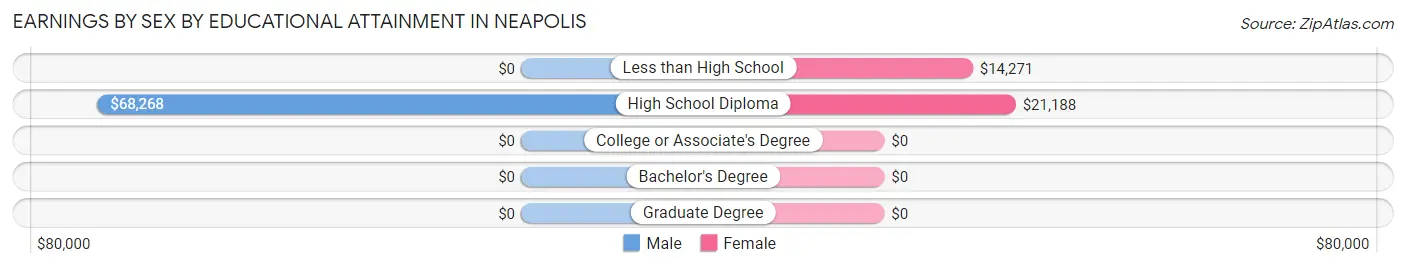
| Educational Attainment | Male Income | Female Income |
| Less than High School | - | - |
| High School Diploma | $68,268 | $21,188 |
| College or Associate's Degree | - | - |
| Bachelor's Degree | - | - |
| Graduate Degree | - | - |
| Total | $68,343 | $14,219 |
Family Income in Neapolis
Family Income Brackets in Neapolis
According to the Neapolis family income data, there are 60 families falling into the $200,000+ income range, which is the most common income bracket and makes up 40.5% of all families.
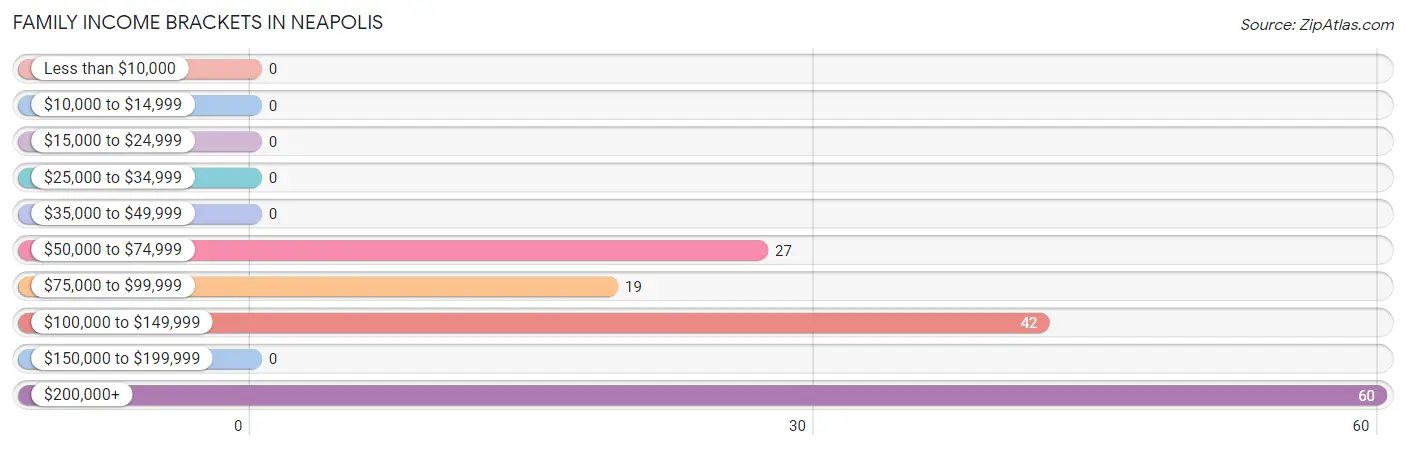
| Income Bracket | # Families | % Families |
| Less than $10,000 | 0 | 0.0% |
| $10,000 to $14,999 | 0 | 0.0% |
| $15,000 to $24,999 | 0 | 0.0% |
| $25,000 to $34,999 | 0 | 0.0% |
| $35,000 to $49,999 | 0 | 0.0% |
| $50,000 to $74,999 | 27 | 18.2% |
| $75,000 to $99,999 | 19 | 12.8% |
| $100,000 to $149,999 | 42 | 28.4% |
| $150,000 to $199,999 | 0 | 0.0% |
| $200,000+ | 60 | 40.5% |
Family Income by Famaliy Size in Neapolis
2-person families (69 | 46.6%) account for the highest median family income in Neapolis with $101,172 per family, while 2-person families (69 | 46.6%) have the highest median income of $50,586 per family member.
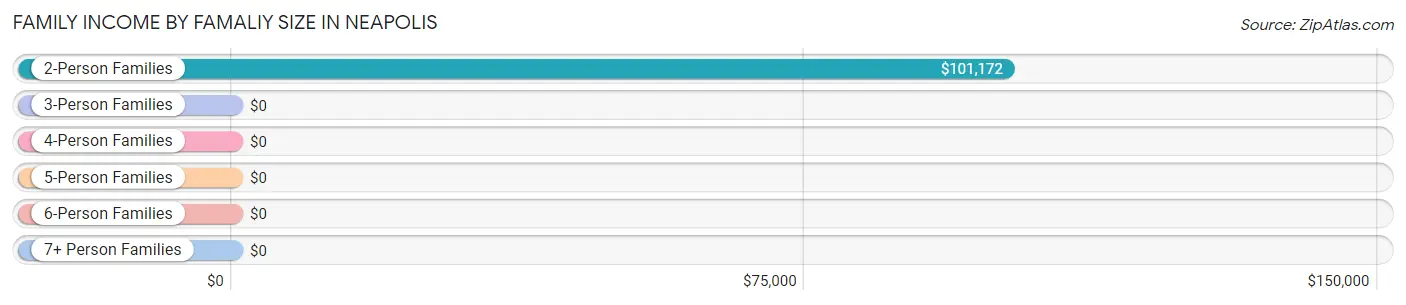
| Income Bracket | # Families | Median Income |
| 2-Person Families | 69 (46.6%) | $101,172 |
| 3-Person Families | 9 (6.1%) | $0 |
| 4-Person Families | 60 (40.5%) | $0 |
| 5-Person Families | 10 (6.8%) | $0 |
| 6-Person Families | 0 (0.0%) | $0 |
| 7+ Person Families | 0 (0.0%) | $0 |
| Total | 148 (100.0%) | $0 |
Family Income by Number of Earners in Neapolis
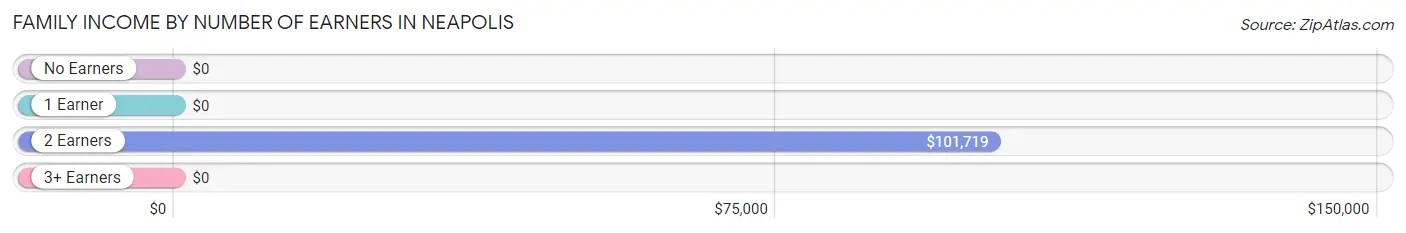
| Number of Earners | # Families | Median Income |
| No Earners | 23 (15.5%) | $0 |
| 1 Earner | 7 (4.7%) | $0 |
| 2 Earners | 48 (32.4%) | $101,719 |
| 3+ Earners | 70 (47.3%) | $0 |
| Total | 148 (100.0%) | $0 |
Household Income in Neapolis
Household Income Brackets in Neapolis
With 60 households falling in the category, the $200,000+ income range is the most frequent in Neapolis, accounting for 33.2% of all households.
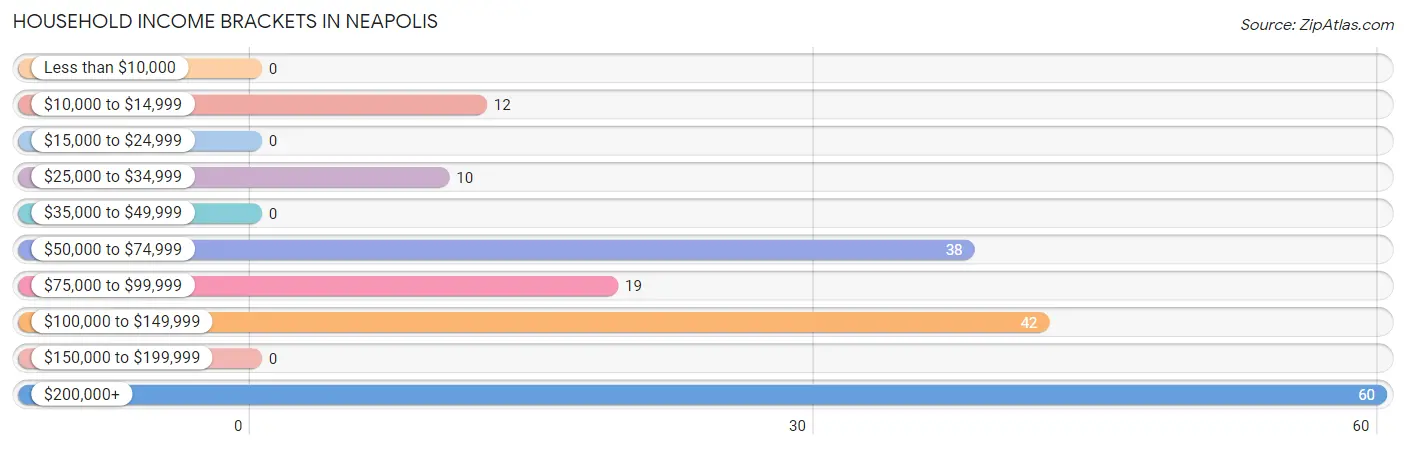
| Income Bracket | # Households | % Households |
| Less than $10,000 | 0 | 0.0% |
| $10,000 to $14,999 | 12 | 6.6% |
| $15,000 to $24,999 | 0 | 0.0% |
| $25,000 to $34,999 | 10 | 5.5% |
| $35,000 to $49,999 | 0 | 0.0% |
| $50,000 to $74,999 | 38 | 21.0% |
| $75,000 to $99,999 | 19 | 10.5% |
| $100,000 to $149,999 | 42 | 23.2% |
| $150,000 to $199,999 | 0 | 0.0% |
| $200,000+ | 60 | 33.1% |
Household Income by Householder Age in Neapolis
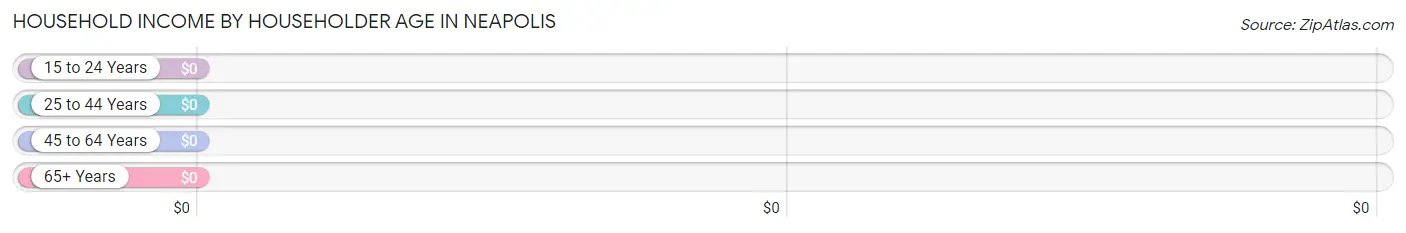
| Income Bracket | # Households | Median Income |
| 15 to 24 Years | 0 (0.0%) | $0 |
| 25 to 44 Years | 23 (12.7%) | $0 |
| 45 to 64 Years | 125 (69.1%) | $0 |
| 65+ Years | 33 (18.2%) | $0 |
| Total | 181 (100.0%) | $101,797 |
Poverty in Neapolis
Income Below Poverty by Sex and Age in Neapolis
With 3.7% poverty level for males and 7.8% for females among the residents of Neapolis, 25 to 34 year old males and 25 to 34 year old females are the most vulnerable to poverty, with 12 males (52.2%) and 24 females (100.0%) in their respective age groups living below the poverty level.
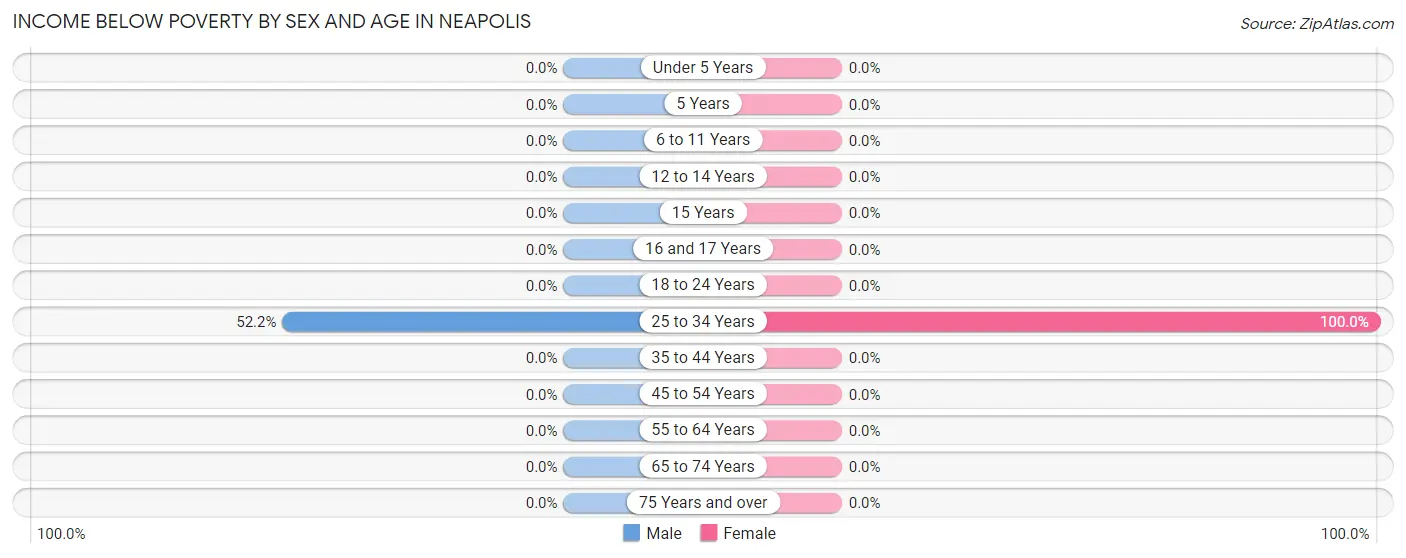
| Age Bracket | Male | Female |
| Under 5 Years | 0 (0.0%) | 0 (0.0%) |
| 5 Years | 0 (0.0%) | 0 (0.0%) |
| 6 to 11 Years | 0 (0.0%) | 0 (0.0%) |
| 12 to 14 Years | 0 (0.0%) | 0 (0.0%) |
| 15 Years | 0 (0.0%) | 0 (0.0%) |
| 16 and 17 Years | 0 (0.0%) | 0 (0.0%) |
| 18 to 24 Years | 0 (0.0%) | 0 (0.0%) |
| 25 to 34 Years | 12 (52.2%) | 24 (100.0%) |
| 35 to 44 Years | 0 (0.0%) | 0 (0.0%) |
| 45 to 54 Years | 0 (0.0%) | 0 (0.0%) |
| 55 to 64 Years | 0 (0.0%) | 0 (0.0%) |
| 65 to 74 Years | 0 (0.0%) | 0 (0.0%) |
| 75 Years and over | 0 (0.0%) | 0 (0.0%) |
| Total | 12 (3.7%) | 24 (7.8%) |
Income Above Poverty by Sex and Age in Neapolis
According to the poverty statistics in Neapolis, males aged 6 to 11 years and females aged 6 to 11 years are the age groups that are most secure financially, with 100.0% of males and 100.0% of females in these age groups living above the poverty line.
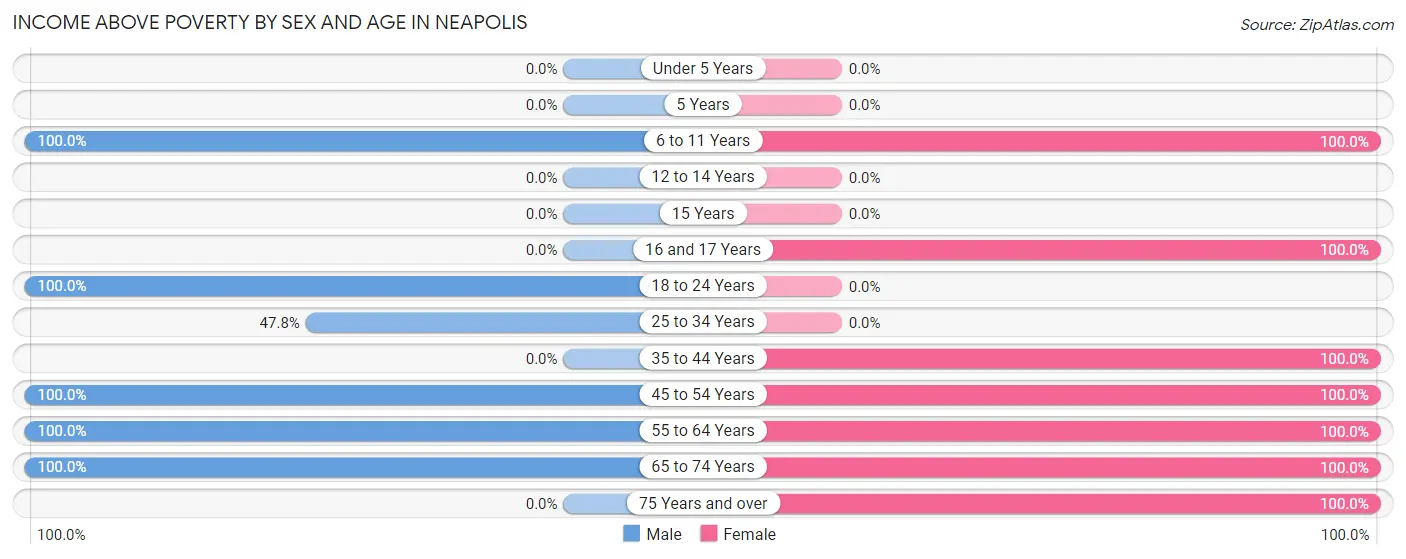
| Age Bracket | Male | Female |
| Under 5 Years | 0 (0.0%) | 0 (0.0%) |
| 5 Years | 0 (0.0%) | 0 (0.0%) |
| 6 to 11 Years | 15 (100.0%) | 11 (100.0%) |
| 12 to 14 Years | 0 (0.0%) | 0 (0.0%) |
| 15 Years | 0 (0.0%) | 0 (0.0%) |
| 16 and 17 Years | 0 (0.0%) | 12 (100.0%) |
| 18 to 24 Years | 111 (100.0%) | 0 (0.0%) |
| 25 to 34 Years | 11 (47.8%) | 0 (0.0%) |
| 35 to 44 Years | 0 (0.0%) | 24 (100.0%) |
| 45 to 54 Years | 93 (100.0%) | 69 (100.0%) |
| 55 to 64 Years | 46 (100.0%) | 50 (100.0%) |
| 65 to 74 Years | 33 (100.0%) | 24 (100.0%) |
| 75 Years and over | 0 (0.0%) | 92 (100.0%) |
| Total | 309 (96.3%) | 282 (92.2%) |
Income Below Poverty Among Married-Couple Families in Neapolis
| Children | Above Poverty | Below Poverty |
| No Children | 125 (100.0%) | 0 (0.0%) |
| 1 or 2 Children | 10 (100.0%) | 0 (0.0%) |
| 3 or 4 Children | 0 (0.0%) | 0 (0.0%) |
| 5 or more Children | 0 (0.0%) | 0 (0.0%) |
| Total | 135 (100.0%) | 0 (0.0%) |
Income Below Poverty Among Single-Parent Households in Neapolis
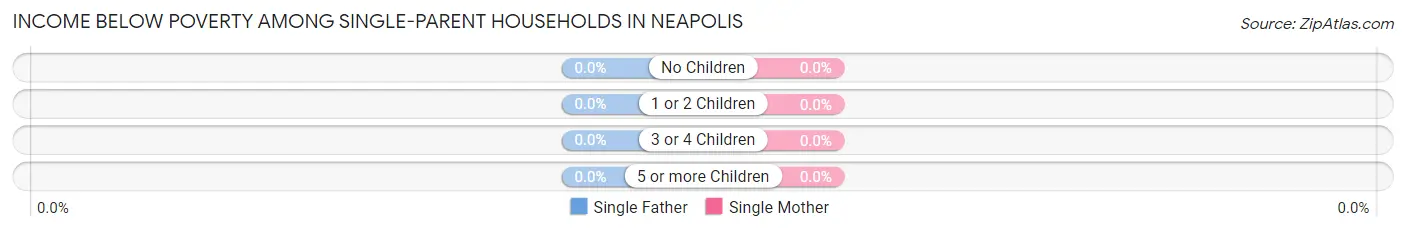
| Children | Single Father | Single Mother |
| No Children | 0 (0.0%) | 0 (0.0%) |
| 1 or 2 Children | 0 (0.0%) | 0 (0.0%) |
| 3 or 4 Children | 0 (0.0%) | 0 (0.0%) |
| 5 or more Children | 0 (0.0%) | 0 (0.0%) |
| Total | 0 (0.0%) | 0 (0.0%) |
Income Below Poverty Among Married-Couple vs Single-Parent Households in Neapolis
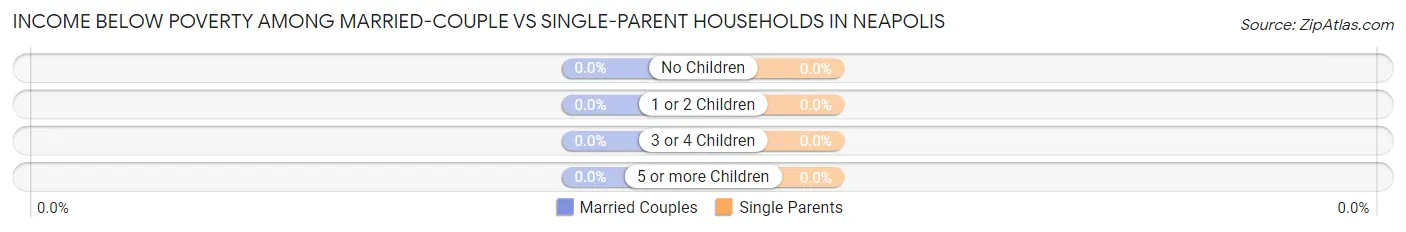
| Children | Married-Couple Families | Single-Parent Households |
| No Children | 0 (0.0%) | 0 (0.0%) |
| 1 or 2 Children | 0 (0.0%) | 0 (0.0%) |
| 3 or 4 Children | 0 (0.0%) | 0 (0.0%) |
| 5 or more Children | 0 (0.0%) | 0 (0.0%) |
| Total | 0 (0.0%) | 0 (0.0%) |
Race in Neapolis
The most populous races in Neapolis are White / Caucasian (627 | 100.0%), and Hispanic or Latino (57 | 9.1%).
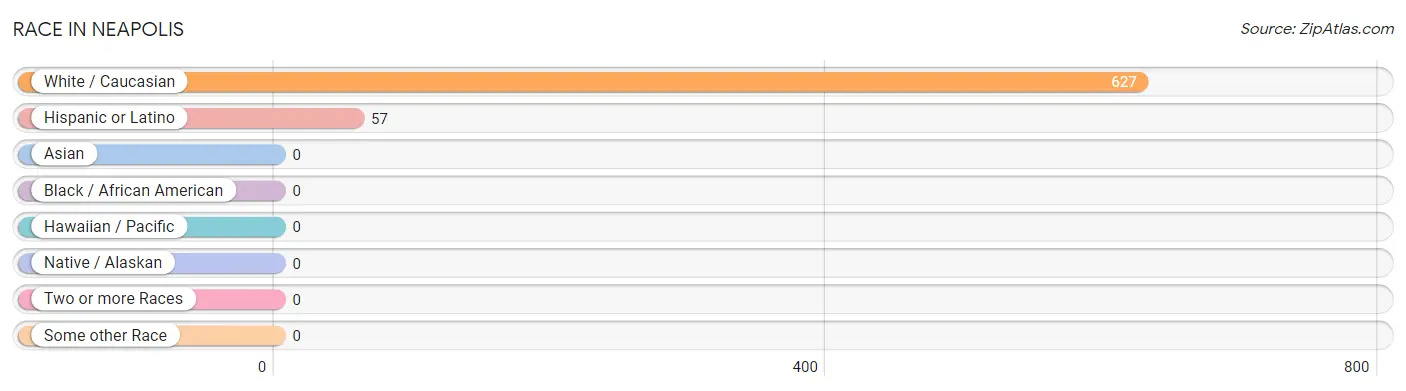
| Race | # Population | % Population |
| Asian | 0 | 0.0% |
| Black / African American | 0 | 0.0% |
| Hawaiian / Pacific | 0 | 0.0% |
| Hispanic or Latino | 57 | 9.1% |
| Native / Alaskan | 0 | 0.0% |
| White / Caucasian | 627 | 100.0% |
| Two or more Races | 0 | 0.0% |
| Some other Race | 0 | 0.0% |
| Total | 627 | 100.0% |
Ancestry in Neapolis
The most populous ancestries reported in Neapolis are German (216 | 34.4%), Mexican (57 | 9.1%), English (36 | 5.7%), Irish (34 | 5.4%), and Hungarian (12 | 1.9%), together accounting for 56.6% of all Neapolis residents.
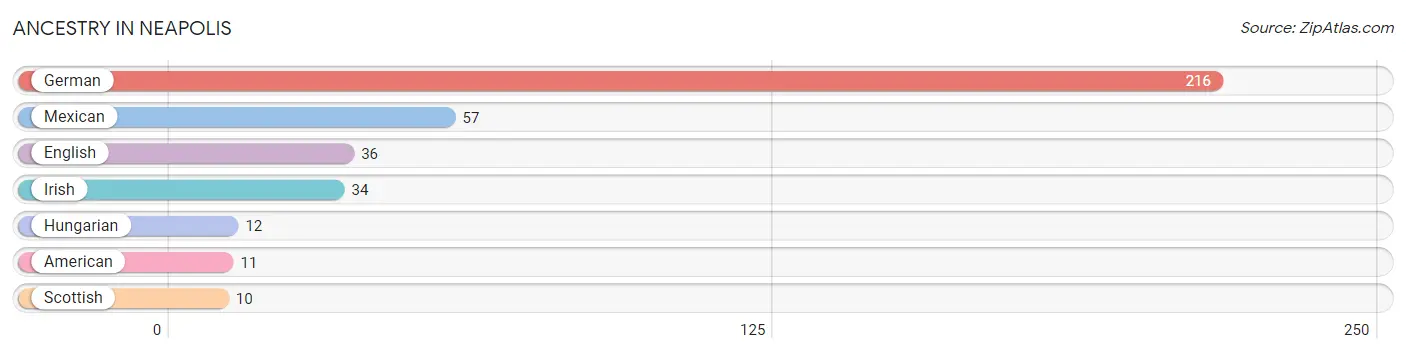
| Ancestry | # Population | % Population |
| American | 11 | 1.8% |
| English | 36 | 5.7% |
| German | 216 | 34.4% |
| Hungarian | 12 | 1.9% |
| Irish | 34 | 5.4% |
| Mexican | 57 | 9.1% |
| Scottish | 10 | 1.6% | View All 7 Rows |
Immigrants in Neapolis
The most numerous immigrant groups reported in Neapolis came from Central America (13 | 2.1%), Latin America (13 | 2.1%), and Mexico (13 | 2.1%), together accounting for 6.2% of all Neapolis residents.
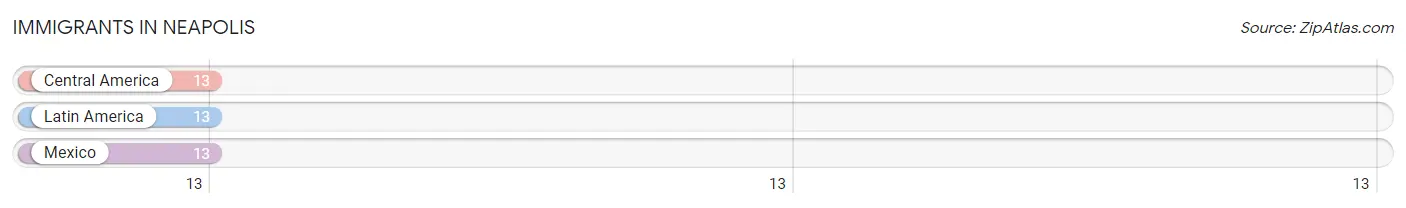
| Immigration Origin | # Population | % Population |
| Central America | 13 | 2.1% |
| Latin America | 13 | 2.1% |
| Mexico | 13 | 2.1% | View All 3 Rows |
Sex and Age in Neapolis
Sex and Age in Neapolis
The most populous age groups in Neapolis are 15 to 19 Years (94 | 29.3%) for men and 75 to 79 Years (92 | 30.1%) for women.
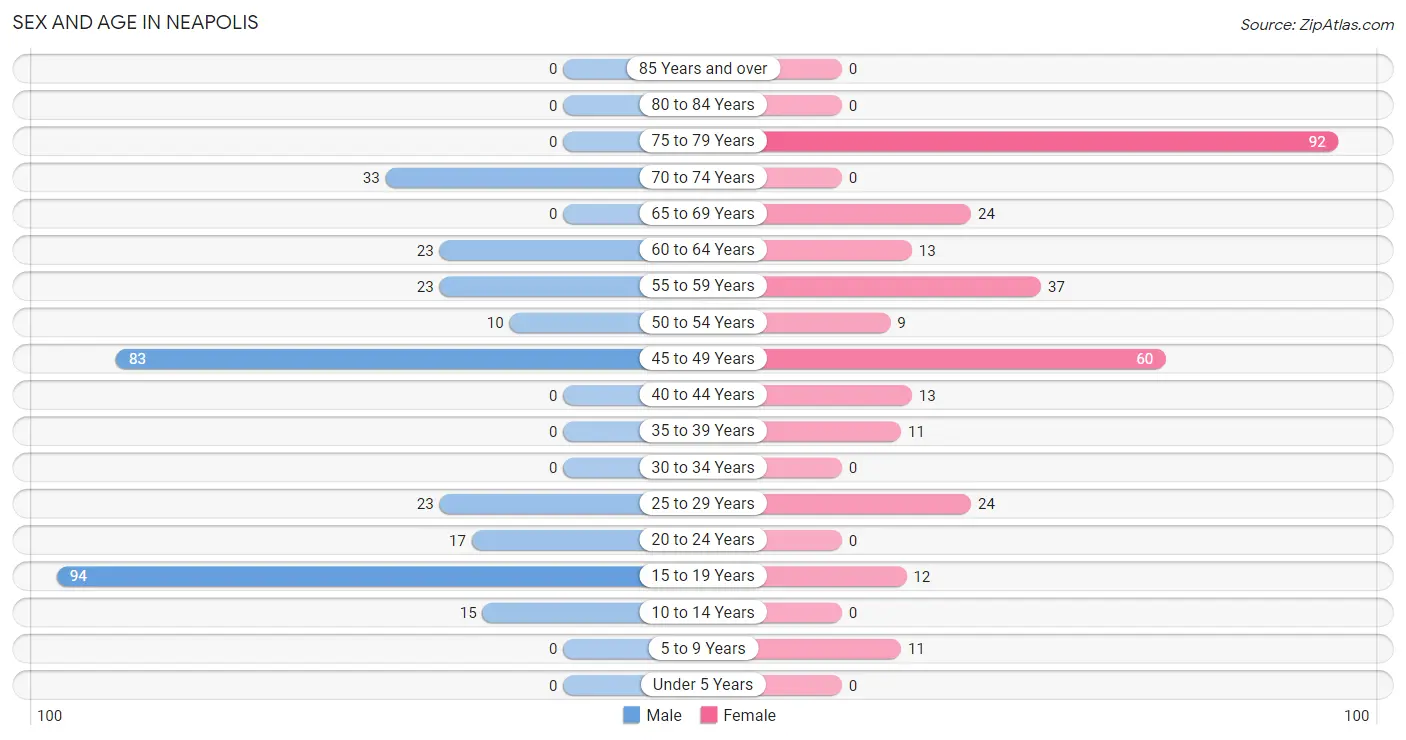
| Age Bracket | Male | Female |
| Under 5 Years | 0 (0.0%) | 0 (0.0%) |
| 5 to 9 Years | 0 (0.0%) | 11 (3.6%) |
| 10 to 14 Years | 15 (4.7%) | 0 (0.0%) |
| 15 to 19 Years | 94 (29.3%) | 12 (3.9%) |
| 20 to 24 Years | 17 (5.3%) | 0 (0.0%) |
| 25 to 29 Years | 23 (7.2%) | 24 (7.8%) |
| 30 to 34 Years | 0 (0.0%) | 0 (0.0%) |
| 35 to 39 Years | 0 (0.0%) | 11 (3.6%) |
| 40 to 44 Years | 0 (0.0%) | 13 (4.3%) |
| 45 to 49 Years | 83 (25.9%) | 60 (19.6%) |
| 50 to 54 Years | 10 (3.1%) | 9 (2.9%) |
| 55 to 59 Years | 23 (7.2%) | 37 (12.1%) |
| 60 to 64 Years | 23 (7.2%) | 13 (4.3%) |
| 65 to 69 Years | 0 (0.0%) | 24 (7.8%) |
| 70 to 74 Years | 33 (10.3%) | 0 (0.0%) |
| 75 to 79 Years | 0 (0.0%) | 92 (30.1%) |
| 80 to 84 Years | 0 (0.0%) | 0 (0.0%) |
| 85 Years and over | 0 (0.0%) | 0 (0.0%) |
| Total | 321 (100.0%) | 306 (100.0%) |
Families and Households in Neapolis
Median Family Size in Neapolis
The median family size in Neapolis is 3.85 persons per family, with married-couple families (135 | 91.2%) accounting for the largest median family size of 3.91 persons per family. On the other hand, single male/father families (4 | 2.7%) represent the smallest median family size with 2.75 persons per family.
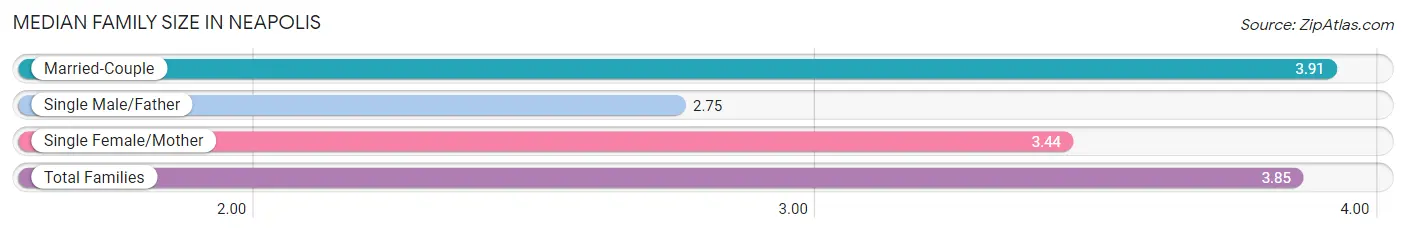
| Family Type | # Families | Family Size |
| Married-Couple | 135 (91.2%) | 3.91 |
| Single Male/Father | 4 (2.7%) | 2.75 |
| Single Female/Mother | 9 (6.1%) | 3.44 |
| Total Families | 148 (100.0%) | 3.85 |
Median Household Size in Neapolis
The median household size in Neapolis is 3.46 persons per household, with married-couple households (135 | 74.6%) accounting for the largest median household size of 3.91 persons per household. non-family households (33 | 18.2%) represent the smallest median household size with 1.73 persons per household.
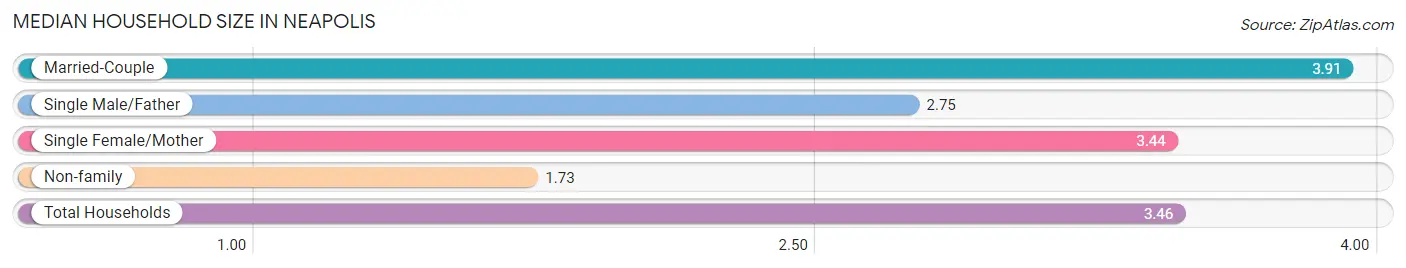
| Household Type | # Households | Household Size |
| Married-Couple | 135 (74.6%) | 3.91 |
| Single Male/Father | 4 (2.2%) | 2.75 |
| Single Female/Mother | 9 (5.0%) | 3.44 |
| Non-family | 33 (18.2%) | 1.73 |
| Total Households | 181 (100.0%) | 3.46 |
Household Size by Marriage Status in Neapolis
Out of a total of 181 households in Neapolis, 148 (81.8%) are family households, while 33 (18.2%) are nonfamily households. The most numerous type of family households are 2-person households, comprising 69, and the most common type of nonfamily households are 2-person households, comprising 23.
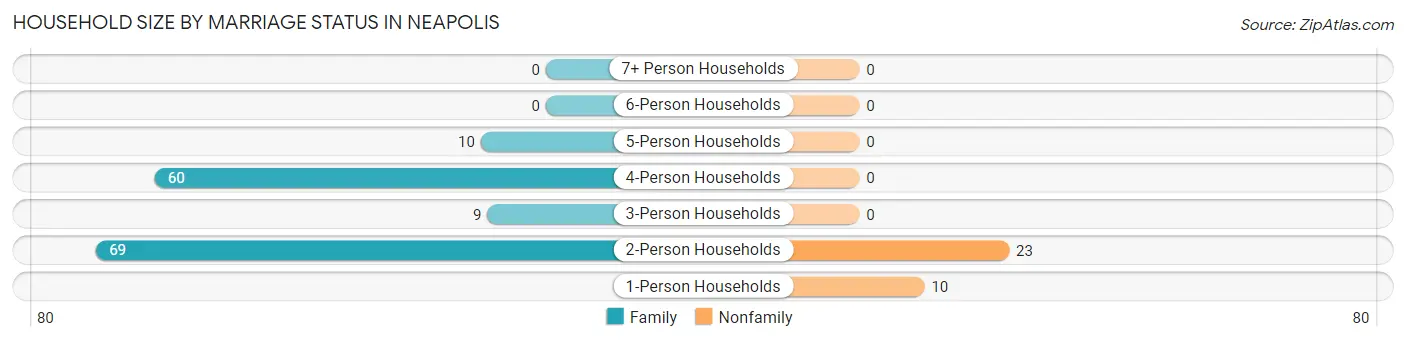
| Household Size | Family Households | Nonfamily Households |
| 1-Person Households | - | 10 (5.5%) |
| 2-Person Households | 69 (38.1%) | 23 (12.7%) |
| 3-Person Households | 9 (5.0%) | 0 (0.0%) |
| 4-Person Households | 60 (33.2%) | 0 (0.0%) |
| 5-Person Households | 10 (5.5%) | 0 (0.0%) |
| 6-Person Households | 0 (0.0%) | 0 (0.0%) |
| 7+ Person Households | 0 (0.0%) | 0 (0.0%) |
| Total | 148 (81.8%) | 33 (18.2%) |
Female Fertility in Neapolis
Fertility by Age in Neapolis
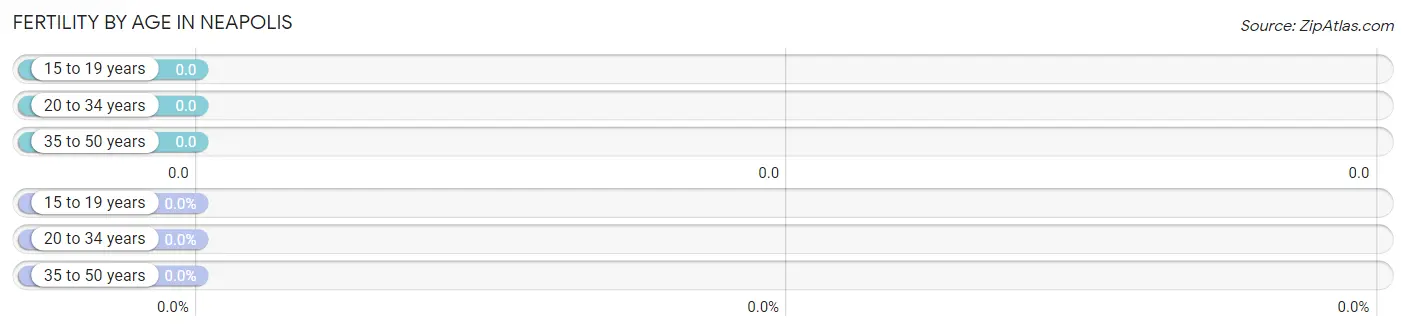
| Age Bracket | Women with Births | Births / 1,000 Women |
| 15 to 19 years | 0 (0.0%) | 0.0 |
| 20 to 34 years | 0 (0.0%) | 0.0 |
| 35 to 50 years | 0 (0.0%) | 0.0 |
| Total | 0 (0.0%) | 0.0 |
Fertility by Age by Marriage Status in Neapolis
| Age Bracket | Married | Unmarried |
| 15 to 19 years | 0 (0.0%) | 0 (0.0%) |
| 20 to 34 years | 0 (0.0%) | 0 (0.0%) |
| 35 to 50 years | 0 (0.0%) | 0 (0.0%) |
| Total | 0 (0.0%) | 0 (0.0%) |
Fertility by Education in Neapolis
| Educational Attainment | Women with Births | Births / 1,000 Women |
| Less than High School | 0 (0.0%) | 0.0 |
| High School Diploma | 0 (0.0%) | 0.0 |
| College or Associate's Degree | 0 (0.0%) | 0.0 |
| Bachelor's Degree | 0 (0.0%) | 0.0 |
| Graduate Degree | 0 (0.0%) | 0.0 |
| Total | 0 (0.0%) | 0.0 |
Fertility by Education by Marriage Status in Neapolis
| Educational Attainment | Married | Unmarried |
| Less than High School | 0 (0.0%) | 0 (0.0%) |
| High School Diploma | 0 (0.0%) | 0 (0.0%) |
| College or Associate's Degree | 0 (0.0%) | 0 (0.0%) |
| Bachelor's Degree | 0 (0.0%) | 0 (0.0%) |
| Graduate Degree | 0 (0.0%) | 0 (0.0%) |
| Total | 0 (0.0%) | 0 (0.0%) |
Employment Characteristics in Neapolis
Employment by Class of Employer in Neapolis
Among the 478 employed individuals in Neapolis, private company employees (449 | 93.9%), self-employed (not incorporated) (19 | 4.0%), and local government employees (10 | 2.1%) make up the most common classes of employment.
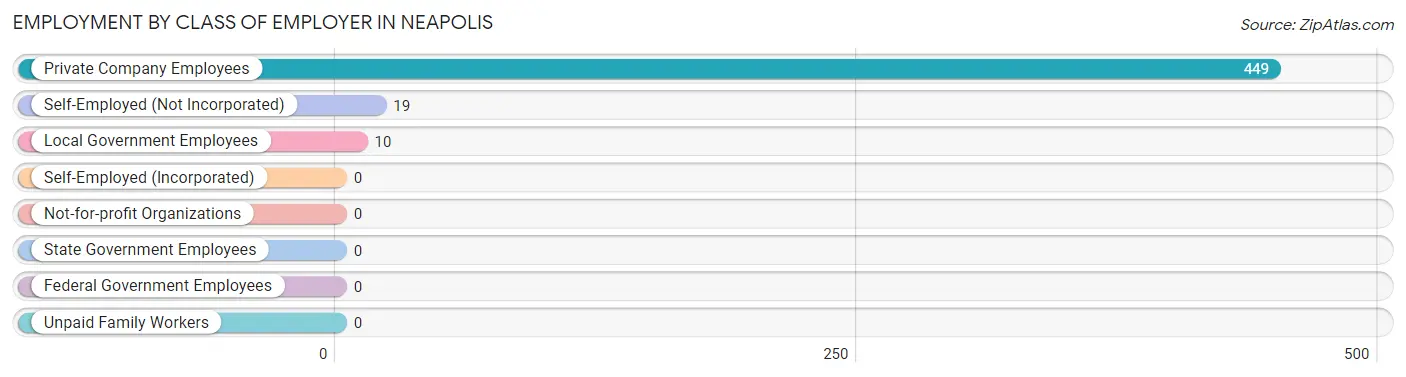
| Employer Class | # Employees | % Employees |
| Private Company Employees | 449 | 93.9% |
| Self-Employed (Incorporated) | 0 | 0.0% |
| Self-Employed (Not Incorporated) | 19 | 4.0% |
| Not-for-profit Organizations | 0 | 0.0% |
| Local Government Employees | 10 | 2.1% |
| State Government Employees | 0 | 0.0% |
| Federal Government Employees | 0 | 0.0% |
| Unpaid Family Workers | 0 | 0.0% |
| Total | 478 | 100.0% |
Employment Status by Age in Neapolis
According to the labor force statistics for Neapolis, out of the total population over 16 years of age (601), 89.5% or 538 individuals are in the labor force, with 11.2% or 60 of them unemployed. The age group with the highest labor force participation rate is 16 to 19 years, with 100.0% or 106 individuals in the labor force. Within the labor force, the 45 to 54 years age range has the highest percentage of unemployed individuals, with 37.0% or 60 of them being unemployed.
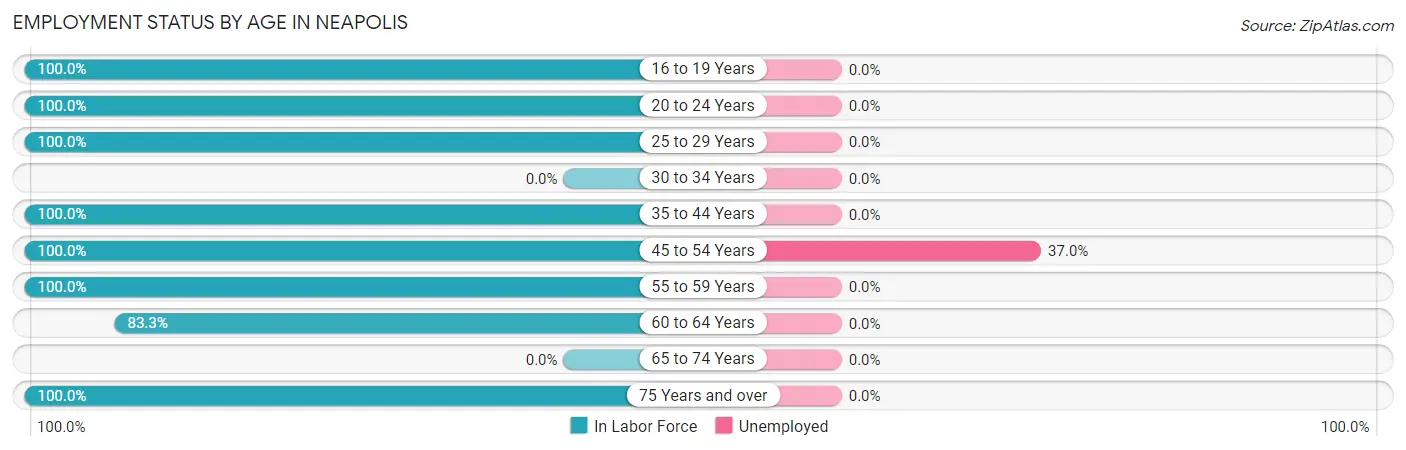
| Age Bracket | In Labor Force | Unemployed |
| 16 to 19 Years | 106 (100.0%) | 0 (0.0%) |
| 20 to 24 Years | 17 (100.0%) | 0 (0.0%) |
| 25 to 29 Years | 47 (100.0%) | 0 (0.0%) |
| 30 to 34 Years | 0 (0.0%) | 0 (0.0%) |
| 35 to 44 Years | 24 (100.0%) | 0 (0.0%) |
| 45 to 54 Years | 162 (100.0%) | 60 (37.0%) |
| 55 to 59 Years | 60 (100.0%) | 0 (0.0%) |
| 60 to 64 Years | 30 (83.3%) | 0 (0.0%) |
| 65 to 74 Years | 0 (0.0%) | 0 (0.0%) |
| 75 Years and over | 92 (100.0%) | 0 (0.0%) |
| Total | 538 (89.5%) | 60 (11.2%) |
Employment Status by Educational Attainment in Neapolis
According to labor force statistics for Neapolis, 98.2% of individuals (323) out of the total population between 25 and 64 years of age (329) are in the labor force, with 18.6% or 60 of them being unemployed. The group with the highest labor force participation rate are those with the educational attainment of less than high school, with 100.0% or 34 individuals in the labor force. Within the labor force, individuals with college / associate degree education have the highest percentage of unemployment, with 69.0% or 60 of them being unemployed.
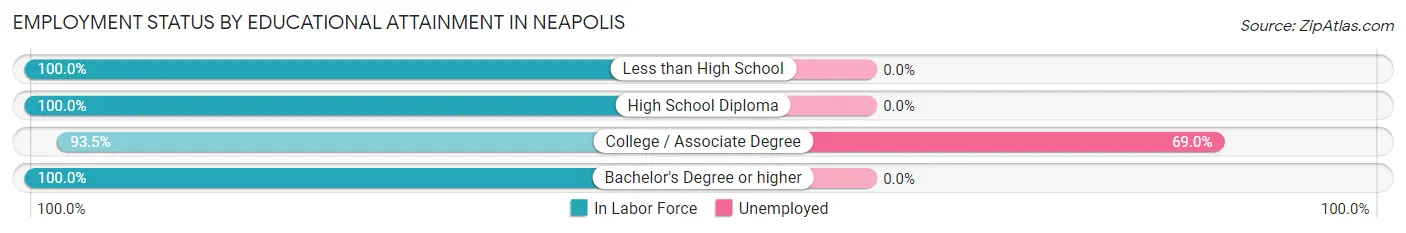
| Educational Attainment | In Labor Force | Unemployed |
| Less than High School | 34 (100.0%) | 0 (0.0%) |
| High School Diploma | 195 (100.0%) | 0 (0.0%) |
| College / Associate Degree | 87 (93.5%) | 64 (69.0%) |
| Bachelor's Degree or higher | 7 (100.0%) | 0 (0.0%) |
| Total | 323 (98.2%) | 61 (18.6%) |
Employment Occupations by Sex in Neapolis
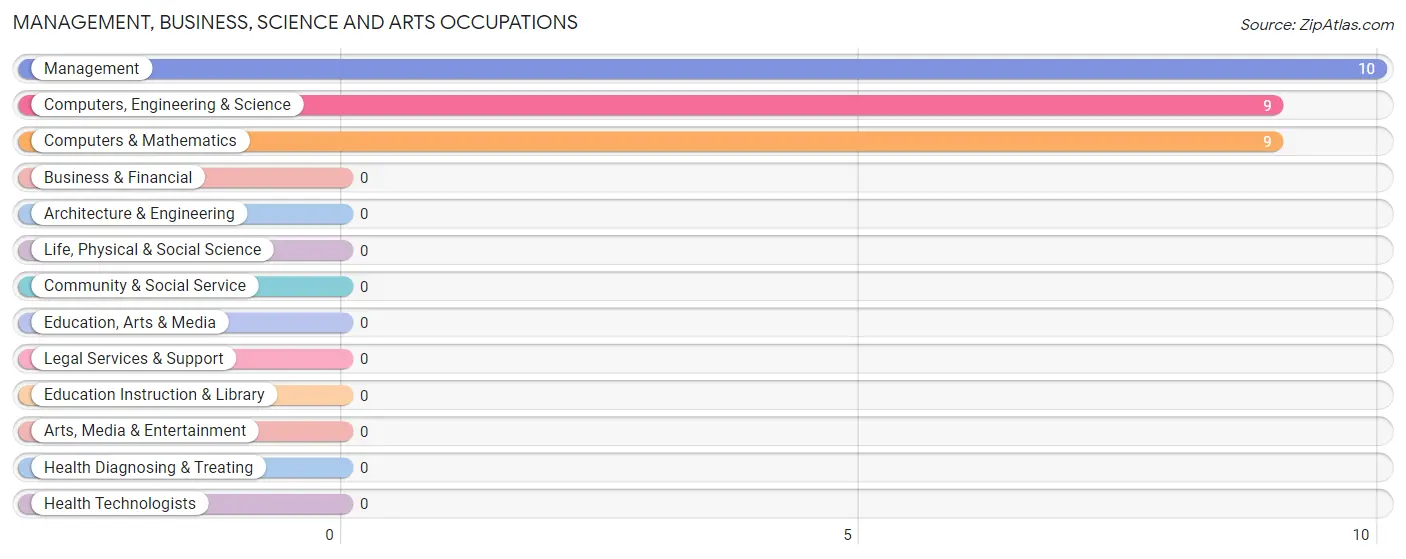
Management, Business, Science and Arts Occupations
The most common Management, Business, Science and Arts occupations in Neapolis are Management (10 | 2.1%), Computers, Engineering & Science (9 | 1.9%), and Computers & Mathematics (9 | 1.9%).
Management, Business, Science and Arts Occupations by Sex
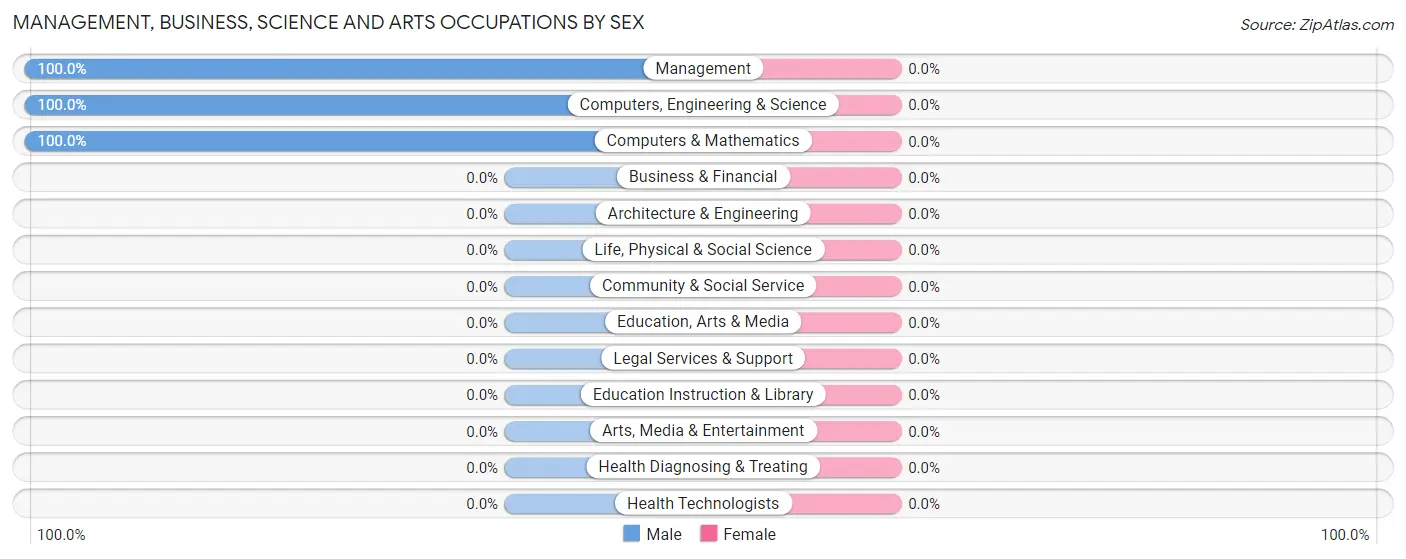
| Occupation | Male | Female |
| Management | 10 (100.0%) | 0 (0.0%) |
| Business & Financial | 0 (0.0%) | 0 (0.0%) |
| Computers, Engineering & Science | 9 (100.0%) | 0 (0.0%) |
| Computers & Mathematics | 9 (100.0%) | 0 (0.0%) |
| Architecture & Engineering | 0 (0.0%) | 0 (0.0%) |
| Life, Physical & Social Science | 0 (0.0%) | 0 (0.0%) |
| Community & Social Service | 0 (0.0%) | 0 (0.0%) |
| Education, Arts & Media | 0 (0.0%) | 0 (0.0%) |
| Legal Services & Support | 0 (0.0%) | 0 (0.0%) |
| Education Instruction & Library | 0 (0.0%) | 0 (0.0%) |
| Arts, Media & Entertainment | 0 (0.0%) | 0 (0.0%) |
| Health Diagnosing & Treating | 0 (0.0%) | 0 (0.0%) |
| Health Technologists | 0 (0.0%) | 0 (0.0%) |
| Total (Category) | 19 (100.0%) | 0 (0.0%) |
| Total (Overall) | 273 (57.1%) | 205 (42.9%) |
Services Occupations
The most common Services occupations in Neapolis are Food Preparation & Serving (116 | 24.3%), and Cleaning & Maintenance (41 | 8.6%).
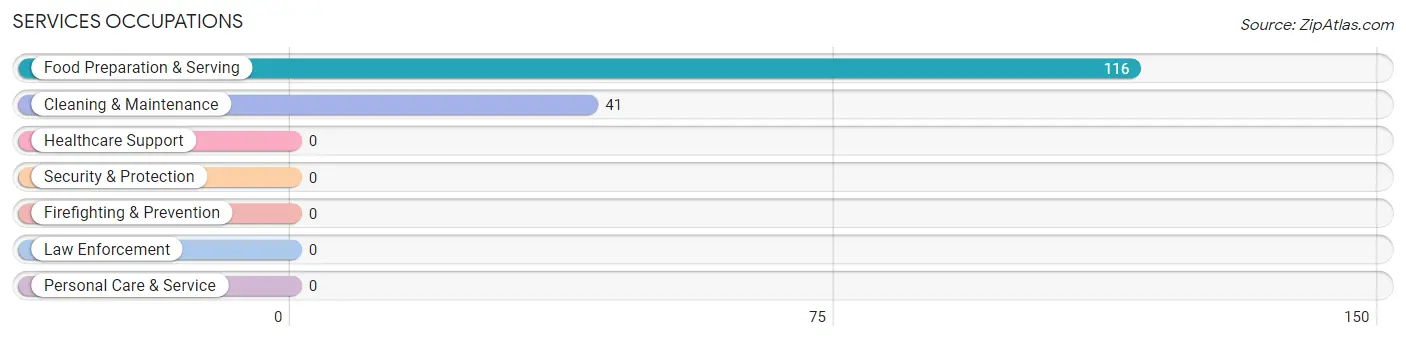
Services Occupations by Sex
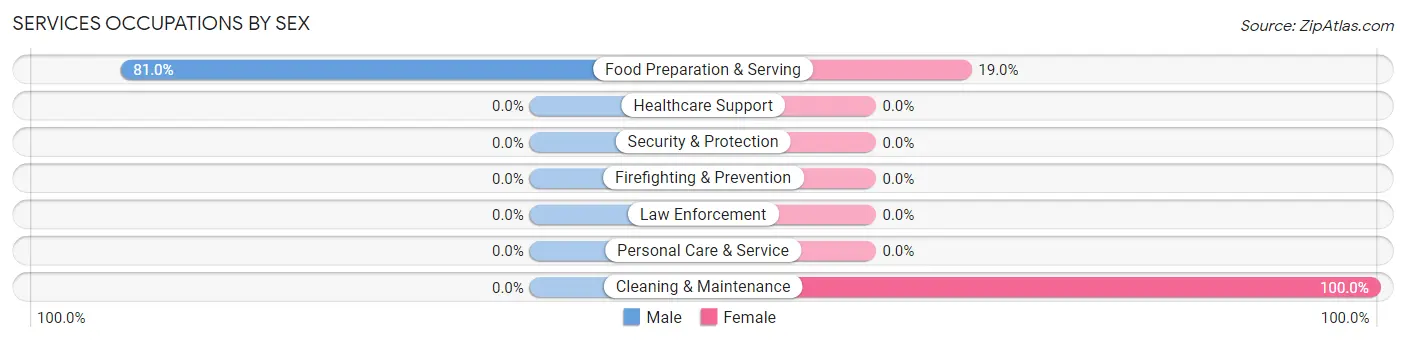
| Occupation | Male | Female |
| Healthcare Support | 0 (0.0%) | 0 (0.0%) |
| Security & Protection | 0 (0.0%) | 0 (0.0%) |
| Firefighting & Prevention | 0 (0.0%) | 0 (0.0%) |
| Law Enforcement | 0 (0.0%) | 0 (0.0%) |
| Food Preparation & Serving | 94 (81.0%) | 22 (19.0%) |
| Cleaning & Maintenance | 0 (0.0%) | 41 (100.0%) |
| Personal Care & Service | 0 (0.0%) | 0 (0.0%) |
| Total (Category) | 94 (59.9%) | 63 (40.1%) |
| Total (Overall) | 273 (57.1%) | 205 (42.9%) |
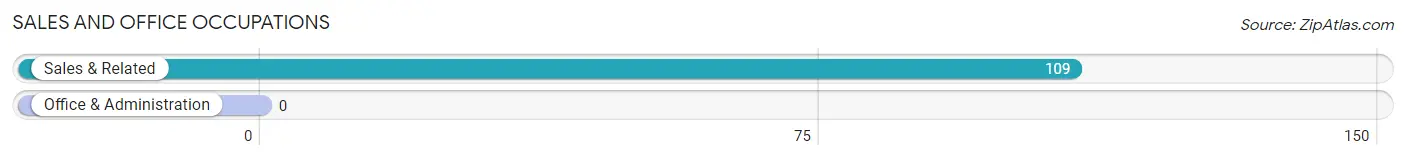
Sales and Office Occupations
The most common Sales and Office occupations in Neapolis are , and Sales & Related (109 | 22.8%).
Sales and Office Occupations by Sex
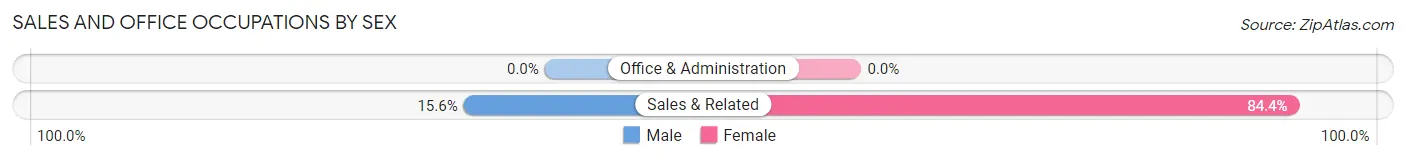
| Occupation | Male | Female |
| Sales & Related | 17 (15.6%) | 92 (84.4%) |
| Office & Administration | 0 (0.0%) | 0 (0.0%) |
| Total (Category) | 17 (15.6%) | 92 (84.4%) |
| Total (Overall) | 273 (57.1%) | 205 (42.9%) |
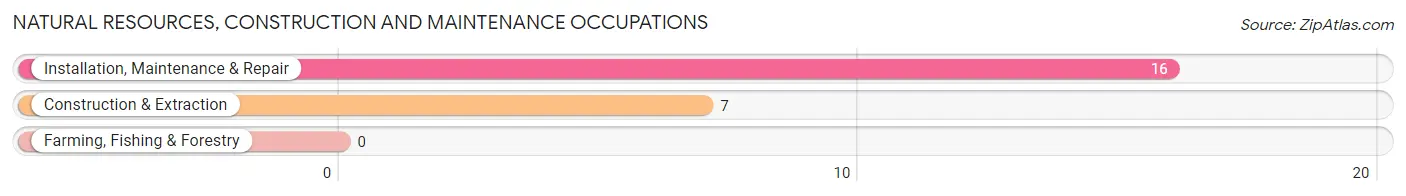
Natural Resources, Construction and Maintenance Occupations
The most common Natural Resources, Construction and Maintenance occupations in Neapolis are Installation, Maintenance & Repair (16 | 3.4%), and Construction & Extraction (7 | 1.5%).
Natural Resources, Construction and Maintenance Occupations by Sex
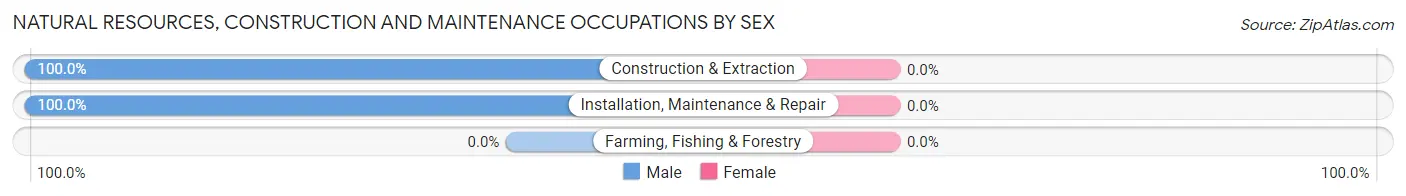
| Occupation | Male | Female |
| Farming, Fishing & Forestry | 0 (0.0%) | 0 (0.0%) |
| Construction & Extraction | 7 (100.0%) | 0 (0.0%) |
| Installation, Maintenance & Repair | 16 (100.0%) | 0 (0.0%) |
| Total (Category) | 23 (100.0%) | 0 (0.0%) |
| Total (Overall) | 273 (57.1%) | 205 (42.9%) |
Production, Transportation and Moving Occupations
The most common Production, Transportation and Moving occupations in Neapolis are Material Moving (94 | 19.7%), Production (56 | 11.7%), and Transportation (20 | 4.2%).
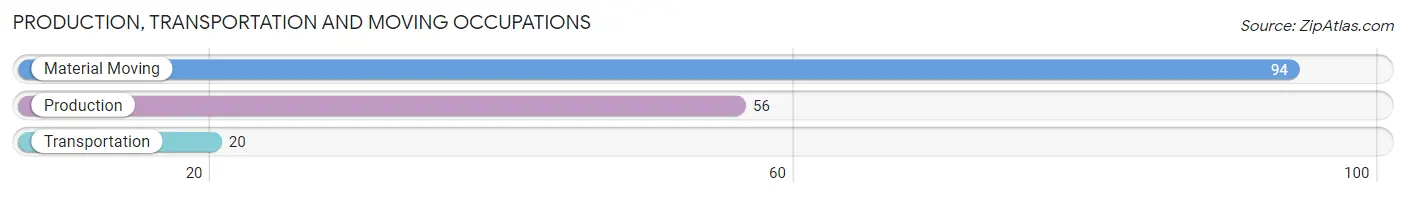
Production, Transportation and Moving Occupations by Sex
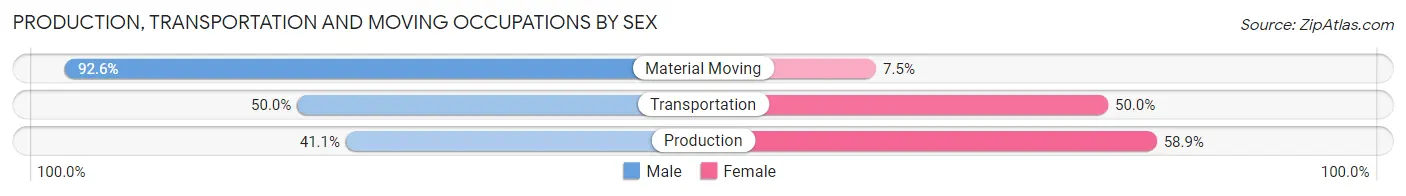
| Occupation | Male | Female |
| Production | 23 (41.1%) | 33 (58.9%) |
| Transportation | 10 (50.0%) | 10 (50.0%) |
| Material Moving | 87 (92.5%) | 7 (7.4%) |
| Total (Category) | 120 (70.6%) | 50 (29.4%) |
| Total (Overall) | 273 (57.1%) | 205 (42.9%) |
Employment Industries by Sex in Neapolis
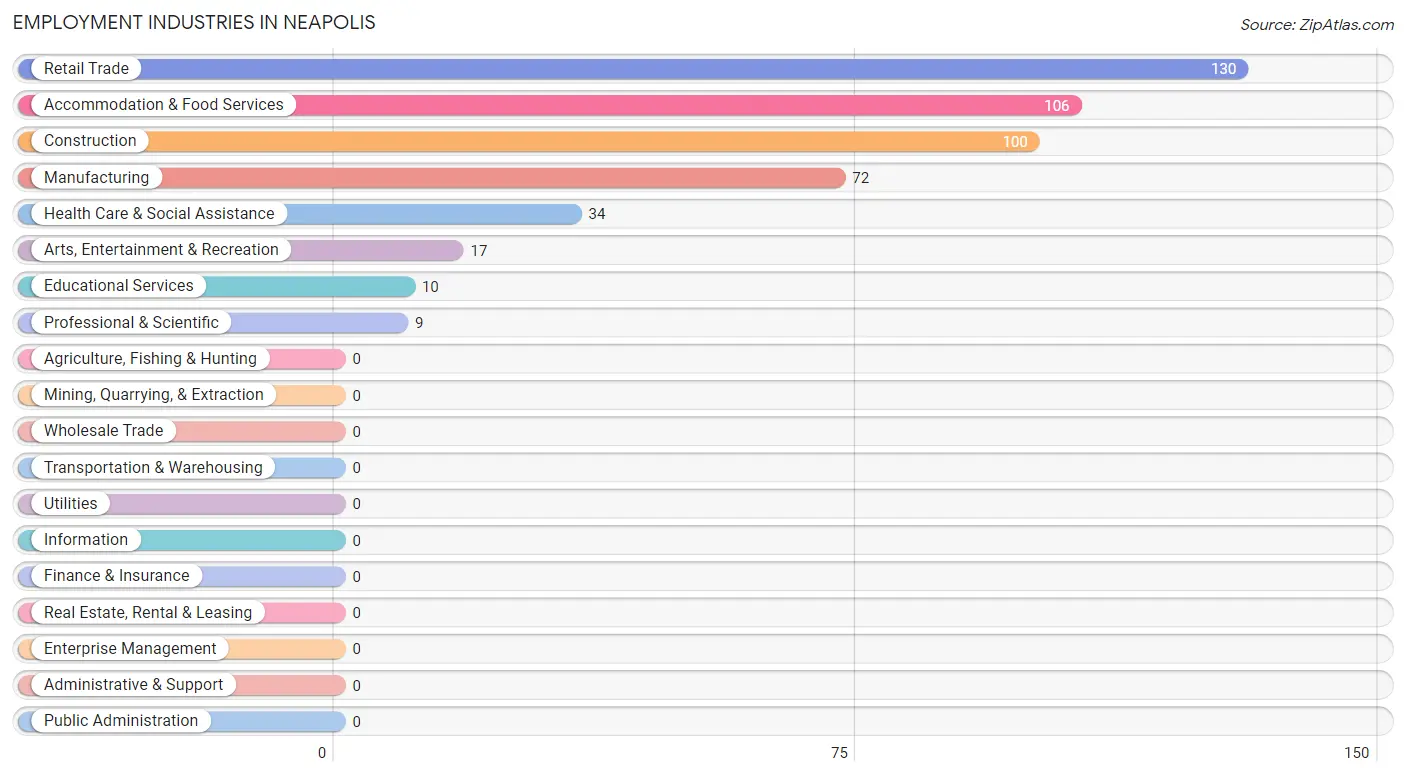
Employment Industries in Neapolis
The major employment industries in Neapolis include Retail Trade (130 | 27.2%), Accommodation & Food Services (106 | 22.2%), Construction (100 | 20.9%), Manufacturing (72 | 15.1%), and Health Care & Social Assistance (34 | 7.1%).
Employment Industries by Sex in Neapolis
The Neapolis industries that see more men than women are Construction (100.0%), Professional & Scientific (100.0%), and Accommodation & Food Services (88.7%), whereas the industries that tend to have a higher number of women are Educational Services (100.0%), Health Care & Social Assistance (100.0%), and Arts, Entertainment & Recreation (100.0%).
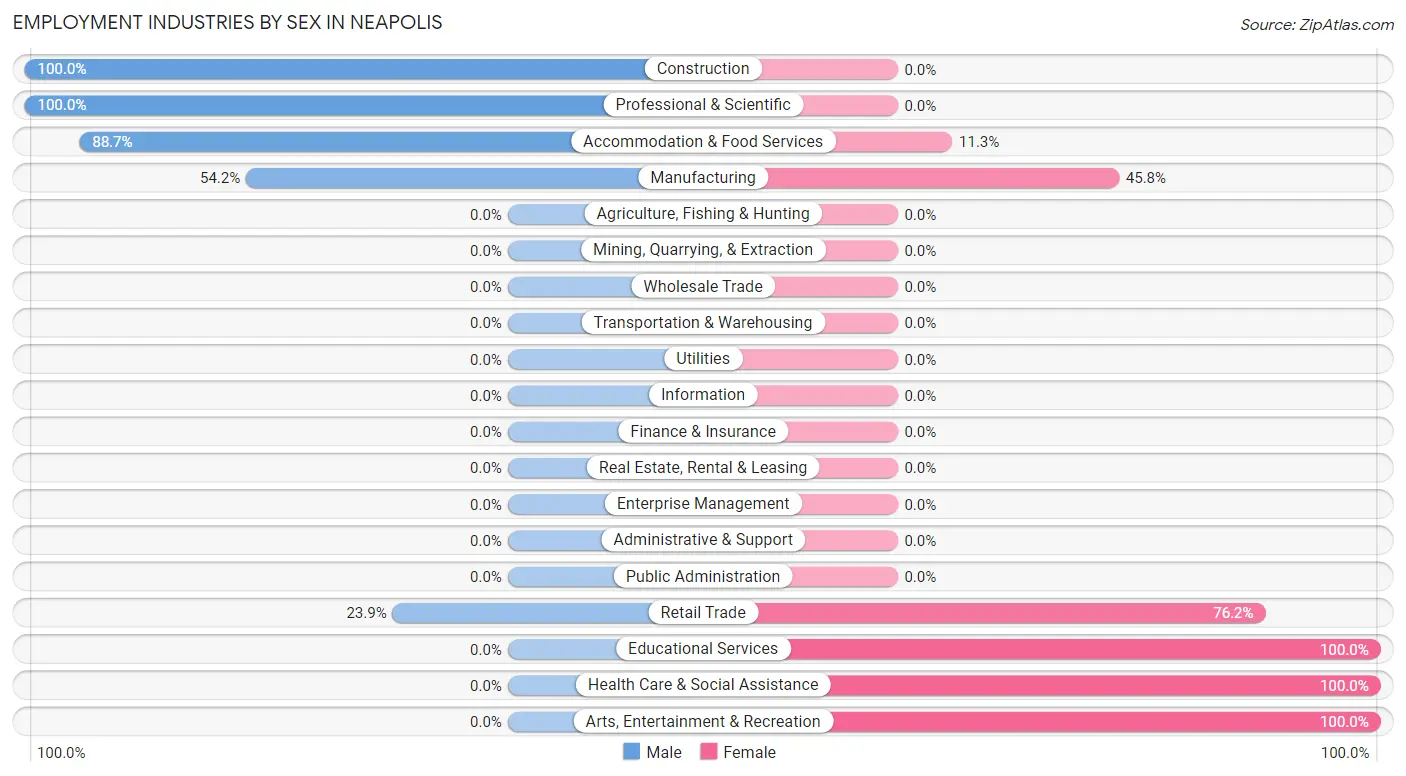
| Industry | Male | Female |
| Agriculture, Fishing & Hunting | 0 (0.0%) | 0 (0.0%) |
| Mining, Quarrying, & Extraction | 0 (0.0%) | 0 (0.0%) |
| Construction | 100 (100.0%) | 0 (0.0%) |
| Manufacturing | 39 (54.2%) | 33 (45.8%) |
| Wholesale Trade | 0 (0.0%) | 0 (0.0%) |
| Retail Trade | 31 (23.8%) | 99 (76.1%) |
| Transportation & Warehousing | 0 (0.0%) | 0 (0.0%) |
| Utilities | 0 (0.0%) | 0 (0.0%) |
| Information | 0 (0.0%) | 0 (0.0%) |
| Finance & Insurance | 0 (0.0%) | 0 (0.0%) |
| Real Estate, Rental & Leasing | 0 (0.0%) | 0 (0.0%) |
| Professional & Scientific | 9 (100.0%) | 0 (0.0%) |
| Enterprise Management | 0 (0.0%) | 0 (0.0%) |
| Administrative & Support | 0 (0.0%) | 0 (0.0%) |
| Educational Services | 0 (0.0%) | 10 (100.0%) |
| Health Care & Social Assistance | 0 (0.0%) | 34 (100.0%) |
| Arts, Entertainment & Recreation | 0 (0.0%) | 17 (100.0%) |
| Accommodation & Food Services | 94 (88.7%) | 12 (11.3%) |
| Public Administration | 0 (0.0%) | 0 (0.0%) |
| Total | 273 (57.1%) | 205 (42.9%) |
Education in Neapolis
School Enrollment in Neapolis
The most common levels of schooling among the 132 students in Neapolis are high school (106 | 80.3%), middle school (15 | 11.4%), and elementary school (11 | 8.3%).
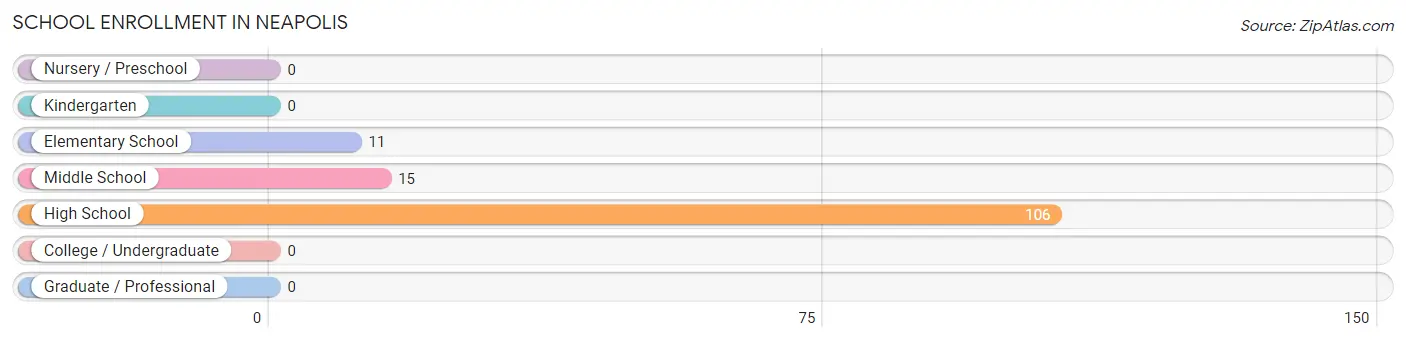
| School Level | # Students | % Students |
| Nursery / Preschool | 0 | 0.0% |
| Kindergarten | 0 | 0.0% |
| Elementary School | 11 | 8.3% |
| Middle School | 15 | 11.4% |
| High School | 106 | 80.3% |
| College / Undergraduate | 0 | 0.0% |
| Graduate / Professional | 0 | 0.0% |
| Total | 132 | 100.0% |
School Enrollment by Age by Funding Source in Neapolis
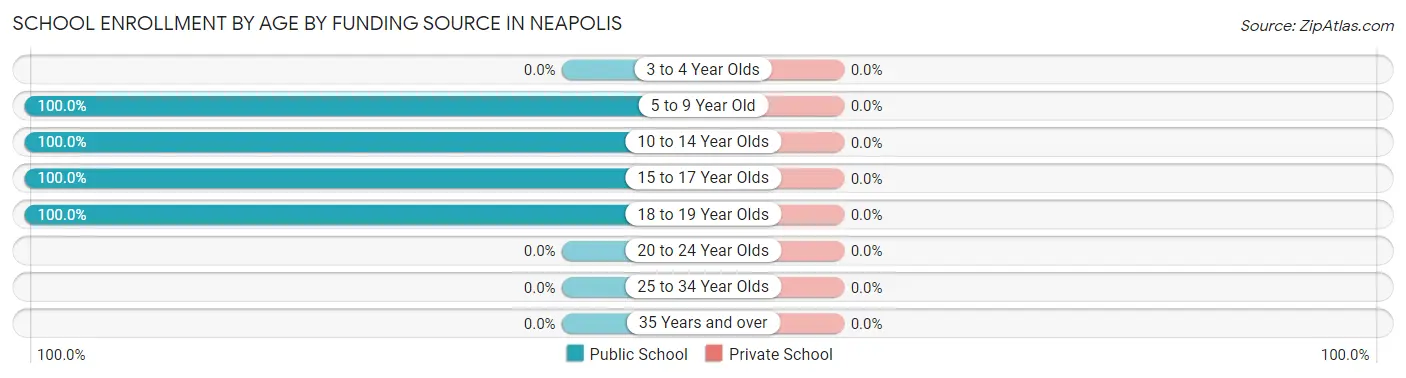
| Age Bracket | Public School | Private School |
| 3 to 4 Year Olds | 0 (0.0%) | 0 (0.0%) |
| 5 to 9 Year Old | 11 (100.0%) | 0 (0.0%) |
| 10 to 14 Year Olds | 15 (100.0%) | 0 (0.0%) |
| 15 to 17 Year Olds | 12 (100.0%) | 0 (0.0%) |
| 18 to 19 Year Olds | 94 (100.0%) | 0 (0.0%) |
| 20 to 24 Year Olds | 0 (0.0%) | 0 (0.0%) |
| 25 to 34 Year Olds | 0 (0.0%) | 0 (0.0%) |
| 35 Years and over | 0 (0.0%) | 0 (0.0%) |
| Total | 132 (100.0%) | 0 (0.0%) |
Educational Attainment by Field of Study in Neapolis
Business (10 | 58.8%), and liberal arts & history (7 | 41.2%) are the most common fields of study among 17 individuals in Neapolis who have obtained a bachelor's degree or higher.
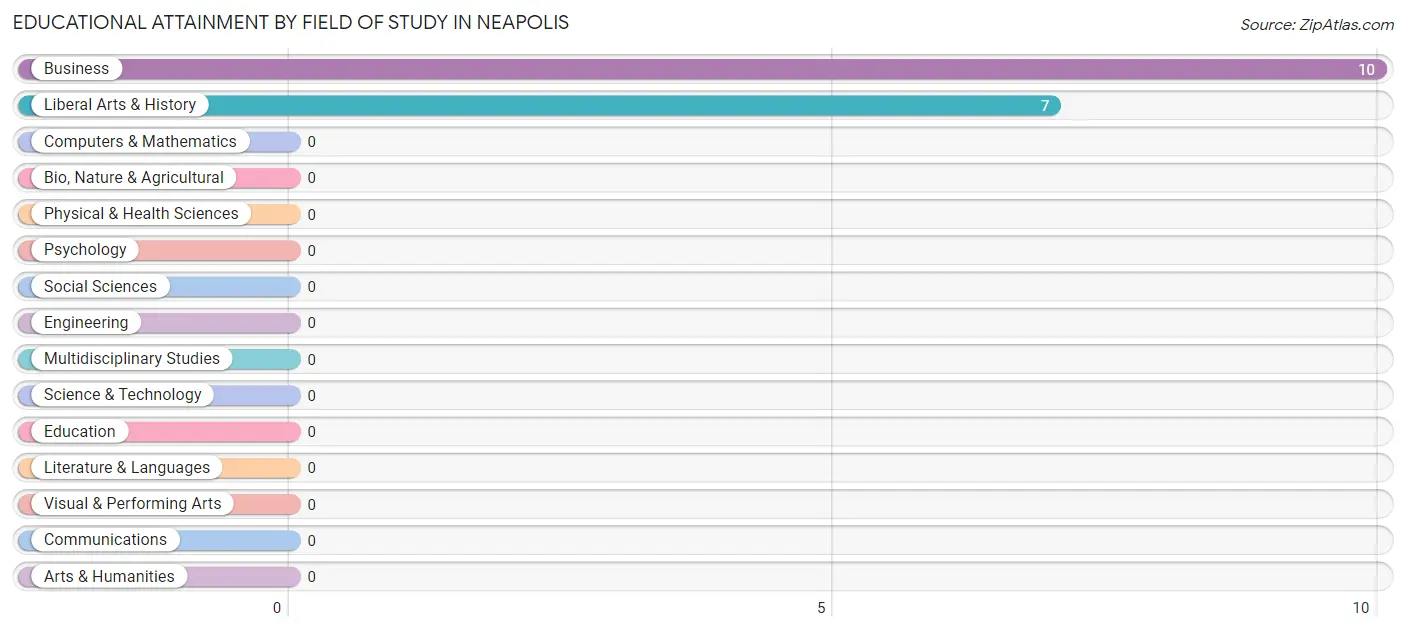
| Field of Study | # Graduates | % Graduates |
| Computers & Mathematics | 0 | 0.0% |
| Bio, Nature & Agricultural | 0 | 0.0% |
| Physical & Health Sciences | 0 | 0.0% |
| Psychology | 0 | 0.0% |
| Social Sciences | 0 | 0.0% |
| Engineering | 0 | 0.0% |
| Multidisciplinary Studies | 0 | 0.0% |
| Science & Technology | 0 | 0.0% |
| Business | 10 | 58.8% |
| Education | 0 | 0.0% |
| Literature & Languages | 0 | 0.0% |
| Liberal Arts & History | 7 | 41.2% |
| Visual & Performing Arts | 0 | 0.0% |
| Communications | 0 | 0.0% |
| Arts & Humanities | 0 | 0.0% |
| Total | 17 | 100.0% |
Transportation & Commute in Neapolis
Vehicle Availability by Sex in Neapolis
The most prevalent vehicle ownership categories in Neapolis are males with 4 vehicles (177, accounting for 64.8%) and females with 4 vehicles (92, making up 86.3%).
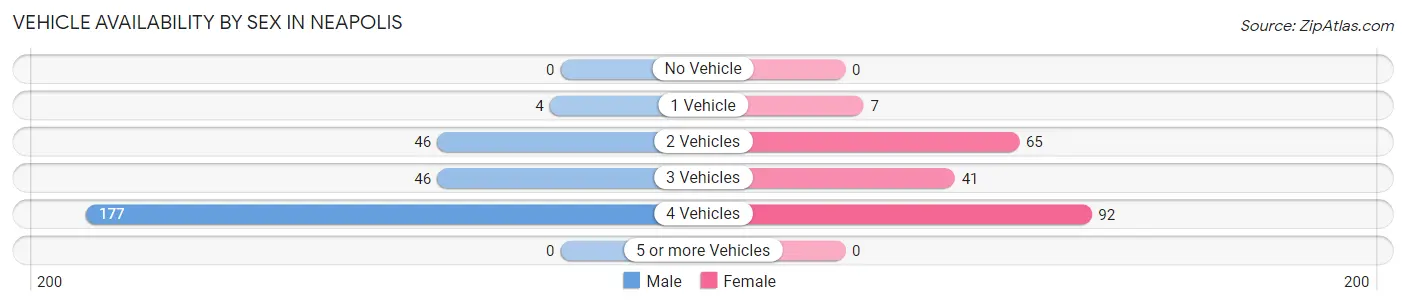
| Vehicles Available | Male | Female |
| No Vehicle | 0 (0.0%) | 0 (0.0%) |
| 1 Vehicle | 4 (1.5%) | 7 (3.4%) |
| 2 Vehicles | 46 (16.9%) | 65 (31.7%) |
| 3 Vehicles | 46 (16.9%) | 41 (20.0%) |
| 4 Vehicles | 177 (64.8%) | 92 (44.9%) |
| 5 or more Vehicles | 0 (0.0%) | 0 (0.0%) |
| Total | 273 (100.0%) | 205 (100.0%) |
Commute Time in Neapolis
The most frequently occuring commute durations in Neapolis are 15 to 19 minutes (198 commuters, 41.4%), 90 or more minutes (83 commuters, 17.4%), and 20 to 24 minutes (49 commuters, 10.2%).
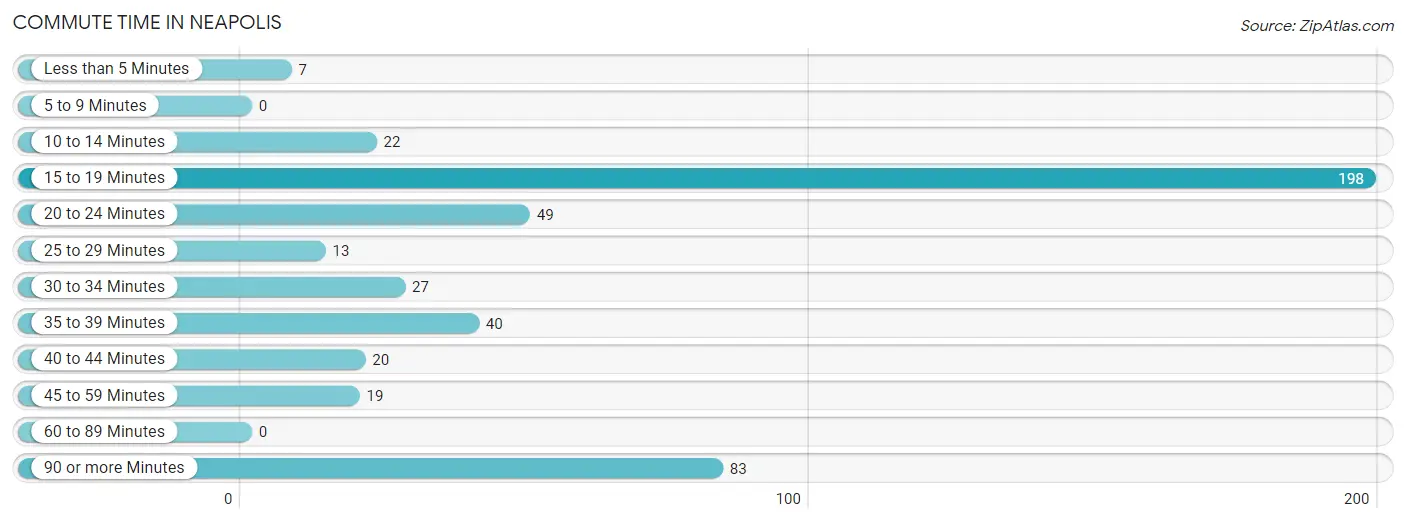
| Commute Time | # Commuters | % Commuters |
| Less than 5 Minutes | 7 | 1.5% |
| 5 to 9 Minutes | 0 | 0.0% |
| 10 to 14 Minutes | 22 | 4.6% |
| 15 to 19 Minutes | 198 | 41.4% |
| 20 to 24 Minutes | 49 | 10.2% |
| 25 to 29 Minutes | 13 | 2.7% |
| 30 to 34 Minutes | 27 | 5.7% |
| 35 to 39 Minutes | 40 | 8.4% |
| 40 to 44 Minutes | 20 | 4.2% |
| 45 to 59 Minutes | 19 | 4.0% |
| 60 to 89 Minutes | 0 | 0.0% |
| 90 or more Minutes | 83 | 17.4% |
Commute Time by Sex in Neapolis
The most common commute times in Neapolis are 15 to 19 minutes (94 commuters, 34.4%) for males and 15 to 19 minutes (104 commuters, 50.7%) for females.
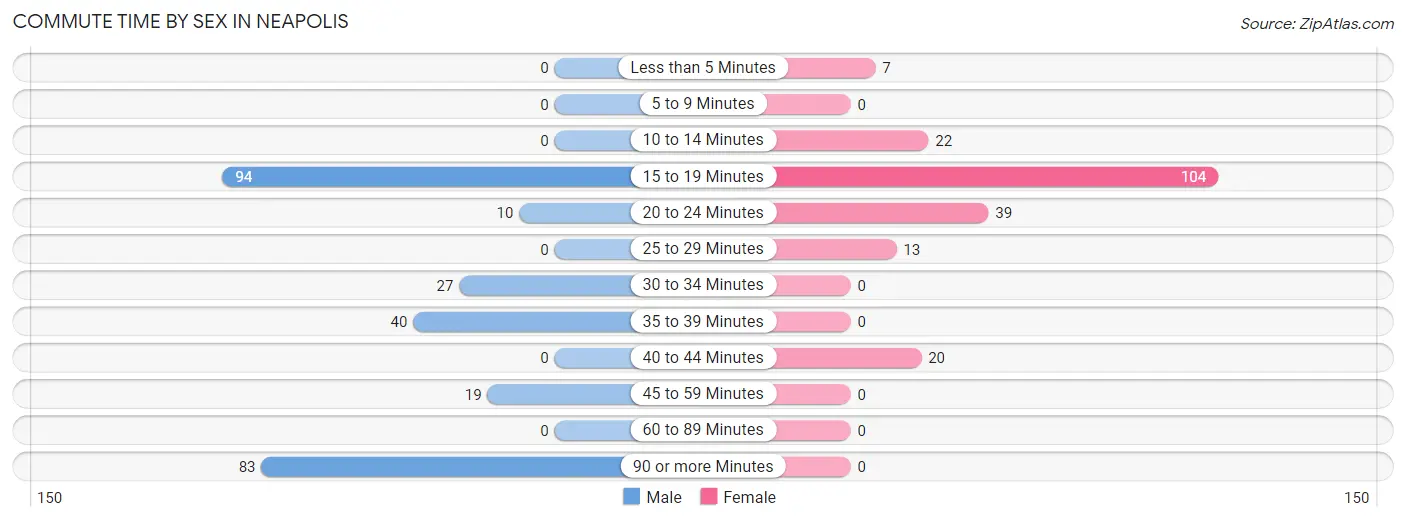
| Commute Time | Male | Female |
| Less than 5 Minutes | 0 (0.0%) | 7 (3.4%) |
| 5 to 9 Minutes | 0 (0.0%) | 0 (0.0%) |
| 10 to 14 Minutes | 0 (0.0%) | 22 (10.7%) |
| 15 to 19 Minutes | 94 (34.4%) | 104 (50.7%) |
| 20 to 24 Minutes | 10 (3.7%) | 39 (19.0%) |
| 25 to 29 Minutes | 0 (0.0%) | 13 (6.3%) |
| 30 to 34 Minutes | 27 (9.9%) | 0 (0.0%) |
| 35 to 39 Minutes | 40 (14.6%) | 0 (0.0%) |
| 40 to 44 Minutes | 0 (0.0%) | 20 (9.8%) |
| 45 to 59 Minutes | 19 (7.0%) | 0 (0.0%) |
| 60 to 89 Minutes | 0 (0.0%) | 0 (0.0%) |
| 90 or more Minutes | 83 (30.4%) | 0 (0.0%) |
Time of Departure to Work by Sex in Neapolis
The most frequent times of departure to work in Neapolis are 4:00 PM to 11:59 PM (94, 34.4%) for males and 4:00 PM to 11:59 PM (92, 44.9%) for females.
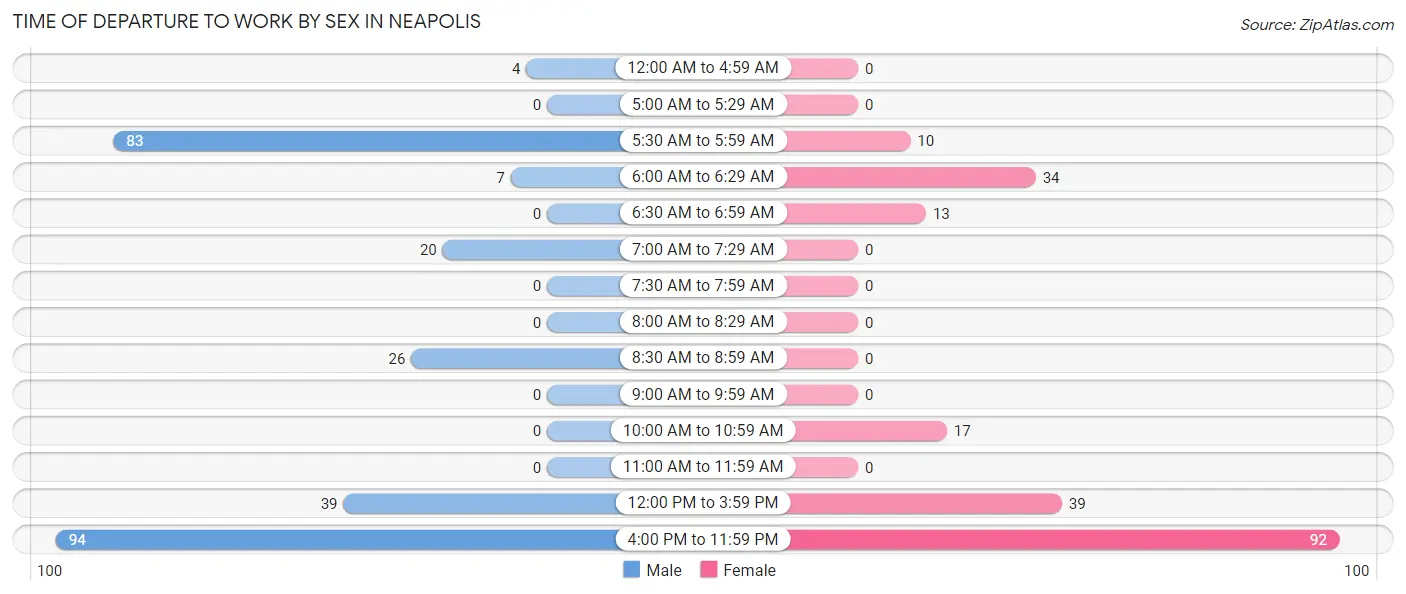
| Time of Departure | Male | Female |
| 12:00 AM to 4:59 AM | 4 (1.5%) | 0 (0.0%) |
| 5:00 AM to 5:29 AM | 0 (0.0%) | 0 (0.0%) |
| 5:30 AM to 5:59 AM | 83 (30.4%) | 10 (4.9%) |
| 6:00 AM to 6:29 AM | 7 (2.6%) | 34 (16.6%) |
| 6:30 AM to 6:59 AM | 0 (0.0%) | 13 (6.3%) |
| 7:00 AM to 7:29 AM | 20 (7.3%) | 0 (0.0%) |
| 7:30 AM to 7:59 AM | 0 (0.0%) | 0 (0.0%) |
| 8:00 AM to 8:29 AM | 0 (0.0%) | 0 (0.0%) |
| 8:30 AM to 8:59 AM | 26 (9.5%) | 0 (0.0%) |
| 9:00 AM to 9:59 AM | 0 (0.0%) | 0 (0.0%) |
| 10:00 AM to 10:59 AM | 0 (0.0%) | 17 (8.3%) |
| 11:00 AM to 11:59 AM | 0 (0.0%) | 0 (0.0%) |
| 12:00 PM to 3:59 PM | 39 (14.3%) | 39 (19.0%) |
| 4:00 PM to 11:59 PM | 94 (34.4%) | 92 (44.9%) |
| Total | 273 (100.0%) | 205 (100.0%) |
Housing Occupancy in Neapolis
Occupancy by Ownership in Neapolis
Of the total 181 dwellings in Neapolis, owner-occupied units account for 181 (100.0%), while renter-occupied units make up 0 (0.0%).
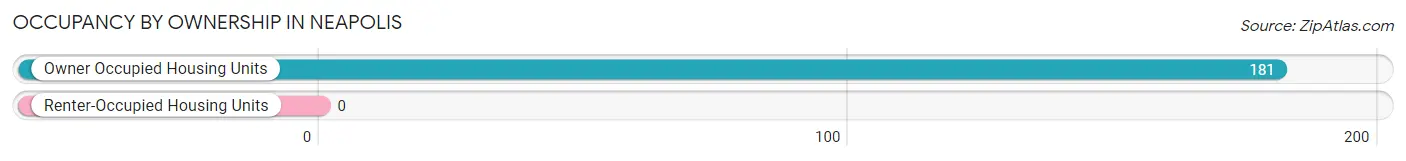
| Occupancy | # Housing Units | % Housing Units |
| Owner Occupied Housing Units | 181 | 100.0% |
| Renter-Occupied Housing Units | 0 | 0.0% |
| Total Occupied Housing Units | 181 | 100.0% |
Occupancy by Household Size in Neapolis
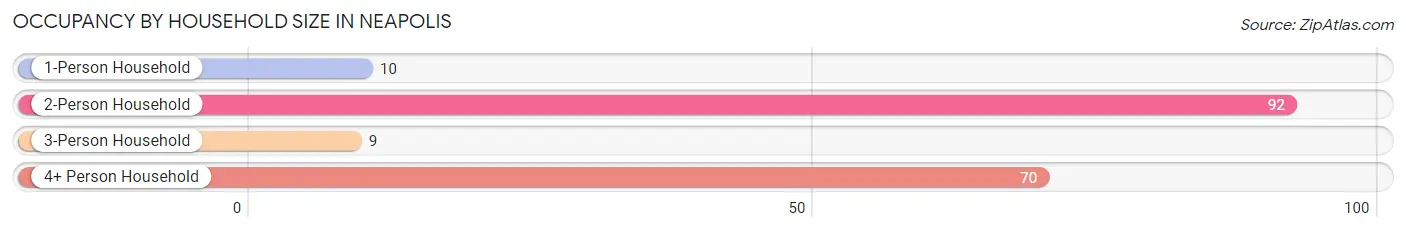
| Household Size | # Housing Units | % Housing Units |
| 1-Person Household | 10 | 5.5% |
| 2-Person Household | 92 | 50.8% |
| 3-Person Household | 9 | 5.0% |
| 4+ Person Household | 70 | 38.7% |
| Total Housing Units | 181 | 100.0% |
Occupancy by Ownership by Household Size in Neapolis
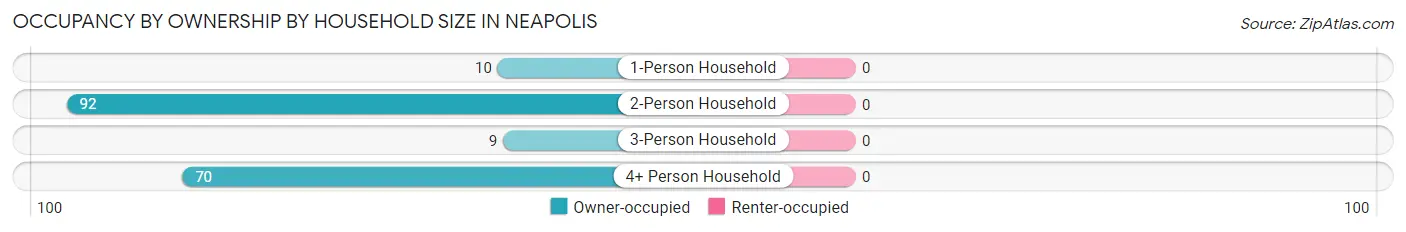
| Household Size | Owner-occupied | Renter-occupied |
| 1-Person Household | 10 (100.0%) | 0 (0.0%) |
| 2-Person Household | 92 (100.0%) | 0 (0.0%) |
| 3-Person Household | 9 (100.0%) | 0 (0.0%) |
| 4+ Person Household | 70 (100.0%) | 0 (0.0%) |
| Total Housing Units | 181 (100.0%) | 0 (0.0%) |
Occupancy by Educational Attainment in Neapolis
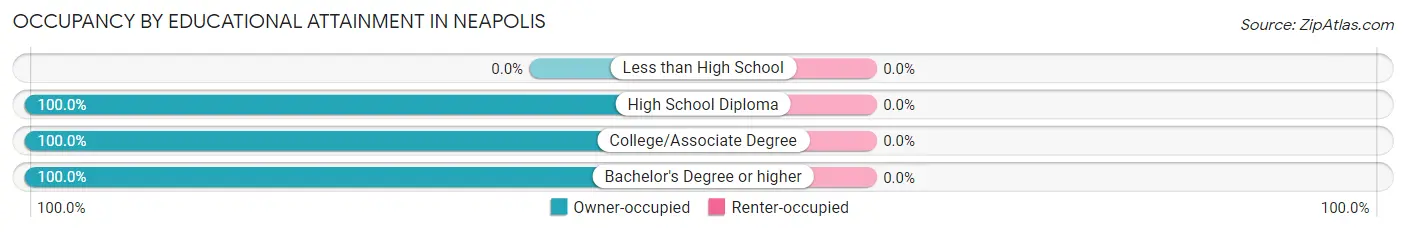
| Household Size | Owner-occupied | Renter-occupied |
| Less than High School | 0 (0.0%) | 0 (0.0%) |
| High School Diploma | 84 (100.0%) | 0 (0.0%) |
| College/Associate Degree | 87 (100.0%) | 0 (0.0%) |
| Bachelor's Degree or higher | 10 (100.0%) | 0 (0.0%) |
Occupancy by Age of Householder in Neapolis
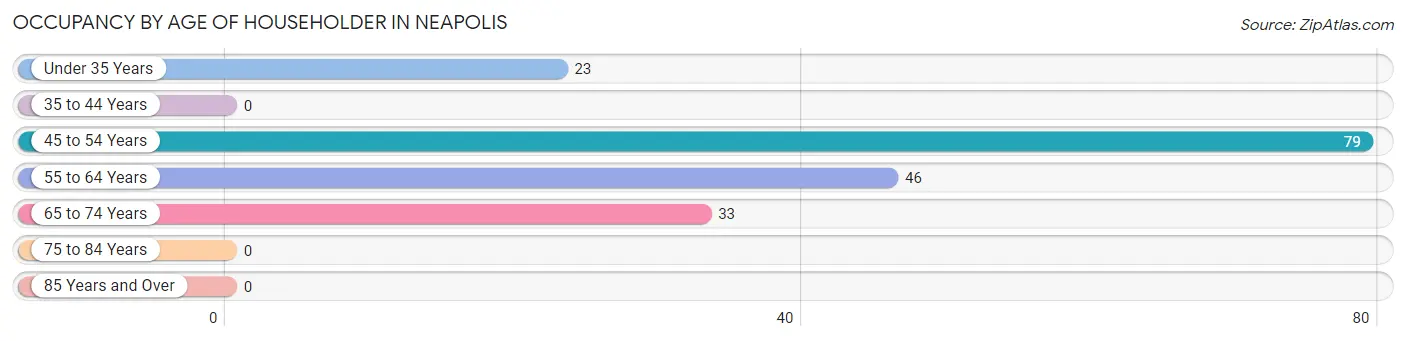
| Age Bracket | # Households | % Households |
| Under 35 Years | 23 | 12.7% |
| 35 to 44 Years | 0 | 0.0% |
| 45 to 54 Years | 79 | 43.6% |
| 55 to 64 Years | 46 | 25.4% |
| 65 to 74 Years | 33 | 18.2% |
| 75 to 84 Years | 0 | 0.0% |
| 85 Years and Over | 0 | 0.0% |
| Total | 181 | 100.0% |
Housing Finances in Neapolis
Median Income by Occupancy in Neapolis
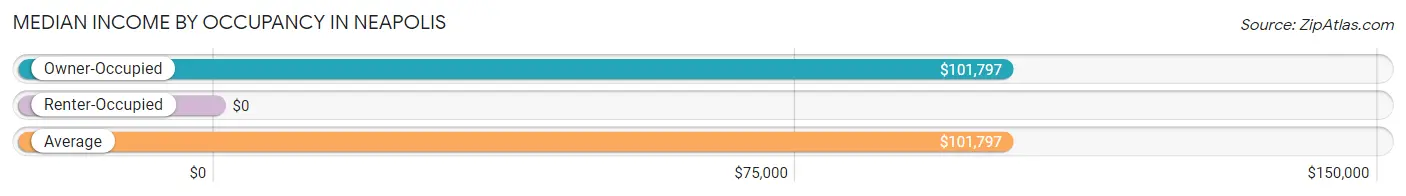
| Occupancy Type | # Households | Median Income |
| Owner-Occupied | 181 (100.0%) | $101,797 |
| Renter-Occupied | 0 (0.0%) | $0 |
| Average | 181 (100.0%) | $101,797 |
Occupancy by Householder Income Bracket in Neapolis
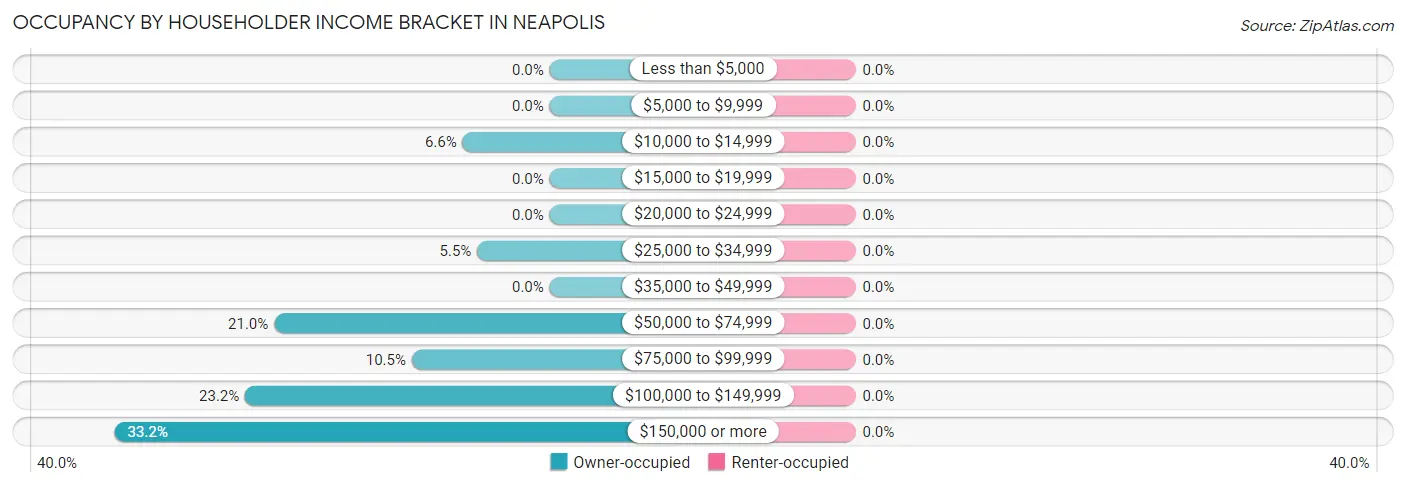
| Income Bracket | Owner-occupied | Renter-occupied |
| Less than $5,000 | 0 (0.0%) | 0 (0.0%) |
| $5,000 to $9,999 | 0 (0.0%) | 0 (0.0%) |
| $10,000 to $14,999 | 12 (6.6%) | 0 (0.0%) |
| $15,000 to $19,999 | 0 (0.0%) | 0 (0.0%) |
| $20,000 to $24,999 | 0 (0.0%) | 0 (0.0%) |
| $25,000 to $34,999 | 10 (5.5%) | 0 (0.0%) |
| $35,000 to $49,999 | 0 (0.0%) | 0 (0.0%) |
| $50,000 to $74,999 | 38 (21.0%) | 0 (0.0%) |
| $75,000 to $99,999 | 19 (10.5%) | 0 (0.0%) |
| $100,000 to $149,999 | 42 (23.2%) | 0 (0.0%) |
| $150,000 or more | 60 (33.2%) | 0 (0.0%) |
| Total | 181 (100.0%) | 0 (0.0%) |
Monthly Housing Cost Tiers in Neapolis
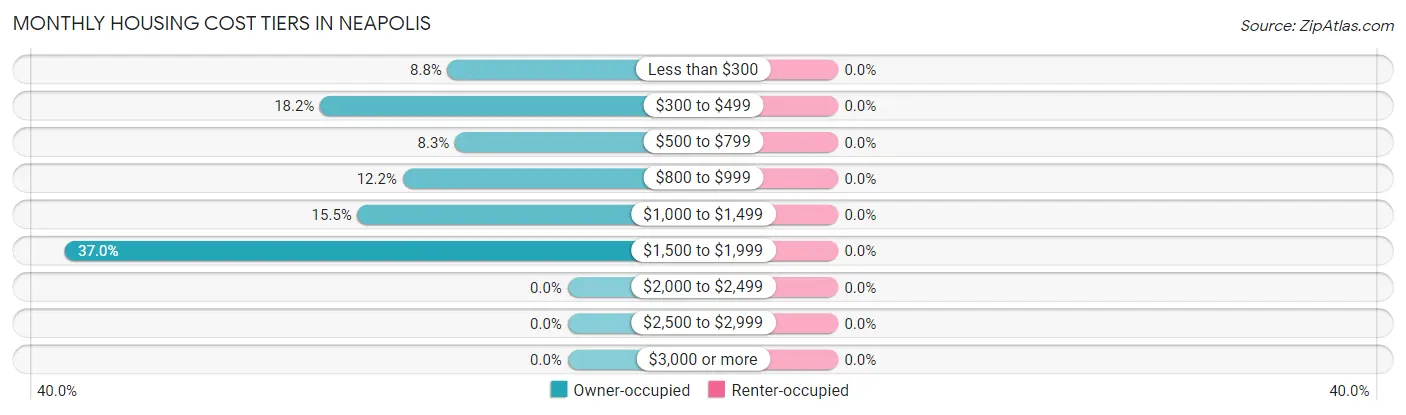
| Monthly Cost | Owner-occupied | Renter-occupied |
| Less than $300 | 16 (8.8%) | 0 (0.0%) |
| $300 to $499 | 33 (18.2%) | 0 (0.0%) |
| $500 to $799 | 15 (8.3%) | 0 (0.0%) |
| $800 to $999 | 22 (12.1%) | 0 (0.0%) |
| $1,000 to $1,499 | 28 (15.5%) | 0 (0.0%) |
| $1,500 to $1,999 | 67 (37.0%) | 0 (0.0%) |
| $2,000 to $2,499 | 0 (0.0%) | 0 (0.0%) |
| $2,500 to $2,999 | 0 (0.0%) | 0 (0.0%) |
| $3,000 or more | 0 (0.0%) | 0 (0.0%) |
| Total | 181 (100.0%) | 0 (0.0%) |
Physical Housing Characteristics in Neapolis
Housing Structures in Neapolis
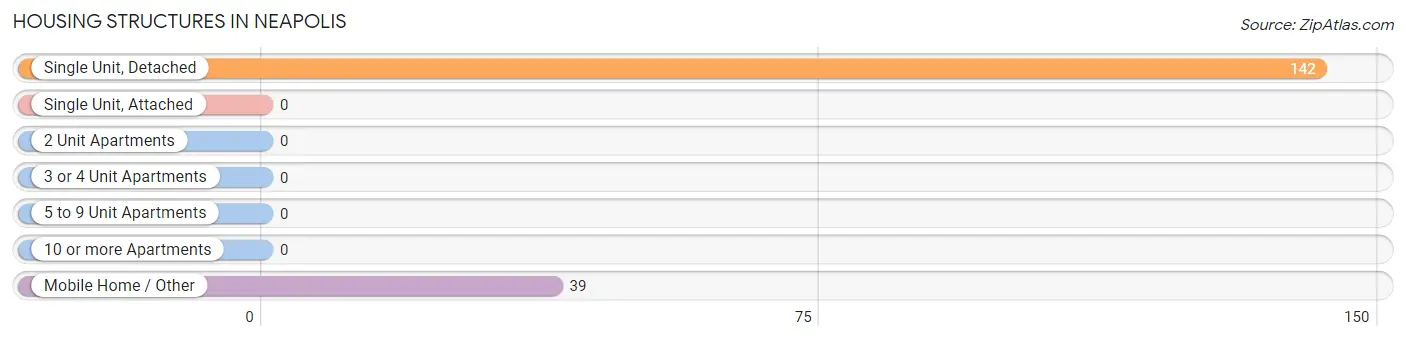
| Structure Type | # Housing Units | % Housing Units |
| Single Unit, Detached | 142 | 78.4% |
| Single Unit, Attached | 0 | 0.0% |
| 2 Unit Apartments | 0 | 0.0% |
| 3 or 4 Unit Apartments | 0 | 0.0% |
| 5 to 9 Unit Apartments | 0 | 0.0% |
| 10 or more Apartments | 0 | 0.0% |
| Mobile Home / Other | 39 | 21.5% |
| Total | 181 | 100.0% |
Housing Structures by Occupancy in Neapolis
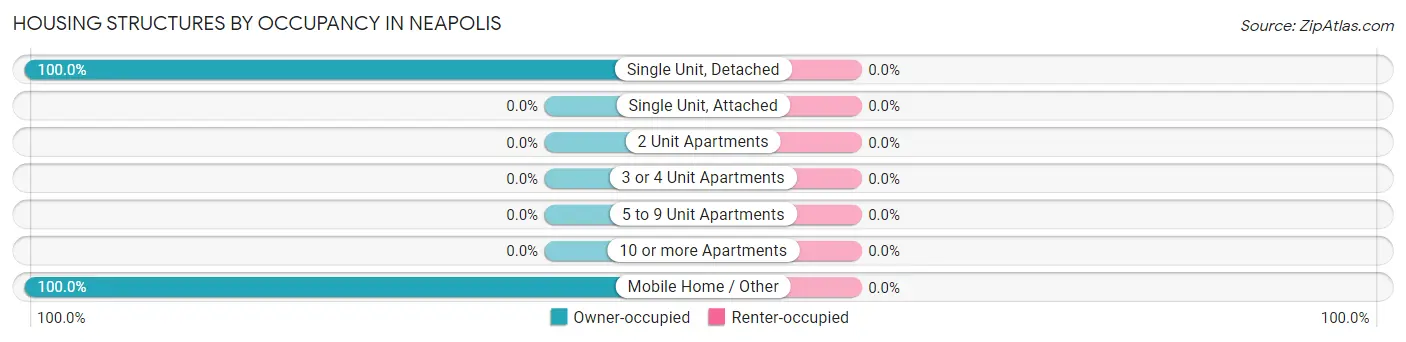
| Structure Type | Owner-occupied | Renter-occupied |
| Single Unit, Detached | 142 (100.0%) | 0 (0.0%) |
| Single Unit, Attached | 0 (0.0%) | 0 (0.0%) |
| 2 Unit Apartments | 0 (0.0%) | 0 (0.0%) |
| 3 or 4 Unit Apartments | 0 (0.0%) | 0 (0.0%) |
| 5 to 9 Unit Apartments | 0 (0.0%) | 0 (0.0%) |
| 10 or more Apartments | 0 (0.0%) | 0 (0.0%) |
| Mobile Home / Other | 39 (100.0%) | 0 (0.0%) |
| Total | 181 (100.0%) | 0 (0.0%) |
Housing Structures by Number of Rooms in Neapolis
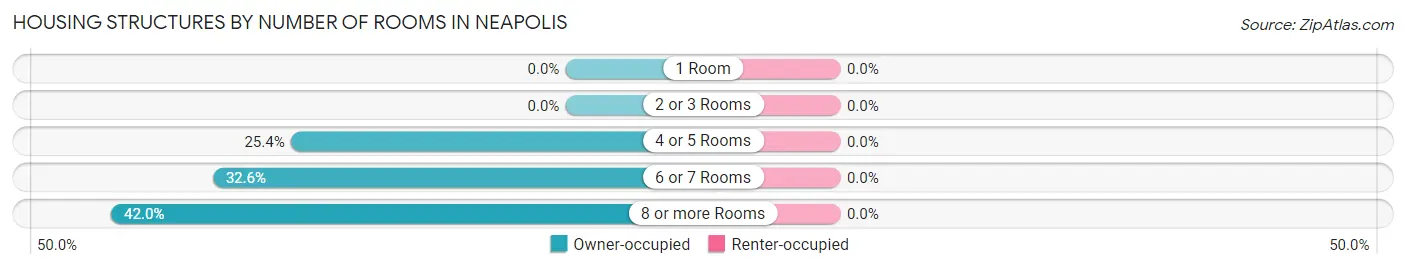
| Number of Rooms | Owner-occupied | Renter-occupied |
| 1 Room | 0 (0.0%) | 0 (0.0%) |
| 2 or 3 Rooms | 0 (0.0%) | 0 (0.0%) |
| 4 or 5 Rooms | 46 (25.4%) | 0 (0.0%) |
| 6 or 7 Rooms | 59 (32.6%) | 0 (0.0%) |
| 8 or more Rooms | 76 (42.0%) | 0 (0.0%) |
| Total | 181 (100.0%) | 0 (0.0%) |
Housing Structure by Heating Type in Neapolis
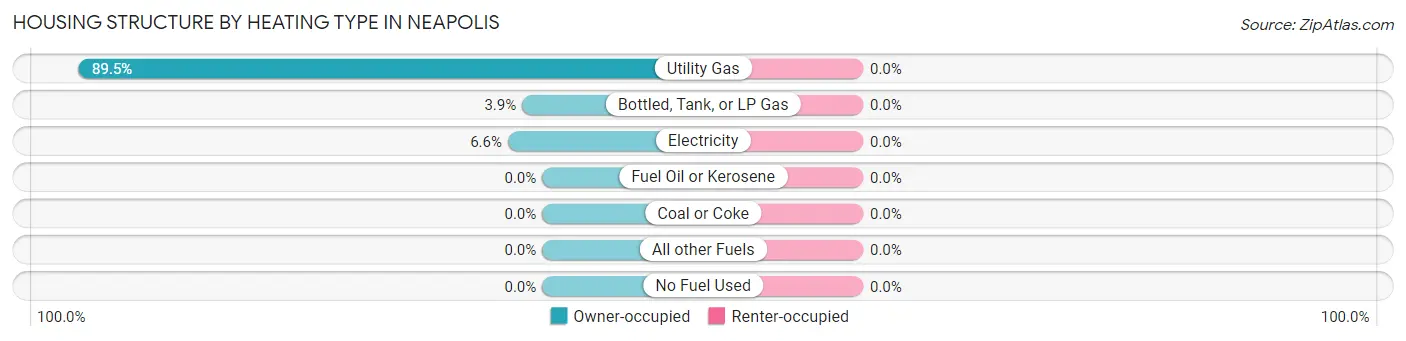
| Heating Type | Owner-occupied | Renter-occupied |
| Utility Gas | 162 (89.5%) | 0 (0.0%) |
| Bottled, Tank, or LP Gas | 7 (3.9%) | 0 (0.0%) |
| Electricity | 12 (6.6%) | 0 (0.0%) |
| Fuel Oil or Kerosene | 0 (0.0%) | 0 (0.0%) |
| Coal or Coke | 0 (0.0%) | 0 (0.0%) |
| All other Fuels | 0 (0.0%) | 0 (0.0%) |
| No Fuel Used | 0 (0.0%) | 0 (0.0%) |
| Total | 181 (100.0%) | 0 (0.0%) |
Household Vehicle Usage in Neapolis
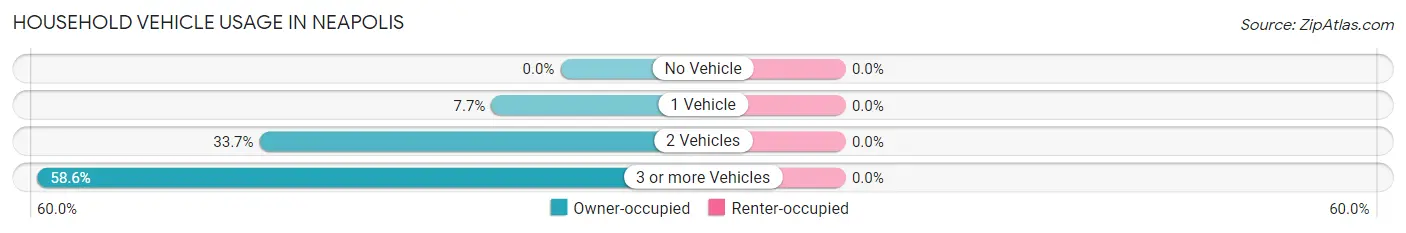
| Vehicles per Household | Owner-occupied | Renter-occupied |
| No Vehicle | 0 (0.0%) | 0 (0.0%) |
| 1 Vehicle | 14 (7.7%) | 0 (0.0%) |
| 2 Vehicles | 61 (33.7%) | 0 (0.0%) |
| 3 or more Vehicles | 106 (58.6%) | 0 (0.0%) |
| Total | 181 (100.0%) | 0 (0.0%) |
Real Estate & Mortgages in Neapolis
Real Estate and Mortgage Overview in Neapolis
| Characteristic | Without Mortgage | With Mortgage |
| Housing Units | 43 | 138 |
| Median Property Value | - | - |
| Median Household Income | - | - |
| Monthly Housing Costs | $424 | $0 |
| Real Estate Taxes | - | - |
Property Value by Mortgage Status in Neapolis
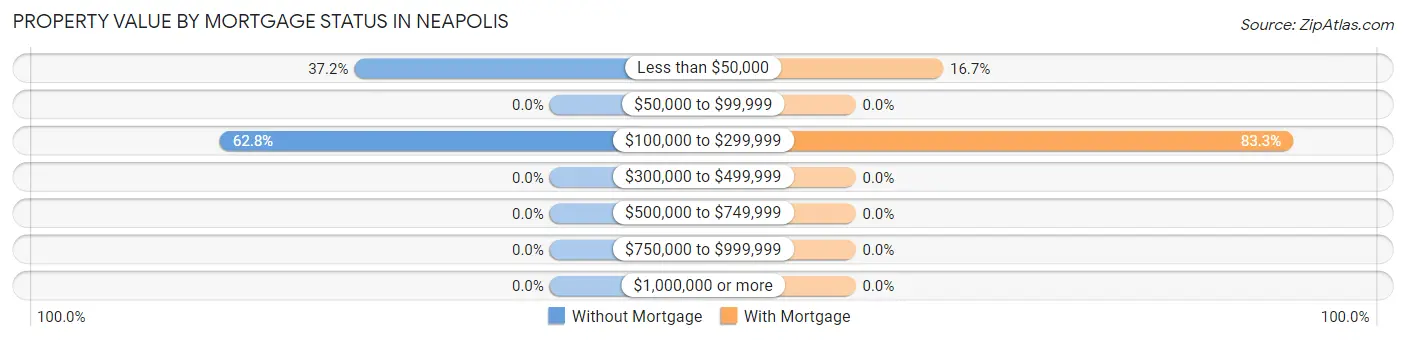
| Property Value | Without Mortgage | With Mortgage |
| Less than $50,000 | 16 (37.2%) | 23 (16.7%) |
| $50,000 to $99,999 | 0 (0.0%) | 0 (0.0%) |
| $100,000 to $299,999 | 27 (62.8%) | 115 (83.3%) |
| $300,000 to $499,999 | 0 (0.0%) | 0 (0.0%) |
| $500,000 to $749,999 | 0 (0.0%) | 0 (0.0%) |
| $750,000 to $999,999 | 0 (0.0%) | 0 (0.0%) |
| $1,000,000 or more | 0 (0.0%) | 0 (0.0%) |
| Total | 43 (100.0%) | 138 (100.0%) |
Household Income by Mortgage Status in Neapolis
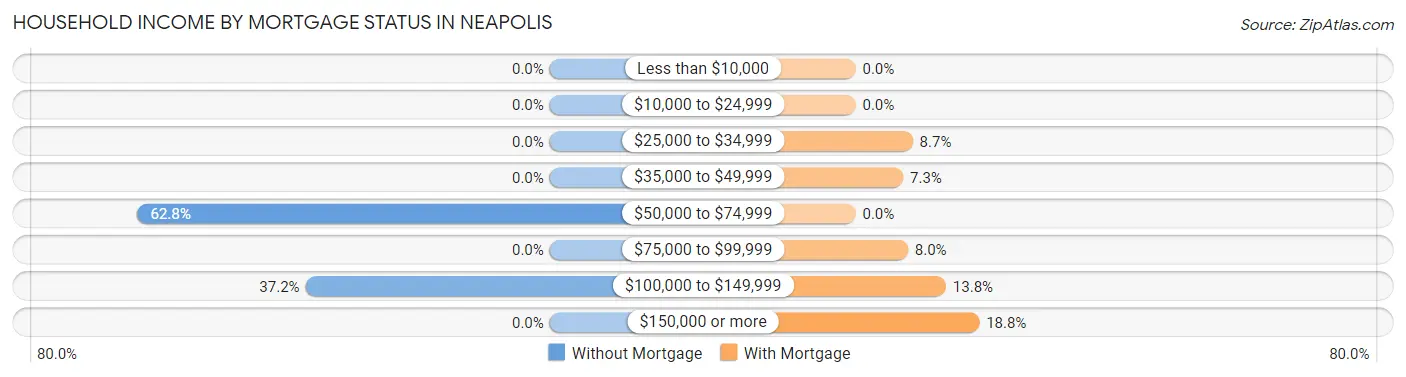
| Household Income | Without Mortgage | With Mortgage |
| Less than $10,000 | 0 (0.0%) | 0 (0.0%) |
| $10,000 to $24,999 | 0 (0.0%) | 0 (0.0%) |
| $25,000 to $34,999 | 0 (0.0%) | 12 (8.7%) |
| $35,000 to $49,999 | 0 (0.0%) | 10 (7.2%) |
| $50,000 to $74,999 | 27 (62.8%) | 0 (0.0%) |
| $75,000 to $99,999 | 0 (0.0%) | 11 (8.0%) |
| $100,000 to $149,999 | 16 (37.2%) | 19 (13.8%) |
| $150,000 or more | 0 (0.0%) | 26 (18.8%) |
| Total | 43 (100.0%) | 138 (100.0%) |
Property Value to Household Income Ratio in Neapolis
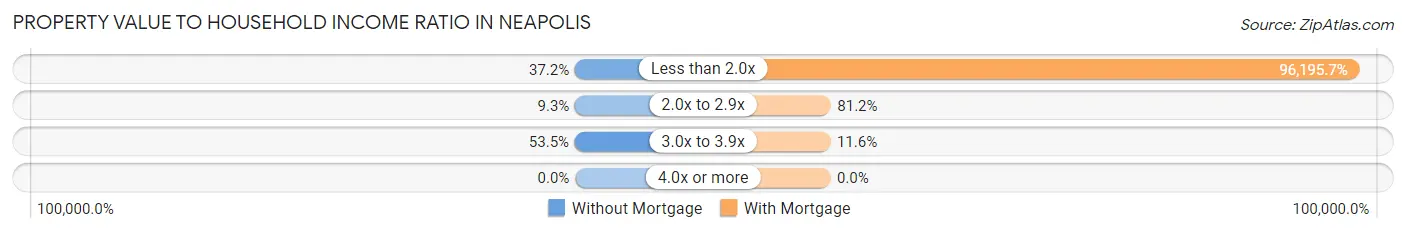
| Value-to-Income Ratio | Without Mortgage | With Mortgage |
| Less than 2.0x | 16 (37.2%) | 132,750 (96,195.7%) |
| 2.0x to 2.9x | 4 (9.3%) | 112 (81.2%) |
| 3.0x to 3.9x | 23 (53.5%) | 16 (11.6%) |
| 4.0x or more | 0 (0.0%) | 0 (0.0%) |
| Total | 43 (100.0%) | 138 (100.0%) |
Real Estate Taxes by Mortgage Status in Neapolis
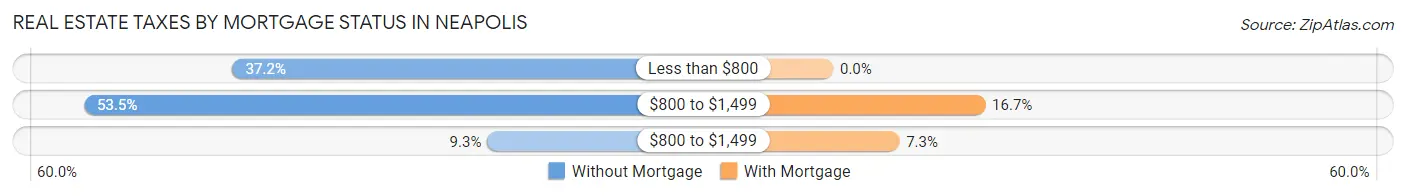
| Property Taxes | Without Mortgage | With Mortgage |
| Less than $800 | 16 (37.2%) | 0 (0.0%) |
| $800 to $1,499 | 23 (53.5%) | 23 (16.7%) |
| $800 to $1,499 | 4 (9.3%) | 10 (7.2%) |
| Total | 43 (100.0%) | 138 (100.0%) |
Health & Disability in Neapolis
Health Insurance Coverage by Age in Neapolis
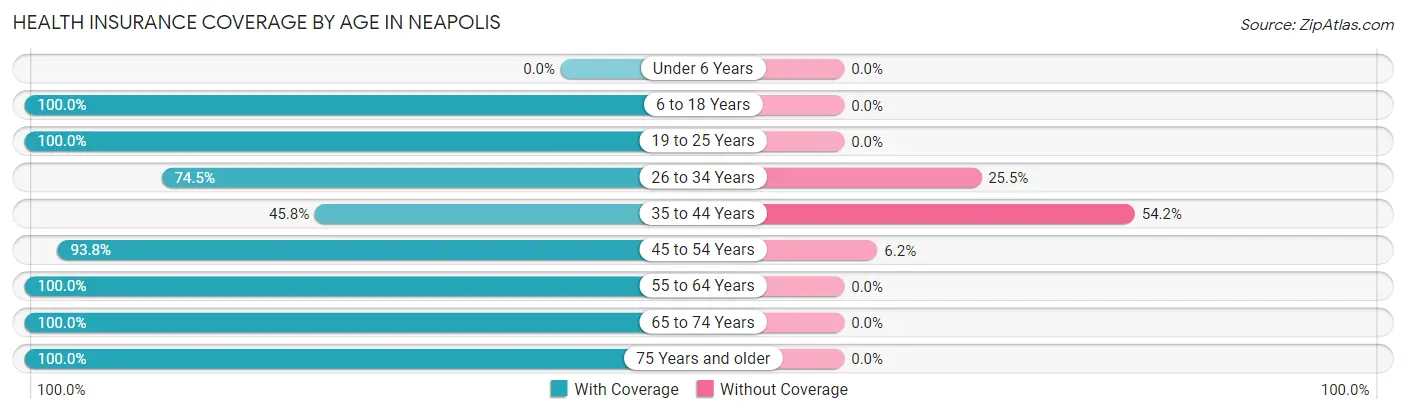
| Age Bracket | With Coverage | Without Coverage |
| Under 6 Years | 0 (0.0%) | 0 (0.0%) |
| 6 to 18 Years | 38 (100.0%) | 0 (0.0%) |
| 19 to 25 Years | 111 (100.0%) | 0 (0.0%) |
| 26 to 34 Years | 35 (74.5%) | 12 (25.5%) |
| 35 to 44 Years | 11 (45.8%) | 13 (54.2%) |
| 45 to 54 Years | 152 (93.8%) | 10 (6.2%) |
| 55 to 64 Years | 96 (100.0%) | 0 (0.0%) |
| 65 to 74 Years | 57 (100.0%) | 0 (0.0%) |
| 75 Years and older | 92 (100.0%) | 0 (0.0%) |
| Total | 592 (94.4%) | 35 (5.6%) |
Health Insurance Coverage by Citizenship Status in Neapolis
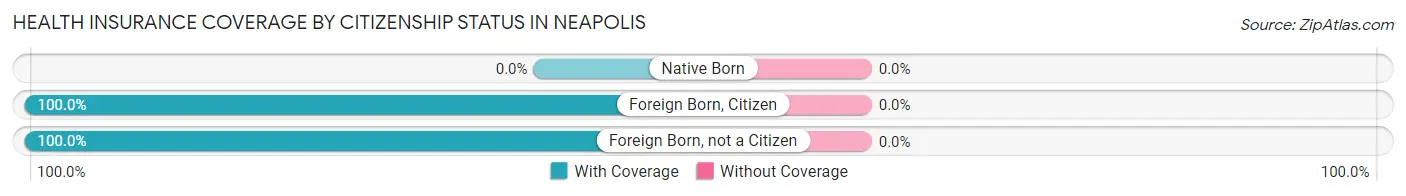
| Citizenship Status | With Coverage | Without Coverage |
| Native Born | 0 (0.0%) | 0 (0.0%) |
| Foreign Born, Citizen | 38 (100.0%) | 0 (0.0%) |
| Foreign Born, not a Citizen | 111 (100.0%) | 0 (0.0%) |
Health Insurance Coverage by Household Income in Neapolis
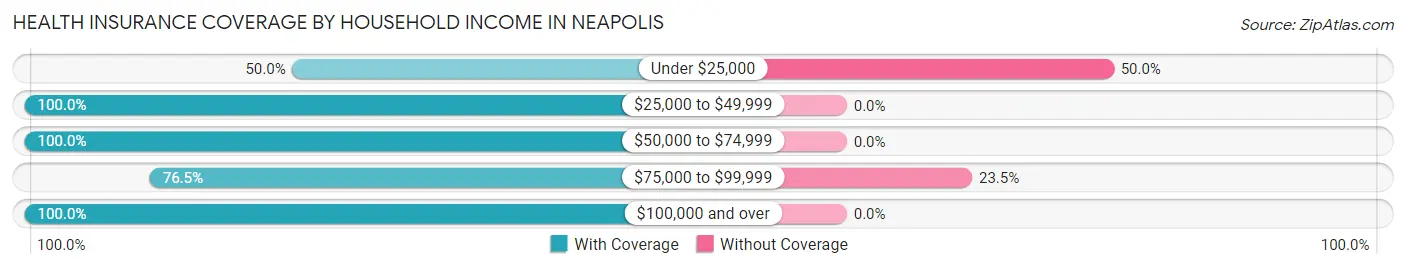
| Household Income | With Coverage | Without Coverage |
| Under $25,000 | 12 (50.0%) | 12 (50.0%) |
| $25,000 to $49,999 | 10 (100.0%) | 0 (0.0%) |
| $50,000 to $74,999 | 81 (100.0%) | 0 (0.0%) |
| $75,000 to $99,999 | 75 (76.5%) | 23 (23.5%) |
| $100,000 and over | 414 (100.0%) | 0 (0.0%) |
Public vs Private Health Insurance Coverage by Age in Neapolis
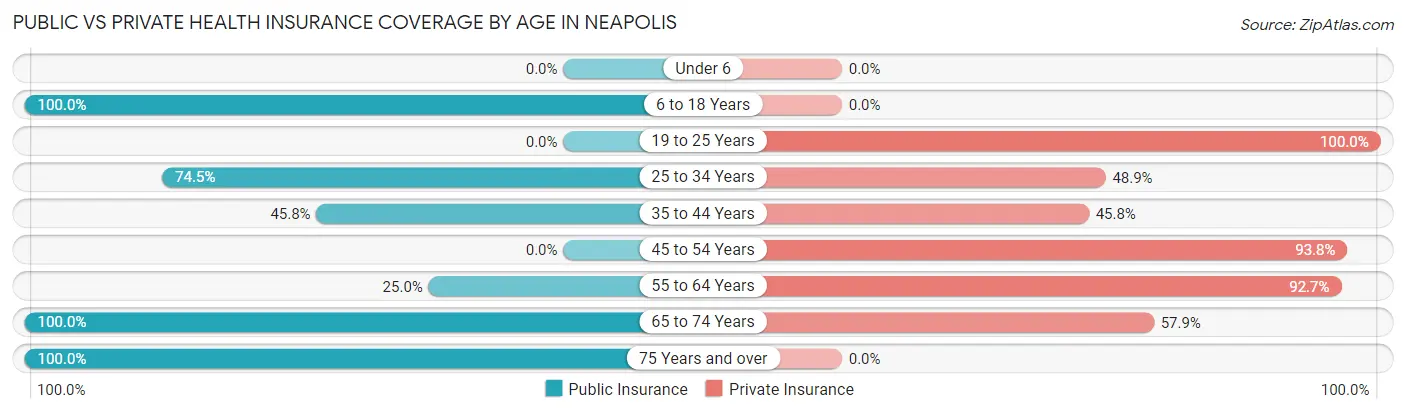
| Age Bracket | Public Insurance | Private Insurance |
| Under 6 | 0 (0.0%) | 0 (0.0%) |
| 6 to 18 Years | 38 (100.0%) | 0 (0.0%) |
| 19 to 25 Years | 0 (0.0%) | 111 (100.0%) |
| 25 to 34 Years | 35 (74.5%) | 23 (48.9%) |
| 35 to 44 Years | 11 (45.8%) | 11 (45.8%) |
| 45 to 54 Years | 0 (0.0%) | 152 (93.8%) |
| 55 to 64 Years | 24 (25.0%) | 89 (92.7%) |
| 65 to 74 Years | 57 (100.0%) | 33 (57.9%) |
| 75 Years and over | 92 (100.0%) | 0 (0.0%) |
| Total | 257 (41.0%) | 419 (66.8%) |
Disability Status by Sex by Age in Neapolis
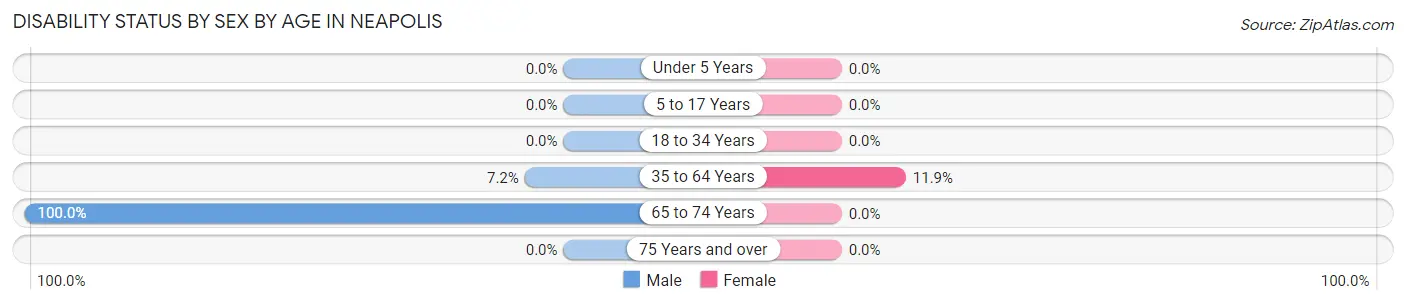
| Age Bracket | Male | Female |
| Under 5 Years | 0 (0.0%) | 0 (0.0%) |
| 5 to 17 Years | 0 (0.0%) | 0 (0.0%) |
| 18 to 34 Years | 0 (0.0%) | 0 (0.0%) |
| 35 to 64 Years | 10 (7.2%) | 17 (11.9%) |
| 65 to 74 Years | 33 (100.0%) | 0 (0.0%) |
| 75 Years and over | 0 (0.0%) | 0 (0.0%) |
Disability Class by Sex by Age in Neapolis
Disability Class: Hearing Difficulty
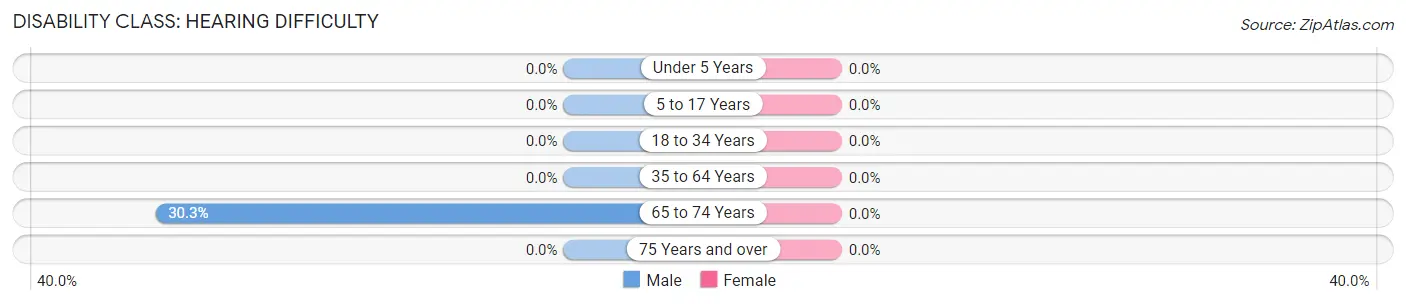
| Age Bracket | Male | Female |
| Under 5 Years | 0 (0.0%) | 0 (0.0%) |
| 5 to 17 Years | 0 (0.0%) | 0 (0.0%) |
| 18 to 34 Years | 0 (0.0%) | 0 (0.0%) |
| 35 to 64 Years | 0 (0.0%) | 0 (0.0%) |
| 65 to 74 Years | 10 (30.3%) | 0 (0.0%) |
| 75 Years and over | 0 (0.0%) | 0 (0.0%) |
Disability Class: Vision Difficulty
| Age Bracket | Male | Female |
| Under 5 Years | 0 (0.0%) | 0 (0.0%) |
| 5 to 17 Years | 0 (0.0%) | 0 (0.0%) |
| 18 to 34 Years | 0 (0.0%) | 0 (0.0%) |
| 35 to 64 Years | 0 (0.0%) | 0 (0.0%) |
| 65 to 74 Years | 0 (0.0%) | 0 (0.0%) |
| 75 Years and over | 0 (0.0%) | 0 (0.0%) |
Disability Class: Cognitive Difficulty
| Age Bracket | Male | Female |
| 5 to 17 Years | 0 (0.0%) | 0 (0.0%) |
| 18 to 34 Years | 0 (0.0%) | 0 (0.0%) |
| 35 to 64 Years | 0 (0.0%) | 0 (0.0%) |
| 65 to 74 Years | 0 (0.0%) | 0 (0.0%) |
| 75 Years and over | 0 (0.0%) | 0 (0.0%) |
Disability Class: Ambulatory Difficulty
| Age Bracket | Male | Female |
| 5 to 17 Years | 0 (0.0%) | 0 (0.0%) |
| 18 to 34 Years | 0 (0.0%) | 0 (0.0%) |
| 35 to 64 Years | 10 (7.2%) | 17 (11.9%) |
| 65 to 74 Years | 23 (69.7%) | 0 (0.0%) |
| 75 Years and over | 0 (0.0%) | 0 (0.0%) |
Disability Class: Self-Care Difficulty
| Age Bracket | Male | Female |
| 5 to 17 Years | 0 (0.0%) | 0 (0.0%) |
| 18 to 34 Years | 0 (0.0%) | 0 (0.0%) |
| 35 to 64 Years | 0 (0.0%) | 0 (0.0%) |
| 65 to 74 Years | 0 (0.0%) | 0 (0.0%) |
| 75 Years and over | 0 (0.0%) | 0 (0.0%) |
Technology Access in Neapolis
Computing Device Access in Neapolis
| Device Type | # Households | % Households |
| Desktop or Laptop | 181 | 100.0% |
| Smartphone | 142 | 78.4% |
| Tablet | 128 | 70.7% |
| No Computing Device | 0 | 0.0% |
| Total | 181 | 100.0% |
Internet Access in Neapolis
| Internet Type | # Households | % Households |
| Dial-Up Internet | 9 | 5.0% |
| Broadband Home | 156 | 86.2% |
| Cellular Data Only | 16 | 8.8% |
| Satellite Internet | 0 | 0.0% |
| No Internet | 0 | 0.0% |
| Total | 181 | 100.0% |
Neapolis Summary
Napoleon, Ohio is a small city located in Henry County in the northwest corner of the state. It is situated on the Maumee River, which is a major tributary of Lake Erie. The city was founded in 1834 and named after Napoleon Bonaparte, the French emperor. The population of Napoleon was 8,717 at the 2010 census.
History
Napoleon was founded in 1834 by a group of settlers from Pennsylvania. The city was named after Napoleon Bonaparte, the French emperor. The city was incorporated in 1837 and was the county seat of Henry County.
In the late 19th century, Napoleon was a major center for the production of agricultural products, such as wheat, corn, and oats. The city was also home to several manufacturing companies, including a flour mill, a sawmill, and a brickyard.
In the early 20th century, Napoleon experienced a period of growth and prosperity. The city was home to several banks, a newspaper, and a variety of stores and businesses. The city also had a streetcar system and a public library.
In the 1950s, the city began to decline as the manufacturing industry moved away. The city's population decreased from a peak of 10,000 in 1950 to 8,717 in 2010.
Geography
Napoleon is located in the northwest corner of Ohio, in Henry County. The city is situated on the Maumee River, which is a major tributary of Lake Erie. The city is located approximately 40 miles southwest of Toledo and 60 miles northwest of Columbus.
The city has a total area of 4.2 square miles, all of which is land. The terrain is mostly flat, with some rolling hills in the northern part of the city.
Economy
Napoleon's economy is largely based on agriculture and manufacturing. The city is home to several manufacturing companies, including a flour mill, a sawmill, and a brickyard. The city is also home to several banks, a newspaper, and a variety of stores and businesses.
Demographics
As of the 2010 census, the population of Napoleon was 8,717. The racial makeup of the city was 95.2% White, 1.2% African American, 0.3% Native American, 0.5% Asian, 0.1% Pacific Islander, 1.2% from other races, and 1.5% from two or more races. Hispanic or Latino of any race were 2.7% of the population.
The median household income in Napoleon was $37,917, and the median family income was $45,917. The per capita income was $19,917. About 11.2% of families and 14.2% of the population were below the poverty line, including 19.2% of those under age 18 and 8.2% of those age 65 or over.
Common Questions
What is Per Capita Income in Neapolis?
Per Capita income in Neapolis is $38,840.
What is the Median Household income in Neapolis?
Median Household Income in Neapolis is $101,797.
What is Inequality or Gini Index in Neapolis?
Inequality or Gini Index in Neapolis is 0.32.
What is the Total Population of Neapolis?
Total Population of Neapolis is 627.
What is the Total Male Population of Neapolis?
Total Male Population of Neapolis is 321.
What is the Total Female Population of Neapolis?
Total Female Population of Neapolis is 306.
What is the Ratio of Males per 100 Females in Neapolis?
There are 104.90 Males per 100 Females in Neapolis.
What is the Ratio of Females per 100 Males in Neapolis?
There are 95.33 Females per 100 Males in Neapolis.
What is the Median Population Age in Neapolis?
Median Population Age in Neapolis is 49.2 Years.
What is the Average Family Size in Neapolis
Average Family Size in Neapolis is 3.9 People.
What is the Average Household Size in Neapolis
Average Household Size in Neapolis is 3.5 People.
How Large is the Labor Force in Neapolis?
There are 538 People in the Labor Forcein in Neapolis.
What is the Percentage of People in the Labor Force in Neapolis?
89.5% of People are in the Labor Force in Neapolis.
What is the Unemployment Rate in Neapolis?
Unemployment Rate in Neapolis is 11.2%.