Bexley, OH Map & Demographics
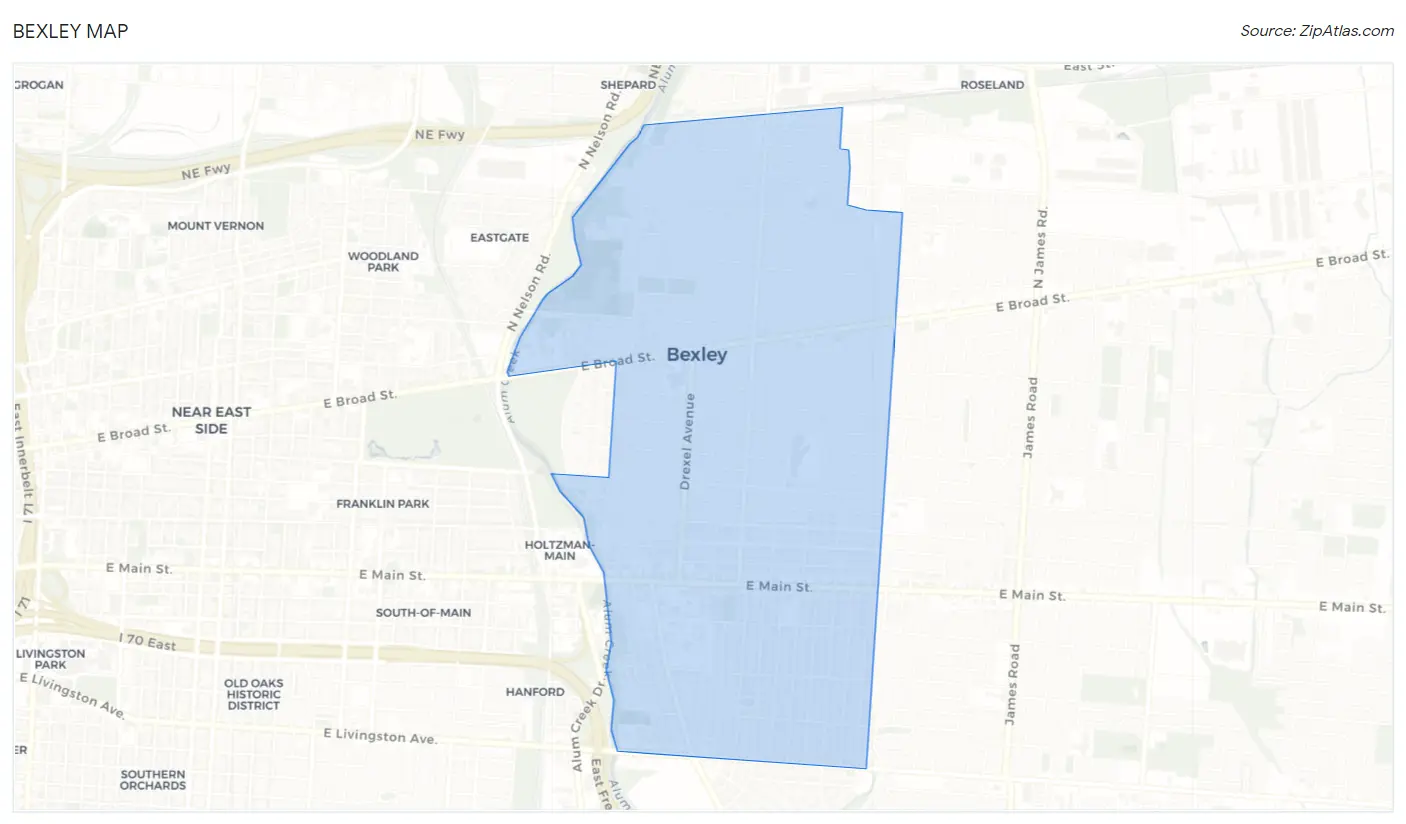
Bexley Map
Bexley Overview
$71,518
PER CAPITA INCOME
$176,852
AVG FAMILY INCOME
$138,929
AVG HOUSEHOLD INCOME
28.8%
WAGE / INCOME GAP [ % ]
71.2¢/ $1
WAGE / INCOME GAP [ $ ]
0.49
INEQUALITY / GINI INDEX
13,537
TOTAL POPULATION
6,503
MALE POPULATION
7,034
FEMALE POPULATION
92.45
MALES / 100 FEMALES
108.17
FEMALES / 100 MALES
37.4
MEDIAN AGE
3.1
AVG FAMILY SIZE
2.6
AVG HOUSEHOLD SIZE
6,808
LABOR FORCE [ PEOPLE ]
66.2%
PERCENT IN LABOR FORCE
3.5%
UNEMPLOYMENT RATE
Bexley Area Codes
Income in Bexley
Income Overview in Bexley
Per Capita Income in Bexley is $71,518, while median incomes of families and households are $176,852 and $138,929 respectively.
| Characteristic | Number | Measure |
| Per Capita Income | 13,537 | $71,518 |
| Median Family Income | 3,526 | $176,852 |
| Mean Family Income | 3,526 | $244,863 |
| Median Household Income | 4,750 | $138,929 |
| Mean Household Income | 4,750 | $201,495 |
| Income Deficit | 3,526 | $0 |
| Wage / Income Gap (%) | 13,537 | 28.81% |
| Wage / Income Gap ($) | 13,537 | 71.19¢ per $1 |
| Gini / Inequality Index | 13,537 | 0.49 |
Earnings by Sex in Bexley
Average Earnings in Bexley are $67,022, $78,333 for men and $55,767 for women, a difference of 28.8%.
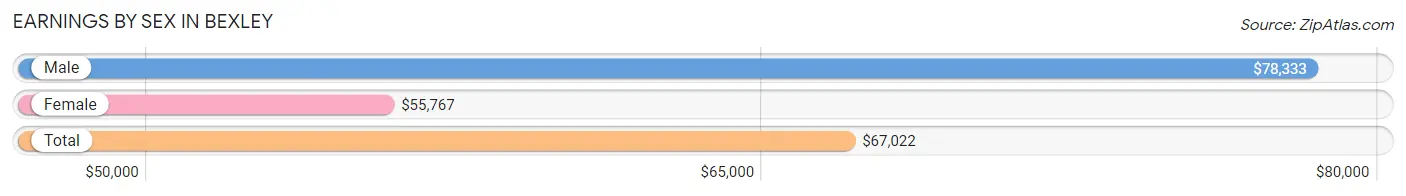
| Sex | Number | Average Earnings |
| Male | 4,020 (52.2%) | $78,333 |
| Female | 3,676 (47.8%) | $55,767 |
| Total | 7,696 (100.0%) | $67,022 |
Earnings by Sex by Income Bracket in Bexley
The most common earnings brackets in Bexley are $100,000+ for men (1,562 | 38.9%) and $100,000+ for women (1,096 | 29.8%).
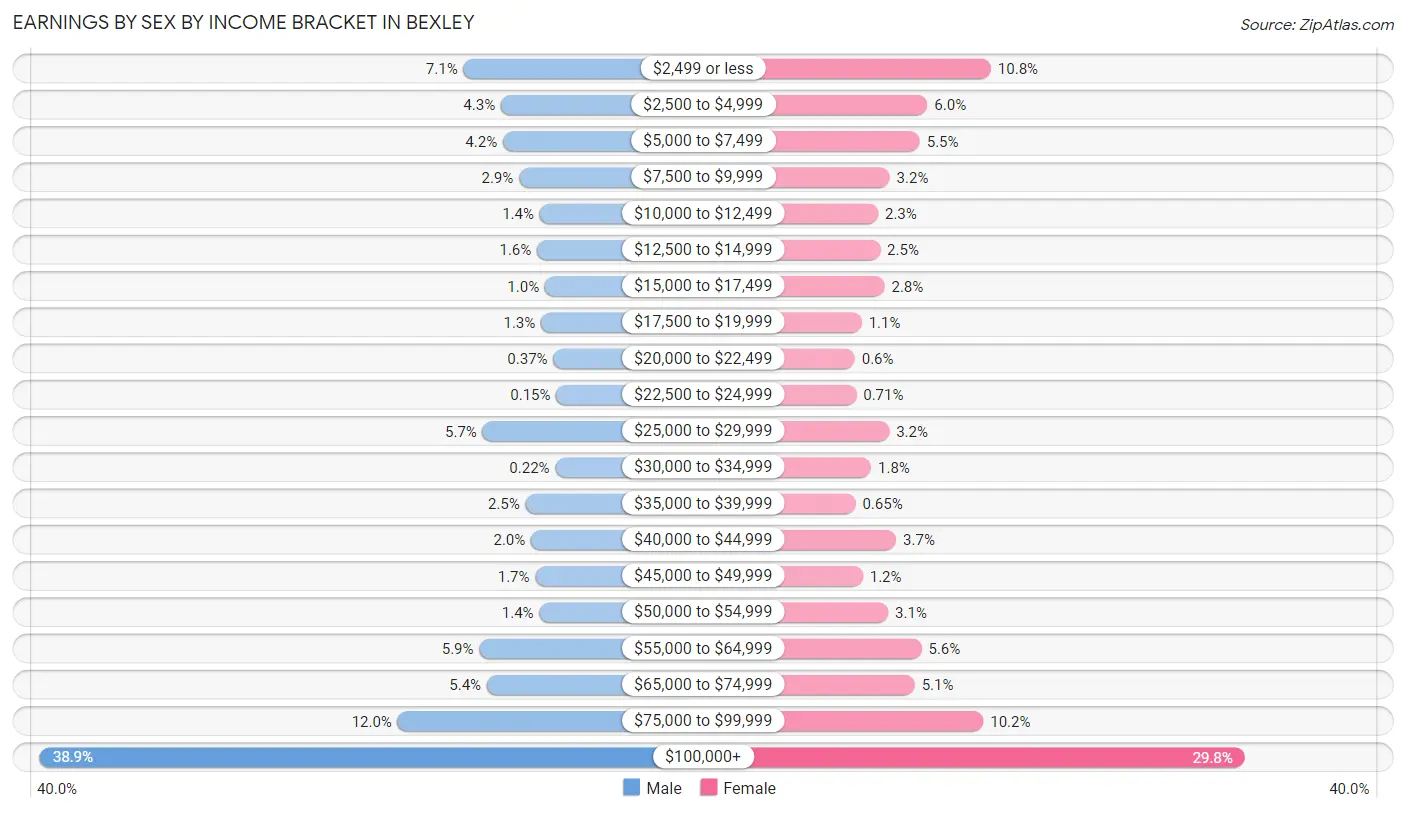
| Income | Male | Female |
| $2,499 or less | 286 (7.1%) | 397 (10.8%) |
| $2,500 to $4,999 | 173 (4.3%) | 222 (6.0%) |
| $5,000 to $7,499 | 167 (4.2%) | 201 (5.5%) |
| $7,500 to $9,999 | 118 (2.9%) | 118 (3.2%) |
| $10,000 to $12,499 | 56 (1.4%) | 86 (2.3%) |
| $12,500 to $14,999 | 64 (1.6%) | 92 (2.5%) |
| $15,000 to $17,499 | 40 (1.0%) | 104 (2.8%) |
| $17,500 to $19,999 | 52 (1.3%) | 41 (1.1%) |
| $20,000 to $22,499 | 15 (0.4%) | 22 (0.6%) |
| $22,500 to $24,999 | 6 (0.2%) | 26 (0.7%) |
| $25,000 to $29,999 | 228 (5.7%) | 117 (3.2%) |
| $30,000 to $34,999 | 9 (0.2%) | 67 (1.8%) |
| $35,000 to $39,999 | 99 (2.5%) | 24 (0.6%) |
| $40,000 to $44,999 | 82 (2.0%) | 136 (3.7%) |
| $45,000 to $49,999 | 69 (1.7%) | 44 (1.2%) |
| $50,000 to $54,999 | 57 (1.4%) | 114 (3.1%) |
| $55,000 to $64,999 | 238 (5.9%) | 206 (5.6%) |
| $65,000 to $74,999 | 215 (5.3%) | 187 (5.1%) |
| $75,000 to $99,999 | 484 (12.0%) | 376 (10.2%) |
| $100,000+ | 1,562 (38.9%) | 1,096 (29.8%) |
| Total | 4,020 (100.0%) | 3,676 (100.0%) |
Earnings by Sex by Educational Attainment in Bexley
Average earnings in Bexley are $96,404 for men and $75,549 for women, a difference of 21.6%. Men with an educational attainment of graduate degree enjoy the highest average annual earnings of $116,403, while those with college or associate's degree education earn the least with $61,250. Women with an educational attainment of graduate degree earn the most with the average annual earnings of $100,137, while those with high school diploma education have the smallest earnings of $32,143.
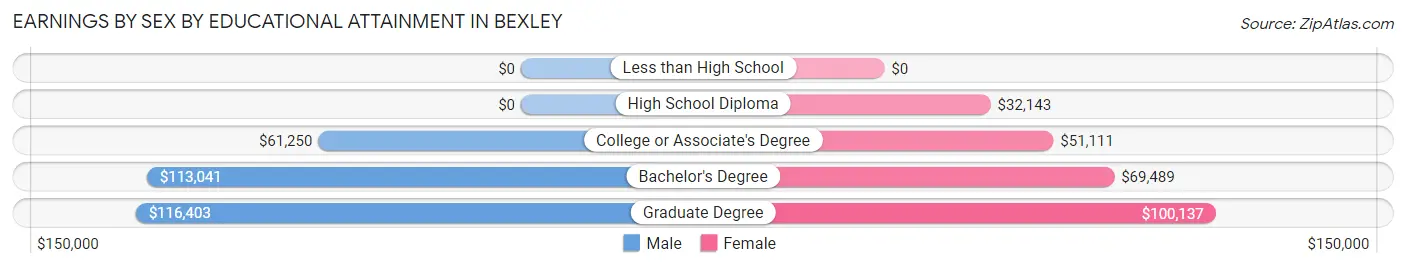
| Educational Attainment | Male Income | Female Income |
| Less than High School | - | - |
| High School Diploma | - | - |
| College or Associate's Degree | $61,250 | $51,111 |
| Bachelor's Degree | $113,041 | $69,489 |
| Graduate Degree | $116,403 | $100,137 |
| Total | $96,404 | $75,549 |
Family Income in Bexley
Family Income Brackets in Bexley
According to the Bexley family income data, there are 1,530 families falling into the $200,000+ income range, which is the most common income bracket and makes up 43.4% of all families.
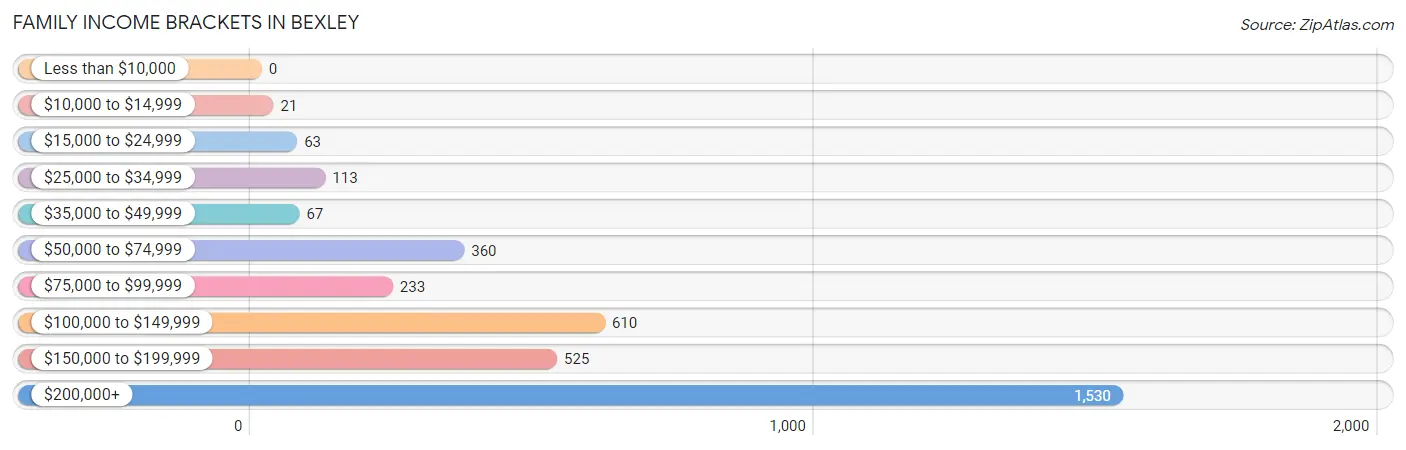
| Income Bracket | # Families | % Families |
| Less than $10,000 | 0 | 0.0% |
| $10,000 to $14,999 | 21 | 0.6% |
| $15,000 to $24,999 | 63 | 1.8% |
| $25,000 to $34,999 | 113 | 3.2% |
| $35,000 to $49,999 | 67 | 1.9% |
| $50,000 to $74,999 | 360 | 10.2% |
| $75,000 to $99,999 | 233 | 6.6% |
| $100,000 to $149,999 | 610 | 17.3% |
| $150,000 to $199,999 | 525 | 14.9% |
| $200,000+ | 1,530 | 43.4% |
Family Income by Famaliy Size in Bexley
6-person families (53 | 1.5%) account for the highest median family income in Bexley with $250,001 per family, while 2-person families (1,417 | 40.2%) have the highest median income of $74,532 per family member.
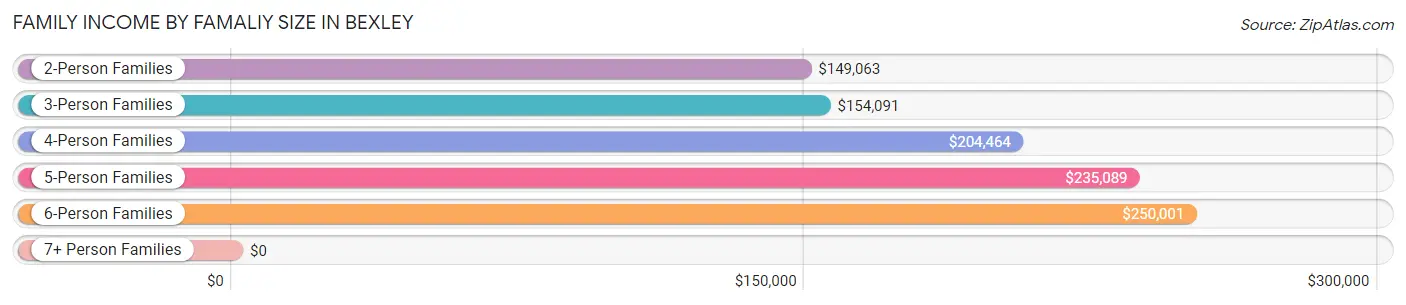
| Income Bracket | # Families | Median Income |
| 2-Person Families | 1,417 (40.2%) | $149,063 |
| 3-Person Families | 990 (28.1%) | $154,091 |
| 4-Person Families | 685 (19.4%) | $204,464 |
| 5-Person Families | 371 (10.5%) | $235,089 |
| 6-Person Families | 53 (1.5%) | $250,001 |
| 7+ Person Families | 10 (0.3%) | $0 |
| Total | 3,526 (100.0%) | $176,852 |
Family Income by Number of Earners in Bexley
The median family income in Bexley is $176,852, with families comprising 2 earners (1,787) having the highest median family income of $203,487, while families with no earners (283) have the lowest median family income of $88,173, accounting for 50.7% and 8.0% of families, respectively.
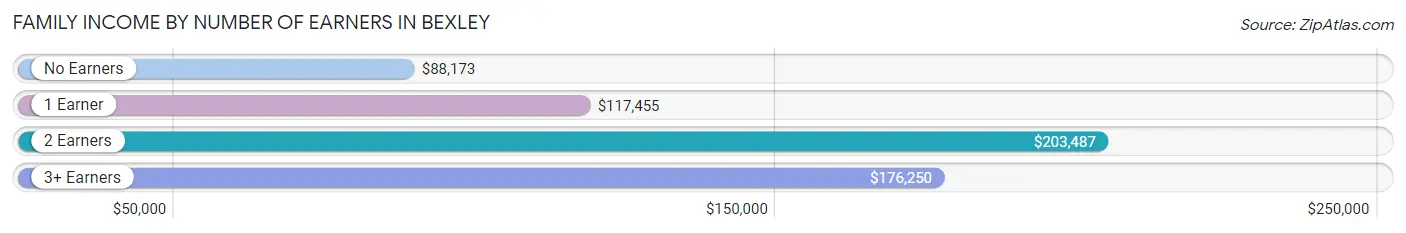
| Number of Earners | # Families | Median Income |
| No Earners | 283 (8.0%) | $88,173 |
| 1 Earner | 1,167 (33.1%) | $117,455 |
| 2 Earners | 1,787 (50.7%) | $203,487 |
| 3+ Earners | 289 (8.2%) | $176,250 |
| Total | 3,526 (100.0%) | $176,852 |
Household Income in Bexley
Household Income Brackets in Bexley
With 1,596 households falling in the category, the $200,000+ income range is the most frequent in Bexley, accounting for 33.6% of all households. In contrast, only 71 households (1.5%) fall into the $10,000 to $14,999 income bracket, making it the least populous group.
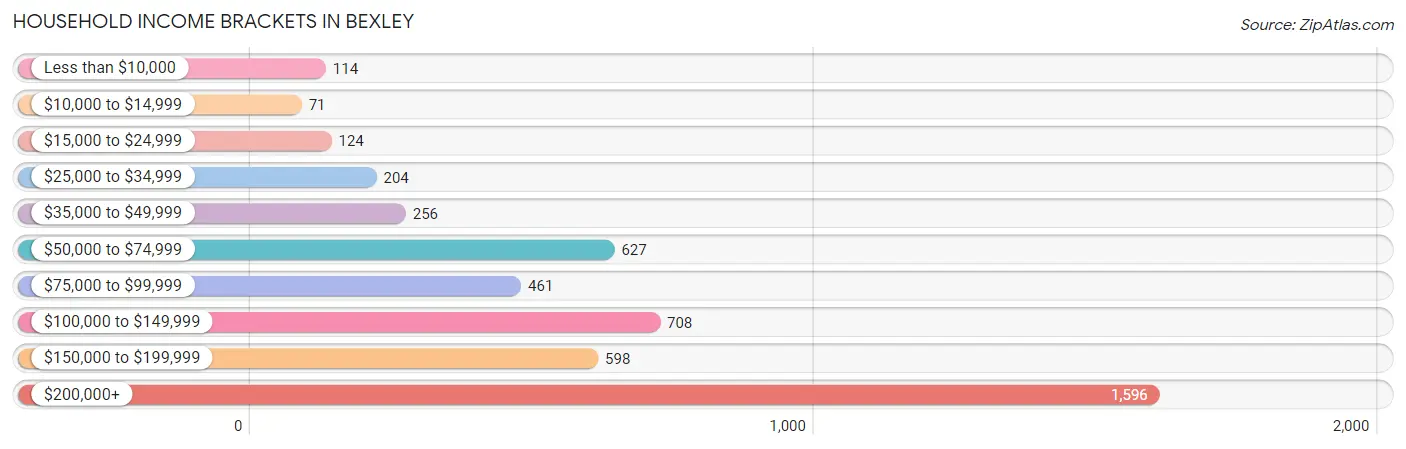
| Income Bracket | # Households | % Households |
| Less than $10,000 | 114 | 2.4% |
| $10,000 to $14,999 | 71 | 1.5% |
| $15,000 to $24,999 | 124 | 2.6% |
| $25,000 to $34,999 | 204 | 4.3% |
| $35,000 to $49,999 | 256 | 5.4% |
| $50,000 to $74,999 | 627 | 13.2% |
| $75,000 to $99,999 | 461 | 9.7% |
| $100,000 to $149,999 | 708 | 14.9% |
| $150,000 to $199,999 | 598 | 12.6% |
| $200,000+ | 1,596 | 33.6% |
Household Income by Householder Age in Bexley
The median household income in Bexley is $138,929, with the highest median household income of $178,625 found in the 45 to 64 years age bracket for the primary householder. A total of 1,737 households (36.6%) fall into this category. Meanwhile, the 15 to 24 years age bracket for the primary householder has the lowest median household income of $0, with 75 households (1.6%) in this group.
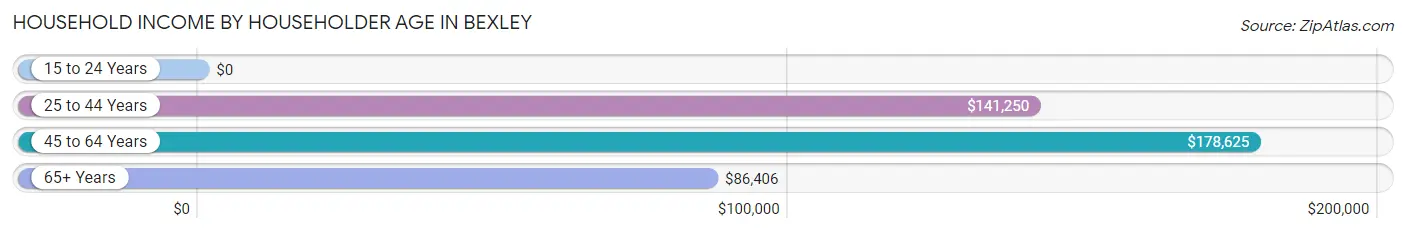
| Income Bracket | # Households | Median Income |
| 15 to 24 Years | 75 (1.6%) | $0 |
| 25 to 44 Years | 1,664 (35.0%) | $141,250 |
| 45 to 64 Years | 1,737 (36.6%) | $178,625 |
| 65+ Years | 1,274 (26.8%) | $86,406 |
| Total | 4,750 (100.0%) | $138,929 |
Poverty in Bexley
Income Below Poverty by Sex and Age in Bexley
With 2.0% poverty level for males and 4.8% for females among the residents of Bexley, 75 year old and over males and 18 to 24 year old females are the most vulnerable to poverty, with 37 males (12.9%) and 111 females (40.4%) in their respective age groups living below the poverty level.
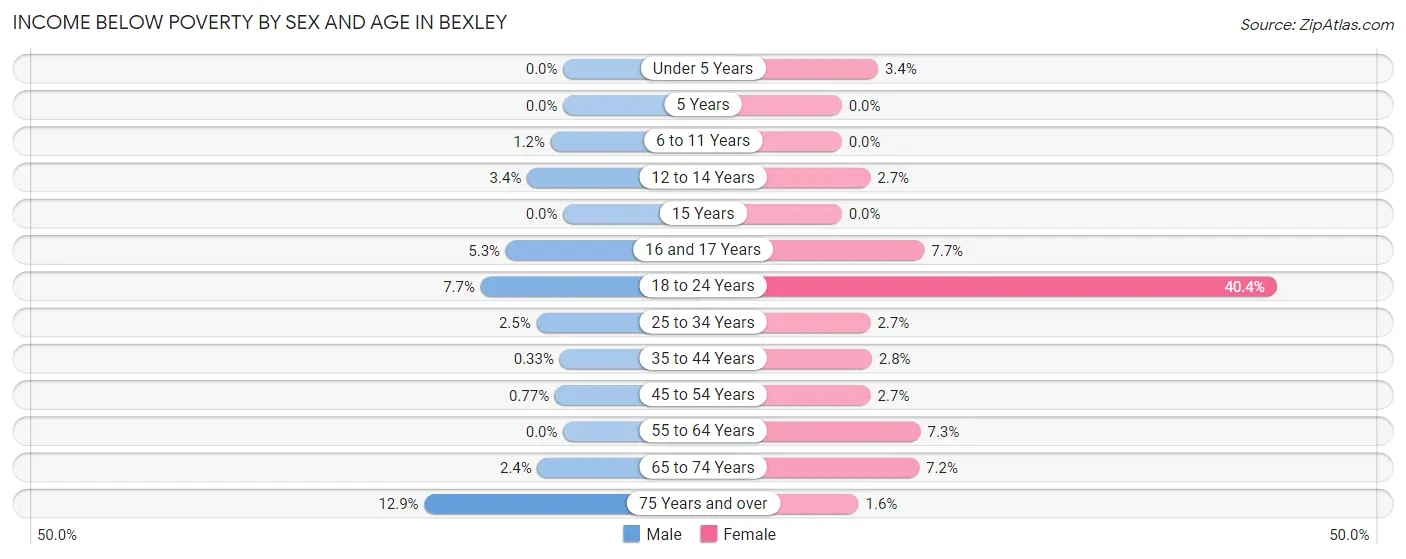
| Age Bracket | Male | Female |
| Under 5 Years | 0 (0.0%) | 14 (3.4%) |
| 5 Years | 0 (0.0%) | 0 (0.0%) |
| 6 to 11 Years | 7 (1.2%) | 0 (0.0%) |
| 12 to 14 Years | 8 (3.4%) | 9 (2.6%) |
| 15 Years | 0 (0.0%) | 0 (0.0%) |
| 16 and 17 Years | 13 (5.3%) | 17 (7.7%) |
| 18 to 24 Years | 20 (7.7%) | 111 (40.4%) |
| 25 to 34 Years | 12 (2.5%) | 14 (2.7%) |
| 35 to 44 Years | 3 (0.3%) | 32 (2.8%) |
| 45 to 54 Years | 7 (0.8%) | 25 (2.7%) |
| 55 to 64 Years | 0 (0.0%) | 44 (7.3%) |
| 65 to 74 Years | 14 (2.4%) | 40 (7.2%) |
| 75 Years and over | 37 (12.9%) | 8 (1.6%) |
| Total | 121 (2.0%) | 314 (4.8%) |
Income Above Poverty by Sex and Age in Bexley
According to the poverty statistics in Bexley, males aged under 5 years and females aged 5 years are the age groups that are most secure financially, with 100.0% of males and 100.0% of females in these age groups living above the poverty line.
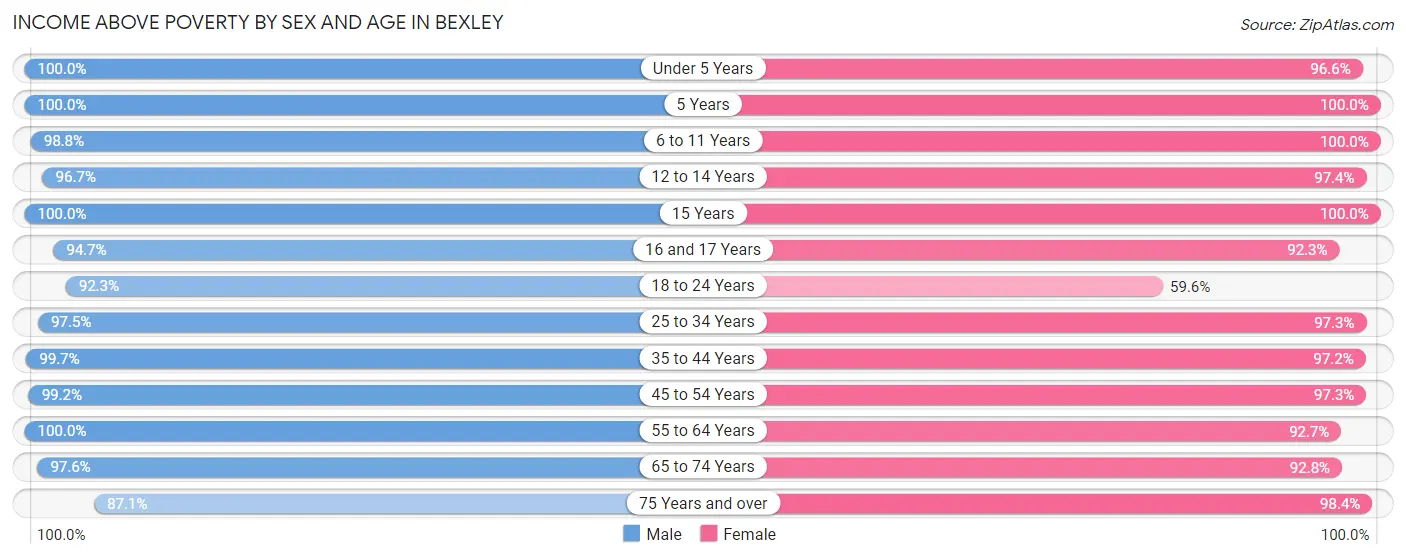
| Age Bracket | Male | Female |
| Under 5 Years | 411 (100.0%) | 403 (96.6%) |
| 5 Years | 135 (100.0%) | 93 (100.0%) |
| 6 to 11 Years | 594 (98.8%) | 770 (100.0%) |
| 12 to 14 Years | 231 (96.7%) | 330 (97.4%) |
| 15 Years | 147 (100.0%) | 97 (100.0%) |
| 16 and 17 Years | 231 (94.7%) | 205 (92.3%) |
| 18 to 24 Years | 241 (92.3%) | 164 (59.6%) |
| 25 to 34 Years | 469 (97.5%) | 512 (97.3%) |
| 35 to 44 Years | 901 (99.7%) | 1,113 (97.2%) |
| 45 to 54 Years | 897 (99.2%) | 908 (97.3%) |
| 55 to 64 Years | 796 (100.0%) | 558 (92.7%) |
| 65 to 74 Years | 571 (97.6%) | 517 (92.8%) |
| 75 Years and over | 250 (87.1%) | 505 (98.4%) |
| Total | 5,874 (98.0%) | 6,175 (95.2%) |
Income Below Poverty Among Married-Couple Families in Bexley
The poverty statistics for married-couple families in Bexley show that 0.5% or 14 of the total 2,867 families live below the poverty line. Families with 3 or 4 children have the highest poverty rate of 2.2%, comprising of 7 families. On the other hand, families with 1 or 2 children have the lowest poverty rate of 0.0%, which includes 0 families.
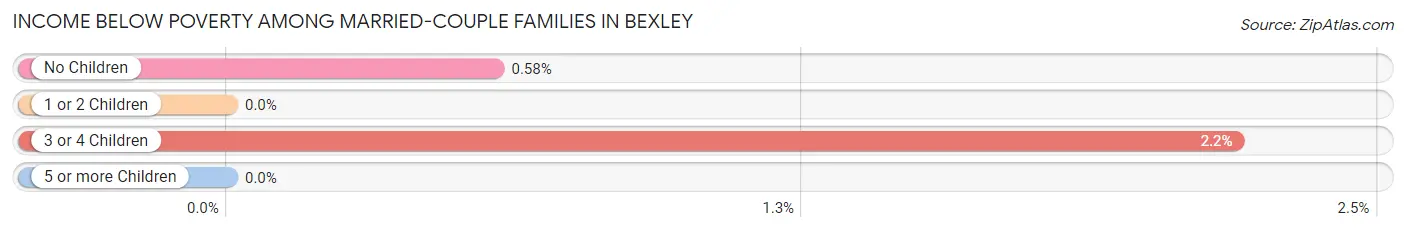
| Children | Above Poverty | Below Poverty |
| No Children | 1,201 (99.4%) | 7 (0.6%) |
| 1 or 2 Children | 1,335 (100.0%) | 0 (0.0%) |
| 3 or 4 Children | 312 (97.8%) | 7 (2.2%) |
| 5 or more Children | 5 (100.0%) | 0 (0.0%) |
| Total | 2,853 (99.5%) | 14 (0.5%) |
Income Below Poverty Among Single-Parent Households in Bexley
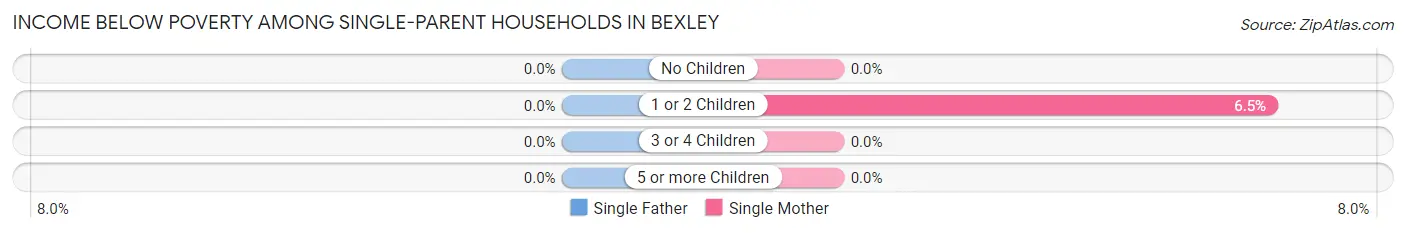
| Children | Single Father | Single Mother |
| No Children | 0 (0.0%) | 0 (0.0%) |
| 1 or 2 Children | 0 (0.0%) | 22 (6.5%) |
| 3 or 4 Children | 0 (0.0%) | 0 (0.0%) |
| 5 or more Children | 0 (0.0%) | 0 (0.0%) |
| Total | 0 (0.0%) | 22 (3.9%) |
Income Below Poverty Among Married-Couple vs Single-Parent Households in Bexley
The poverty data for Bexley shows that 14 of the married-couple family households (0.5%) and 22 of the single-parent households (3.3%) are living below the poverty level. Within the married-couple family households, those with 3 or 4 children have the highest poverty rate, with 7 households (2.2%) falling below the poverty line. Among the single-parent households, those with 1 or 2 children have the highest poverty rate, with 22 household (5.1%) living below poverty.
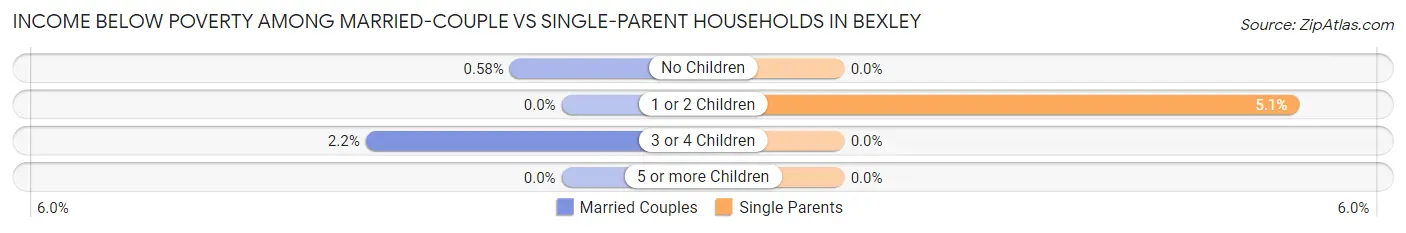
| Children | Married-Couple Families | Single-Parent Households |
| No Children | 7 (0.6%) | 0 (0.0%) |
| 1 or 2 Children | 0 (0.0%) | 22 (5.1%) |
| 3 or 4 Children | 7 (2.2%) | 0 (0.0%) |
| 5 or more Children | 0 (0.0%) | 0 (0.0%) |
| Total | 14 (0.5%) | 22 (3.3%) |
Race in Bexley
The most populous races in Bexley are White / Caucasian (11,673 | 86.2%), Two or more Races (821 | 6.1%), and Black / African American (606 | 4.5%).
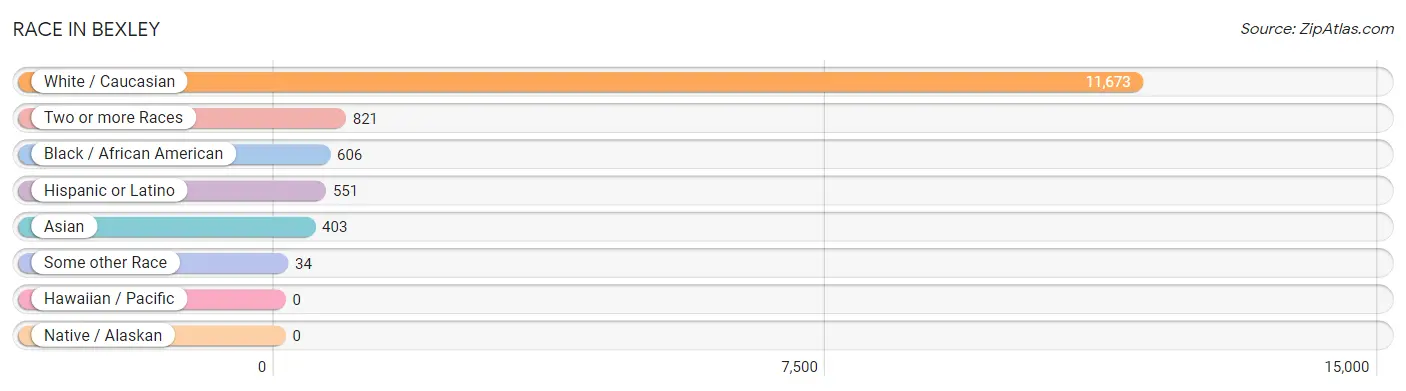
| Race | # Population | % Population |
| Asian | 403 | 3.0% |
| Black / African American | 606 | 4.5% |
| Hawaiian / Pacific | 0 | 0.0% |
| Hispanic or Latino | 551 | 4.1% |
| Native / Alaskan | 0 | 0.0% |
| White / Caucasian | 11,673 | 86.2% |
| Two or more Races | 821 | 6.1% |
| Some other Race | 34 | 0.3% |
| Total | 13,537 | 100.0% |
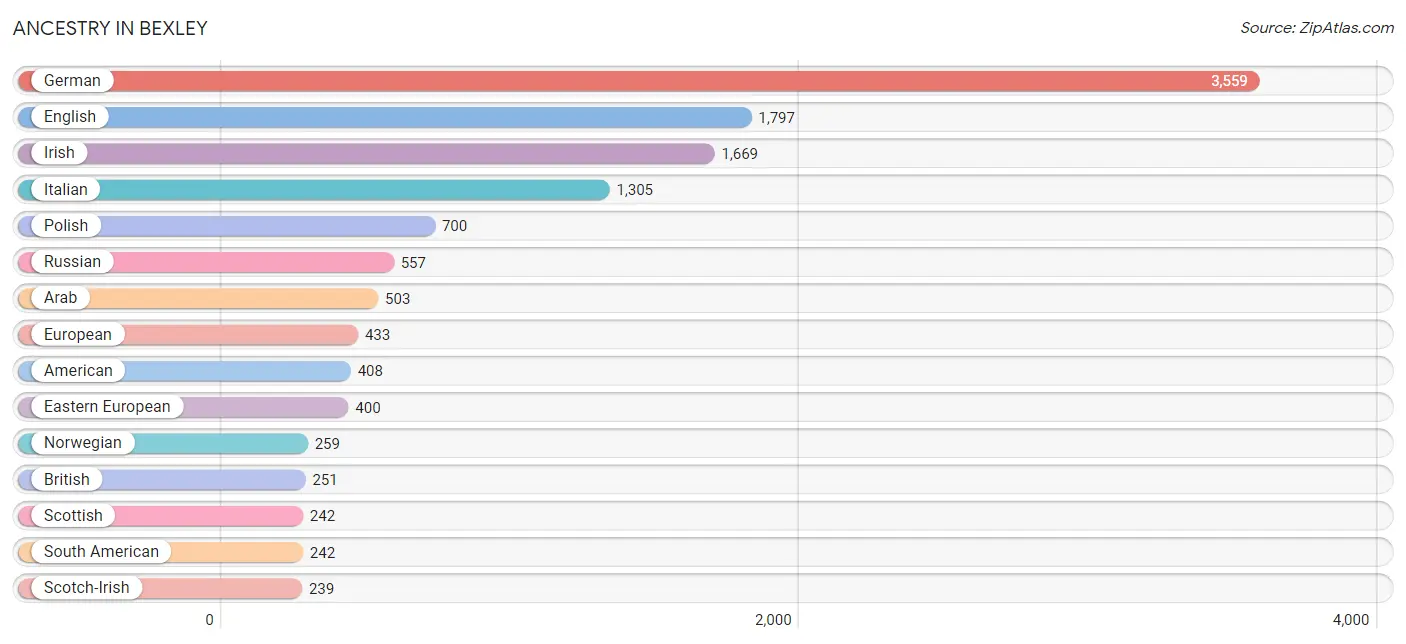
Ancestry in Bexley
The most populous ancestries reported in Bexley are German (3,559 | 26.3%), English (1,797 | 13.3%), Irish (1,669 | 12.3%), Italian (1,305 | 9.6%), and Polish (700 | 5.2%), together accounting for 66.7% of all Bexley residents.
| Ancestry | # Population | % Population |
| African | 10 | 0.1% |
| Albanian | 7 | 0.1% |
| American | 408 | 3.0% |
| Arab | 503 | 3.7% |
| Argentinean | 6 | 0.0% |
| Armenian | 9 | 0.1% |
| Austrian | 43 | 0.3% |
| Bhutanese | 119 | 0.9% |
| British | 251 | 1.8% |
| Burmese | 46 | 0.3% |
| Canadian | 28 | 0.2% |
| Central American | 43 | 0.3% |
| Chilean | 60 | 0.4% |
| Colombian | 59 | 0.4% |
| Croatian | 125 | 0.9% |
| Cuban | 18 | 0.1% |
| Czech | 83 | 0.6% |
| Danish | 34 | 0.3% |
| Dominican | 17 | 0.1% |
| Dutch | 92 | 0.7% |
| Eastern European | 400 | 2.9% |
| Ecuadorian | 81 | 0.6% |
| Egyptian | 129 | 0.9% |
| English | 1,797 | 13.3% |
| European | 433 | 3.2% |
| Finnish | 30 | 0.2% |
| French | 233 | 1.7% |
| French Canadian | 113 | 0.8% |
| German | 3,559 | 26.3% |
| German Russian | 18 | 0.1% |
| Greek | 61 | 0.4% |
| Hungarian | 118 | 0.9% |
| Indian (Asian) | 171 | 1.3% |
| Iranian | 68 | 0.5% |
| Iraqi | 66 | 0.5% |
| Irish | 1,669 | 12.3% |
| Italian | 1,305 | 9.6% |
| Jamaican | 39 | 0.3% |
| Korean | 45 | 0.3% |
| Latvian | 7 | 0.1% |
| Lebanese | 64 | 0.5% |
| Lithuanian | 97 | 0.7% |
| Mexican | 66 | 0.5% |
| Mexican American Indian | 11 | 0.1% |
| Native Hawaiian | 6 | 0.0% |
| Nicaraguan | 40 | 0.3% |
| Nigerian | 32 | 0.2% |
| Northern European | 46 | 0.3% |
| Norwegian | 259 | 1.9% |
| Pakistani | 74 | 0.5% |
| Palestinian | 205 | 1.5% |
| Panamanian | 3 | 0.0% |
| Pennsylvania German | 48 | 0.4% |
| Polish | 700 | 5.2% |
| Puerto Rican | 50 | 0.4% |
| Romanian | 107 | 0.8% |
| Russian | 557 | 4.1% |
| Scandinavian | 7 | 0.1% |
| Scotch-Irish | 239 | 1.8% |
| Scottish | 242 | 1.8% |
| Serbian | 47 | 0.4% |
| Slavic | 16 | 0.1% |
| Slovak | 58 | 0.4% |
| Slovene | 19 | 0.1% |
| South American | 242 | 1.8% |
| Spaniard | 57 | 0.4% |
| Spanish | 35 | 0.3% |
| Sri Lankan | 21 | 0.2% |
| Subsaharan African | 49 | 0.4% |
| Swedish | 110 | 0.8% |
| Swiss | 98 | 0.7% |
| Syrian | 23 | 0.2% |
| Thai | 169 | 1.3% |
| Turkish | 118 | 0.9% |
| Ukrainian | 158 | 1.2% |
| Venezuelan | 36 | 0.3% |
| Welsh | 92 | 0.7% | View All 77 Rows |
Immigrants in Bexley
The most numerous immigrant groups reported in Bexley came from Europe (339 | 2.5%), Asia (336 | 2.5%), Eastern Europe (293 | 2.2%), Latin America (132 | 1.0%), and Western Asia (123 | 0.9%), together accounting for 9.0% of all Bexley residents.
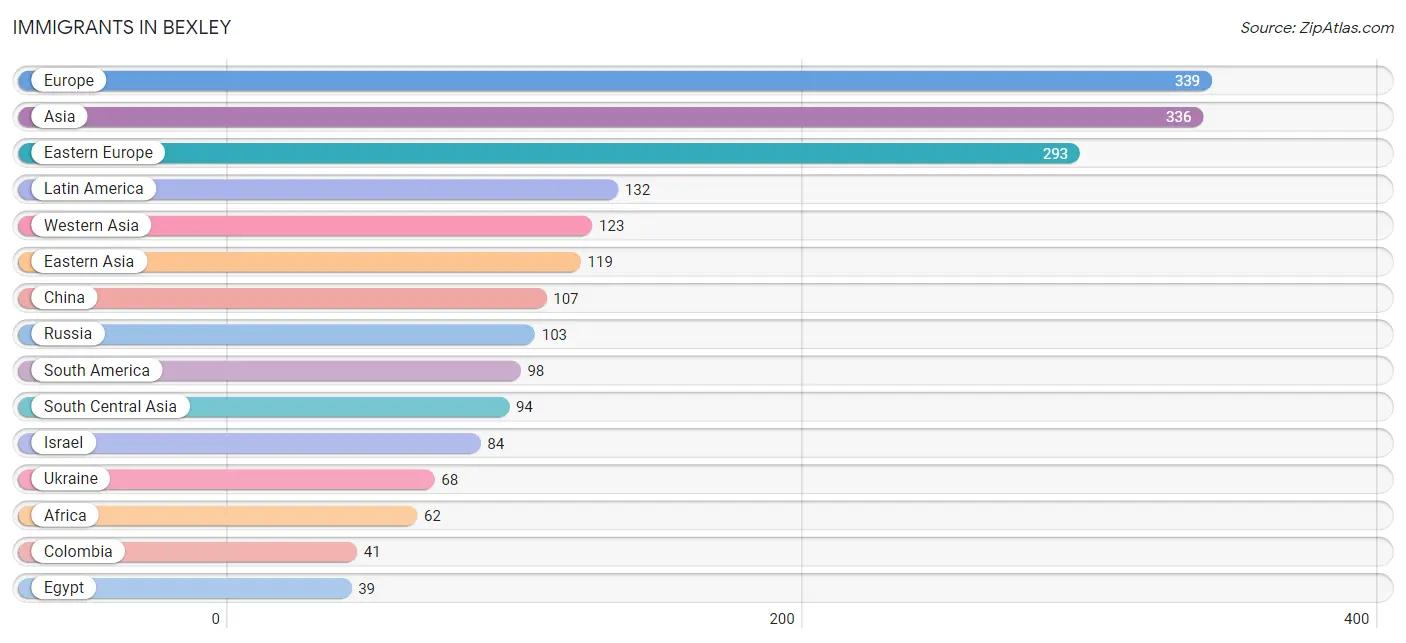
| Immigration Origin | # Population | % Population |
| Africa | 62 | 0.5% |
| Argentina | 6 | 0.0% |
| Asia | 336 | 2.5% |
| Belarus | 15 | 0.1% |
| Brazil | 15 | 0.1% |
| Canada | 31 | 0.2% |
| Caribbean | 15 | 0.1% |
| Central America | 19 | 0.1% |
| China | 107 | 0.8% |
| Colombia | 41 | 0.3% |
| Cuba | 7 | 0.1% |
| Czechoslovakia | 33 | 0.2% |
| Dominican Republic | 8 | 0.1% |
| Eastern Asia | 119 | 0.9% |
| Eastern Europe | 293 | 2.2% |
| Ecuador | 10 | 0.1% |
| Egypt | 39 | 0.3% |
| England | 9 | 0.1% |
| Europe | 339 | 2.5% |
| Germany | 7 | 0.1% |
| Hong Kong | 38 | 0.3% |
| India | 29 | 0.2% |
| Iran | 16 | 0.1% |
| Ireland | 8 | 0.1% |
| Israel | 84 | 0.6% |
| Jordan | 5 | 0.0% |
| Kazakhstan | 10 | 0.1% |
| Korea | 12 | 0.1% |
| Latin America | 132 | 1.0% |
| Mexico | 19 | 0.1% |
| Nepal | 9 | 0.1% |
| Nigeria | 23 | 0.2% |
| Northern Africa | 39 | 0.3% |
| Northern Europe | 33 | 0.2% |
| Pakistan | 30 | 0.2% |
| Romania | 32 | 0.2% |
| Russia | 103 | 0.8% |
| South America | 98 | 0.7% |
| South Central Asia | 94 | 0.7% |
| Switzerland | 6 | 0.0% |
| Turkey | 23 | 0.2% |
| Ukraine | 68 | 0.5% |
| Venezuela | 26 | 0.2% |
| Western Africa | 23 | 0.2% |
| Western Asia | 123 | 0.9% |
| Western Europe | 13 | 0.1% | View All 46 Rows |
Sex and Age in Bexley
Sex and Age in Bexley
The most populous age groups in Bexley are 15 to 19 Years (839 | 12.9%) for men and 15 to 19 Years (777 | 11.1%) for women.
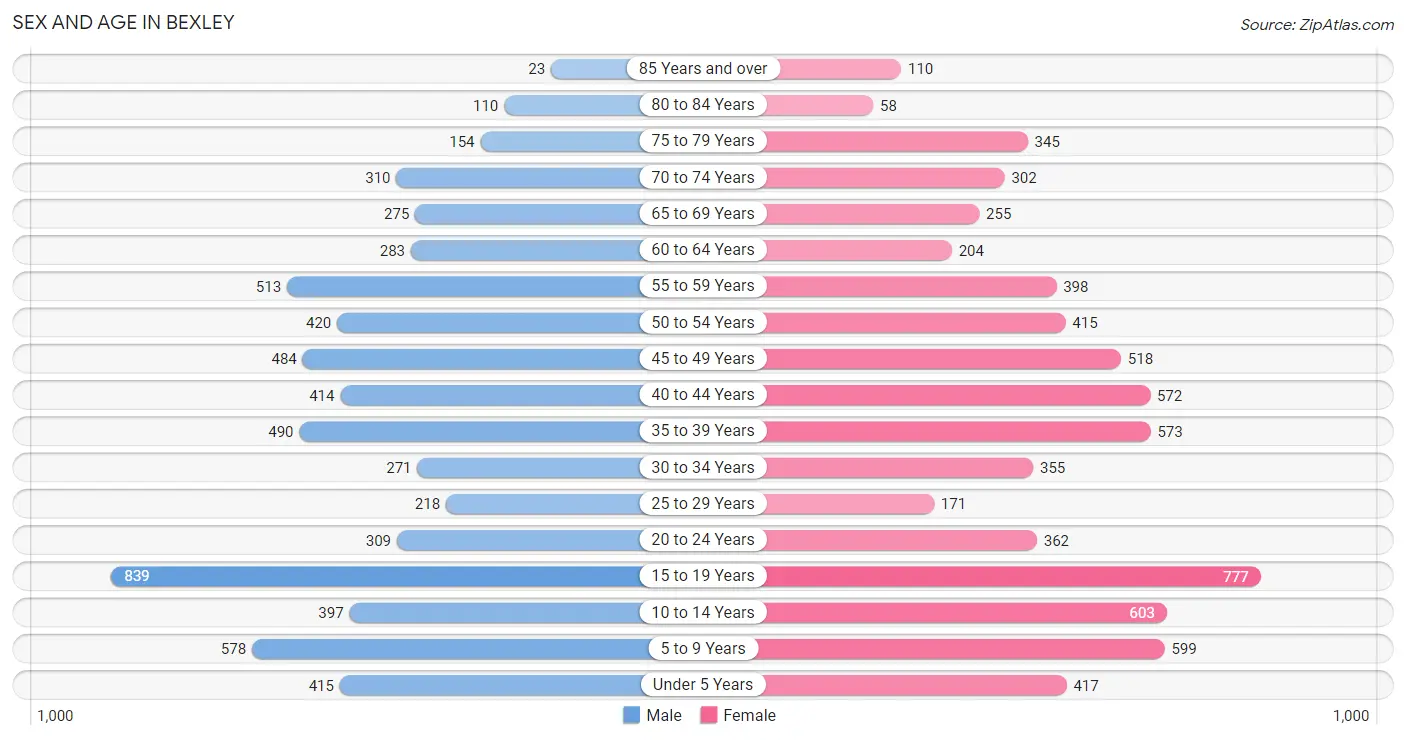
| Age Bracket | Male | Female |
| Under 5 Years | 415 (6.4%) | 417 (5.9%) |
| 5 to 9 Years | 578 (8.9%) | 599 (8.5%) |
| 10 to 14 Years | 397 (6.1%) | 603 (8.6%) |
| 15 to 19 Years | 839 (12.9%) | 777 (11.1%) |
| 20 to 24 Years | 309 (4.8%) | 362 (5.1%) |
| 25 to 29 Years | 218 (3.4%) | 171 (2.4%) |
| 30 to 34 Years | 271 (4.2%) | 355 (5.1%) |
| 35 to 39 Years | 490 (7.5%) | 573 (8.2%) |
| 40 to 44 Years | 414 (6.4%) | 572 (8.1%) |
| 45 to 49 Years | 484 (7.4%) | 518 (7.4%) |
| 50 to 54 Years | 420 (6.5%) | 415 (5.9%) |
| 55 to 59 Years | 513 (7.9%) | 398 (5.7%) |
| 60 to 64 Years | 283 (4.3%) | 204 (2.9%) |
| 65 to 69 Years | 275 (4.2%) | 255 (3.6%) |
| 70 to 74 Years | 310 (4.8%) | 302 (4.3%) |
| 75 to 79 Years | 154 (2.4%) | 345 (4.9%) |
| 80 to 84 Years | 110 (1.7%) | 58 (0.8%) |
| 85 Years and over | 23 (0.4%) | 110 (1.6%) |
| Total | 6,503 (100.0%) | 7,034 (100.0%) |
Families and Households in Bexley
Median Family Size in Bexley
The median family size in Bexley is 3.10 persons per family, with married-couple families (2,867 | 81.3%) accounting for the largest median family size of 3.22 persons per family. On the other hand, single male/father families (92 | 2.6%) represent the smallest median family size with 2.49 persons per family.
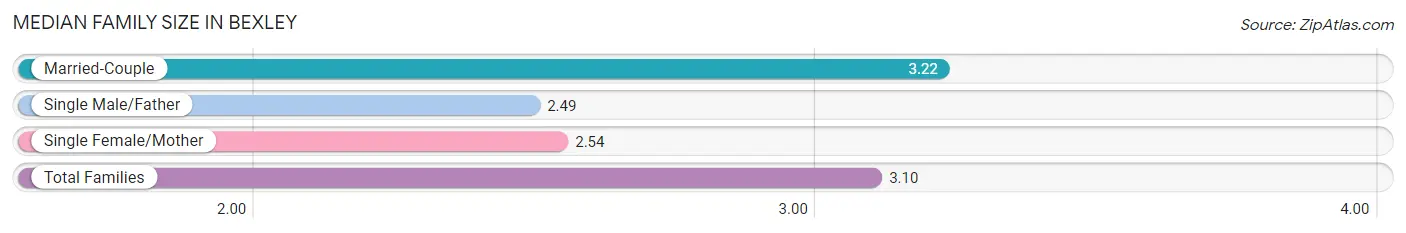
| Family Type | # Families | Family Size |
| Married-Couple | 2,867 (81.3%) | 3.22 |
| Single Male/Father | 92 (2.6%) | 2.49 |
| Single Female/Mother | 567 (16.1%) | 2.54 |
| Total Families | 3,526 (100.0%) | 3.10 |
Median Household Size in Bexley
The median household size in Bexley is 2.63 persons per household, with married-couple households (2,867 | 60.4%) accounting for the largest median household size of 3.24 persons per household. non-family households (1,224 | 25.8%) represent the smallest median household size with 1.19 persons per household.
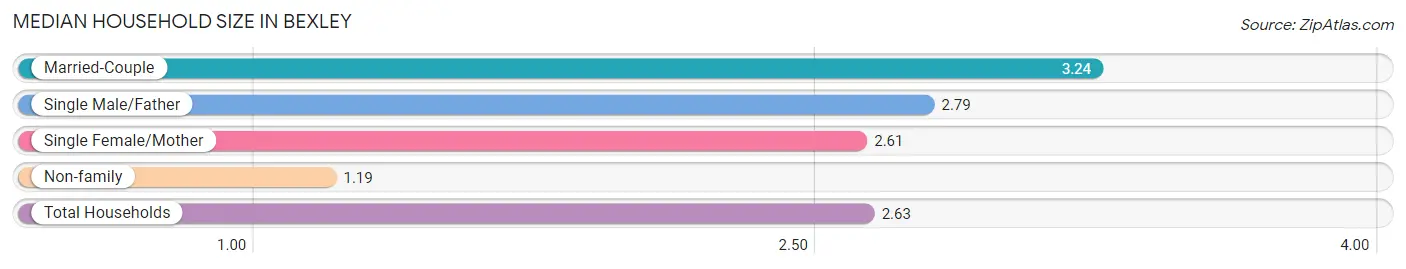
| Household Type | # Households | Household Size |
| Married-Couple | 2,867 (60.4%) | 3.24 |
| Single Male/Father | 92 (1.9%) | 2.79 |
| Single Female/Mother | 567 (11.9%) | 2.61 |
| Non-family | 1,224 (25.8%) | 1.19 |
| Total Households | 4,750 (100.0%) | 2.63 |
Household Size by Marriage Status in Bexley
Out of a total of 4,750 households in Bexley, 3,526 (74.2%) are family households, while 1,224 (25.8%) are nonfamily households. The most numerous type of family households are 2-person households, comprising 1,401, and the most common type of nonfamily households are 1-person households, comprising 1,013.
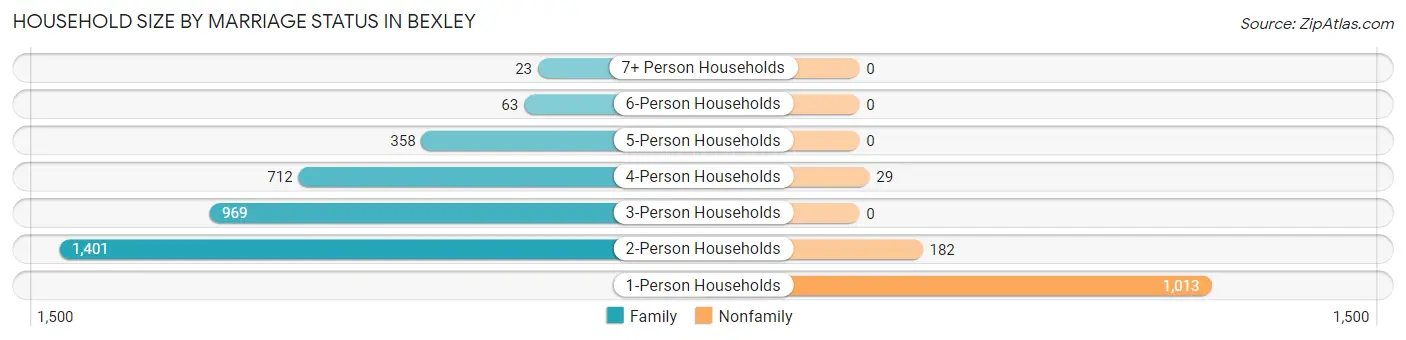
| Household Size | Family Households | Nonfamily Households |
| 1-Person Households | - | 1,013 (21.3%) |
| 2-Person Households | 1,401 (29.5%) | 182 (3.8%) |
| 3-Person Households | 969 (20.4%) | 0 (0.0%) |
| 4-Person Households | 712 (15.0%) | 29 (0.6%) |
| 5-Person Households | 358 (7.5%) | 0 (0.0%) |
| 6-Person Households | 63 (1.3%) | 0 (0.0%) |
| 7+ Person Households | 23 (0.5%) | 0 (0.0%) |
| Total | 3,526 (74.2%) | 1,224 (25.8%) |
Female Fertility in Bexley
Fertility by Age in Bexley
Average fertility rate in Bexley is 45.0 births per 1,000 women. Women in the age bracket of 20 to 34 years have the highest fertility rate with 80.0 births per 1,000 women. Women in the age bracket of 35 to 50 years acount for 53.9% of all women with births.
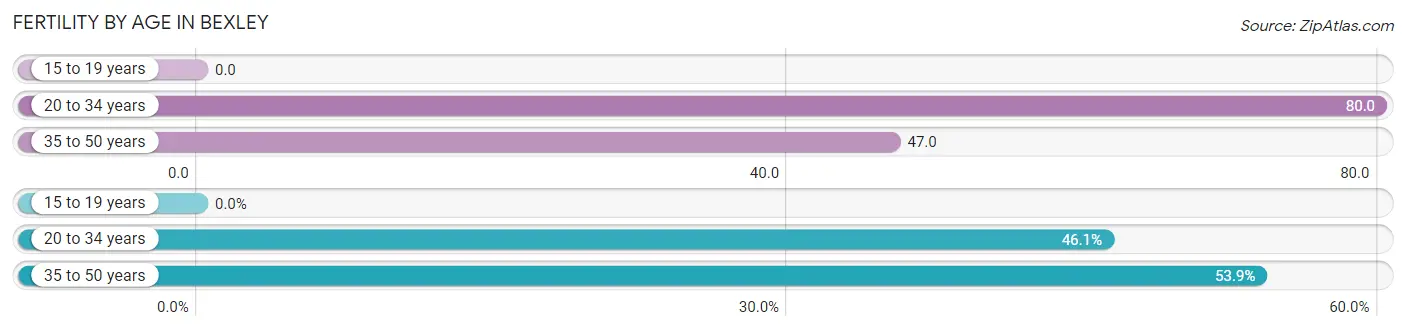
| Age Bracket | Women with Births | Births / 1,000 Women |
| 15 to 19 years | 0 (0.0%) | 0.0 |
| 20 to 34 years | 71 (46.1%) | 80.0 |
| 35 to 50 years | 83 (53.9%) | 47.0 |
| Total | 154 (100.0%) | 45.0 |
Fertility by Age by Marriage Status in Bexley
85.1% of women with births (154) in Bexley are married. The highest percentage of unmarried women with births falls into 20 to 34 years age bracket with 32.4% of them unmarried at the time of birth, while the lowest percentage of unmarried women with births belong to 35 to 50 years age bracket with 0.0% of them unmarried.
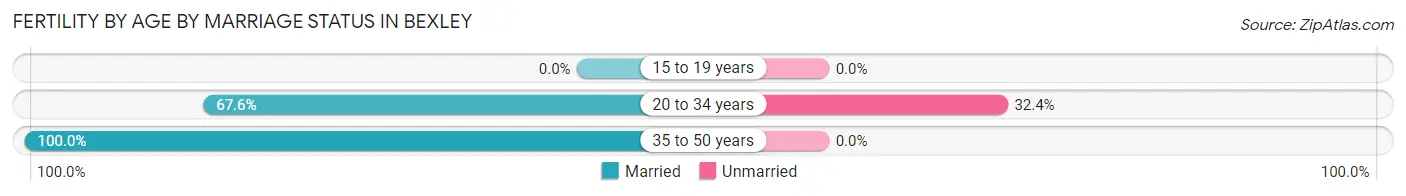
| Age Bracket | Married | Unmarried |
| 15 to 19 years | 0 (0.0%) | 0 (0.0%) |
| 20 to 34 years | 48 (67.6%) | 23 (32.4%) |
| 35 to 50 years | 83 (100.0%) | 0 (0.0%) |
| Total | 131 (85.1%) | 23 (14.9%) |
Fertility by Education in Bexley
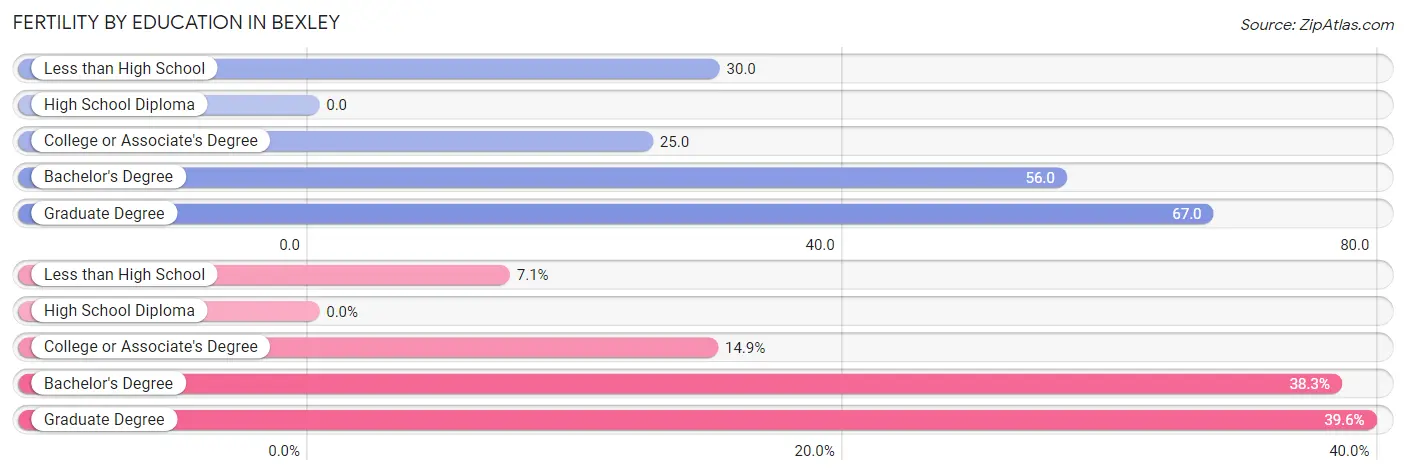
| Educational Attainment | Women with Births | Births / 1,000 Women |
| Less than High School | 11 (7.1%) | 30.0 |
| High School Diploma | 0 (0.0%) | 0.0 |
| College or Associate's Degree | 23 (14.9%) | 25.0 |
| Bachelor's Degree | 59 (38.3%) | 56.0 |
| Graduate Degree | 61 (39.6%) | 67.0 |
| Total | 154 (100.0%) | 45.0 |
Fertility by Education by Marriage Status in Bexley
14.9% of women with births in Bexley are unmarried. Women with the educational attainment of less than high school are most likely to be married with 100.0% of them married at childbirth, while women with the educational attainment of college or associate's degree are least likely to be married with 100.0% of them unmarried at childbirth.
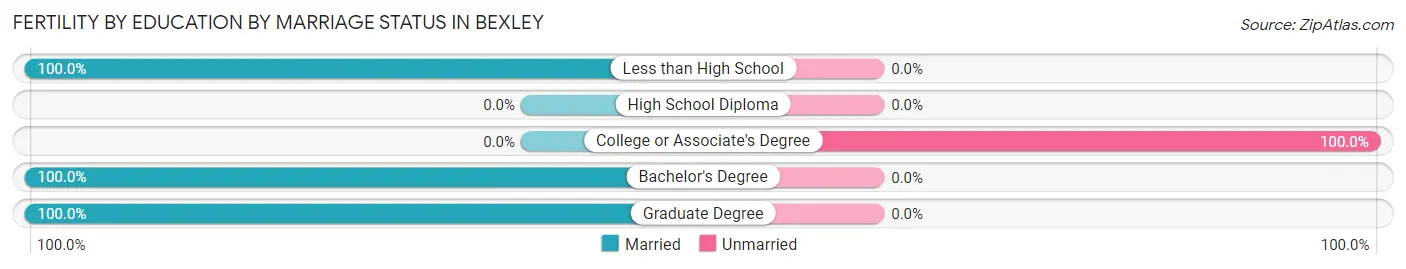
| Educational Attainment | Married | Unmarried |
| Less than High School | 11 (100.0%) | 0 (0.0%) |
| High School Diploma | 0 (0.0%) | 0 (0.0%) |
| College or Associate's Degree | 0 (0.0%) | 23 (100.0%) |
| Bachelor's Degree | 59 (100.0%) | 0 (0.0%) |
| Graduate Degree | 61 (100.0%) | 0 (0.0%) |
| Total | 131 (85.1%) | 23 (14.9%) |
Employment Characteristics in Bexley
Employment by Class of Employer in Bexley
Among the 6,446 employed individuals in Bexley, private company employees (3,381 | 52.4%), not-for-profit organizations (1,016 | 15.8%), and local government employees (544 | 8.4%) make up the most common classes of employment.
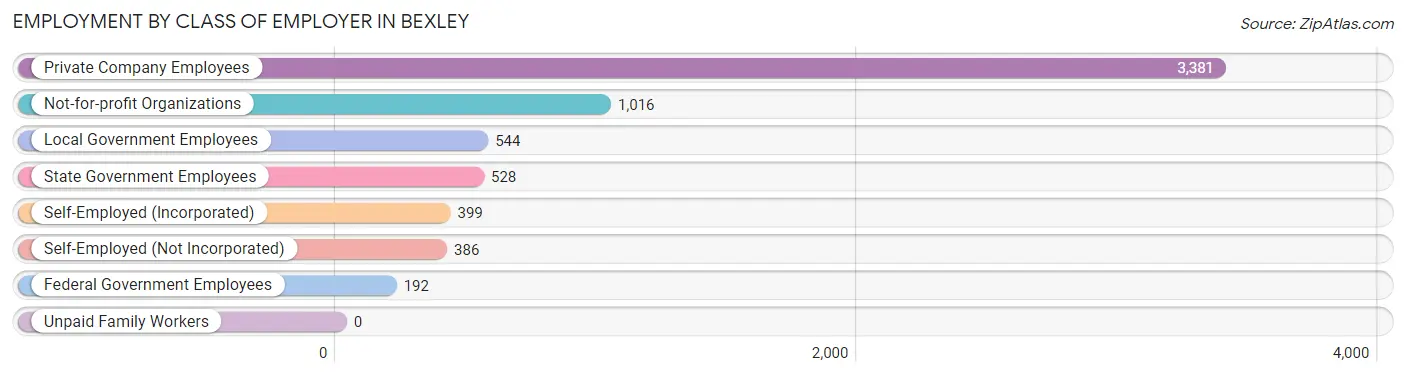
| Employer Class | # Employees | % Employees |
| Private Company Employees | 3,381 | 52.4% |
| Self-Employed (Incorporated) | 399 | 6.2% |
| Self-Employed (Not Incorporated) | 386 | 6.0% |
| Not-for-profit Organizations | 1,016 | 15.8% |
| Local Government Employees | 544 | 8.4% |
| State Government Employees | 528 | 8.2% |
| Federal Government Employees | 192 | 3.0% |
| Unpaid Family Workers | 0 | 0.0% |
| Total | 6,446 | 100.0% |
Employment Status by Age in Bexley
According to the labor force statistics for Bexley, out of the total population over 16 years of age (10,284), 66.2% or 6,808 individuals are in the labor force, with 3.5% or 238 of them unemployed. The age group with the highest labor force participation rate is 35 to 44 years, with 92.2% or 1,889 individuals in the labor force. Within the labor force, the 75 years and over age range has the highest percentage of unemployed individuals, with 34.0% or 33 of them being unemployed.
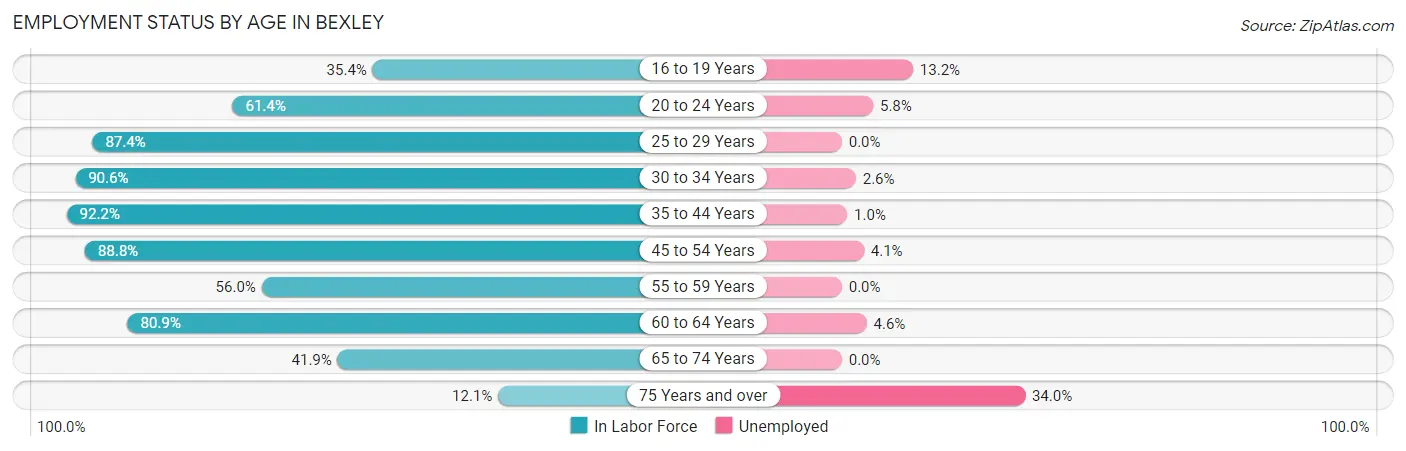
| Age Bracket | In Labor Force | Unemployed |
| 16 to 19 Years | 486 (35.4%) | 64 (13.2%) |
| 20 to 24 Years | 412 (61.4%) | 24 (5.8%) |
| 25 to 29 Years | 340 (87.4%) | 0 (0.0%) |
| 30 to 34 Years | 567 (90.6%) | 15 (2.6%) |
| 35 to 44 Years | 1,889 (92.2%) | 19 (1.0%) |
| 45 to 54 Years | 1,631 (88.8%) | 67 (4.1%) |
| 55 to 59 Years | 510 (56.0%) | 0 (0.0%) |
| 60 to 64 Years | 394 (80.9%) | 18 (4.6%) |
| 65 to 74 Years | 478 (41.9%) | 0 (0.0%) |
| 75 Years and over | 97 (12.1%) | 33 (34.0%) |
| Total | 6,808 (66.2%) | 238 (3.5%) |
Employment Status by Educational Attainment in Bexley
According to labor force statistics for Bexley, 84.6% of individuals (5,329) out of the total population between 25 and 64 years of age (6,299) are in the labor force, with 2.2% or 117 of them being unemployed. The group with the highest labor force participation rate are those with the educational attainment of bachelor's degree or higher, with 88.4% or 4,432 individuals in the labor force. Within the labor force, individuals with high school diploma education have the highest percentage of unemployment, with 18.3% or 40 of them being unemployed.
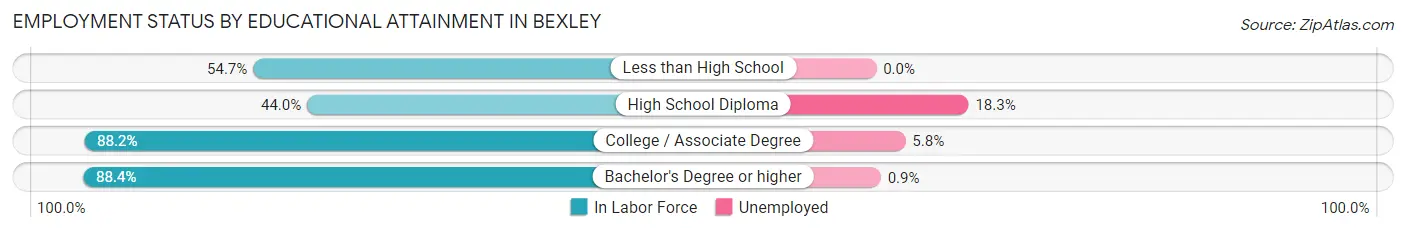
| Educational Attainment | In Labor Force | Unemployed |
| Less than High School | 29 (54.7%) | 0 (0.0%) |
| High School Diploma | 218 (44.0%) | 91 (18.3%) |
| College / Associate Degree | 650 (88.2%) | 43 (5.8%) |
| Bachelor's Degree or higher | 4,432 (88.4%) | 45 (0.9%) |
| Total | 5,329 (84.6%) | 139 (2.2%) |
Employment Occupations by Sex in Bexley
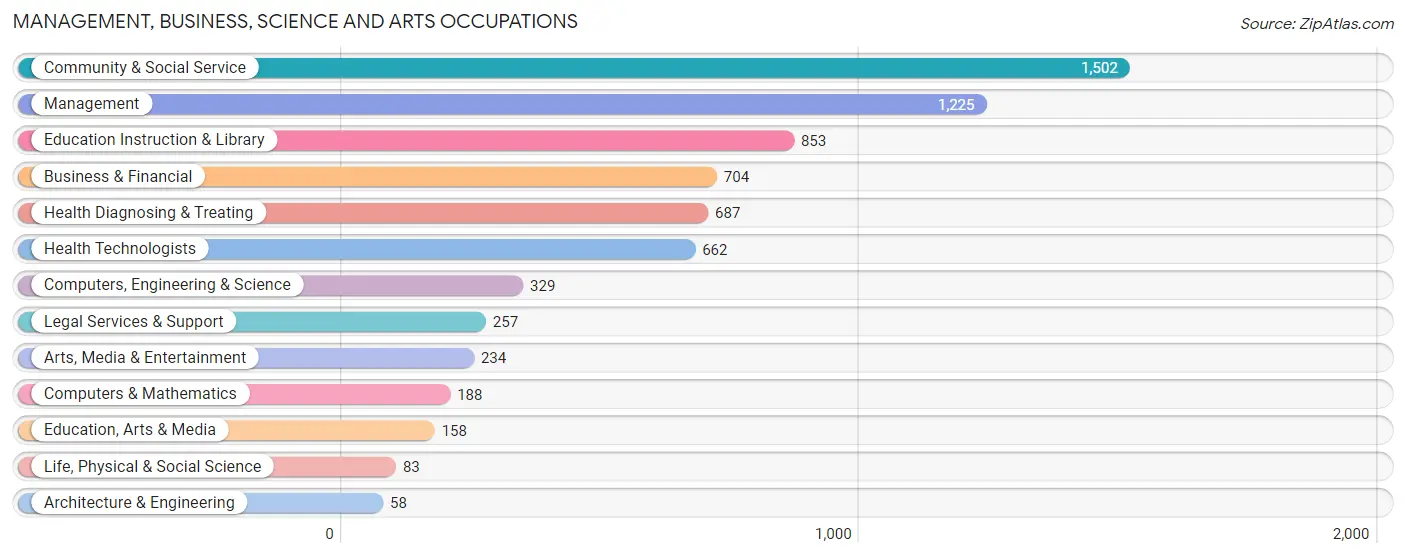
Management, Business, Science and Arts Occupations
The most common Management, Business, Science and Arts occupations in Bexley are Community & Social Service (1,502 | 22.9%), Management (1,225 | 18.7%), Education Instruction & Library (853 | 13.0%), Business & Financial (704 | 10.7%), and Health Diagnosing & Treating (687 | 10.5%).
Management, Business, Science and Arts Occupations by Sex
Within the Management, Business, Science and Arts occupations in Bexley, the most male-oriented occupations are Architecture & Engineering (100.0%), Life, Physical & Social Science (84.3%), and Computers, Engineering & Science (83.0%), while the most female-oriented occupations are Education, Arts & Media (100.0%), Health Diagnosing & Treating (67.0%), and Health Technologists (65.7%).
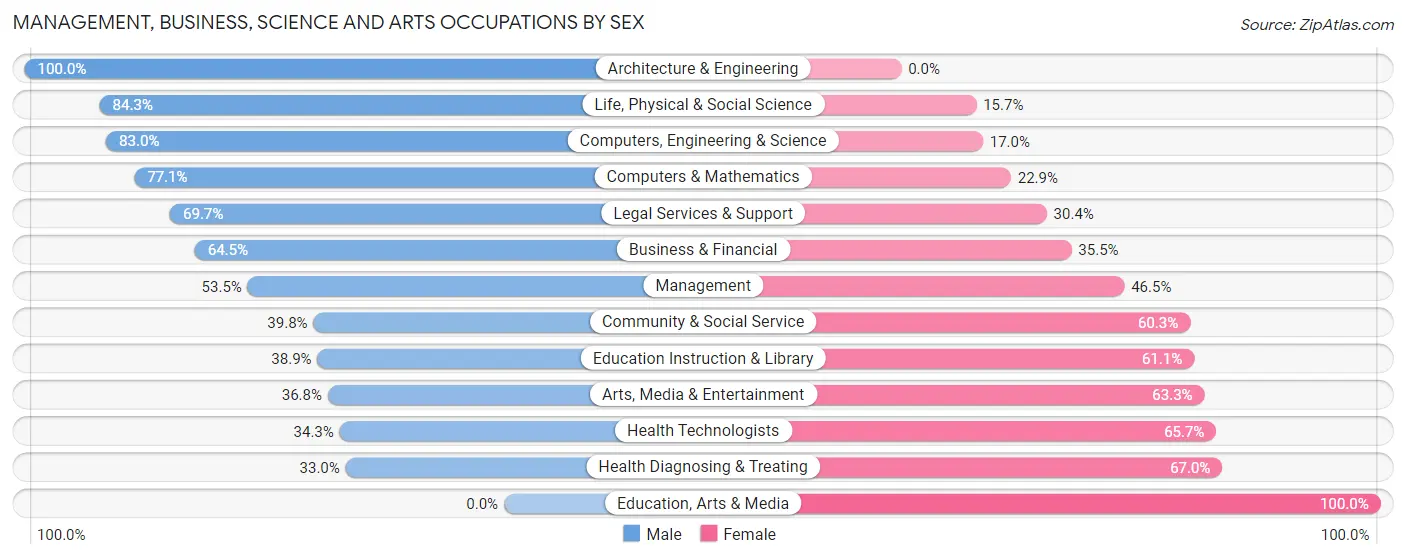
| Occupation | Male | Female |
| Management | 655 (53.5%) | 570 (46.5%) |
| Business & Financial | 454 (64.5%) | 250 (35.5%) |
| Computers, Engineering & Science | 273 (83.0%) | 56 (17.0%) |
| Computers & Mathematics | 145 (77.1%) | 43 (22.9%) |
| Architecture & Engineering | 58 (100.0%) | 0 (0.0%) |
| Life, Physical & Social Science | 70 (84.3%) | 13 (15.7%) |
| Community & Social Service | 597 (39.8%) | 905 (60.3%) |
| Education, Arts & Media | 0 (0.0%) | 158 (100.0%) |
| Legal Services & Support | 179 (69.7%) | 78 (30.3%) |
| Education Instruction & Library | 332 (38.9%) | 521 (61.1%) |
| Arts, Media & Entertainment | 86 (36.7%) | 148 (63.2%) |
| Health Diagnosing & Treating | 227 (33.0%) | 460 (67.0%) |
| Health Technologists | 227 (34.3%) | 435 (65.7%) |
| Total (Category) | 2,206 (49.6%) | 2,241 (50.4%) |
| Total (Overall) | 3,314 (50.6%) | 3,240 (49.4%) |
Services Occupations
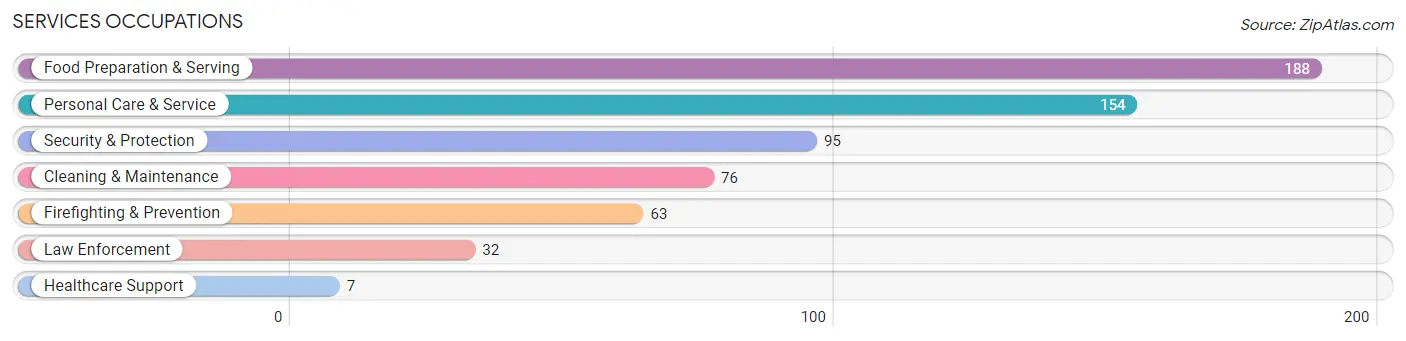
The most common Services occupations in Bexley are Food Preparation & Serving (188 | 2.9%), Personal Care & Service (154 | 2.4%), Security & Protection (95 | 1.5%), Cleaning & Maintenance (76 | 1.2%), and Firefighting & Prevention (63 | 1.0%).
Services Occupations by Sex
Within the Services occupations in Bexley, the most male-oriented occupations are Law Enforcement (100.0%), Security & Protection (70.5%), and Firefighting & Prevention (55.6%), while the most female-oriented occupations are Healthcare Support (100.0%), Personal Care & Service (77.9%), and Food Preparation & Serving (74.5%).
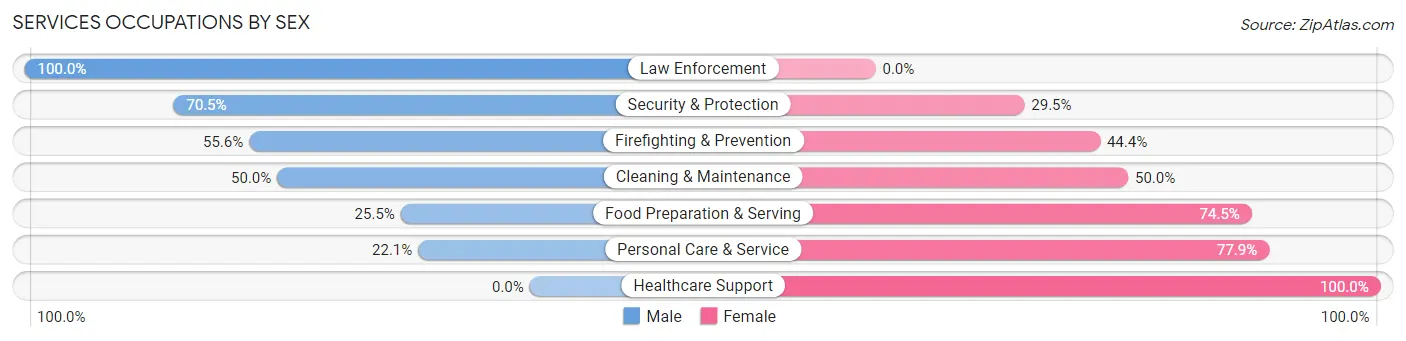
| Occupation | Male | Female |
| Healthcare Support | 0 (0.0%) | 7 (100.0%) |
| Security & Protection | 67 (70.5%) | 28 (29.5%) |
| Firefighting & Prevention | 35 (55.6%) | 28 (44.4%) |
| Law Enforcement | 32 (100.0%) | 0 (0.0%) |
| Food Preparation & Serving | 48 (25.5%) | 140 (74.5%) |
| Cleaning & Maintenance | 38 (50.0%) | 38 (50.0%) |
| Personal Care & Service | 34 (22.1%) | 120 (77.9%) |
| Total (Category) | 187 (36.0%) | 333 (64.0%) |
| Total (Overall) | 3,314 (50.6%) | 3,240 (49.4%) |
Sales and Office Occupations
The most common Sales and Office occupations in Bexley are Sales & Related (786 | 12.0%), and Office & Administration (344 | 5.2%).
Sales and Office Occupations by Sex
| Occupation | Male | Female |
| Sales & Related | 429 (54.6%) | 357 (45.4%) |
| Office & Administration | 109 (31.7%) | 235 (68.3%) |
| Total (Category) | 538 (47.6%) | 592 (52.4%) |
| Total (Overall) | 3,314 (50.6%) | 3,240 (49.4%) |
Natural Resources, Construction and Maintenance Occupations
The most common Natural Resources, Construction and Maintenance occupations in Bexley are Construction & Extraction (110 | 1.7%), Installation, Maintenance & Repair (30 | 0.5%), and Farming, Fishing & Forestry (6 | 0.1%).
Natural Resources, Construction and Maintenance Occupations by Sex
| Occupation | Male | Female |
| Farming, Fishing & Forestry | 0 (0.0%) | 6 (100.0%) |
| Construction & Extraction | 110 (100.0%) | 0 (0.0%) |
| Installation, Maintenance & Repair | 30 (100.0%) | 0 (0.0%) |
| Total (Category) | 140 (95.9%) | 6 (4.1%) |
| Total (Overall) | 3,314 (50.6%) | 3,240 (49.4%) |
Production, Transportation and Moving Occupations
The most common Production, Transportation and Moving occupations in Bexley are Transportation (130 | 2.0%), Production (112 | 1.7%), and Material Moving (69 | 1.1%).
Production, Transportation and Moving Occupations by Sex
| Occupation | Male | Female |
| Production | 56 (50.0%) | 56 (50.0%) |
| Transportation | 127 (97.7%) | 3 (2.3%) |
| Material Moving | 60 (87.0%) | 9 (13.0%) |
| Total (Category) | 243 (78.1%) | 68 (21.9%) |
| Total (Overall) | 3,314 (50.6%) | 3,240 (49.4%) |
Employment Industries by Sex in Bexley
Employment Industries in Bexley
The major employment industries in Bexley include Educational Services (1,197 | 18.3%), Health Care & Social Assistance (980 | 14.9%), Retail Trade (794 | 12.1%), Professional & Scientific (731 | 11.2%), and Finance & Insurance (726 | 11.1%).
Employment Industries by Sex in Bexley
The Bexley industries that see more men than women are Construction (100.0%), Utilities (100.0%), and Transportation & Warehousing (93.1%), whereas the industries that tend to have a higher number of women are Agriculture, Fishing & Hunting (100.0%), Enterprise Management (100.0%), and Health Care & Social Assistance (70.8%).
| Industry | Male | Female |
| Agriculture, Fishing & Hunting | 0 (0.0%) | 6 (100.0%) |
| Mining, Quarrying, & Extraction | 0 (0.0%) | 0 (0.0%) |
| Construction | 170 (100.0%) | 0 (0.0%) |
| Manufacturing | 197 (78.8%) | 53 (21.2%) |
| Wholesale Trade | 95 (86.4%) | 15 (13.6%) |
| Retail Trade | 327 (41.2%) | 467 (58.8%) |
| Transportation & Warehousing | 162 (93.1%) | 12 (6.9%) |
| Utilities | 22 (100.0%) | 0 (0.0%) |
| Information | 50 (59.5%) | 34 (40.5%) |
| Finance & Insurance | 448 (61.7%) | 278 (38.3%) |
| Real Estate, Rental & Leasing | 100 (73.5%) | 36 (26.5%) |
| Professional & Scientific | 481 (65.8%) | 250 (34.2%) |
| Enterprise Management | 0 (0.0%) | 33 (100.0%) |
| Administrative & Support | 121 (76.6%) | 37 (23.4%) |
| Educational Services | 454 (37.9%) | 743 (62.1%) |
| Health Care & Social Assistance | 286 (29.2%) | 694 (70.8%) |
| Arts, Entertainment & Recreation | 39 (30.7%) | 88 (69.3%) |
| Accommodation & Food Services | 97 (36.3%) | 170 (63.7%) |
| Public Administration | 189 (52.1%) | 174 (47.9%) |
| Total | 3,314 (50.6%) | 3,240 (49.4%) |
Education in Bexley
School Enrollment in Bexley
The most common levels of schooling among the 4,919 students in Bexley are college / undergraduate (1,492 | 30.3%), middle school (858 | 17.4%), and high school (845 | 17.2%).
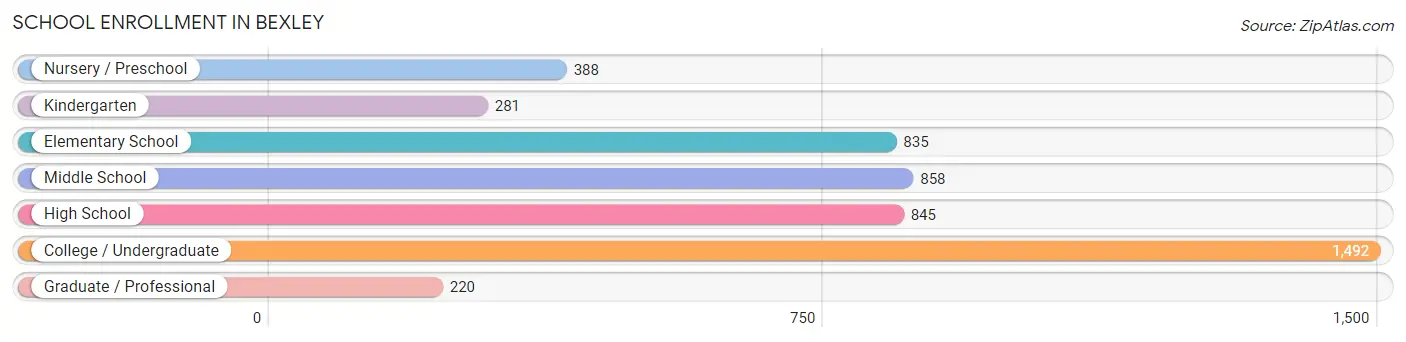
| School Level | # Students | % Students |
| Nursery / Preschool | 388 | 7.9% |
| Kindergarten | 281 | 5.7% |
| Elementary School | 835 | 17.0% |
| Middle School | 858 | 17.4% |
| High School | 845 | 17.2% |
| College / Undergraduate | 1,492 | 30.3% |
| Graduate / Professional | 220 | 4.5% |
| Total | 4,919 | 100.0% |
School Enrollment by Age by Funding Source in Bexley
Out of a total of 4,919 students who are enrolled in schools in Bexley, 1,717 (34.9%) attend a private institution, while the remaining 3,202 (65.1%) are enrolled in public schools. The age group of 3 to 4 year olds has the highest likelihood of being enrolled in private schools, with 268 (86.2% in the age bracket) enrolled. Conversely, the age group of 15 to 17 year olds has the lowest likelihood of being enrolled in a private school, with 573 (80.7% in the age bracket) attending a public institution.
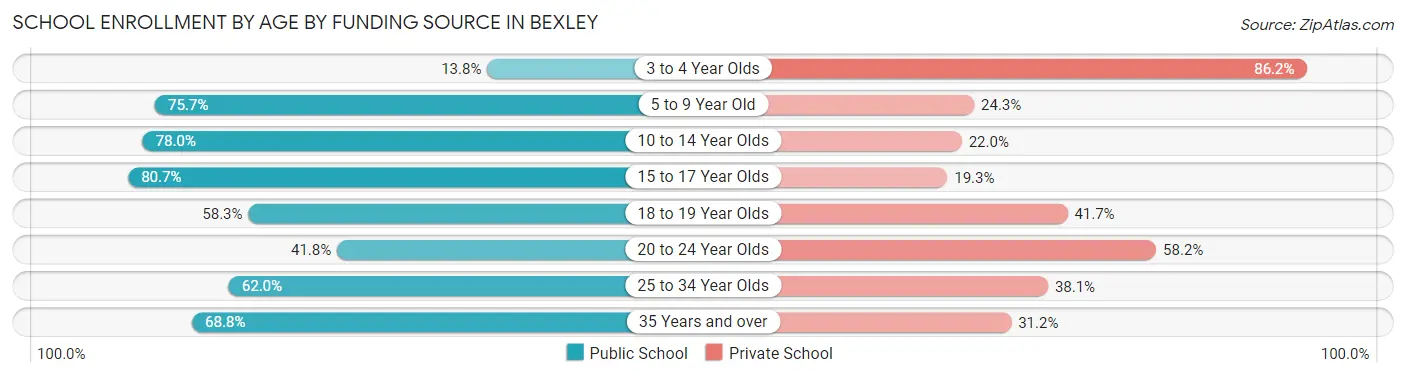
| Age Bracket | Public School | Private School |
| 3 to 4 Year Olds | 43 (13.8%) | 268 (86.2%) |
| 5 to 9 Year Old | 869 (75.7%) | 279 (24.3%) |
| 10 to 14 Year Olds | 770 (78.0%) | 217 (22.0%) |
| 15 to 17 Year Olds | 573 (80.7%) | 137 (19.3%) |
| 18 to 19 Year Olds | 508 (58.3%) | 363 (41.7%) |
| 20 to 24 Year Olds | 260 (41.8%) | 362 (58.2%) |
| 25 to 34 Year Olds | 70 (62.0%) | 43 (38.1%) |
| 35 Years and over | 108 (68.8%) | 49 (31.2%) |
| Total | 3,202 (65.1%) | 1,717 (34.9%) |
Educational Attainment by Field of Study in Bexley
Business (1,342 | 19.3%), social sciences (911 | 13.1%), education (672 | 9.7%), literature & languages (538 | 7.7%), and communications (477 | 6.9%) are the most common fields of study among 6,953 individuals in Bexley who have obtained a bachelor's degree or higher.
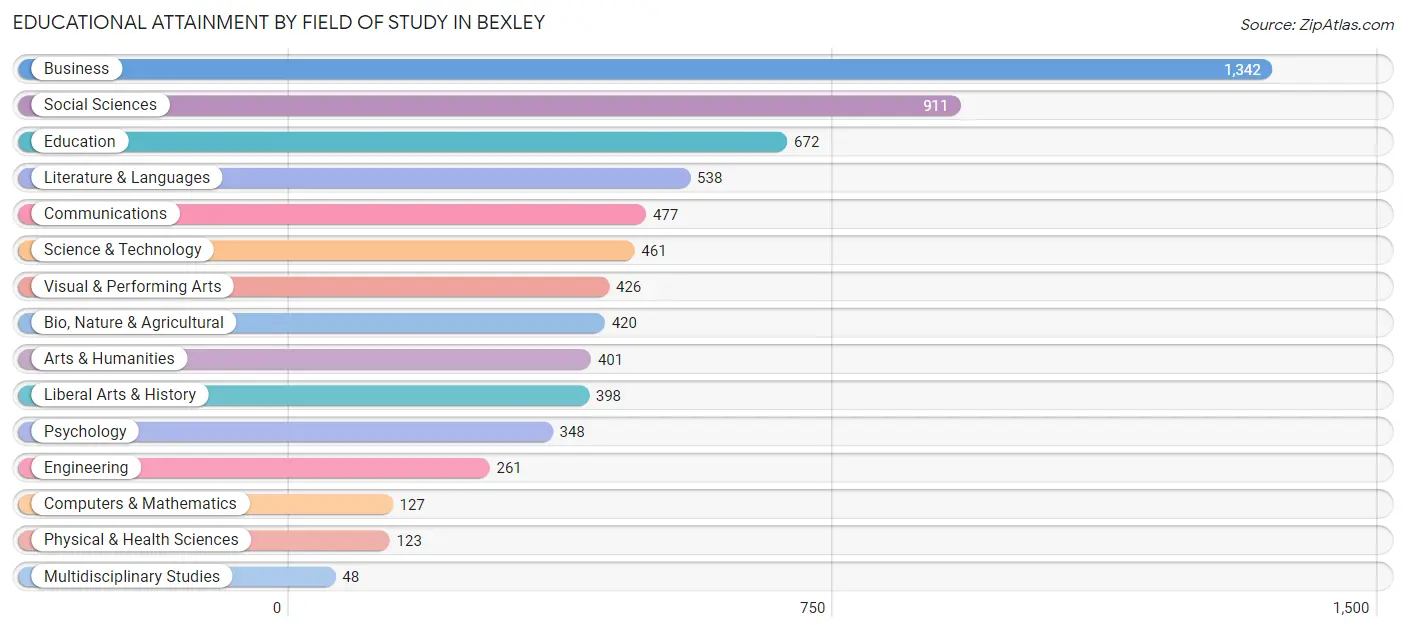
| Field of Study | # Graduates | % Graduates |
| Computers & Mathematics | 127 | 1.8% |
| Bio, Nature & Agricultural | 420 | 6.0% |
| Physical & Health Sciences | 123 | 1.8% |
| Psychology | 348 | 5.0% |
| Social Sciences | 911 | 13.1% |
| Engineering | 261 | 3.7% |
| Multidisciplinary Studies | 48 | 0.7% |
| Science & Technology | 461 | 6.6% |
| Business | 1,342 | 19.3% |
| Education | 672 | 9.7% |
| Literature & Languages | 538 | 7.7% |
| Liberal Arts & History | 398 | 5.7% |
| Visual & Performing Arts | 426 | 6.1% |
| Communications | 477 | 6.9% |
| Arts & Humanities | 401 | 5.8% |
| Total | 6,953 | 100.0% |
Transportation & Commute in Bexley
Vehicle Availability by Sex in Bexley
The most prevalent vehicle ownership categories in Bexley are males with 2 vehicles (1,808, accounting for 57.9%) and females with 2 vehicles (1,569, making up 61.7%).
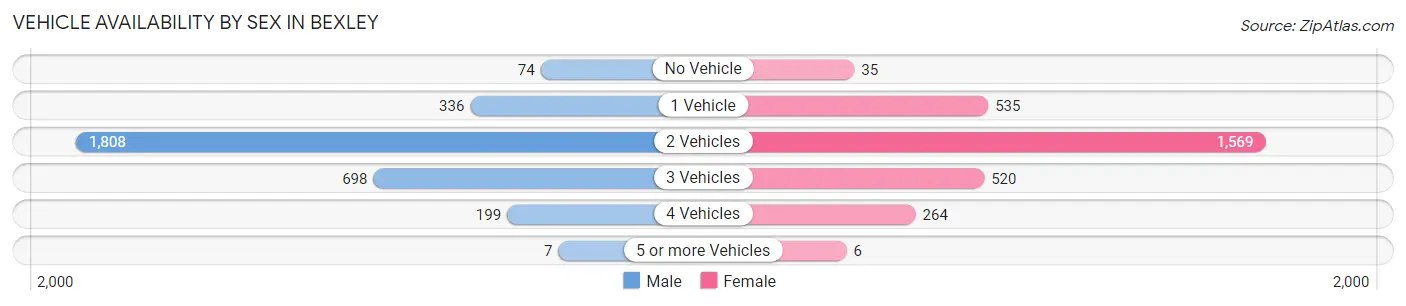
| Vehicles Available | Male | Female |
| No Vehicle | 74 (2.4%) | 35 (1.2%) |
| 1 Vehicle | 336 (10.8%) | 535 (18.3%) |
| 2 Vehicles | 1,808 (57.9%) | 1,569 (53.6%) |
| 3 Vehicles | 698 (22.4%) | 520 (17.7%) |
| 4 Vehicles | 199 (6.4%) | 264 (9.0%) |
| 5 or more Vehicles | 7 (0.2%) | 6 (0.2%) |
| Total | 3,122 (100.0%) | 2,929 (100.0%) |
Commute Time in Bexley
The most frequently occuring commute durations in Bexley are 15 to 19 minutes (1,419 commuters, 27.4%), 20 to 24 minutes (872 commuters, 16.9%), and 10 to 14 minutes (850 commuters, 16.4%).
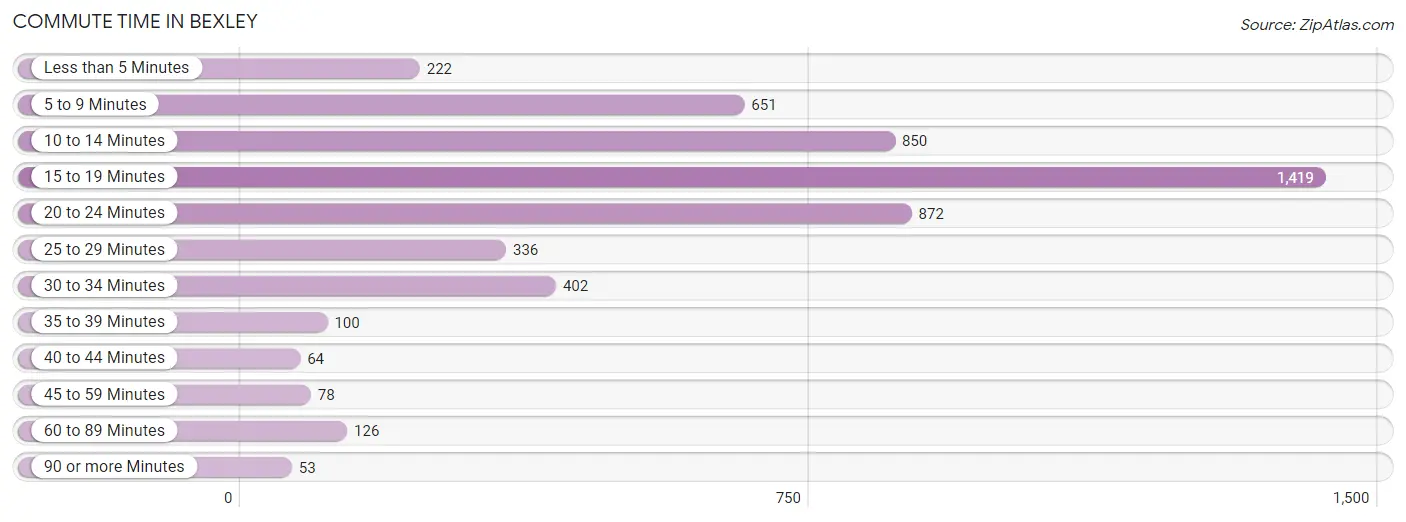
| Commute Time | # Commuters | % Commuters |
| Less than 5 Minutes | 222 | 4.3% |
| 5 to 9 Minutes | 651 | 12.6% |
| 10 to 14 Minutes | 850 | 16.4% |
| 15 to 19 Minutes | 1,419 | 27.4% |
| 20 to 24 Minutes | 872 | 16.9% |
| 25 to 29 Minutes | 336 | 6.5% |
| 30 to 34 Minutes | 402 | 7.8% |
| 35 to 39 Minutes | 100 | 1.9% |
| 40 to 44 Minutes | 64 | 1.2% |
| 45 to 59 Minutes | 78 | 1.5% |
| 60 to 89 Minutes | 126 | 2.4% |
| 90 or more Minutes | 53 | 1.0% |
Commute Time by Sex in Bexley
The most common commute times in Bexley are 15 to 19 minutes (742 commuters, 28.8%) for males and 15 to 19 minutes (677 commuters, 26.1%) for females.
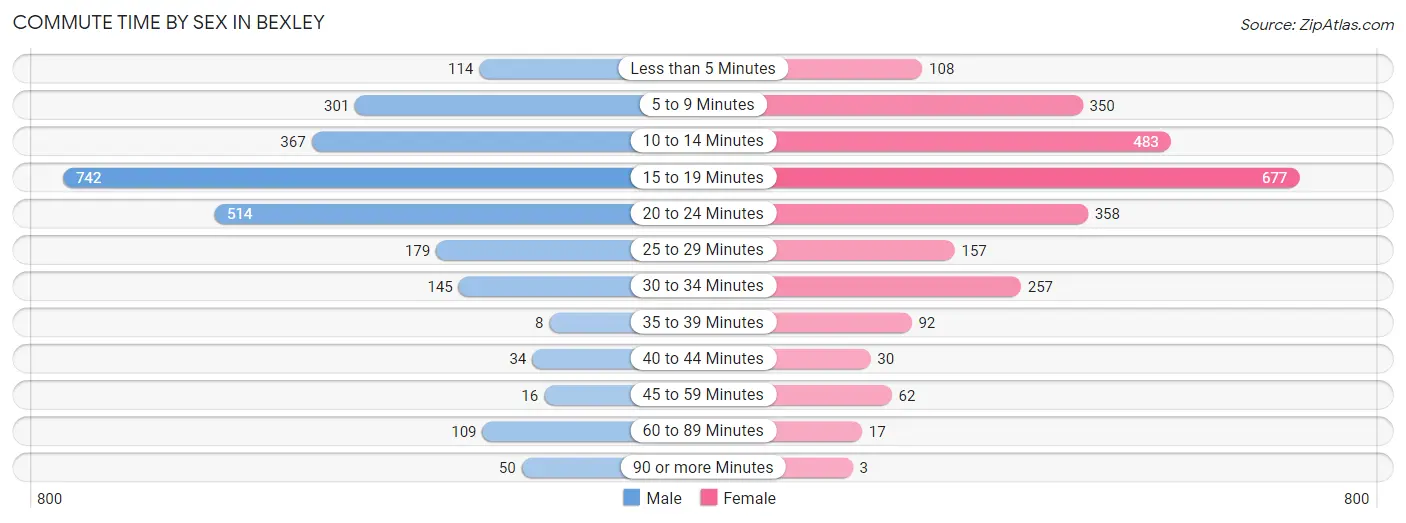
| Commute Time | Male | Female |
| Less than 5 Minutes | 114 (4.4%) | 108 (4.2%) |
| 5 to 9 Minutes | 301 (11.7%) | 350 (13.5%) |
| 10 to 14 Minutes | 367 (14.2%) | 483 (18.6%) |
| 15 to 19 Minutes | 742 (28.8%) | 677 (26.1%) |
| 20 to 24 Minutes | 514 (19.9%) | 358 (13.8%) |
| 25 to 29 Minutes | 179 (6.9%) | 157 (6.0%) |
| 30 to 34 Minutes | 145 (5.6%) | 257 (9.9%) |
| 35 to 39 Minutes | 8 (0.3%) | 92 (3.5%) |
| 40 to 44 Minutes | 34 (1.3%) | 30 (1.2%) |
| 45 to 59 Minutes | 16 (0.6%) | 62 (2.4%) |
| 60 to 89 Minutes | 109 (4.2%) | 17 (0.7%) |
| 90 or more Minutes | 50 (1.9%) | 3 (0.1%) |
Time of Departure to Work by Sex in Bexley
The most frequent times of departure to work in Bexley are 7:30 AM to 7:59 AM (544, 21.1%) for males and 7:30 AM to 7:59 AM (413, 15.9%) for females.
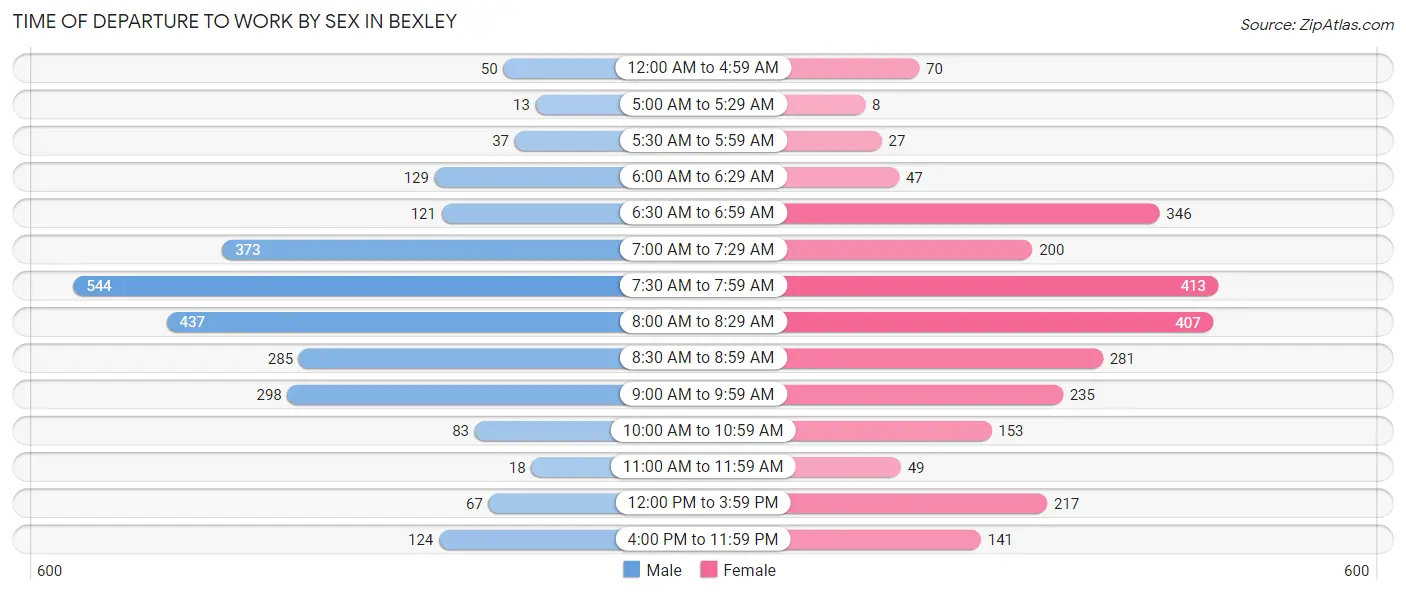
| Time of Departure | Male | Female |
| 12:00 AM to 4:59 AM | 50 (1.9%) | 70 (2.7%) |
| 5:00 AM to 5:29 AM | 13 (0.5%) | 8 (0.3%) |
| 5:30 AM to 5:59 AM | 37 (1.4%) | 27 (1.0%) |
| 6:00 AM to 6:29 AM | 129 (5.0%) | 47 (1.8%) |
| 6:30 AM to 6:59 AM | 121 (4.7%) | 346 (13.3%) |
| 7:00 AM to 7:29 AM | 373 (14.5%) | 200 (7.7%) |
| 7:30 AM to 7:59 AM | 544 (21.1%) | 413 (15.9%) |
| 8:00 AM to 8:29 AM | 437 (16.9%) | 407 (15.7%) |
| 8:30 AM to 8:59 AM | 285 (11.1%) | 281 (10.8%) |
| 9:00 AM to 9:59 AM | 298 (11.6%) | 235 (9.1%) |
| 10:00 AM to 10:59 AM | 83 (3.2%) | 153 (5.9%) |
| 11:00 AM to 11:59 AM | 18 (0.7%) | 49 (1.9%) |
| 12:00 PM to 3:59 PM | 67 (2.6%) | 217 (8.4%) |
| 4:00 PM to 11:59 PM | 124 (4.8%) | 141 (5.4%) |
| Total | 2,579 (100.0%) | 2,594 (100.0%) |
Housing Occupancy in Bexley
Occupancy by Ownership in Bexley
Of the total 4,750 dwellings in Bexley, owner-occupied units account for 3,644 (76.7%), while renter-occupied units make up 1,106 (23.3%).
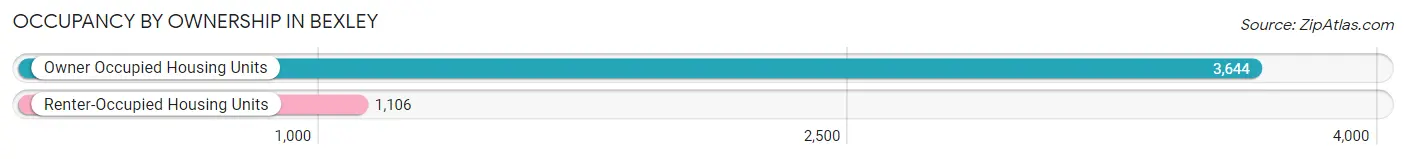
| Occupancy | # Housing Units | % Housing Units |
| Owner Occupied Housing Units | 3,644 | 76.7% |
| Renter-Occupied Housing Units | 1,106 | 23.3% |
| Total Occupied Housing Units | 4,750 | 100.0% |
Occupancy by Household Size in Bexley
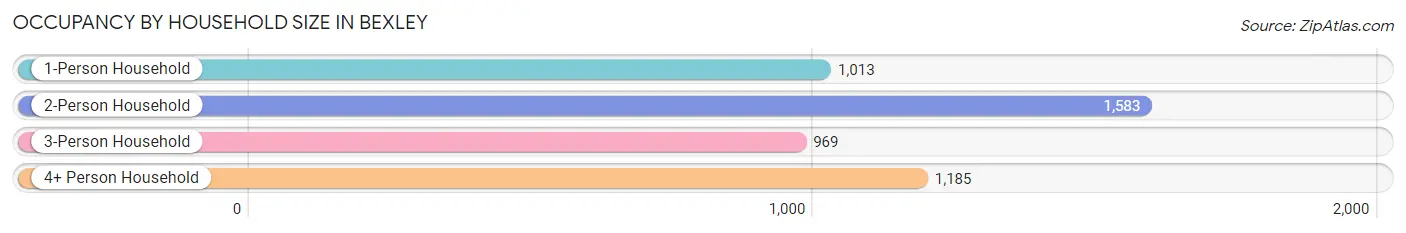
| Household Size | # Housing Units | % Housing Units |
| 1-Person Household | 1,013 | 21.3% |
| 2-Person Household | 1,583 | 33.3% |
| 3-Person Household | 969 | 20.4% |
| 4+ Person Household | 1,185 | 24.9% |
| Total Housing Units | 4,750 | 100.0% |
Occupancy by Ownership by Household Size in Bexley

| Household Size | Owner-occupied | Renter-occupied |
| 1-Person Household | 457 (45.1%) | 556 (54.9%) |
| 2-Person Household | 1,300 (82.1%) | 283 (17.9%) |
| 3-Person Household | 804 (83.0%) | 165 (17.0%) |
| 4+ Person Household | 1,083 (91.4%) | 102 (8.6%) |
| Total Housing Units | 3,644 (76.7%) | 1,106 (23.3%) |
Occupancy by Educational Attainment in Bexley
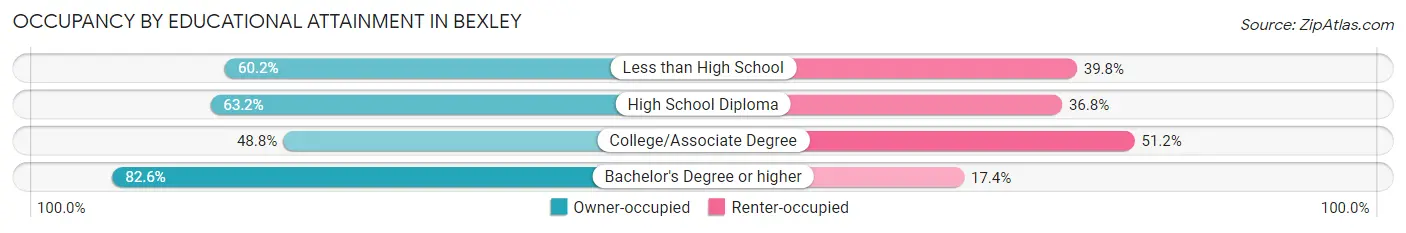
| Household Size | Owner-occupied | Renter-occupied |
| Less than High School | 106 (60.2%) | 70 (39.8%) |
| High School Diploma | 108 (63.2%) | 63 (36.8%) |
| College/Associate Degree | 297 (48.8%) | 312 (51.2%) |
| Bachelor's Degree or higher | 3,133 (82.6%) | 661 (17.4%) |
Occupancy by Age of Householder in Bexley
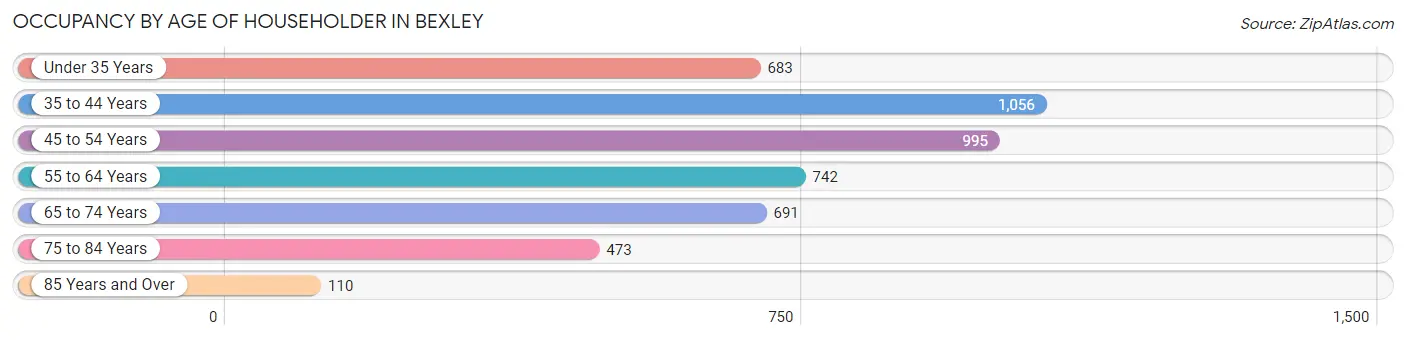
| Age Bracket | # Households | % Households |
| Under 35 Years | 683 | 14.4% |
| 35 to 44 Years | 1,056 | 22.2% |
| 45 to 54 Years | 995 | 20.9% |
| 55 to 64 Years | 742 | 15.6% |
| 65 to 74 Years | 691 | 14.5% |
| 75 to 84 Years | 473 | 10.0% |
| 85 Years and Over | 110 | 2.3% |
| Total | 4,750 | 100.0% |
Housing Finances in Bexley
Median Income by Occupancy in Bexley
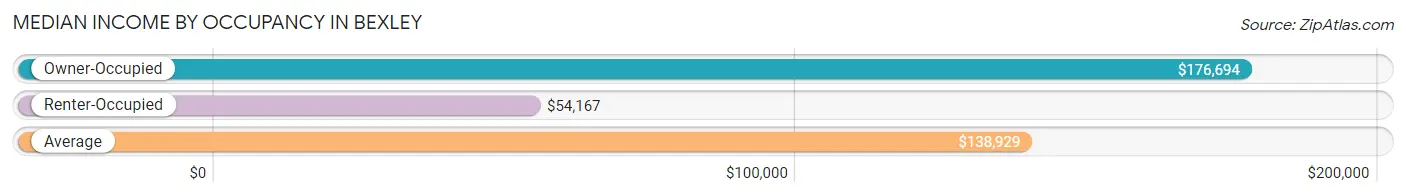
| Occupancy Type | # Households | Median Income |
| Owner-Occupied | 3,644 (76.7%) | $176,694 |
| Renter-Occupied | 1,106 (23.3%) | $54,167 |
| Average | 4,750 (100.0%) | $138,929 |
Occupancy by Householder Income Bracket in Bexley
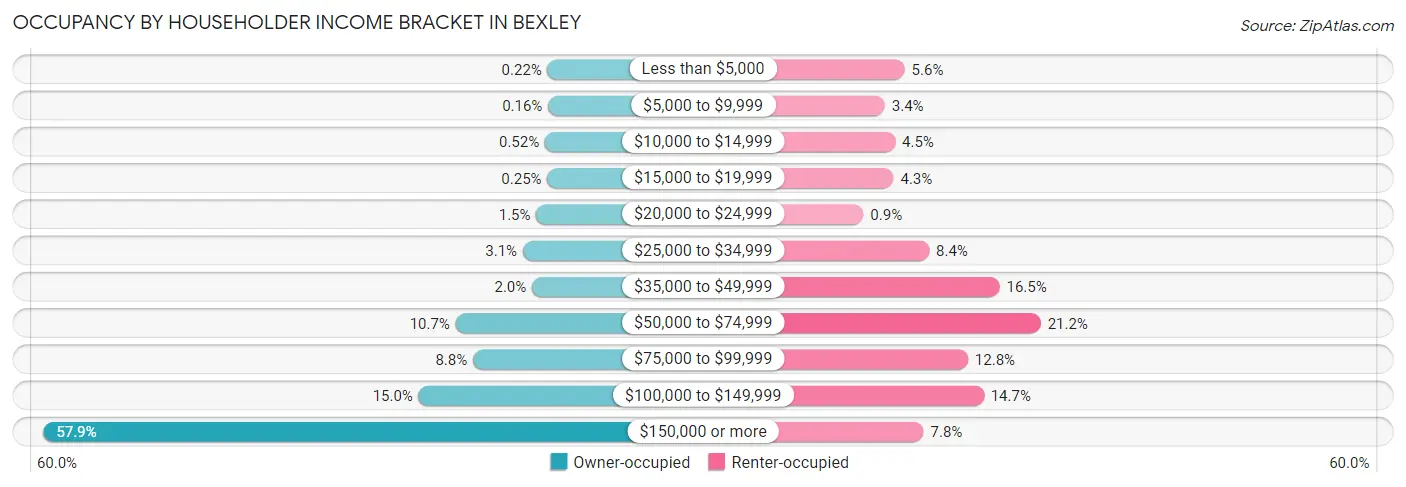
| Income Bracket | Owner-occupied | Renter-occupied |
| Less than $5,000 | 8 (0.2%) | 62 (5.6%) |
| $5,000 to $9,999 | 6 (0.2%) | 37 (3.4%) |
| $10,000 to $14,999 | 19 (0.5%) | 50 (4.5%) |
| $15,000 to $19,999 | 9 (0.3%) | 48 (4.3%) |
| $20,000 to $24,999 | 55 (1.5%) | 10 (0.9%) |
| $25,000 to $34,999 | 111 (3.0%) | 93 (8.4%) |
| $35,000 to $49,999 | 73 (2.0%) | 182 (16.5%) |
| $50,000 to $74,999 | 391 (10.7%) | 234 (21.2%) |
| $75,000 to $99,999 | 319 (8.7%) | 142 (12.8%) |
| $100,000 to $149,999 | 545 (15.0%) | 162 (14.6%) |
| $150,000 or more | 2,108 (57.9%) | 86 (7.8%) |
| Total | 3,644 (100.0%) | 1,106 (100.0%) |
Monthly Housing Cost Tiers in Bexley
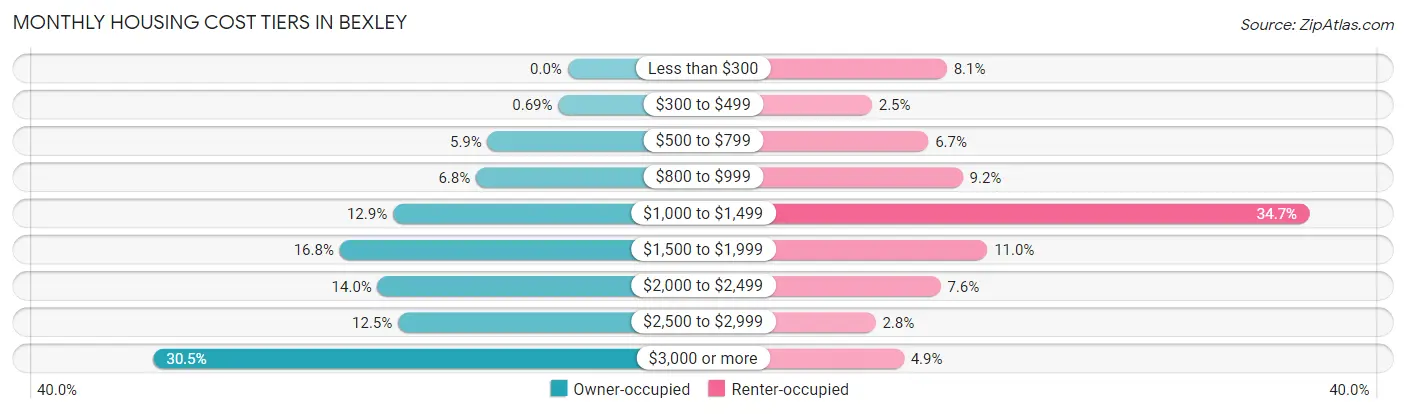
| Monthly Cost | Owner-occupied | Renter-occupied |
| Less than $300 | 0 (0.0%) | 89 (8.1%) |
| $300 to $499 | 25 (0.7%) | 28 (2.5%) |
| $500 to $799 | 215 (5.9%) | 74 (6.7%) |
| $800 to $999 | 246 (6.8%) | 102 (9.2%) |
| $1,000 to $1,499 | 469 (12.9%) | 384 (34.7%) |
| $1,500 to $1,999 | 612 (16.8%) | 122 (11.0%) |
| $2,000 to $2,499 | 510 (14.0%) | 84 (7.6%) |
| $2,500 to $2,999 | 455 (12.5%) | 31 (2.8%) |
| $3,000 or more | 1,112 (30.5%) | 54 (4.9%) |
| Total | 3,644 (100.0%) | 1,106 (100.0%) |
Physical Housing Characteristics in Bexley
Housing Structures in Bexley
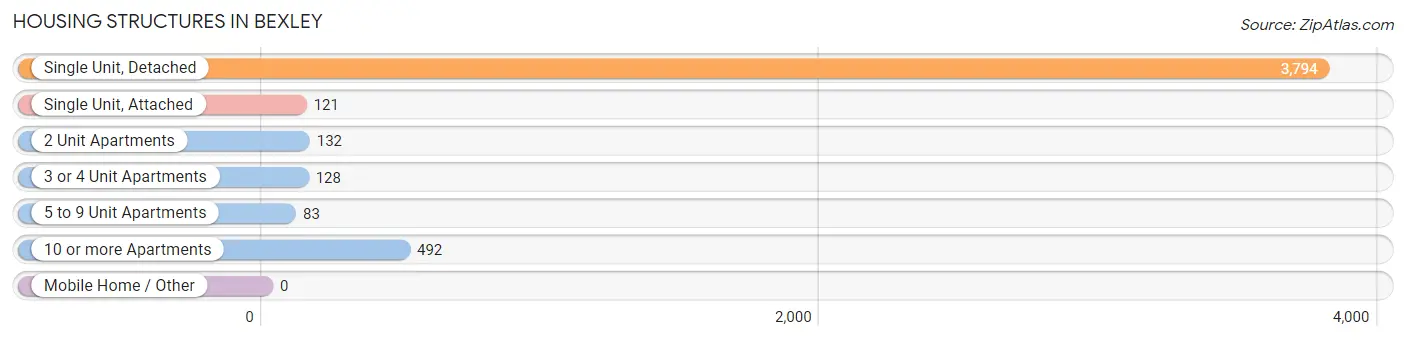
| Structure Type | # Housing Units | % Housing Units |
| Single Unit, Detached | 3,794 | 79.9% |
| Single Unit, Attached | 121 | 2.5% |
| 2 Unit Apartments | 132 | 2.8% |
| 3 or 4 Unit Apartments | 128 | 2.7% |
| 5 to 9 Unit Apartments | 83 | 1.8% |
| 10 or more Apartments | 492 | 10.4% |
| Mobile Home / Other | 0 | 0.0% |
| Total | 4,750 | 100.0% |
Housing Structures by Occupancy in Bexley
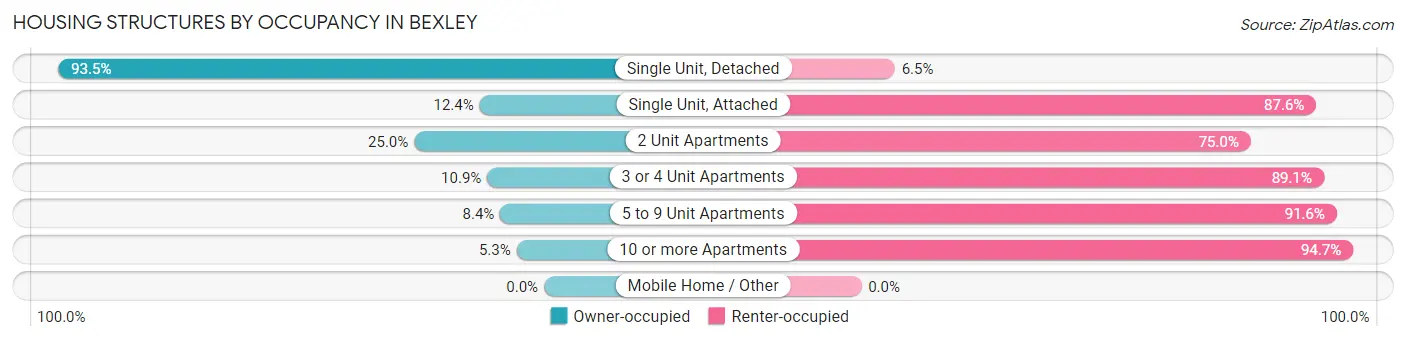
| Structure Type | Owner-occupied | Renter-occupied |
| Single Unit, Detached | 3,549 (93.5%) | 245 (6.5%) |
| Single Unit, Attached | 15 (12.4%) | 106 (87.6%) |
| 2 Unit Apartments | 33 (25.0%) | 99 (75.0%) |
| 3 or 4 Unit Apartments | 14 (10.9%) | 114 (89.1%) |
| 5 to 9 Unit Apartments | 7 (8.4%) | 76 (91.6%) |
| 10 or more Apartments | 26 (5.3%) | 466 (94.7%) |
| Mobile Home / Other | 0 (0.0%) | 0 (0.0%) |
| Total | 3,644 (76.7%) | 1,106 (23.3%) |
Housing Structures by Number of Rooms in Bexley
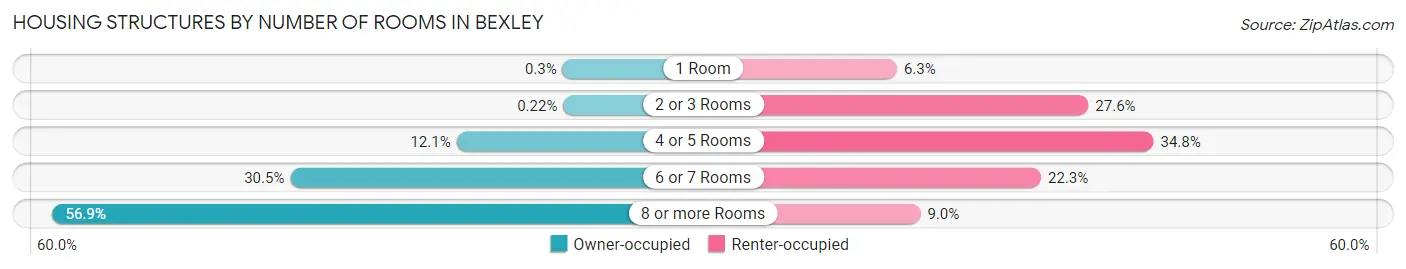
| Number of Rooms | Owner-occupied | Renter-occupied |
| 1 Room | 11 (0.3%) | 70 (6.3%) |
| 2 or 3 Rooms | 8 (0.2%) | 305 (27.6%) |
| 4 or 5 Rooms | 440 (12.1%) | 385 (34.8%) |
| 6 or 7 Rooms | 1,112 (30.5%) | 247 (22.3%) |
| 8 or more Rooms | 2,073 (56.9%) | 99 (8.9%) |
| Total | 3,644 (100.0%) | 1,106 (100.0%) |
Housing Structure by Heating Type in Bexley
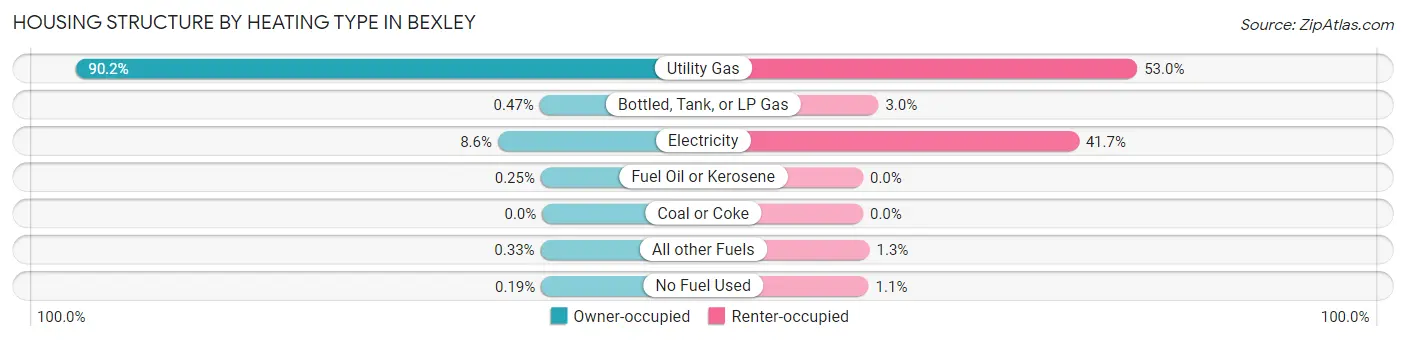
| Heating Type | Owner-occupied | Renter-occupied |
| Utility Gas | 3,287 (90.2%) | 586 (53.0%) |
| Bottled, Tank, or LP Gas | 17 (0.5%) | 33 (3.0%) |
| Electricity | 312 (8.6%) | 461 (41.7%) |
| Fuel Oil or Kerosene | 9 (0.3%) | 0 (0.0%) |
| Coal or Coke | 0 (0.0%) | 0 (0.0%) |
| All other Fuels | 12 (0.3%) | 14 (1.3%) |
| No Fuel Used | 7 (0.2%) | 12 (1.1%) |
| Total | 3,644 (100.0%) | 1,106 (100.0%) |
Household Vehicle Usage in Bexley
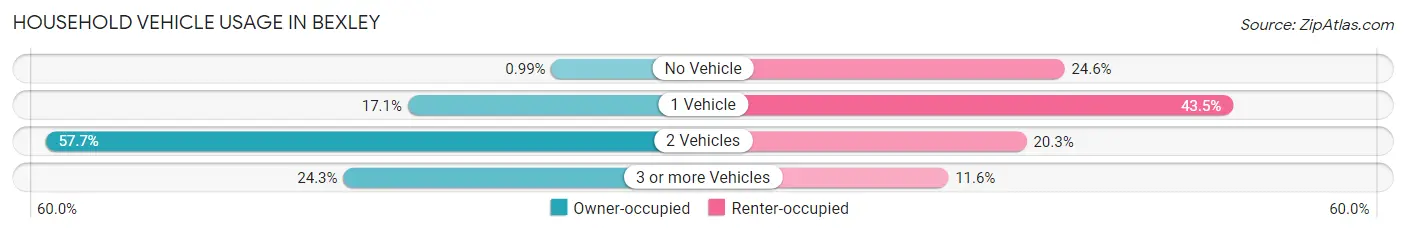
| Vehicles per Household | Owner-occupied | Renter-occupied |
| No Vehicle | 36 (1.0%) | 272 (24.6%) |
| 1 Vehicle | 622 (17.1%) | 481 (43.5%) |
| 2 Vehicles | 2,101 (57.7%) | 225 (20.3%) |
| 3 or more Vehicles | 885 (24.3%) | 128 (11.6%) |
| Total | 3,644 (100.0%) | 1,106 (100.0%) |
Real Estate & Mortgages in Bexley
Real Estate and Mortgage Overview in Bexley
| Characteristic | Without Mortgage | With Mortgage |
| Housing Units | 993 | 2,651 |
| Median Property Value | $513,000 | $445,300 |
| Median Household Income | $149,464 | $1,613 |
| Monthly Housing Costs | $1,038 | $1,056 |
| Real Estate Taxes | $6,954 | $41 |
Property Value by Mortgage Status in Bexley
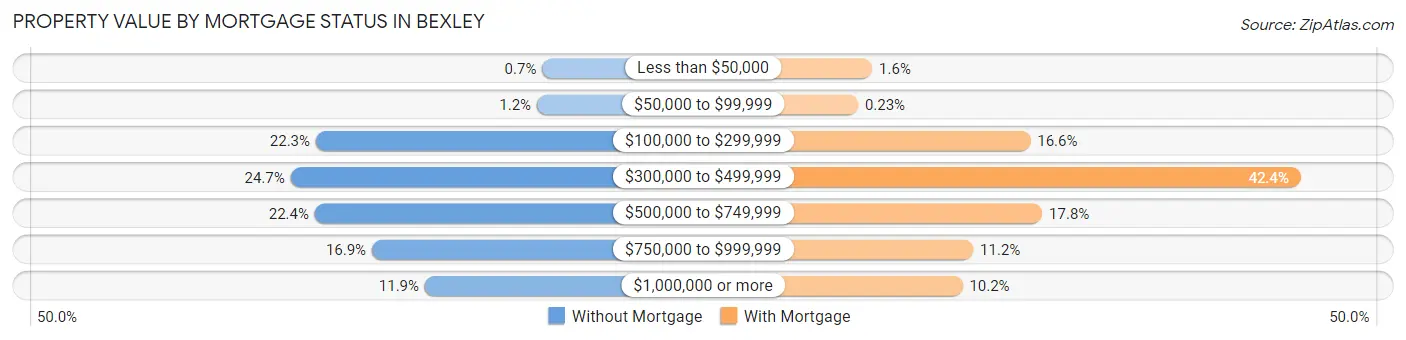
| Property Value | Without Mortgage | With Mortgage |
| Less than $50,000 | 7 (0.7%) | 42 (1.6%) |
| $50,000 to $99,999 | 12 (1.2%) | 6 (0.2%) |
| $100,000 to $299,999 | 221 (22.3%) | 441 (16.6%) |
| $300,000 to $499,999 | 245 (24.7%) | 1,124 (42.4%) |
| $500,000 to $749,999 | 222 (22.4%) | 471 (17.8%) |
| $750,000 to $999,999 | 168 (16.9%) | 297 (11.2%) |
| $1,000,000 or more | 118 (11.9%) | 270 (10.2%) |
| Total | 993 (100.0%) | 2,651 (100.0%) |
Household Income by Mortgage Status in Bexley
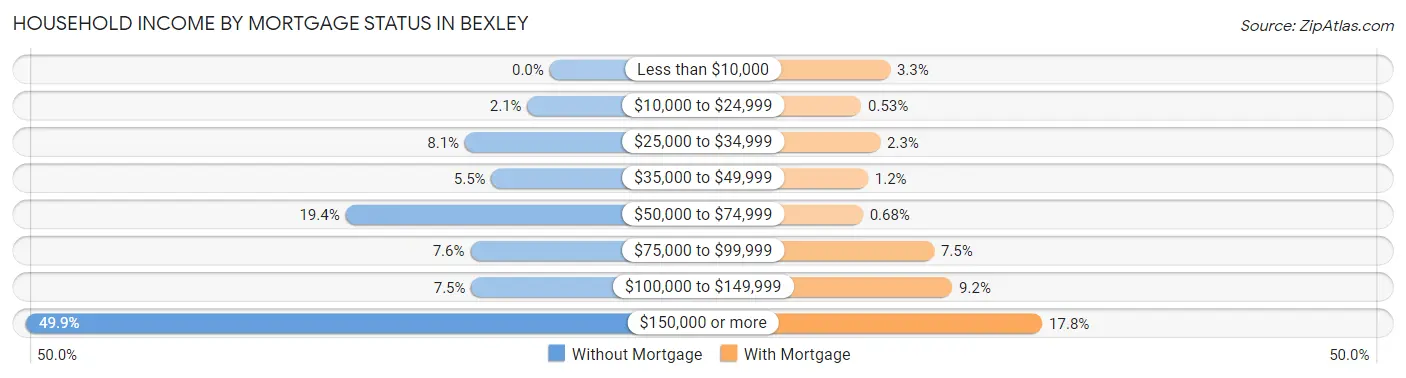
| Household Income | Without Mortgage | With Mortgage |
| Less than $10,000 | 0 (0.0%) | 87 (3.3%) |
| $10,000 to $24,999 | 21 (2.1%) | 14 (0.5%) |
| $25,000 to $34,999 | 80 (8.1%) | 62 (2.3%) |
| $35,000 to $49,999 | 55 (5.5%) | 31 (1.2%) |
| $50,000 to $74,999 | 193 (19.4%) | 18 (0.7%) |
| $75,000 to $99,999 | 75 (7.5%) | 198 (7.5%) |
| $100,000 to $149,999 | 74 (7.4%) | 244 (9.2%) |
| $150,000 or more | 495 (49.8%) | 471 (17.8%) |
| Total | 993 (100.0%) | 2,651 (100.0%) |
Property Value to Household Income Ratio in Bexley
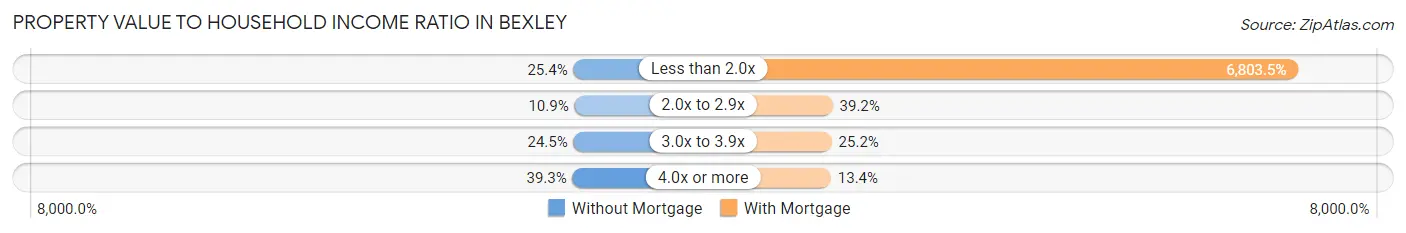
| Value-to-Income Ratio | Without Mortgage | With Mortgage |
| Less than 2.0x | 252 (25.4%) | 180,361 (6,803.5%) |
| 2.0x to 2.9x | 108 (10.9%) | 1,038 (39.2%) |
| 3.0x to 3.9x | 243 (24.5%) | 667 (25.2%) |
| 4.0x or more | 390 (39.3%) | 354 (13.4%) |
| Total | 993 (100.0%) | 2,651 (100.0%) |
Real Estate Taxes by Mortgage Status in Bexley
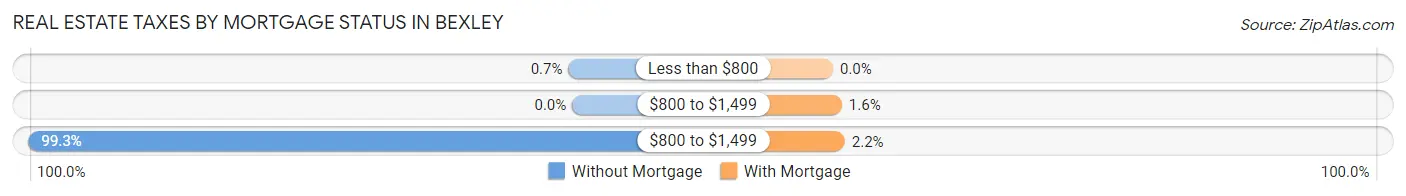
| Property Taxes | Without Mortgage | With Mortgage |
| Less than $800 | 7 (0.7%) | 0 (0.0%) |
| $800 to $1,499 | 0 (0.0%) | 43 (1.6%) |
| $800 to $1,499 | 986 (99.3%) | 57 (2.1%) |
| Total | 993 (100.0%) | 2,651 (100.0%) |
Health & Disability in Bexley
Health Insurance Coverage by Age in Bexley
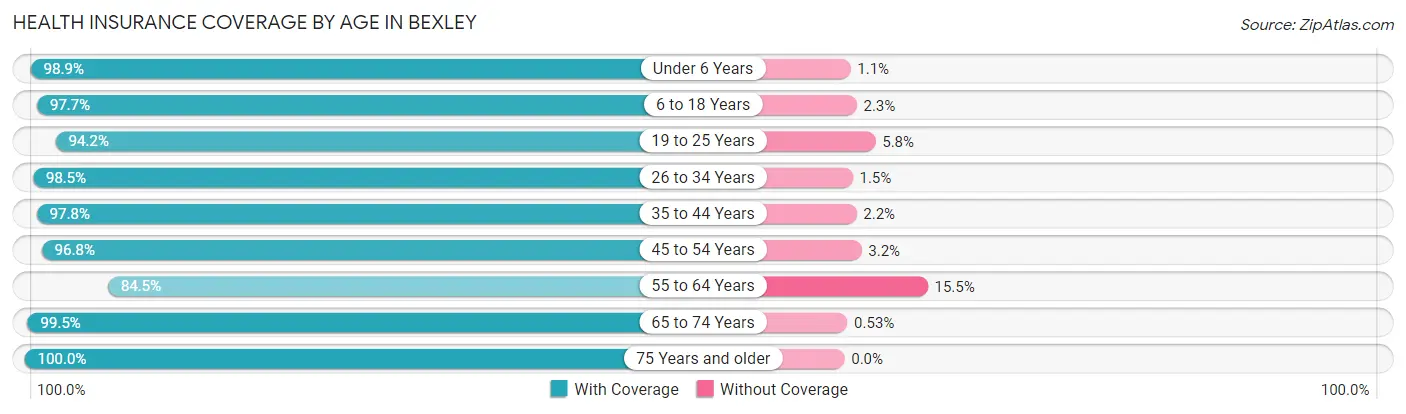
| Age Bracket | With Coverage | Without Coverage |
| Under 6 Years | 1,048 (98.9%) | 12 (1.1%) |
| 6 to 18 Years | 2,963 (97.7%) | 69 (2.3%) |
| 19 to 25 Years | 1,173 (94.2%) | 72 (5.8%) |
| 26 to 34 Years | 959 (98.5%) | 15 (1.5%) |
| 35 to 44 Years | 2,003 (97.8%) | 46 (2.2%) |
| 45 to 54 Years | 1,767 (96.8%) | 58 (3.2%) |
| 55 to 64 Years | 1,181 (84.5%) | 217 (15.5%) |
| 65 to 74 Years | 1,136 (99.5%) | 6 (0.5%) |
| 75 Years and older | 800 (100.0%) | 0 (0.0%) |
| Total | 13,030 (96.3%) | 495 (3.7%) |
Health Insurance Coverage by Citizenship Status in Bexley
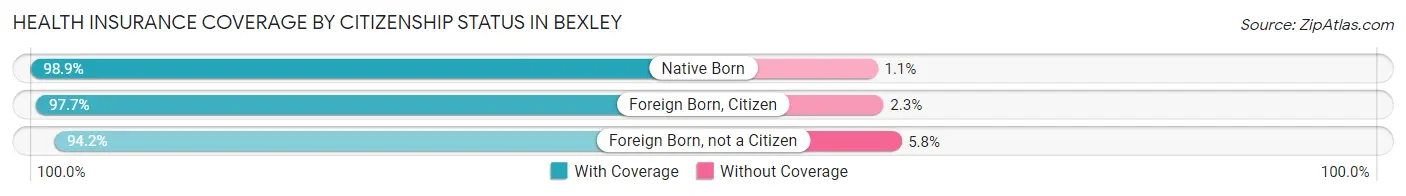
| Citizenship Status | With Coverage | Without Coverage |
| Native Born | 1,048 (98.9%) | 12 (1.1%) |
| Foreign Born, Citizen | 2,963 (97.7%) | 69 (2.3%) |
| Foreign Born, not a Citizen | 1,173 (94.2%) | 72 (5.8%) |
Health Insurance Coverage by Household Income in Bexley
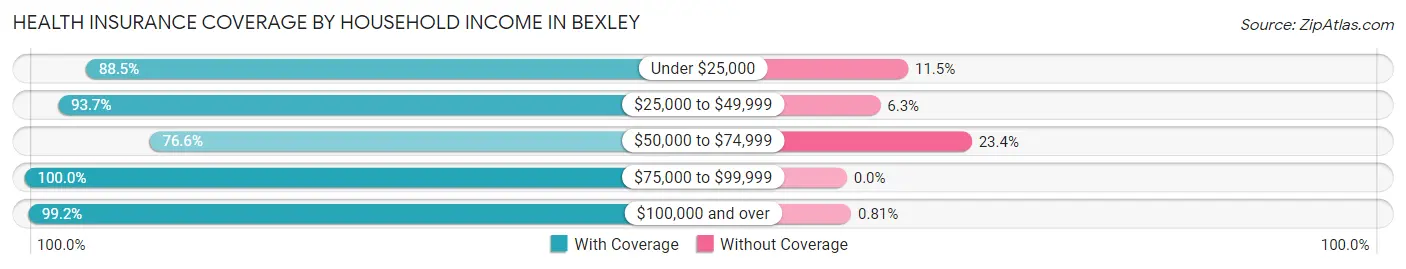
| Household Income | With Coverage | Without Coverage |
| Under $25,000 | 401 (88.5%) | 52 (11.5%) |
| $25,000 to $49,999 | 670 (93.7%) | 45 (6.3%) |
| $50,000 to $74,999 | 998 (76.6%) | 305 (23.4%) |
| $75,000 to $99,999 | 978 (100.0%) | 0 (0.0%) |
| $100,000 and over | 8,949 (99.2%) | 73 (0.8%) |
Public vs Private Health Insurance Coverage by Age in Bexley
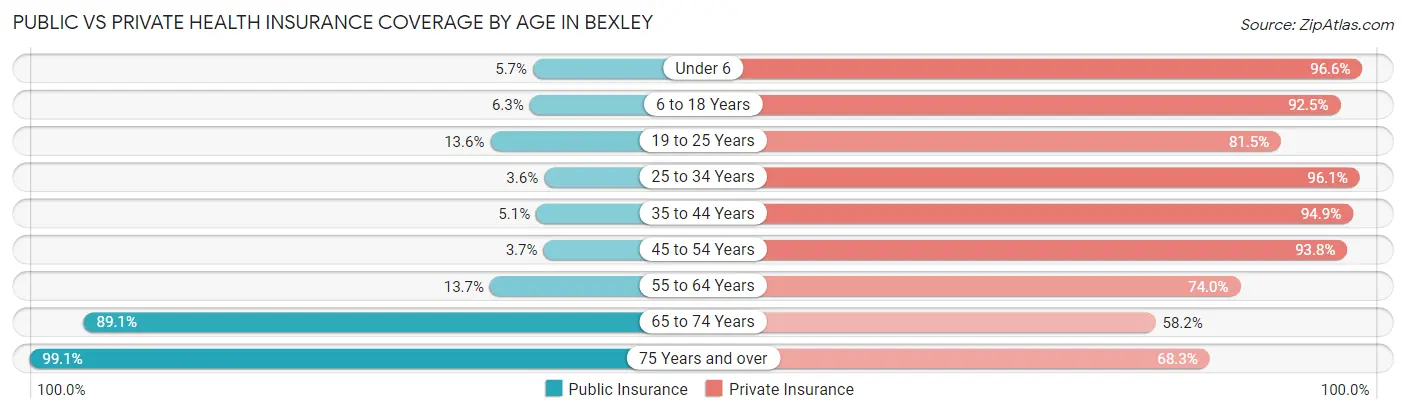
| Age Bracket | Public Insurance | Private Insurance |
| Under 6 | 60 (5.7%) | 1,024 (96.6%) |
| 6 to 18 Years | 190 (6.3%) | 2,805 (92.5%) |
| 19 to 25 Years | 169 (13.6%) | 1,015 (81.5%) |
| 25 to 34 Years | 35 (3.6%) | 936 (96.1%) |
| 35 to 44 Years | 104 (5.1%) | 1,944 (94.9%) |
| 45 to 54 Years | 68 (3.7%) | 1,712 (93.8%) |
| 55 to 64 Years | 191 (13.7%) | 1,034 (74.0%) |
| 65 to 74 Years | 1,017 (89.0%) | 665 (58.2%) |
| 75 Years and over | 793 (99.1%) | 546 (68.2%) |
| Total | 2,627 (19.4%) | 11,681 (86.4%) |
Disability Status by Sex by Age in Bexley
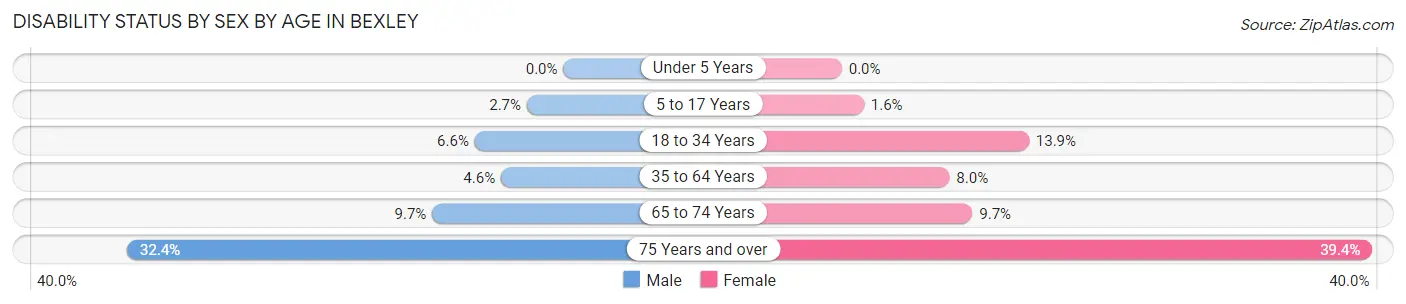
| Age Bracket | Male | Female |
| Under 5 Years | 0 (0.0%) | 0 (0.0%) |
| 5 to 17 Years | 37 (2.7%) | 25 (1.6%) |
| 18 to 34 Years | 82 (6.6%) | 187 (13.9%) |
| 35 to 64 Years | 120 (4.6%) | 214 (8.0%) |
| 65 to 74 Years | 57 (9.7%) | 54 (9.7%) |
| 75 Years and over | 93 (32.4%) | 202 (39.4%) |
Disability Class by Sex by Age in Bexley
Disability Class: Hearing Difficulty
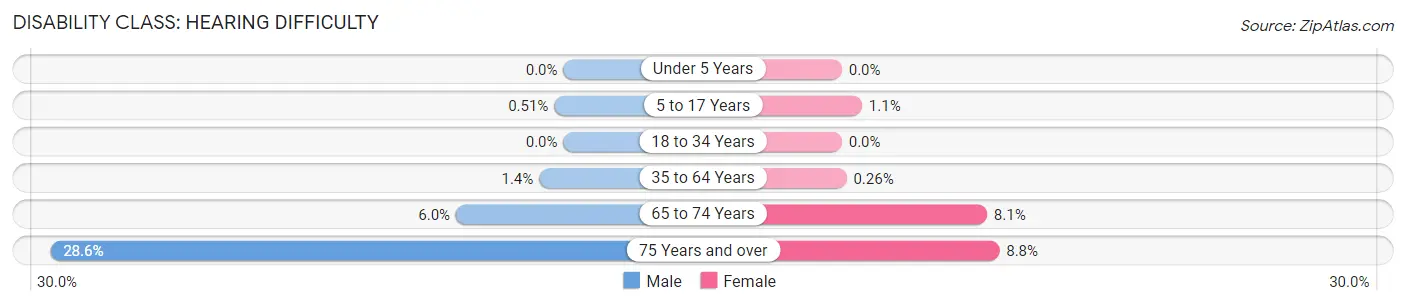
| Age Bracket | Male | Female |
| Under 5 Years | 0 (0.0%) | 0 (0.0%) |
| 5 to 17 Years | 7 (0.5%) | 17 (1.1%) |
| 18 to 34 Years | 0 (0.0%) | 0 (0.0%) |
| 35 to 64 Years | 35 (1.3%) | 7 (0.3%) |
| 65 to 74 Years | 35 (6.0%) | 45 (8.1%) |
| 75 Years and over | 82 (28.6%) | 45 (8.8%) |
Disability Class: Vision Difficulty
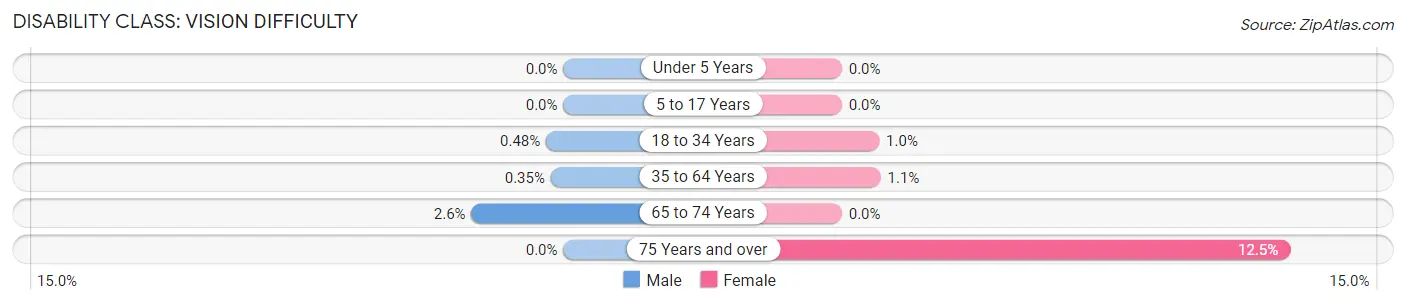
| Age Bracket | Male | Female |
| Under 5 Years | 0 (0.0%) | 0 (0.0%) |
| 5 to 17 Years | 0 (0.0%) | 0 (0.0%) |
| 18 to 34 Years | 6 (0.5%) | 14 (1.0%) |
| 35 to 64 Years | 9 (0.4%) | 29 (1.1%) |
| 65 to 74 Years | 15 (2.6%) | 0 (0.0%) |
| 75 Years and over | 0 (0.0%) | 64 (12.5%) |
Disability Class: Cognitive Difficulty
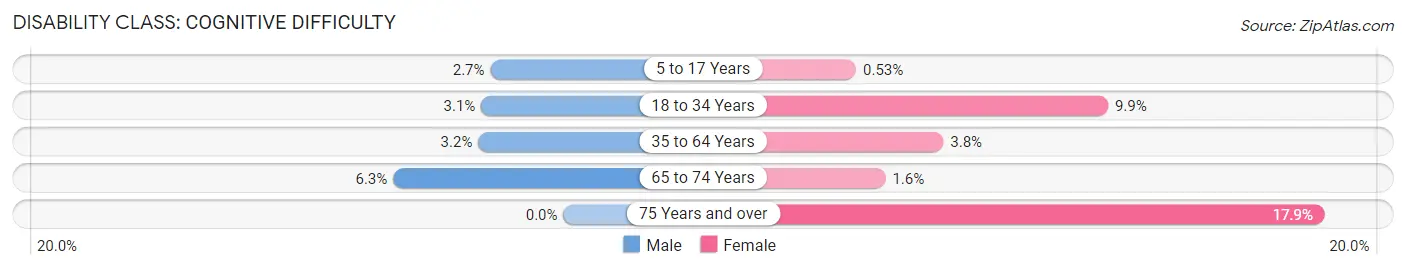
| Age Bracket | Male | Female |
| 5 to 17 Years | 37 (2.7%) | 8 (0.5%) |
| 18 to 34 Years | 38 (3.0%) | 133 (9.9%) |
| 35 to 64 Years | 82 (3.2%) | 101 (3.8%) |
| 65 to 74 Years | 37 (6.3%) | 9 (1.6%) |
| 75 Years and over | 0 (0.0%) | 92 (17.9%) |
Disability Class: Ambulatory Difficulty
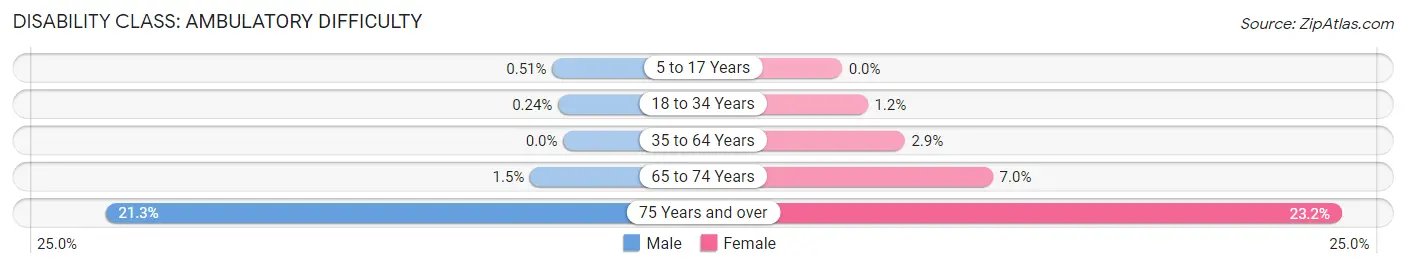
| Age Bracket | Male | Female |
| 5 to 17 Years | 7 (0.5%) | 0 (0.0%) |
| 18 to 34 Years | 3 (0.2%) | 16 (1.2%) |
| 35 to 64 Years | 0 (0.0%) | 78 (2.9%) |
| 65 to 74 Years | 9 (1.5%) | 39 (7.0%) |
| 75 Years and over | 61 (21.2%) | 119 (23.2%) |
Disability Class: Self-Care Difficulty
| Age Bracket | Male | Female |
| 5 to 17 Years | 7 (0.5%) | 0 (0.0%) |
| 18 to 34 Years | 6 (0.5%) | 0 (0.0%) |
| 35 to 64 Years | 0 (0.0%) | 14 (0.5%) |
| 65 to 74 Years | 0 (0.0%) | 24 (4.3%) |
| 75 Years and over | 22 (7.7%) | 31 (6.0%) |
Technology Access in Bexley
Computing Device Access in Bexley
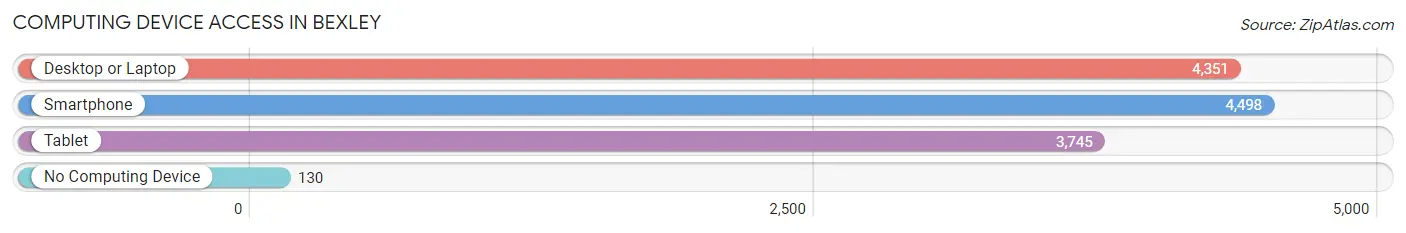
| Device Type | # Households | % Households |
| Desktop or Laptop | 4,351 | 91.6% |
| Smartphone | 4,498 | 94.7% |
| Tablet | 3,745 | 78.8% |
| No Computing Device | 130 | 2.7% |
| Total | 4,750 | 100.0% |
Internet Access in Bexley
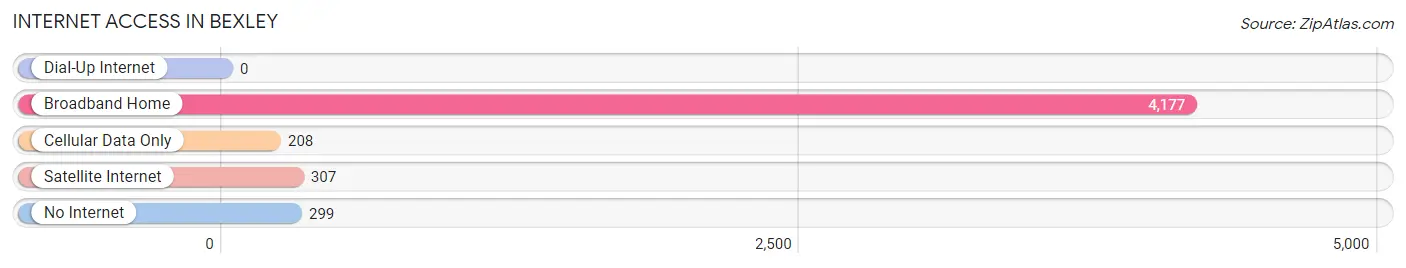
| Internet Type | # Households | % Households |
| Dial-Up Internet | 0 | 0.0% |
| Broadband Home | 4,177 | 87.9% |
| Cellular Data Only | 208 | 4.4% |
| Satellite Internet | 307 | 6.5% |
| No Internet | 299 | 6.3% |
| Total | 4,750 | 100.0% |
Bexley Summary
Bexley is a city located in Franklin County, Ohio, United States. It is a suburb of Columbus, the state capital and largest city in Ohio. The population was 13,057 at the 2010 census. Bexley is a diverse and vibrant community with a rich history, a strong economy, and a variety of cultural and recreational opportunities.
History
Bexley was founded in 1908 by a group of investors led by Columbus real estate developer, John S. Jeffrey. The city was named after Bexley Hall, a prestigious boys' school in England. The city was incorporated in 1908 and was the first suburb of Columbus to be annexed by the city in 1914.
Bexley has a long and rich history. The city was home to the first Jewish congregation in Franklin County, the Bexley Hebrew Congregation, which was founded in 1909. The city was also home to the first public library in Franklin County, the Bexley Public Library, which opened in 1910.
The city has a strong connection to the arts. The Bexley Community Arts Center was founded in 1921 and is the oldest continuously operating arts center in Ohio. The city is also home to the Drexel Theatre, which opened in 1924 and is the oldest continuously operating movie theater in Ohio.
Geography
Bexley is located in Franklin County, Ohio, approximately 5 miles east of downtown Columbus. The city is situated on the east side of the Scioto River and is bordered by the cities of Whitehall, Reynoldsburg, and Columbus. The city covers an area of 4.3 square miles and has a population of 13,057 as of the 2010 census.
The city is divided into four distinct neighborhoods: Bexley North, Bexley South, Bexley East, and Bexley West. Bexley North is the most populous neighborhood and is home to the majority of the city's businesses and institutions. Bexley South is the most residential neighborhood and is home to many of the city's historic homes. Bexley East is the most diverse neighborhood and is home to a variety of cultures and ethnicities. Bexley West is the least populous neighborhood and is home to the city's industrial and commercial areas.
Economy
Bexley is a vibrant and diverse community with a strong economy. The city is home to a variety of businesses, including retail stores, restaurants, professional services, and manufacturing companies. The city is also home to a number of educational institutions, including Capital University, the Ohio School for the Deaf, and the Bexley Public Library.
The city's economy is largely driven by the educational and health care sectors. Capital University is the largest employer in the city, with over 1,000 employees. The Ohio School for the Deaf is the second largest employer, with over 500 employees. The Bexley Public Library is the third largest employer, with over 200 employees.
Demographics
As of the 2010 census, the population of Bexley was 13,057. The racial makeup of the city was 79.3% White, 11.2% African American, 4.2% Asian, 0.7% Native American, 0.1% Pacific Islander, and 4.5% from other races. The median household income was $68,945 and the median family income was $90,945.
Bexley is a diverse and vibrant community with a variety of cultures and ethnicities. The city is home to a large Jewish population, as well as a growing Hispanic population. The city is also home to a large number of international students, many of whom attend Capital University.
Conclusion
Bexley is a vibrant and diverse city located in Franklin County, Ohio. The city has a rich history, a strong economy, and a variety of cultural and recreational opportunities. The city is home to a variety of businesses, educational institutions, and cultural attractions. The city is also home to a diverse population, with a variety of cultures and ethnicities. Bexley is a great place to live, work, and play.
Common Questions
What is Per Capita Income in Bexley?
Per Capita income in Bexley is $71,518.
What is the Median Family Income in Bexley?
Median Family Income in Bexley is $176,852.
What is the Median Household income in Bexley?
Median Household Income in Bexley is $138,929.
What is Income or Wage Gap in Bexley?
Income or Wage Gap in Bexley is 28.8%.
Women in Bexley earn 71.2 cents for every dollar earned by a man.
What is Inequality or Gini Index in Bexley?
Inequality or Gini Index in Bexley is 0.49.
What is the Total Population of Bexley?
Total Population of Bexley is 13,537.
What is the Total Male Population of Bexley?
Total Male Population of Bexley is 6,503.
What is the Total Female Population of Bexley?
Total Female Population of Bexley is 7,034.
What is the Ratio of Males per 100 Females in Bexley?
There are 92.45 Males per 100 Females in Bexley.
What is the Ratio of Females per 100 Males in Bexley?
There are 108.17 Females per 100 Males in Bexley.
What is the Median Population Age in Bexley?
Median Population Age in Bexley is 37.4 Years.
What is the Average Family Size in Bexley
Average Family Size in Bexley is 3.1 People.
What is the Average Household Size in Bexley
Average Household Size in Bexley is 2.6 People.
How Large is the Labor Force in Bexley?
There are 6,808 People in the Labor Forcein in Bexley.
What is the Percentage of People in the Labor Force in Bexley?
66.2% of People are in the Labor Force in Bexley.
What is the Unemployment Rate in Bexley?
Unemployment Rate in Bexley is 3.5%.