Montgomery, OH Map & Demographics
Montgomery Map
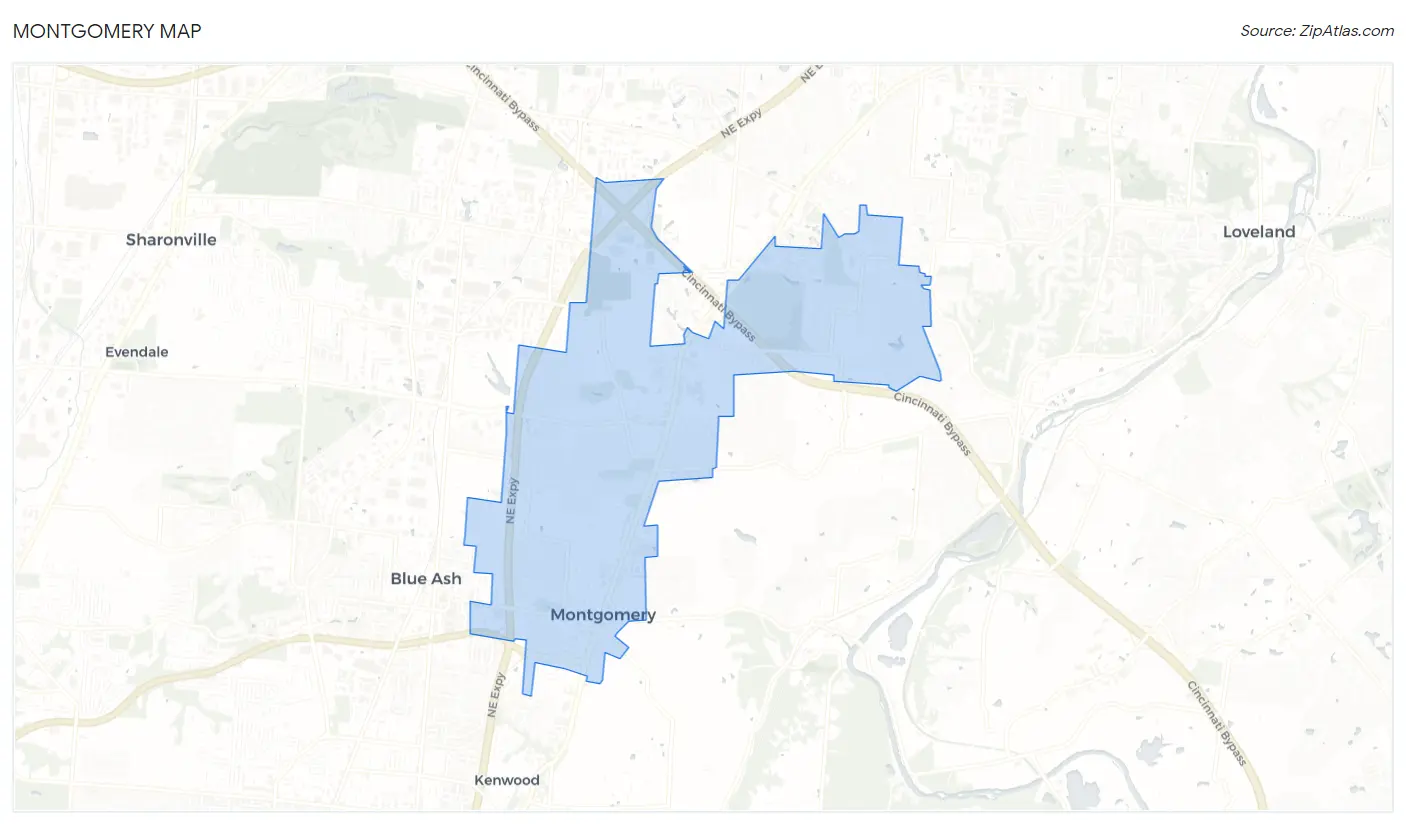
Montgomery Overview
$73,904
PER CAPITA INCOME
$178,438
AVG FAMILY INCOME
$142,244
AVG HOUSEHOLD INCOME
44.3%
WAGE / INCOME GAP [ % ]
55.7¢/ $1
WAGE / INCOME GAP [ $ ]
0.43
INEQUALITY / GINI INDEX
10,816
TOTAL POPULATION
5,331
MALE POPULATION
5,485
FEMALE POPULATION
97.19
MALES / 100 FEMALES
102.89
FEMALES / 100 MALES
44.8
MEDIAN AGE
3.2
AVG FAMILY SIZE
2.6
AVG HOUSEHOLD SIZE
5,204
LABOR FORCE [ PEOPLE ]
64.4%
PERCENT IN LABOR FORCE
2.4%
UNEMPLOYMENT RATE
Montgomery Area Codes
Income in Montgomery
Income Overview in Montgomery
Per Capita Income in Montgomery is $73,904, while median incomes of families and households are $178,438 and $142,244 respectively.
| Characteristic | Number | Measure |
| Per Capita Income | 10,816 | $73,904 |
| Median Family Income | 2,878 | $178,438 |
| Mean Family Income | 2,878 | $232,664 |
| Median Household Income | 4,029 | $142,244 |
| Mean Household Income | 4,029 | $195,939 |
| Income Deficit | 2,878 | $0 |
| Wage / Income Gap (%) | 10,816 | 44.34% |
| Wage / Income Gap ($) | 10,816 | 55.66¢ per $1 |
| Gini / Inequality Index | 10,816 | 0.43 |
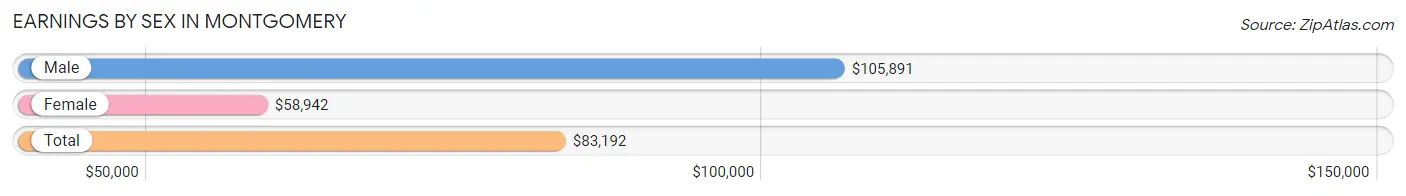
Earnings by Sex in Montgomery
Average Earnings in Montgomery are $83,192, $105,891 for men and $58,942 for women, a difference of 44.3%.
| Sex | Number | Average Earnings |
| Male | 2,852 (52.2%) | $105,891 |
| Female | 2,615 (47.8%) | $58,942 |
| Total | 5,467 (100.0%) | $83,192 |
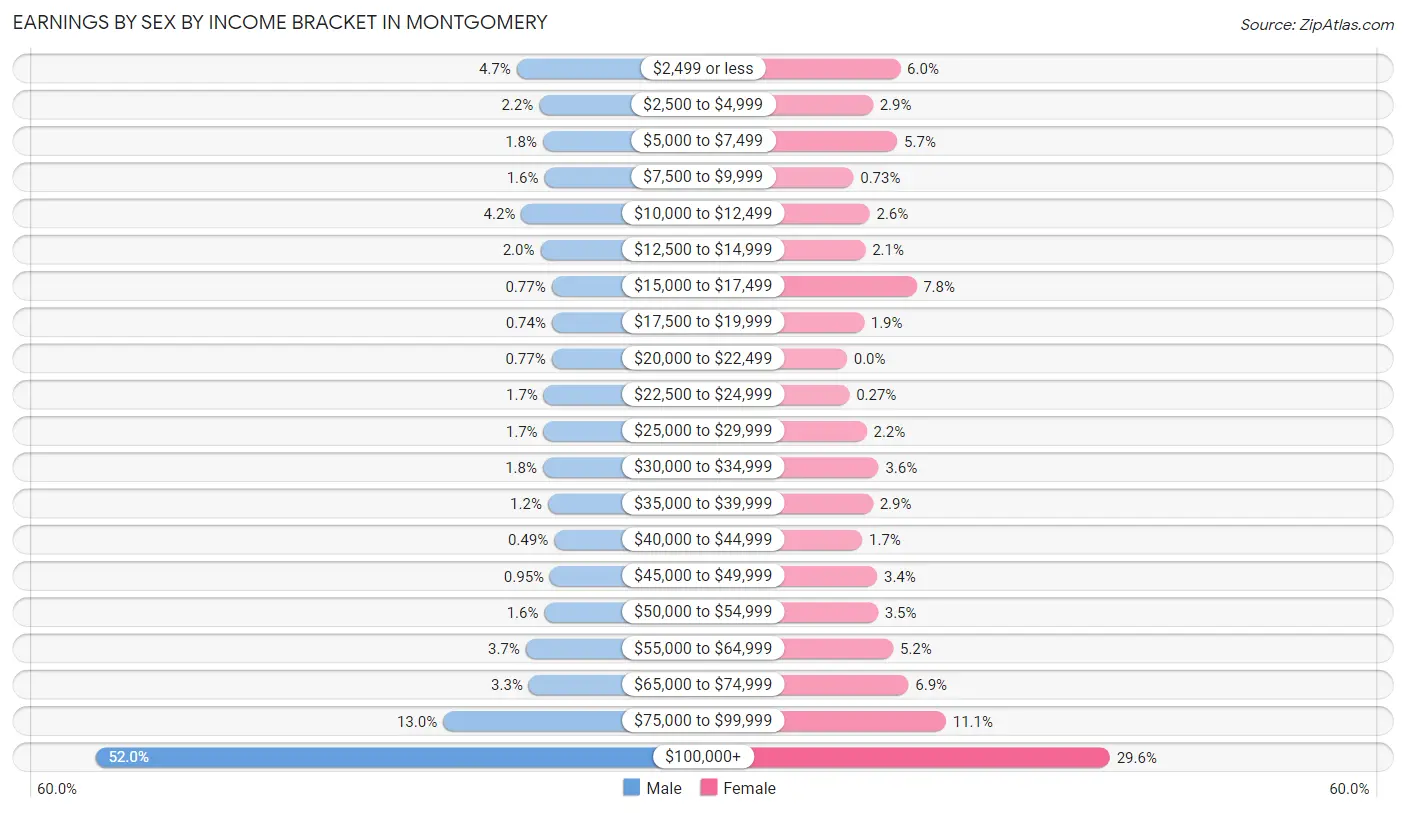
Earnings by Sex by Income Bracket in Montgomery
The most common earnings brackets in Montgomery are $100,000+ for men (1,484 | 52.0%) and $100,000+ for women (773 | 29.6%).
| Income | Male | Female |
| $2,499 or less | 134 (4.7%) | 157 (6.0%) |
| $2,500 to $4,999 | 62 (2.2%) | 76 (2.9%) |
| $5,000 to $7,499 | 50 (1.8%) | 148 (5.7%) |
| $7,500 to $9,999 | 45 (1.6%) | 19 (0.7%) |
| $10,000 to $12,499 | 119 (4.2%) | 67 (2.6%) |
| $12,500 to $14,999 | 58 (2.0%) | 54 (2.1%) |
| $15,000 to $17,499 | 22 (0.8%) | 204 (7.8%) |
| $17,500 to $19,999 | 21 (0.7%) | 50 (1.9%) |
| $20,000 to $22,499 | 22 (0.8%) | 0 (0.0%) |
| $22,500 to $24,999 | 47 (1.7%) | 7 (0.3%) |
| $25,000 to $29,999 | 48 (1.7%) | 58 (2.2%) |
| $30,000 to $34,999 | 50 (1.8%) | 93 (3.6%) |
| $35,000 to $39,999 | 34 (1.2%) | 76 (2.9%) |
| $40,000 to $44,999 | 14 (0.5%) | 45 (1.7%) |
| $45,000 to $49,999 | 27 (0.9%) | 89 (3.4%) |
| $50,000 to $54,999 | 45 (1.6%) | 91 (3.5%) |
| $55,000 to $64,999 | 105 (3.7%) | 136 (5.2%) |
| $65,000 to $74,999 | 95 (3.3%) | 181 (6.9%) |
| $75,000 to $99,999 | 370 (13.0%) | 291 (11.1%) |
| $100,000+ | 1,484 (52.0%) | 773 (29.6%) |
| Total | 2,852 (100.0%) | 2,615 (100.0%) |
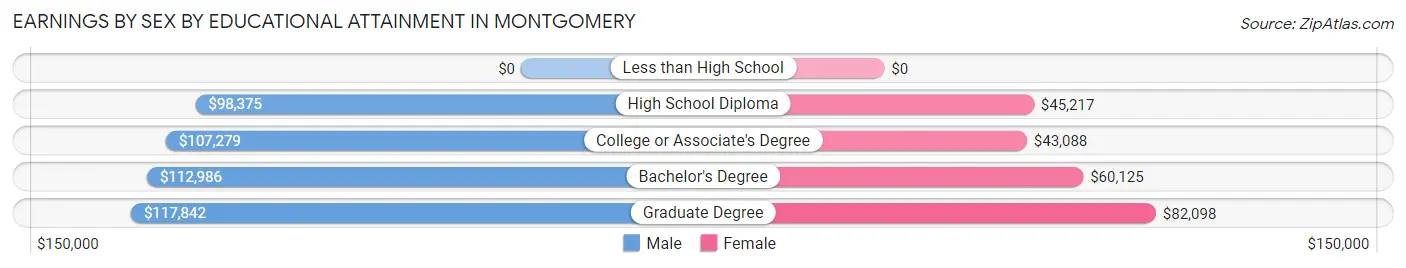
Earnings by Sex by Educational Attainment in Montgomery
Average earnings in Montgomery are $112,917 for men and $69,857 for women, a difference of 38.1%. Men with an educational attainment of graduate degree enjoy the highest average annual earnings of $117,842, while those with high school diploma education earn the least with $98,375. Women with an educational attainment of graduate degree earn the most with the average annual earnings of $82,098, while those with college or associate's degree education have the smallest earnings of $43,088.
| Educational Attainment | Male Income | Female Income |
| Less than High School | - | - |
| High School Diploma | $98,375 | $45,217 |
| College or Associate's Degree | $107,279 | $43,088 |
| Bachelor's Degree | $112,986 | $60,125 |
| Graduate Degree | $117,842 | $82,098 |
| Total | $112,917 | $69,857 |
Family Income in Montgomery
Family Income Brackets in Montgomery
According to the Montgomery family income data, there are 1,269 families falling into the $200,000+ income range, which is the most common income bracket and makes up 44.1% of all families. Conversely, the $10,000 to $14,999 income bracket is the least frequent group with only 6 families (0.2%) belonging to this category.
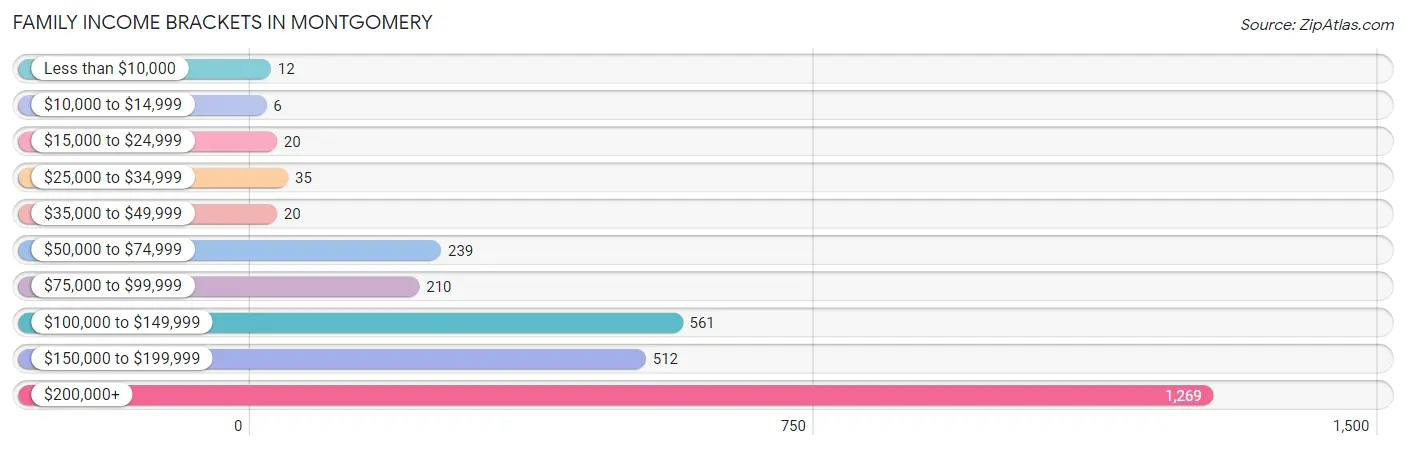
| Income Bracket | # Families | % Families |
| Less than $10,000 | 12 | 0.4% |
| $10,000 to $14,999 | 6 | 0.2% |
| $15,000 to $24,999 | 20 | 0.7% |
| $25,000 to $34,999 | 35 | 1.2% |
| $35,000 to $49,999 | 20 | 0.7% |
| $50,000 to $74,999 | 239 | 8.3% |
| $75,000 to $99,999 | 210 | 7.3% |
| $100,000 to $149,999 | 561 | 19.5% |
| $150,000 to $199,999 | 512 | 17.8% |
| $200,000+ | 1,269 | 44.1% |
Family Income by Famaliy Size in Montgomery
6-person families (140 | 4.9%) account for the highest median family income in Montgomery with $250,001 per family, while 2-person families (1,309 | 45.5%) have the highest median income of $72,162 per family member.
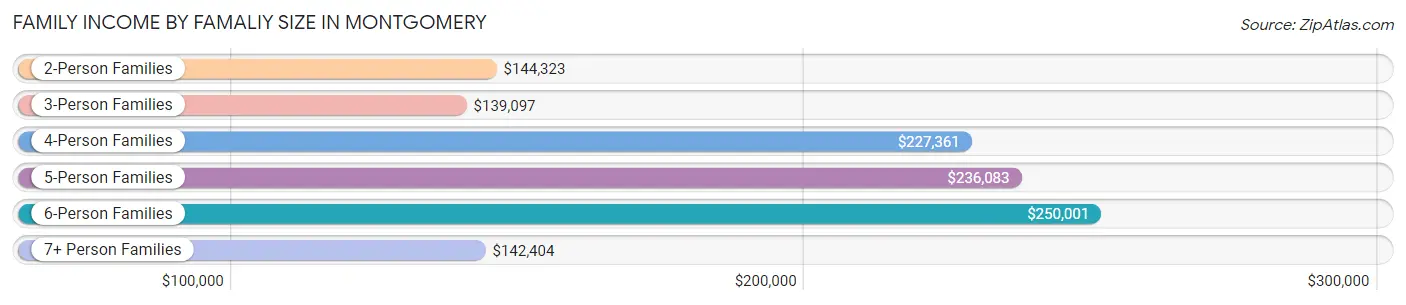
| Income Bracket | # Families | Median Income |
| 2-Person Families | 1,309 (45.5%) | $144,323 |
| 3-Person Families | 489 (17.0%) | $139,097 |
| 4-Person Families | 653 (22.7%) | $227,361 |
| 5-Person Families | 248 (8.6%) | $236,083 |
| 6-Person Families | 140 (4.9%) | $250,001 |
| 7+ Person Families | 39 (1.4%) | $142,404 |
| Total | 2,878 (100.0%) | $178,438 |
Family Income by Number of Earners in Montgomery
The median family income in Montgomery is $178,438, with families comprising 3+ earners (309) having the highest median family income of $230,139, while families with no earners (397) have the lowest median family income of $87,708, accounting for 10.7% and 13.8% of families, respectively.
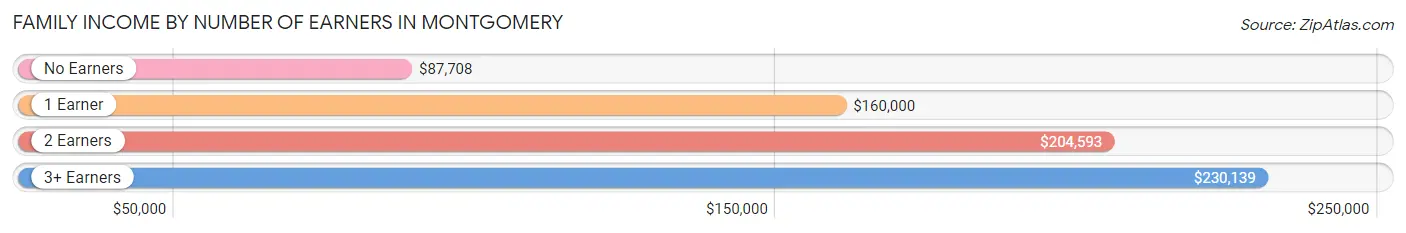
| Number of Earners | # Families | Median Income |
| No Earners | 397 (13.8%) | $87,708 |
| 1 Earner | 794 (27.6%) | $160,000 |
| 2 Earners | 1,378 (47.9%) | $204,593 |
| 3+ Earners | 309 (10.7%) | $230,139 |
| Total | 2,878 (100.0%) | $178,438 |
Household Income in Montgomery
Household Income Brackets in Montgomery
With 1,366 households falling in the category, the $200,000+ income range is the most frequent in Montgomery, accounting for 33.9% of all households. In contrast, only 4 households (0.1%) fall into the $10,000 to $14,999 income bracket, making it the least populous group.
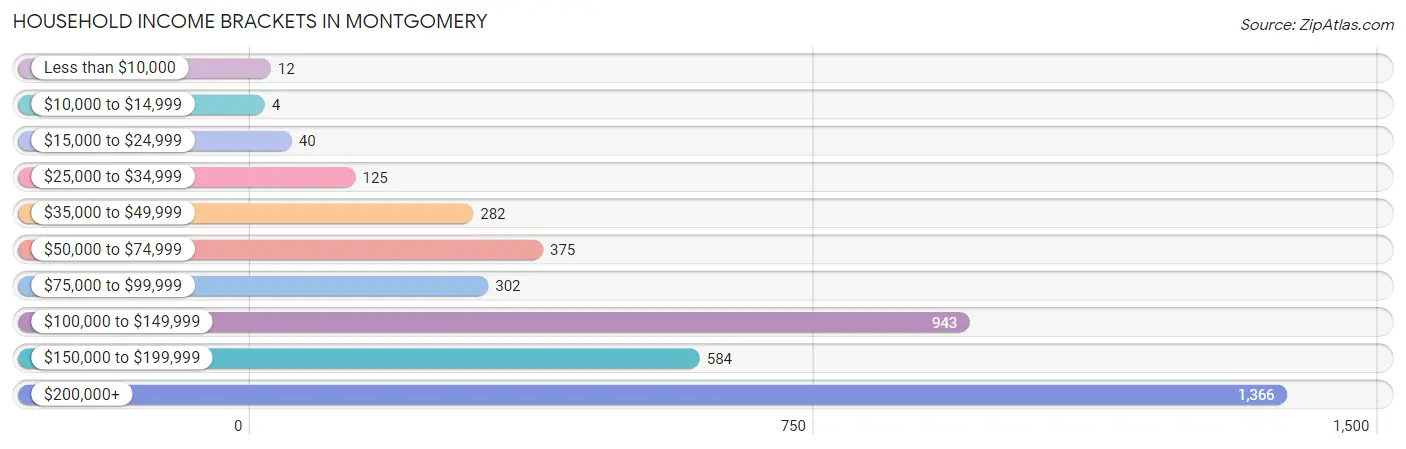
| Income Bracket | # Households | % Households |
| Less than $10,000 | 12 | 0.3% |
| $10,000 to $14,999 | 4 | 0.1% |
| $15,000 to $24,999 | 40 | 1.0% |
| $25,000 to $34,999 | 125 | 3.1% |
| $35,000 to $49,999 | 282 | 7.0% |
| $50,000 to $74,999 | 375 | 9.3% |
| $75,000 to $99,999 | 302 | 7.5% |
| $100,000 to $149,999 | 943 | 23.4% |
| $150,000 to $199,999 | 584 | 14.5% |
| $200,000+ | 1,366 | 33.9% |
Household Income by Householder Age in Montgomery
The median household income in Montgomery is $142,244, with the highest median household income of $199,911 found in the 25 to 44 years age bracket for the primary householder. A total of 953 households (23.6%) fall into this category.
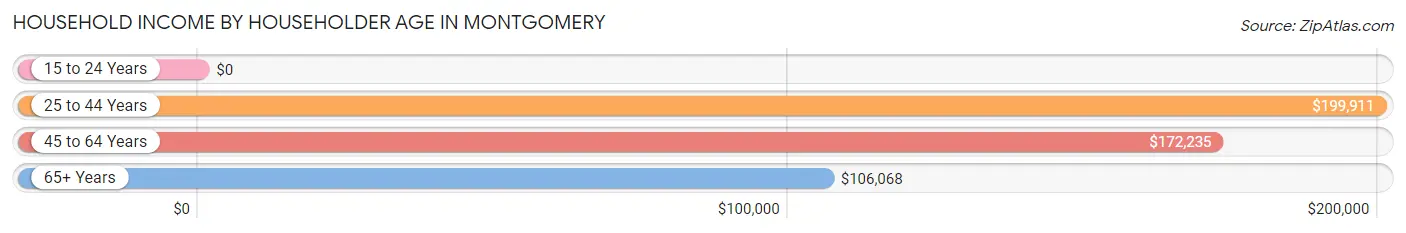
| Income Bracket | # Households | Median Income |
| 15 to 24 Years | 0 (0.0%) | $0 |
| 25 to 44 Years | 953 (23.6%) | $199,911 |
| 45 to 64 Years | 1,591 (39.5%) | $172,235 |
| 65+ Years | 1,485 (36.9%) | $106,068 |
| Total | 4,029 (100.0%) | $142,244 |
Poverty in Montgomery
Income Below Poverty by Sex and Age in Montgomery
With 1.0% poverty level for males and 1.0% for females among the residents of Montgomery, 12 to 14 year old males and 65 to 74 year old females are the most vulnerable to poverty, with 9 males (5.4%) and 25 females (3.3%) in their respective age groups living below the poverty level.
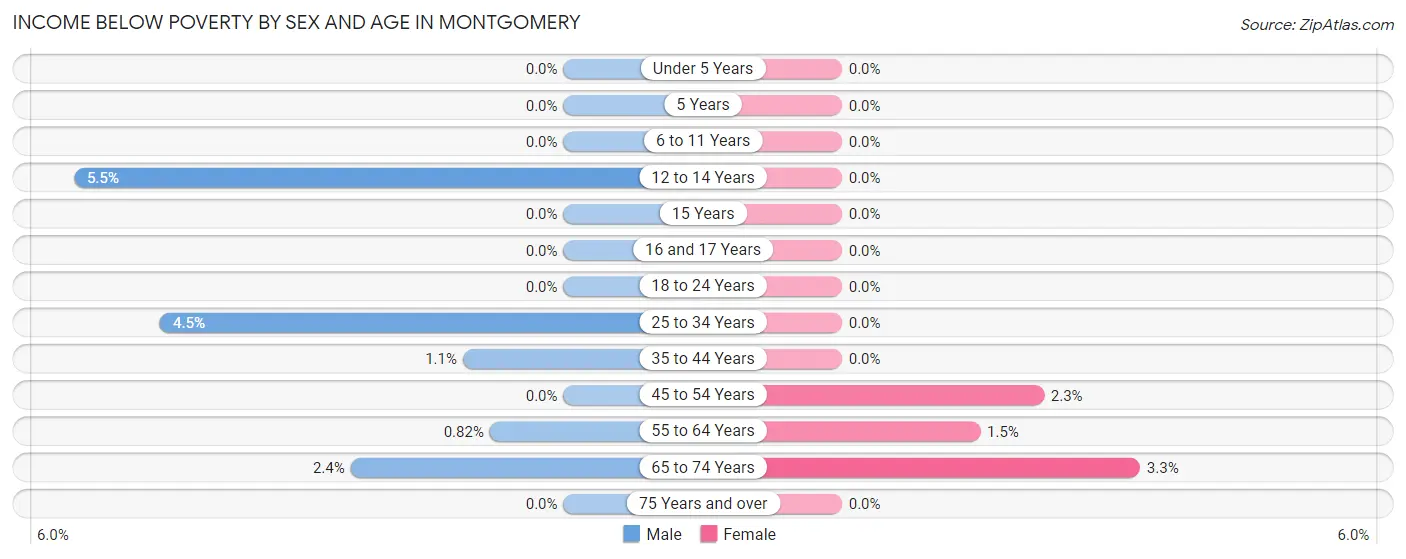
| Age Bracket | Male | Female |
| Under 5 Years | 0 (0.0%) | 0 (0.0%) |
| 5 Years | 0 (0.0%) | 0 (0.0%) |
| 6 to 11 Years | 0 (0.0%) | 0 (0.0%) |
| 12 to 14 Years | 9 (5.4%) | 0 (0.0%) |
| 15 Years | 0 (0.0%) | 0 (0.0%) |
| 16 and 17 Years | 0 (0.0%) | 0 (0.0%) |
| 18 to 24 Years | 0 (0.0%) | 0 (0.0%) |
| 25 to 34 Years | 15 (4.5%) | 0 (0.0%) |
| 35 to 44 Years | 8 (1.1%) | 0 (0.0%) |
| 45 to 54 Years | 0 (0.0%) | 14 (2.2%) |
| 55 to 64 Years | 7 (0.8%) | 13 (1.5%) |
| 65 to 74 Years | 13 (2.4%) | 25 (3.3%) |
| 75 Years and over | 0 (0.0%) | 0 (0.0%) |
| Total | 52 (1.0%) | 52 (1.0%) |
Income Above Poverty by Sex and Age in Montgomery
According to the poverty statistics in Montgomery, males aged under 5 years and females aged under 5 years are the age groups that are most secure financially, with 100.0% of males and 100.0% of females in these age groups living above the poverty line.
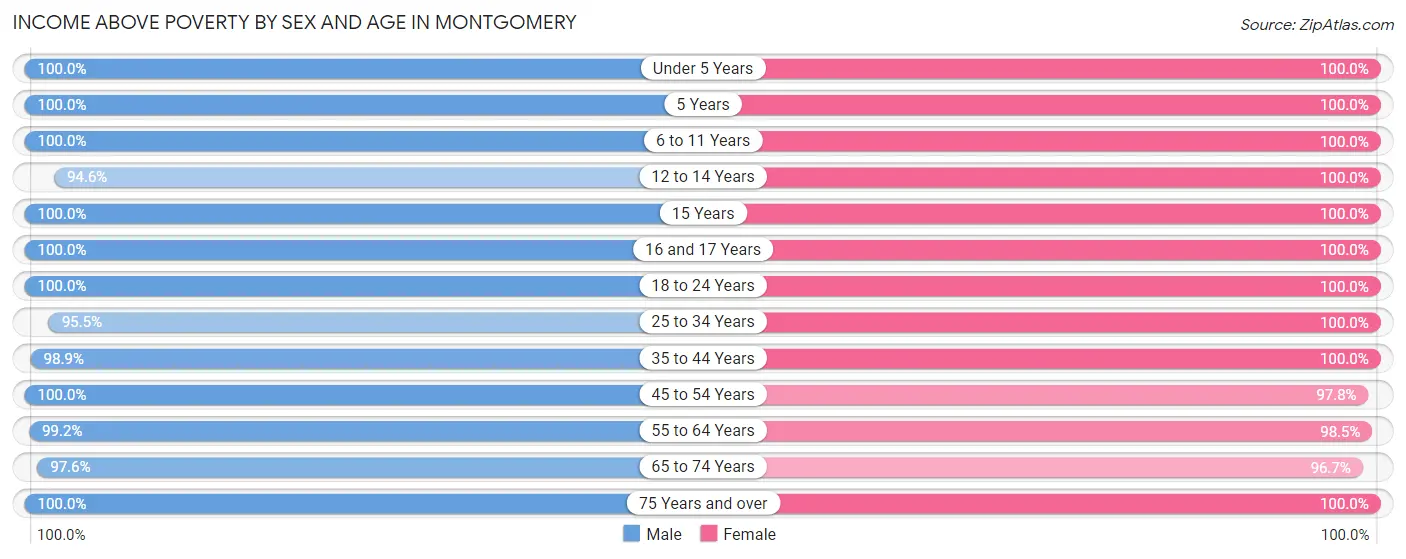
| Age Bracket | Male | Female |
| Under 5 Years | 433 (100.0%) | 377 (100.0%) |
| 5 Years | 142 (100.0%) | 46 (100.0%) |
| 6 to 11 Years | 672 (100.0%) | 607 (100.0%) |
| 12 to 14 Years | 156 (94.6%) | 171 (100.0%) |
| 15 Years | 22 (100.0%) | 100 (100.0%) |
| 16 and 17 Years | 142 (100.0%) | 70 (100.0%) |
| 18 to 24 Years | 210 (100.0%) | 243 (100.0%) |
| 25 to 34 Years | 319 (95.5%) | 246 (100.0%) |
| 35 to 44 Years | 708 (98.9%) | 740 (100.0%) |
| 45 to 54 Years | 520 (100.0%) | 609 (97.8%) |
| 55 to 64 Years | 845 (99.2%) | 833 (98.5%) |
| 65 to 74 Years | 536 (97.6%) | 729 (96.7%) |
| 75 Years and over | 462 (100.0%) | 489 (100.0%) |
| Total | 5,167 (99.0%) | 5,260 (99.0%) |
Income Below Poverty Among Married-Couple Families in Montgomery
The poverty statistics for married-couple families in Montgomery show that 0.7% or 18 of the total 2,637 families live below the poverty line. Families with no children have the highest poverty rate of 1.2%, comprising of 18 families. On the other hand, families with 1 or 2 children have the lowest poverty rate of 0.0%, which includes 0 families.
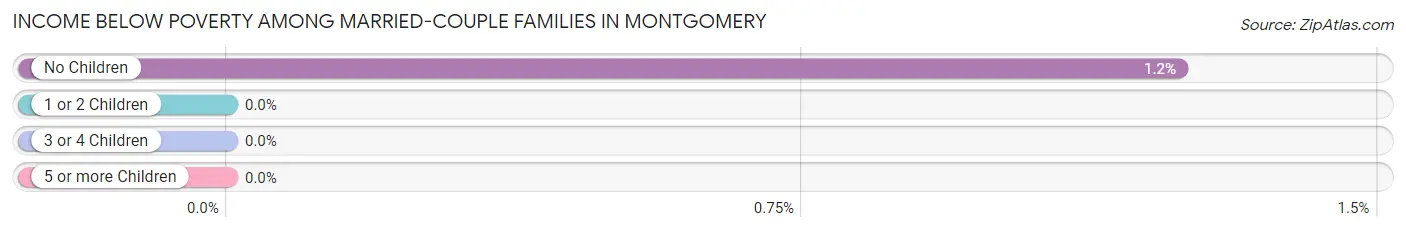
| Children | Above Poverty | Below Poverty |
| No Children | 1,428 (98.8%) | 18 (1.2%) |
| 1 or 2 Children | 848 (100.0%) | 0 (0.0%) |
| 3 or 4 Children | 304 (100.0%) | 0 (0.0%) |
| 5 or more Children | 39 (100.0%) | 0 (0.0%) |
| Total | 2,619 (99.3%) | 18 (0.7%) |
Income Below Poverty Among Single-Parent Households in Montgomery
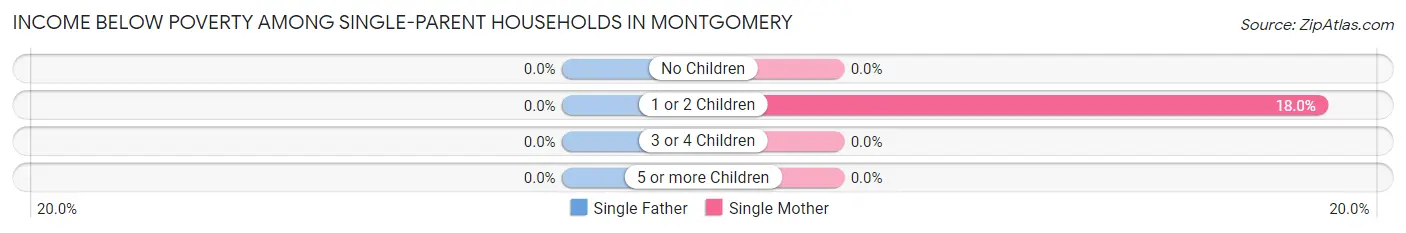
| Children | Single Father | Single Mother |
| No Children | 0 (0.0%) | 0 (0.0%) |
| 1 or 2 Children | 0 (0.0%) | 11 (18.0%) |
| 3 or 4 Children | 0 (0.0%) | 0 (0.0%) |
| 5 or more Children | 0 (0.0%) | 0 (0.0%) |
| Total | 0 (0.0%) | 11 (6.6%) |
Income Below Poverty Among Married-Couple vs Single-Parent Households in Montgomery
The poverty data for Montgomery shows that 18 of the married-couple family households (0.7%) and 11 of the single-parent households (4.6%) are living below the poverty level. Within the married-couple family households, those with no children have the highest poverty rate, with 18 households (1.2%) falling below the poverty line. Among the single-parent households, those with 1 or 2 children have the highest poverty rate, with 11 household (9.9%) living below poverty.
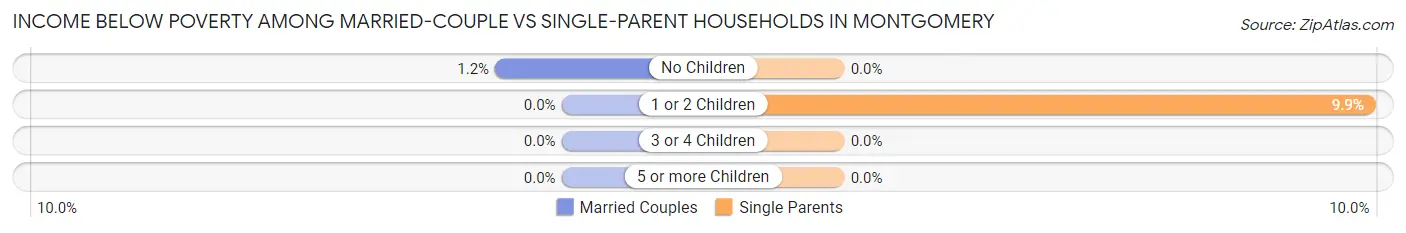
| Children | Married-Couple Families | Single-Parent Households |
| No Children | 18 (1.2%) | 0 (0.0%) |
| 1 or 2 Children | 0 (0.0%) | 11 (9.9%) |
| 3 or 4 Children | 0 (0.0%) | 0 (0.0%) |
| 5 or more Children | 0 (0.0%) | 0 (0.0%) |
| Total | 18 (0.7%) | 11 (4.6%) |
Race in Montgomery
The most populous races in Montgomery are White / Caucasian (9,817 | 90.8%), Hispanic or Latino (470 | 4.3%), and Two or more Races (445 | 4.1%).
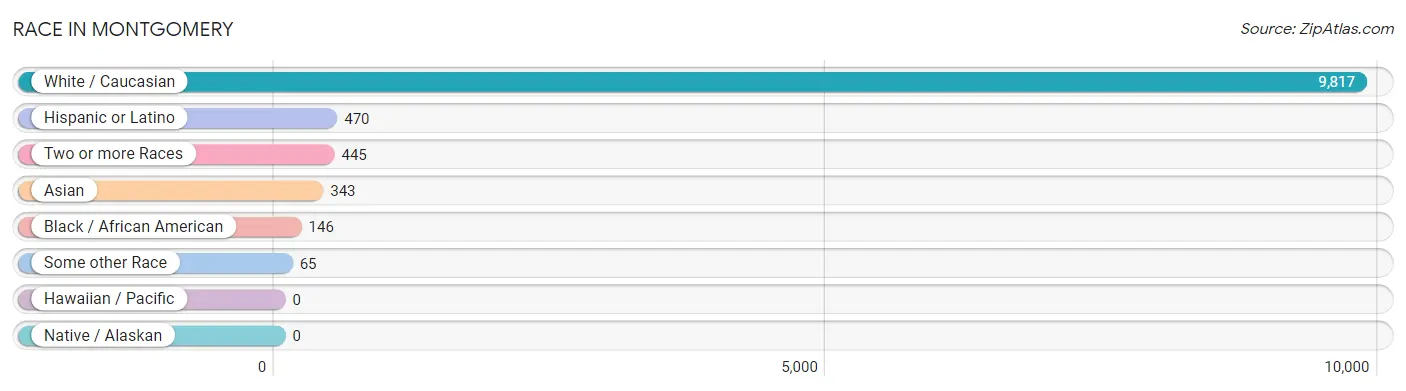
| Race | # Population | % Population |
| Asian | 343 | 3.2% |
| Black / African American | 146 | 1.3% |
| Hawaiian / Pacific | 0 | 0.0% |
| Hispanic or Latino | 470 | 4.3% |
| Native / Alaskan | 0 | 0.0% |
| White / Caucasian | 9,817 | 90.8% |
| Two or more Races | 445 | 4.1% |
| Some other Race | 65 | 0.6% |
| Total | 10,816 | 100.0% |
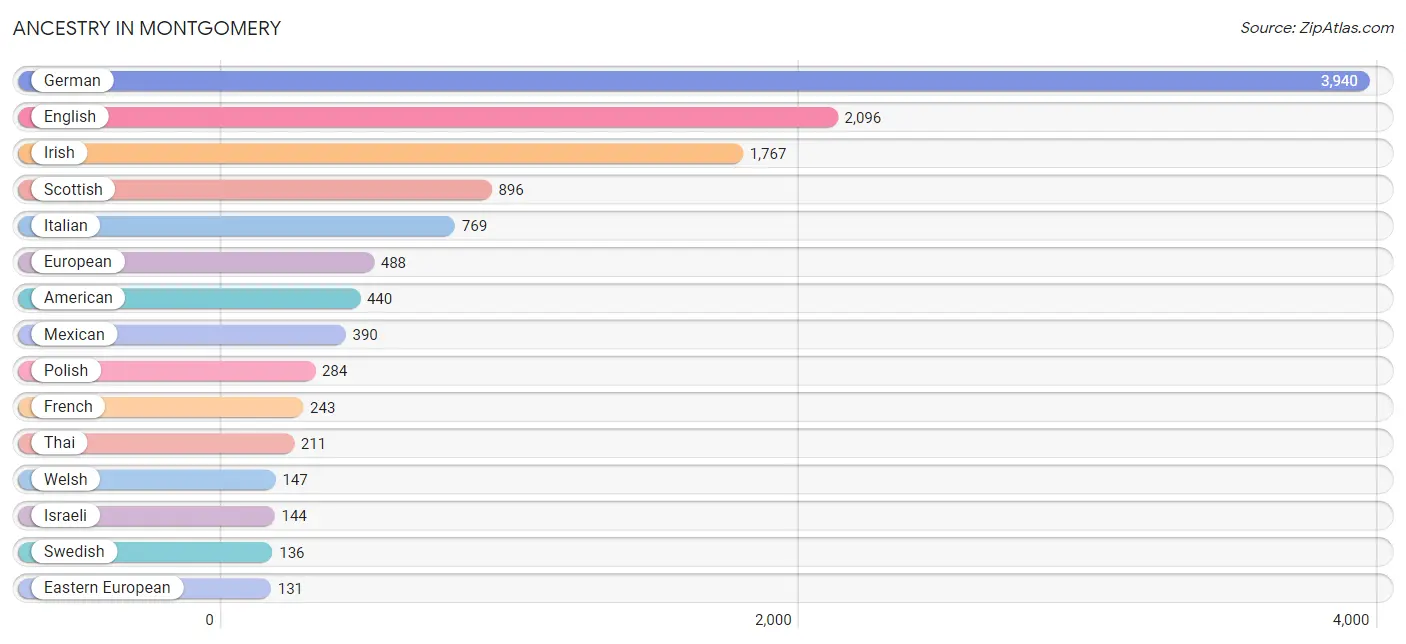
Ancestry in Montgomery
The most populous ancestries reported in Montgomery are German (3,940 | 36.4%), English (2,096 | 19.4%), Irish (1,767 | 16.3%), Scottish (896 | 8.3%), and Italian (769 | 7.1%), together accounting for 87.5% of all Montgomery residents.
| Ancestry | # Population | % Population |
| American | 440 | 4.1% |
| Arab | 18 | 0.2% |
| Austrian | 27 | 0.3% |
| Belgian | 17 | 0.2% |
| Bhutanese | 26 | 0.2% |
| Brazilian | 7 | 0.1% |
| British | 101 | 0.9% |
| Bulgarian | 20 | 0.2% |
| Burmese | 46 | 0.4% |
| Canadian | 17 | 0.2% |
| Central American | 48 | 0.4% |
| Croatian | 6 | 0.1% |
| Czech | 8 | 0.1% |
| Danish | 47 | 0.4% |
| Dutch | 98 | 0.9% |
| Eastern European | 131 | 1.2% |
| English | 2,096 | 19.4% |
| European | 488 | 4.5% |
| Filipino | 21 | 0.2% |
| Finnish | 8 | 0.1% |
| French | 243 | 2.2% |
| German | 3,940 | 36.4% |
| Greek | 107 | 1.0% |
| Guatemalan | 14 | 0.1% |
| Hungarian | 48 | 0.4% |
| Indian (Asian) | 69 | 0.6% |
| Iranian | 10 | 0.1% |
| Irish | 1,767 | 16.3% |
| Israeli | 144 | 1.3% |
| Italian | 769 | 7.1% |
| Korean | 15 | 0.1% |
| Lebanese | 18 | 0.2% |
| Mexican | 390 | 3.6% |
| Mongolian | 26 | 0.2% |
| Nicaraguan | 10 | 0.1% |
| Norwegian | 87 | 0.8% |
| Panamanian | 24 | 0.2% |
| Polish | 284 | 2.6% |
| Portuguese | 9 | 0.1% |
| Russian | 62 | 0.6% |
| Scandinavian | 28 | 0.3% |
| Scotch-Irish | 128 | 1.2% |
| Scottish | 896 | 8.3% |
| Slovak | 30 | 0.3% |
| Slovene | 12 | 0.1% |
| South American | 18 | 0.2% |
| Spaniard | 14 | 0.1% |
| Sri Lankan | 7 | 0.1% |
| Swedish | 136 | 1.3% |
| Swiss | 36 | 0.3% |
| Thai | 211 | 1.9% |
| Ukrainian | 99 | 0.9% |
| Venezuelan | 18 | 0.2% |
| Welsh | 147 | 1.4% | View All 54 Rows |
Immigrants in Montgomery
The most numerous immigrant groups reported in Montgomery came from Asia (308 | 2.9%), Latin America (108 | 1.0%), Israel (106 | 1.0%), Western Asia (106 | 1.0%), and Central America (101 | 0.9%), together accounting for 6.7% of all Montgomery residents.
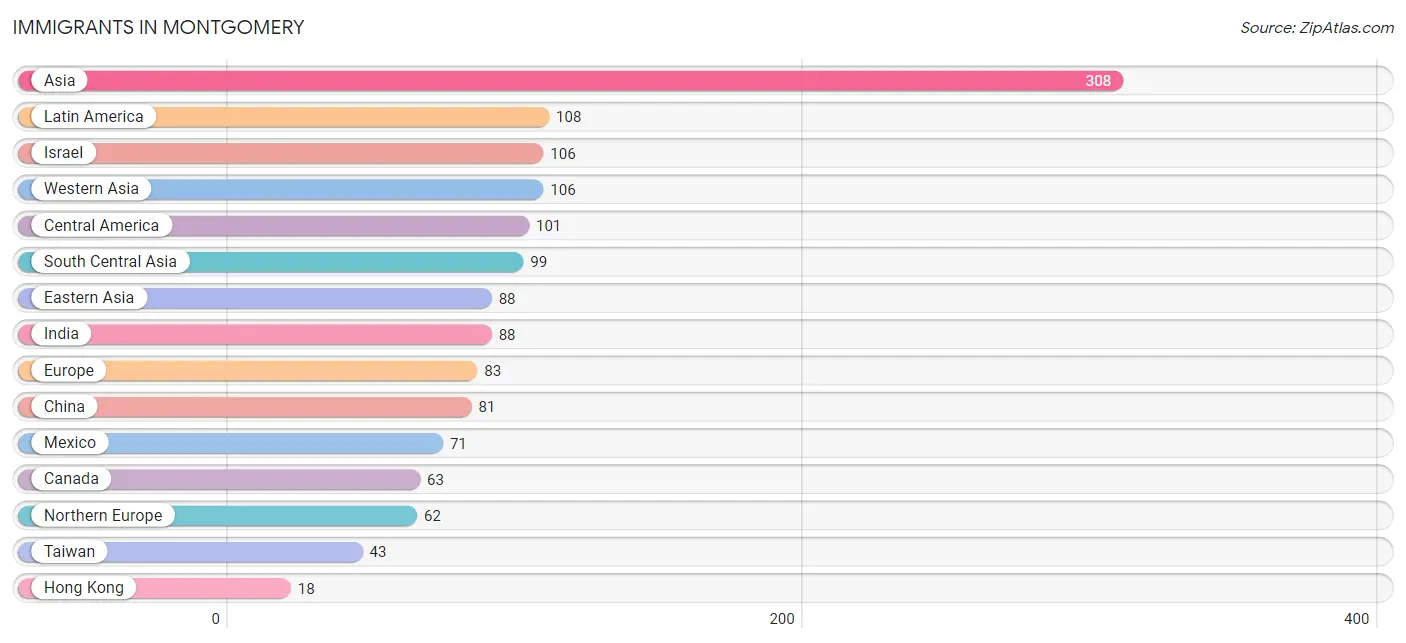
| Immigration Origin | # Population | % Population |
| Africa | 6 | 0.1% |
| Asia | 308 | 2.9% |
| Belarus | 5 | 0.1% |
| Brazil | 7 | 0.1% |
| Canada | 63 | 0.6% |
| Central America | 101 | 0.9% |
| China | 81 | 0.7% |
| Eastern Asia | 88 | 0.8% |
| Eastern Europe | 5 | 0.1% |
| England | 17 | 0.2% |
| Europe | 83 | 0.8% |
| Guatemala | 14 | 0.1% |
| Hong Kong | 18 | 0.2% |
| India | 88 | 0.8% |
| Ireland | 16 | 0.2% |
| Israel | 106 | 1.0% |
| Italy | 7 | 0.1% |
| Japan | 7 | 0.1% |
| Latin America | 108 | 1.0% |
| Malaysia | 8 | 0.1% |
| Mexico | 71 | 0.7% |
| Nepal | 11 | 0.1% |
| Northern Europe | 62 | 0.6% |
| Panama | 16 | 0.2% |
| Portugal | 9 | 0.1% |
| South America | 7 | 0.1% |
| South Central Asia | 99 | 0.9% |
| South Eastern Asia | 15 | 0.1% |
| Southern Europe | 16 | 0.2% |
| Taiwan | 43 | 0.4% |
| Vietnam | 7 | 0.1% |
| Western Asia | 106 | 1.0% | View All 32 Rows |
Sex and Age in Montgomery
Sex and Age in Montgomery
The most populous age groups in Montgomery are 5 to 9 Years (717 | 13.5%) for men and 65 to 69 Years (538 | 9.8%) for women.
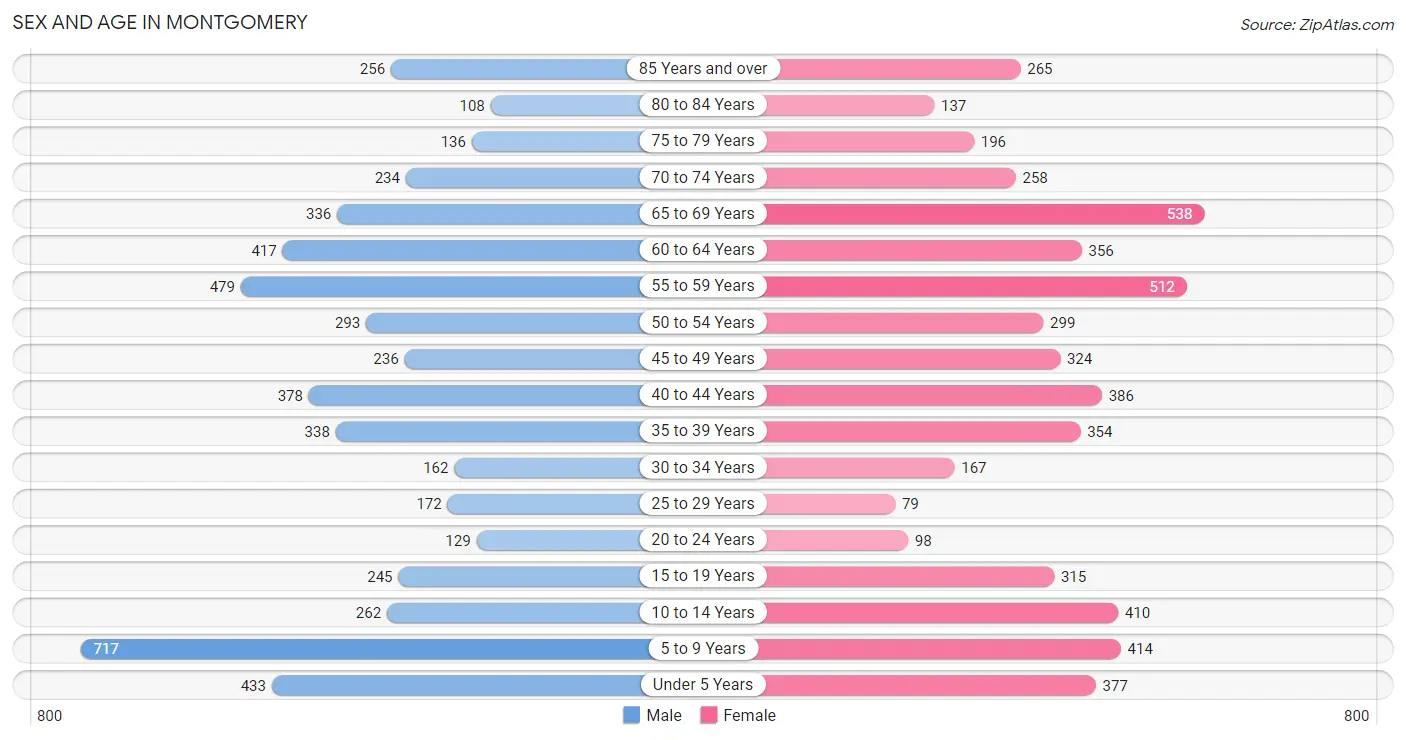
| Age Bracket | Male | Female |
| Under 5 Years | 433 (8.1%) | 377 (6.9%) |
| 5 to 9 Years | 717 (13.5%) | 414 (7.5%) |
| 10 to 14 Years | 262 (4.9%) | 410 (7.5%) |
| 15 to 19 Years | 245 (4.6%) | 315 (5.7%) |
| 20 to 24 Years | 129 (2.4%) | 98 (1.8%) |
| 25 to 29 Years | 172 (3.2%) | 79 (1.4%) |
| 30 to 34 Years | 162 (3.0%) | 167 (3.0%) |
| 35 to 39 Years | 338 (6.3%) | 354 (6.5%) |
| 40 to 44 Years | 378 (7.1%) | 386 (7.0%) |
| 45 to 49 Years | 236 (4.4%) | 324 (5.9%) |
| 50 to 54 Years | 293 (5.5%) | 299 (5.4%) |
| 55 to 59 Years | 479 (9.0%) | 512 (9.3%) |
| 60 to 64 Years | 417 (7.8%) | 356 (6.5%) |
| 65 to 69 Years | 336 (6.3%) | 538 (9.8%) |
| 70 to 74 Years | 234 (4.4%) | 258 (4.7%) |
| 75 to 79 Years | 136 (2.5%) | 196 (3.6%) |
| 80 to 84 Years | 108 (2.0%) | 137 (2.5%) |
| 85 Years and over | 256 (4.8%) | 265 (4.8%) |
| Total | 5,331 (100.0%) | 5,485 (100.0%) |
Families and Households in Montgomery
Median Family Size in Montgomery
The median family size in Montgomery is 3.20 persons per family, with single male/father families (75 | 2.6%) accounting for the largest median family size of 3.4 persons per family. On the other hand, single female/mother families (166 | 5.8%) represent the smallest median family size with 2.36 persons per family.
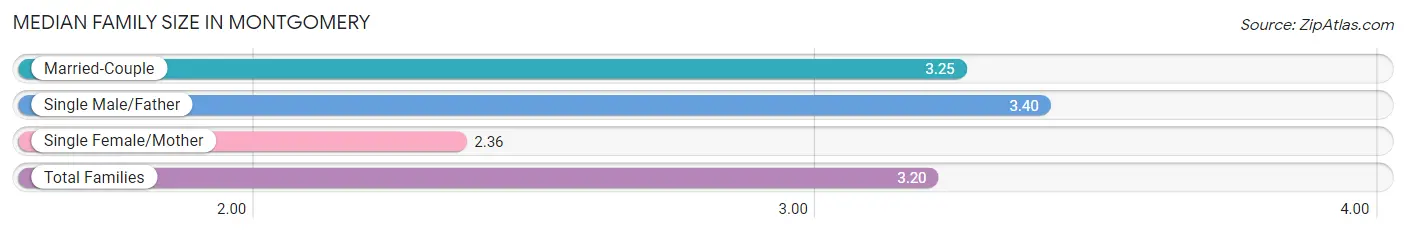
| Family Type | # Families | Family Size |
| Married-Couple | 2,637 (91.6%) | 3.25 |
| Single Male/Father | 75 (2.6%) | 3.40 |
| Single Female/Mother | 166 (5.8%) | 2.36 |
| Total Families | 2,878 (100.0%) | 3.20 |
Median Household Size in Montgomery
The median household size in Montgomery is 2.61 persons per household, with single male/father households (75 | 1.9%) accounting for the largest median household size of 3.55 persons per household. non-family households (1,151 | 28.6%) represent the smallest median household size with 1.11 persons per household.
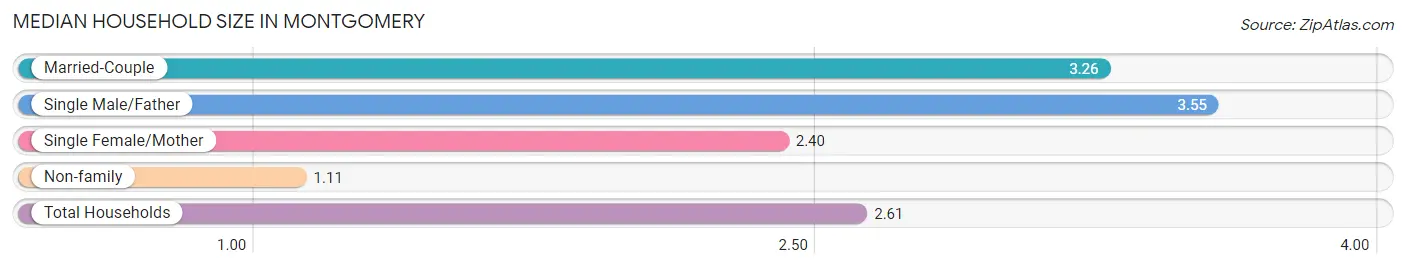
| Household Type | # Households | Household Size |
| Married-Couple | 2,637 (65.4%) | 3.26 |
| Single Male/Father | 75 (1.9%) | 3.55 |
| Single Female/Mother | 166 (4.1%) | 2.40 |
| Non-family | 1,151 (28.6%) | 1.11 |
| Total Households | 4,029 (100.0%) | 2.61 |
Household Size by Marriage Status in Montgomery
Out of a total of 4,029 households in Montgomery, 2,878 (71.4%) are family households, while 1,151 (28.6%) are nonfamily households. The most numerous type of family households are 2-person households, comprising 1,273, and the most common type of nonfamily households are 1-person households, comprising 1,048.
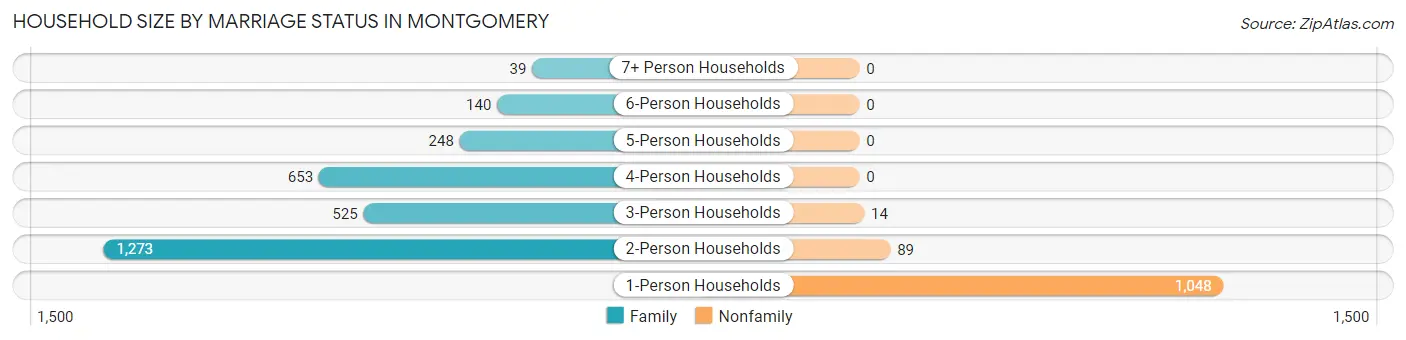
| Household Size | Family Households | Nonfamily Households |
| 1-Person Households | - | 1,048 (26.0%) |
| 2-Person Households | 1,273 (31.6%) | 89 (2.2%) |
| 3-Person Households | 525 (13.0%) | 14 (0.4%) |
| 4-Person Households | 653 (16.2%) | 0 (0.0%) |
| 5-Person Households | 248 (6.2%) | 0 (0.0%) |
| 6-Person Households | 140 (3.5%) | 0 (0.0%) |
| 7+ Person Households | 39 (1.0%) | 0 (0.0%) |
| Total | 2,878 (71.4%) | 1,151 (28.6%) |
Female Fertility in Montgomery
Fertility by Age in Montgomery
Average fertility rate in Montgomery is 63.0 births per 1,000 women. Women in the age bracket of 20 to 34 years have the highest fertility rate with 148.0 births per 1,000 women. Women in the age bracket of 35 to 50 years acount for 54.0% of all women with births.
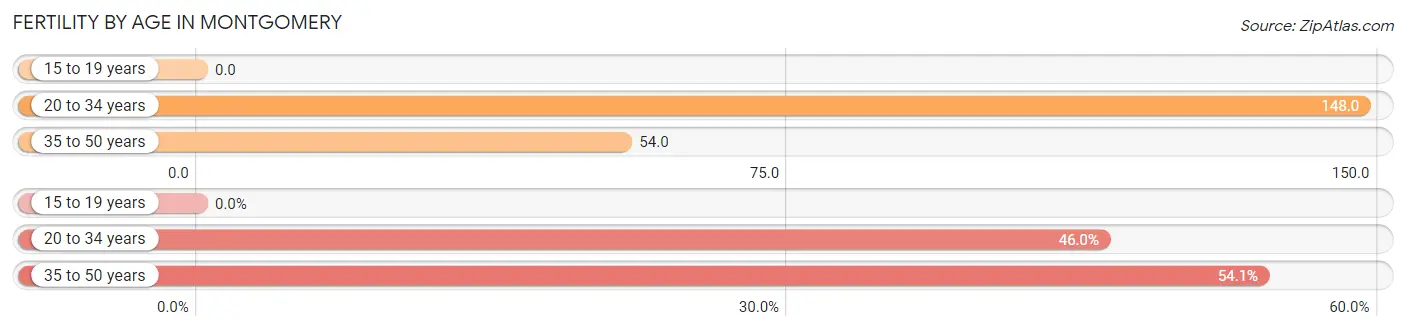
| Age Bracket | Women with Births | Births / 1,000 Women |
| 15 to 19 years | 0 (0.0%) | 0.0 |
| 20 to 34 years | 51 (46.0%) | 148.0 |
| 35 to 50 years | 60 (54.0%) | 54.0 |
| Total | 111 (100.0%) | 63.0 |
Fertility by Age by Marriage Status in Montgomery
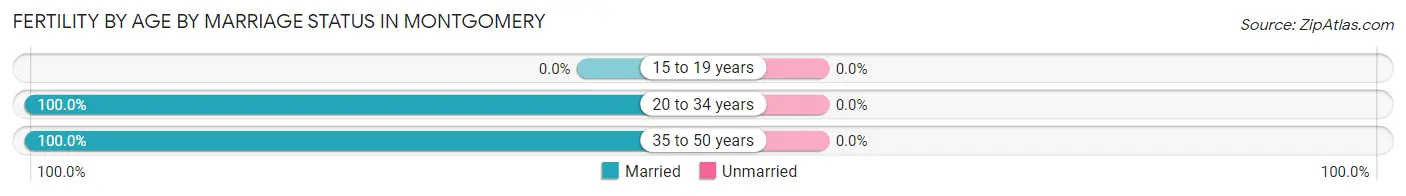
| Age Bracket | Married | Unmarried |
| 15 to 19 years | 0 (0.0%) | 0 (0.0%) |
| 20 to 34 years | 51 (100.0%) | 0 (0.0%) |
| 35 to 50 years | 60 (100.0%) | 0 (0.0%) |
| Total | 111 (100.0%) | 0 (0.0%) |
Fertility by Education in Montgomery
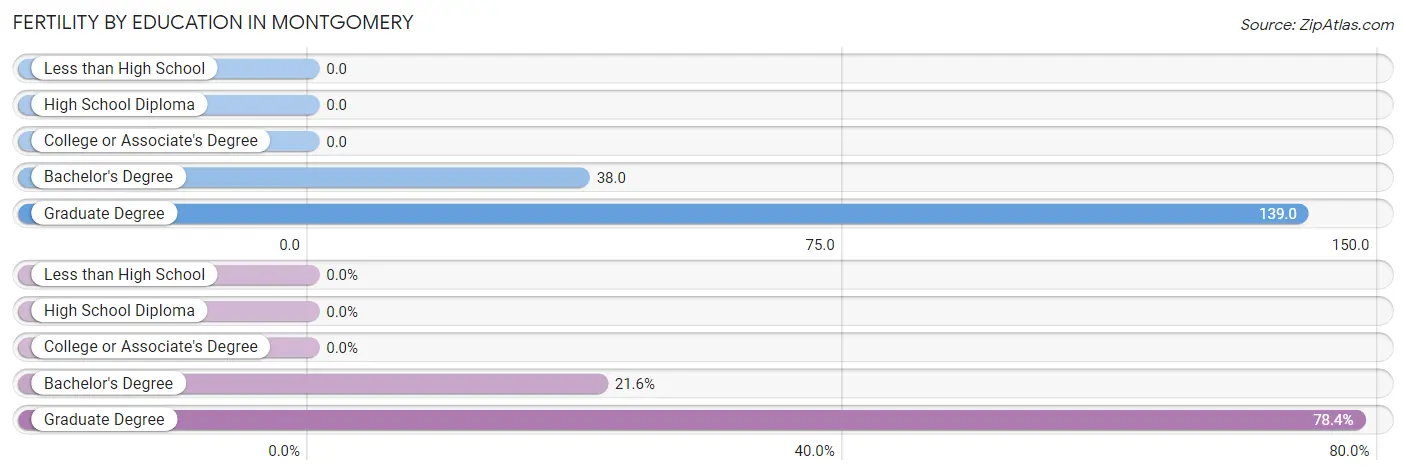
| Educational Attainment | Women with Births | Births / 1,000 Women |
| Less than High School | 0 (0.0%) | 0.0 |
| High School Diploma | 0 (0.0%) | 0.0 |
| College or Associate's Degree | 0 (0.0%) | 0.0 |
| Bachelor's Degree | 24 (21.6%) | 38.0 |
| Graduate Degree | 87 (78.4%) | 139.0 |
| Total | 111 (100.0%) | 63.0 |
Fertility by Education by Marriage Status in Montgomery
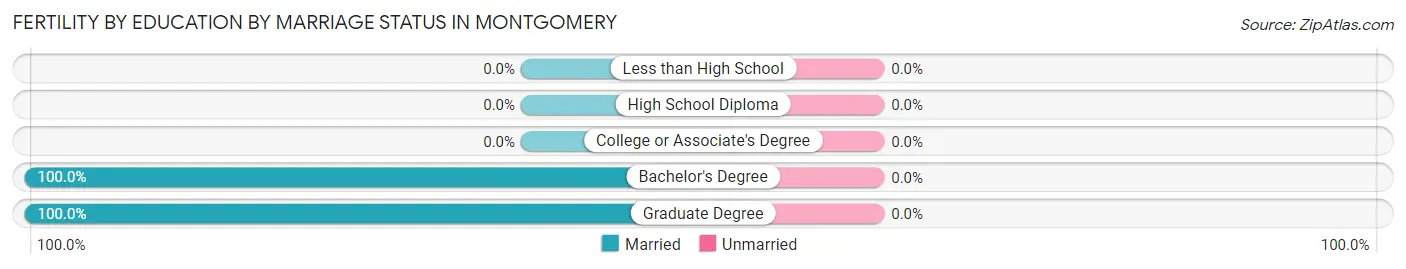
| Educational Attainment | Married | Unmarried |
| Less than High School | 0 (0.0%) | 0 (0.0%) |
| High School Diploma | 0 (0.0%) | 0 (0.0%) |
| College or Associate's Degree | 0 (0.0%) | 0 (0.0%) |
| Bachelor's Degree | 24 (100.0%) | 0 (0.0%) |
| Graduate Degree | 87 (100.0%) | 0 (0.0%) |
| Total | 111 (100.0%) | 0 (0.0%) |
Employment Characteristics in Montgomery
Employment by Class of Employer in Montgomery
Among the 5,038 employed individuals in Montgomery, private company employees (3,295 | 65.4%), not-for-profit organizations (654 | 13.0%), and local government employees (313 | 6.2%) make up the most common classes of employment.
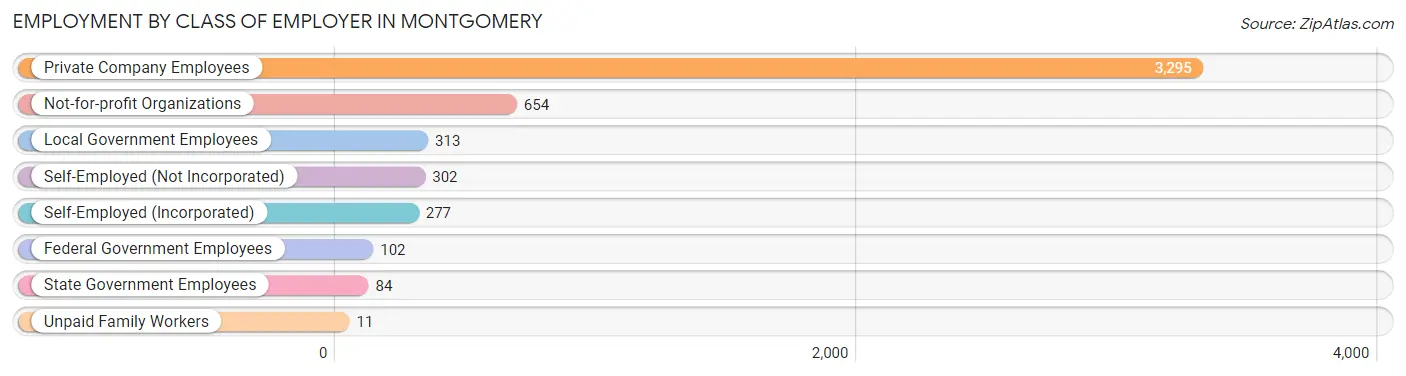
| Employer Class | # Employees | % Employees |
| Private Company Employees | 3,295 | 65.4% |
| Self-Employed (Incorporated) | 277 | 5.5% |
| Self-Employed (Not Incorporated) | 302 | 6.0% |
| Not-for-profit Organizations | 654 | 13.0% |
| Local Government Employees | 313 | 6.2% |
| State Government Employees | 84 | 1.7% |
| Federal Government Employees | 102 | 2.0% |
| Unpaid Family Workers | 11 | 0.2% |
| Total | 5,038 | 100.0% |
Employment Status by Age in Montgomery
According to the labor force statistics for Montgomery, out of the total population over 16 years of age (8,081), 64.4% or 5,204 individuals are in the labor force, with 2.4% or 125 of them unemployed. The age group with the highest labor force participation rate is 30 to 34 years, with 92.7% or 305 individuals in the labor force. Within the labor force, the 25 to 29 years age range has the highest percentage of unemployed individuals, with 38.2% or 73 of them being unemployed.
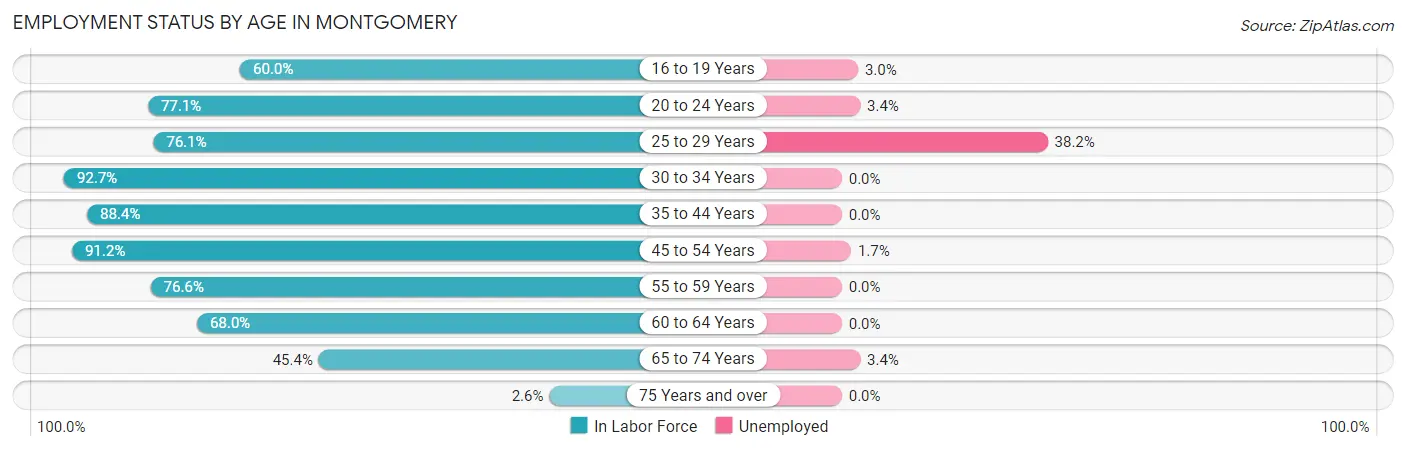
| Age Bracket | In Labor Force | Unemployed |
| 16 to 19 Years | 263 (60.0%) | 8 (3.0%) |
| 20 to 24 Years | 175 (77.1%) | 6 (3.4%) |
| 25 to 29 Years | 191 (76.1%) | 73 (38.2%) |
| 30 to 34 Years | 305 (92.7%) | 0 (0.0%) |
| 35 to 44 Years | 1,287 (88.4%) | 0 (0.0%) |
| 45 to 54 Years | 1,051 (91.2%) | 18 (1.7%) |
| 55 to 59 Years | 759 (76.6%) | 0 (0.0%) |
| 60 to 64 Years | 526 (68.0%) | 0 (0.0%) |
| 65 to 74 Years | 620 (45.4%) | 21 (3.4%) |
| 75 Years and over | 29 (2.6%) | 0 (0.0%) |
| Total | 5,204 (64.4%) | 125 (2.4%) |
Employment Status by Educational Attainment in Montgomery
According to labor force statistics for Montgomery, 83.2% of individuals (4,120) out of the total population between 25 and 64 years of age (4,952) are in the labor force, with 2.2% or 91 of them being unemployed. The group with the highest labor force participation rate are those with the educational attainment of college / associate degree, with 89.9% or 532 individuals in the labor force. Within the labor force, individuals with bachelor's degree or higher education have the highest percentage of unemployment, with 2.7% or 91 of them being unemployed.
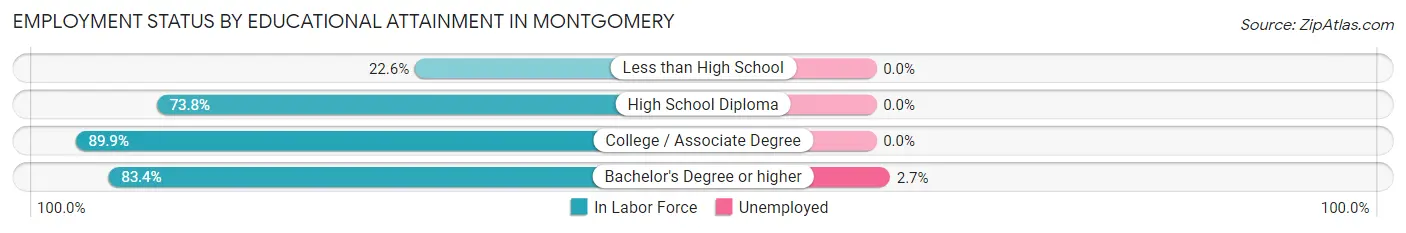
| Educational Attainment | In Labor Force | Unemployed |
| Less than High School | 7 (22.6%) | 0 (0.0%) |
| High School Diploma | 222 (73.8%) | 0 (0.0%) |
| College / Associate Degree | 532 (89.9%) | 0 (0.0%) |
| Bachelor's Degree or higher | 3,359 (83.4%) | 109 (2.7%) |
| Total | 4,120 (83.2%) | 109 (2.2%) |
Employment Occupations by Sex in Montgomery
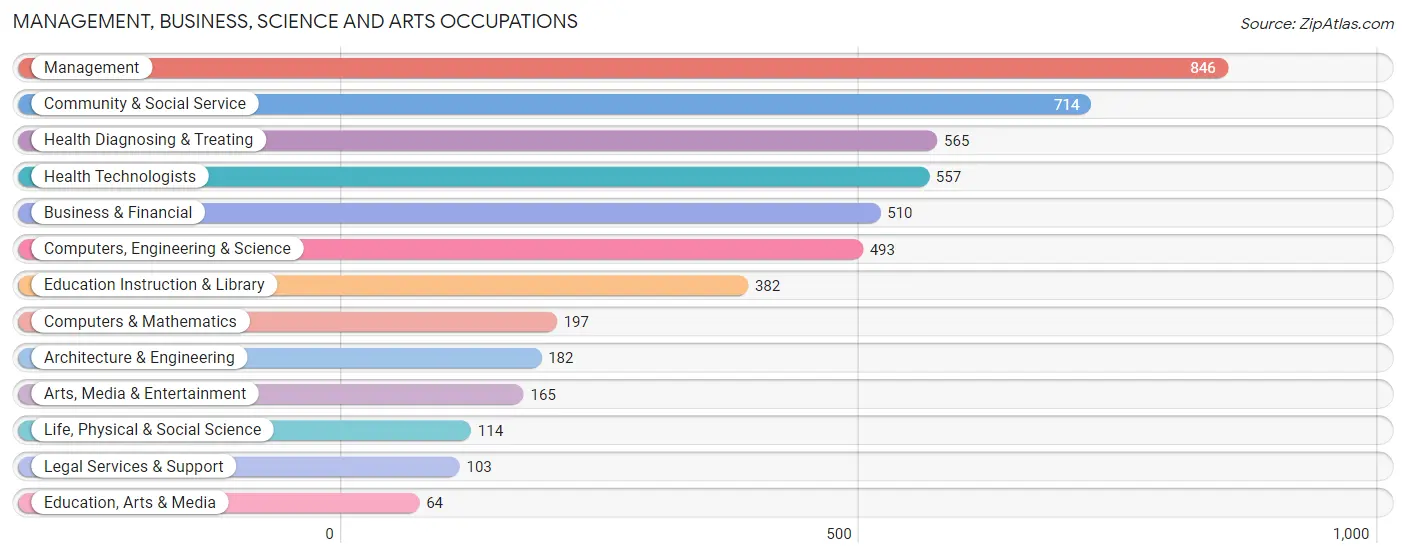
Management, Business, Science and Arts Occupations
The most common Management, Business, Science and Arts occupations in Montgomery are Management (846 | 16.7%), Community & Social Service (714 | 14.1%), Health Diagnosing & Treating (565 | 11.1%), Health Technologists (557 | 11.0%), and Business & Financial (510 | 10.0%).
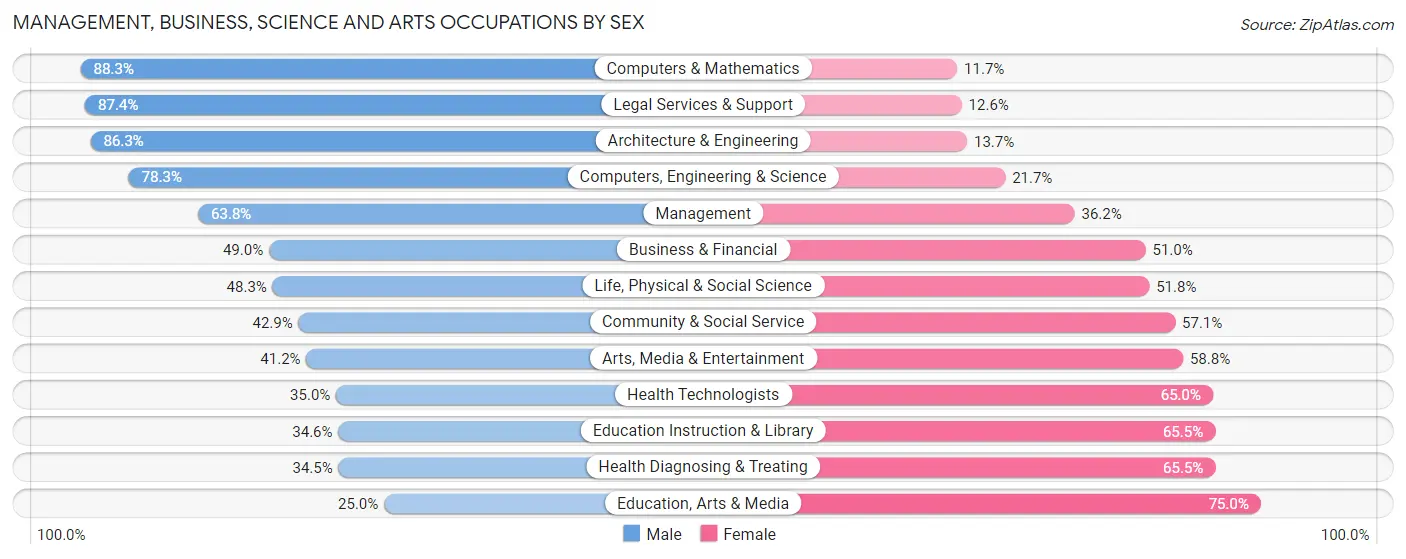
Management, Business, Science and Arts Occupations by Sex
Within the Management, Business, Science and Arts occupations in Montgomery, the most male-oriented occupations are Computers & Mathematics (88.3%), Legal Services & Support (87.4%), and Architecture & Engineering (86.3%), while the most female-oriented occupations are Education, Arts & Media (75.0%), Health Diagnosing & Treating (65.5%), and Education Instruction & Library (65.4%).
| Occupation | Male | Female |
| Management | 540 (63.8%) | 306 (36.2%) |
| Business & Financial | 250 (49.0%) | 260 (51.0%) |
| Computers, Engineering & Science | 386 (78.3%) | 107 (21.7%) |
| Computers & Mathematics | 174 (88.3%) | 23 (11.7%) |
| Architecture & Engineering | 157 (86.3%) | 25 (13.7%) |
| Life, Physical & Social Science | 55 (48.2%) | 59 (51.7%) |
| Community & Social Service | 306 (42.9%) | 408 (57.1%) |
| Education, Arts & Media | 16 (25.0%) | 48 (75.0%) |
| Legal Services & Support | 90 (87.4%) | 13 (12.6%) |
| Education Instruction & Library | 132 (34.5%) | 250 (65.4%) |
| Arts, Media & Entertainment | 68 (41.2%) | 97 (58.8%) |
| Health Diagnosing & Treating | 195 (34.5%) | 370 (65.5%) |
| Health Technologists | 195 (35.0%) | 362 (65.0%) |
| Total (Category) | 1,677 (53.6%) | 1,451 (46.4%) |
| Total (Overall) | 2,636 (51.9%) | 2,443 (48.1%) |
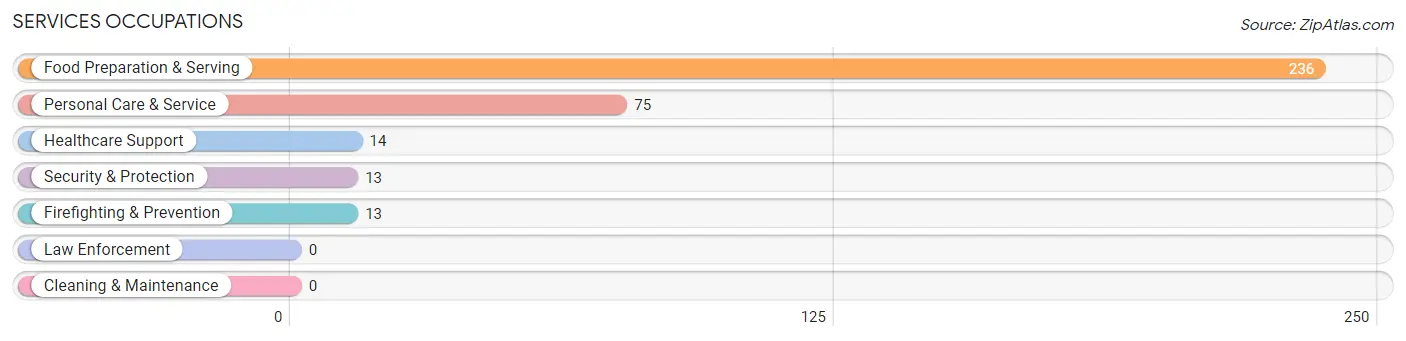
Services Occupations
The most common Services occupations in Montgomery are Food Preparation & Serving (236 | 4.6%), Personal Care & Service (75 | 1.5%), Healthcare Support (14 | 0.3%), Security & Protection (13 | 0.3%), and Firefighting & Prevention (13 | 0.3%).
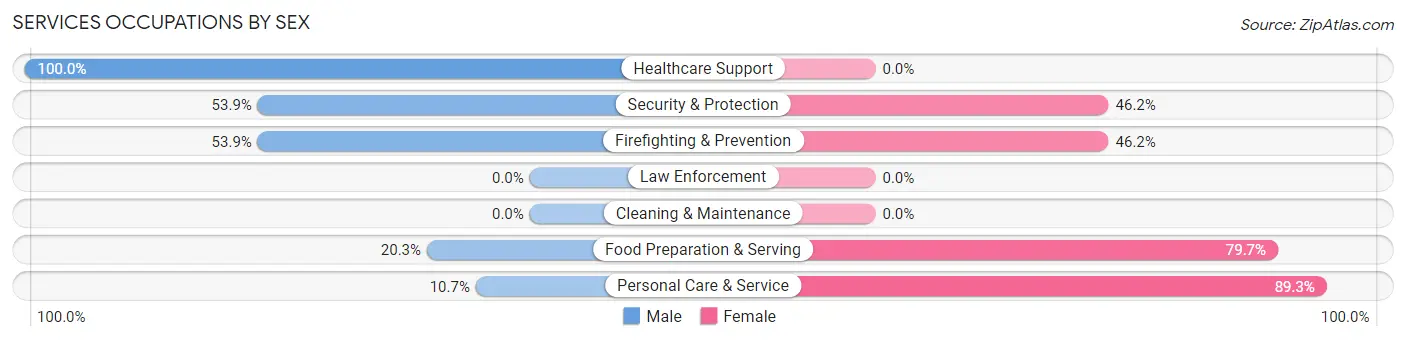
Services Occupations by Sex
Within the Services occupations in Montgomery, the most male-oriented occupations are Healthcare Support (100.0%), Security & Protection (53.8%), and Firefighting & Prevention (53.8%), while the most female-oriented occupations are Personal Care & Service (89.3%), Food Preparation & Serving (79.7%), and Security & Protection (46.2%).
| Occupation | Male | Female |
| Healthcare Support | 14 (100.0%) | 0 (0.0%) |
| Security & Protection | 7 (53.8%) | 6 (46.2%) |
| Firefighting & Prevention | 7 (53.8%) | 6 (46.2%) |
| Law Enforcement | 0 (0.0%) | 0 (0.0%) |
| Food Preparation & Serving | 48 (20.3%) | 188 (79.7%) |
| Cleaning & Maintenance | 0 (0.0%) | 0 (0.0%) |
| Personal Care & Service | 8 (10.7%) | 67 (89.3%) |
| Total (Category) | 77 (22.8%) | 261 (77.2%) |
| Total (Overall) | 2,636 (51.9%) | 2,443 (48.1%) |
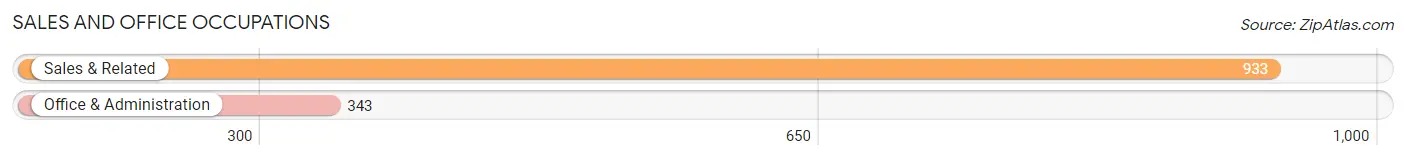
Sales and Office Occupations
The most common Sales and Office occupations in Montgomery are Sales & Related (933 | 18.4%), and Office & Administration (343 | 6.8%).
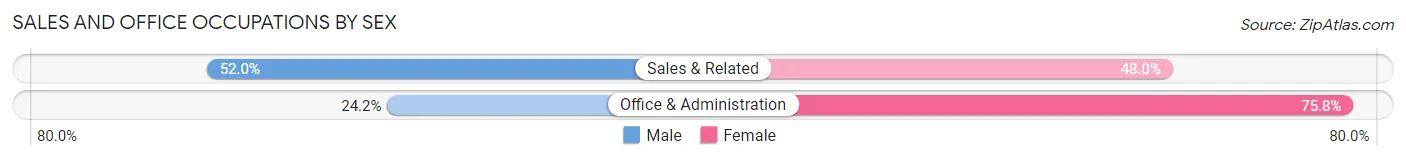
Sales and Office Occupations by Sex
| Occupation | Male | Female |
| Sales & Related | 485 (52.0%) | 448 (48.0%) |
| Office & Administration | 83 (24.2%) | 260 (75.8%) |
| Total (Category) | 568 (44.5%) | 708 (55.5%) |
| Total (Overall) | 2,636 (51.9%) | 2,443 (48.1%) |
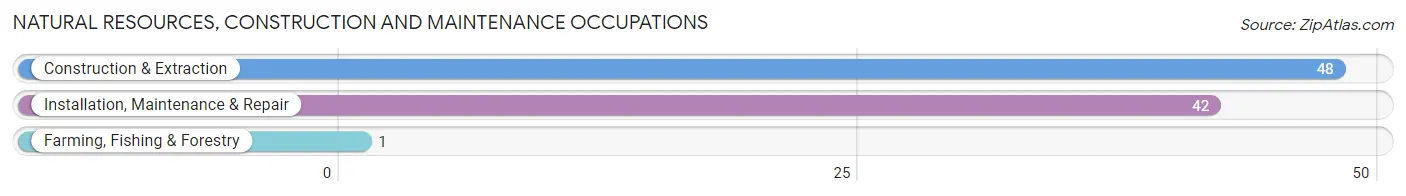
Natural Resources, Construction and Maintenance Occupations
The most common Natural Resources, Construction and Maintenance occupations in Montgomery are Construction & Extraction (48 | 0.9%), Installation, Maintenance & Repair (42 | 0.8%), and Farming, Fishing & Forestry (1 | 0.0%).
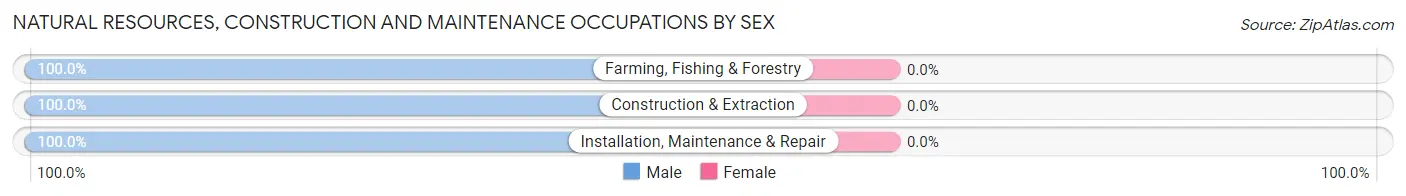
Natural Resources, Construction and Maintenance Occupations by Sex
| Occupation | Male | Female |
| Farming, Fishing & Forestry | 1 (100.0%) | 0 (0.0%) |
| Construction & Extraction | 48 (100.0%) | 0 (0.0%) |
| Installation, Maintenance & Repair | 42 (100.0%) | 0 (0.0%) |
| Total (Category) | 91 (100.0%) | 0 (0.0%) |
| Total (Overall) | 2,636 (51.9%) | 2,443 (48.1%) |
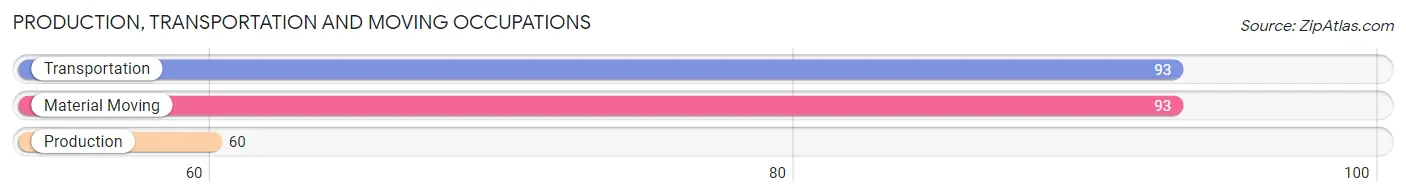
Production, Transportation and Moving Occupations
The most common Production, Transportation and Moving occupations in Montgomery are Transportation (93 | 1.8%), Material Moving (93 | 1.8%), and Production (60 | 1.2%).
Production, Transportation and Moving Occupations by Sex
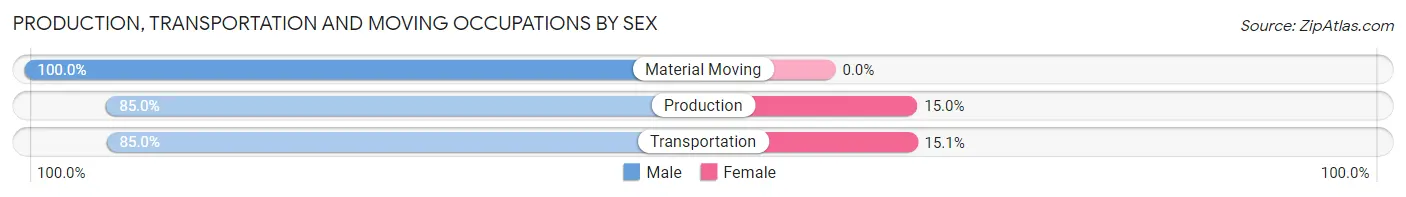
| Occupation | Male | Female |
| Production | 51 (85.0%) | 9 (15.0%) |
| Transportation | 79 (85.0%) | 14 (15.0%) |
| Material Moving | 93 (100.0%) | 0 (0.0%) |
| Total (Category) | 223 (90.6%) | 23 (9.3%) |
| Total (Overall) | 2,636 (51.9%) | 2,443 (48.1%) |
Employment Industries by Sex in Montgomery
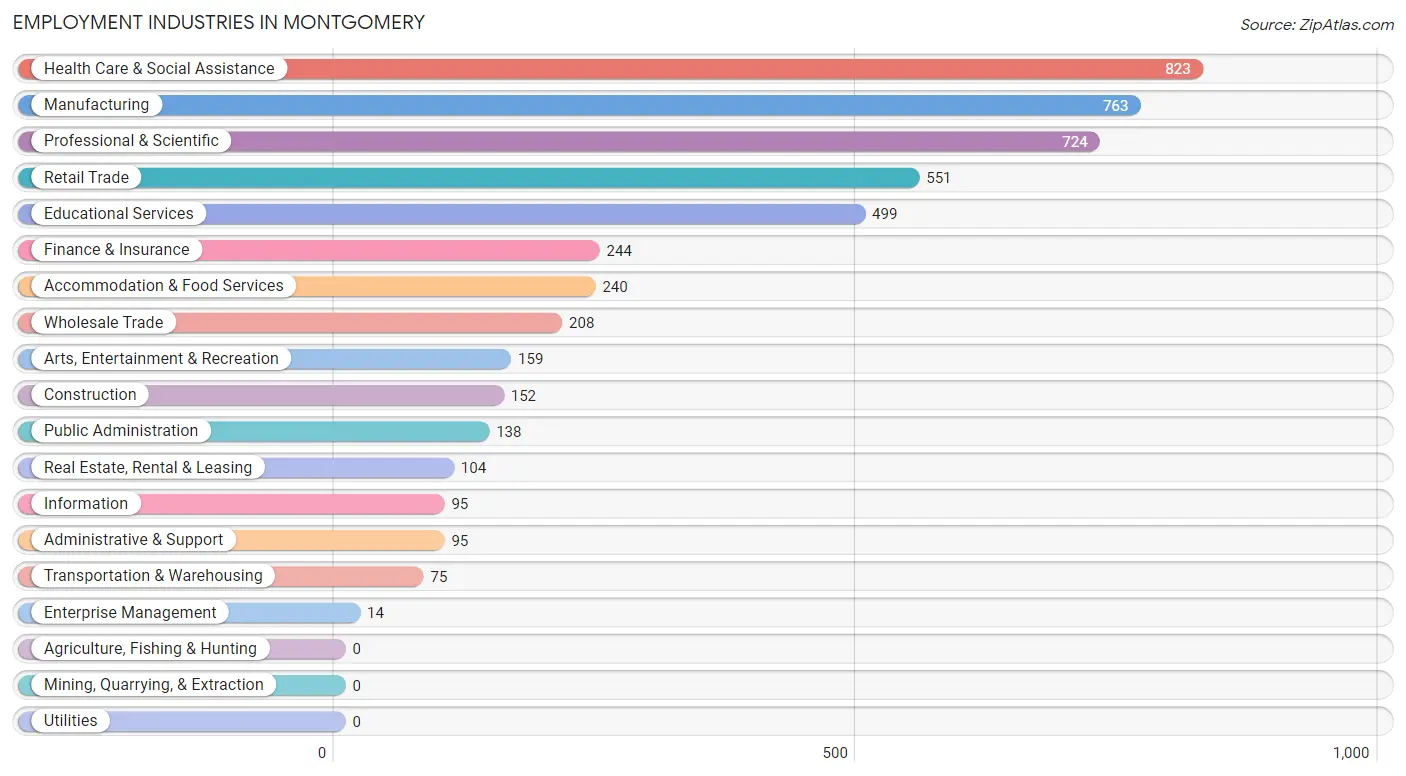
Employment Industries in Montgomery
The major employment industries in Montgomery include Health Care & Social Assistance (823 | 16.2%), Manufacturing (763 | 15.0%), Professional & Scientific (724 | 14.2%), Retail Trade (551 | 10.8%), and Educational Services (499 | 9.8%).
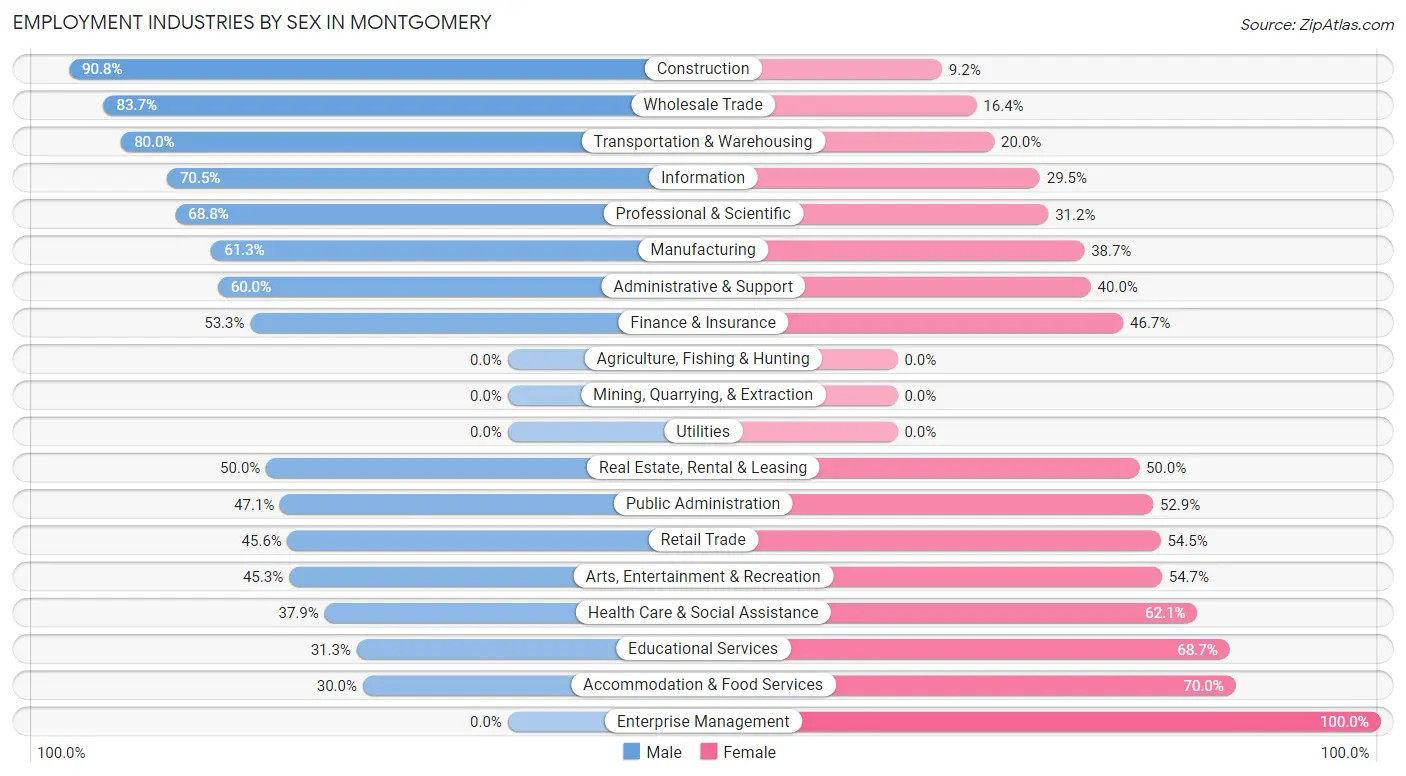
Employment Industries by Sex in Montgomery
The Montgomery industries that see more men than women are Construction (90.8%), Wholesale Trade (83.7%), and Transportation & Warehousing (80.0%), whereas the industries that tend to have a higher number of women are Enterprise Management (100.0%), Accommodation & Food Services (70.0%), and Educational Services (68.7%).
| Industry | Male | Female |
| Agriculture, Fishing & Hunting | 0 (0.0%) | 0 (0.0%) |
| Mining, Quarrying, & Extraction | 0 (0.0%) | 0 (0.0%) |
| Construction | 138 (90.8%) | 14 (9.2%) |
| Manufacturing | 468 (61.3%) | 295 (38.7%) |
| Wholesale Trade | 174 (83.7%) | 34 (16.4%) |
| Retail Trade | 251 (45.6%) | 300 (54.4%) |
| Transportation & Warehousing | 60 (80.0%) | 15 (20.0%) |
| Utilities | 0 (0.0%) | 0 (0.0%) |
| Information | 67 (70.5%) | 28 (29.5%) |
| Finance & Insurance | 130 (53.3%) | 114 (46.7%) |
| Real Estate, Rental & Leasing | 52 (50.0%) | 52 (50.0%) |
| Professional & Scientific | 498 (68.8%) | 226 (31.2%) |
| Enterprise Management | 0 (0.0%) | 14 (100.0%) |
| Administrative & Support | 57 (60.0%) | 38 (40.0%) |
| Educational Services | 156 (31.3%) | 343 (68.7%) |
| Health Care & Social Assistance | 312 (37.9%) | 511 (62.1%) |
| Arts, Entertainment & Recreation | 72 (45.3%) | 87 (54.7%) |
| Accommodation & Food Services | 72 (30.0%) | 168 (70.0%) |
| Public Administration | 65 (47.1%) | 73 (52.9%) |
| Total | 2,636 (51.9%) | 2,443 (48.1%) |
Education in Montgomery
School Enrollment in Montgomery
The most common levels of schooling among the 2,905 students in Montgomery are elementary school (920 | 31.7%), high school (584 | 20.1%), and middle school (503 | 17.3%).
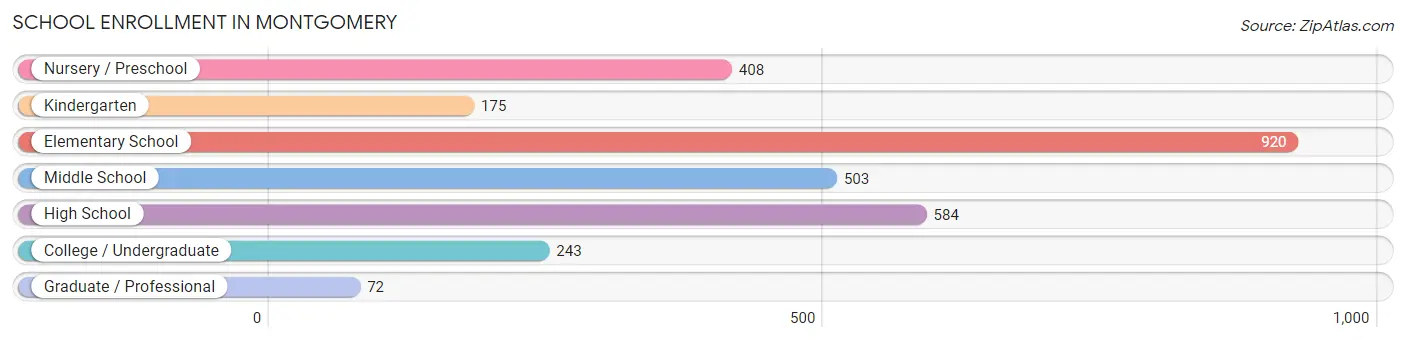
| School Level | # Students | % Students |
| Nursery / Preschool | 408 | 14.0% |
| Kindergarten | 175 | 6.0% |
| Elementary School | 920 | 31.7% |
| Middle School | 503 | 17.3% |
| High School | 584 | 20.1% |
| College / Undergraduate | 243 | 8.4% |
| Graduate / Professional | 72 | 2.5% |
| Total | 2,905 | 100.0% |
School Enrollment by Age by Funding Source in Montgomery
Out of a total of 2,905 students who are enrolled in schools in Montgomery, 694 (23.9%) attend a private institution, while the remaining 2,211 (76.1%) are enrolled in public schools. The age group of 3 to 4 year olds has the highest likelihood of being enrolled in private schools, with 247 (83.5% in the age bracket) enrolled. Conversely, the age group of 35 years and over has the lowest likelihood of being enrolled in a private school, with 80 (100.0% in the age bracket) attending a public institution.
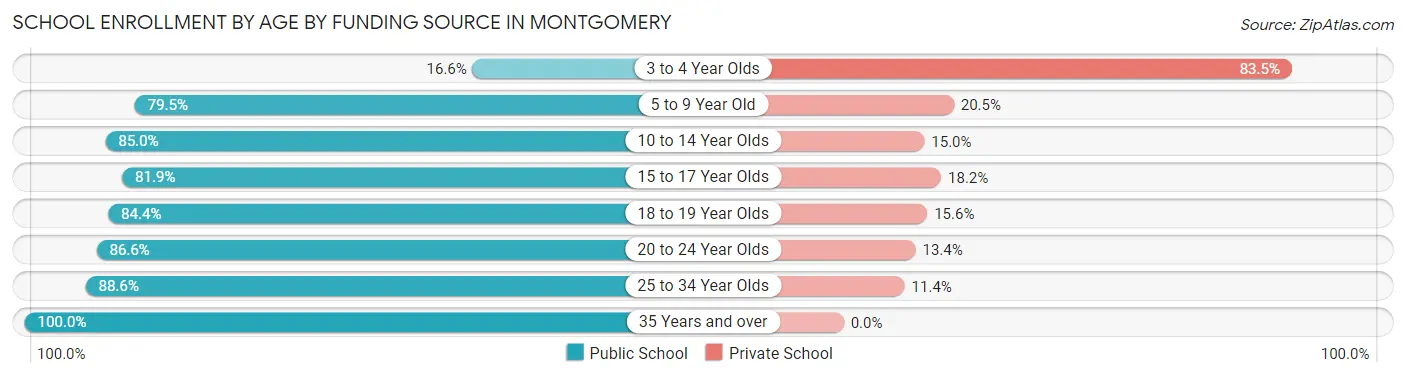
| Age Bracket | Public School | Private School |
| 3 to 4 Year Olds | 49 (16.6%) | 247 (83.5%) |
| 5 to 9 Year Old | 899 (79.5%) | 232 (20.5%) |
| 10 to 14 Year Olds | 571 (85.0%) | 101 (15.0%) |
| 15 to 17 Year Olds | 257 (81.9%) | 57 (18.1%) |
| 18 to 19 Year Olds | 179 (84.4%) | 33 (15.6%) |
| 20 to 24 Year Olds | 97 (86.6%) | 15 (13.4%) |
| 25 to 34 Year Olds | 78 (88.6%) | 10 (11.4%) |
| 35 Years and over | 80 (100.0%) | 0 (0.0%) |
| Total | 2,211 (76.1%) | 694 (23.9%) |
Educational Attainment by Field of Study in Montgomery
Business (1,195 | 19.1%), engineering (919 | 14.7%), science & technology (711 | 11.4%), education (692 | 11.1%), and social sciences (480 | 7.7%) are the most common fields of study among 6,246 individuals in Montgomery who have obtained a bachelor's degree or higher.
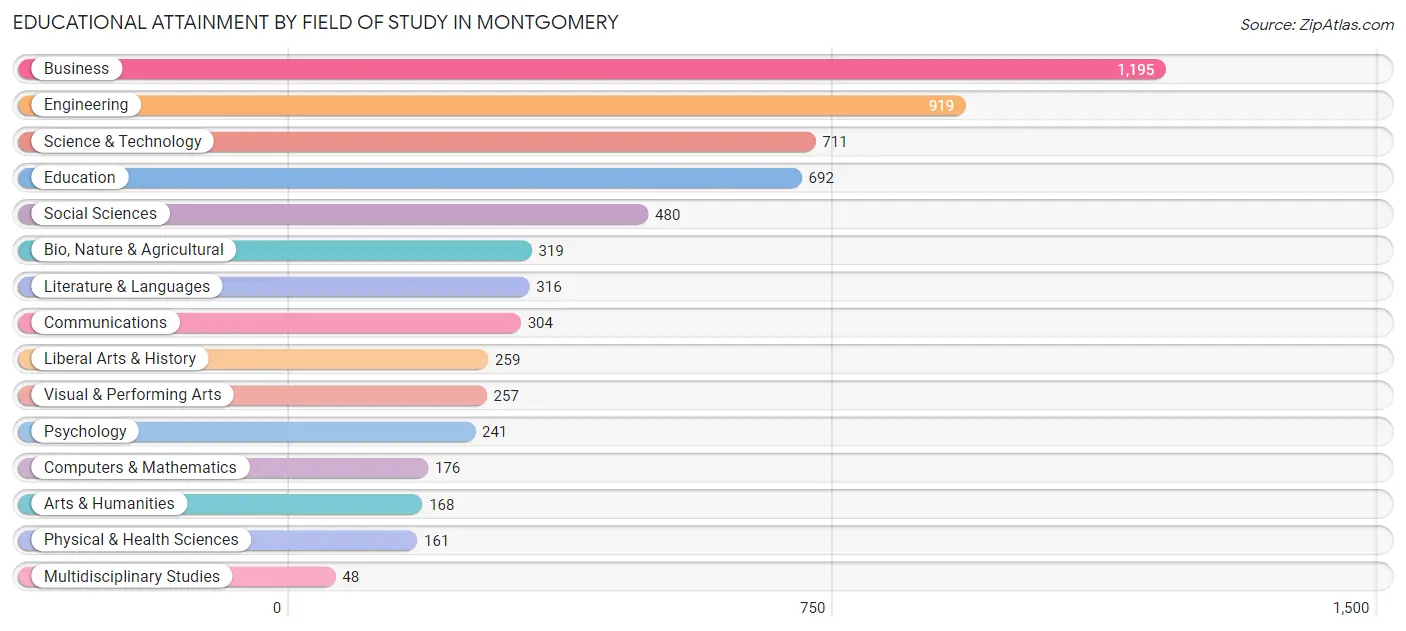
| Field of Study | # Graduates | % Graduates |
| Computers & Mathematics | 176 | 2.8% |
| Bio, Nature & Agricultural | 319 | 5.1% |
| Physical & Health Sciences | 161 | 2.6% |
| Psychology | 241 | 3.9% |
| Social Sciences | 480 | 7.7% |
| Engineering | 919 | 14.7% |
| Multidisciplinary Studies | 48 | 0.8% |
| Science & Technology | 711 | 11.4% |
| Business | 1,195 | 19.1% |
| Education | 692 | 11.1% |
| Literature & Languages | 316 | 5.1% |
| Liberal Arts & History | 259 | 4.2% |
| Visual & Performing Arts | 257 | 4.1% |
| Communications | 304 | 4.9% |
| Arts & Humanities | 168 | 2.7% |
| Total | 6,246 | 100.0% |
Transportation & Commute in Montgomery
Vehicle Availability by Sex in Montgomery
The most prevalent vehicle ownership categories in Montgomery are males with 2 vehicles (1,640, accounting for 62.6%) and females with 2 vehicles (1,377, making up 67.9%).
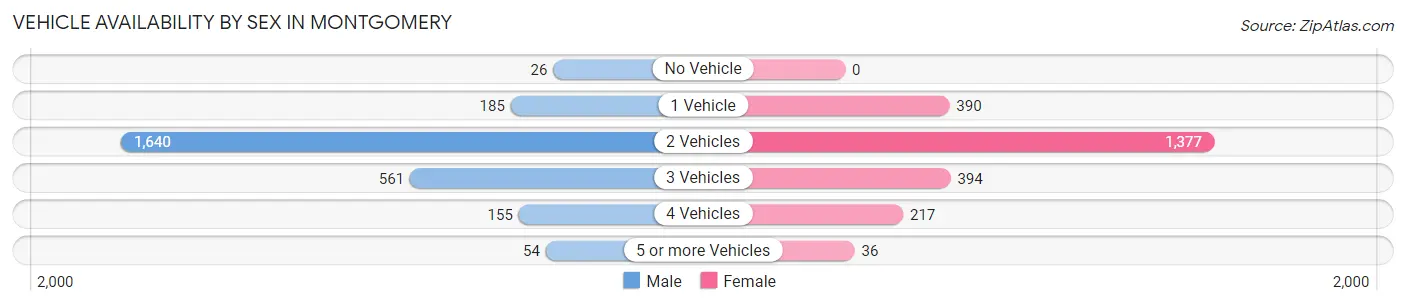
| Vehicles Available | Male | Female |
| No Vehicle | 26 (1.0%) | 0 (0.0%) |
| 1 Vehicle | 185 (7.1%) | 390 (16.2%) |
| 2 Vehicles | 1,640 (62.6%) | 1,377 (57.0%) |
| 3 Vehicles | 561 (21.4%) | 394 (16.3%) |
| 4 Vehicles | 155 (5.9%) | 217 (9.0%) |
| 5 or more Vehicles | 54 (2.1%) | 36 (1.5%) |
| Total | 2,621 (100.0%) | 2,414 (100.0%) |
Commute Time in Montgomery
The most frequently occuring commute durations in Montgomery are 20 to 24 minutes (823 commuters, 20.2%), 10 to 14 minutes (688 commuters, 16.9%), and 30 to 34 minutes (564 commuters, 13.8%).
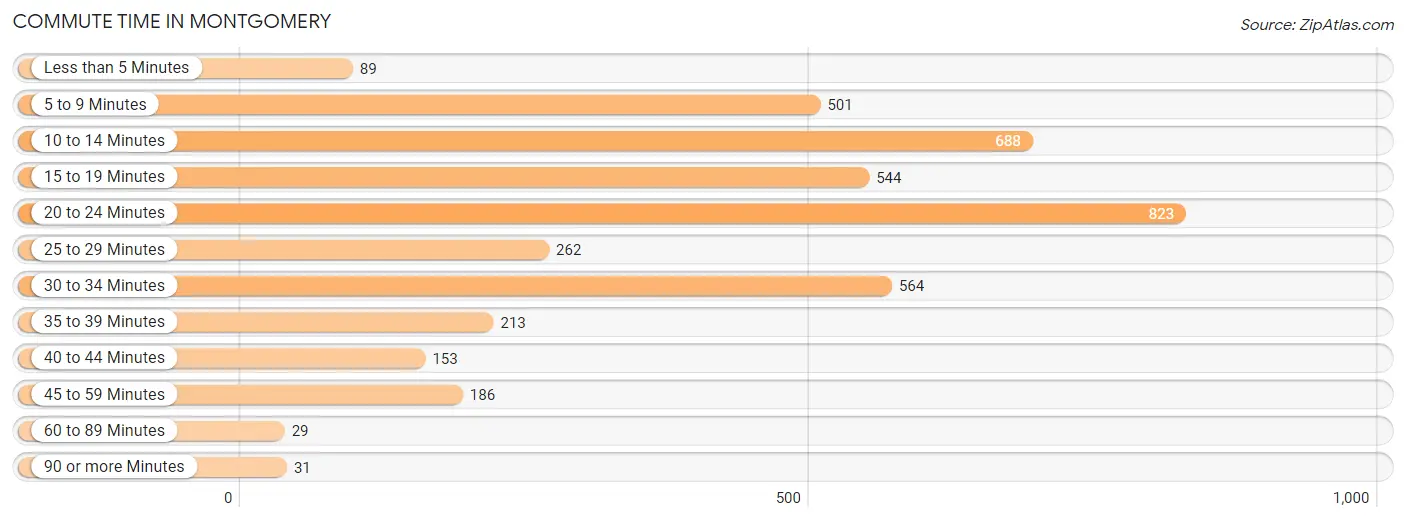
| Commute Time | # Commuters | % Commuters |
| Less than 5 Minutes | 89 | 2.2% |
| 5 to 9 Minutes | 501 | 12.3% |
| 10 to 14 Minutes | 688 | 16.9% |
| 15 to 19 Minutes | 544 | 13.3% |
| 20 to 24 Minutes | 823 | 20.2% |
| 25 to 29 Minutes | 262 | 6.4% |
| 30 to 34 Minutes | 564 | 13.8% |
| 35 to 39 Minutes | 213 | 5.2% |
| 40 to 44 Minutes | 153 | 3.7% |
| 45 to 59 Minutes | 186 | 4.6% |
| 60 to 89 Minutes | 29 | 0.7% |
| 90 or more Minutes | 31 | 0.8% |
Commute Time by Sex in Montgomery
The most common commute times in Montgomery are 20 to 24 minutes (505 commuters, 24.1%) for males and 10 to 14 minutes (434 commuters, 21.9%) for females.
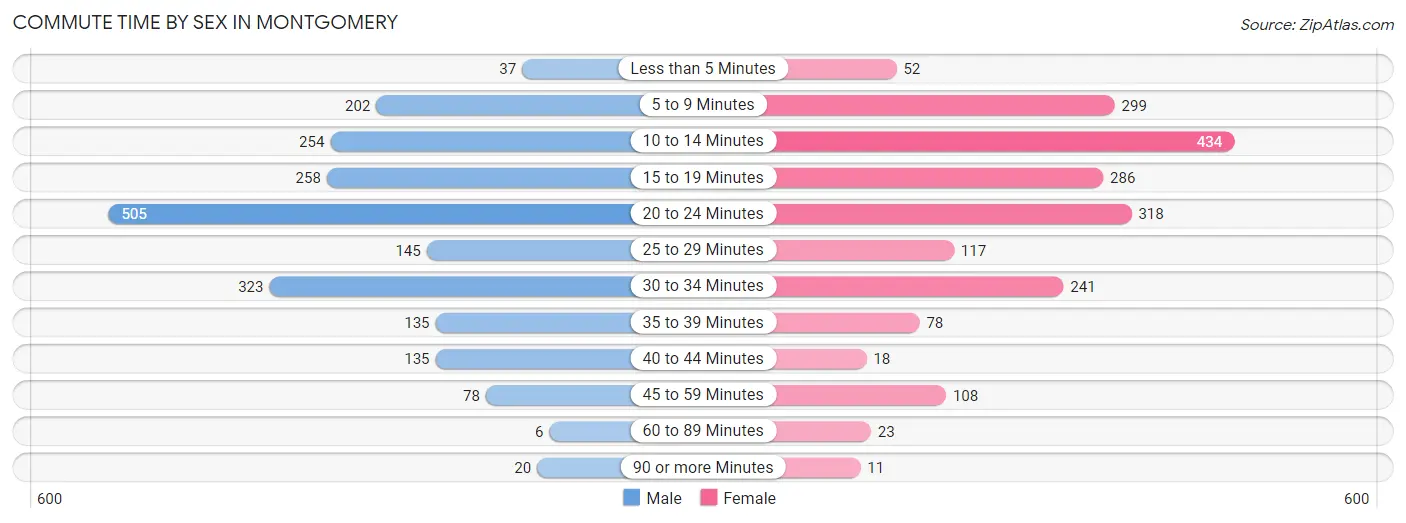
| Commute Time | Male | Female |
| Less than 5 Minutes | 37 (1.8%) | 52 (2.6%) |
| 5 to 9 Minutes | 202 (9.6%) | 299 (15.1%) |
| 10 to 14 Minutes | 254 (12.1%) | 434 (21.9%) |
| 15 to 19 Minutes | 258 (12.3%) | 286 (14.4%) |
| 20 to 24 Minutes | 505 (24.1%) | 318 (16.0%) |
| 25 to 29 Minutes | 145 (6.9%) | 117 (5.9%) |
| 30 to 34 Minutes | 323 (15.4%) | 241 (12.1%) |
| 35 to 39 Minutes | 135 (6.4%) | 78 (3.9%) |
| 40 to 44 Minutes | 135 (6.4%) | 18 (0.9%) |
| 45 to 59 Minutes | 78 (3.7%) | 108 (5.4%) |
| 60 to 89 Minutes | 6 (0.3%) | 23 (1.2%) |
| 90 or more Minutes | 20 (0.9%) | 11 (0.5%) |
Time of Departure to Work by Sex in Montgomery
The most frequent times of departure to work in Montgomery are 7:30 AM to 7:59 AM (381, 18.2%) for males and 8:30 AM to 8:59 AM (393, 19.8%) for females.
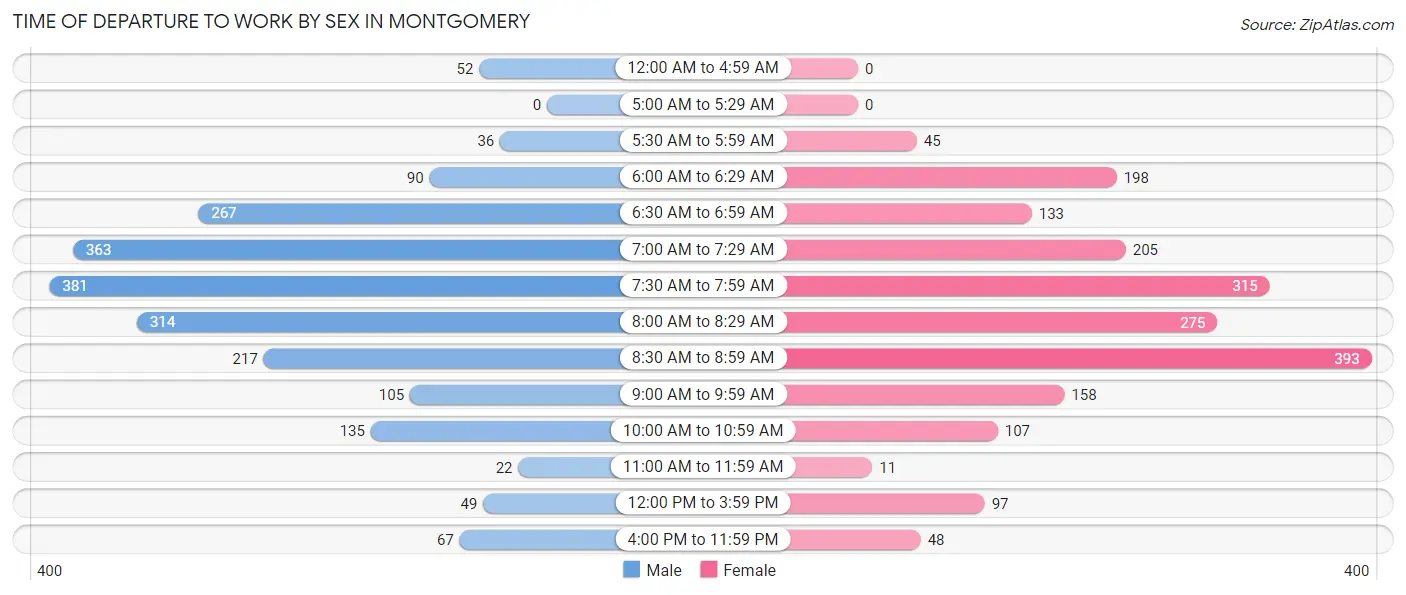
| Time of Departure | Male | Female |
| 12:00 AM to 4:59 AM | 52 (2.5%) | 0 (0.0%) |
| 5:00 AM to 5:29 AM | 0 (0.0%) | 0 (0.0%) |
| 5:30 AM to 5:59 AM | 36 (1.7%) | 45 (2.3%) |
| 6:00 AM to 6:29 AM | 90 (4.3%) | 198 (10.0%) |
| 6:30 AM to 6:59 AM | 267 (12.7%) | 133 (6.7%) |
| 7:00 AM to 7:29 AM | 363 (17.3%) | 205 (10.3%) |
| 7:30 AM to 7:59 AM | 381 (18.2%) | 315 (15.9%) |
| 8:00 AM to 8:29 AM | 314 (15.0%) | 275 (13.9%) |
| 8:30 AM to 8:59 AM | 217 (10.3%) | 393 (19.8%) |
| 9:00 AM to 9:59 AM | 105 (5.0%) | 158 (8.0%) |
| 10:00 AM to 10:59 AM | 135 (6.4%) | 107 (5.4%) |
| 11:00 AM to 11:59 AM | 22 (1.1%) | 11 (0.5%) |
| 12:00 PM to 3:59 PM | 49 (2.3%) | 97 (4.9%) |
| 4:00 PM to 11:59 PM | 67 (3.2%) | 48 (2.4%) |
| Total | 2,098 (100.0%) | 1,985 (100.0%) |
Housing Occupancy in Montgomery
Occupancy by Ownership in Montgomery
Of the total 4,029 dwellings in Montgomery, owner-occupied units account for 3,596 (89.2%), while renter-occupied units make up 433 (10.7%).
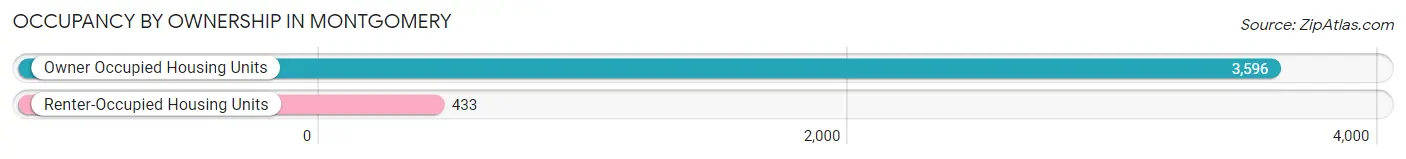
| Occupancy | # Housing Units | % Housing Units |
| Owner Occupied Housing Units | 3,596 | 89.2% |
| Renter-Occupied Housing Units | 433 | 10.7% |
| Total Occupied Housing Units | 4,029 | 100.0% |
Occupancy by Household Size in Montgomery
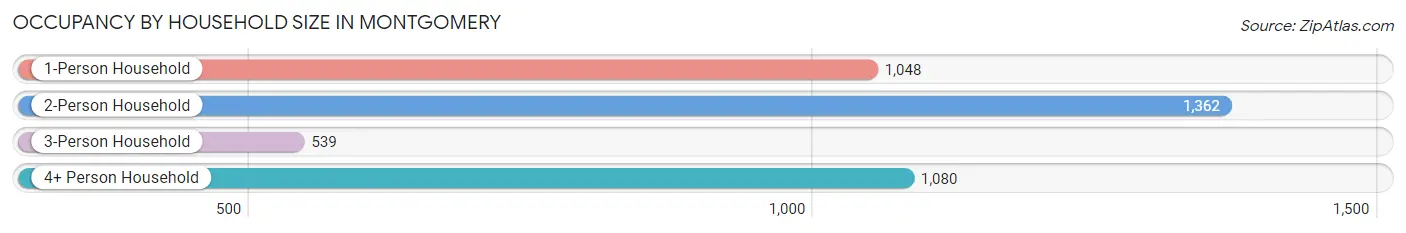
| Household Size | # Housing Units | % Housing Units |
| 1-Person Household | 1,048 | 26.0% |
| 2-Person Household | 1,362 | 33.8% |
| 3-Person Household | 539 | 13.4% |
| 4+ Person Household | 1,080 | 26.8% |
| Total Housing Units | 4,029 | 100.0% |
Occupancy by Ownership by Household Size in Montgomery
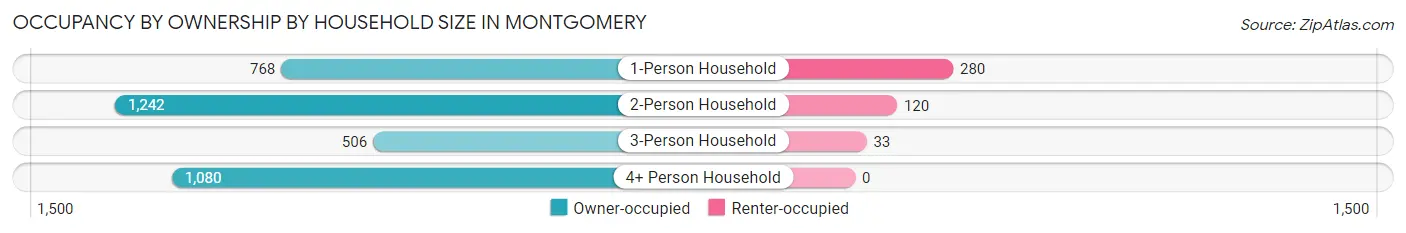
| Household Size | Owner-occupied | Renter-occupied |
| 1-Person Household | 768 (73.3%) | 280 (26.7%) |
| 2-Person Household | 1,242 (91.2%) | 120 (8.8%) |
| 3-Person Household | 506 (93.9%) | 33 (6.1%) |
| 4+ Person Household | 1,080 (100.0%) | 0 (0.0%) |
| Total Housing Units | 3,596 (89.2%) | 433 (10.7%) |
Occupancy by Educational Attainment in Montgomery
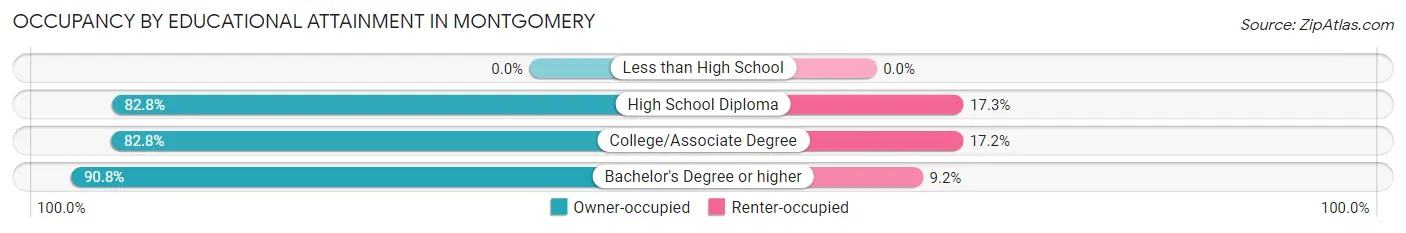
| Household Size | Owner-occupied | Renter-occupied |
| Less than High School | 0 (0.0%) | 0 (0.0%) |
| High School Diploma | 283 (82.8%) | 59 (17.2%) |
| College/Associate Degree | 362 (82.8%) | 75 (17.2%) |
| Bachelor's Degree or higher | 2,951 (90.8%) | 299 (9.2%) |
Occupancy by Age of Householder in Montgomery
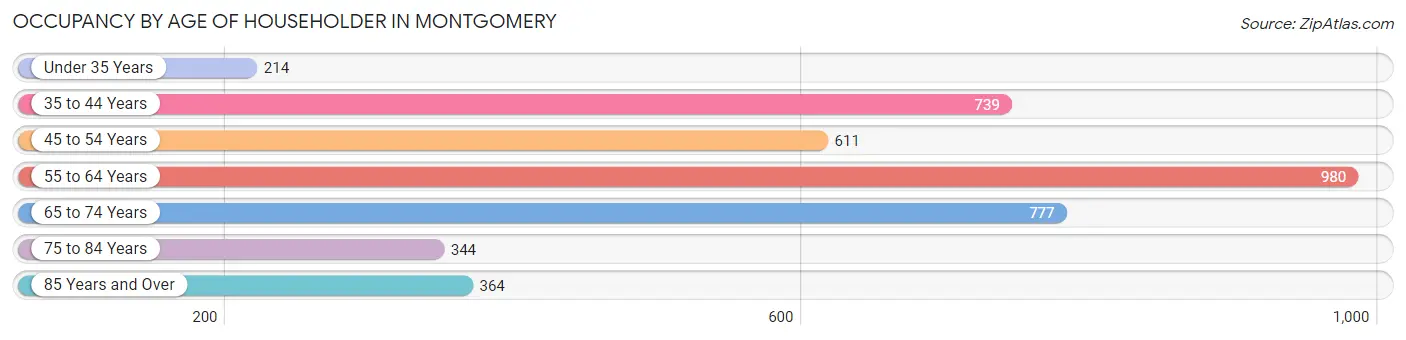
| Age Bracket | # Households | % Households |
| Under 35 Years | 214 | 5.3% |
| 35 to 44 Years | 739 | 18.3% |
| 45 to 54 Years | 611 | 15.2% |
| 55 to 64 Years | 980 | 24.3% |
| 65 to 74 Years | 777 | 19.3% |
| 75 to 84 Years | 344 | 8.5% |
| 85 Years and Over | 364 | 9.0% |
| Total | 4,029 | 100.0% |
Housing Finances in Montgomery
Median Income by Occupancy in Montgomery
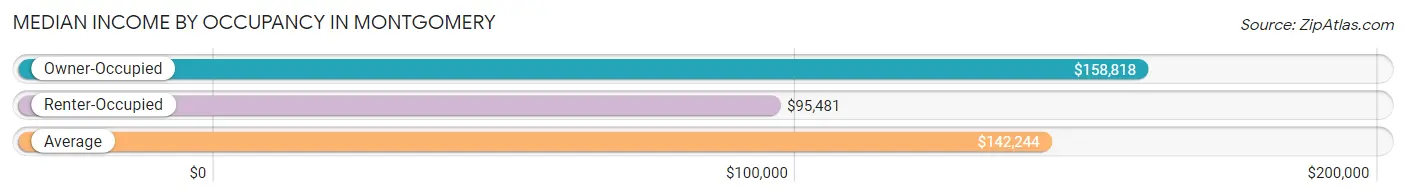
| Occupancy Type | # Households | Median Income |
| Owner-Occupied | 3,596 (89.2%) | $158,818 |
| Renter-Occupied | 433 (10.7%) | $95,481 |
| Average | 4,029 (100.0%) | $142,244 |
Occupancy by Householder Income Bracket in Montgomery
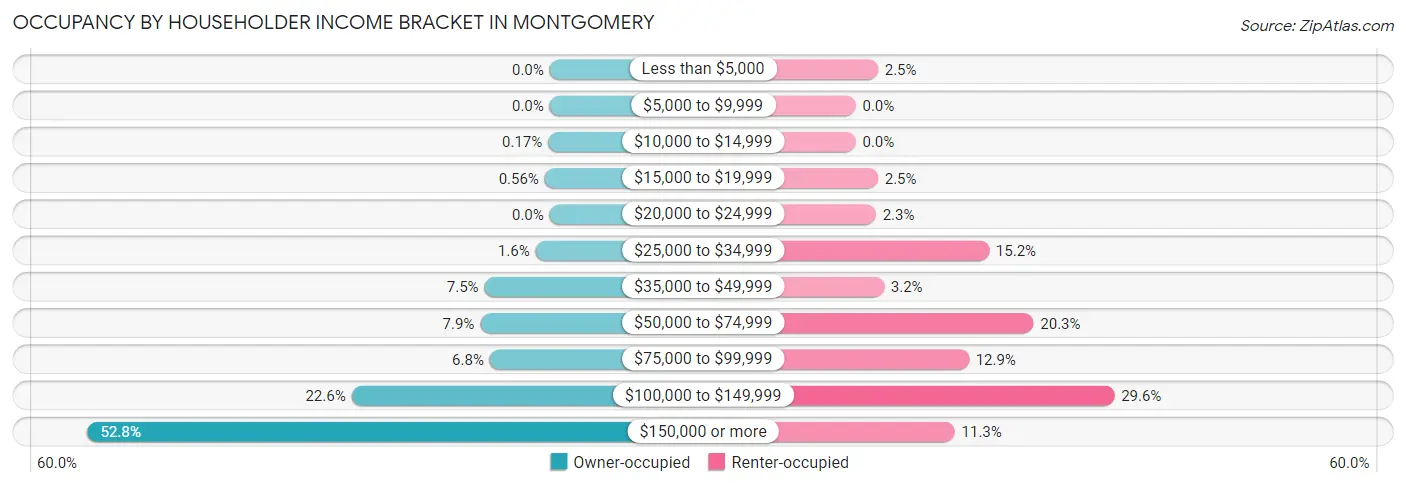
| Income Bracket | Owner-occupied | Renter-occupied |
| Less than $5,000 | 0 (0.0%) | 11 (2.5%) |
| $5,000 to $9,999 | 0 (0.0%) | 0 (0.0%) |
| $10,000 to $14,999 | 6 (0.2%) | 0 (0.0%) |
| $15,000 to $19,999 | 20 (0.6%) | 11 (2.5%) |
| $20,000 to $24,999 | 0 (0.0%) | 10 (2.3%) |
| $25,000 to $34,999 | 58 (1.6%) | 66 (15.2%) |
| $35,000 to $49,999 | 268 (7.4%) | 14 (3.2%) |
| $50,000 to $74,999 | 285 (7.9%) | 88 (20.3%) |
| $75,000 to $99,999 | 246 (6.8%) | 56 (12.9%) |
| $100,000 to $149,999 | 814 (22.6%) | 128 (29.6%) |
| $150,000 or more | 1,899 (52.8%) | 49 (11.3%) |
| Total | 3,596 (100.0%) | 433 (100.0%) |
Monthly Housing Cost Tiers in Montgomery
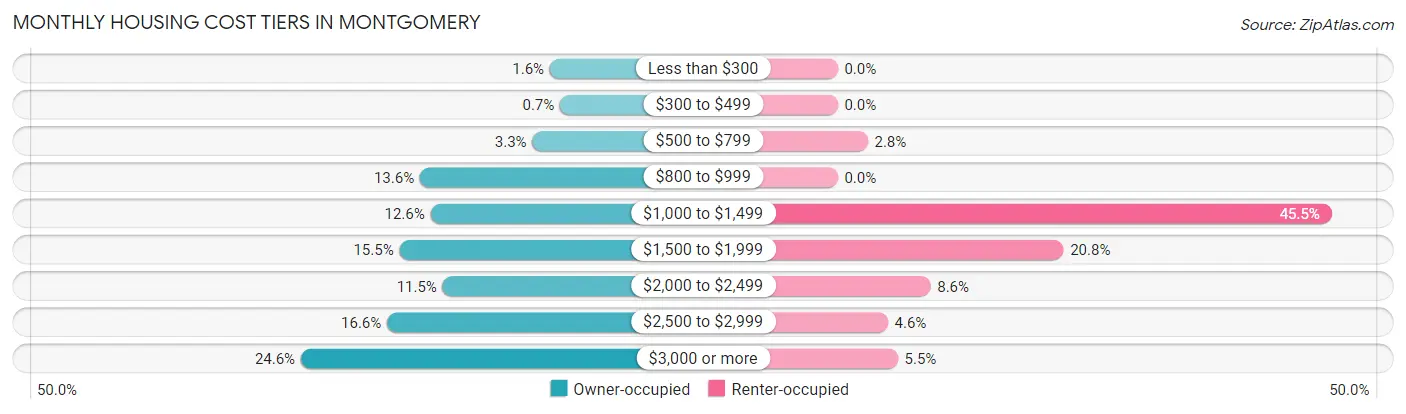
| Monthly Cost | Owner-occupied | Renter-occupied |
| Less than $300 | 59 (1.6%) | 0 (0.0%) |
| $300 to $499 | 25 (0.7%) | 0 (0.0%) |
| $500 to $799 | 117 (3.3%) | 12 (2.8%) |
| $800 to $999 | 489 (13.6%) | 0 (0.0%) |
| $1,000 to $1,499 | 454 (12.6%) | 197 (45.5%) |
| $1,500 to $1,999 | 557 (15.5%) | 90 (20.8%) |
| $2,000 to $2,499 | 414 (11.5%) | 37 (8.6%) |
| $2,500 to $2,999 | 598 (16.6%) | 20 (4.6%) |
| $3,000 or more | 883 (24.6%) | 24 (5.5%) |
| Total | 3,596 (100.0%) | 433 (100.0%) |
Physical Housing Characteristics in Montgomery
Housing Structures in Montgomery
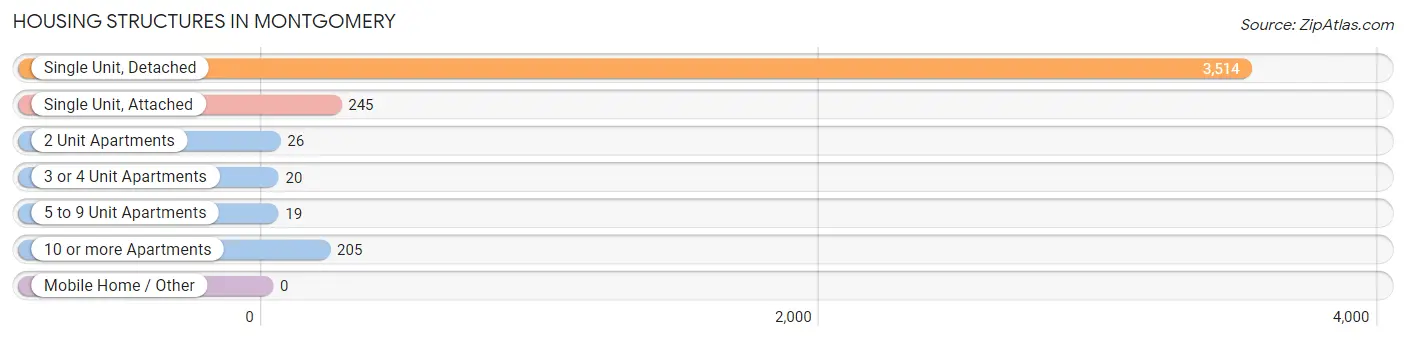
| Structure Type | # Housing Units | % Housing Units |
| Single Unit, Detached | 3,514 | 87.2% |
| Single Unit, Attached | 245 | 6.1% |
| 2 Unit Apartments | 26 | 0.6% |
| 3 or 4 Unit Apartments | 20 | 0.5% |
| 5 to 9 Unit Apartments | 19 | 0.5% |
| 10 or more Apartments | 205 | 5.1% |
| Mobile Home / Other | 0 | 0.0% |
| Total | 4,029 | 100.0% |
Housing Structures by Occupancy in Montgomery
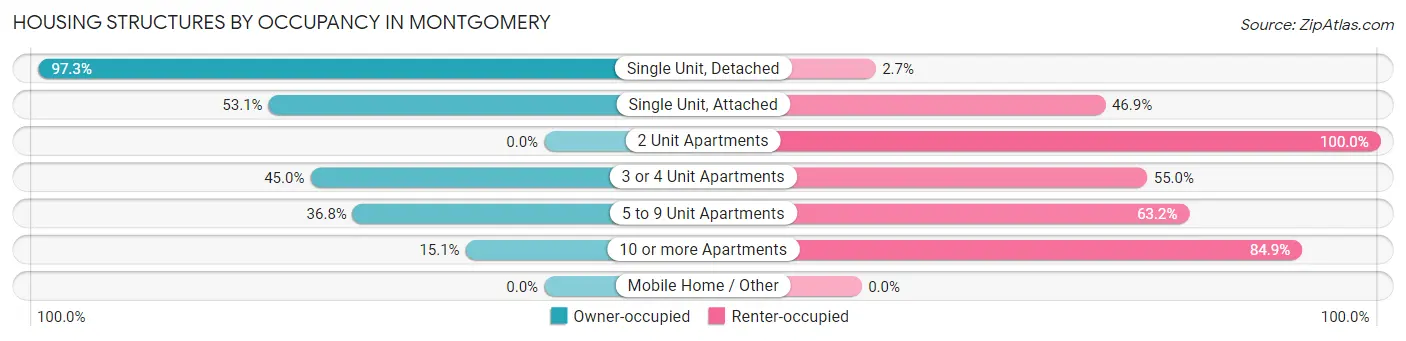
| Structure Type | Owner-occupied | Renter-occupied |
| Single Unit, Detached | 3,419 (97.3%) | 95 (2.7%) |
| Single Unit, Attached | 130 (53.1%) | 115 (46.9%) |
| 2 Unit Apartments | 0 (0.0%) | 26 (100.0%) |
| 3 or 4 Unit Apartments | 9 (45.0%) | 11 (55.0%) |
| 5 to 9 Unit Apartments | 7 (36.8%) | 12 (63.2%) |
| 10 or more Apartments | 31 (15.1%) | 174 (84.9%) |
| Mobile Home / Other | 0 (0.0%) | 0 (0.0%) |
| Total | 3,596 (89.2%) | 433 (10.7%) |
Housing Structures by Number of Rooms in Montgomery
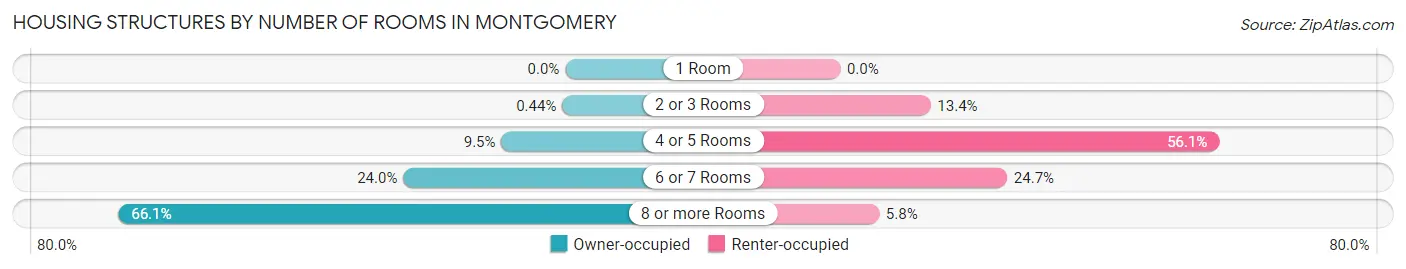
| Number of Rooms | Owner-occupied | Renter-occupied |
| 1 Room | 0 (0.0%) | 0 (0.0%) |
| 2 or 3 Rooms | 16 (0.4%) | 58 (13.4%) |
| 4 or 5 Rooms | 340 (9.5%) | 243 (56.1%) |
| 6 or 7 Rooms | 862 (24.0%) | 107 (24.7%) |
| 8 or more Rooms | 2,378 (66.1%) | 25 (5.8%) |
| Total | 3,596 (100.0%) | 433 (100.0%) |
Housing Structure by Heating Type in Montgomery
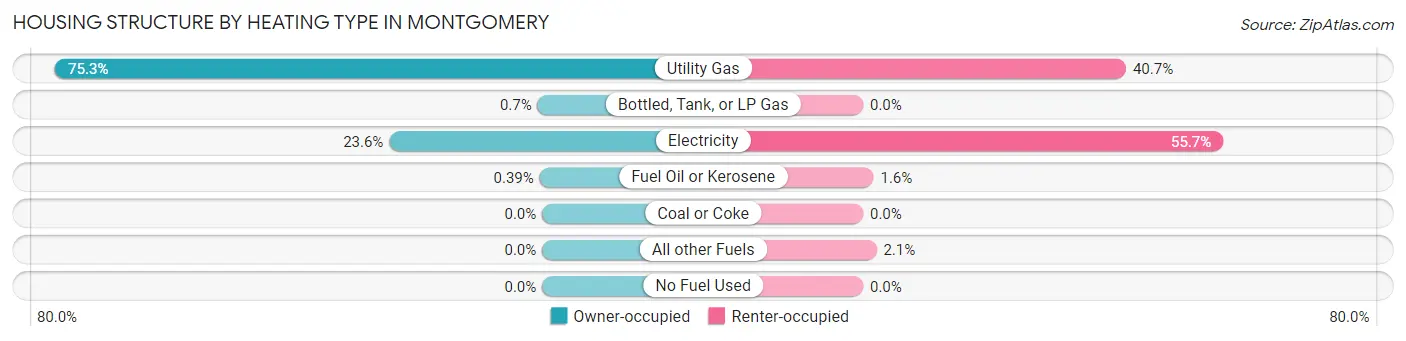
| Heating Type | Owner-occupied | Renter-occupied |
| Utility Gas | 2,707 (75.3%) | 176 (40.6%) |
| Bottled, Tank, or LP Gas | 25 (0.7%) | 0 (0.0%) |
| Electricity | 850 (23.6%) | 241 (55.7%) |
| Fuel Oil or Kerosene | 14 (0.4%) | 7 (1.6%) |
| Coal or Coke | 0 (0.0%) | 0 (0.0%) |
| All other Fuels | 0 (0.0%) | 9 (2.1%) |
| No Fuel Used | 0 (0.0%) | 0 (0.0%) |
| Total | 3,596 (100.0%) | 433 (100.0%) |
Household Vehicle Usage in Montgomery
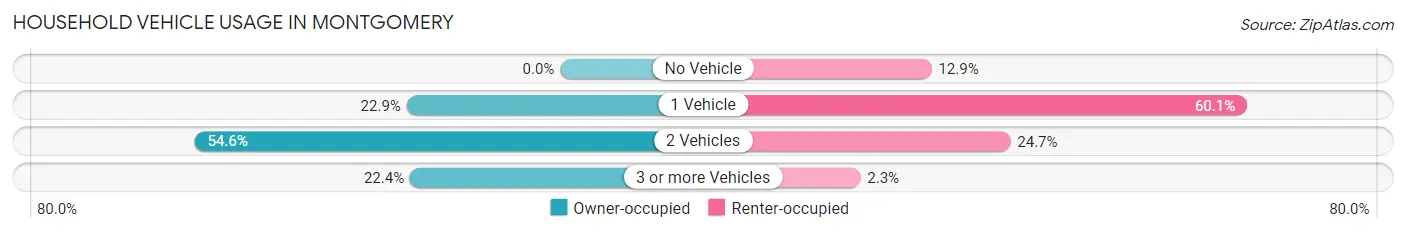
| Vehicles per Household | Owner-occupied | Renter-occupied |
| No Vehicle | 0 (0.0%) | 56 (12.9%) |
| 1 Vehicle | 825 (22.9%) | 260 (60.1%) |
| 2 Vehicles | 1,964 (54.6%) | 107 (24.7%) |
| 3 or more Vehicles | 807 (22.4%) | 10 (2.3%) |
| Total | 3,596 (100.0%) | 433 (100.0%) |
Real Estate & Mortgages in Montgomery
Real Estate and Mortgage Overview in Montgomery
| Characteristic | Without Mortgage | With Mortgage |
| Housing Units | 1,195 | 2,401 |
| Median Property Value | $421,600 | $484,900 |
| Median Household Income | $122,656 | $1,425 |
| Monthly Housing Costs | $989 | $883 |
| Real Estate Taxes | $7,053 | $169 |
Property Value by Mortgage Status in Montgomery
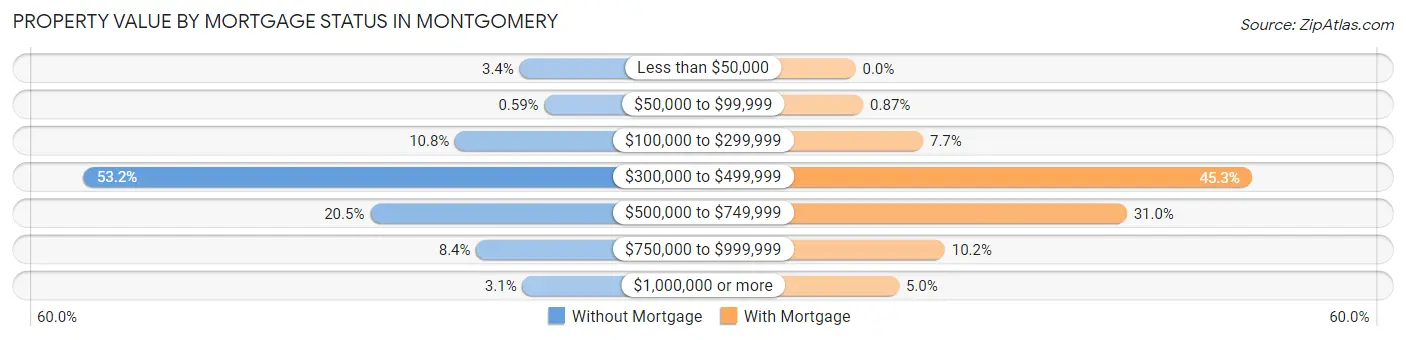
| Property Value | Without Mortgage | With Mortgage |
| Less than $50,000 | 41 (3.4%) | 0 (0.0%) |
| $50,000 to $99,999 | 7 (0.6%) | 21 (0.9%) |
| $100,000 to $299,999 | 129 (10.8%) | 185 (7.7%) |
| $300,000 to $499,999 | 636 (53.2%) | 1,087 (45.3%) |
| $500,000 to $749,999 | 245 (20.5%) | 744 (31.0%) |
| $750,000 to $999,999 | 100 (8.4%) | 245 (10.2%) |
| $1,000,000 or more | 37 (3.1%) | 119 (5.0%) |
| Total | 1,195 (100.0%) | 2,401 (100.0%) |
Household Income by Mortgage Status in Montgomery
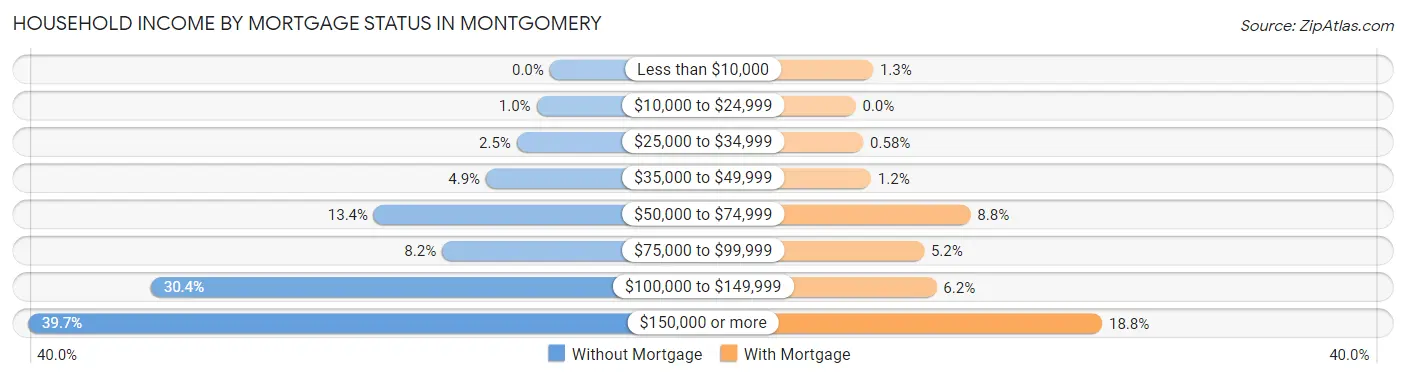
| Household Income | Without Mortgage | With Mortgage |
| Less than $10,000 | 0 (0.0%) | 32 (1.3%) |
| $10,000 to $24,999 | 12 (1.0%) | 0 (0.0%) |
| $25,000 to $34,999 | 30 (2.5%) | 14 (0.6%) |
| $35,000 to $49,999 | 58 (4.9%) | 28 (1.2%) |
| $50,000 to $74,999 | 160 (13.4%) | 210 (8.7%) |
| $75,000 to $99,999 | 98 (8.2%) | 125 (5.2%) |
| $100,000 to $149,999 | 363 (30.4%) | 148 (6.2%) |
| $150,000 or more | 474 (39.7%) | 451 (18.8%) |
| Total | 1,195 (100.0%) | 2,401 (100.0%) |
Property Value to Household Income Ratio in Montgomery
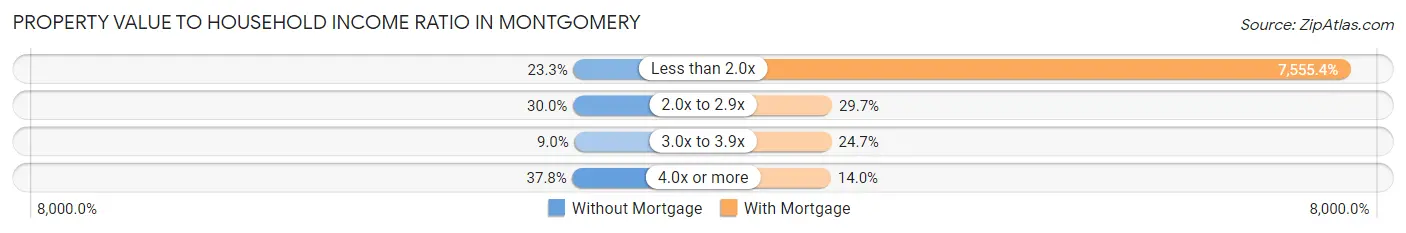
| Value-to-Income Ratio | Without Mortgage | With Mortgage |
| Less than 2.0x | 278 (23.3%) | 181,406 (7,555.4%) |
| 2.0x to 2.9x | 358 (30.0%) | 712 (29.6%) |
| 3.0x to 3.9x | 107 (8.9%) | 593 (24.7%) |
| 4.0x or more | 452 (37.8%) | 337 (14.0%) |
| Total | 1,195 (100.0%) | 2,401 (100.0%) |
Real Estate Taxes by Mortgage Status in Montgomery
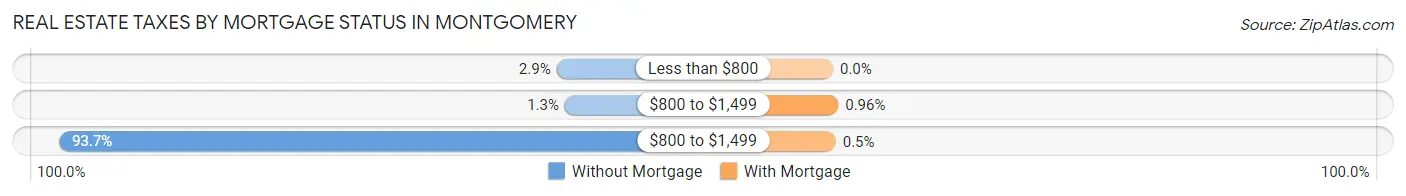
| Property Taxes | Without Mortgage | With Mortgage |
| Less than $800 | 34 (2.9%) | 0 (0.0%) |
| $800 to $1,499 | 16 (1.3%) | 23 (1.0%) |
| $800 to $1,499 | 1,120 (93.7%) | 12 (0.5%) |
| Total | 1,195 (100.0%) | 2,401 (100.0%) |
Health & Disability in Montgomery
Health Insurance Coverage by Age in Montgomery
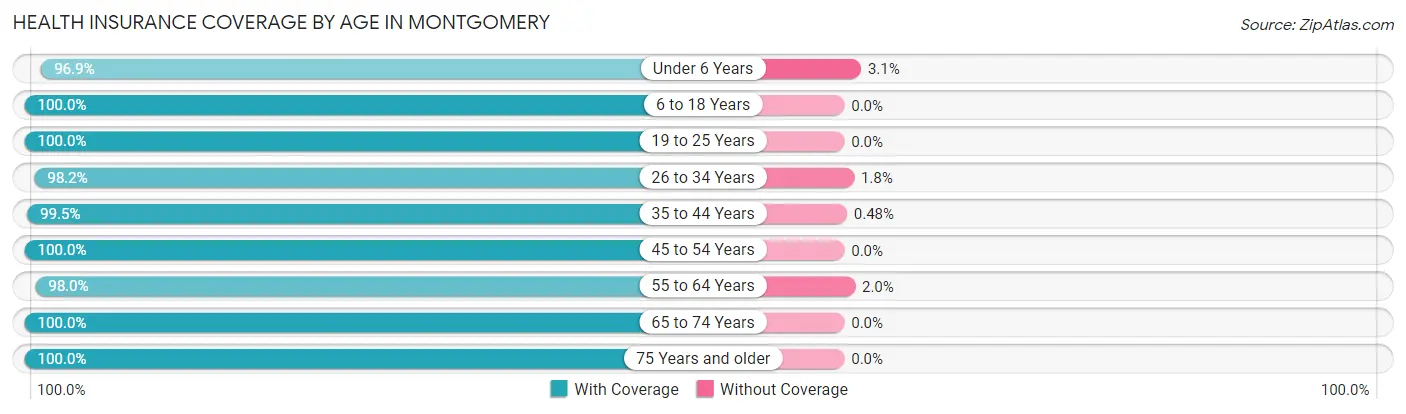
| Age Bracket | With Coverage | Without Coverage |
| Under 6 Years | 967 (96.9%) | 31 (3.1%) |
| 6 to 18 Years | 2,141 (100.0%) | 0 (0.0%) |
| 19 to 25 Years | 290 (100.0%) | 0 (0.0%) |
| 26 to 34 Years | 541 (98.2%) | 10 (1.8%) |
| 35 to 44 Years | 1,449 (99.5%) | 7 (0.5%) |
| 45 to 54 Years | 1,143 (100.0%) | 0 (0.0%) |
| 55 to 64 Years | 1,664 (98.0%) | 34 (2.0%) |
| 65 to 74 Years | 1,303 (100.0%) | 0 (0.0%) |
| 75 Years and older | 951 (100.0%) | 0 (0.0%) |
| Total | 10,449 (99.2%) | 82 (0.8%) |
Health Insurance Coverage by Citizenship Status in Montgomery
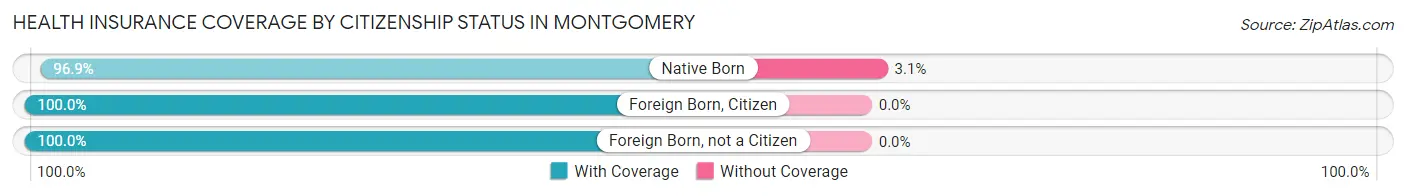
| Citizenship Status | With Coverage | Without Coverage |
| Native Born | 967 (96.9%) | 31 (3.1%) |
| Foreign Born, Citizen | 2,141 (100.0%) | 0 (0.0%) |
| Foreign Born, not a Citizen | 290 (100.0%) | 0 (0.0%) |
Health Insurance Coverage by Household Income in Montgomery
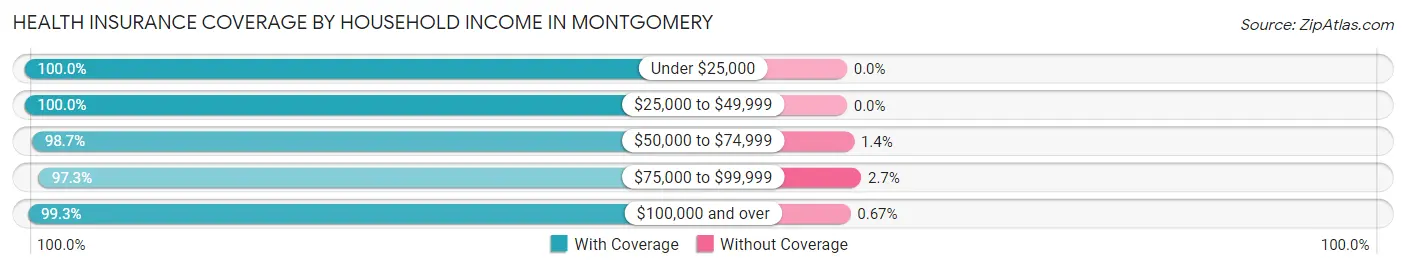
| Household Income | With Coverage | Without Coverage |
| Under $25,000 | 94 (100.0%) | 0 (0.0%) |
| $25,000 to $49,999 | 495 (100.0%) | 0 (0.0%) |
| $50,000 to $74,999 | 656 (98.7%) | 9 (1.3%) |
| $75,000 to $99,999 | 546 (97.3%) | 15 (2.7%) |
| $100,000 and over | 8,651 (99.3%) | 58 (0.7%) |
Public vs Private Health Insurance Coverage by Age in Montgomery
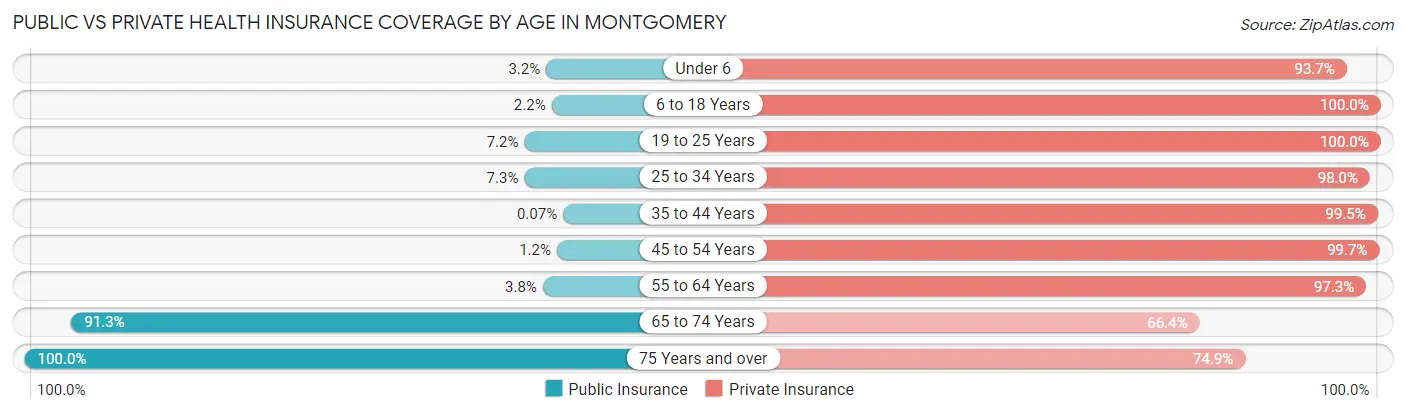
| Age Bracket | Public Insurance | Private Insurance |
| Under 6 | 32 (3.2%) | 935 (93.7%) |
| 6 to 18 Years | 47 (2.2%) | 2,141 (100.0%) |
| 19 to 25 Years | 21 (7.2%) | 290 (100.0%) |
| 25 to 34 Years | 40 (7.3%) | 540 (98.0%) |
| 35 to 44 Years | 1 (0.1%) | 1,448 (99.5%) |
| 45 to 54 Years | 14 (1.2%) | 1,140 (99.7%) |
| 55 to 64 Years | 65 (3.8%) | 1,652 (97.3%) |
| 65 to 74 Years | 1,190 (91.3%) | 865 (66.4%) |
| 75 Years and over | 951 (100.0%) | 712 (74.9%) |
| Total | 2,361 (22.4%) | 9,723 (92.3%) |
Disability Status by Sex by Age in Montgomery
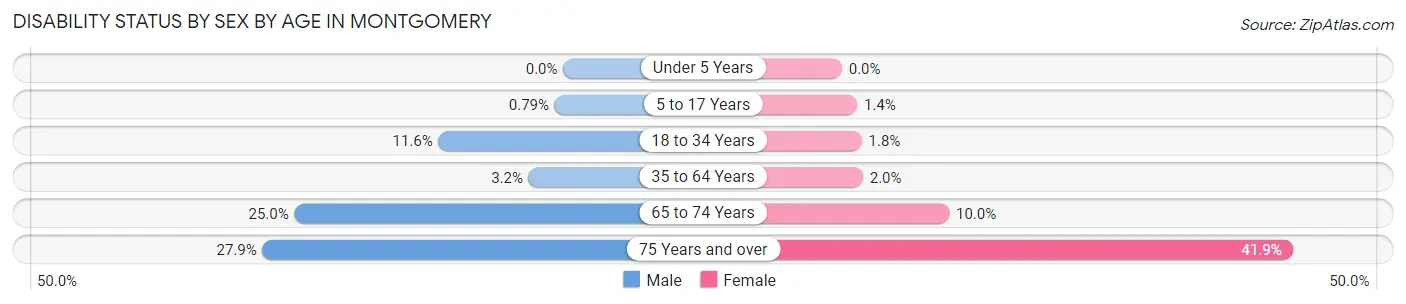
| Age Bracket | Male | Female |
| Under 5 Years | 0 (0.0%) | 0 (0.0%) |
| 5 to 17 Years | 9 (0.8%) | 14 (1.4%) |
| 18 to 34 Years | 63 (11.6%) | 9 (1.8%) |
| 35 to 64 Years | 67 (3.2%) | 43 (1.9%) |
| 65 to 74 Years | 137 (24.9%) | 75 (10.0%) |
| 75 Years and over | 129 (27.9%) | 205 (41.9%) |
Disability Class by Sex by Age in Montgomery
Disability Class: Hearing Difficulty
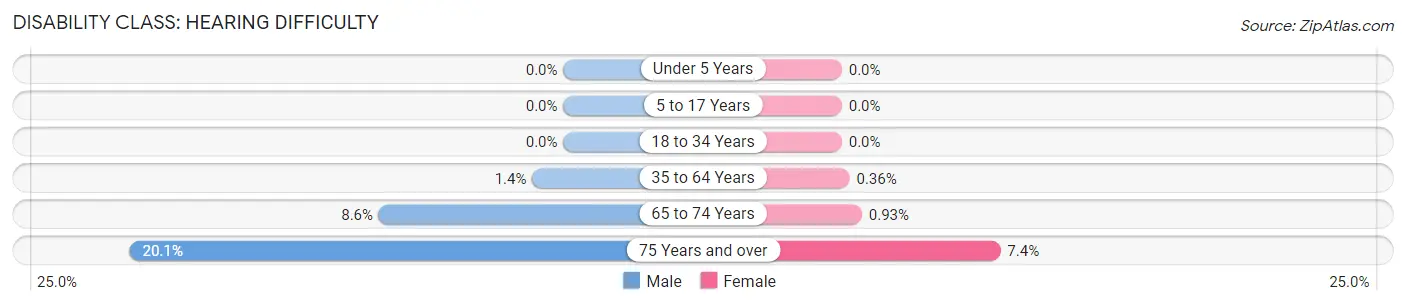
| Age Bracket | Male | Female |
| Under 5 Years | 0 (0.0%) | 0 (0.0%) |
| 5 to 17 Years | 0 (0.0%) | 0 (0.0%) |
| 18 to 34 Years | 0 (0.0%) | 0 (0.0%) |
| 35 to 64 Years | 30 (1.4%) | 8 (0.4%) |
| 65 to 74 Years | 47 (8.6%) | 7 (0.9%) |
| 75 Years and over | 93 (20.1%) | 36 (7.4%) |
Disability Class: Vision Difficulty
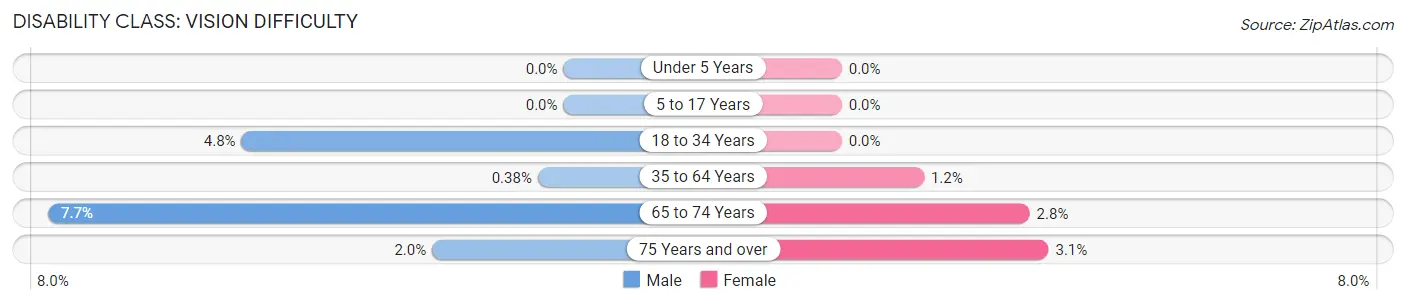
| Age Bracket | Male | Female |
| Under 5 Years | 0 (0.0%) | 0 (0.0%) |
| 5 to 17 Years | 0 (0.0%) | 0 (0.0%) |
| 18 to 34 Years | 26 (4.8%) | 0 (0.0%) |
| 35 to 64 Years | 8 (0.4%) | 27 (1.2%) |
| 65 to 74 Years | 42 (7.6%) | 21 (2.8%) |
| 75 Years and over | 9 (1.9%) | 15 (3.1%) |
Disability Class: Cognitive Difficulty
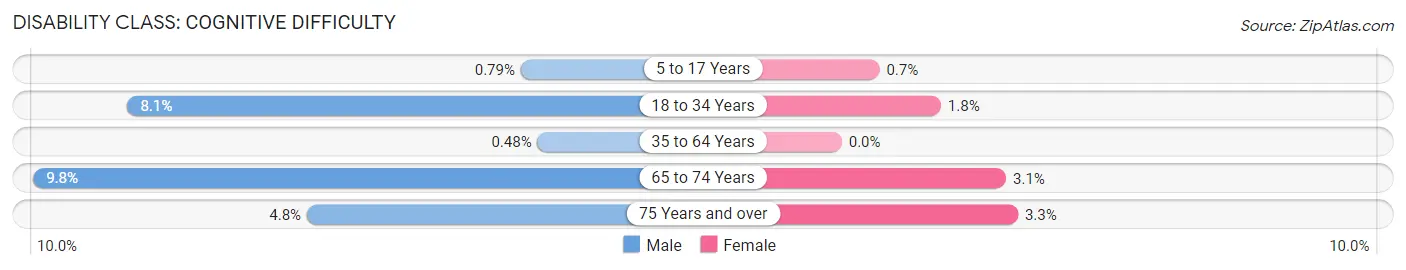
| Age Bracket | Male | Female |
| 5 to 17 Years | 9 (0.8%) | 7 (0.7%) |
| 18 to 34 Years | 44 (8.1%) | 9 (1.8%) |
| 35 to 64 Years | 10 (0.5%) | 0 (0.0%) |
| 65 to 74 Years | 54 (9.8%) | 23 (3.0%) |
| 75 Years and over | 22 (4.8%) | 16 (3.3%) |
Disability Class: Ambulatory Difficulty
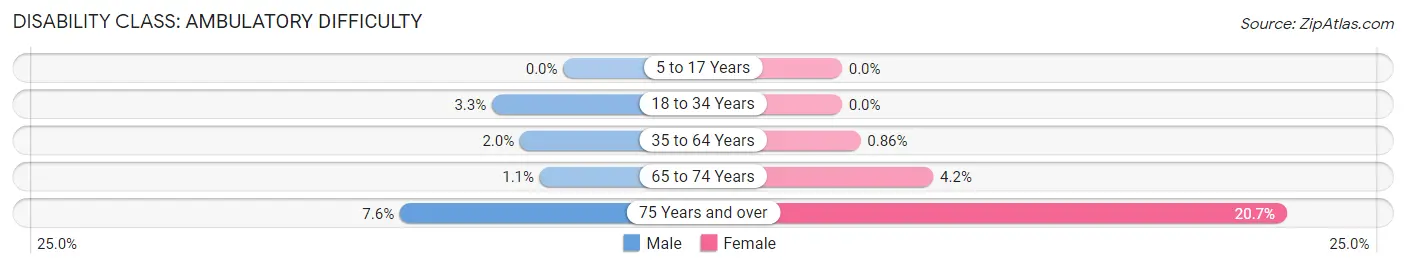
| Age Bracket | Male | Female |
| 5 to 17 Years | 0 (0.0%) | 0 (0.0%) |
| 18 to 34 Years | 18 (3.3%) | 0 (0.0%) |
| 35 to 64 Years | 42 (2.0%) | 19 (0.9%) |
| 65 to 74 Years | 6 (1.1%) | 32 (4.2%) |
| 75 Years and over | 35 (7.6%) | 101 (20.6%) |
Disability Class: Self-Care Difficulty
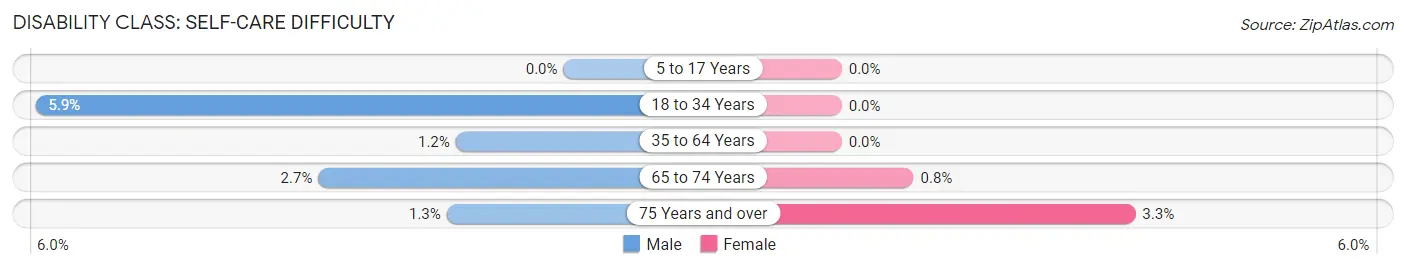
| Age Bracket | Male | Female |
| 5 to 17 Years | 0 (0.0%) | 0 (0.0%) |
| 18 to 34 Years | 32 (5.9%) | 0 (0.0%) |
| 35 to 64 Years | 25 (1.2%) | 0 (0.0%) |
| 65 to 74 Years | 15 (2.7%) | 6 (0.8%) |
| 75 Years and over | 6 (1.3%) | 16 (3.3%) |
Technology Access in Montgomery
Computing Device Access in Montgomery
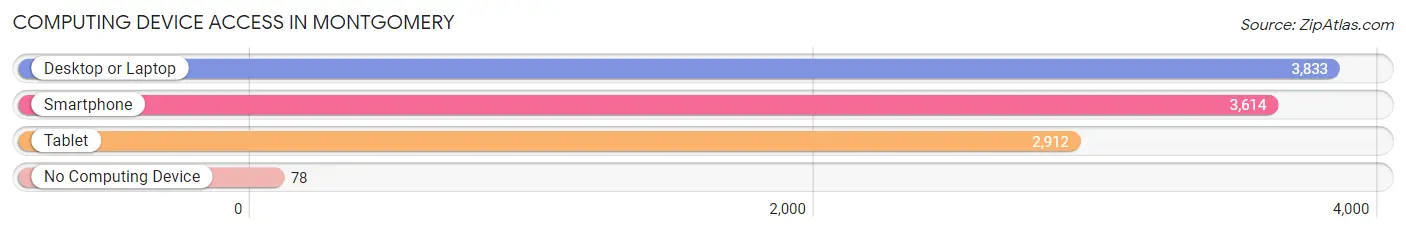
| Device Type | # Households | % Households |
| Desktop or Laptop | 3,833 | 95.1% |
| Smartphone | 3,614 | 89.7% |
| Tablet | 2,912 | 72.3% |
| No Computing Device | 78 | 1.9% |
| Total | 4,029 | 100.0% |
Internet Access in Montgomery
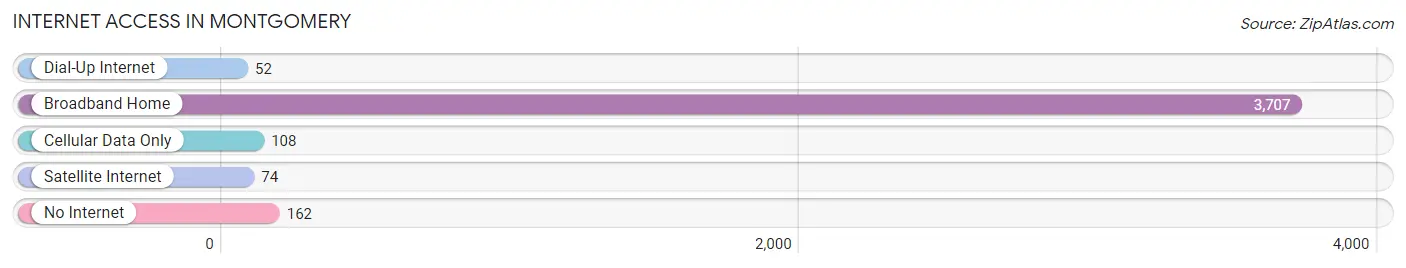
| Internet Type | # Households | % Households |
| Dial-Up Internet | 52 | 1.3% |
| Broadband Home | 3,707 | 92.0% |
| Cellular Data Only | 108 | 2.7% |
| Satellite Internet | 74 | 1.8% |
| No Internet | 162 | 4.0% |
| Total | 4,029 | 100.0% |
Montgomery Summary
Montgomery, Ohio is a small city located in Hamilton County, Ohio. It is situated on the banks of the Great Miami River and is part of the Cincinnati metropolitan area. The city has a population of 10,811 as of the 2010 census.
History
Montgomery was founded in 1796 by William Montgomery, a Revolutionary War veteran. The city was originally known as Montgomery Station, and was the first settlement in Hamilton County. The city was incorporated in 1803 and was named after William Montgomery.
In the early 19th century, Montgomery was a small farming community. The city was home to a number of mills, including a grist mill, a saw mill, and a woolen mill. The city also had a number of stores and taverns.
In the late 19th century, Montgomery began to grow and develop. The city was home to a number of factories, including a paper mill, a furniture factory, and a cigar factory. The city also had a number of churches, schools, and other businesses.
In the early 20th century, Montgomery continued to grow and develop. The city was home to a number of businesses, including a brewery, a canning factory, and a number of other factories. The city also had a number of churches, schools, and other businesses.
Geography
Montgomery is located in Hamilton County, Ohio. The city is situated on the banks of the Great Miami River. The city has a total area of 4.2 square miles, all of which is land.
The city is located in the Cincinnati metropolitan area. The city is located near the cities of Cincinnati, Dayton, and Columbus.
Economy
Montgomery has a diverse economy. The city is home to a number of businesses, including manufacturing, retail, and healthcare. The city is also home to a number of government offices, including the Hamilton County Courthouse.
The city is home to a number of manufacturing companies, including a paper mill, a furniture factory, and a cigar factory. The city is also home to a number of retail stores, including a grocery store, a hardware store, and a number of other stores.
The city is also home to a number of healthcare facilities, including a hospital, a nursing home, and a number of other healthcare facilities.
Demographics
As of the 2010 census, Montgomery had a population of 10,811. The city has a population density of 2,567 people per square mile. The city has a median age of 38.7 years.
The city is predominantly white, with a population that is 88.3% white, 5.3% African American, 2.2% Asian, and 1.2% Hispanic or Latino. The city also has a small population of Native Americans, at 0.2%.
The city has a median household income of $50,945. The city also has a poverty rate of 8.3%. The city has a high school graduation rate of 92.3%.
Common Questions
What is Per Capita Income in Montgomery?
Per Capita income in Montgomery is $73,904.
What is the Median Family Income in Montgomery?
Median Family Income in Montgomery is $178,438.
What is the Median Household income in Montgomery?
Median Household Income in Montgomery is $142,244.
What is Income or Wage Gap in Montgomery?
Income or Wage Gap in Montgomery is 44.3%.
Women in Montgomery earn 55.7 cents for every dollar earned by a man.
What is Inequality or Gini Index in Montgomery?
Inequality or Gini Index in Montgomery is 0.43.
What is the Total Population of Montgomery?
Total Population of Montgomery is 10,816.
What is the Total Male Population of Montgomery?
Total Male Population of Montgomery is 5,331.
What is the Total Female Population of Montgomery?
Total Female Population of Montgomery is 5,485.
What is the Ratio of Males per 100 Females in Montgomery?
There are 97.19 Males per 100 Females in Montgomery.
What is the Ratio of Females per 100 Males in Montgomery?
There are 102.89 Females per 100 Males in Montgomery.
What is the Median Population Age in Montgomery?
Median Population Age in Montgomery is 44.8 Years.
What is the Average Family Size in Montgomery
Average Family Size in Montgomery is 3.2 People.
What is the Average Household Size in Montgomery
Average Household Size in Montgomery is 2.6 People.
How Large is the Labor Force in Montgomery?
There are 5,204 People in the Labor Forcein in Montgomery.
What is the Percentage of People in the Labor Force in Montgomery?
64.4% of People are in the Labor Force in Montgomery.
What is the Unemployment Rate in Montgomery?
Unemployment Rate in Montgomery is 2.4%.