Gambier, OH Map & Demographics
Gambier Map
Gambier Overview
$16,002
PER CAPITA INCOME
$88,750
AVG FAMILY INCOME
$90,625
AVG HOUSEHOLD INCOME
25.9%
WAGE / INCOME GAP [ % ]
74.1¢/ $1
WAGE / INCOME GAP [ $ ]
0.43
INEQUALITY / GINI INDEX
2,000
TOTAL POPULATION
868
MALE POPULATION
1,132
FEMALE POPULATION
76.68
MALES / 100 FEMALES
130.41
FEMALES / 100 MALES
20.4
MEDIAN AGE
2.6
AVG FAMILY SIZE
2.0
AVG HOUSEHOLD SIZE
936
LABOR FORCE [ PEOPLE ]
47.7%
PERCENT IN LABOR FORCE
3.7%
UNEMPLOYMENT RATE
Gambier Zip Codes
Gambier Area Codes
Income in Gambier
Income Overview in Gambier
Per Capita Income in Gambier is $16,002, while median incomes of families and households are $88,750 and $90,625 respectively.
| Characteristic | Number | Measure |
| Per Capita Income | 2,000 | $16,002 |
| Median Family Income | 108 | $88,750 |
| Mean Family Income | 108 | $118,577 |
| Median Household Income | 215 | $90,625 |
| Mean Household Income | 215 | $107,288 |
| Income Deficit | 108 | $0 |
| Wage / Income Gap (%) | 2,000 | 25.93% |
| Wage / Income Gap ($) | 2,000 | 74.07¢ per $1 |
| Gini / Inequality Index | 2,000 | 0.43 |
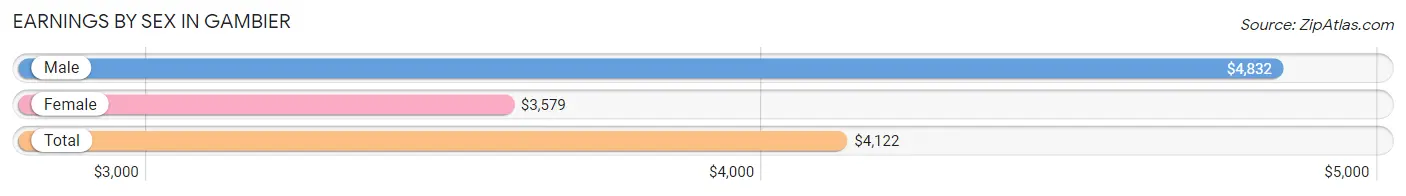
Earnings by Sex in Gambier
Average Earnings in Gambier are $4,122, $4,832 for men and $3,579 for women, a difference of 25.9%.
| Sex | Number | Average Earnings |
| Male | 660 (42.7%) | $4,832 |
| Female | 884 (57.3%) | $3,579 |
| Total | 1,544 (100.0%) | $4,122 |
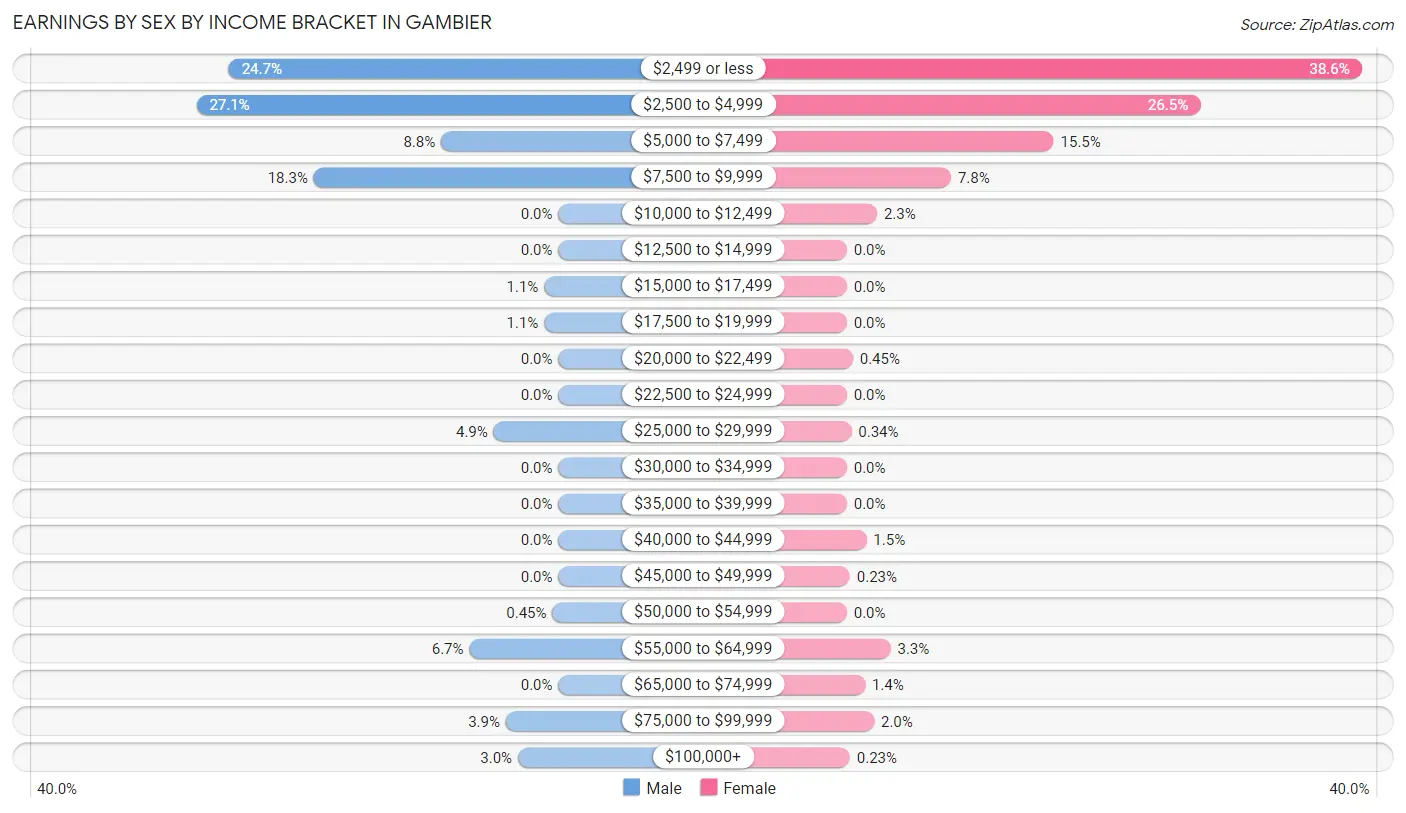
Earnings by Sex by Income Bracket in Gambier
The most common earnings brackets in Gambier are $2,500 to $4,999 for men (179 | 27.1%) and $2,499 or less for women (341 | 38.6%).
| Income | Male | Female |
| $2,499 or less | 163 (24.7%) | 341 (38.6%) |
| $2,500 to $4,999 | 179 (27.1%) | 234 (26.5%) |
| $5,000 to $7,499 | 58 (8.8%) | 137 (15.5%) |
| $7,500 to $9,999 | 121 (18.3%) | 69 (7.8%) |
| $10,000 to $12,499 | 0 (0.0%) | 20 (2.3%) |
| $12,500 to $14,999 | 0 (0.0%) | 0 (0.0%) |
| $15,000 to $17,499 | 7 (1.1%) | 0 (0.0%) |
| $17,500 to $19,999 | 7 (1.1%) | 0 (0.0%) |
| $20,000 to $22,499 | 0 (0.0%) | 4 (0.4%) |
| $22,500 to $24,999 | 0 (0.0%) | 0 (0.0%) |
| $25,000 to $29,999 | 32 (4.9%) | 3 (0.3%) |
| $30,000 to $34,999 | 0 (0.0%) | 0 (0.0%) |
| $35,000 to $39,999 | 0 (0.0%) | 0 (0.0%) |
| $40,000 to $44,999 | 0 (0.0%) | 13 (1.5%) |
| $45,000 to $49,999 | 0 (0.0%) | 2 (0.2%) |
| $50,000 to $54,999 | 3 (0.4%) | 0 (0.0%) |
| $55,000 to $64,999 | 44 (6.7%) | 29 (3.3%) |
| $65,000 to $74,999 | 0 (0.0%) | 12 (1.4%) |
| $75,000 to $99,999 | 26 (3.9%) | 18 (2.0%) |
| $100,000+ | 20 (3.0%) | 2 (0.2%) |
| Total | 660 (100.0%) | 884 (100.0%) |
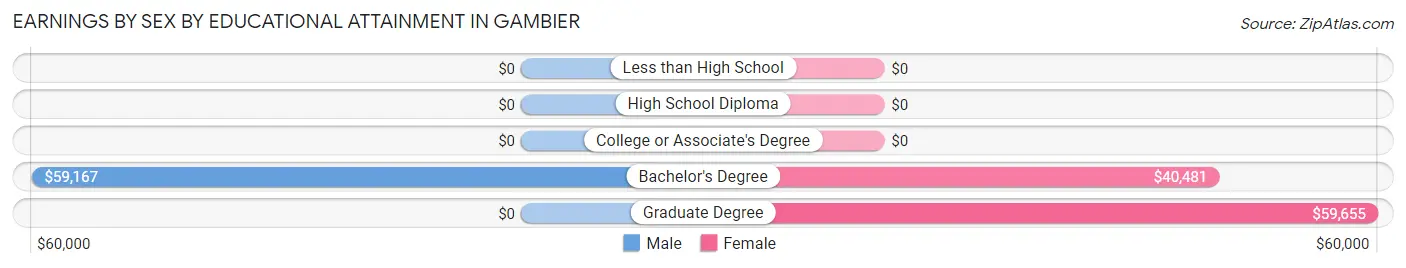
Earnings by Sex by Educational Attainment in Gambier
Average earnings in Gambier are $61,923 for men and $58,750 for women, a difference of 5.1%. Men with an educational attainment of bachelor's degree enjoy the highest average annual earnings of $59,167, while those with bachelor's degree education earn the least with $59,167. Women with an educational attainment of graduate degree earn the most with the average annual earnings of $59,655, while those with bachelor's degree education have the smallest earnings of $40,481.
| Educational Attainment | Male Income | Female Income |
| Less than High School | - | - |
| High School Diploma | - | - |
| College or Associate's Degree | - | - |
| Bachelor's Degree | $59,167 | $40,481 |
| Graduate Degree | - | - |
| Total | $61,923 | $58,750 |
Family Income in Gambier
Family Income Brackets in Gambier
According to the Gambier family income data, there are 28 families falling into the $200,000+ income range, which is the most common income bracket and makes up 25.9% of all families.
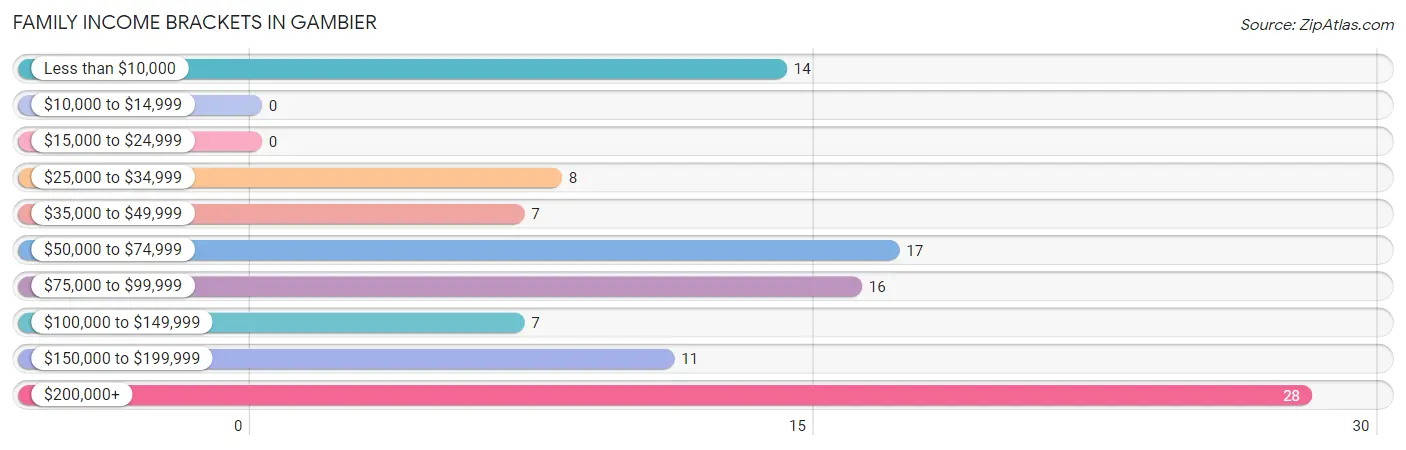
| Income Bracket | # Families | % Families |
| Less than $10,000 | 14 | 13.0% |
| $10,000 to $14,999 | 0 | 0.0% |
| $15,000 to $24,999 | 0 | 0.0% |
| $25,000 to $34,999 | 8 | 7.4% |
| $35,000 to $49,999 | 7 | 6.5% |
| $50,000 to $74,999 | 17 | 15.7% |
| $75,000 to $99,999 | 16 | 14.8% |
| $100,000 to $149,999 | 7 | 6.5% |
| $150,000 to $199,999 | 11 | 10.2% |
| $200,000+ | 28 | 25.9% |
Family Income by Famaliy Size in Gambier
2-person families (71 | 65.7%) account for the highest median family income in Gambier with $86,406 per family, while 2-person families (71 | 65.7%) have the highest median income of $43,203 per family member.
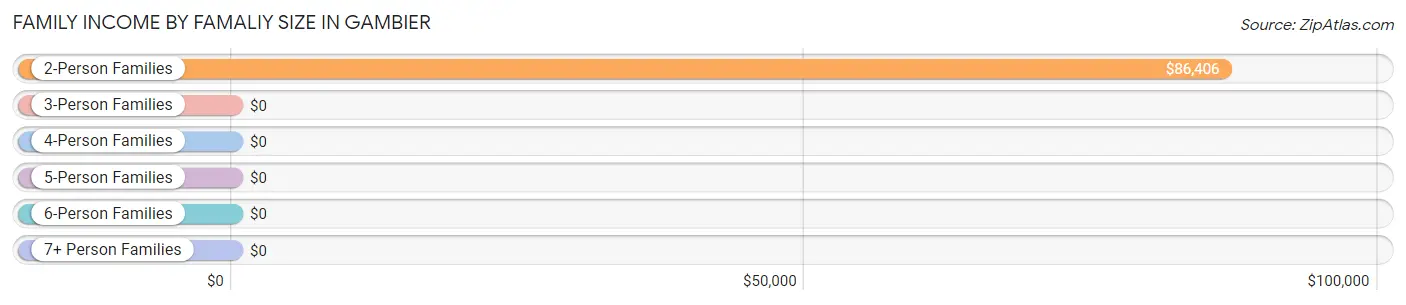
| Income Bracket | # Families | Median Income |
| 2-Person Families | 71 (65.7%) | $86,406 |
| 3-Person Families | 22 (20.4%) | $0 |
| 4-Person Families | 15 (13.9%) | $0 |
| 5-Person Families | 0 (0.0%) | $0 |
| 6-Person Families | 0 (0.0%) | $0 |
| 7+ Person Families | 0 (0.0%) | $0 |
| Total | 108 (100.0%) | $88,750 |
Family Income by Number of Earners in Gambier
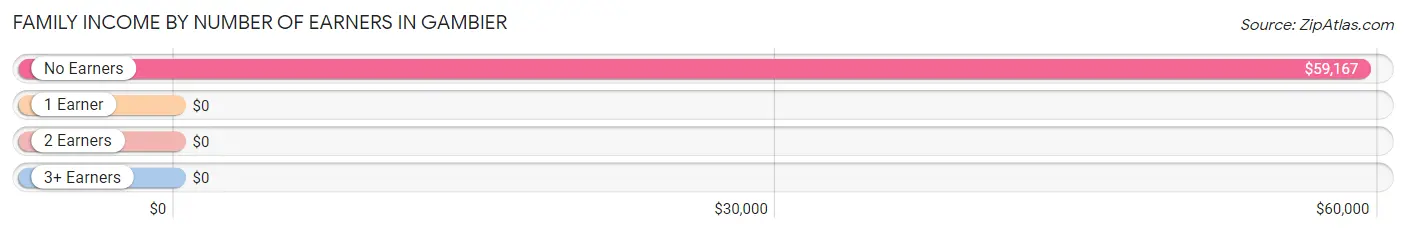
| Number of Earners | # Families | Median Income |
| No Earners | 50 (46.3%) | $59,167 |
| 1 Earner | 15 (13.9%) | $0 |
| 2 Earners | 23 (21.3%) | $0 |
| 3+ Earners | 20 (18.5%) | $0 |
| Total | 108 (100.0%) | $88,750 |
Household Income in Gambier
Household Income Brackets in Gambier
With 40 households falling in the category, the $150,000 to $199,999 income range is the most frequent in Gambier, accounting for 18.6% of all households. In contrast, only 7 households (3.3%) fall into the $15,000 to $24,999 income bracket, making it the least populous group.
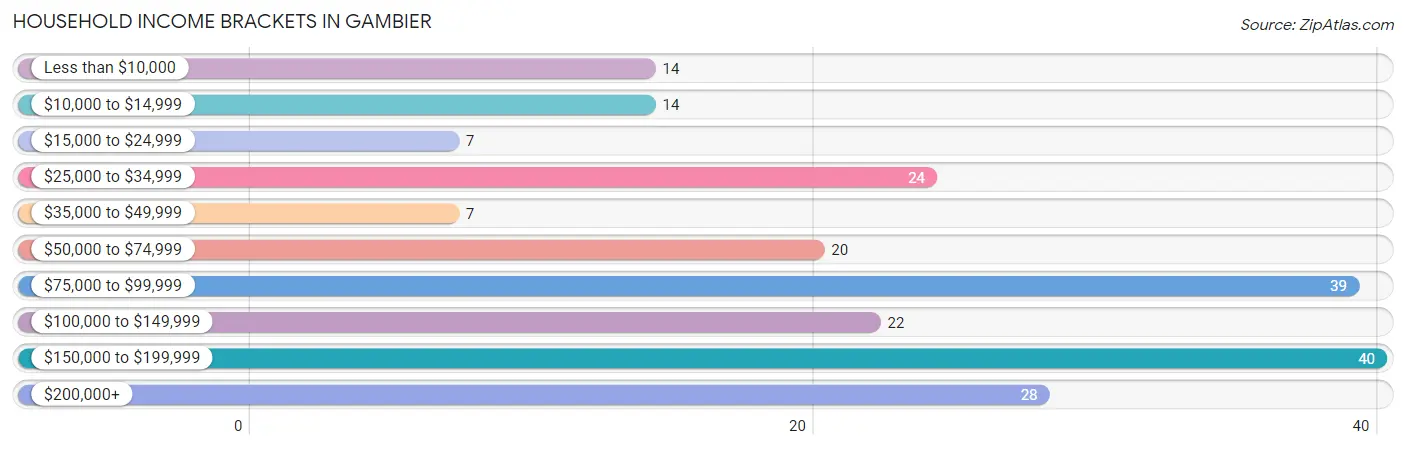
| Income Bracket | # Households | % Households |
| Less than $10,000 | 14 | 6.5% |
| $10,000 to $14,999 | 14 | 6.5% |
| $15,000 to $24,999 | 7 | 3.3% |
| $25,000 to $34,999 | 24 | 11.2% |
| $35,000 to $49,999 | 7 | 3.3% |
| $50,000 to $74,999 | 20 | 9.3% |
| $75,000 to $99,999 | 39 | 18.1% |
| $100,000 to $149,999 | 22 | 10.2% |
| $150,000 to $199,999 | 40 | 18.6% |
| $200,000+ | 28 | 13.0% |
Household Income by Householder Age in Gambier
The median household income in Gambier is $90,625, with the highest median household income of $191,164 found in the 45 to 64 years age bracket for the primary householder. A total of 71 households (33.0%) fall into this category. Meanwhile, the 15 to 24 years age bracket for the primary householder has the lowest median household income of $0, with 8 households (3.7%) in this group.
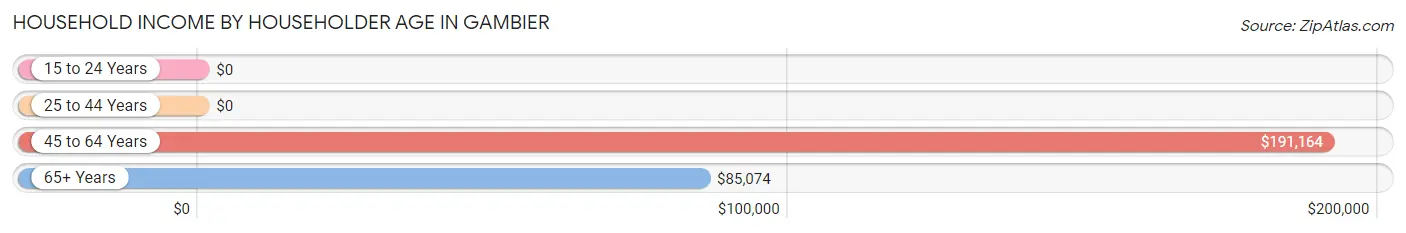
| Income Bracket | # Households | Median Income |
| 15 to 24 Years | 8 (3.7%) | $0 |
| 25 to 44 Years | 33 (15.3%) | $0 |
| 45 to 64 Years | 71 (33.0%) | $191,164 |
| 65+ Years | 103 (47.9%) | $85,074 |
| Total | 215 (100.0%) | $90,625 |
Poverty in Gambier
Income Below Poverty by Sex and Age in Gambier
With 20.9% poverty level for males and 16.0% for females among the residents of Gambier, 25 to 34 year old males and under 5 year old females are the most vulnerable to poverty, with 27 males (49.1%) and 14 females (87.5%) in their respective age groups living below the poverty level.
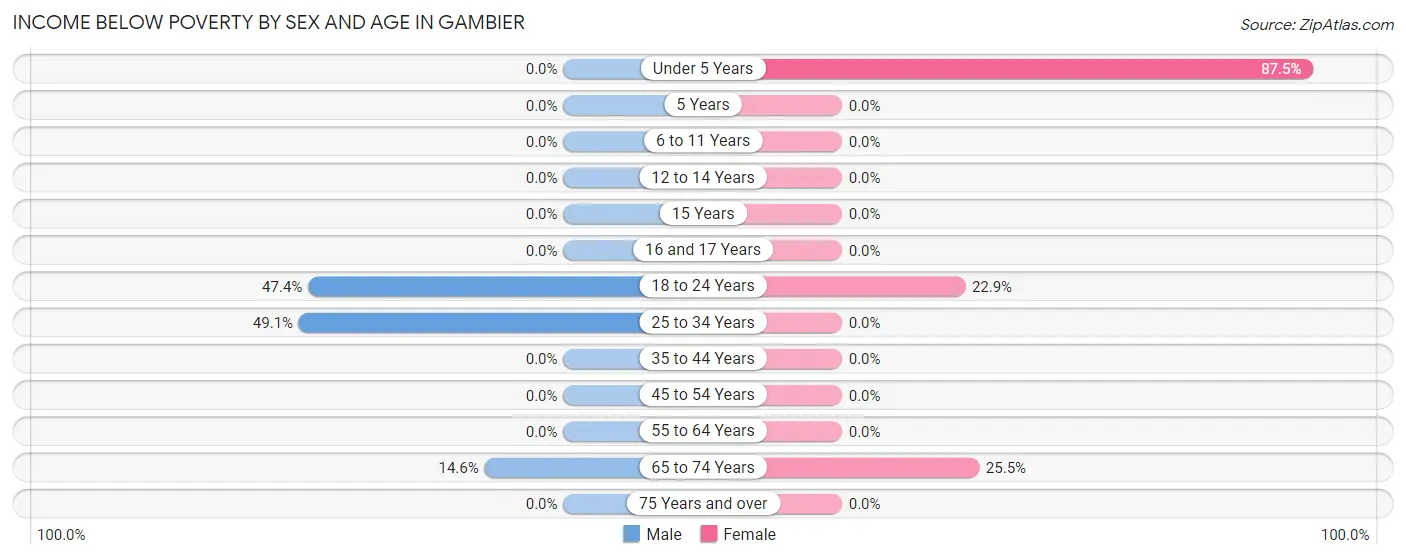
| Age Bracket | Male | Female |
| Under 5 Years | 0 (0.0%) | 14 (87.5%) |
| 5 Years | 0 (0.0%) | 0 (0.0%) |
| 6 to 11 Years | 0 (0.0%) | 0 (0.0%) |
| 12 to 14 Years | 0 (0.0%) | 0 (0.0%) |
| 15 Years | 0 (0.0%) | 0 (0.0%) |
| 16 and 17 Years | 0 (0.0%) | 0 (0.0%) |
| 18 to 24 Years | 9 (47.4%) | 8 (22.9%) |
| 25 to 34 Years | 27 (49.1%) | 0 (0.0%) |
| 35 to 44 Years | 0 (0.0%) | 0 (0.0%) |
| 45 to 54 Years | 0 (0.0%) | 0 (0.0%) |
| 55 to 64 Years | 0 (0.0%) | 0 (0.0%) |
| 65 to 74 Years | 6 (14.6%) | 14 (25.5%) |
| 75 Years and over | 0 (0.0%) | 0 (0.0%) |
| Total | 42 (20.9%) | 36 (16.0%) |
Income Above Poverty by Sex and Age in Gambier
According to the poverty statistics in Gambier, males aged under 5 years and females aged 25 to 34 years are the age groups that are most secure financially, with 100.0% of males and 100.0% of females in these age groups living above the poverty line.
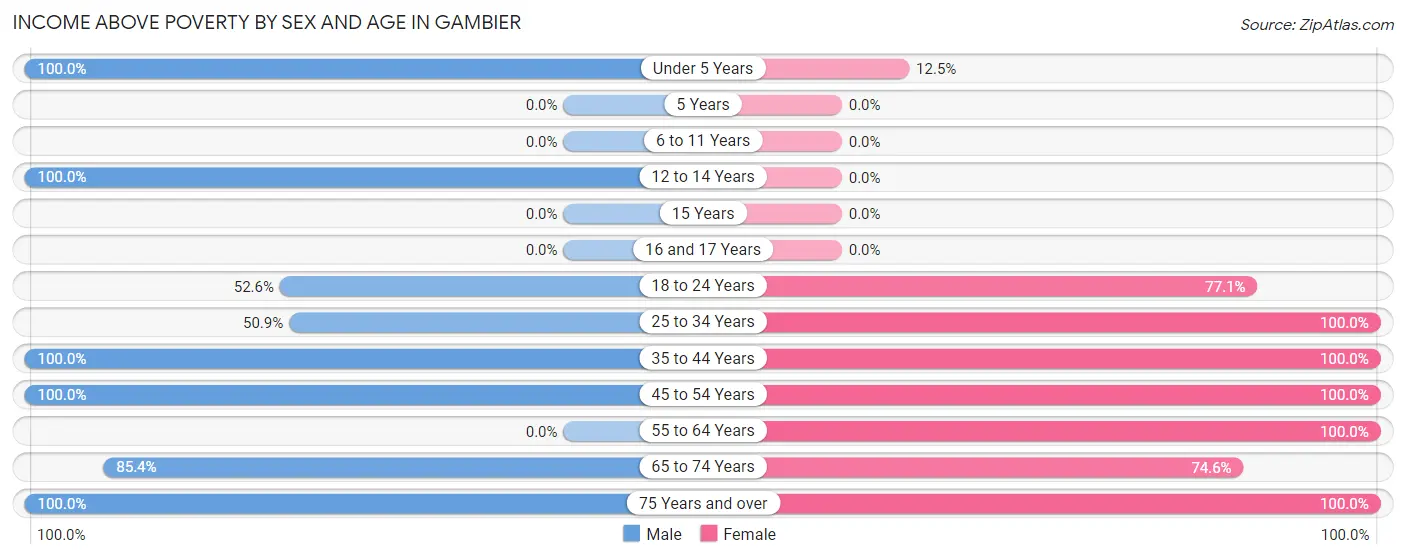
| Age Bracket | Male | Female |
| Under 5 Years | 14 (100.0%) | 2 (12.5%) |
| 5 Years | 0 (0.0%) | 0 (0.0%) |
| 6 to 11 Years | 0 (0.0%) | 0 (0.0%) |
| 12 to 14 Years | 7 (100.0%) | 0 (0.0%) |
| 15 Years | 0 (0.0%) | 0 (0.0%) |
| 16 and 17 Years | 0 (0.0%) | 0 (0.0%) |
| 18 to 24 Years | 10 (52.6%) | 27 (77.1%) |
| 25 to 34 Years | 28 (50.9%) | 24 (100.0%) |
| 35 to 44 Years | 10 (100.0%) | 5 (100.0%) |
| 45 to 54 Years | 39 (100.0%) | 32 (100.0%) |
| 55 to 64 Years | 0 (0.0%) | 30 (100.0%) |
| 65 to 74 Years | 35 (85.4%) | 41 (74.6%) |
| 75 Years and over | 16 (100.0%) | 28 (100.0%) |
| Total | 159 (79.1%) | 189 (84.0%) |
Income Below Poverty Among Married-Couple Families in Gambier
The poverty statistics for married-couple families in Gambier show that 9.5% or 8 of the total 84 families live below the poverty line. Families with 1 or 2 children have the highest poverty rate of 47.1%, comprising of 8 families. On the other hand, families with no children have the lowest poverty rate of 0.0%, which includes 0 families.
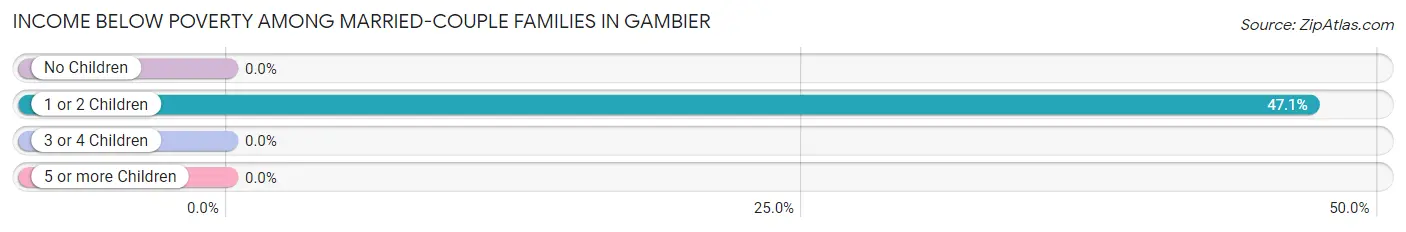
| Children | Above Poverty | Below Poverty |
| No Children | 67 (100.0%) | 0 (0.0%) |
| 1 or 2 Children | 9 (52.9%) | 8 (47.1%) |
| 3 or 4 Children | 0 (0.0%) | 0 (0.0%) |
| 5 or more Children | 0 (0.0%) | 0 (0.0%) |
| Total | 76 (90.5%) | 8 (9.5%) |
Income Below Poverty Among Single-Parent Households in Gambier
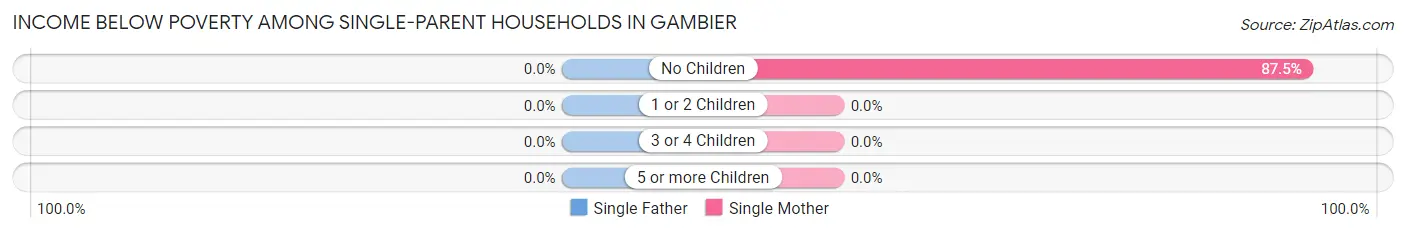
| Children | Single Father | Single Mother |
| No Children | 0 (0.0%) | 14 (87.5%) |
| 1 or 2 Children | 0 (0.0%) | 0 (0.0%) |
| 3 or 4 Children | 0 (0.0%) | 0 (0.0%) |
| 5 or more Children | 0 (0.0%) | 0 (0.0%) |
| Total | 0 (0.0%) | 14 (87.5%) |
Income Below Poverty Among Married-Couple vs Single-Parent Households in Gambier
The poverty data for Gambier shows that 8 of the married-couple family households (9.5%) and 14 of the single-parent households (58.3%) are living below the poverty level. Within the married-couple family households, those with 1 or 2 children have the highest poverty rate, with 8 households (47.1%) falling below the poverty line. Among the single-parent households, those with no children have the highest poverty rate, with 14 household (87.5%) living below poverty.
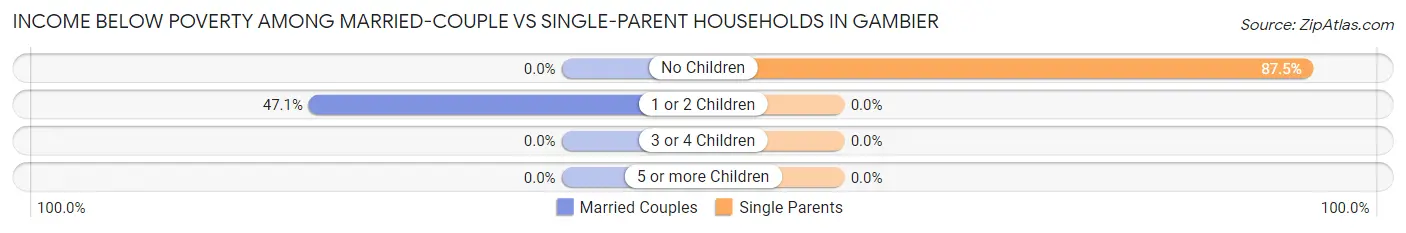
| Children | Married-Couple Families | Single-Parent Households |
| No Children | 0 (0.0%) | 14 (87.5%) |
| 1 or 2 Children | 8 (47.1%) | 0 (0.0%) |
| 3 or 4 Children | 0 (0.0%) | 0 (0.0%) |
| 5 or more Children | 0 (0.0%) | 0 (0.0%) |
| Total | 8 (9.5%) | 14 (58.3%) |
Race in Gambier
The most populous races in Gambier are White / Caucasian (1,777 | 88.8%), Hispanic or Latino (146 | 7.3%), and Two or more Races (98 | 4.9%).
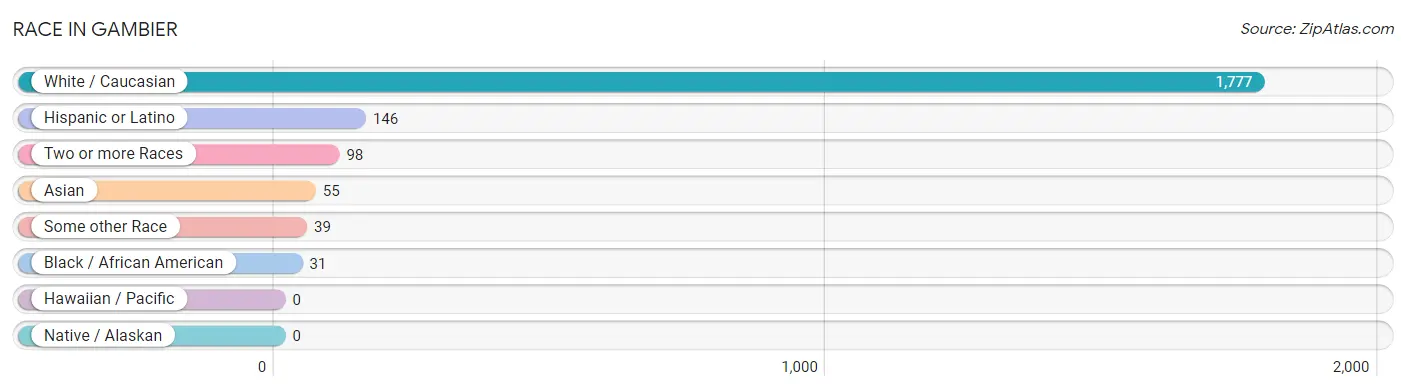
| Race | # Population | % Population |
| Asian | 55 | 2.8% |
| Black / African American | 31 | 1.5% |
| Hawaiian / Pacific | 0 | 0.0% |
| Hispanic or Latino | 146 | 7.3% |
| Native / Alaskan | 0 | 0.0% |
| White / Caucasian | 1,777 | 88.8% |
| Two or more Races | 98 | 4.9% |
| Some other Race | 39 | 1.9% |
| Total | 2,000 | 100.0% |
Ancestry in Gambier
The most populous ancestries reported in Gambier are German (308 | 15.4%), Irish (266 | 13.3%), English (205 | 10.2%), American (140 | 7.0%), and Italian (131 | 6.6%), together accounting for 52.5% of all Gambier residents.
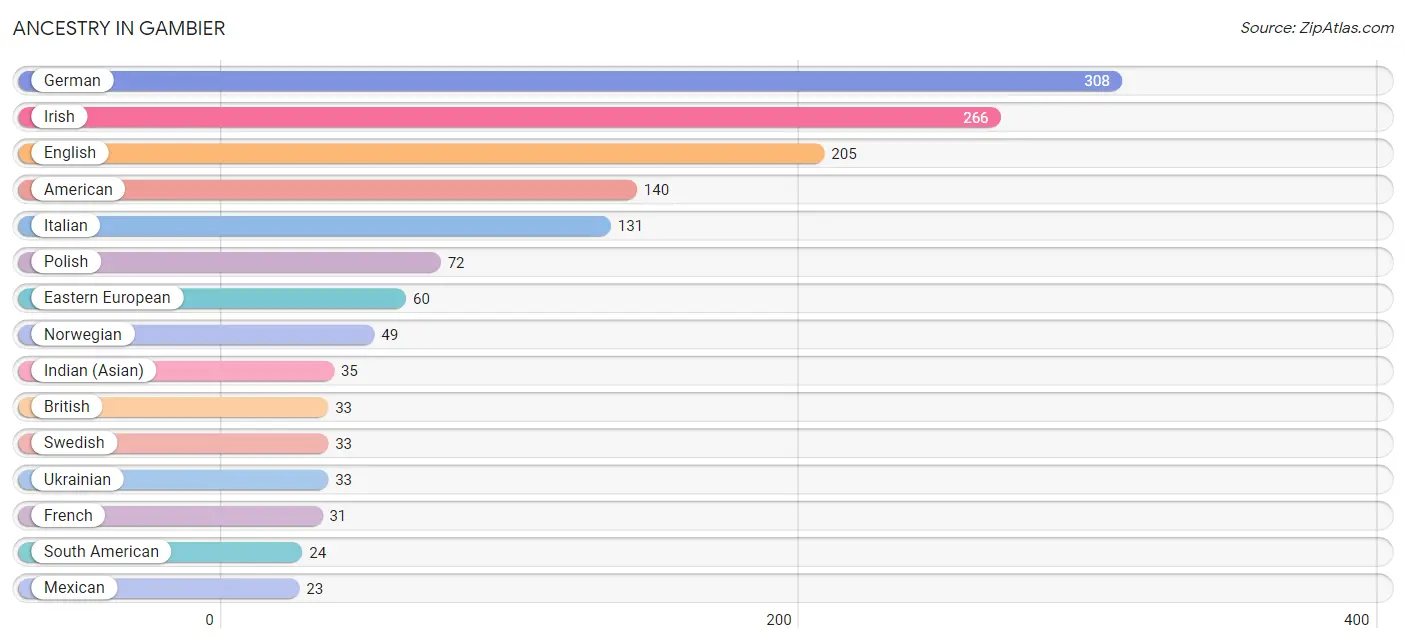
| Ancestry | # Population | % Population |
| American | 140 | 7.0% |
| Arab | 20 | 1.0% |
| Bhutanese | 13 | 0.6% |
| British | 33 | 1.7% |
| Colombian | 13 | 0.6% |
| Czech | 3 | 0.2% |
| Danish | 15 | 0.7% |
| Dutch | 21 | 1.1% |
| Eastern European | 60 | 3.0% |
| Ecuadorian | 11 | 0.5% |
| English | 205 | 10.2% |
| European | 19 | 0.9% |
| French | 31 | 1.5% |
| German | 308 | 15.4% |
| Greek | 6 | 0.3% |
| Hungarian | 16 | 0.8% |
| Indian (Asian) | 35 | 1.8% |
| Iranian | 7 | 0.4% |
| Iraqi | 4 | 0.2% |
| Irish | 266 | 13.3% |
| Italian | 131 | 6.6% |
| Latvian | 5 | 0.3% |
| Lebanese | 16 | 0.8% |
| Mexican | 23 | 1.1% |
| Mongolian | 4 | 0.2% |
| Norwegian | 49 | 2.5% |
| Okinawan | 4 | 0.2% |
| Polish | 72 | 3.6% |
| Russian | 6 | 0.3% |
| Scandinavian | 12 | 0.6% |
| Scotch-Irish | 4 | 0.2% |
| Scottish | 16 | 0.8% |
| Slovene | 2 | 0.1% |
| South American | 24 | 1.2% |
| Spanish | 20 | 1.0% |
| Swedish | 33 | 1.7% |
| Swiss | 15 | 0.7% |
| Thai | 22 | 1.1% |
| Ukrainian | 33 | 1.7% |
| Welsh | 5 | 0.3% |
| Yugoslavian | 16 | 0.8% | View All 41 Rows |
Immigrants in Gambier
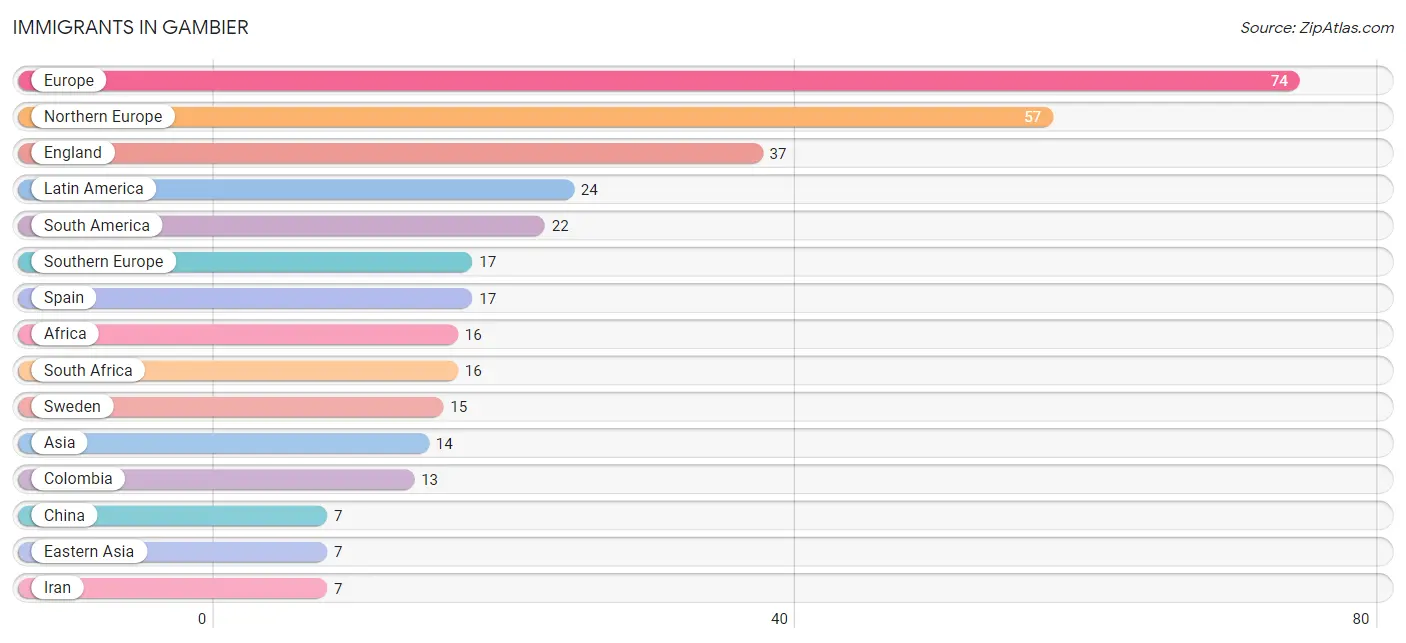
The most numerous immigrant groups reported in Gambier came from Europe (74 | 3.7%), Northern Europe (57 | 2.9%), England (37 | 1.8%), Latin America (24 | 1.2%), and South America (22 | 1.1%), together accounting for 10.7% of all Gambier residents.
| Immigration Origin | # Population | % Population |
| Africa | 16 | 0.8% |
| Asia | 14 | 0.7% |
| Central America | 2 | 0.1% |
| China | 7 | 0.4% |
| Colombia | 13 | 0.6% |
| Eastern Asia | 7 | 0.4% |
| England | 37 | 1.8% |
| Europe | 74 | 3.7% |
| Iran | 7 | 0.4% |
| Latin America | 24 | 1.2% |
| Mexico | 2 | 0.1% |
| Northern Europe | 57 | 2.9% |
| Peru | 6 | 0.3% |
| South Africa | 16 | 0.8% |
| South America | 22 | 1.1% |
| South Central Asia | 7 | 0.4% |
| Southern Europe | 17 | 0.9% |
| Spain | 17 | 0.9% |
| Sweden | 15 | 0.7% |
| Venezuela | 3 | 0.2% | View All 20 Rows |
Sex and Age in Gambier
Sex and Age in Gambier
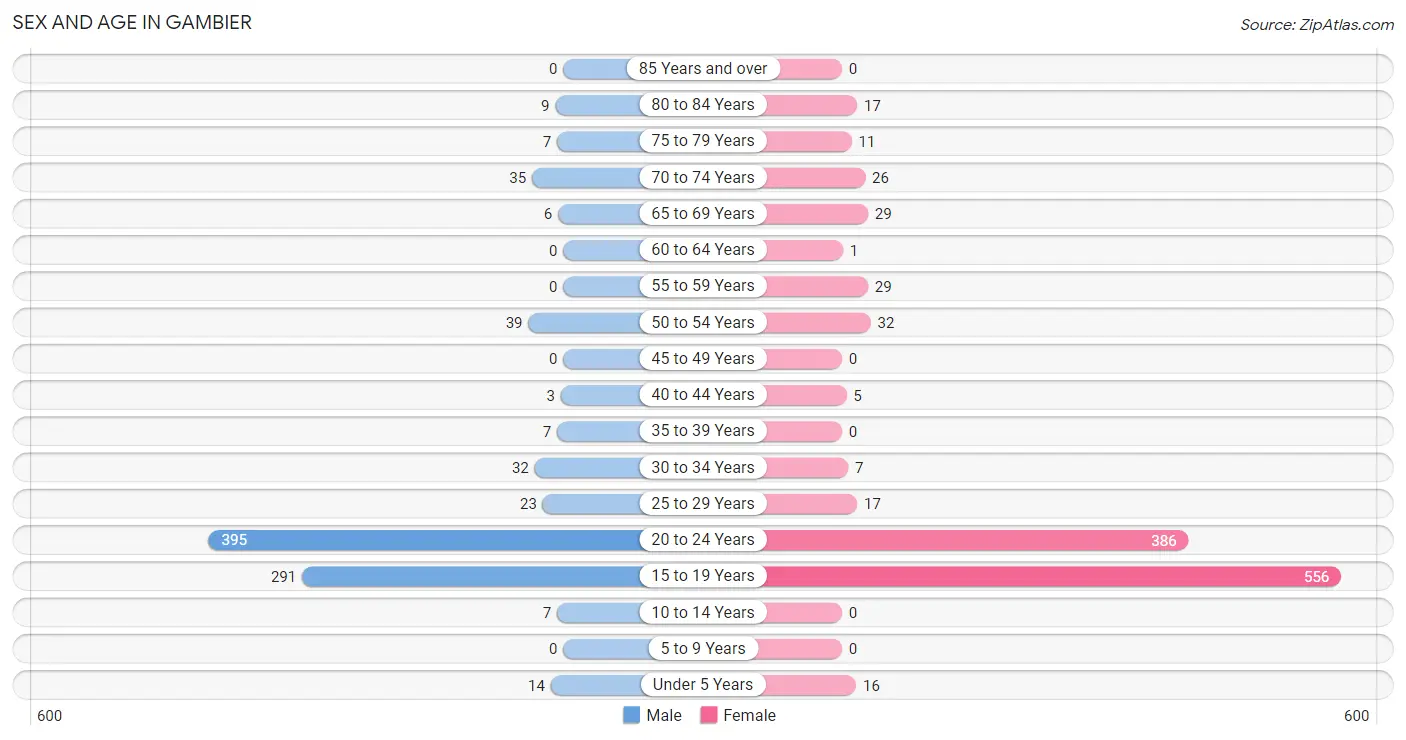
The most populous age groups in Gambier are 20 to 24 Years (395 | 45.5%) for men and 15 to 19 Years (556 | 49.1%) for women.
| Age Bracket | Male | Female |
| Under 5 Years | 14 (1.6%) | 16 (1.4%) |
| 5 to 9 Years | 0 (0.0%) | 0 (0.0%) |
| 10 to 14 Years | 7 (0.8%) | 0 (0.0%) |
| 15 to 19 Years | 291 (33.5%) | 556 (49.1%) |
| 20 to 24 Years | 395 (45.5%) | 386 (34.1%) |
| 25 to 29 Years | 23 (2.6%) | 17 (1.5%) |
| 30 to 34 Years | 32 (3.7%) | 7 (0.6%) |
| 35 to 39 Years | 7 (0.8%) | 0 (0.0%) |
| 40 to 44 Years | 3 (0.4%) | 5 (0.4%) |
| 45 to 49 Years | 0 (0.0%) | 0 (0.0%) |
| 50 to 54 Years | 39 (4.5%) | 32 (2.8%) |
| 55 to 59 Years | 0 (0.0%) | 29 (2.6%) |
| 60 to 64 Years | 0 (0.0%) | 1 (0.1%) |
| 65 to 69 Years | 6 (0.7%) | 29 (2.6%) |
| 70 to 74 Years | 35 (4.0%) | 26 (2.3%) |
| 75 to 79 Years | 7 (0.8%) | 11 (1.0%) |
| 80 to 84 Years | 9 (1.0%) | 17 (1.5%) |
| 85 Years and over | 0 (0.0%) | 0 (0.0%) |
| Total | 868 (100.0%) | 1,132 (100.0%) |
Families and Households in Gambier
Median Family Size in Gambier
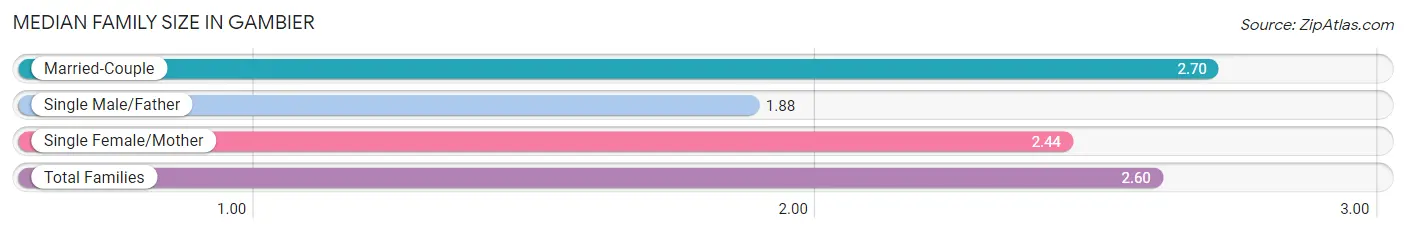
The median family size in Gambier is 2.60 persons per family, with married-couple families (84 | 77.8%) accounting for the largest median family size of 2.7 persons per family. On the other hand, single male/father families (8 | 7.4%) represent the smallest median family size with 1.88 persons per family.
| Family Type | # Families | Family Size |
| Married-Couple | 84 (77.8%) | 2.70 |
| Single Male/Father | 8 (7.4%) | 1.88 |
| Single Female/Mother | 16 (14.8%) | 2.44 |
| Total Families | 108 (100.0%) | 2.60 |
Median Household Size in Gambier
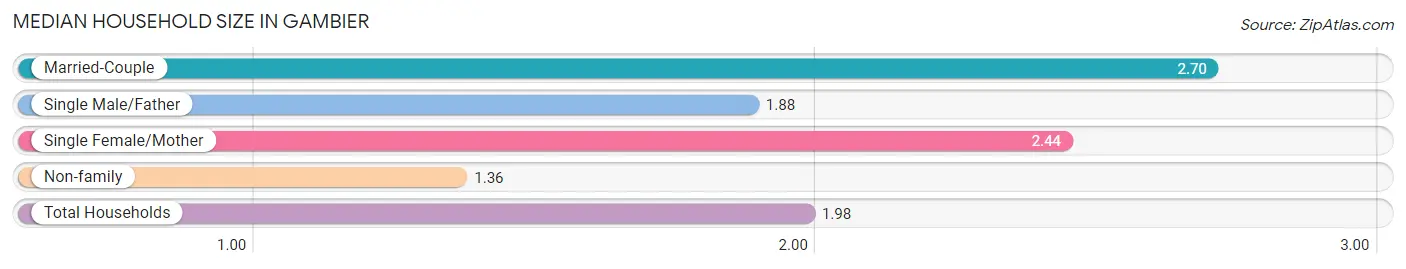
The median household size in Gambier is 1.98 persons per household, with married-couple households (84 | 39.1%) accounting for the largest median household size of 2.7 persons per household. non-family households (107 | 49.8%) represent the smallest median household size with 1.36 persons per household.
| Household Type | # Households | Household Size |
| Married-Couple | 84 (39.1%) | 2.70 |
| Single Male/Father | 8 (3.7%) | 1.88 |
| Single Female/Mother | 16 (7.4%) | 2.44 |
| Non-family | 107 (49.8%) | 1.36 |
| Total Households | 215 (100.0%) | 1.98 |
Household Size by Marriage Status in Gambier
Out of a total of 215 households in Gambier, 108 (50.2%) are family households, while 107 (49.8%) are nonfamily households. The most numerous type of family households are 2-person households, comprising 71, and the most common type of nonfamily households are 1-person households, comprising 92.
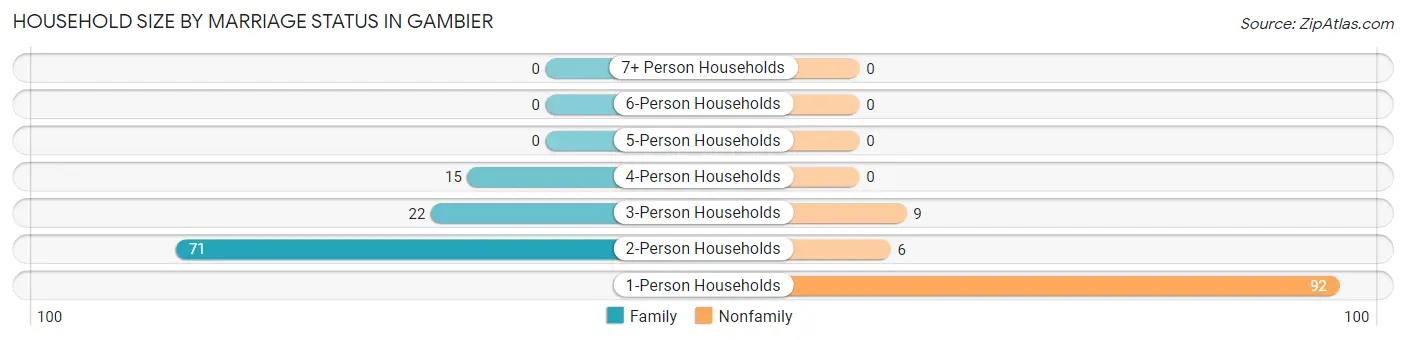
| Household Size | Family Households | Nonfamily Households |
| 1-Person Households | - | 92 (42.8%) |
| 2-Person Households | 71 (33.0%) | 6 (2.8%) |
| 3-Person Households | 22 (10.2%) | 9 (4.2%) |
| 4-Person Households | 15 (7.0%) | 0 (0.0%) |
| 5-Person Households | 0 (0.0%) | 0 (0.0%) |
| 6-Person Households | 0 (0.0%) | 0 (0.0%) |
| 7+ Person Households | 0 (0.0%) | 0 (0.0%) |
| Total | 108 (50.2%) | 107 (49.8%) |
Female Fertility in Gambier
Fertility by Age in Gambier
Average fertility rate in Gambier is 8.0 births per 1,000 women. Women in the age bracket of 20 to 34 years have the highest fertility rate with 20.0 births per 1,000 women. Women in the age bracket of 20 to 34 years acount for 100.0% of all women with births.
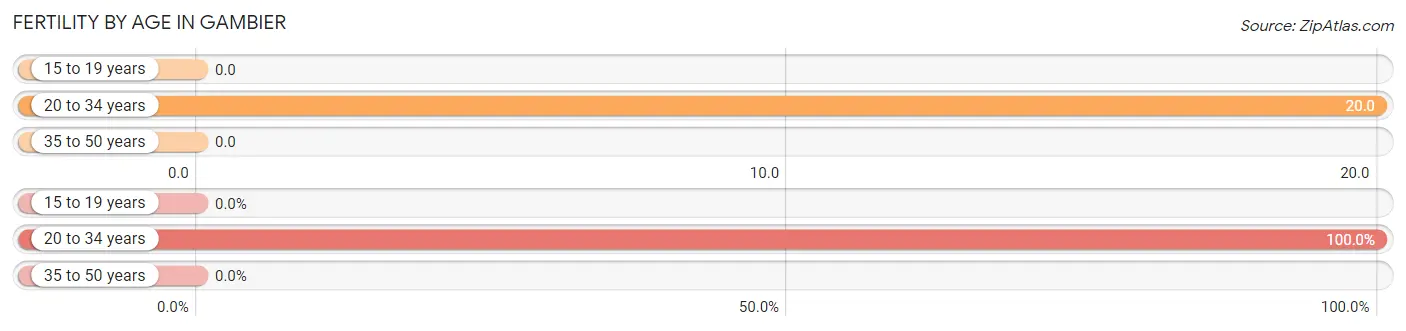
| Age Bracket | Women with Births | Births / 1,000 Women |
| 15 to 19 years | 0 (0.0%) | 0.0 |
| 20 to 34 years | 8 (100.0%) | 20.0 |
| 35 to 50 years | 0 (0.0%) | 0.0 |
| Total | 8 (100.0%) | 8.0 |
Fertility by Age by Marriage Status in Gambier
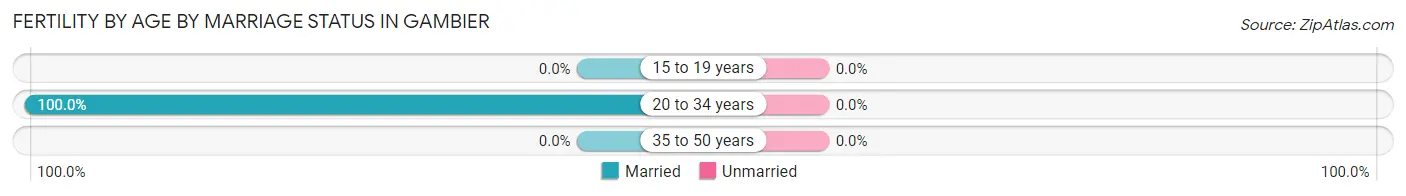
| Age Bracket | Married | Unmarried |
| 15 to 19 years | 0 (0.0%) | 0 (0.0%) |
| 20 to 34 years | 8 (100.0%) | 0 (0.0%) |
| 35 to 50 years | 0 (0.0%) | 0 (0.0%) |
| Total | 8 (100.0%) | 0 (0.0%) |
Fertility by Education in Gambier
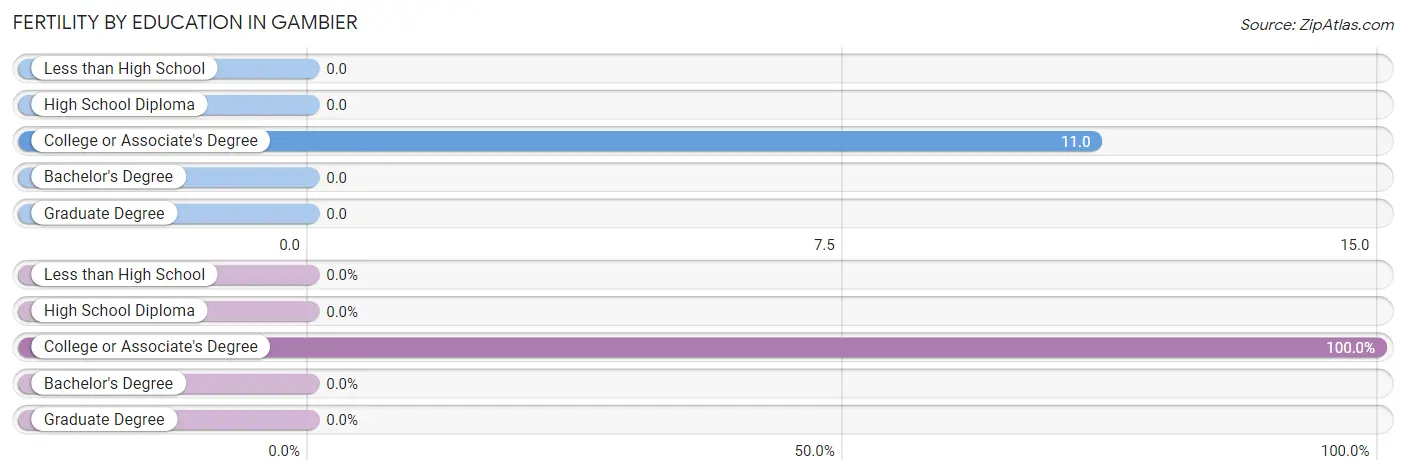
| Educational Attainment | Women with Births | Births / 1,000 Women |
| Less than High School | 0 (0.0%) | 0.0 |
| High School Diploma | 0 (0.0%) | 0.0 |
| College or Associate's Degree | 8 (100.0%) | 11.0 |
| Bachelor's Degree | 0 (0.0%) | 0.0 |
| Graduate Degree | 0 (0.0%) | 0.0 |
| Total | 8 (100.0%) | 8.0 |
Fertility by Education by Marriage Status in Gambier
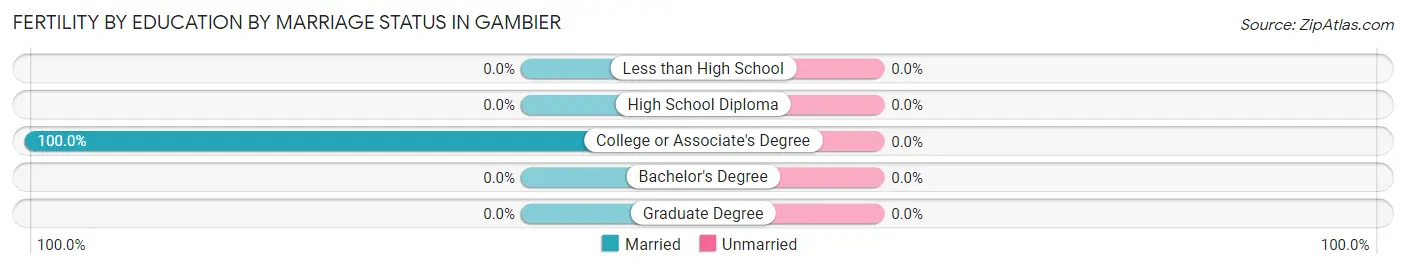
| Educational Attainment | Married | Unmarried |
| Less than High School | 0 (0.0%) | 0 (0.0%) |
| High School Diploma | 0 (0.0%) | 0 (0.0%) |
| College or Associate's Degree | 8 (100.0%) | 0 (0.0%) |
| Bachelor's Degree | 0 (0.0%) | 0 (0.0%) |
| Graduate Degree | 0 (0.0%) | 0 (0.0%) |
| Total | 8 (100.0%) | 0 (0.0%) |
Employment Characteristics in Gambier
Employment by Class of Employer in Gambier
Among the 776 employed individuals in Gambier, private company employees (429 | 55.3%), not-for-profit organizations (246 | 31.7%), and local government employees (36 | 4.6%) make up the most common classes of employment.
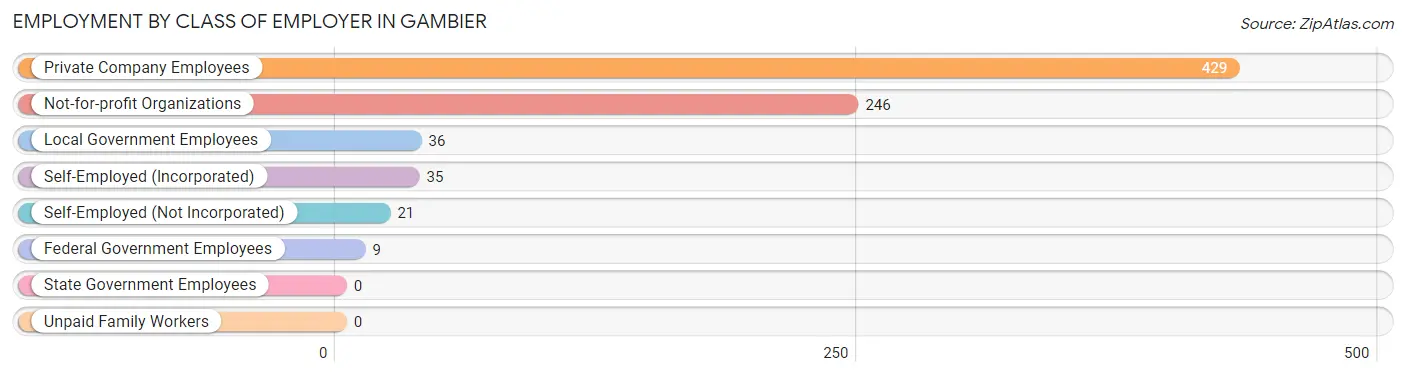
| Employer Class | # Employees | % Employees |
| Private Company Employees | 429 | 55.3% |
| Self-Employed (Incorporated) | 35 | 4.5% |
| Self-Employed (Not Incorporated) | 21 | 2.7% |
| Not-for-profit Organizations | 246 | 31.7% |
| Local Government Employees | 36 | 4.6% |
| State Government Employees | 0 | 0.0% |
| Federal Government Employees | 9 | 1.2% |
| Unpaid Family Workers | 0 | 0.0% |
| Total | 776 | 100.0% |
Employment Status by Age in Gambier
According to the labor force statistics for Gambier, out of the total population over 16 years of age (1,963), 47.7% or 936 individuals are in the labor force, with 3.7% or 35 of them unemployed. The age group with the highest labor force participation rate is 25 to 29 years, with 100.0% or 40 individuals in the labor force. Within the labor force, the 16 to 19 years age range has the highest percentage of unemployed individuals, with 10.6% or 28 of them being unemployed.
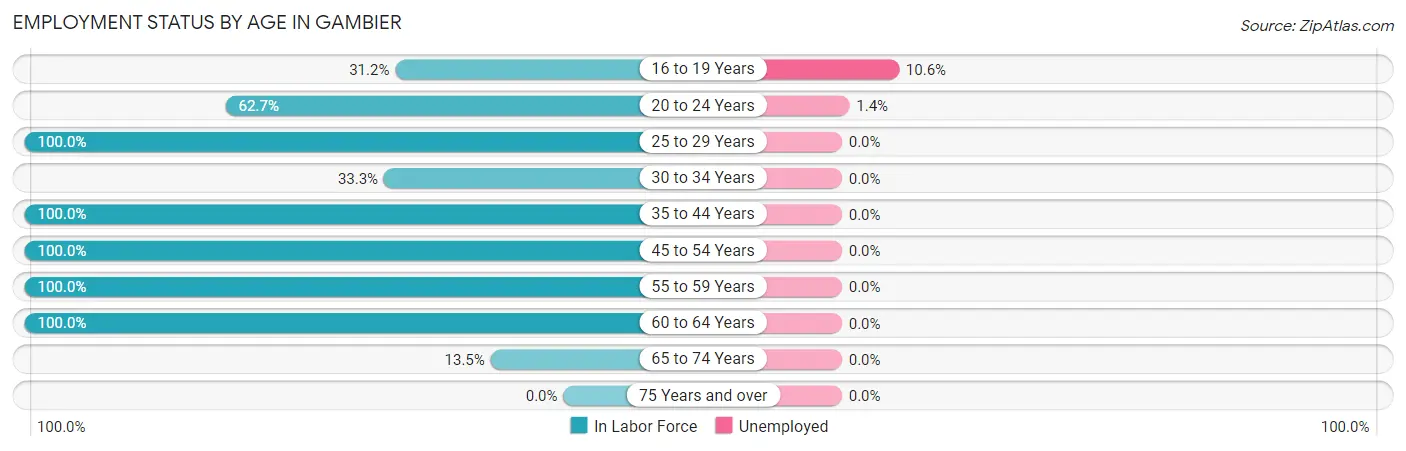
| Age Bracket | In Labor Force | Unemployed |
| 16 to 19 Years | 264 (31.2%) | 28 (10.6%) |
| 20 to 24 Years | 490 (62.7%) | 7 (1.4%) |
| 25 to 29 Years | 40 (100.0%) | 0 (0.0%) |
| 30 to 34 Years | 13 (33.3%) | 0 (0.0%) |
| 35 to 44 Years | 15 (100.0%) | 0 (0.0%) |
| 45 to 54 Years | 71 (100.0%) | 0 (0.0%) |
| 55 to 59 Years | 29 (100.0%) | 0 (0.0%) |
| 60 to 64 Years | 1 (100.0%) | 0 (0.0%) |
| 65 to 74 Years | 13 (13.5%) | 0 (0.0%) |
| 75 Years and over | 0 (0.0%) | 0 (0.0%) |
| Total | 936 (47.7%) | 35 (3.7%) |
Employment Status by Educational Attainment in Gambier
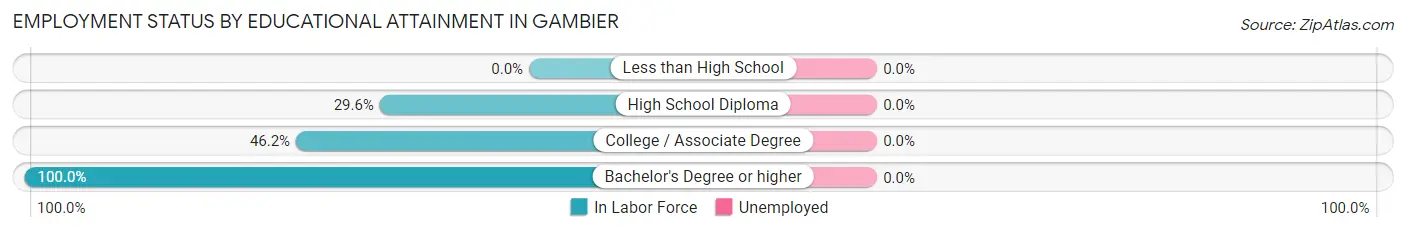
| Educational Attainment | In Labor Force | Unemployed |
| Less than High School | 0 (0.0%) | 0 (0.0%) |
| High School Diploma | 8 (29.6%) | 0 (0.0%) |
| College / Associate Degree | 6 (46.2%) | 0 (0.0%) |
| Bachelor's Degree or higher | 155 (100.0%) | 0 (0.0%) |
| Total | 169 (86.7%) | 0 (0.0%) |
Employment Occupations by Sex in Gambier
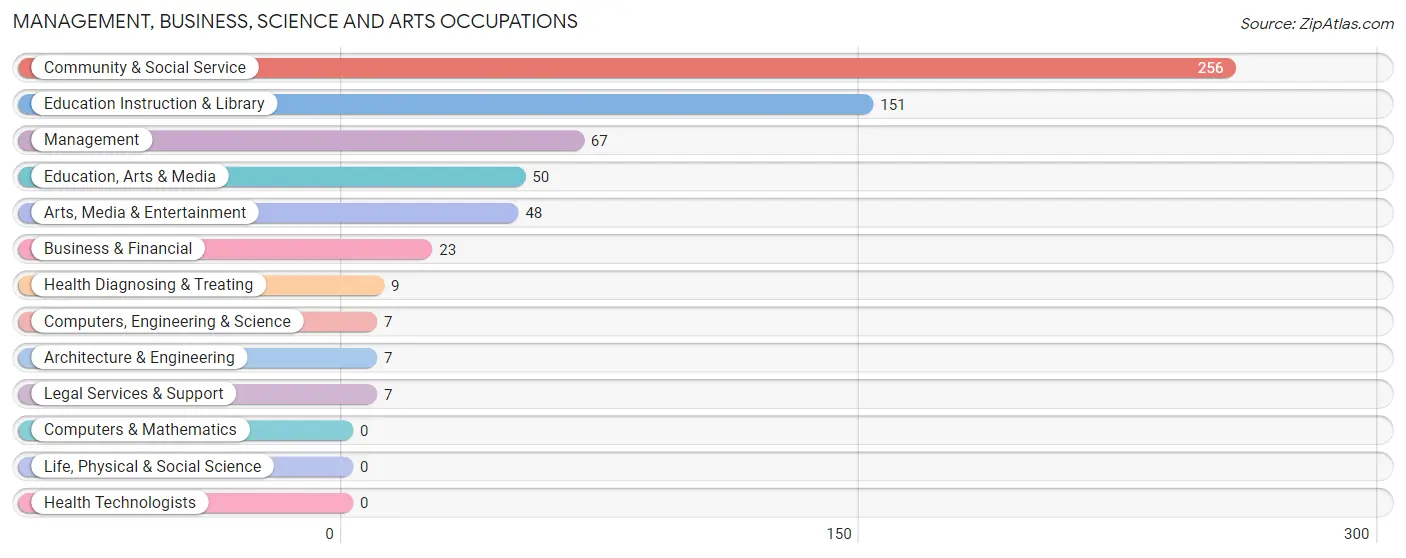
Management, Business, Science and Arts Occupations
The most common Management, Business, Science and Arts occupations in Gambier are Community & Social Service (256 | 28.7%), Education Instruction & Library (151 | 16.9%), Management (67 | 7.5%), Education, Arts & Media (50 | 5.6%), and Arts, Media & Entertainment (48 | 5.4%).
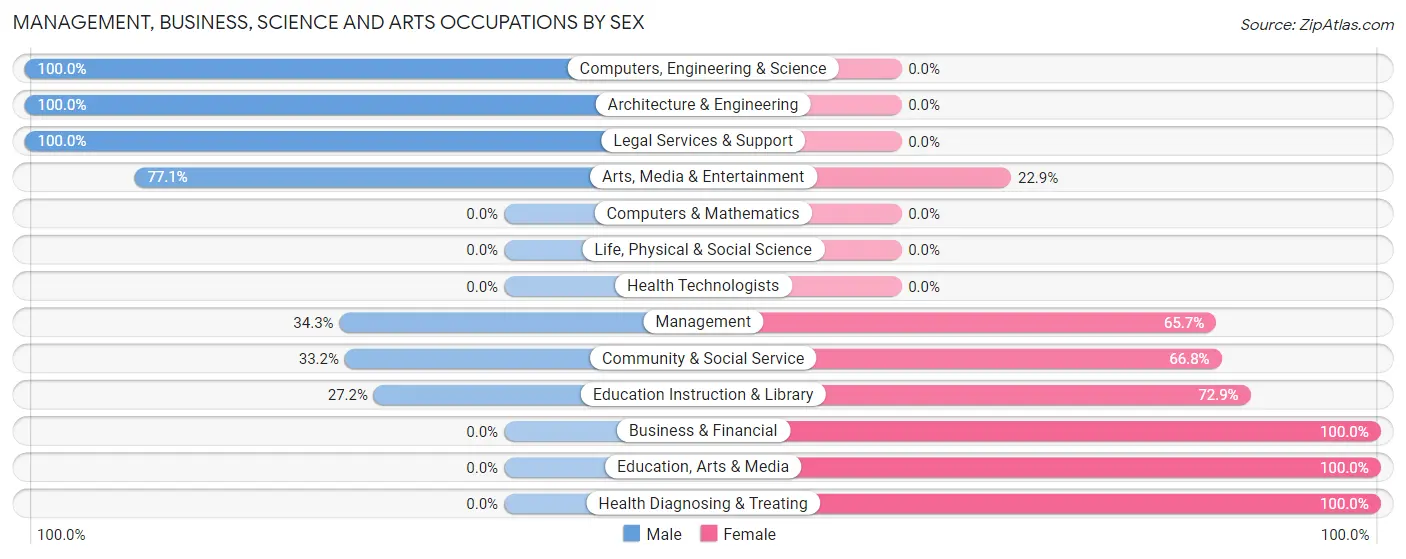
Management, Business, Science and Arts Occupations by Sex
Within the Management, Business, Science and Arts occupations in Gambier, the most male-oriented occupations are Computers, Engineering & Science (100.0%), Architecture & Engineering (100.0%), and Legal Services & Support (100.0%), while the most female-oriented occupations are Business & Financial (100.0%), Education, Arts & Media (100.0%), and Health Diagnosing & Treating (100.0%).
| Occupation | Male | Female |
| Management | 23 (34.3%) | 44 (65.7%) |
| Business & Financial | 0 (0.0%) | 23 (100.0%) |
| Computers, Engineering & Science | 7 (100.0%) | 0 (0.0%) |
| Computers & Mathematics | 0 (0.0%) | 0 (0.0%) |
| Architecture & Engineering | 7 (100.0%) | 0 (0.0%) |
| Life, Physical & Social Science | 0 (0.0%) | 0 (0.0%) |
| Community & Social Service | 85 (33.2%) | 171 (66.8%) |
| Education, Arts & Media | 0 (0.0%) | 50 (100.0%) |
| Legal Services & Support | 7 (100.0%) | 0 (0.0%) |
| Education Instruction & Library | 41 (27.2%) | 110 (72.9%) |
| Arts, Media & Entertainment | 37 (77.1%) | 11 (22.9%) |
| Health Diagnosing & Treating | 0 (0.0%) | 9 (100.0%) |
| Health Technologists | 0 (0.0%) | 0 (0.0%) |
| Total (Category) | 115 (31.8%) | 247 (68.2%) |
| Total (Overall) | 416 (46.6%) | 477 (53.4%) |
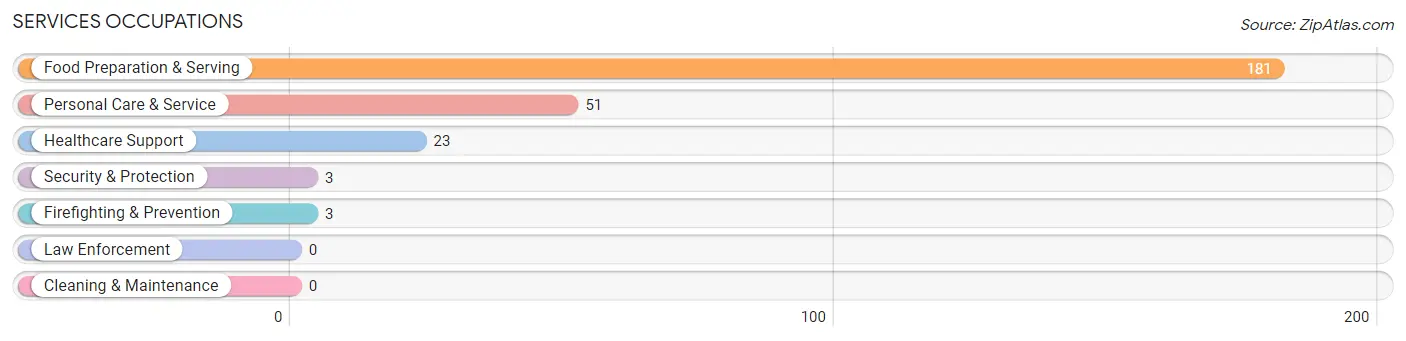
Services Occupations
The most common Services occupations in Gambier are Food Preparation & Serving (181 | 20.3%), Personal Care & Service (51 | 5.7%), Healthcare Support (23 | 2.6%), Security & Protection (3 | 0.3%), and Firefighting & Prevention (3 | 0.3%).
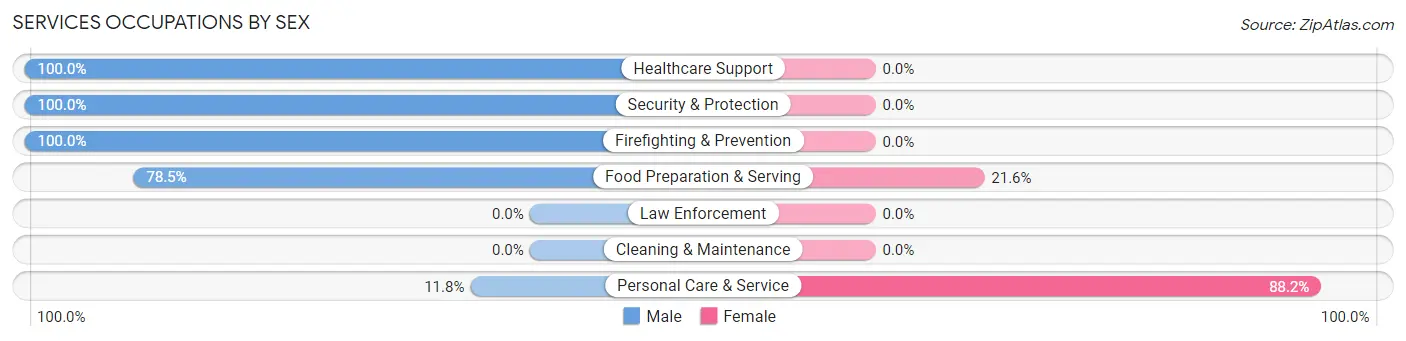
Services Occupations by Sex
Within the Services occupations in Gambier, the most male-oriented occupations are Healthcare Support (100.0%), Security & Protection (100.0%), and Firefighting & Prevention (100.0%), while the most female-oriented occupations are Personal Care & Service (88.2%), and Food Preparation & Serving (21.5%).
| Occupation | Male | Female |
| Healthcare Support | 23 (100.0%) | 0 (0.0%) |
| Security & Protection | 3 (100.0%) | 0 (0.0%) |
| Firefighting & Prevention | 3 (100.0%) | 0 (0.0%) |
| Law Enforcement | 0 (0.0%) | 0 (0.0%) |
| Food Preparation & Serving | 142 (78.4%) | 39 (21.5%) |
| Cleaning & Maintenance | 0 (0.0%) | 0 (0.0%) |
| Personal Care & Service | 6 (11.8%) | 45 (88.2%) |
| Total (Category) | 174 (67.4%) | 84 (32.6%) |
| Total (Overall) | 416 (46.6%) | 477 (53.4%) |
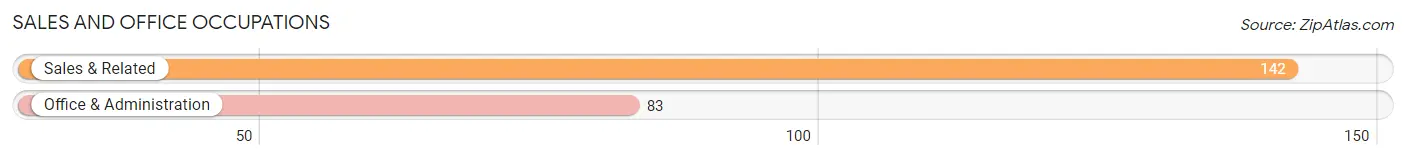
Sales and Office Occupations
The most common Sales and Office occupations in Gambier are Sales & Related (142 | 15.9%), and Office & Administration (83 | 9.3%).
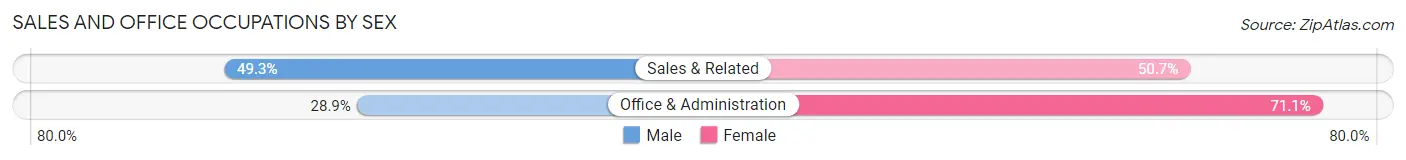
Sales and Office Occupations by Sex
| Occupation | Male | Female |
| Sales & Related | 70 (49.3%) | 72 (50.7%) |
| Office & Administration | 24 (28.9%) | 59 (71.1%) |
| Total (Category) | 94 (41.8%) | 131 (58.2%) |
| Total (Overall) | 416 (46.6%) | 477 (53.4%) |
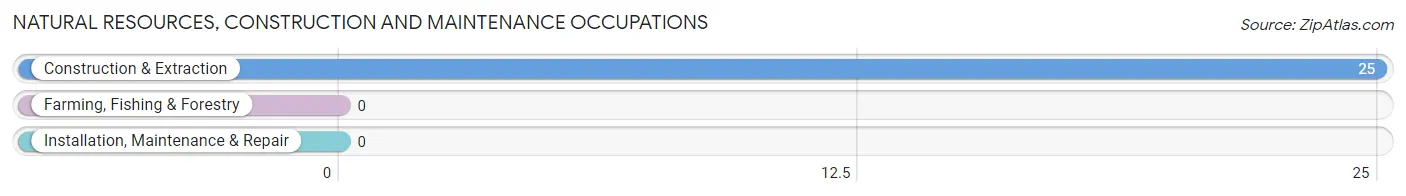
Natural Resources, Construction and Maintenance Occupations
The most common Natural Resources, Construction and Maintenance occupations in Gambier are , and Construction & Extraction (25 | 2.8%).
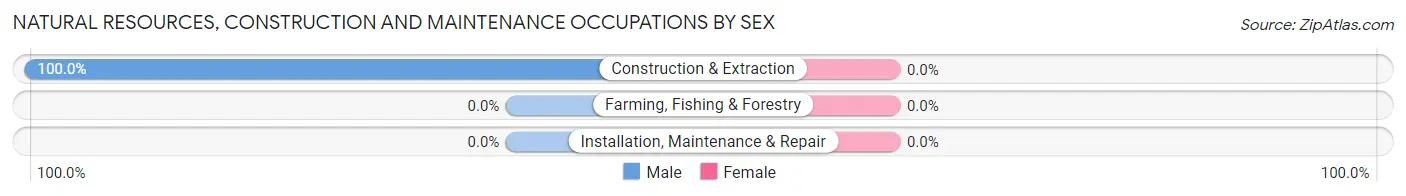
Natural Resources, Construction and Maintenance Occupations by Sex
| Occupation | Male | Female |
| Farming, Fishing & Forestry | 0 (0.0%) | 0 (0.0%) |
| Construction & Extraction | 25 (100.0%) | 0 (0.0%) |
| Installation, Maintenance & Repair | 0 (0.0%) | 0 (0.0%) |
| Total (Category) | 25 (100.0%) | 0 (0.0%) |
| Total (Overall) | 416 (46.6%) | 477 (53.4%) |
Production, Transportation and Moving Occupations
The most common Production, Transportation and Moving occupations in Gambier are , and Material Moving (23 | 2.6%).
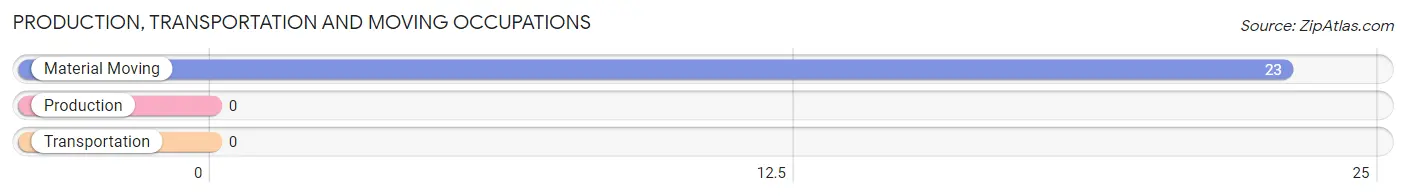
Production, Transportation and Moving Occupations by Sex
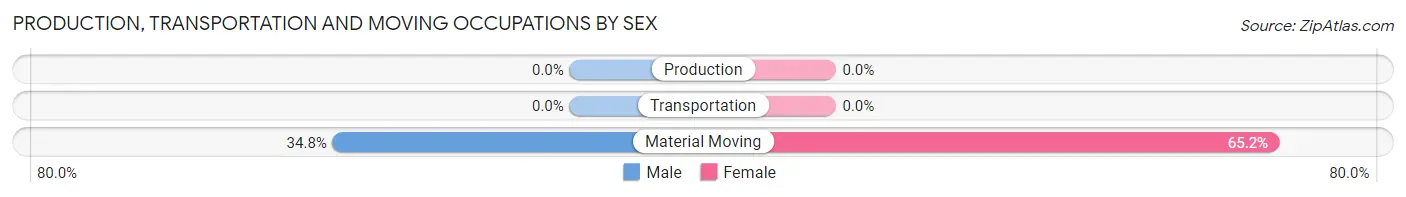
| Occupation | Male | Female |
| Production | 0 (0.0%) | 0 (0.0%) |
| Transportation | 0 (0.0%) | 0 (0.0%) |
| Material Moving | 8 (34.8%) | 15 (65.2%) |
| Total (Category) | 8 (34.8%) | 15 (65.2%) |
| Total (Overall) | 416 (46.6%) | 477 (53.4%) |
Employment Industries by Sex in Gambier
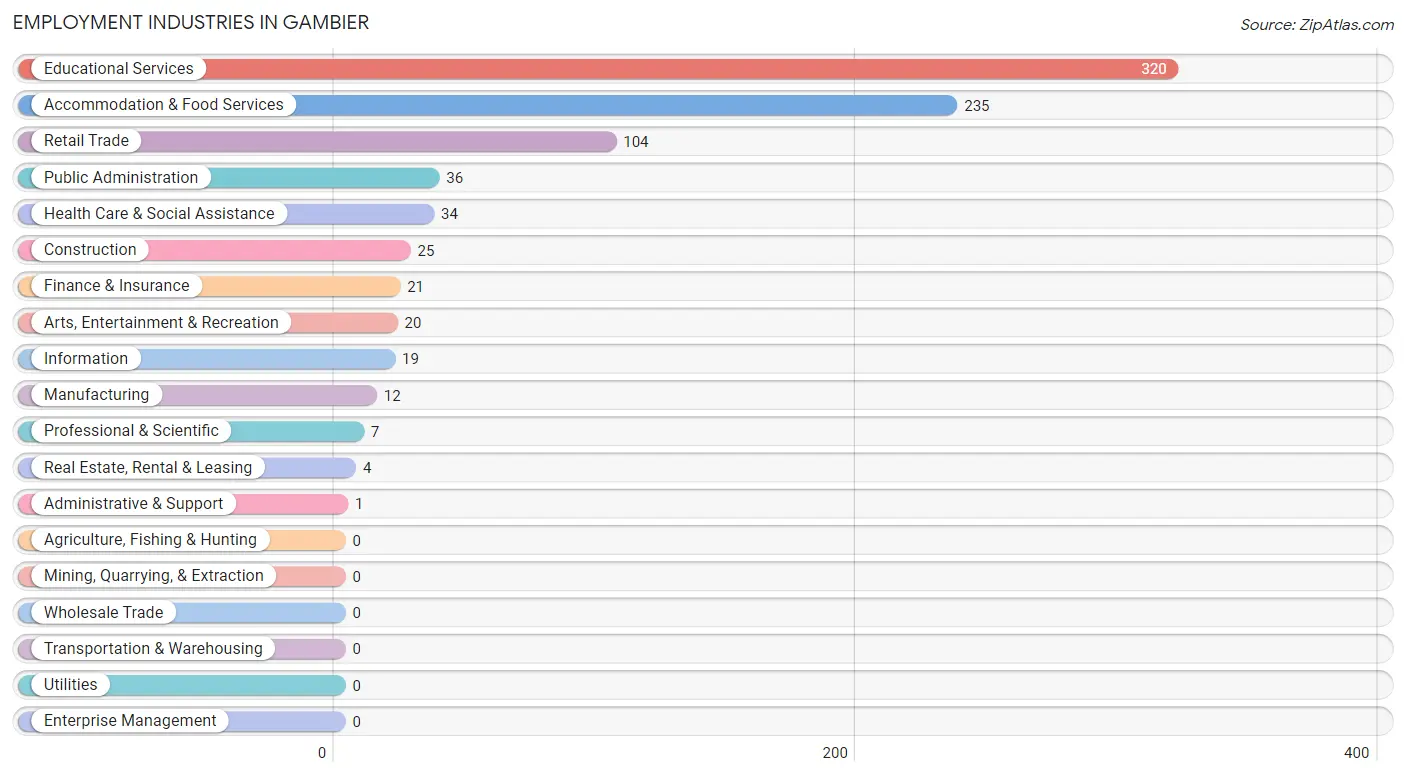
Employment Industries in Gambier
The major employment industries in Gambier include Educational Services (320 | 35.8%), Accommodation & Food Services (235 | 26.3%), Retail Trade (104 | 11.7%), Public Administration (36 | 4.0%), and Health Care & Social Assistance (34 | 3.8%).
Employment Industries by Sex in Gambier
The Gambier industries that see more men than women are Construction (100.0%), Real Estate, Rental & Leasing (100.0%), and Professional & Scientific (100.0%), whereas the industries that tend to have a higher number of women are Administrative & Support (100.0%), Arts, Entertainment & Recreation (100.0%), and Public Administration (100.0%).
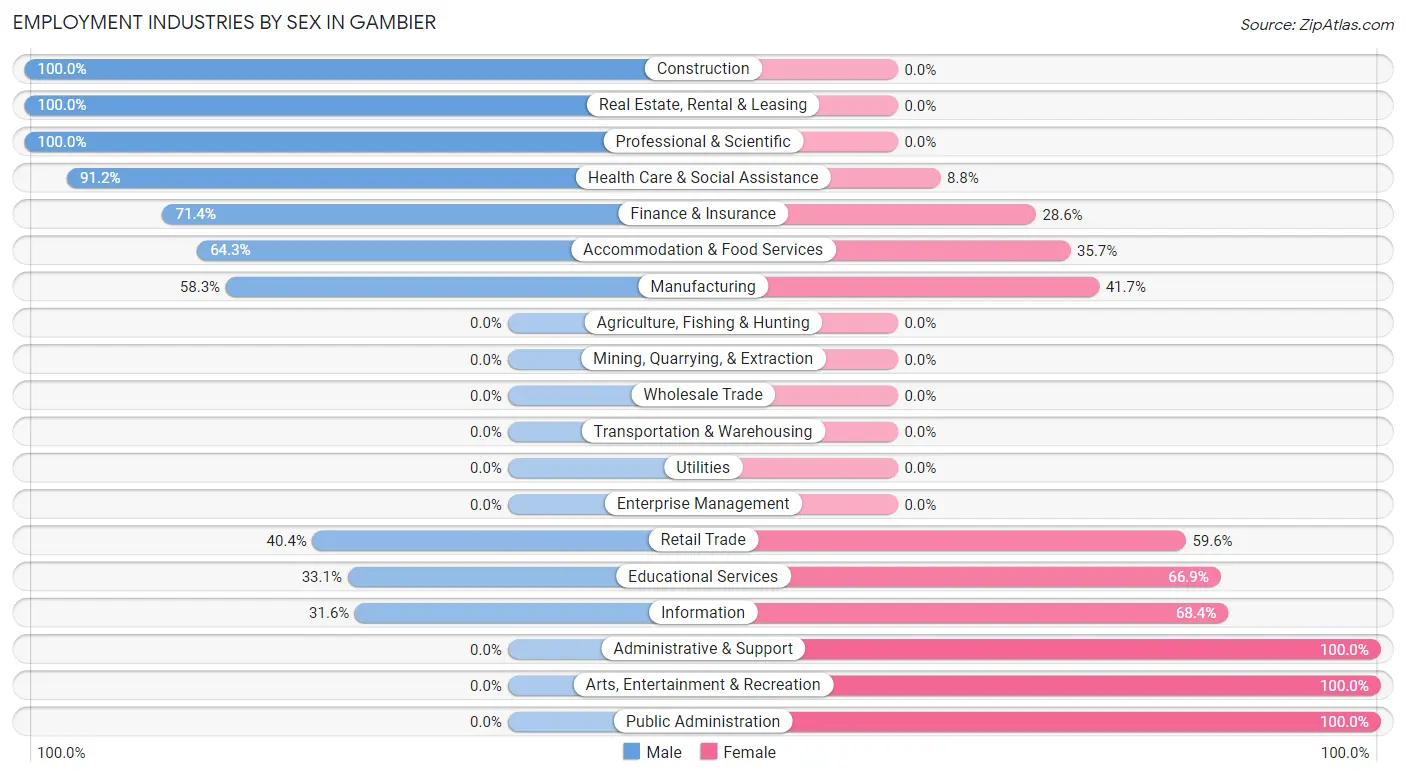
| Industry | Male | Female |
| Agriculture, Fishing & Hunting | 0 (0.0%) | 0 (0.0%) |
| Mining, Quarrying, & Extraction | 0 (0.0%) | 0 (0.0%) |
| Construction | 25 (100.0%) | 0 (0.0%) |
| Manufacturing | 7 (58.3%) | 5 (41.7%) |
| Wholesale Trade | 0 (0.0%) | 0 (0.0%) |
| Retail Trade | 42 (40.4%) | 62 (59.6%) |
| Transportation & Warehousing | 0 (0.0%) | 0 (0.0%) |
| Utilities | 0 (0.0%) | 0 (0.0%) |
| Information | 6 (31.6%) | 13 (68.4%) |
| Finance & Insurance | 15 (71.4%) | 6 (28.6%) |
| Real Estate, Rental & Leasing | 4 (100.0%) | 0 (0.0%) |
| Professional & Scientific | 7 (100.0%) | 0 (0.0%) |
| Enterprise Management | 0 (0.0%) | 0 (0.0%) |
| Administrative & Support | 0 (0.0%) | 1 (100.0%) |
| Educational Services | 106 (33.1%) | 214 (66.9%) |
| Health Care & Social Assistance | 31 (91.2%) | 3 (8.8%) |
| Arts, Entertainment & Recreation | 0 (0.0%) | 20 (100.0%) |
| Accommodation & Food Services | 151 (64.3%) | 84 (35.7%) |
| Public Administration | 0 (0.0%) | 36 (100.0%) |
| Total | 416 (46.6%) | 477 (53.4%) |
Education in Gambier
School Enrollment in Gambier
The most common levels of schooling among the 1,634 students in Gambier are college / undergraduate (1,618 | 99.0%), high school (7 | 0.4%), and graduate / professional (7 | 0.4%).
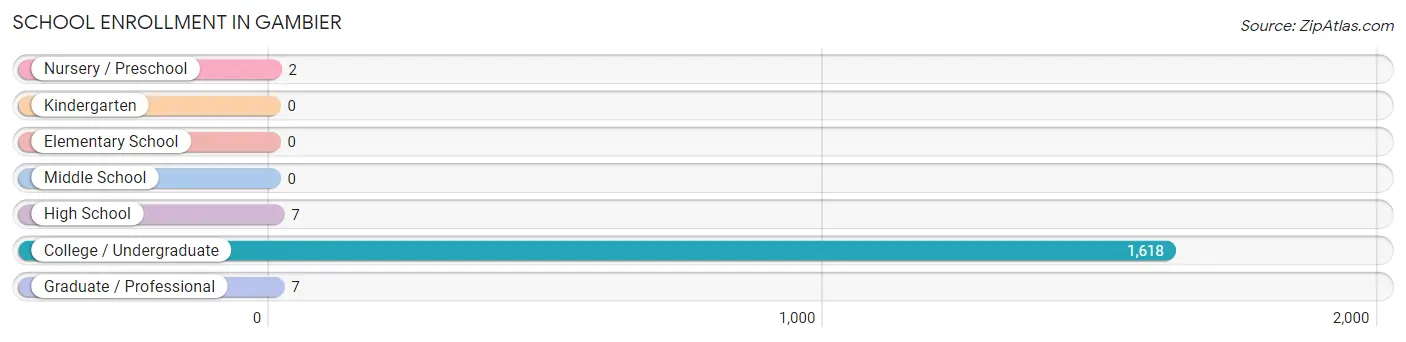
| School Level | # Students | % Students |
| Nursery / Preschool | 2 | 0.1% |
| Kindergarten | 0 | 0.0% |
| Elementary School | 0 | 0.0% |
| Middle School | 0 | 0.0% |
| High School | 7 | 0.4% |
| College / Undergraduate | 1,618 | 99.0% |
| Graduate / Professional | 7 | 0.4% |
| Total | 1,634 | 100.0% |
School Enrollment by Age by Funding Source in Gambier
Out of a total of 1,634 students who are enrolled in schools in Gambier, 1,580 (96.7%) attend a private institution, while the remaining 54 (3.3%) are enrolled in public schools. The age group of 3 to 4 year olds has the highest likelihood of being enrolled in private schools, with 2 (100.0% in the age bracket) enrolled. Conversely, the age group of 10 to 14 year olds has the lowest likelihood of being enrolled in a private school, with 7 (100.0% in the age bracket) attending a public institution.
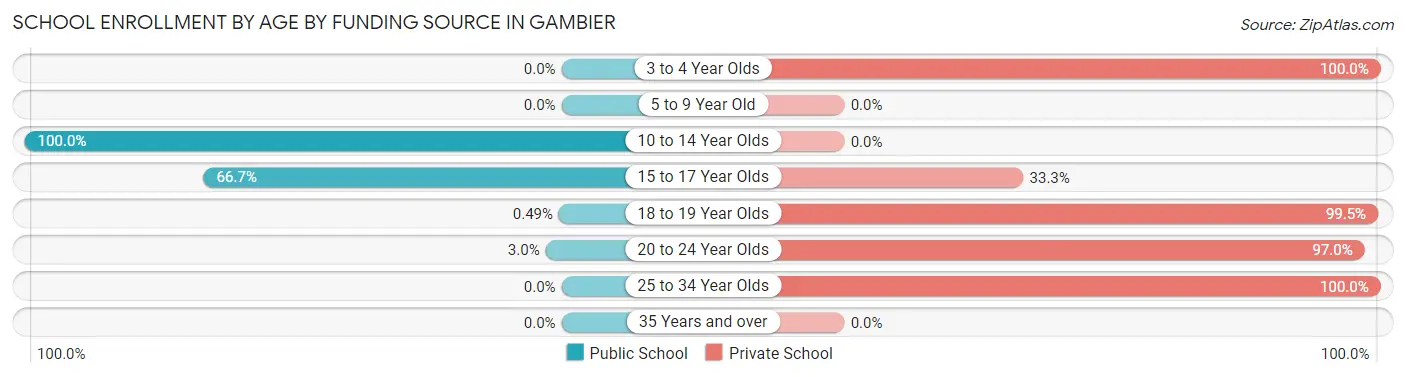
| Age Bracket | Public School | Private School |
| 3 to 4 Year Olds | 0 (0.0%) | 2 (100.0%) |
| 5 to 9 Year Old | 0 (0.0%) | 0 (0.0%) |
| 10 to 14 Year Olds | 7 (100.0%) | 0 (0.0%) |
| 15 to 17 Year Olds | 20 (66.7%) | 10 (33.3%) |
| 18 to 19 Year Olds | 4 (0.5%) | 813 (99.5%) |
| 20 to 24 Year Olds | 23 (3.0%) | 748 (97.0%) |
| 25 to 34 Year Olds | 0 (0.0%) | 7 (100.0%) |
| 35 Years and over | 0 (0.0%) | 0 (0.0%) |
| Total | 54 (3.3%) | 1,580 (96.7%) |
Educational Attainment by Field of Study in Gambier
Visual & performing arts (67 | 23.0%), literature & languages (60 | 20.6%), liberal arts & history (41 | 14.1%), education (33 | 11.3%), and business (23 | 7.9%) are the most common fields of study among 291 individuals in Gambier who have obtained a bachelor's degree or higher.
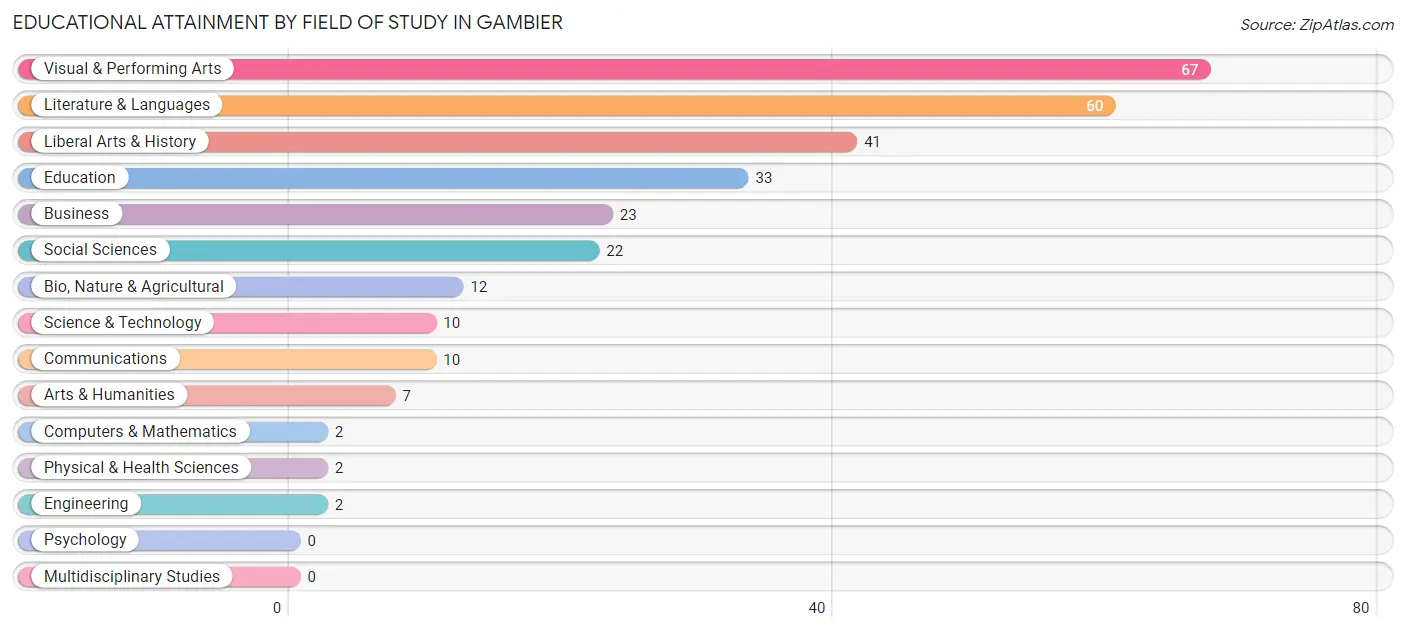
| Field of Study | # Graduates | % Graduates |
| Computers & Mathematics | 2 | 0.7% |
| Bio, Nature & Agricultural | 12 | 4.1% |
| Physical & Health Sciences | 2 | 0.7% |
| Psychology | 0 | 0.0% |
| Social Sciences | 22 | 7.6% |
| Engineering | 2 | 0.7% |
| Multidisciplinary Studies | 0 | 0.0% |
| Science & Technology | 10 | 3.4% |
| Business | 23 | 7.9% |
| Education | 33 | 11.3% |
| Literature & Languages | 60 | 20.6% |
| Liberal Arts & History | 41 | 14.1% |
| Visual & Performing Arts | 67 | 23.0% |
| Communications | 10 | 3.4% |
| Arts & Humanities | 7 | 2.4% |
| Total | 291 | 100.0% |
Transportation & Commute in Gambier
Vehicle Availability by Sex in Gambier
The most prevalent vehicle ownership categories in Gambier are males with 2 vehicles (47, accounting for 40.2%) and females with 2 vehicles (27, making up 39.5%).
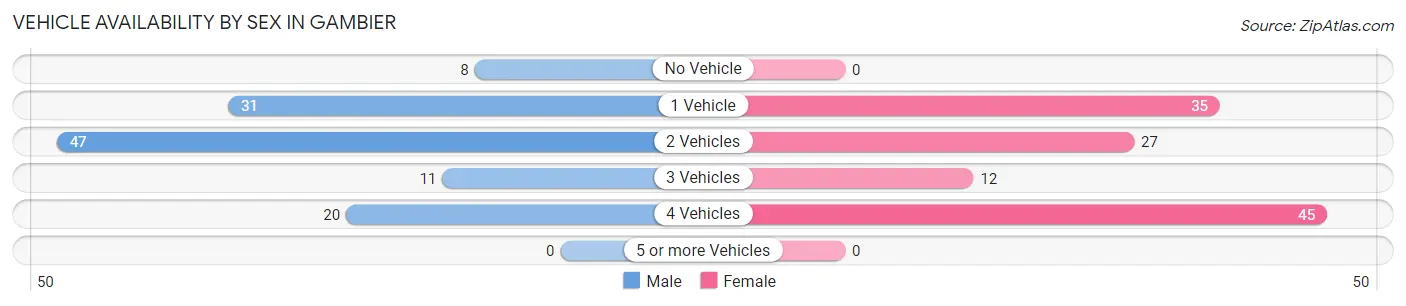
| Vehicles Available | Male | Female |
| No Vehicle | 8 (6.8%) | 0 (0.0%) |
| 1 Vehicle | 31 (26.5%) | 35 (29.4%) |
| 2 Vehicles | 47 (40.2%) | 27 (22.7%) |
| 3 Vehicles | 11 (9.4%) | 12 (10.1%) |
| 4 Vehicles | 20 (17.1%) | 45 (37.8%) |
| 5 or more Vehicles | 0 (0.0%) | 0 (0.0%) |
| Total | 117 (100.0%) | 119 (100.0%) |
Commute Time in Gambier
The most frequently occuring commute durations in Gambier are 5 to 9 minutes (327 commuters, 48.8%), 10 to 14 minutes (152 commuters, 22.7%), and less than 5 minutes (91 commuters, 13.6%).
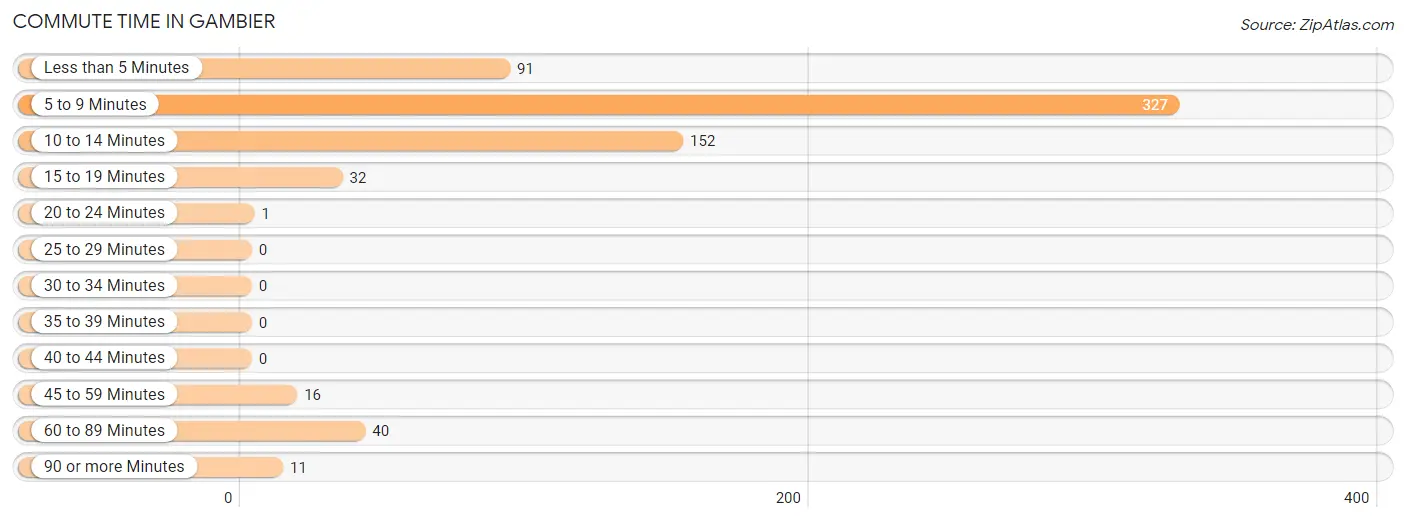
| Commute Time | # Commuters | % Commuters |
| Less than 5 Minutes | 91 | 13.6% |
| 5 to 9 Minutes | 327 | 48.8% |
| 10 to 14 Minutes | 152 | 22.7% |
| 15 to 19 Minutes | 32 | 4.8% |
| 20 to 24 Minutes | 1 | 0.2% |
| 25 to 29 Minutes | 0 | 0.0% |
| 30 to 34 Minutes | 0 | 0.0% |
| 35 to 39 Minutes | 0 | 0.0% |
| 40 to 44 Minutes | 0 | 0.0% |
| 45 to 59 Minutes | 16 | 2.4% |
| 60 to 89 Minutes | 40 | 6.0% |
| 90 or more Minutes | 11 | 1.6% |
Commute Time by Sex in Gambier
The most common commute times in Gambier are 5 to 9 minutes (150 commuters, 51.4%) for males and 5 to 9 minutes (177 commuters, 46.8%) for females.
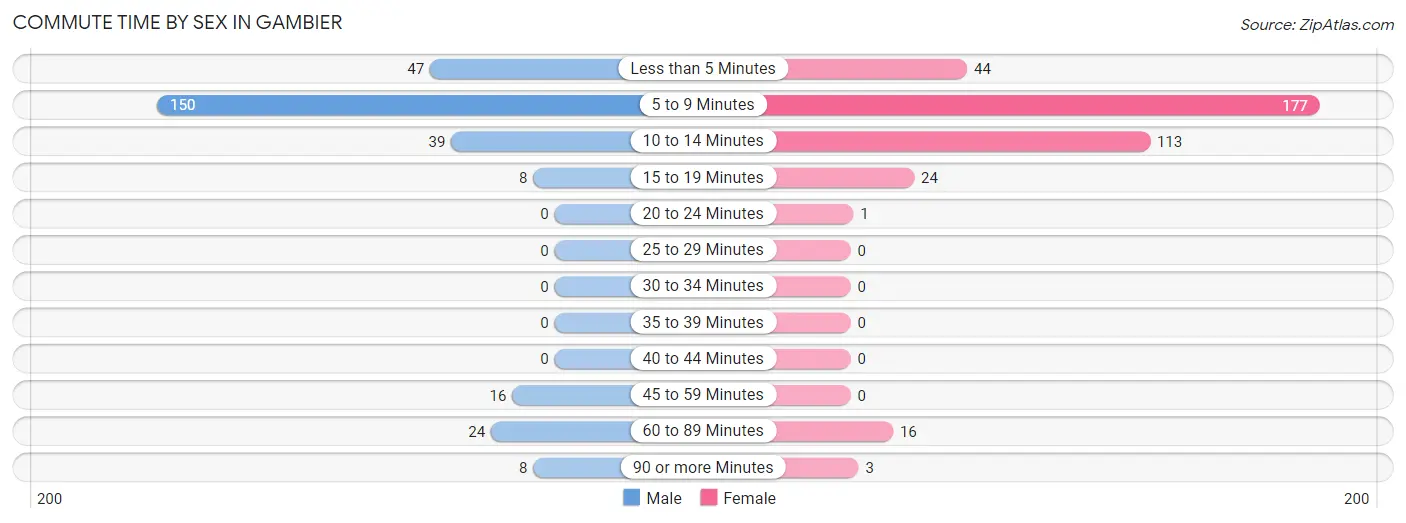
| Commute Time | Male | Female |
| Less than 5 Minutes | 47 (16.1%) | 44 (11.6%) |
| 5 to 9 Minutes | 150 (51.4%) | 177 (46.8%) |
| 10 to 14 Minutes | 39 (13.4%) | 113 (29.9%) |
| 15 to 19 Minutes | 8 (2.7%) | 24 (6.4%) |
| 20 to 24 Minutes | 0 (0.0%) | 1 (0.3%) |
| 25 to 29 Minutes | 0 (0.0%) | 0 (0.0%) |
| 30 to 34 Minutes | 0 (0.0%) | 0 (0.0%) |
| 35 to 39 Minutes | 0 (0.0%) | 0 (0.0%) |
| 40 to 44 Minutes | 0 (0.0%) | 0 (0.0%) |
| 45 to 59 Minutes | 16 (5.5%) | 0 (0.0%) |
| 60 to 89 Minutes | 24 (8.2%) | 16 (4.2%) |
| 90 or more Minutes | 8 (2.7%) | 3 (0.8%) |
Time of Departure to Work by Sex in Gambier
The most frequent times of departure to work in Gambier are 9:00 AM to 9:59 AM (58, 19.9%) for males and 4:00 PM to 11:59 PM (152, 40.2%) for females.
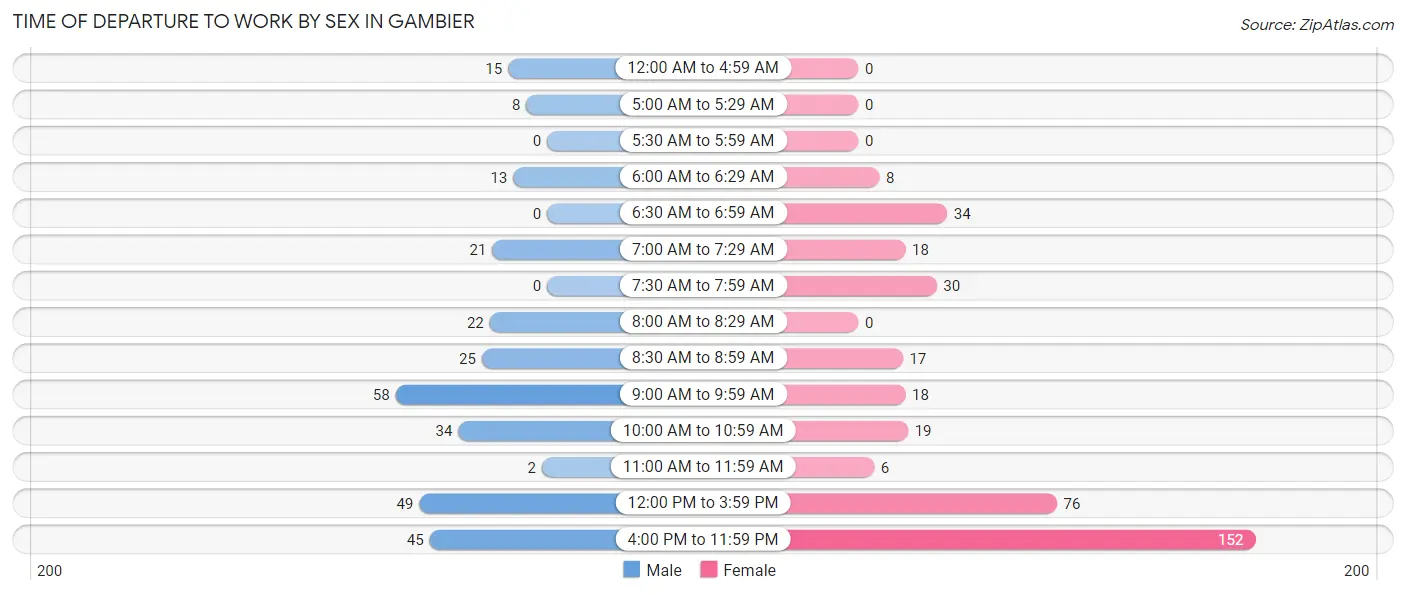
| Time of Departure | Male | Female |
| 12:00 AM to 4:59 AM | 15 (5.1%) | 0 (0.0%) |
| 5:00 AM to 5:29 AM | 8 (2.7%) | 0 (0.0%) |
| 5:30 AM to 5:59 AM | 0 (0.0%) | 0 (0.0%) |
| 6:00 AM to 6:29 AM | 13 (4.4%) | 8 (2.1%) |
| 6:30 AM to 6:59 AM | 0 (0.0%) | 34 (9.0%) |
| 7:00 AM to 7:29 AM | 21 (7.2%) | 18 (4.8%) |
| 7:30 AM to 7:59 AM | 0 (0.0%) | 30 (7.9%) |
| 8:00 AM to 8:29 AM | 22 (7.5%) | 0 (0.0%) |
| 8:30 AM to 8:59 AM | 25 (8.6%) | 17 (4.5%) |
| 9:00 AM to 9:59 AM | 58 (19.9%) | 18 (4.8%) |
| 10:00 AM to 10:59 AM | 34 (11.6%) | 19 (5.0%) |
| 11:00 AM to 11:59 AM | 2 (0.7%) | 6 (1.6%) |
| 12:00 PM to 3:59 PM | 49 (16.8%) | 76 (20.1%) |
| 4:00 PM to 11:59 PM | 45 (15.4%) | 152 (40.2%) |
| Total | 292 (100.0%) | 378 (100.0%) |
Housing Occupancy in Gambier
Occupancy by Ownership in Gambier
Of the total 215 dwellings in Gambier, owner-occupied units account for 149 (69.3%), while renter-occupied units make up 66 (30.7%).
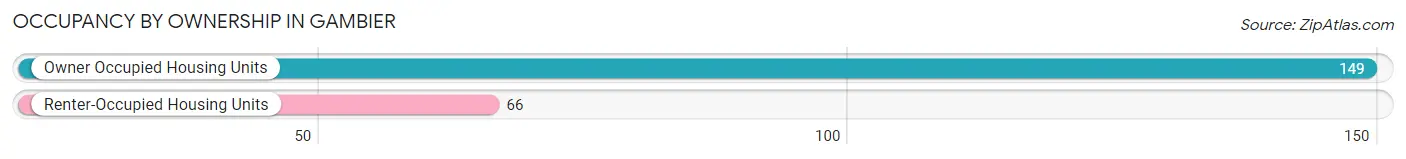
| Occupancy | # Housing Units | % Housing Units |
| Owner Occupied Housing Units | 149 | 69.3% |
| Renter-Occupied Housing Units | 66 | 30.7% |
| Total Occupied Housing Units | 215 | 100.0% |
Occupancy by Household Size in Gambier
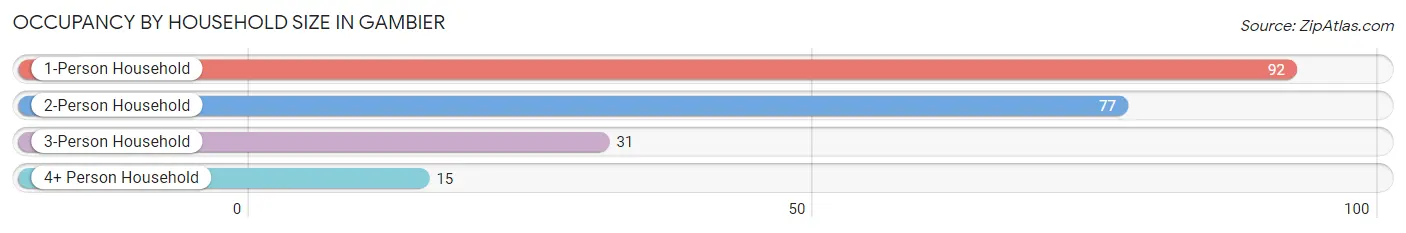
| Household Size | # Housing Units | % Housing Units |
| 1-Person Household | 92 | 42.8% |
| 2-Person Household | 77 | 35.8% |
| 3-Person Household | 31 | 14.4% |
| 4+ Person Household | 15 | 7.0% |
| Total Housing Units | 215 | 100.0% |
Occupancy by Ownership by Household Size in Gambier
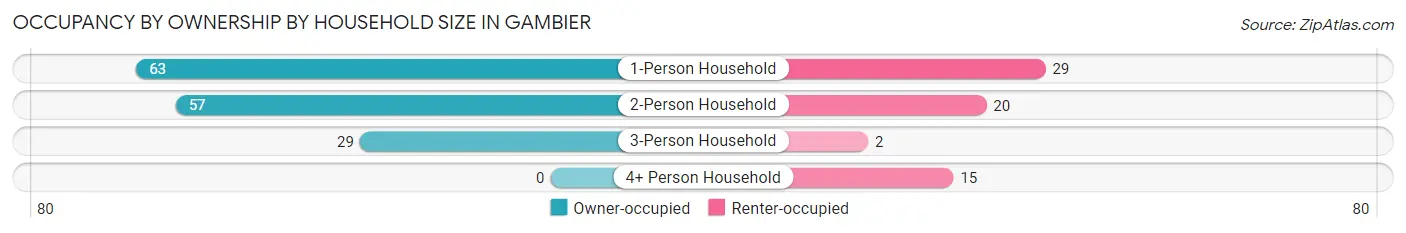
| Household Size | Owner-occupied | Renter-occupied |
| 1-Person Household | 63 (68.5%) | 29 (31.5%) |
| 2-Person Household | 57 (74.0%) | 20 (26.0%) |
| 3-Person Household | 29 (93.5%) | 2 (6.5%) |
| 4+ Person Household | 0 (0.0%) | 15 (100.0%) |
| Total Housing Units | 149 (69.3%) | 66 (30.7%) |
Occupancy by Educational Attainment in Gambier
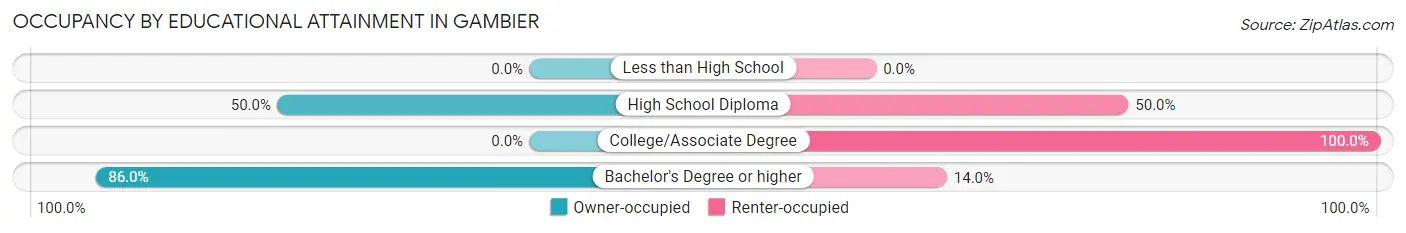
| Household Size | Owner-occupied | Renter-occupied |
| Less than High School | 0 (0.0%) | 0 (0.0%) |
| High School Diploma | 8 (50.0%) | 8 (50.0%) |
| College/Associate Degree | 0 (0.0%) | 35 (100.0%) |
| Bachelor's Degree or higher | 141 (86.0%) | 23 (14.0%) |
Occupancy by Age of Householder in Gambier
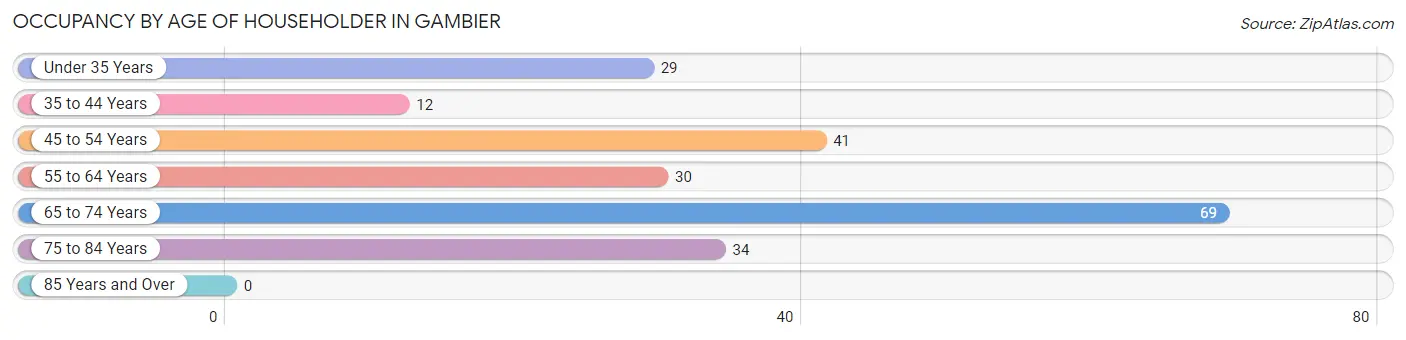
| Age Bracket | # Households | % Households |
| Under 35 Years | 29 | 13.5% |
| 35 to 44 Years | 12 | 5.6% |
| 45 to 54 Years | 41 | 19.1% |
| 55 to 64 Years | 30 | 14.0% |
| 65 to 74 Years | 69 | 32.1% |
| 75 to 84 Years | 34 | 15.8% |
| 85 Years and Over | 0 | 0.0% |
| Total | 215 | 100.0% |
Housing Finances in Gambier
Median Income by Occupancy in Gambier
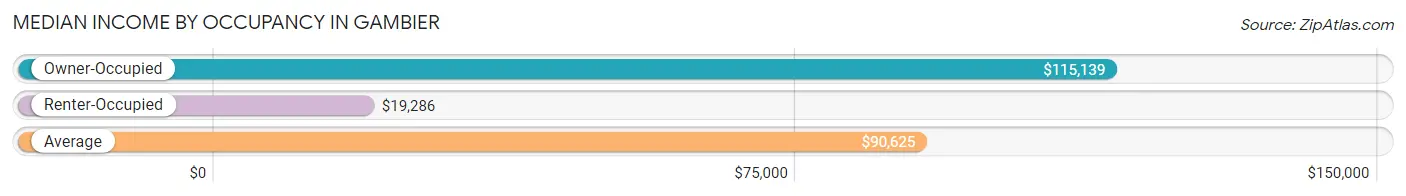
| Occupancy Type | # Households | Median Income |
| Owner-Occupied | 149 (69.3%) | $115,139 |
| Renter-Occupied | 66 (30.7%) | $19,286 |
| Average | 215 (100.0%) | $90,625 |
Occupancy by Householder Income Bracket in Gambier
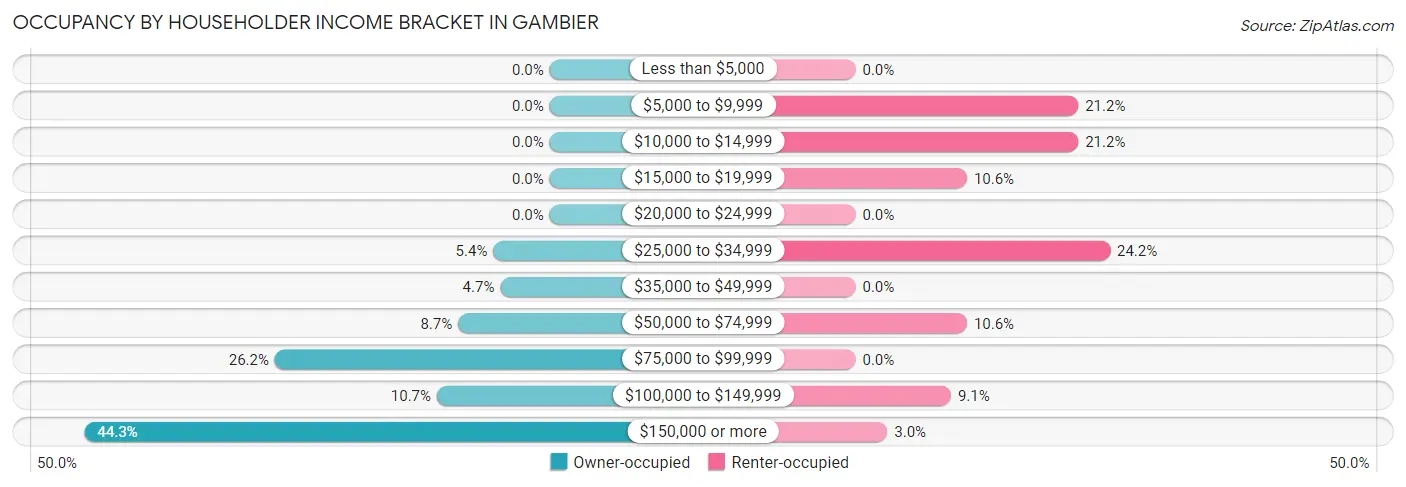
| Income Bracket | Owner-occupied | Renter-occupied |
| Less than $5,000 | 0 (0.0%) | 0 (0.0%) |
| $5,000 to $9,999 | 0 (0.0%) | 14 (21.2%) |
| $10,000 to $14,999 | 0 (0.0%) | 14 (21.2%) |
| $15,000 to $19,999 | 0 (0.0%) | 7 (10.6%) |
| $20,000 to $24,999 | 0 (0.0%) | 0 (0.0%) |
| $25,000 to $34,999 | 8 (5.4%) | 16 (24.2%) |
| $35,000 to $49,999 | 7 (4.7%) | 0 (0.0%) |
| $50,000 to $74,999 | 13 (8.7%) | 7 (10.6%) |
| $75,000 to $99,999 | 39 (26.2%) | 0 (0.0%) |
| $100,000 to $149,999 | 16 (10.7%) | 6 (9.1%) |
| $150,000 or more | 66 (44.3%) | 2 (3.0%) |
| Total | 149 (100.0%) | 66 (100.0%) |
Monthly Housing Cost Tiers in Gambier
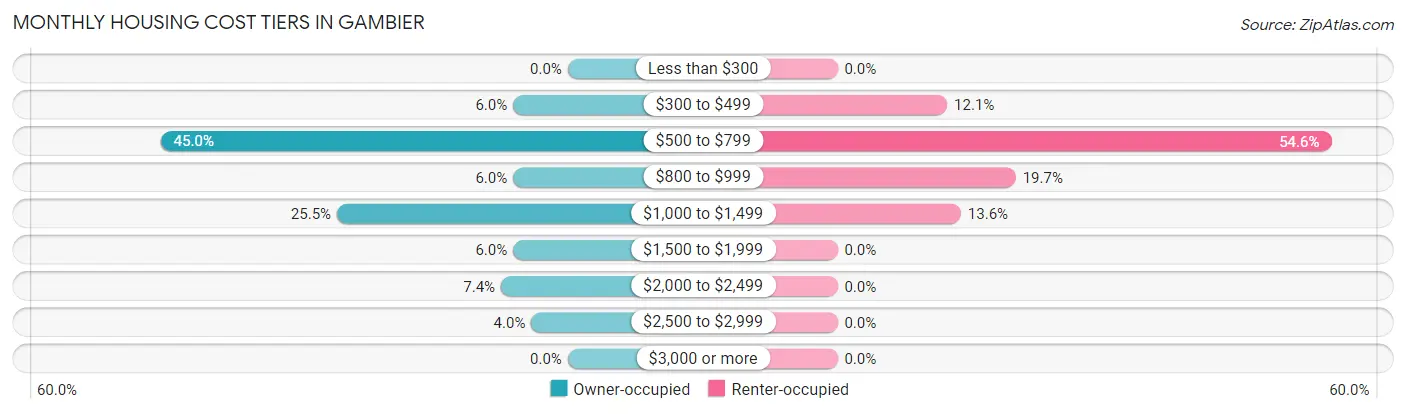
| Monthly Cost | Owner-occupied | Renter-occupied |
| Less than $300 | 0 (0.0%) | 0 (0.0%) |
| $300 to $499 | 9 (6.0%) | 8 (12.1%) |
| $500 to $799 | 67 (45.0%) | 36 (54.5%) |
| $800 to $999 | 9 (6.0%) | 13 (19.7%) |
| $1,000 to $1,499 | 38 (25.5%) | 9 (13.6%) |
| $1,500 to $1,999 | 9 (6.0%) | 0 (0.0%) |
| $2,000 to $2,499 | 11 (7.4%) | 0 (0.0%) |
| $2,500 to $2,999 | 6 (4.0%) | 0 (0.0%) |
| $3,000 or more | 0 (0.0%) | 0 (0.0%) |
| Total | 149 (100.0%) | 66 (100.0%) |
Physical Housing Characteristics in Gambier
Housing Structures in Gambier
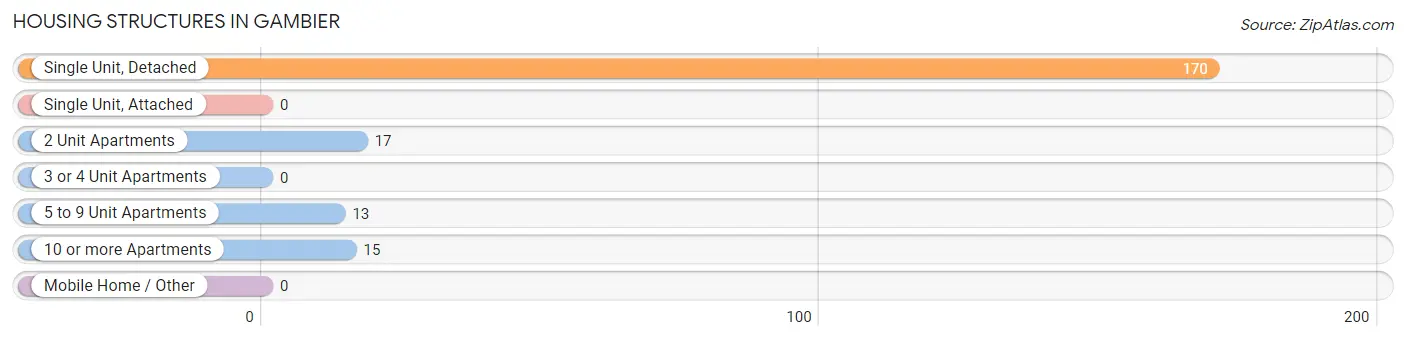
| Structure Type | # Housing Units | % Housing Units |
| Single Unit, Detached | 170 | 79.1% |
| Single Unit, Attached | 0 | 0.0% |
| 2 Unit Apartments | 17 | 7.9% |
| 3 or 4 Unit Apartments | 0 | 0.0% |
| 5 to 9 Unit Apartments | 13 | 6.0% |
| 10 or more Apartments | 15 | 7.0% |
| Mobile Home / Other | 0 | 0.0% |
| Total | 215 | 100.0% |
Housing Structures by Occupancy in Gambier

| Structure Type | Owner-occupied | Renter-occupied |
| Single Unit, Detached | 149 (87.6%) | 21 (12.3%) |
| Single Unit, Attached | 0 (0.0%) | 0 (0.0%) |
| 2 Unit Apartments | 0 (0.0%) | 17 (100.0%) |
| 3 or 4 Unit Apartments | 0 (0.0%) | 0 (0.0%) |
| 5 to 9 Unit Apartments | 0 (0.0%) | 13 (100.0%) |
| 10 or more Apartments | 0 (0.0%) | 15 (100.0%) |
| Mobile Home / Other | 0 (0.0%) | 0 (0.0%) |
| Total | 149 (69.3%) | 66 (30.7%) |
Housing Structures by Number of Rooms in Gambier
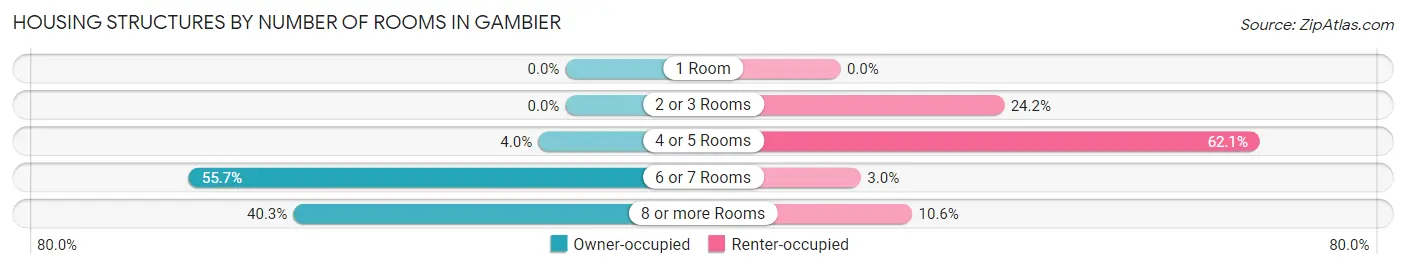
| Number of Rooms | Owner-occupied | Renter-occupied |
| 1 Room | 0 (0.0%) | 0 (0.0%) |
| 2 or 3 Rooms | 0 (0.0%) | 16 (24.2%) |
| 4 or 5 Rooms | 6 (4.0%) | 41 (62.1%) |
| 6 or 7 Rooms | 83 (55.7%) | 2 (3.0%) |
| 8 or more Rooms | 60 (40.3%) | 7 (10.6%) |
| Total | 149 (100.0%) | 66 (100.0%) |
Housing Structure by Heating Type in Gambier
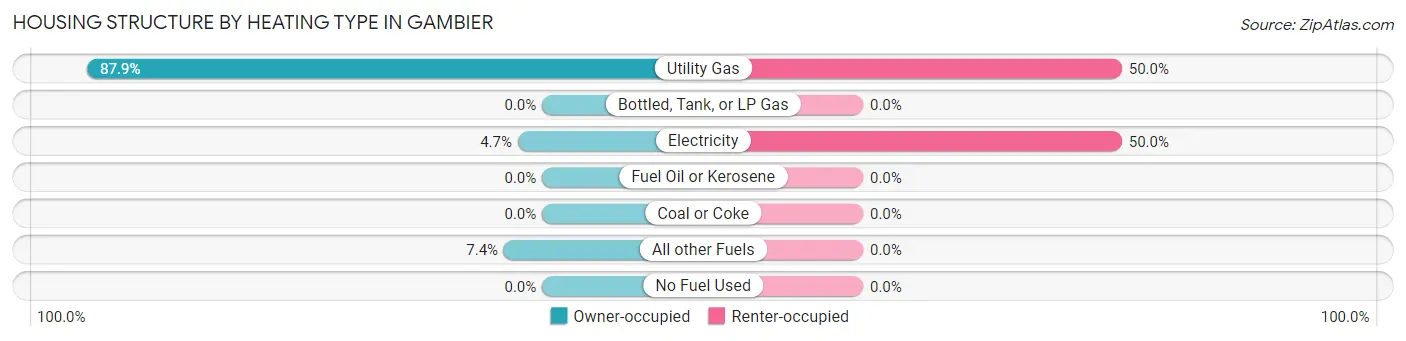
| Heating Type | Owner-occupied | Renter-occupied |
| Utility Gas | 131 (87.9%) | 33 (50.0%) |
| Bottled, Tank, or LP Gas | 0 (0.0%) | 0 (0.0%) |
| Electricity | 7 (4.7%) | 33 (50.0%) |
| Fuel Oil or Kerosene | 0 (0.0%) | 0 (0.0%) |
| Coal or Coke | 0 (0.0%) | 0 (0.0%) |
| All other Fuels | 11 (7.4%) | 0 (0.0%) |
| No Fuel Used | 0 (0.0%) | 0 (0.0%) |
| Total | 149 (100.0%) | 66 (100.0%) |
Household Vehicle Usage in Gambier
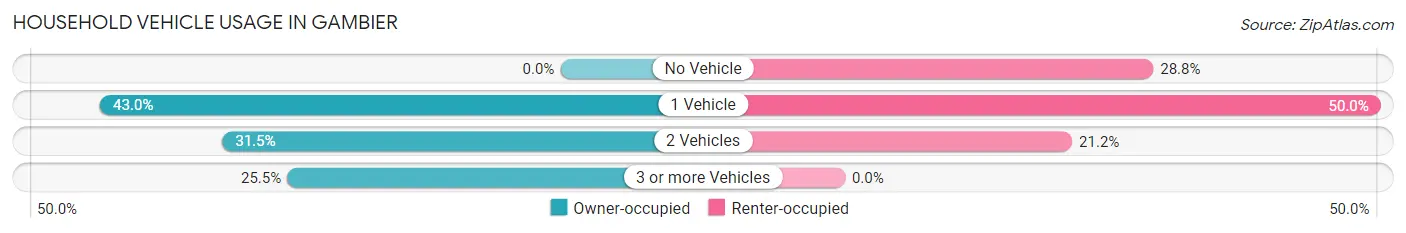
| Vehicles per Household | Owner-occupied | Renter-occupied |
| No Vehicle | 0 (0.0%) | 19 (28.8%) |
| 1 Vehicle | 64 (42.9%) | 33 (50.0%) |
| 2 Vehicles | 47 (31.5%) | 14 (21.2%) |
| 3 or more Vehicles | 38 (25.5%) | 0 (0.0%) |
| Total | 149 (100.0%) | 66 (100.0%) |
Real Estate & Mortgages in Gambier
Real Estate and Mortgage Overview in Gambier
| Characteristic | Without Mortgage | With Mortgage |
| Housing Units | 96 | 53 |
| Median Property Value | $273,000 | $305,800 |
| Median Household Income | - | - |
| Monthly Housing Costs | $711 | $0 |
| Real Estate Taxes | $3,870 | $0 |
Property Value by Mortgage Status in Gambier
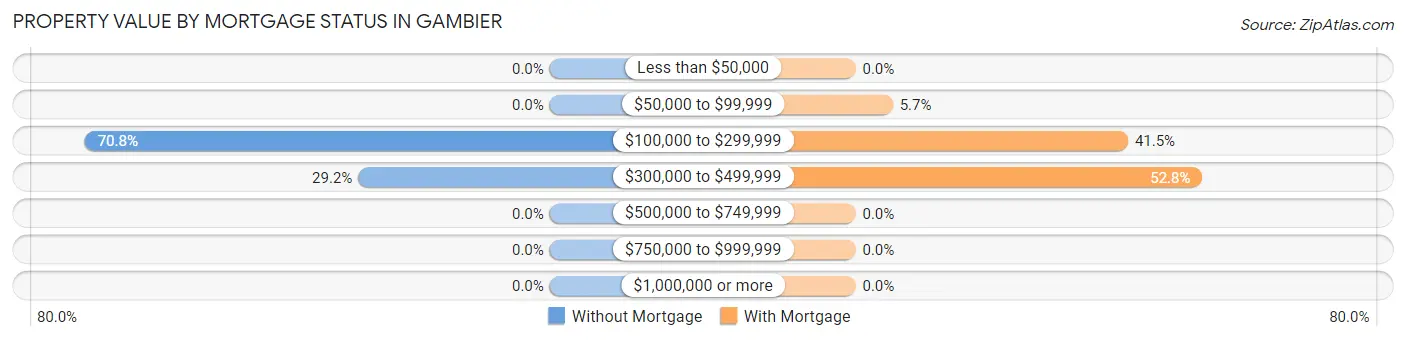
| Property Value | Without Mortgage | With Mortgage |
| Less than $50,000 | 0 (0.0%) | 0 (0.0%) |
| $50,000 to $99,999 | 0 (0.0%) | 3 (5.7%) |
| $100,000 to $299,999 | 68 (70.8%) | 22 (41.5%) |
| $300,000 to $499,999 | 28 (29.2%) | 28 (52.8%) |
| $500,000 to $749,999 | 0 (0.0%) | 0 (0.0%) |
| $750,000 to $999,999 | 0 (0.0%) | 0 (0.0%) |
| $1,000,000 or more | 0 (0.0%) | 0 (0.0%) |
| Total | 96 (100.0%) | 53 (100.0%) |
Household Income by Mortgage Status in Gambier
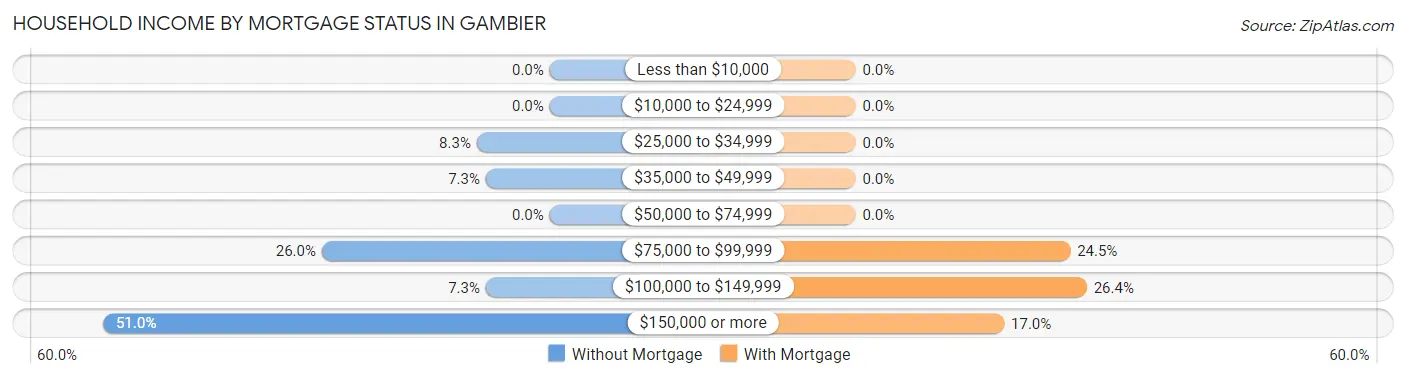
| Household Income | Without Mortgage | With Mortgage |
| Less than $10,000 | 0 (0.0%) | 0 (0.0%) |
| $10,000 to $24,999 | 0 (0.0%) | 0 (0.0%) |
| $25,000 to $34,999 | 8 (8.3%) | 0 (0.0%) |
| $35,000 to $49,999 | 7 (7.3%) | 0 (0.0%) |
| $50,000 to $74,999 | 0 (0.0%) | 0 (0.0%) |
| $75,000 to $99,999 | 25 (26.0%) | 13 (24.5%) |
| $100,000 to $149,999 | 7 (7.3%) | 14 (26.4%) |
| $150,000 or more | 49 (51.0%) | 9 (17.0%) |
| Total | 96 (100.0%) | 53 (100.0%) |
Property Value to Household Income Ratio in Gambier
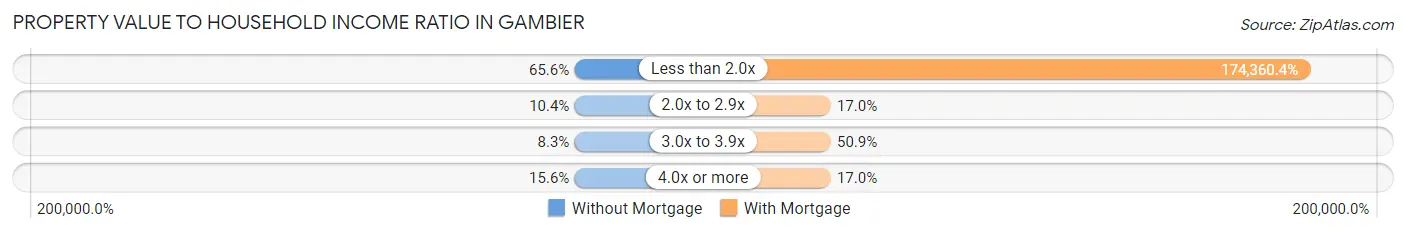
| Value-to-Income Ratio | Without Mortgage | With Mortgage |
| Less than 2.0x | 63 (65.6%) | 92,411 (174,360.4%) |
| 2.0x to 2.9x | 10 (10.4%) | 9 (17.0%) |
| 3.0x to 3.9x | 8 (8.3%) | 27 (50.9%) |
| 4.0x or more | 15 (15.6%) | 9 (17.0%) |
| Total | 96 (100.0%) | 53 (100.0%) |
Real Estate Taxes by Mortgage Status in Gambier
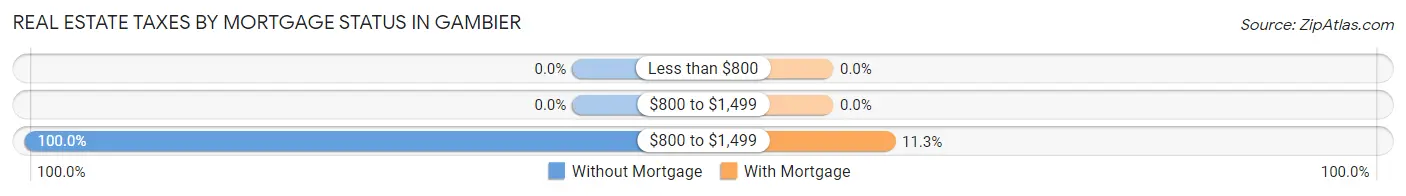
| Property Taxes | Without Mortgage | With Mortgage |
| Less than $800 | 0 (0.0%) | 0 (0.0%) |
| $800 to $1,499 | 0 (0.0%) | 0 (0.0%) |
| $800 to $1,499 | 96 (100.0%) | 6 (11.3%) |
| Total | 96 (100.0%) | 53 (100.0%) |
Health & Disability in Gambier
Health Insurance Coverage by Age in Gambier
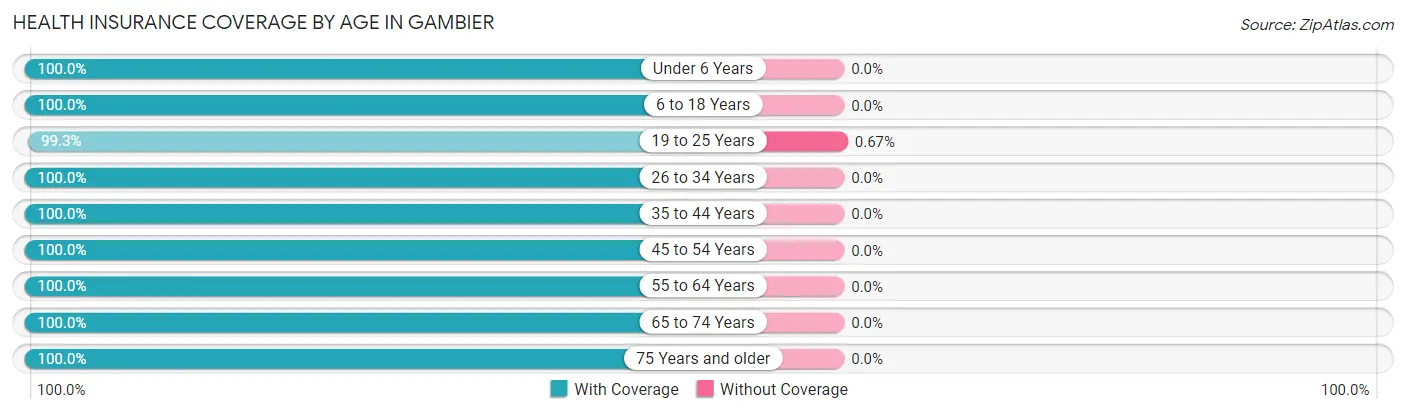
| Age Bracket | With Coverage | Without Coverage |
| Under 6 Years | 30 (100.0%) | 0 (0.0%) |
| 6 to 18 Years | 289 (100.0%) | 0 (0.0%) |
| 19 to 25 Years | 1,328 (99.3%) | 9 (0.7%) |
| 26 to 34 Years | 79 (100.0%) | 0 (0.0%) |
| 35 to 44 Years | 15 (100.0%) | 0 (0.0%) |
| 45 to 54 Years | 71 (100.0%) | 0 (0.0%) |
| 55 to 64 Years | 30 (100.0%) | 0 (0.0%) |
| 65 to 74 Years | 96 (100.0%) | 0 (0.0%) |
| 75 Years and older | 44 (100.0%) | 0 (0.0%) |
| Total | 1,982 (99.6%) | 9 (0.4%) |
Health Insurance Coverage by Citizenship Status in Gambier
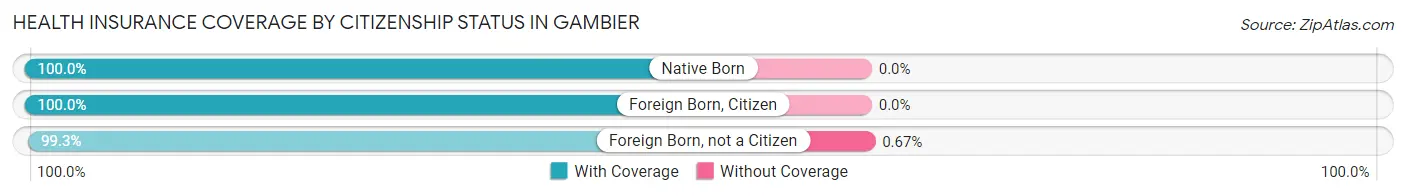
| Citizenship Status | With Coverage | Without Coverage |
| Native Born | 30 (100.0%) | 0 (0.0%) |
| Foreign Born, Citizen | 289 (100.0%) | 0 (0.0%) |
| Foreign Born, not a Citizen | 1,328 (99.3%) | 9 (0.7%) |
Health Insurance Coverage by Household Income in Gambier
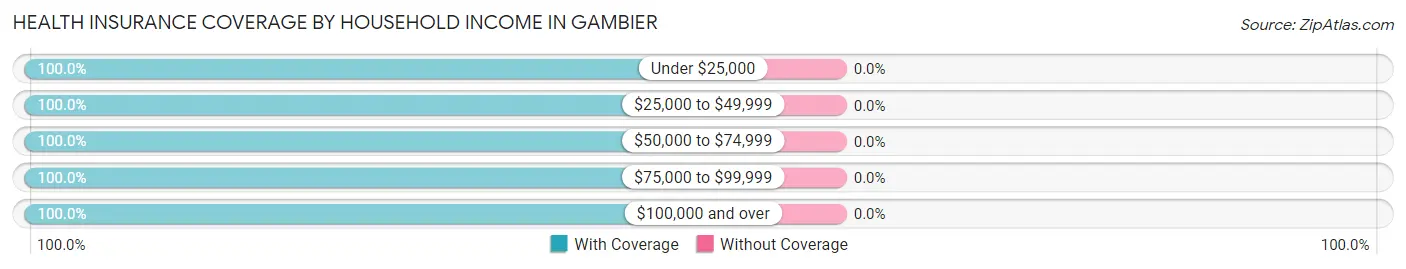
| Household Income | With Coverage | Without Coverage |
| Under $25,000 | 54 (100.0%) | 0 (0.0%) |
| $25,000 to $49,999 | 61 (100.0%) | 0 (0.0%) |
| $50,000 to $74,999 | 54 (100.0%) | 0 (0.0%) |
| $75,000 to $99,999 | 53 (100.0%) | 0 (0.0%) |
| $100,000 and over | 204 (100.0%) | 0 (0.0%) |
Public vs Private Health Insurance Coverage by Age in Gambier
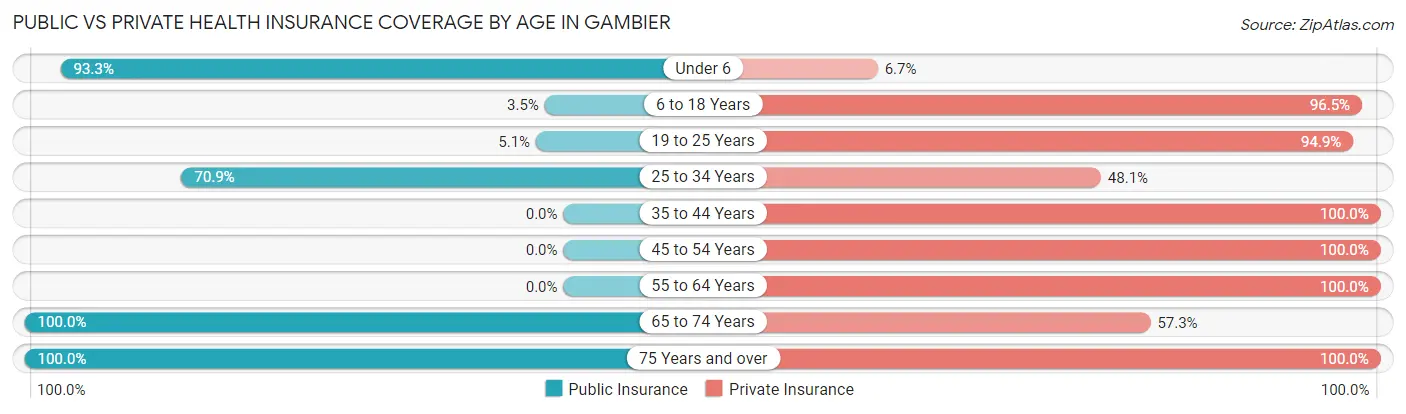
| Age Bracket | Public Insurance | Private Insurance |
| Under 6 | 28 (93.3%) | 2 (6.7%) |
| 6 to 18 Years | 10 (3.5%) | 279 (96.5%) |
| 19 to 25 Years | 68 (5.1%) | 1,269 (94.9%) |
| 25 to 34 Years | 56 (70.9%) | 38 (48.1%) |
| 35 to 44 Years | 0 (0.0%) | 15 (100.0%) |
| 45 to 54 Years | 0 (0.0%) | 71 (100.0%) |
| 55 to 64 Years | 0 (0.0%) | 30 (100.0%) |
| 65 to 74 Years | 96 (100.0%) | 55 (57.3%) |
| 75 Years and over | 44 (100.0%) | 44 (100.0%) |
| Total | 302 (15.2%) | 1,803 (90.6%) |
Disability Status by Sex by Age in Gambier
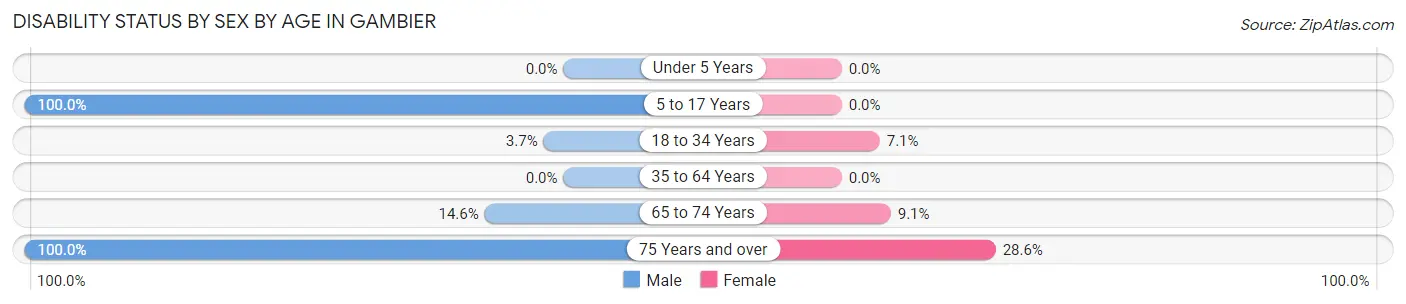
| Age Bracket | Male | Female |
| Under 5 Years | 0 (0.0%) | 0 (0.0%) |
| 5 to 17 Years | 7 (100.0%) | 0 (0.0%) |
| 18 to 34 Years | 27 (3.7%) | 66 (7.0%) |
| 35 to 64 Years | 0 (0.0%) | 0 (0.0%) |
| 65 to 74 Years | 6 (14.6%) | 5 (9.1%) |
| 75 Years and over | 16 (100.0%) | 8 (28.6%) |
Disability Class by Sex by Age in Gambier
Disability Class: Hearing Difficulty
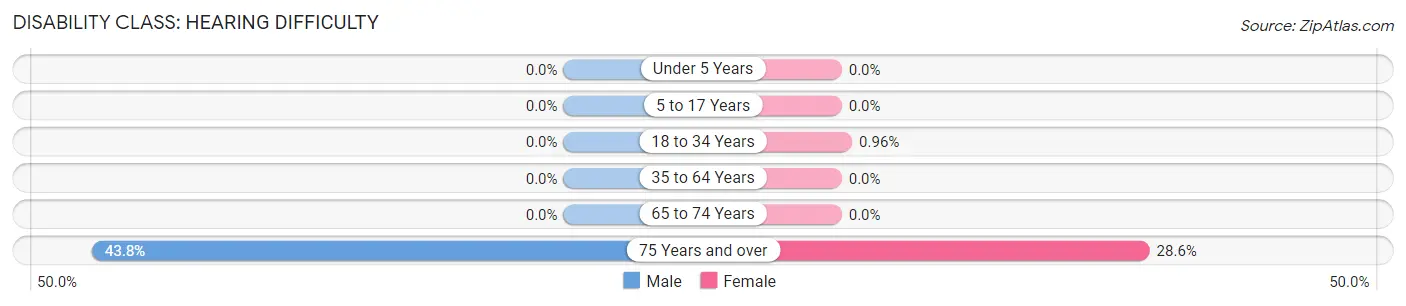
| Age Bracket | Male | Female |
| Under 5 Years | 0 (0.0%) | 0 (0.0%) |
| 5 to 17 Years | 0 (0.0%) | 0 (0.0%) |
| 18 to 34 Years | 0 (0.0%) | 9 (1.0%) |
| 35 to 64 Years | 0 (0.0%) | 0 (0.0%) |
| 65 to 74 Years | 0 (0.0%) | 0 (0.0%) |
| 75 Years and over | 7 (43.8%) | 8 (28.6%) |
Disability Class: Vision Difficulty
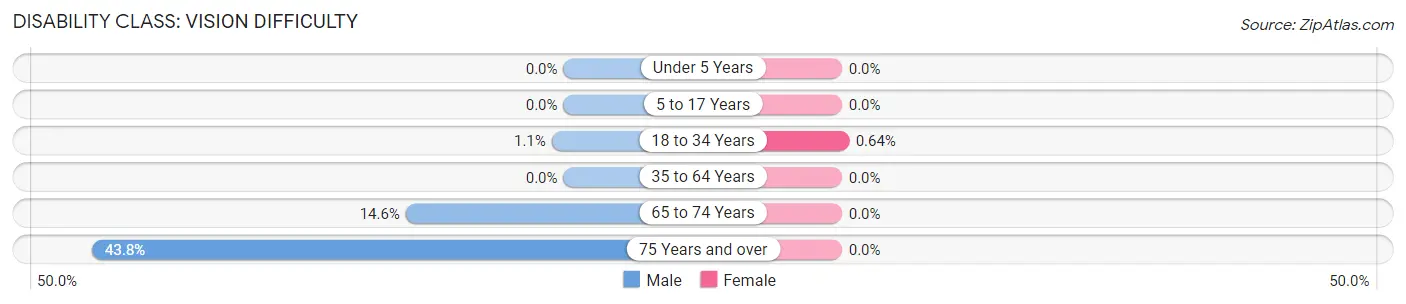
| Age Bracket | Male | Female |
| Under 5 Years | 0 (0.0%) | 0 (0.0%) |
| 5 to 17 Years | 0 (0.0%) | 0 (0.0%) |
| 18 to 34 Years | 8 (1.1%) | 6 (0.6%) |
| 35 to 64 Years | 0 (0.0%) | 0 (0.0%) |
| 65 to 74 Years | 6 (14.6%) | 0 (0.0%) |
| 75 Years and over | 7 (43.8%) | 0 (0.0%) |
Disability Class: Cognitive Difficulty
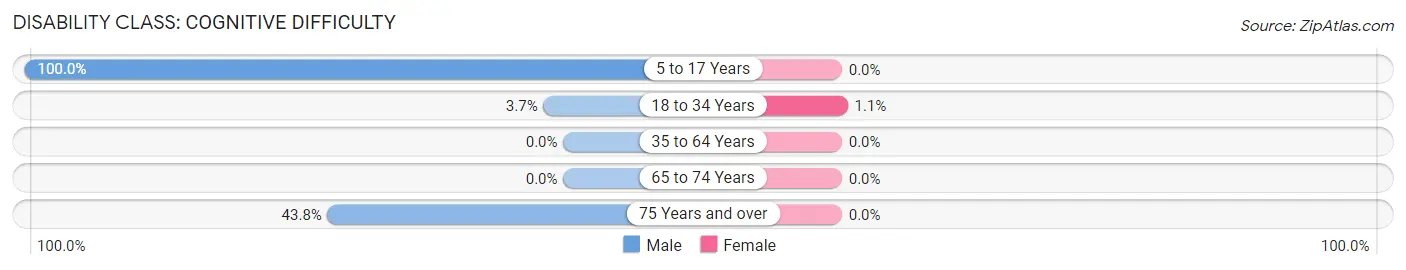
| Age Bracket | Male | Female |
| 5 to 17 Years | 7 (100.0%) | 0 (0.0%) |
| 18 to 34 Years | 27 (3.7%) | 10 (1.1%) |
| 35 to 64 Years | 0 (0.0%) | 0 (0.0%) |
| 65 to 74 Years | 0 (0.0%) | 0 (0.0%) |
| 75 Years and over | 7 (43.8%) | 0 (0.0%) |
Disability Class: Ambulatory Difficulty
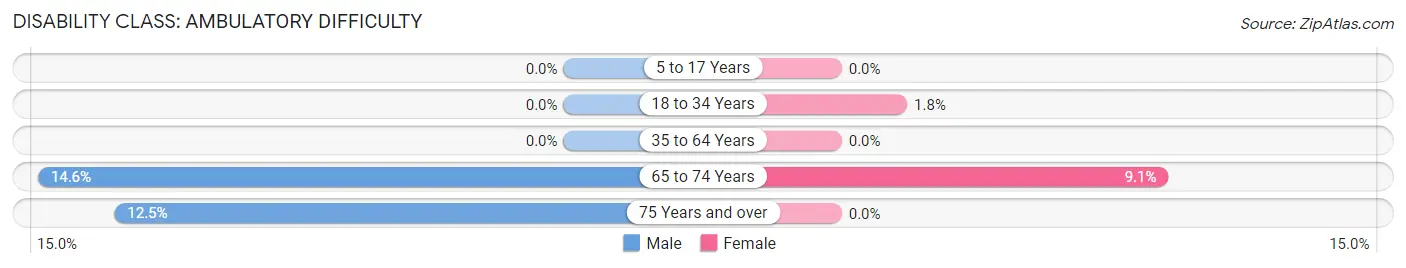
| Age Bracket | Male | Female |
| 5 to 17 Years | 0 (0.0%) | 0 (0.0%) |
| 18 to 34 Years | 0 (0.0%) | 17 (1.8%) |
| 35 to 64 Years | 0 (0.0%) | 0 (0.0%) |
| 65 to 74 Years | 6 (14.6%) | 5 (9.1%) |
| 75 Years and over | 2 (12.5%) | 0 (0.0%) |
Disability Class: Self-Care Difficulty
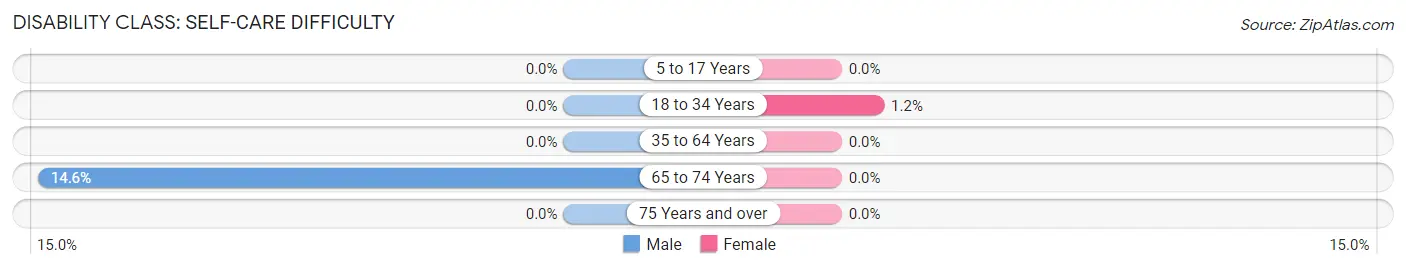
| Age Bracket | Male | Female |
| 5 to 17 Years | 0 (0.0%) | 0 (0.0%) |
| 18 to 34 Years | 0 (0.0%) | 11 (1.2%) |
| 35 to 64 Years | 0 (0.0%) | 0 (0.0%) |
| 65 to 74 Years | 6 (14.6%) | 0 (0.0%) |
| 75 Years and over | 0 (0.0%) | 0 (0.0%) |
Technology Access in Gambier
Computing Device Access in Gambier
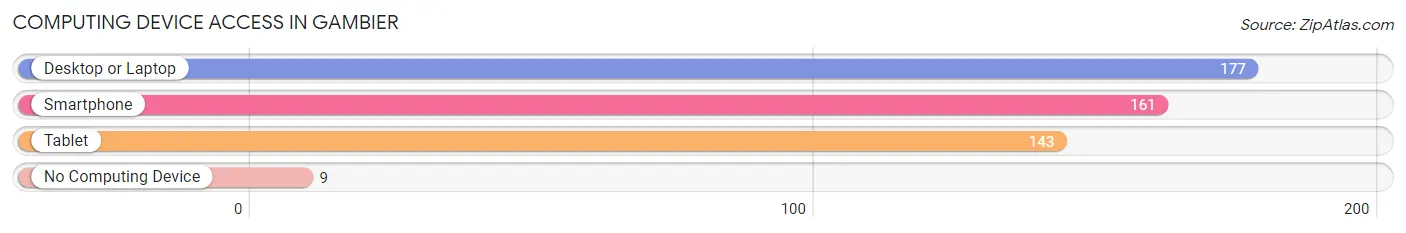
| Device Type | # Households | % Households |
| Desktop or Laptop | 177 | 82.3% |
| Smartphone | 161 | 74.9% |
| Tablet | 143 | 66.5% |
| No Computing Device | 9 | 4.2% |
| Total | 215 | 100.0% |
Internet Access in Gambier
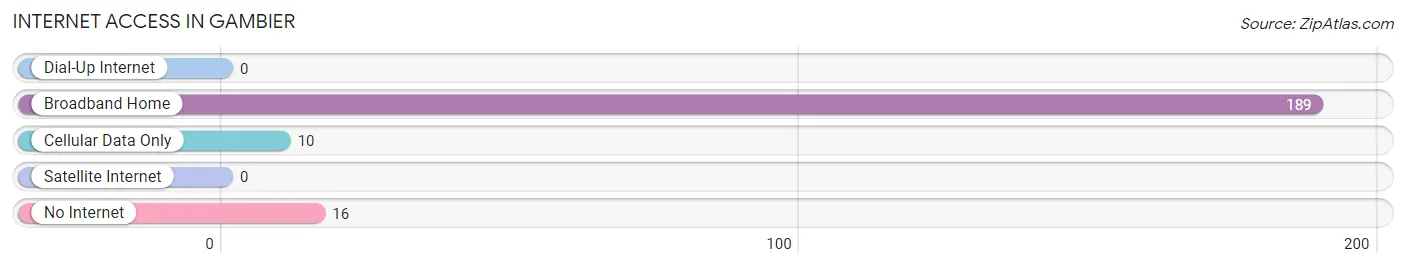
| Internet Type | # Households | % Households |
| Dial-Up Internet | 0 | 0.0% |
| Broadband Home | 189 | 87.9% |
| Cellular Data Only | 10 | 4.6% |
| Satellite Internet | 0 | 0.0% |
| No Internet | 16 | 7.4% |
| Total | 215 | 100.0% |
Gambier Summary
Gambier, Ohio is a small village located in Knox County, Ohio. It is situated in the foothills of the Appalachian Mountains and is home to Kenyon College, a private liberal arts college. The village has a population of 2,391 as of the 2010 census.
History
Gambier was founded in 1824 by Bishop Philander Chase, the first Episcopal Bishop of Ohio. He named the village after James Gambier, the first Lord Gambier, who was a British admiral and diplomat. The village was originally intended to be a college town, and in 1825, Kenyon College was founded. The college has since become one of the most prestigious liberal arts colleges in the United States.
Geography
Gambier is located at 40°25'17"N 82°20'45"W (40.4214, -82.3458). It is situated in the foothills of the Appalachian Mountains and is surrounded by rolling hills and farmland. The Kokosing River runs through the village, and the village is located approximately 25 miles northeast of Columbus, Ohio.
Economy
Gambier’s economy is largely driven by Kenyon College. The college employs a large number of people in the village, and many businesses in the village cater to the college’s students and faculty. The village also has a few small businesses, including a grocery store, a hardware store, and a few restaurants.
Demographics
As of the 2010 census, Gambier had a population of 2,391. The racial makeup of the village was 94.2% White, 2.2% African American, 0.3% Native American, 1.2% Asian, 0.1% Pacific Islander, 0.7% from other races, and 1.3% from two or more races. Hispanic or Latino of any race were 1.7% of the population.
The median income for a household in the village was $50,972, and the median income for a family was $76,250. The per capita income for the village was $27,945. About 5.2% of families and 11.2% of the population were below the poverty line, including 8.2% of those under age 18 and 5.2% of those age 65 or over.
Conclusion
Gambier, Ohio is a small village located in Knox County, Ohio. It is situated in the foothills of the Appalachian Mountains and is home to Kenyon College, a private liberal arts college. The village has a population of 2,391 as of the 2010 census. The village’s economy is largely driven by Kenyon College, and the village has a few small businesses. The racial makeup of the village is 94.2% White, 2.2% African American, 0.3% Native American, 1.2% Asian, 0.1% Pacific Islander, 0.7% from other races, and 1.3% from two or more races. The median income for a household in the village was $50,972, and the median income for a family was $76,250.
Common Questions
What is Per Capita Income in Gambier?
Per Capita income in Gambier is $16,002.
What is the Median Family Income in Gambier?
Median Family Income in Gambier is $88,750.
What is the Median Household income in Gambier?
Median Household Income in Gambier is $90,625.
What is Income or Wage Gap in Gambier?
Income or Wage Gap in Gambier is 25.9%.
Women in Gambier earn 74.1 cents for every dollar earned by a man.
What is Inequality or Gini Index in Gambier?
Inequality or Gini Index in Gambier is 0.43.
What is the Total Population of Gambier?
Total Population of Gambier is 2,000.
What is the Total Male Population of Gambier?
Total Male Population of Gambier is 868.
What is the Total Female Population of Gambier?
Total Female Population of Gambier is 1,132.
What is the Ratio of Males per 100 Females in Gambier?
There are 76.68 Males per 100 Females in Gambier.
What is the Ratio of Females per 100 Males in Gambier?
There are 130.41 Females per 100 Males in Gambier.
What is the Median Population Age in Gambier?
Median Population Age in Gambier is 20.4 Years.
What is the Average Family Size in Gambier
Average Family Size in Gambier is 2.6 People.
What is the Average Household Size in Gambier
Average Household Size in Gambier is 2.0 People.
How Large is the Labor Force in Gambier?
There are 936 People in the Labor Forcein in Gambier.
What is the Percentage of People in the Labor Force in Gambier?
47.7% of People are in the Labor Force in Gambier.
What is the Unemployment Rate in Gambier?
Unemployment Rate in Gambier is 3.7%.