Grandview Heights, OH Map & Demographics
Grandview Heights Map
Grandview Heights Overview
$72,009
PER CAPITA INCOME
$176,563
AVG FAMILY INCOME
$100,833
AVG HOUSEHOLD INCOME
11.9%
WAGE / INCOME GAP [ % ]
88.1¢/ $1
WAGE / INCOME GAP [ $ ]
0.47
INEQUALITY / GINI INDEX
8,258
TOTAL POPULATION
4,141
MALE POPULATION
4,117
FEMALE POPULATION
100.58
MALES / 100 FEMALES
99.42
FEMALES / 100 MALES
32.9
MEDIAN AGE
3.1
AVG FAMILY SIZE
2.2
AVG HOUSEHOLD SIZE
5,274
LABOR FORCE [ PEOPLE ]
80.8%
PERCENT IN LABOR FORCE
1.8%
UNEMPLOYMENT RATE
Grandview Heights Area Codes
Income in Grandview Heights
Income Overview in Grandview Heights
Per Capita Income in Grandview Heights is $72,009, while median incomes of families and households are $176,563 and $100,833 respectively.
| Characteristic | Number | Measure |
| Per Capita Income | 8,258 | $72,009 |
| Median Family Income | 1,716 | $176,563 |
| Mean Family Income | 1,716 | $215,245 |
| Median Household Income | 3,750 | $100,833 |
| Mean Household Income | 3,750 | $152,942 |
| Income Deficit | 1,716 | $0 |
| Wage / Income Gap (%) | 8,258 | 11.93% |
| Wage / Income Gap ($) | 8,258 | 88.07¢ per $1 |
| Gini / Inequality Index | 8,258 | 0.47 |
Earnings by Sex in Grandview Heights
Average Earnings in Grandview Heights are $61,783, $68,846 for men and $60,630 for women, a difference of 11.9%.
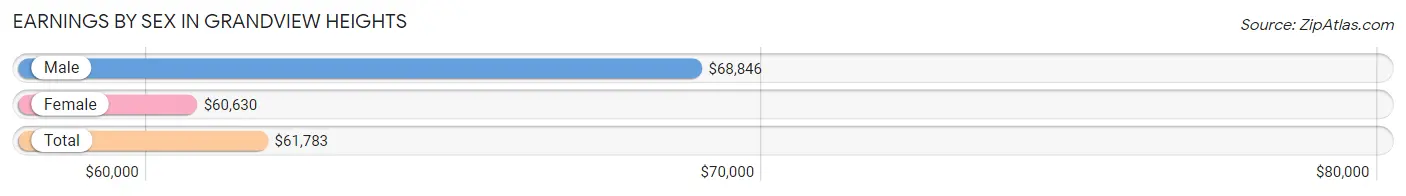
| Sex | Number | Average Earnings |
| Male | 2,920 (52.9%) | $68,846 |
| Female | 2,597 (47.1%) | $60,630 |
| Total | 5,517 (100.0%) | $61,783 |
Earnings by Sex by Income Bracket in Grandview Heights
The most common earnings brackets in Grandview Heights are $100,000+ for men (1,068 | 36.6%) and $100,000+ for women (465 | 17.9%).
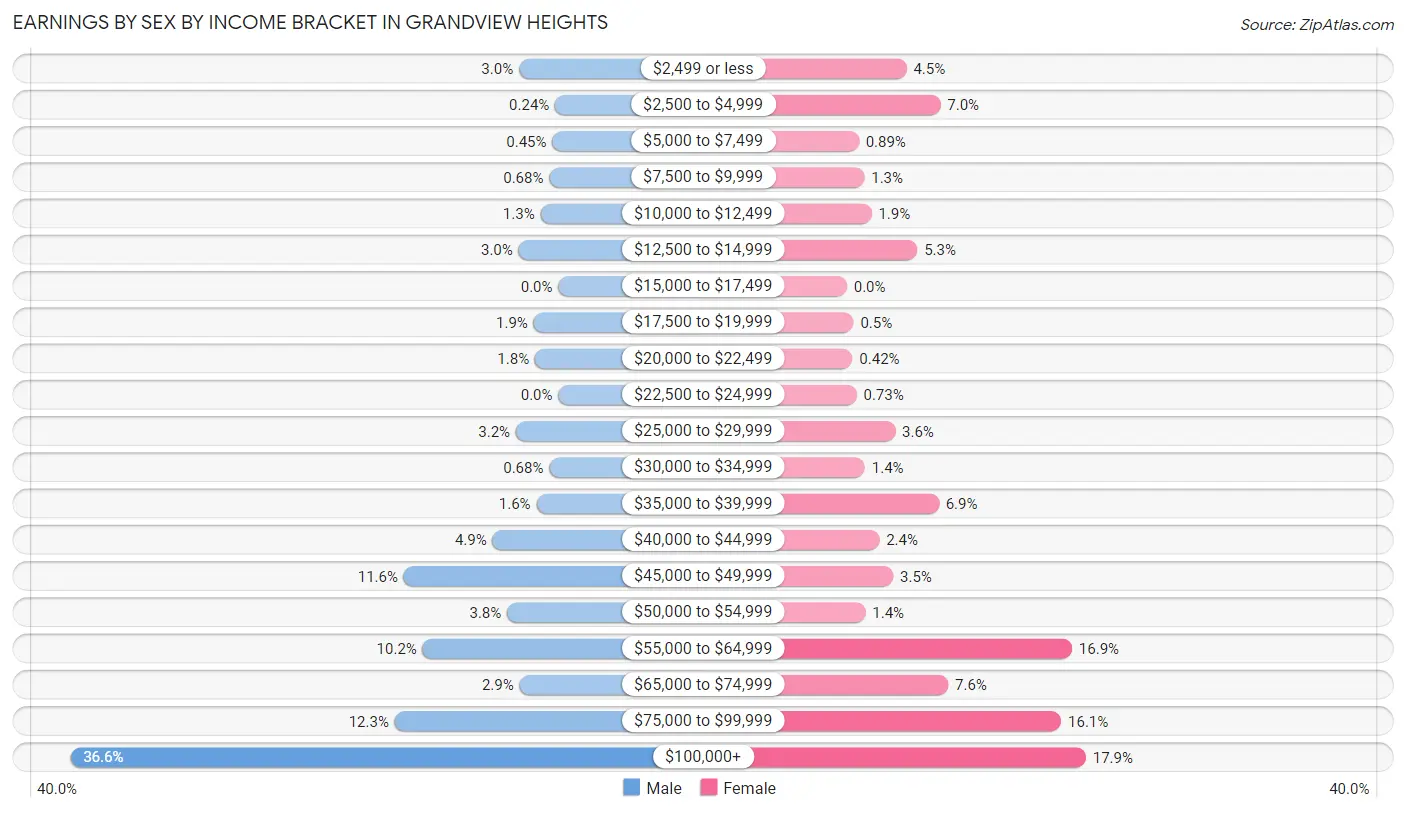
| Income | Male | Female |
| $2,499 or less | 86 (2.9%) | 116 (4.5%) |
| $2,500 to $4,999 | 7 (0.2%) | 182 (7.0%) |
| $5,000 to $7,499 | 13 (0.4%) | 23 (0.9%) |
| $7,500 to $9,999 | 20 (0.7%) | 34 (1.3%) |
| $10,000 to $12,499 | 39 (1.3%) | 48 (1.8%) |
| $12,500 to $14,999 | 87 (3.0%) | 137 (5.3%) |
| $15,000 to $17,499 | 0 (0.0%) | 0 (0.0%) |
| $17,500 to $19,999 | 54 (1.8%) | 13 (0.5%) |
| $20,000 to $22,499 | 51 (1.8%) | 11 (0.4%) |
| $22,500 to $24,999 | 0 (0.0%) | 19 (0.7%) |
| $25,000 to $29,999 | 93 (3.2%) | 94 (3.6%) |
| $30,000 to $34,999 | 20 (0.7%) | 35 (1.3%) |
| $35,000 to $39,999 | 48 (1.6%) | 179 (6.9%) |
| $40,000 to $44,999 | 144 (4.9%) | 63 (2.4%) |
| $45,000 to $49,999 | 338 (11.6%) | 90 (3.5%) |
| $50,000 to $54,999 | 112 (3.8%) | 36 (1.4%) |
| $55,000 to $64,999 | 297 (10.2%) | 438 (16.9%) |
| $65,000 to $74,999 | 85 (2.9%) | 197 (7.6%) |
| $75,000 to $99,999 | 358 (12.3%) | 417 (16.1%) |
| $100,000+ | 1,068 (36.6%) | 465 (17.9%) |
| Total | 2,920 (100.0%) | 2,597 (100.0%) |
Earnings by Sex by Educational Attainment in Grandview Heights
Average earnings in Grandview Heights are $79,172 for men and $60,809 for women, a difference of 23.2%. Men with an educational attainment of high school diploma enjoy the highest average annual earnings of $90,455, while those with college or associate's degree education earn the least with $59,457. Women with an educational attainment of graduate degree earn the most with the average annual earnings of $63,542, while those with college or associate's degree education have the smallest earnings of $38,083.
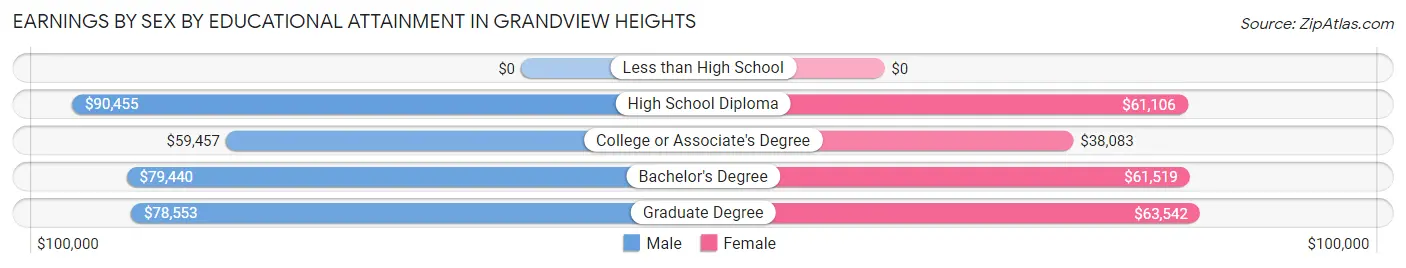
| Educational Attainment | Male Income | Female Income |
| Less than High School | - | - |
| High School Diploma | $90,455 | $61,106 |
| College or Associate's Degree | $59,457 | $38,083 |
| Bachelor's Degree | $79,440 | $61,519 |
| Graduate Degree | $78,553 | $63,542 |
| Total | $79,172 | $60,809 |
Family Income in Grandview Heights
Family Income Brackets in Grandview Heights
According to the Grandview Heights family income data, there are 784 families falling into the $200,000+ income range, which is the most common income bracket and makes up 45.7% of all families. Conversely, the $15,000 to $24,999 income bracket is the least frequent group with only 2 families (0.1%) belonging to this category.
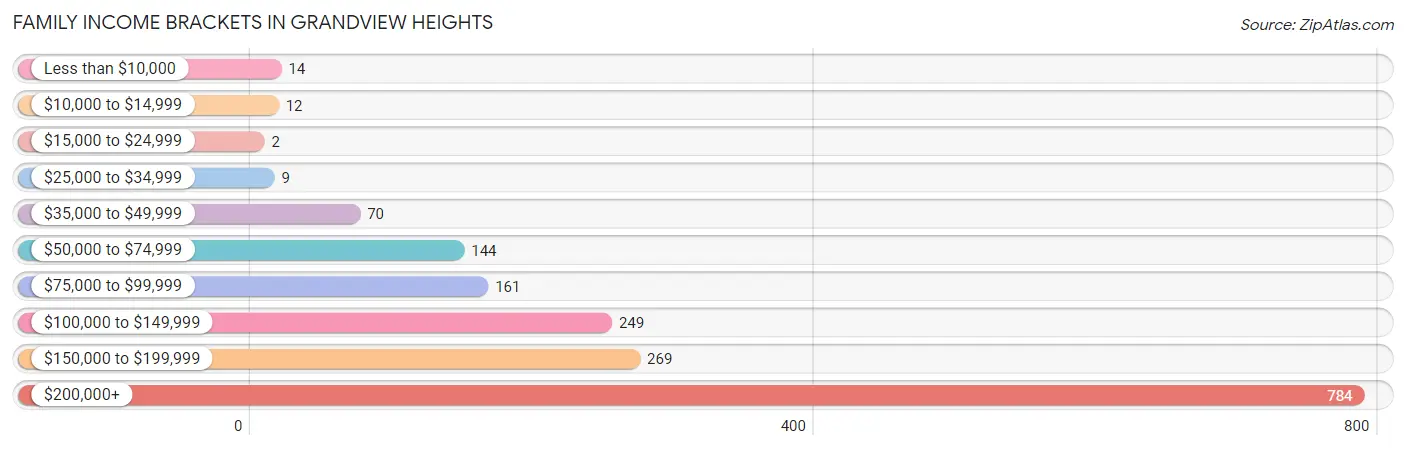
| Income Bracket | # Families | % Families |
| Less than $10,000 | 14 | 0.8% |
| $10,000 to $14,999 | 12 | 0.7% |
| $15,000 to $24,999 | 2 | 0.1% |
| $25,000 to $34,999 | 9 | 0.5% |
| $35,000 to $49,999 | 70 | 4.1% |
| $50,000 to $74,999 | 144 | 8.4% |
| $75,000 to $99,999 | 161 | 9.4% |
| $100,000 to $149,999 | 249 | 14.5% |
| $150,000 to $199,999 | 269 | 15.7% |
| $200,000+ | 784 | 45.7% |
Family Income by Famaliy Size in Grandview Heights
4-person families (401 | 23.4%) account for the highest median family income in Grandview Heights with $244,896 per family, while 2-person families (755 | 44.0%) have the highest median income of $86,823 per family member.
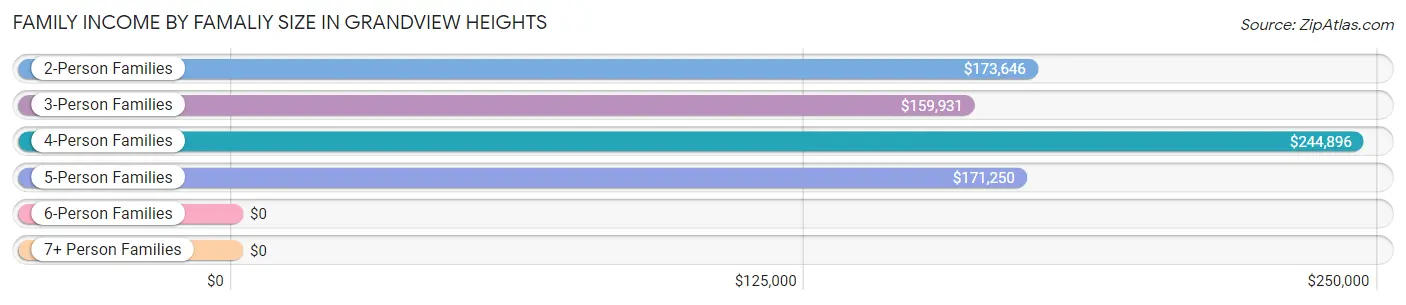
| Income Bracket | # Families | Median Income |
| 2-Person Families | 755 (44.0%) | $173,646 |
| 3-Person Families | 381 (22.2%) | $159,931 |
| 4-Person Families | 401 (23.4%) | $244,896 |
| 5-Person Families | 141 (8.2%) | $171,250 |
| 6-Person Families | 35 (2.0%) | $0 |
| 7+ Person Families | 3 (0.2%) | $0 |
| Total | 1,716 (100.0%) | $176,563 |
Family Income by Number of Earners in Grandview Heights
The median family income in Grandview Heights is $176,563, with families comprising 3+ earners (99) having the highest median family income of $229,554, while families with no earners (114) have the lowest median family income of $82,273, accounting for 5.8% and 6.6% of families, respectively.
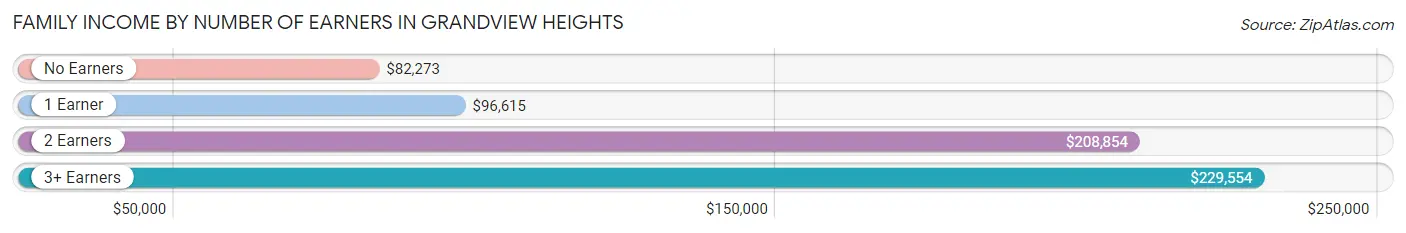
| Number of Earners | # Families | Median Income |
| No Earners | 114 (6.6%) | $82,273 |
| 1 Earner | 377 (22.0%) | $96,615 |
| 2 Earners | 1,126 (65.6%) | $208,854 |
| 3+ Earners | 99 (5.8%) | $229,554 |
| Total | 1,716 (100.0%) | $176,563 |
Household Income in Grandview Heights
Household Income Brackets in Grandview Heights
With 941 households falling in the category, the $200,000+ income range is the most frequent in Grandview Heights, accounting for 25.1% of all households. In contrast, only 22 households (0.6%) fall into the $10,000 to $14,999 income bracket, making it the least populous group.
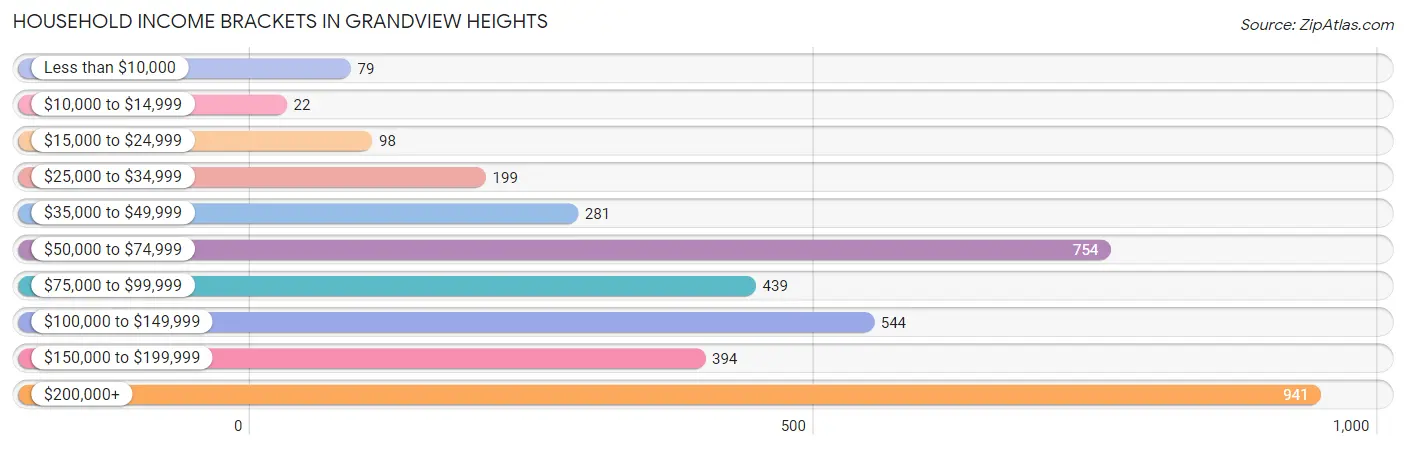
| Income Bracket | # Households | % Households |
| Less than $10,000 | 79 | 2.1% |
| $10,000 to $14,999 | 22 | 0.6% |
| $15,000 to $24,999 | 98 | 2.6% |
| $25,000 to $34,999 | 199 | 5.3% |
| $35,000 to $49,999 | 281 | 7.5% |
| $50,000 to $74,999 | 754 | 20.1% |
| $75,000 to $99,999 | 439 | 11.7% |
| $100,000 to $149,999 | 544 | 14.5% |
| $150,000 to $199,999 | 394 | 10.5% |
| $200,000+ | 941 | 25.1% |
Household Income by Householder Age in Grandview Heights
The median household income in Grandview Heights is $100,833, with the highest median household income of $112,796 found in the 25 to 44 years age bracket for the primary householder. A total of 1,849 households (49.3%) fall into this category. Meanwhile, the 65+ years age bracket for the primary householder has the lowest median household income of $68,964, with 575 households (15.3%) in this group.
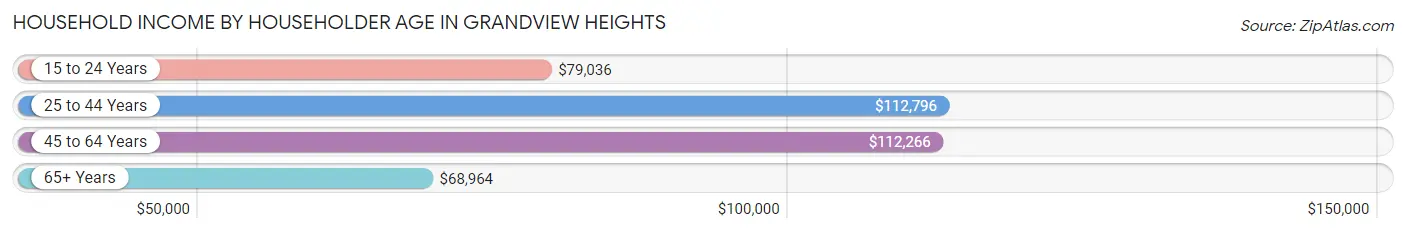
| Income Bracket | # Households | Median Income |
| 15 to 24 Years | 229 (6.1%) | $79,036 |
| 25 to 44 Years | 1,849 (49.3%) | $112,796 |
| 45 to 64 Years | 1,097 (29.2%) | $112,266 |
| 65+ Years | 575 (15.3%) | $68,964 |
| Total | 3,750 (100.0%) | $100,833 |
Poverty in Grandview Heights
Income Below Poverty by Sex and Age in Grandview Heights
With 4.1% poverty level for males and 6.6% for females among the residents of Grandview Heights, 25 to 34 year old males and 15 year old females are the most vulnerable to poverty, with 129 males (12.7%) and 3 females (20.0%) in their respective age groups living below the poverty level.
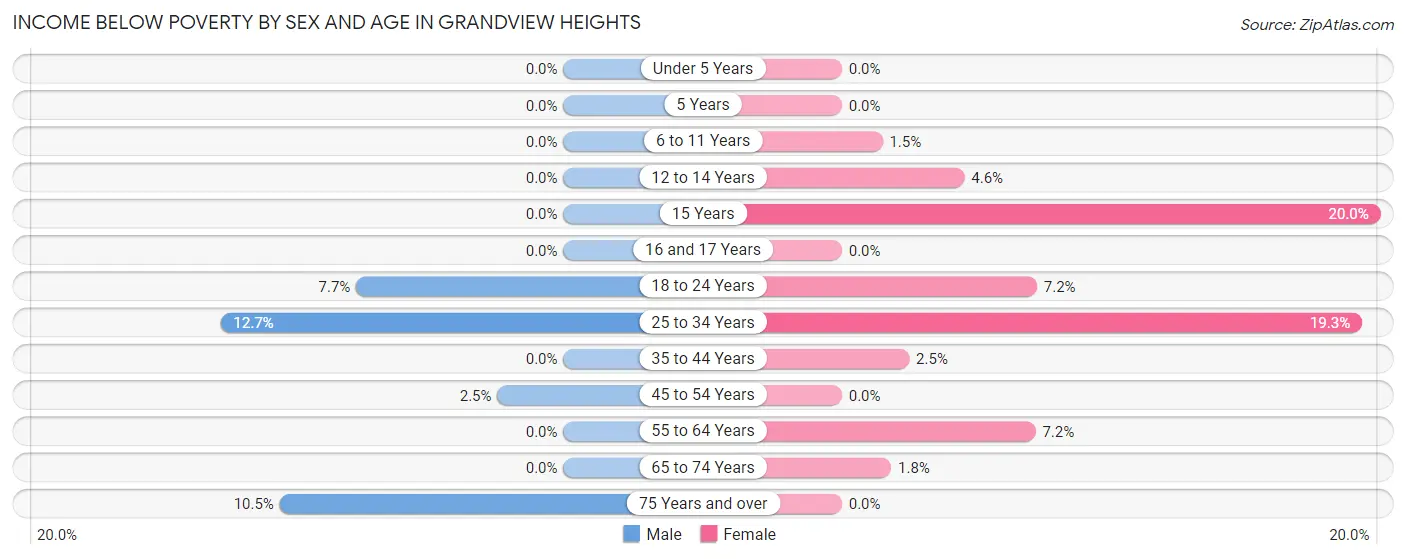
| Age Bracket | Male | Female |
| Under 5 Years | 0 (0.0%) | 0 (0.0%) |
| 5 Years | 0 (0.0%) | 0 (0.0%) |
| 6 to 11 Years | 0 (0.0%) | 7 (1.5%) |
| 12 to 14 Years | 0 (0.0%) | 5 (4.5%) |
| 15 Years | 0 (0.0%) | 3 (20.0%) |
| 16 and 17 Years | 0 (0.0%) | 0 (0.0%) |
| 18 to 24 Years | 16 (7.7%) | 21 (7.2%) |
| 25 to 34 Years | 129 (12.7%) | 190 (19.3%) |
| 35 to 44 Years | 0 (0.0%) | 16 (2.5%) |
| 45 to 54 Years | 14 (2.5%) | 0 (0.0%) |
| 55 to 64 Years | 0 (0.0%) | 23 (7.2%) |
| 65 to 74 Years | 0 (0.0%) | 6 (1.8%) |
| 75 Years and over | 12 (10.5%) | 0 (0.0%) |
| Total | 171 (4.1%) | 271 (6.6%) |
Income Above Poverty by Sex and Age in Grandview Heights
According to the poverty statistics in Grandview Heights, males aged under 5 years and females aged under 5 years are the age groups that are most secure financially, with 100.0% of males and 100.0% of females in these age groups living above the poverty line.
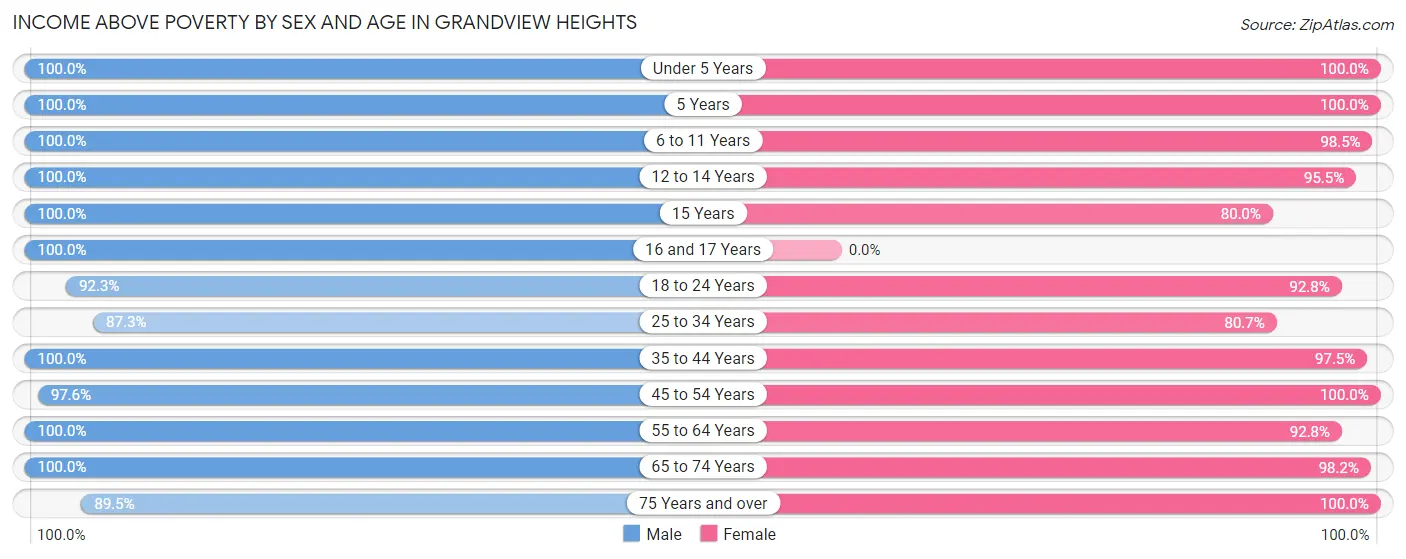
| Age Bracket | Male | Female |
| Under 5 Years | 224 (100.0%) | 286 (100.0%) |
| 5 Years | 28 (100.0%) | 22 (100.0%) |
| 6 to 11 Years | 447 (100.0%) | 456 (98.5%) |
| 12 to 14 Years | 120 (100.0%) | 105 (95.5%) |
| 15 Years | 16 (100.0%) | 12 (80.0%) |
| 16 and 17 Years | 83 (100.0%) | 0 (0.0%) |
| 18 to 24 Years | 192 (92.3%) | 269 (92.8%) |
| 25 to 34 Years | 884 (87.3%) | 794 (80.7%) |
| 35 to 44 Years | 580 (100.0%) | 625 (97.5%) |
| 45 to 54 Years | 557 (97.6%) | 411 (100.0%) |
| 55 to 64 Years | 519 (100.0%) | 297 (92.8%) |
| 65 to 74 Years | 218 (100.0%) | 322 (98.2%) |
| 75 Years and over | 102 (89.5%) | 247 (100.0%) |
| Total | 3,970 (95.9%) | 3,846 (93.4%) |
Income Below Poverty Among Married-Couple Families in Grandview Heights
The poverty statistics for married-couple families in Grandview Heights show that 0.1% or 2 of the total 1,431 families live below the poverty line. Families with 5 or more children have the highest poverty rate of 66.7%, comprising of 2 families. On the other hand, families with no children have the lowest poverty rate of 0.0%, which includes 0 families.
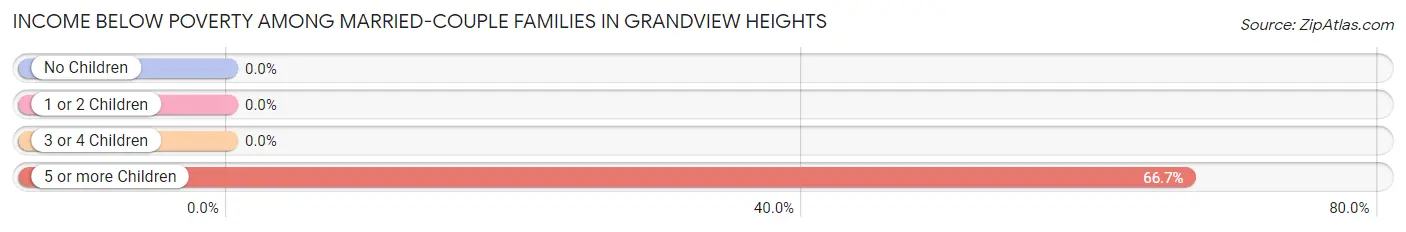
| Children | Above Poverty | Below Poverty |
| No Children | 631 (100.0%) | 0 (0.0%) |
| 1 or 2 Children | 621 (100.0%) | 0 (0.0%) |
| 3 or 4 Children | 176 (100.0%) | 0 (0.0%) |
| 5 or more Children | 1 (33.3%) | 2 (66.7%) |
| Total | 1,429 (99.9%) | 2 (0.1%) |
Income Below Poverty Among Single-Parent Households in Grandview Heights
According to the poverty data in Grandview Heights, 15.6% or 12 single-father households and 6.2% or 13 single-mother households are living below the poverty line. Among single-father households, those with 1 or 2 children have the highest poverty rate, with 12 households (27.9%) experiencing poverty. Likewise, among single-mother households, those with no children have the highest poverty rate, with 13 households (10.6%) falling below the poverty line.
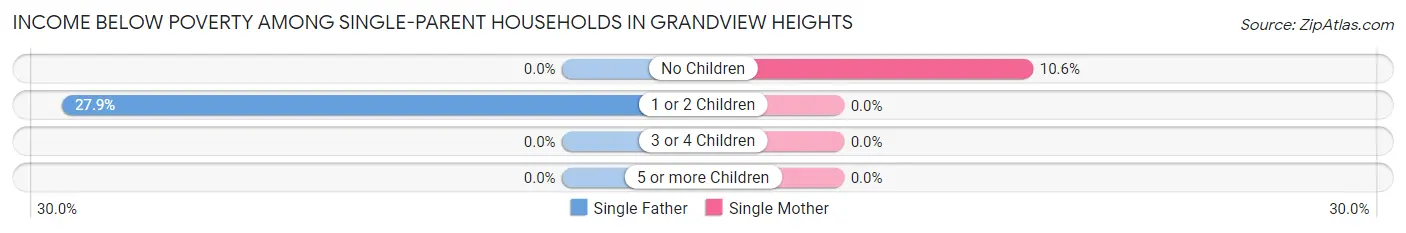
| Children | Single Father | Single Mother |
| No Children | 0 (0.0%) | 13 (10.6%) |
| 1 or 2 Children | 12 (27.9%) | 0 (0.0%) |
| 3 or 4 Children | 0 (0.0%) | 0 (0.0%) |
| 5 or more Children | 0 (0.0%) | 0 (0.0%) |
| Total | 12 (15.6%) | 13 (6.2%) |
Income Below Poverty Among Married-Couple vs Single-Parent Households in Grandview Heights
The poverty data for Grandview Heights shows that 2 of the married-couple family households (0.1%) and 25 of the single-parent households (8.8%) are living below the poverty level. Within the married-couple family households, those with 5 or more children have the highest poverty rate, with 2 households (66.7%) falling below the poverty line. Among the single-parent households, those with 1 or 2 children have the highest poverty rate, with 12 household (9.4%) living below poverty.
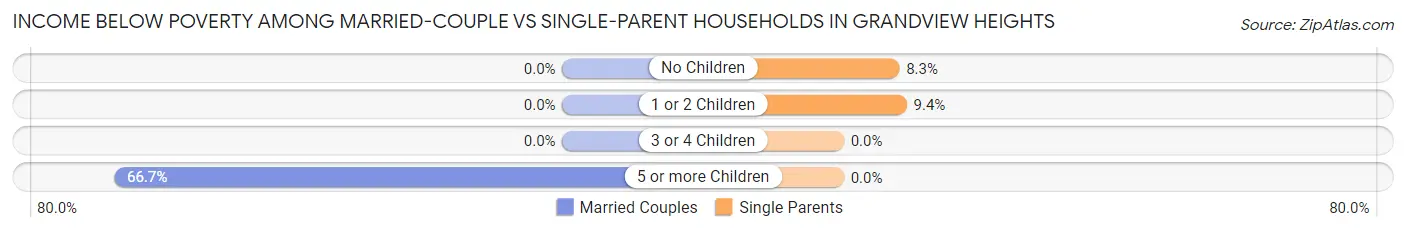
| Children | Married-Couple Families | Single-Parent Households |
| No Children | 0 (0.0%) | 13 (8.3%) |
| 1 or 2 Children | 0 (0.0%) | 12 (9.4%) |
| 3 or 4 Children | 0 (0.0%) | 0 (0.0%) |
| 5 or more Children | 2 (66.7%) | 0 (0.0%) |
| Total | 2 (0.1%) | 25 (8.8%) |
Race in Grandview Heights
The most populous races in Grandview Heights are White / Caucasian (7,191 | 87.1%), Two or more Races (815 | 9.9%), and Hispanic or Latino (352 | 4.3%).
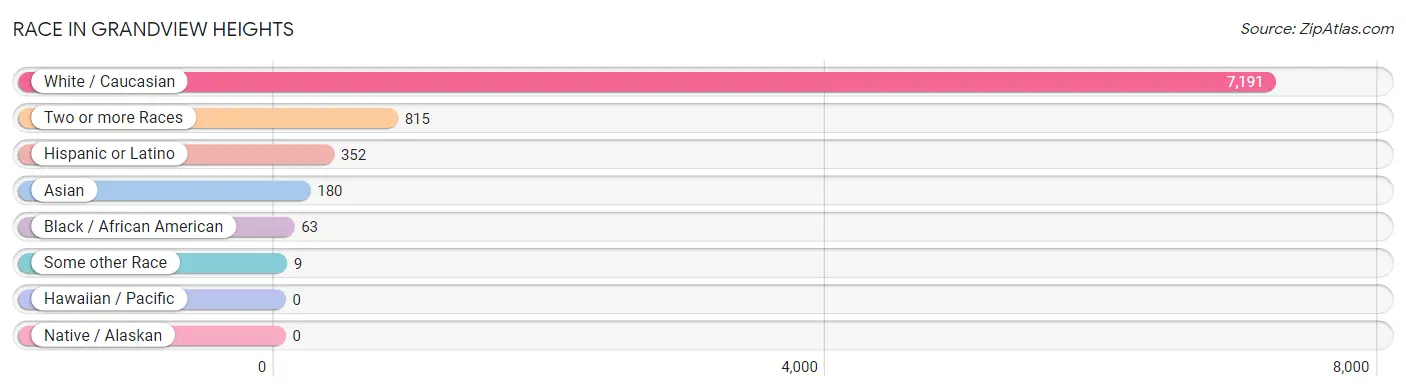
| Race | # Population | % Population |
| Asian | 180 | 2.2% |
| Black / African American | 63 | 0.8% |
| Hawaiian / Pacific | 0 | 0.0% |
| Hispanic or Latino | 352 | 4.3% |
| Native / Alaskan | 0 | 0.0% |
| White / Caucasian | 7,191 | 87.1% |
| Two or more Races | 815 | 9.9% |
| Some other Race | 9 | 0.1% |
| Total | 8,258 | 100.0% |
Ancestry in Grandview Heights
The most populous ancestries reported in Grandview Heights are German (2,287 | 27.7%), Irish (1,965 | 23.8%), English (1,050 | 12.7%), Italian (887 | 10.7%), and Bhutanese (457 | 5.5%), together accounting for 80.5% of all Grandview Heights residents.
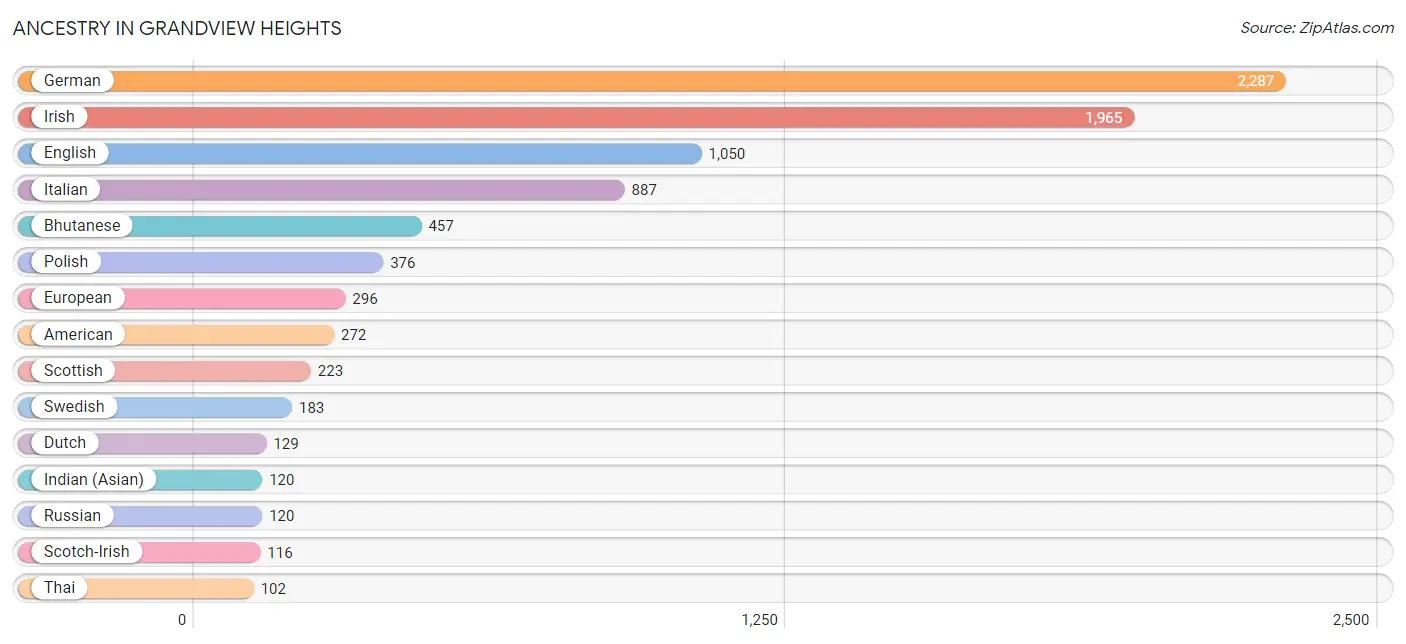
| Ancestry | # Population | % Population |
| African | 6 | 0.1% |
| American | 272 | 3.3% |
| Argentinean | 52 | 0.6% |
| Armenian | 23 | 0.3% |
| Austrian | 18 | 0.2% |
| Belgian | 22 | 0.3% |
| Bhutanese | 457 | 5.5% |
| British | 10 | 0.1% |
| Cherokee | 9 | 0.1% |
| Croatian | 96 | 1.2% |
| Czech | 12 | 0.2% |
| Danish | 10 | 0.1% |
| Dominican | 91 | 1.1% |
| Dutch | 129 | 1.6% |
| Eastern European | 64 | 0.8% |
| English | 1,050 | 12.7% |
| European | 296 | 3.6% |
| French | 81 | 1.0% |
| French Canadian | 50 | 0.6% |
| German | 2,287 | 27.7% |
| Greek | 24 | 0.3% |
| Hungarian | 60 | 0.7% |
| Indian (Asian) | 120 | 1.5% |
| Iranian | 57 | 0.7% |
| Irish | 1,965 | 23.8% |
| Italian | 887 | 10.7% |
| Korean | 18 | 0.2% |
| Mexican | 24 | 0.3% |
| Northern European | 47 | 0.6% |
| Norwegian | 13 | 0.2% |
| Peruvian | 26 | 0.3% |
| Polish | 376 | 4.5% |
| Portuguese | 7 | 0.1% |
| Puerto Rican | 80 | 1.0% |
| Russian | 120 | 1.5% |
| Scandinavian | 25 | 0.3% |
| Scotch-Irish | 116 | 1.4% |
| Scottish | 223 | 2.7% |
| Serbian | 9 | 0.1% |
| Sioux | 9 | 0.1% |
| Slovak | 34 | 0.4% |
| Slovene | 90 | 1.1% |
| South American | 78 | 0.9% |
| Spaniard | 44 | 0.5% |
| Subsaharan African | 6 | 0.1% |
| Swedish | 183 | 2.2% |
| Swiss | 71 | 0.9% |
| Thai | 102 | 1.2% |
| Ukrainian | 54 | 0.6% |
| Welsh | 59 | 0.7% | View All 50 Rows |
Immigrants in Grandview Heights
The most numerous immigrant groups reported in Grandview Heights came from Europe (175 | 2.1%), Latin America (134 | 1.6%), Caribbean (91 | 1.1%), Dominican Republic (91 | 1.1%), and Eastern Europe (89 | 1.1%), together accounting for 7.0% of all Grandview Heights residents.
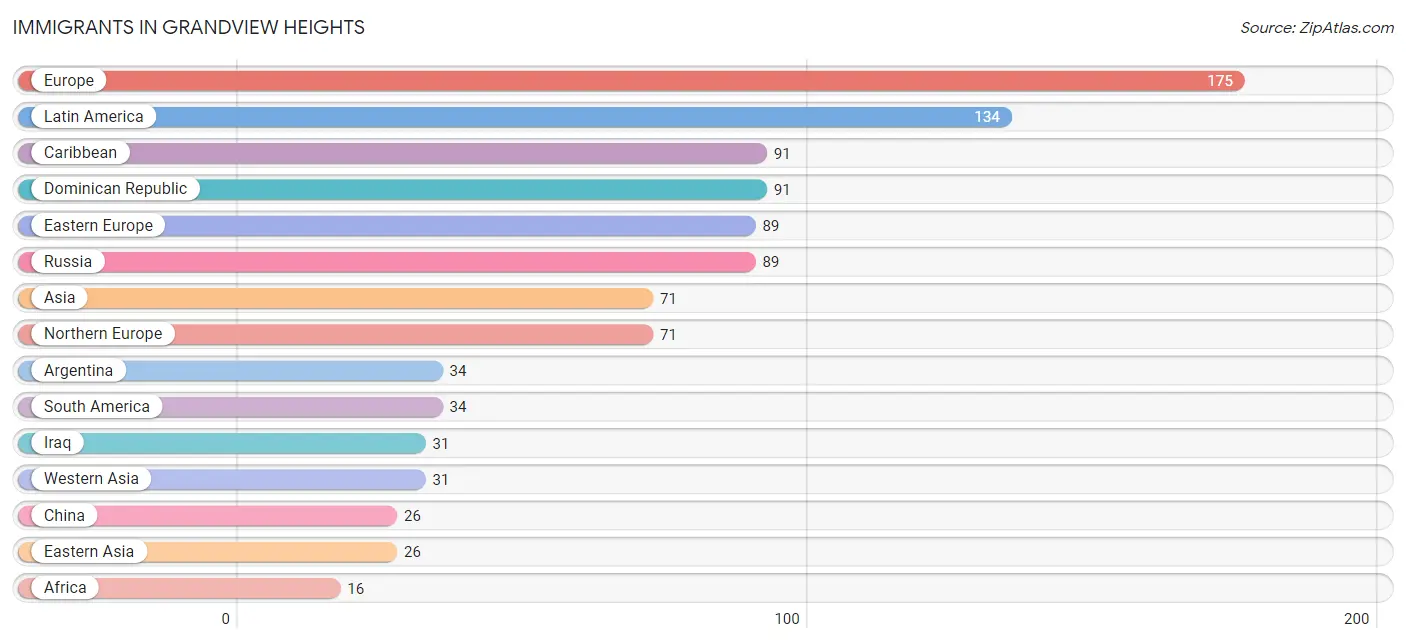
| Immigration Origin | # Population | % Population |
| Africa | 16 | 0.2% |
| Argentina | 34 | 0.4% |
| Asia | 71 | 0.9% |
| Canada | 12 | 0.2% |
| Caribbean | 91 | 1.1% |
| Central America | 9 | 0.1% |
| China | 26 | 0.3% |
| Dominican Republic | 91 | 1.1% |
| Eastern Asia | 26 | 0.3% |
| Eastern Europe | 89 | 1.1% |
| England | 15 | 0.2% |
| Europe | 175 | 2.1% |
| India | 14 | 0.2% |
| Iraq | 31 | 0.4% |
| Latin America | 134 | 1.6% |
| Mexico | 9 | 0.1% |
| Northern Europe | 71 | 0.9% |
| Russia | 89 | 1.1% |
| South Africa | 16 | 0.2% |
| South America | 34 | 0.4% |
| South Central Asia | 14 | 0.2% |
| Southern Europe | 15 | 0.2% |
| Spain | 15 | 0.2% |
| Taiwan | 16 | 0.2% |
| Western Asia | 31 | 0.4% | View All 25 Rows |
Sex and Age in Grandview Heights
Sex and Age in Grandview Heights
The most populous age groups in Grandview Heights are 25 to 29 Years (639 | 15.4%) for men and 25 to 29 Years (512 | 12.4%) for women.
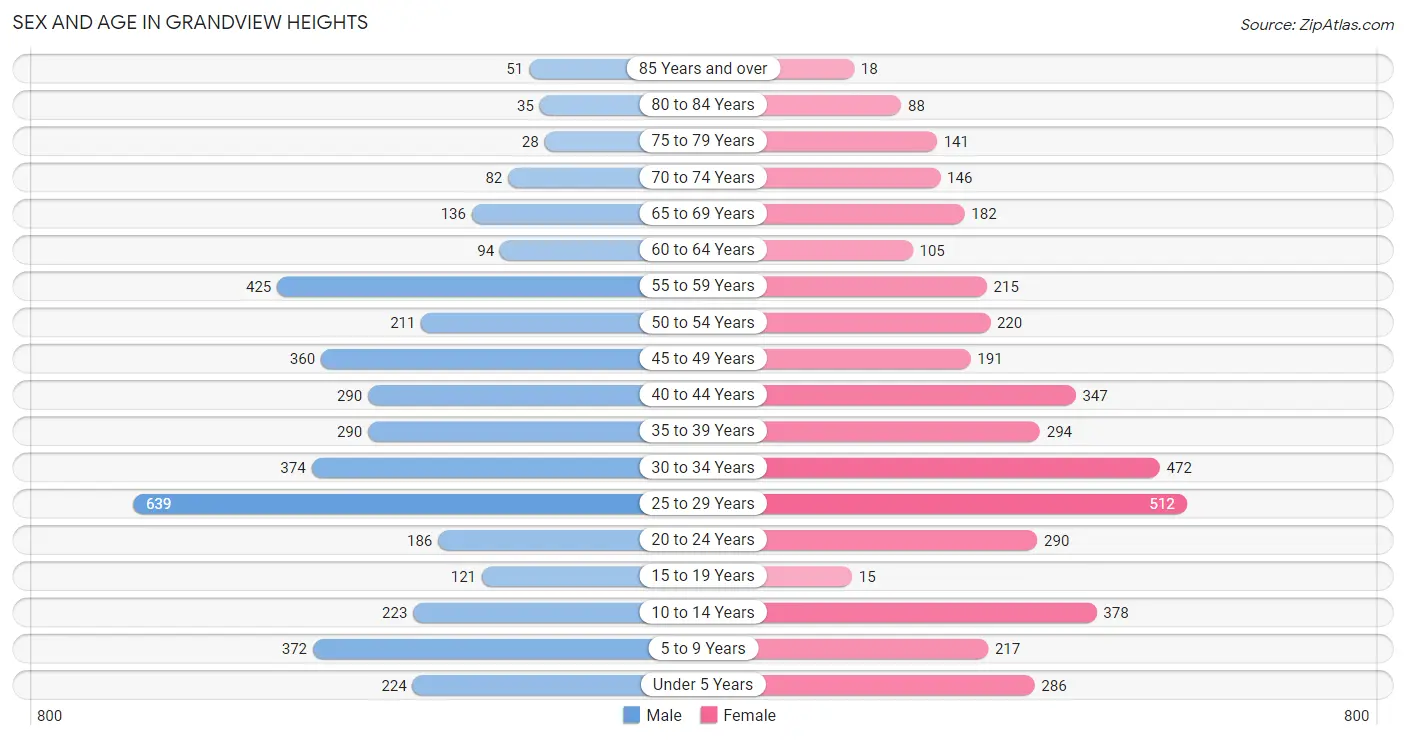
| Age Bracket | Male | Female |
| Under 5 Years | 224 (5.4%) | 286 (7.0%) |
| 5 to 9 Years | 372 (9.0%) | 217 (5.3%) |
| 10 to 14 Years | 223 (5.4%) | 378 (9.2%) |
| 15 to 19 Years | 121 (2.9%) | 15 (0.4%) |
| 20 to 24 Years | 186 (4.5%) | 290 (7.0%) |
| 25 to 29 Years | 639 (15.4%) | 512 (12.4%) |
| 30 to 34 Years | 374 (9.0%) | 472 (11.5%) |
| 35 to 39 Years | 290 (7.0%) | 294 (7.1%) |
| 40 to 44 Years | 290 (7.0%) | 347 (8.4%) |
| 45 to 49 Years | 360 (8.7%) | 191 (4.6%) |
| 50 to 54 Years | 211 (5.1%) | 220 (5.3%) |
| 55 to 59 Years | 425 (10.3%) | 215 (5.2%) |
| 60 to 64 Years | 94 (2.3%) | 105 (2.5%) |
| 65 to 69 Years | 136 (3.3%) | 182 (4.4%) |
| 70 to 74 Years | 82 (2.0%) | 146 (3.5%) |
| 75 to 79 Years | 28 (0.7%) | 141 (3.4%) |
| 80 to 84 Years | 35 (0.9%) | 88 (2.1%) |
| 85 Years and over | 51 (1.2%) | 18 (0.4%) |
| Total | 4,141 (100.0%) | 4,117 (100.0%) |
Families and Households in Grandview Heights
Median Family Size in Grandview Heights
The median family size in Grandview Heights is 3.14 persons per family, with married-couple families (1,431 | 83.4%) accounting for the largest median family size of 3.3 persons per family. On the other hand, single male/father families (77 | 4.5%) represent the smallest median family size with 2.01 persons per family.
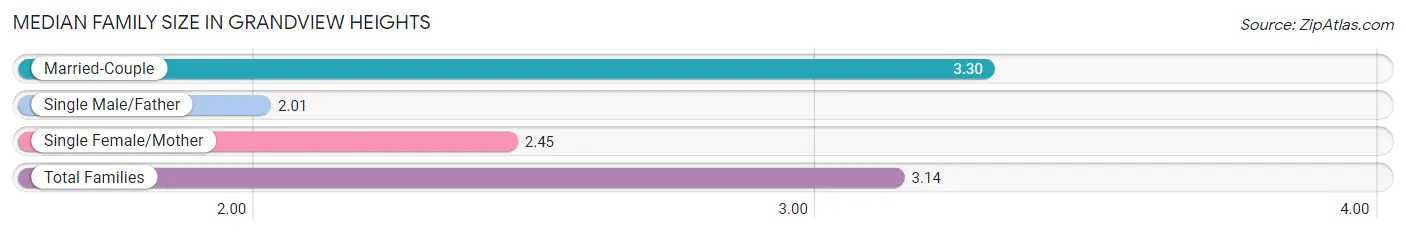
| Family Type | # Families | Family Size |
| Married-Couple | 1,431 (83.4%) | 3.30 |
| Single Male/Father | 77 (4.5%) | 2.01 |
| Single Female/Mother | 208 (12.1%) | 2.45 |
| Total Families | 1,716 (100.0%) | 3.14 |
Median Household Size in Grandview Heights
The median household size in Grandview Heights is 2.20 persons per household, with married-couple households (1,431 | 38.2%) accounting for the largest median household size of 3.32 persons per household. non-family households (2,034 | 54.2%) represent the smallest median household size with 1.40 persons per household.
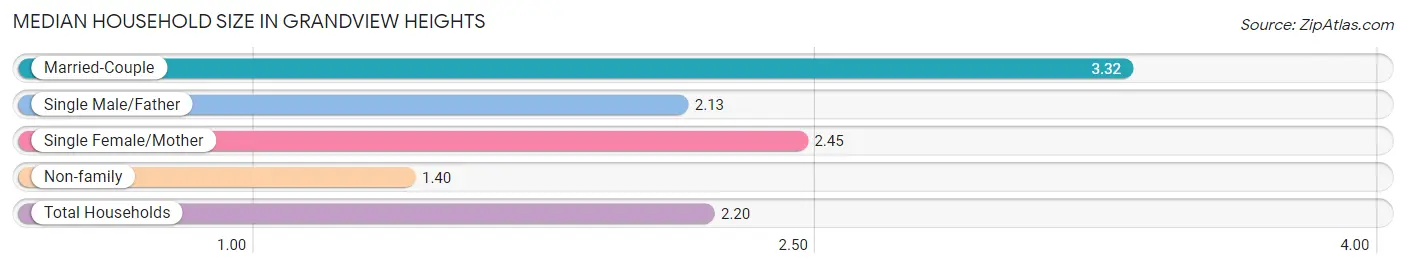
| Household Type | # Households | Household Size |
| Married-Couple | 1,431 (38.2%) | 3.32 |
| Single Male/Father | 77 (2.1%) | 2.13 |
| Single Female/Mother | 208 (5.6%) | 2.45 |
| Non-family | 2,034 (54.2%) | 1.40 |
| Total Households | 3,750 (100.0%) | 2.20 |
Household Size by Marriage Status in Grandview Heights
Out of a total of 3,750 households in Grandview Heights, 1,716 (45.8%) are family households, while 2,034 (54.2%) are nonfamily households. The most numerous type of family households are 2-person households, comprising 743, and the most common type of nonfamily households are 1-person households, comprising 1,388.
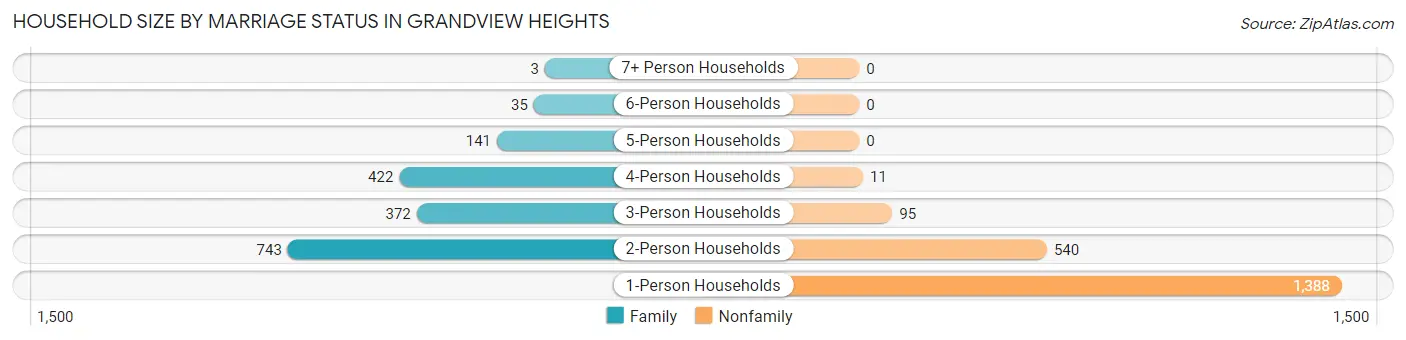
| Household Size | Family Households | Nonfamily Households |
| 1-Person Households | - | 1,388 (37.0%) |
| 2-Person Households | 743 (19.8%) | 540 (14.4%) |
| 3-Person Households | 372 (9.9%) | 95 (2.5%) |
| 4-Person Households | 422 (11.3%) | 11 (0.3%) |
| 5-Person Households | 141 (3.8%) | 0 (0.0%) |
| 6-Person Households | 35 (0.9%) | 0 (0.0%) |
| 7+ Person Households | 3 (0.1%) | 0 (0.0%) |
| Total | 1,716 (45.8%) | 2,034 (54.2%) |
Female Fertility in Grandview Heights
Fertility by Age in Grandview Heights
Average fertility rate in Grandview Heights is 67.0 births per 1,000 women. Women in the age bracket of 20 to 34 years have the highest fertility rate with 72.0 births per 1,000 women. Women in the age bracket of 20 to 34 years acount for 63.4% of all women with births.
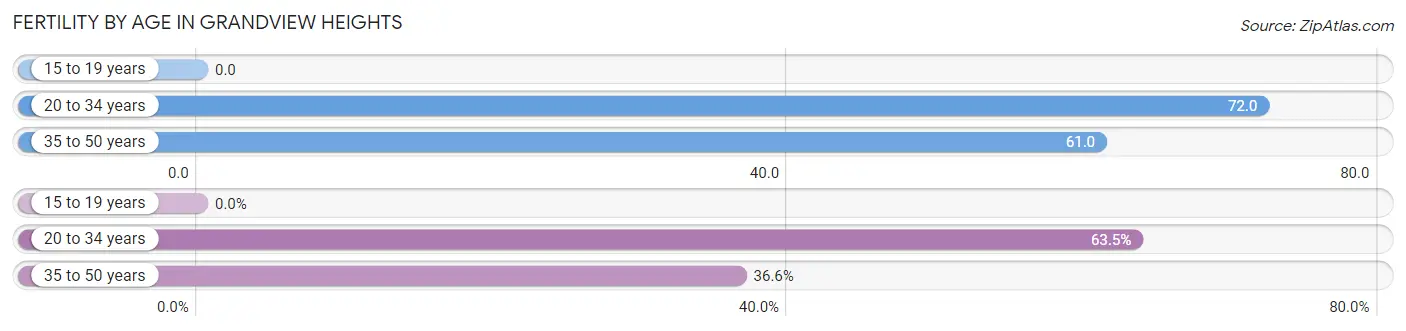
| Age Bracket | Women with Births | Births / 1,000 Women |
| 15 to 19 years | 0 (0.0%) | 0.0 |
| 20 to 34 years | 92 (63.4%) | 72.0 |
| 35 to 50 years | 53 (36.5%) | 61.0 |
| Total | 145 (100.0%) | 67.0 |
Fertility by Age by Marriage Status in Grandview Heights
91.7% of women with births (145) in Grandview Heights are married. The highest percentage of unmarried women with births falls into 35 to 50 years age bracket with 22.6% of them unmarried at the time of birth, while the lowest percentage of unmarried women with births belong to 20 to 34 years age bracket with 0.0% of them unmarried.
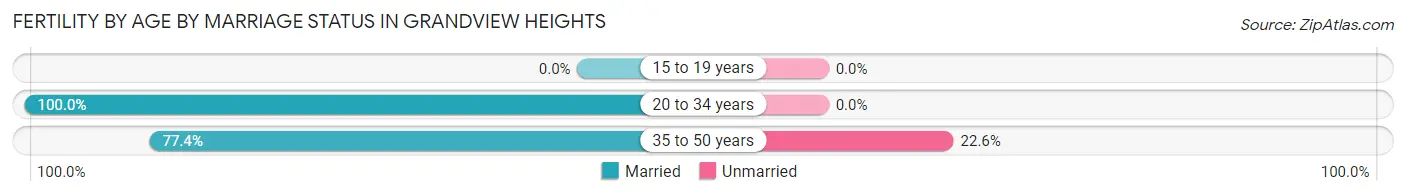
| Age Bracket | Married | Unmarried |
| 15 to 19 years | 0 (0.0%) | 0 (0.0%) |
| 20 to 34 years | 92 (100.0%) | 0 (0.0%) |
| 35 to 50 years | 41 (77.4%) | 12 (22.6%) |
| Total | 133 (91.7%) | 12 (8.3%) |
Fertility by Education in Grandview Heights
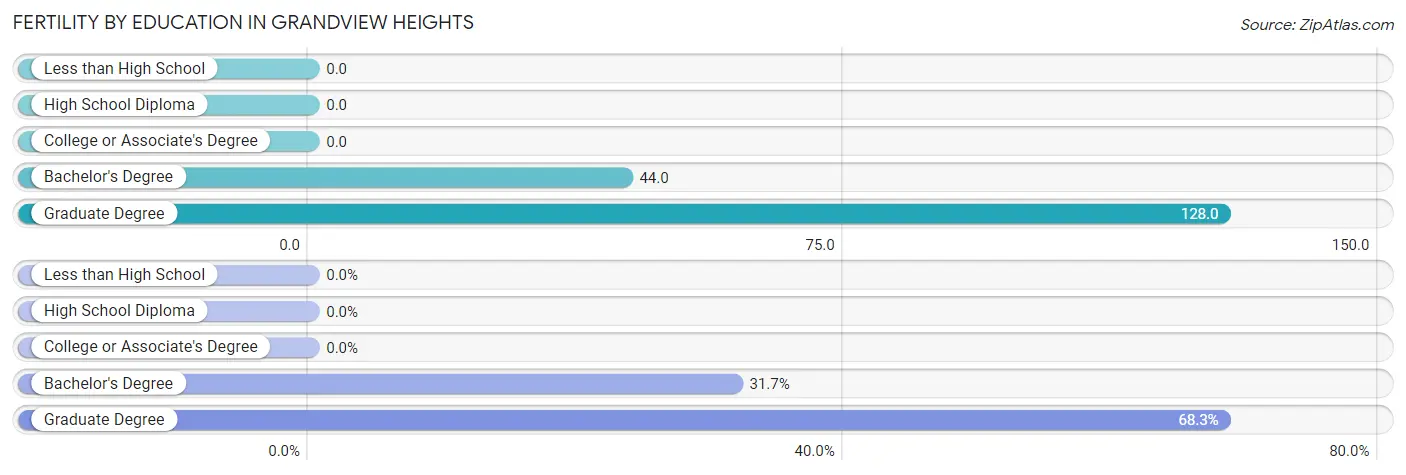
| Educational Attainment | Women with Births | Births / 1,000 Women |
| Less than High School | 0 (0.0%) | 0.0 |
| High School Diploma | 0 (0.0%) | 0.0 |
| College or Associate's Degree | 0 (0.0%) | 0.0 |
| Bachelor's Degree | 46 (31.7%) | 44.0 |
| Graduate Degree | 99 (68.3%) | 128.0 |
| Total | 145 (100.0%) | 67.0 |
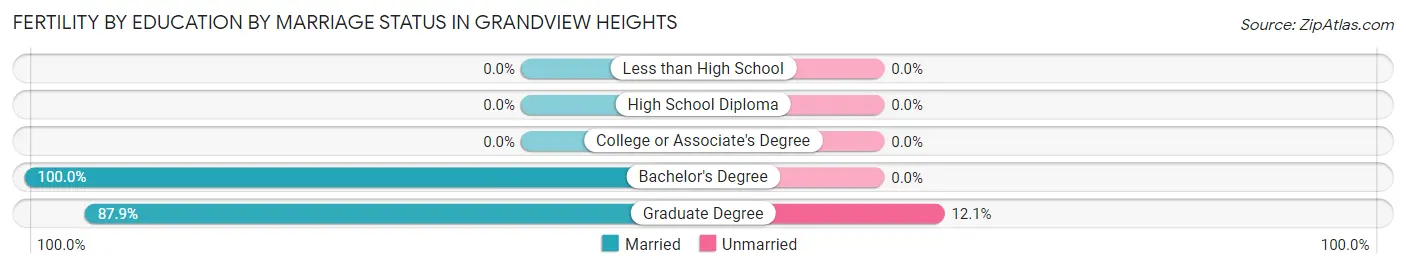
Fertility by Education by Marriage Status in Grandview Heights
8.3% of women with births in Grandview Heights are unmarried. Women with the educational attainment of bachelor's degree are most likely to be married with 100.0% of them married at childbirth, while women with the educational attainment of graduate degree are least likely to be married with 12.1% of them unmarried at childbirth.
| Educational Attainment | Married | Unmarried |
| Less than High School | 0 (0.0%) | 0 (0.0%) |
| High School Diploma | 0 (0.0%) | 0 (0.0%) |
| College or Associate's Degree | 0 (0.0%) | 0 (0.0%) |
| Bachelor's Degree | 46 (100.0%) | 0 (0.0%) |
| Graduate Degree | 87 (87.9%) | 12 (12.1%) |
| Total | 133 (91.7%) | 12 (8.3%) |
Employment Characteristics in Grandview Heights
Employment by Class of Employer in Grandview Heights
Among the 5,166 employed individuals in Grandview Heights, private company employees (3,271 | 63.3%), not-for-profit organizations (669 | 13.0%), and state government employees (473 | 9.2%) make up the most common classes of employment.
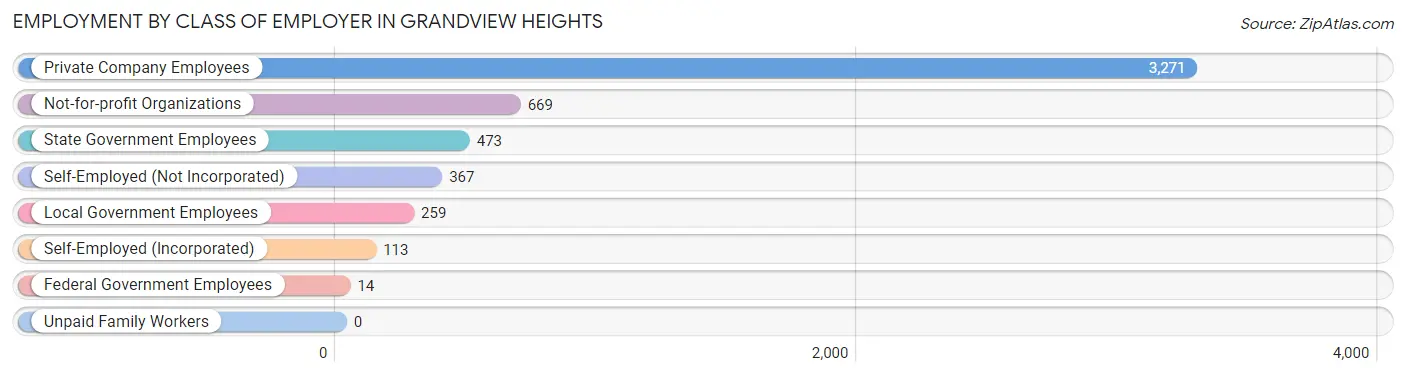
| Employer Class | # Employees | % Employees |
| Private Company Employees | 3,271 | 63.3% |
| Self-Employed (Incorporated) | 113 | 2.2% |
| Self-Employed (Not Incorporated) | 367 | 7.1% |
| Not-for-profit Organizations | 669 | 13.0% |
| Local Government Employees | 259 | 5.0% |
| State Government Employees | 473 | 9.2% |
| Federal Government Employees | 14 | 0.3% |
| Unpaid Family Workers | 0 | 0.0% |
| Total | 5,166 | 100.0% |
Employment Status by Age in Grandview Heights
According to the labor force statistics for Grandview Heights, out of the total population over 16 years of age (6,527), 80.8% or 5,274 individuals are in the labor force, with 1.8% or 95 of them unemployed. The age group with the highest labor force participation rate is 30 to 34 years, with 97.8% or 827 individuals in the labor force. Within the labor force, the 25 to 29 years age range has the highest percentage of unemployed individuals, with 5.6% or 62 of them being unemployed.
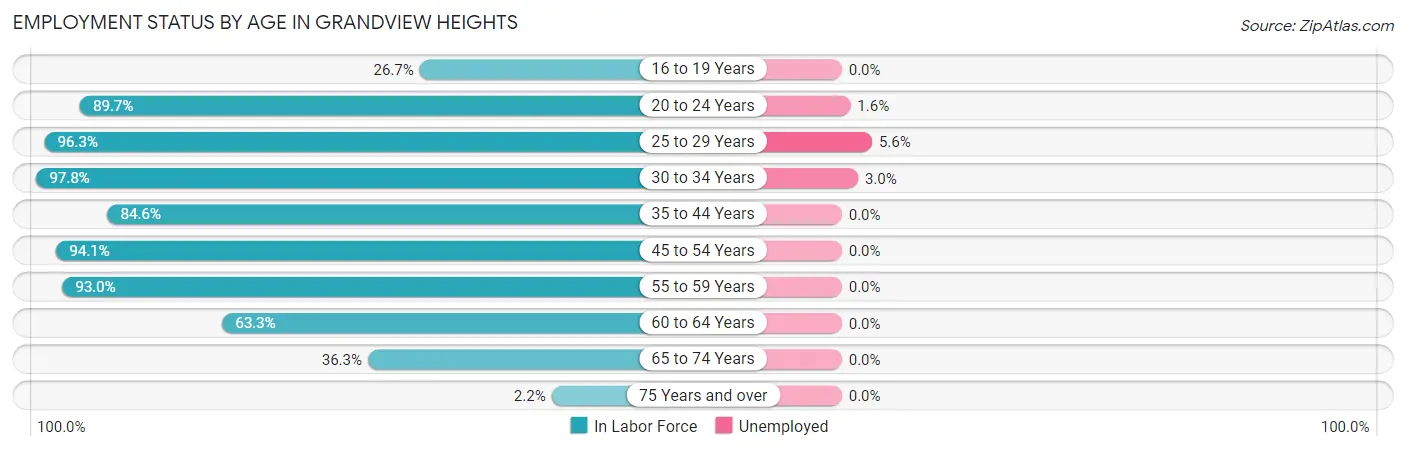
| Age Bracket | In Labor Force | Unemployed |
| 16 to 19 Years | 28 (26.7%) | 0 (0.0%) |
| 20 to 24 Years | 427 (89.7%) | 7 (1.6%) |
| 25 to 29 Years | 1,108 (96.3%) | 62 (5.6%) |
| 30 to 34 Years | 827 (97.8%) | 25 (3.0%) |
| 35 to 44 Years | 1,033 (84.6%) | 0 (0.0%) |
| 45 to 54 Years | 924 (94.1%) | 0 (0.0%) |
| 55 to 59 Years | 595 (93.0%) | 0 (0.0%) |
| 60 to 64 Years | 126 (63.3%) | 0 (0.0%) |
| 65 to 74 Years | 198 (36.3%) | 0 (0.0%) |
| 75 Years and over | 8 (2.2%) | 0 (0.0%) |
| Total | 5,274 (80.8%) | 95 (1.8%) |
Employment Status by Educational Attainment in Grandview Heights
According to labor force statistics for Grandview Heights, 91.5% of individuals (4,611) out of the total population between 25 and 64 years of age (5,039) are in the labor force, with 1.9% or 88 of them being unemployed. The group with the highest labor force participation rate are those with the educational attainment of less than high school, with 100.0% or 39 individuals in the labor force. Within the labor force, individuals with college / associate degree education have the highest percentage of unemployment, with 6.4% or 40 of them being unemployed.
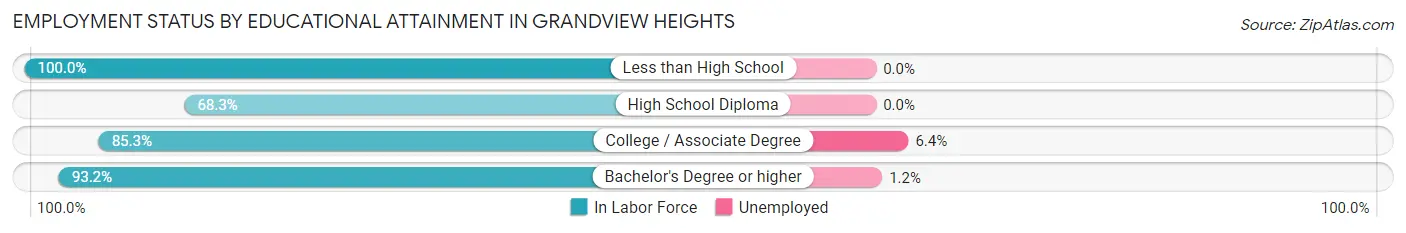
| Educational Attainment | In Labor Force | Unemployed |
| Less than High School | 39 (100.0%) | 0 (0.0%) |
| High School Diploma | 82 (68.3%) | 0 (0.0%) |
| College / Associate Degree | 623 (85.3%) | 47 (6.4%) |
| Bachelor's Degree or higher | 3,868 (93.2%) | 50 (1.2%) |
| Total | 4,611 (91.5%) | 96 (1.9%) |
Employment Occupations by Sex in Grandview Heights
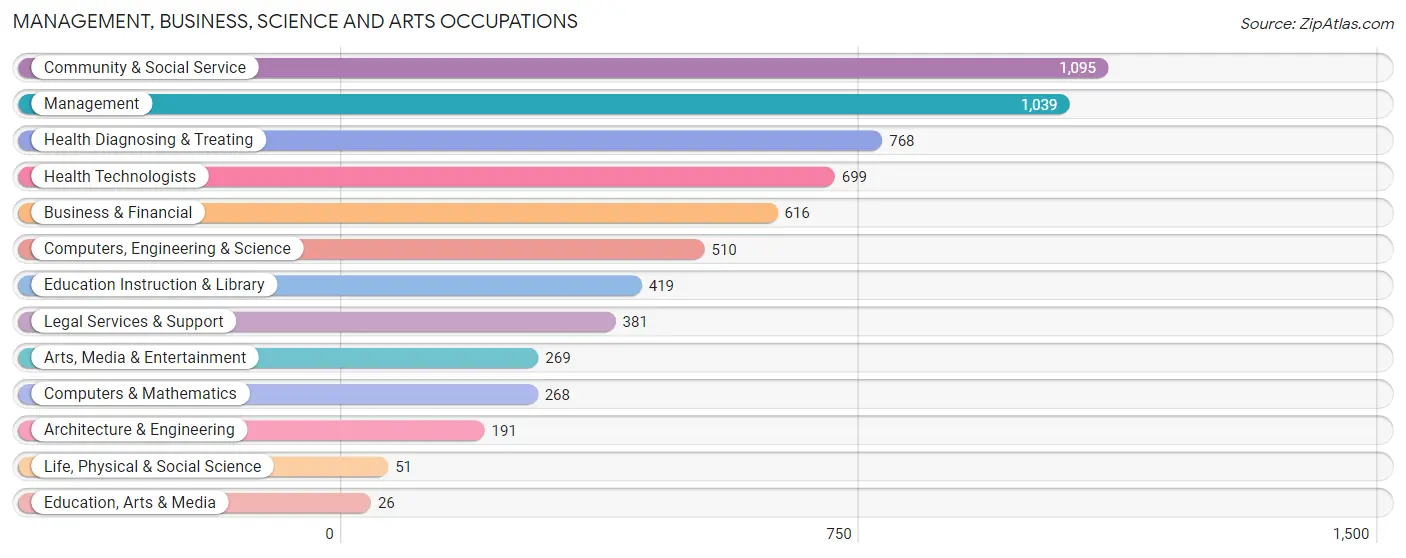
Management, Business, Science and Arts Occupations
The most common Management, Business, Science and Arts occupations in Grandview Heights are Community & Social Service (1,095 | 21.1%), Management (1,039 | 20.1%), Health Diagnosing & Treating (768 | 14.8%), Health Technologists (699 | 13.5%), and Business & Financial (616 | 11.9%).
Management, Business, Science and Arts Occupations by Sex
Within the Management, Business, Science and Arts occupations in Grandview Heights, the most male-oriented occupations are Legal Services & Support (89.5%), Architecture & Engineering (77.0%), and Computers, Engineering & Science (67.1%), while the most female-oriented occupations are Education Instruction & Library (75.7%), Arts, Media & Entertainment (59.1%), and Health Diagnosing & Treating (57.8%).
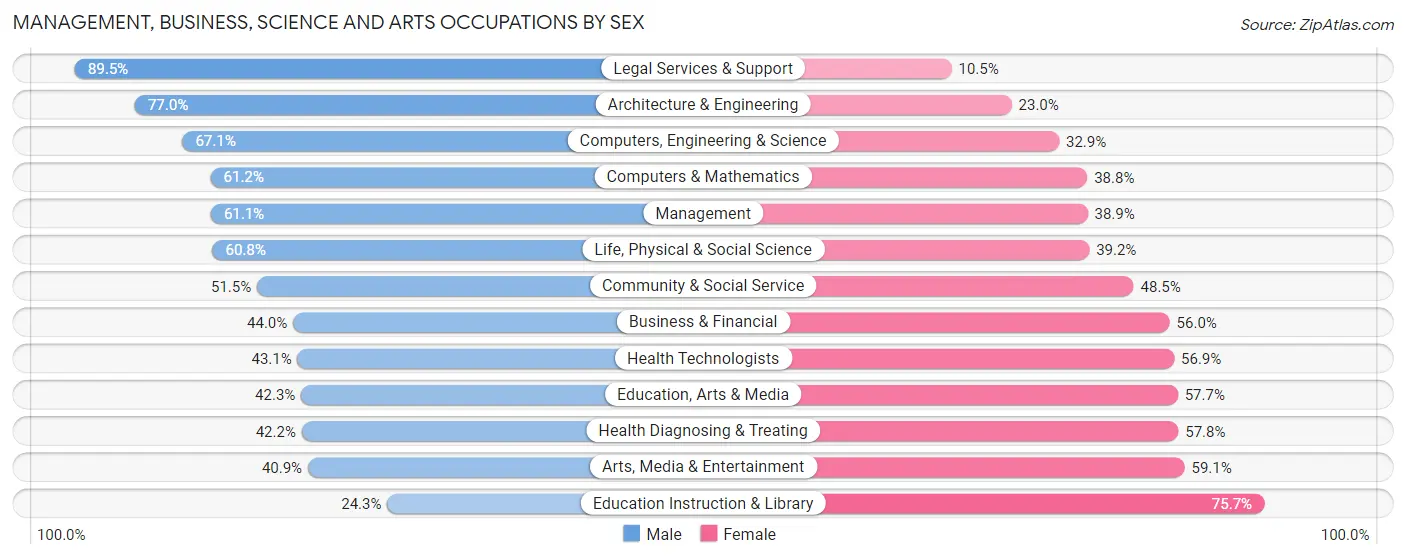
| Occupation | Male | Female |
| Management | 635 (61.1%) | 404 (38.9%) |
| Business & Financial | 271 (44.0%) | 345 (56.0%) |
| Computers, Engineering & Science | 342 (67.1%) | 168 (32.9%) |
| Computers & Mathematics | 164 (61.2%) | 104 (38.8%) |
| Architecture & Engineering | 147 (77.0%) | 44 (23.0%) |
| Life, Physical & Social Science | 31 (60.8%) | 20 (39.2%) |
| Community & Social Service | 564 (51.5%) | 531 (48.5%) |
| Education, Arts & Media | 11 (42.3%) | 15 (57.7%) |
| Legal Services & Support | 341 (89.5%) | 40 (10.5%) |
| Education Instruction & Library | 102 (24.3%) | 317 (75.7%) |
| Arts, Media & Entertainment | 110 (40.9%) | 159 (59.1%) |
| Health Diagnosing & Treating | 324 (42.2%) | 444 (57.8%) |
| Health Technologists | 301 (43.1%) | 398 (56.9%) |
| Total (Category) | 2,136 (53.0%) | 1,892 (47.0%) |
| Total (Overall) | 2,832 (54.7%) | 2,348 (45.3%) |
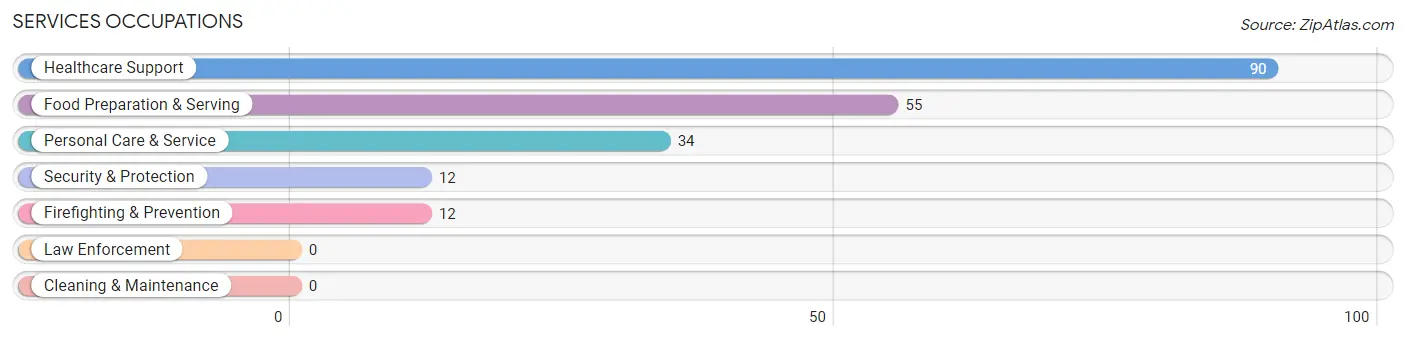
Services Occupations
The most common Services occupations in Grandview Heights are Healthcare Support (90 | 1.7%), Food Preparation & Serving (55 | 1.1%), Personal Care & Service (34 | 0.7%), Security & Protection (12 | 0.2%), and Firefighting & Prevention (12 | 0.2%).
Services Occupations by Sex
Within the Services occupations in Grandview Heights, the most male-oriented occupations are Security & Protection (100.0%), Firefighting & Prevention (100.0%), and Food Preparation & Serving (70.9%), while the most female-oriented occupations are Healthcare Support (94.4%), Personal Care & Service (58.8%), and Food Preparation & Serving (29.1%).
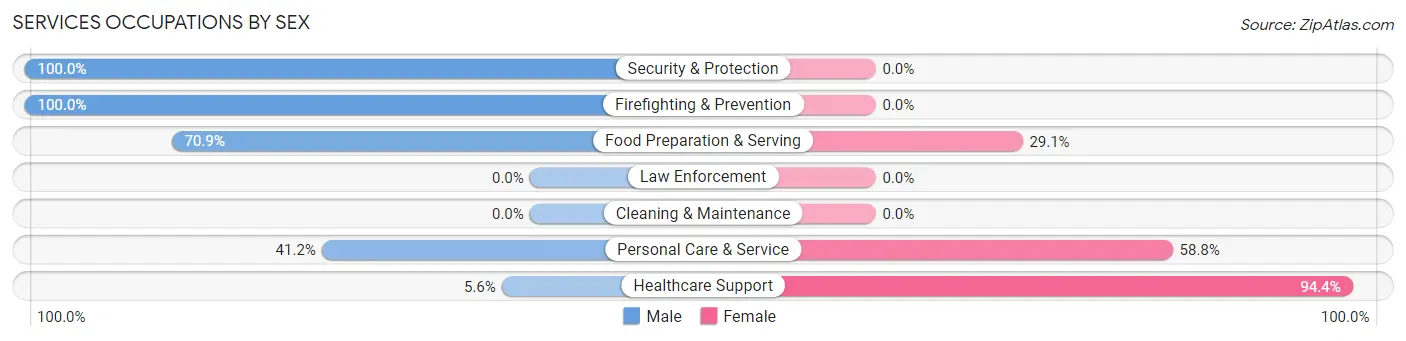
| Occupation | Male | Female |
| Healthcare Support | 5 (5.6%) | 85 (94.4%) |
| Security & Protection | 12 (100.0%) | 0 (0.0%) |
| Firefighting & Prevention | 12 (100.0%) | 0 (0.0%) |
| Law Enforcement | 0 (0.0%) | 0 (0.0%) |
| Food Preparation & Serving | 39 (70.9%) | 16 (29.1%) |
| Cleaning & Maintenance | 0 (0.0%) | 0 (0.0%) |
| Personal Care & Service | 14 (41.2%) | 20 (58.8%) |
| Total (Category) | 70 (36.6%) | 121 (63.3%) |
| Total (Overall) | 2,832 (54.7%) | 2,348 (45.3%) |
Sales and Office Occupations
The most common Sales and Office occupations in Grandview Heights are Sales & Related (435 | 8.4%), and Office & Administration (300 | 5.8%).
Sales and Office Occupations by Sex
| Occupation | Male | Female |
| Sales & Related | 310 (71.3%) | 125 (28.7%) |
| Office & Administration | 117 (39.0%) | 183 (61.0%) |
| Total (Category) | 427 (58.1%) | 308 (41.9%) |
| Total (Overall) | 2,832 (54.7%) | 2,348 (45.3%) |
Natural Resources, Construction and Maintenance Occupations
The most common Natural Resources, Construction and Maintenance occupations in Grandview Heights are Construction & Extraction (46 | 0.9%), and Installation, Maintenance & Repair (31 | 0.6%).
Natural Resources, Construction and Maintenance Occupations by Sex
| Occupation | Male | Female |
| Farming, Fishing & Forestry | 0 (0.0%) | 0 (0.0%) |
| Construction & Extraction | 46 (100.0%) | 0 (0.0%) |
| Installation, Maintenance & Repair | 31 (100.0%) | 0 (0.0%) |
| Total (Category) | 77 (100.0%) | 0 (0.0%) |
| Total (Overall) | 2,832 (54.7%) | 2,348 (45.3%) |
Production, Transportation and Moving Occupations
The most common Production, Transportation and Moving occupations in Grandview Heights are Production (104 | 2.0%), and Material Moving (45 | 0.9%).
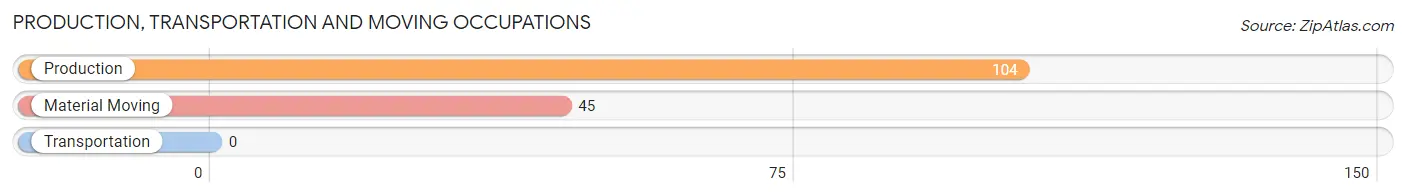
Production, Transportation and Moving Occupations by Sex
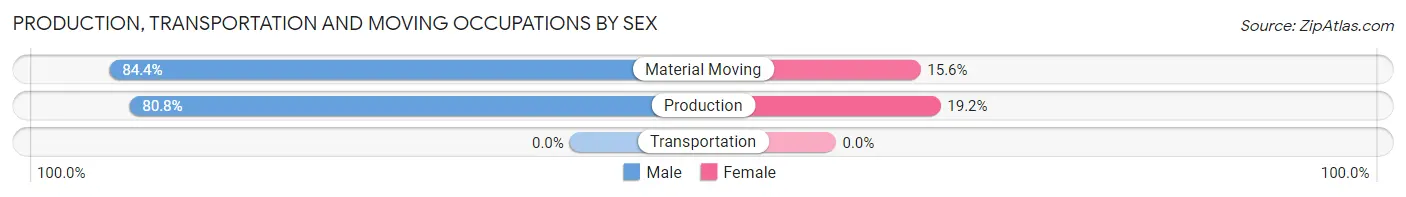
| Occupation | Male | Female |
| Production | 84 (80.8%) | 20 (19.2%) |
| Transportation | 0 (0.0%) | 0 (0.0%) |
| Material Moving | 38 (84.4%) | 7 (15.6%) |
| Total (Category) | 122 (81.9%) | 27 (18.1%) |
| Total (Overall) | 2,832 (54.7%) | 2,348 (45.3%) |
Employment Industries by Sex in Grandview Heights
Employment Industries in Grandview Heights
The major employment industries in Grandview Heights include Health Care & Social Assistance (996 | 19.2%), Professional & Scientific (922 | 17.8%), Educational Services (575 | 11.1%), Finance & Insurance (504 | 9.7%), and Manufacturing (372 | 7.2%).
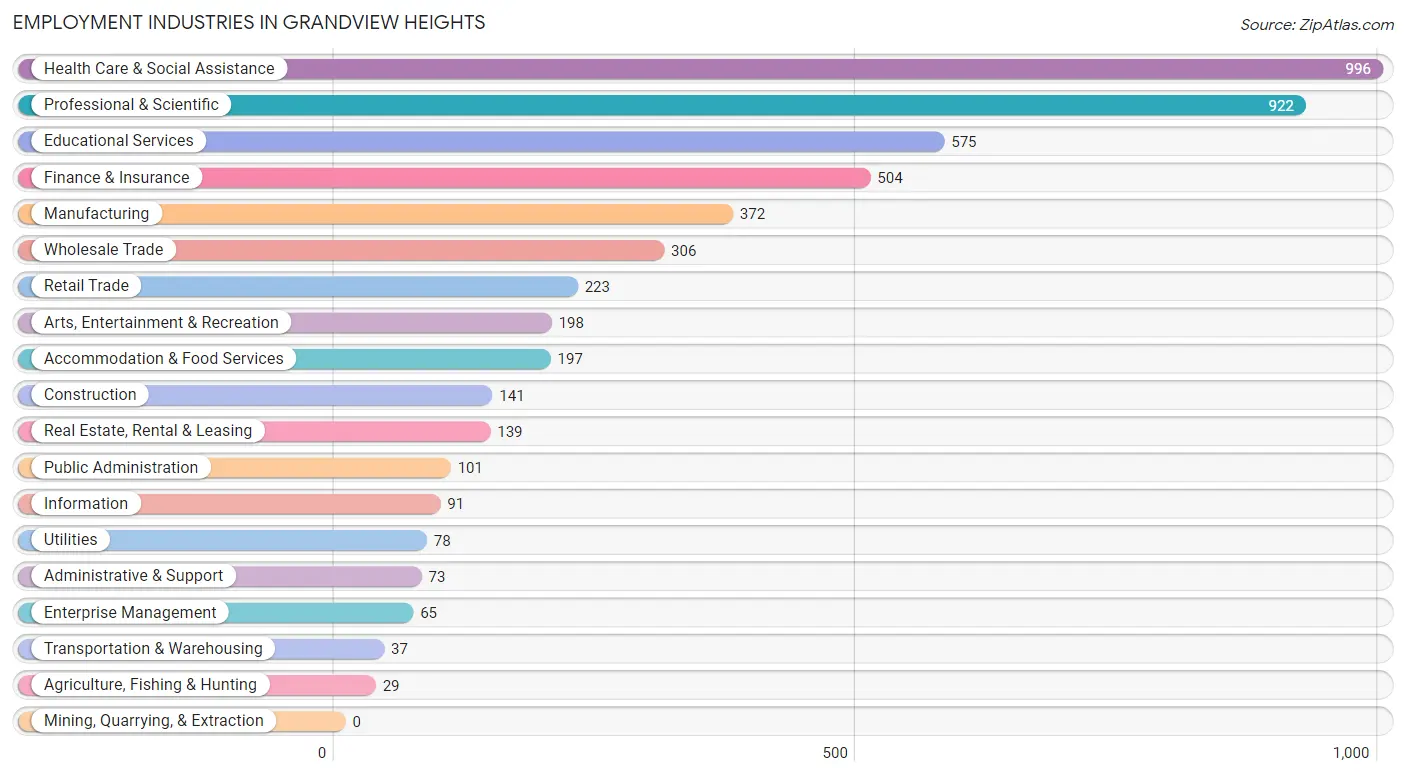
Employment Industries by Sex in Grandview Heights
The Grandview Heights industries that see more men than women are Transportation & Warehousing (100.0%), Construction (92.9%), and Public Administration (86.1%), whereas the industries that tend to have a higher number of women are Arts, Entertainment & Recreation (86.4%), Enterprise Management (80.0%), and Utilities (65.4%).
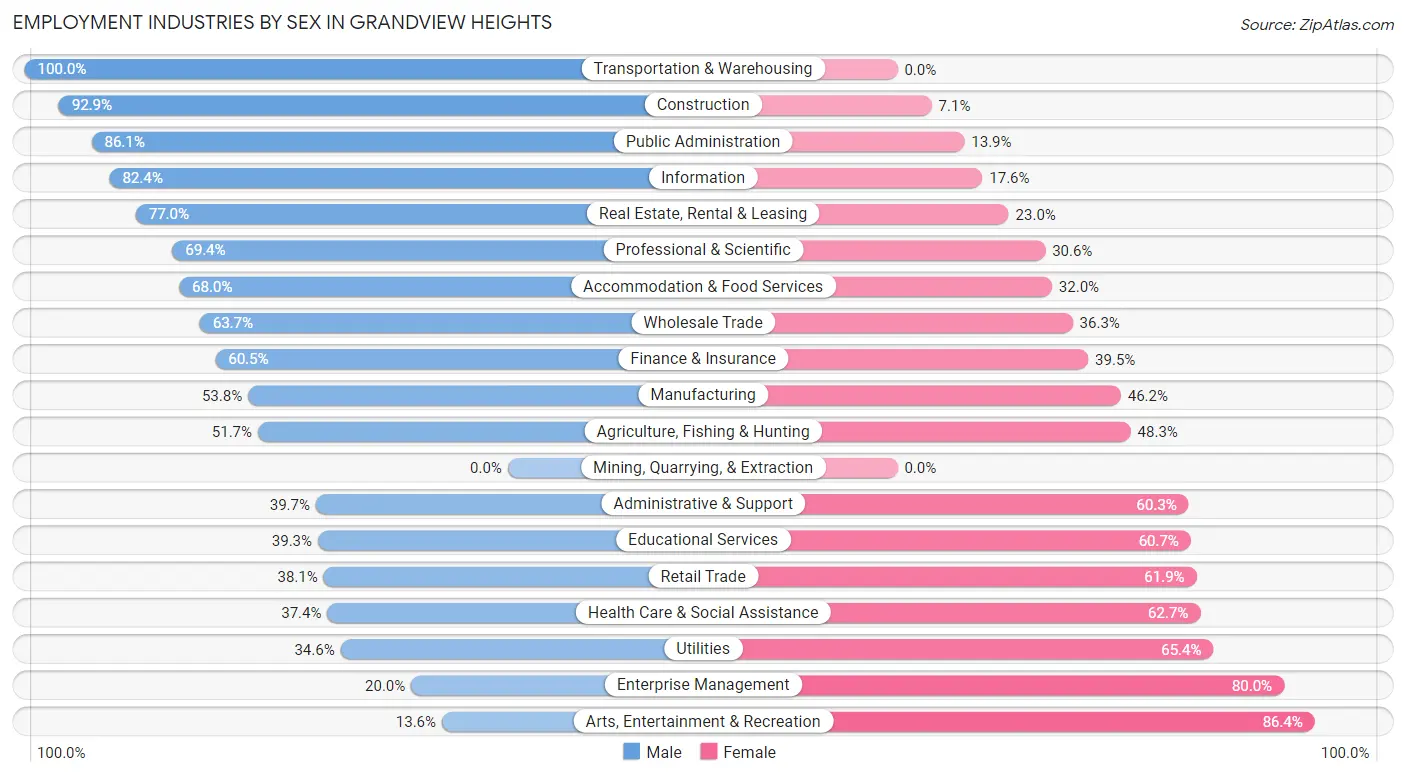
| Industry | Male | Female |
| Agriculture, Fishing & Hunting | 15 (51.7%) | 14 (48.3%) |
| Mining, Quarrying, & Extraction | 0 (0.0%) | 0 (0.0%) |
| Construction | 131 (92.9%) | 10 (7.1%) |
| Manufacturing | 200 (53.8%) | 172 (46.2%) |
| Wholesale Trade | 195 (63.7%) | 111 (36.3%) |
| Retail Trade | 85 (38.1%) | 138 (61.9%) |
| Transportation & Warehousing | 37 (100.0%) | 0 (0.0%) |
| Utilities | 27 (34.6%) | 51 (65.4%) |
| Information | 75 (82.4%) | 16 (17.6%) |
| Finance & Insurance | 305 (60.5%) | 199 (39.5%) |
| Real Estate, Rental & Leasing | 107 (77.0%) | 32 (23.0%) |
| Professional & Scientific | 640 (69.4%) | 282 (30.6%) |
| Enterprise Management | 13 (20.0%) | 52 (80.0%) |
| Administrative & Support | 29 (39.7%) | 44 (60.3%) |
| Educational Services | 226 (39.3%) | 349 (60.7%) |
| Health Care & Social Assistance | 372 (37.3%) | 624 (62.6%) |
| Arts, Entertainment & Recreation | 27 (13.6%) | 171 (86.4%) |
| Accommodation & Food Services | 134 (68.0%) | 63 (32.0%) |
| Public Administration | 87 (86.1%) | 14 (13.9%) |
| Total | 2,832 (54.7%) | 2,348 (45.3%) |
Education in Grandview Heights
School Enrollment in Grandview Heights
The most common levels of schooling among the 2,062 students in Grandview Heights are middle school (492 | 23.9%), elementary school (491 | 23.8%), and graduate / professional (432 | 20.9%).
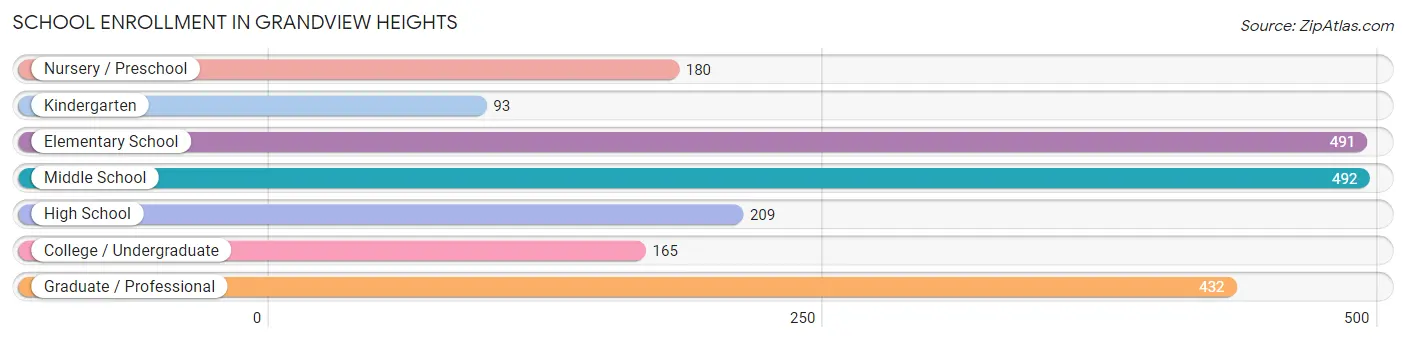
| School Level | # Students | % Students |
| Nursery / Preschool | 180 | 8.7% |
| Kindergarten | 93 | 4.5% |
| Elementary School | 491 | 23.8% |
| Middle School | 492 | 23.9% |
| High School | 209 | 10.1% |
| College / Undergraduate | 165 | 8.0% |
| Graduate / Professional | 432 | 20.9% |
| Total | 2,062 | 100.0% |
School Enrollment by Age by Funding Source in Grandview Heights
Out of a total of 2,062 students who are enrolled in schools in Grandview Heights, 445 (21.6%) attend a private institution, while the remaining 1,617 (78.4%) are enrolled in public schools. The age group of 3 to 4 year olds has the highest likelihood of being enrolled in private schools, with 129 (82.2% in the age bracket) enrolled. Conversely, the age group of 18 to 19 year olds has the lowest likelihood of being enrolled in a private school, with 22 (100.0% in the age bracket) attending a public institution.
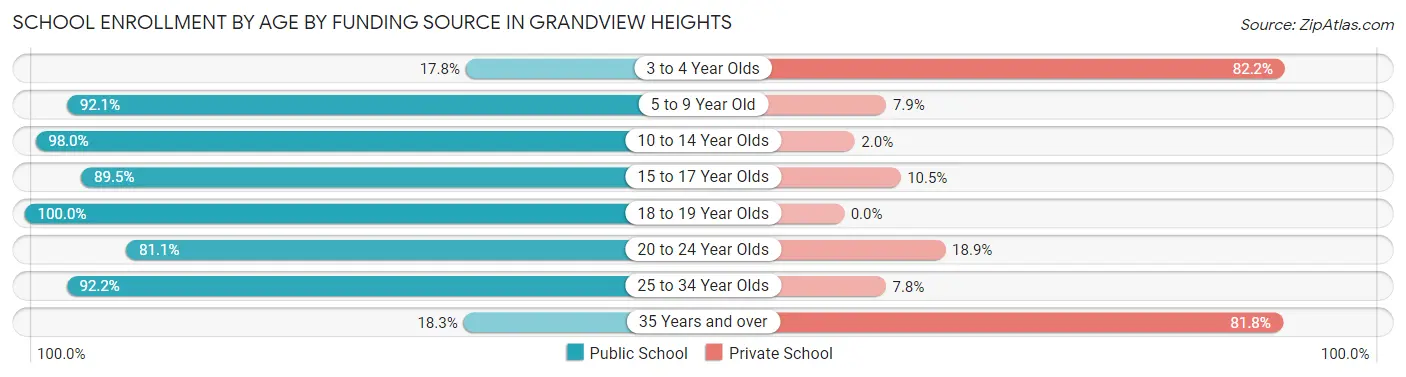
| Age Bracket | Public School | Private School |
| 3 to 4 Year Olds | 28 (17.8%) | 129 (82.2%) |
| 5 to 9 Year Old | 526 (92.1%) | 45 (7.9%) |
| 10 to 14 Year Olds | 589 (98.0%) | 12 (2.0%) |
| 15 to 17 Year Olds | 102 (89.5%) | 12 (10.5%) |
| 18 to 19 Year Olds | 22 (100.0%) | 0 (0.0%) |
| 20 to 24 Year Olds | 103 (81.1%) | 24 (18.9%) |
| 25 to 34 Year Olds | 201 (92.2%) | 17 (7.8%) |
| 35 Years and over | 46 (18.2%) | 206 (81.8%) |
| Total | 1,617 (78.4%) | 445 (21.6%) |
Educational Attainment by Field of Study in Grandview Heights
Business (797 | 15.8%), social sciences (777 | 15.4%), bio, nature & agricultural (641 | 12.7%), science & technology (553 | 11.0%), and engineering (415 | 8.3%) are the most common fields of study among 5,033 individuals in Grandview Heights who have obtained a bachelor's degree or higher.
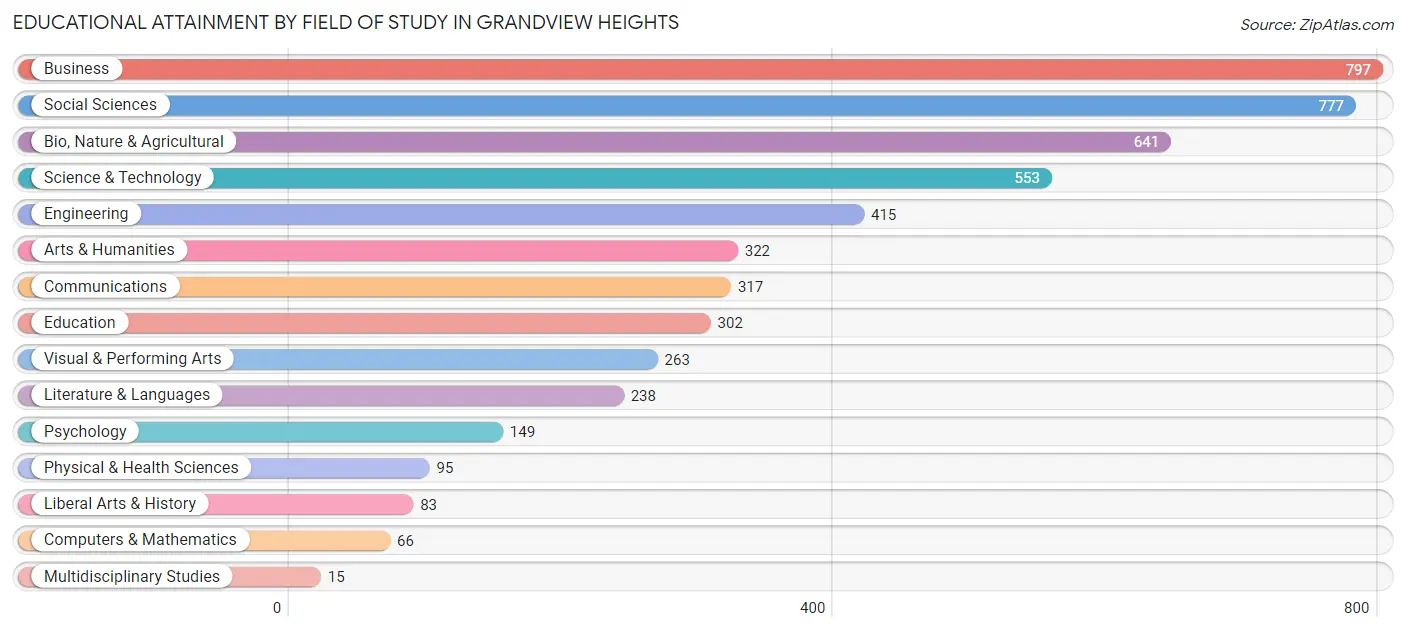
| Field of Study | # Graduates | % Graduates |
| Computers & Mathematics | 66 | 1.3% |
| Bio, Nature & Agricultural | 641 | 12.7% |
| Physical & Health Sciences | 95 | 1.9% |
| Psychology | 149 | 3.0% |
| Social Sciences | 777 | 15.4% |
| Engineering | 415 | 8.3% |
| Multidisciplinary Studies | 15 | 0.3% |
| Science & Technology | 553 | 11.0% |
| Business | 797 | 15.8% |
| Education | 302 | 6.0% |
| Literature & Languages | 238 | 4.7% |
| Liberal Arts & History | 83 | 1.7% |
| Visual & Performing Arts | 263 | 5.2% |
| Communications | 317 | 6.3% |
| Arts & Humanities | 322 | 6.4% |
| Total | 5,033 | 100.0% |
Transportation & Commute in Grandview Heights
Vehicle Availability by Sex in Grandview Heights
The most prevalent vehicle ownership categories in Grandview Heights are males with 2 vehicles (1,813, accounting for 64.3%) and females with 2 vehicles (1,203, making up 77.2%).
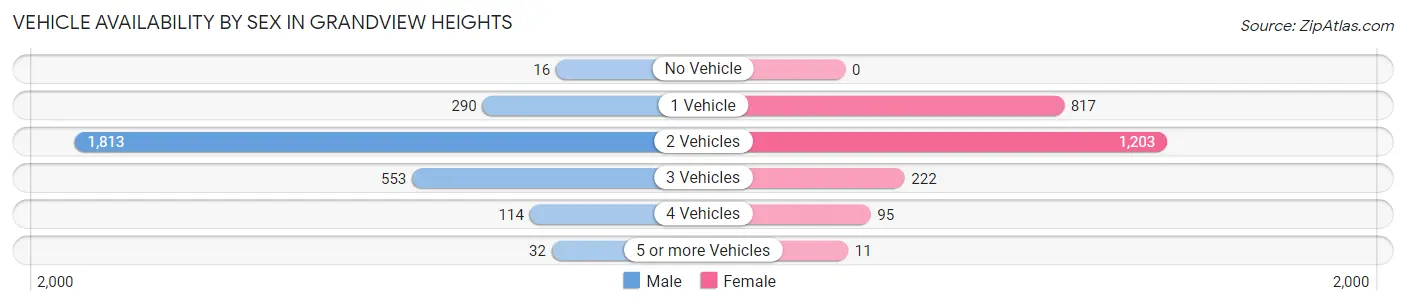
| Vehicles Available | Male | Female |
| No Vehicle | 16 (0.6%) | 0 (0.0%) |
| 1 Vehicle | 290 (10.3%) | 817 (34.8%) |
| 2 Vehicles | 1,813 (64.3%) | 1,203 (51.2%) |
| 3 Vehicles | 553 (19.6%) | 222 (9.5%) |
| 4 Vehicles | 114 (4.1%) | 95 (4.1%) |
| 5 or more Vehicles | 32 (1.1%) | 11 (0.5%) |
| Total | 2,818 (100.0%) | 2,348 (100.0%) |
Commute Time in Grandview Heights
The most frequently occuring commute durations in Grandview Heights are 15 to 19 minutes (877 commuters, 21.3%), 10 to 14 minutes (868 commuters, 21.1%), and 20 to 24 minutes (776 commuters, 18.9%).
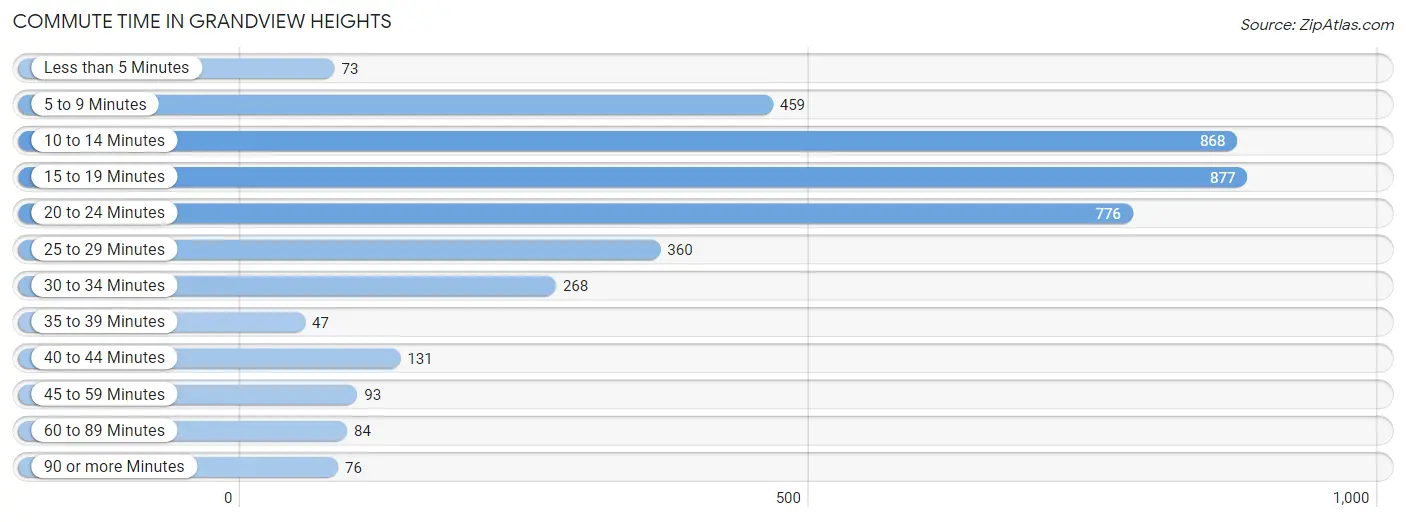
| Commute Time | # Commuters | % Commuters |
| Less than 5 Minutes | 73 | 1.8% |
| 5 to 9 Minutes | 459 | 11.2% |
| 10 to 14 Minutes | 868 | 21.1% |
| 15 to 19 Minutes | 877 | 21.3% |
| 20 to 24 Minutes | 776 | 18.9% |
| 25 to 29 Minutes | 360 | 8.7% |
| 30 to 34 Minutes | 268 | 6.5% |
| 35 to 39 Minutes | 47 | 1.1% |
| 40 to 44 Minutes | 131 | 3.2% |
| 45 to 59 Minutes | 93 | 2.3% |
| 60 to 89 Minutes | 84 | 2.0% |
| 90 or more Minutes | 76 | 1.8% |
Commute Time by Sex in Grandview Heights
The most common commute times in Grandview Heights are 20 to 24 minutes (518 commuters, 23.7%) for males and 10 to 14 minutes (405 commuters, 21.0%) for females.
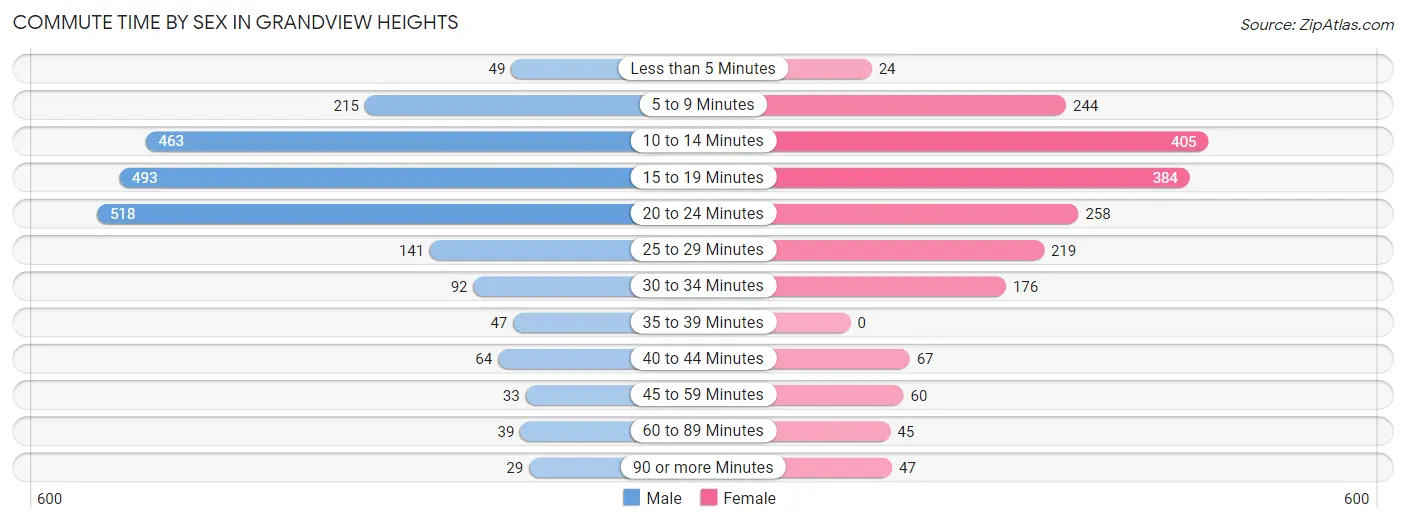
| Commute Time | Male | Female |
| Less than 5 Minutes | 49 (2.2%) | 24 (1.2%) |
| 5 to 9 Minutes | 215 (9.9%) | 244 (12.7%) |
| 10 to 14 Minutes | 463 (21.2%) | 405 (21.0%) |
| 15 to 19 Minutes | 493 (22.6%) | 384 (19.9%) |
| 20 to 24 Minutes | 518 (23.7%) | 258 (13.4%) |
| 25 to 29 Minutes | 141 (6.5%) | 219 (11.4%) |
| 30 to 34 Minutes | 92 (4.2%) | 176 (9.1%) |
| 35 to 39 Minutes | 47 (2.1%) | 0 (0.0%) |
| 40 to 44 Minutes | 64 (2.9%) | 67 (3.5%) |
| 45 to 59 Minutes | 33 (1.5%) | 60 (3.1%) |
| 60 to 89 Minutes | 39 (1.8%) | 45 (2.3%) |
| 90 or more Minutes | 29 (1.3%) | 47 (2.4%) |
Time of Departure to Work by Sex in Grandview Heights
The most frequent times of departure to work in Grandview Heights are 7:30 AM to 7:59 AM (562, 25.7%) for males and 8:00 AM to 8:29 AM (462, 23.9%) for females.
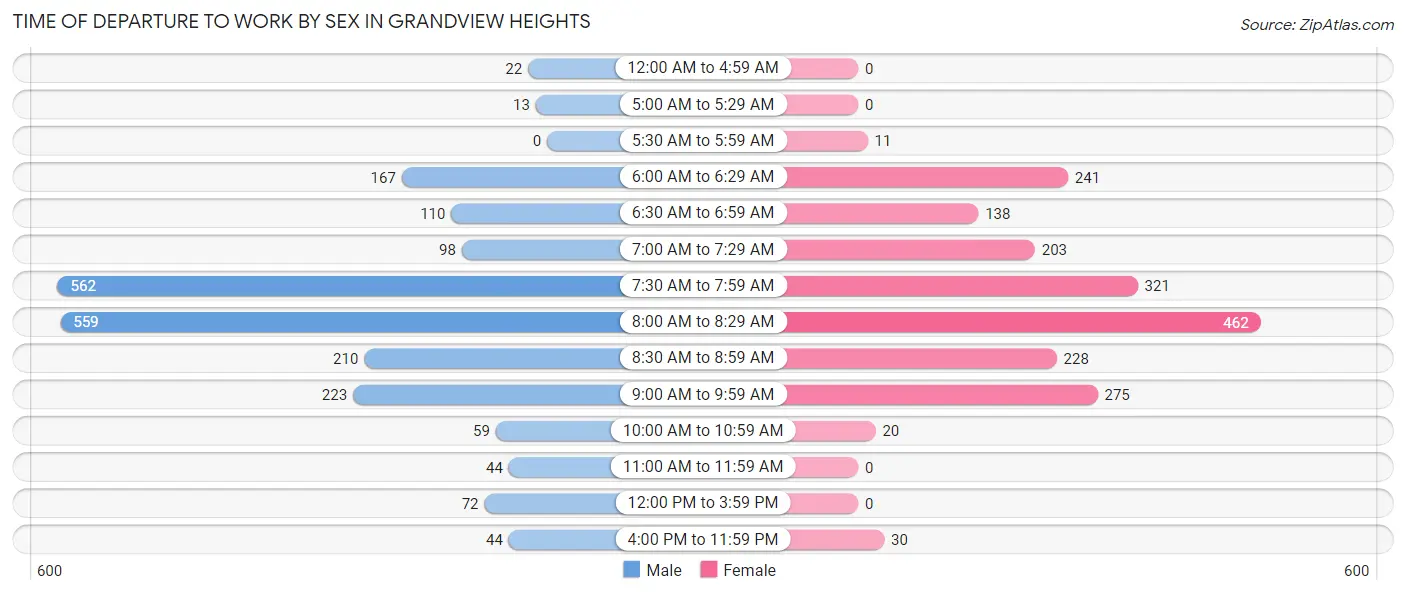
| Time of Departure | Male | Female |
| 12:00 AM to 4:59 AM | 22 (1.0%) | 0 (0.0%) |
| 5:00 AM to 5:29 AM | 13 (0.6%) | 0 (0.0%) |
| 5:30 AM to 5:59 AM | 0 (0.0%) | 11 (0.6%) |
| 6:00 AM to 6:29 AM | 167 (7.6%) | 241 (12.5%) |
| 6:30 AM to 6:59 AM | 110 (5.0%) | 138 (7.1%) |
| 7:00 AM to 7:29 AM | 98 (4.5%) | 203 (10.5%) |
| 7:30 AM to 7:59 AM | 562 (25.7%) | 321 (16.6%) |
| 8:00 AM to 8:29 AM | 559 (25.6%) | 462 (23.9%) |
| 8:30 AM to 8:59 AM | 210 (9.6%) | 228 (11.8%) |
| 9:00 AM to 9:59 AM | 223 (10.2%) | 275 (14.3%) |
| 10:00 AM to 10:59 AM | 59 (2.7%) | 20 (1.0%) |
| 11:00 AM to 11:59 AM | 44 (2.0%) | 0 (0.0%) |
| 12:00 PM to 3:59 PM | 72 (3.3%) | 0 (0.0%) |
| 4:00 PM to 11:59 PM | 44 (2.0%) | 30 (1.6%) |
| Total | 2,183 (100.0%) | 1,929 (100.0%) |
Housing Occupancy in Grandview Heights
Occupancy by Ownership in Grandview Heights
Of the total 3,750 dwellings in Grandview Heights, owner-occupied units account for 2,144 (57.2%), while renter-occupied units make up 1,606 (42.8%).
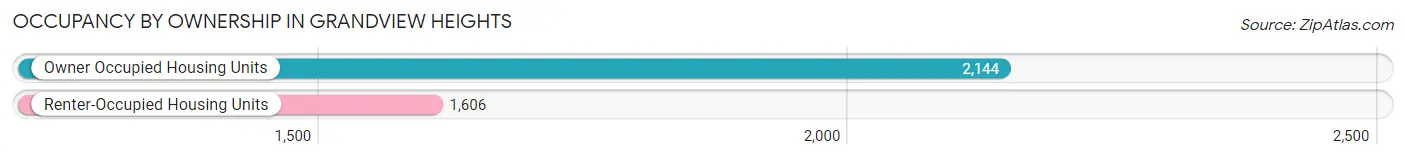
| Occupancy | # Housing Units | % Housing Units |
| Owner Occupied Housing Units | 2,144 | 57.2% |
| Renter-Occupied Housing Units | 1,606 | 42.8% |
| Total Occupied Housing Units | 3,750 | 100.0% |
Occupancy by Household Size in Grandview Heights
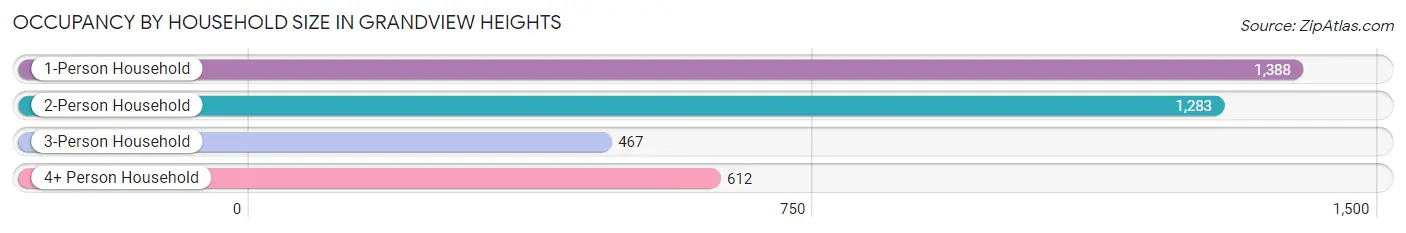
| Household Size | # Housing Units | % Housing Units |
| 1-Person Household | 1,388 | 37.0% |
| 2-Person Household | 1,283 | 34.2% |
| 3-Person Household | 467 | 12.4% |
| 4+ Person Household | 612 | 16.3% |
| Total Housing Units | 3,750 | 100.0% |
Occupancy by Ownership by Household Size in Grandview Heights
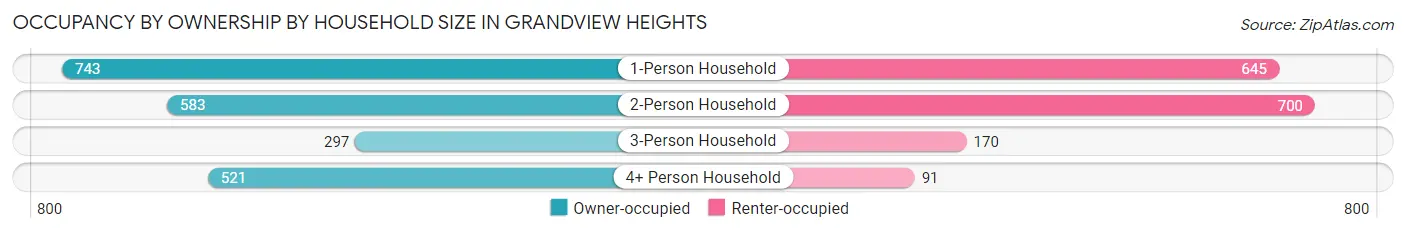
| Household Size | Owner-occupied | Renter-occupied |
| 1-Person Household | 743 (53.5%) | 645 (46.5%) |
| 2-Person Household | 583 (45.4%) | 700 (54.6%) |
| 3-Person Household | 297 (63.6%) | 170 (36.4%) |
| 4+ Person Household | 521 (85.1%) | 91 (14.9%) |
| Total Housing Units | 2,144 (57.2%) | 1,606 (42.8%) |
Occupancy by Educational Attainment in Grandview Heights
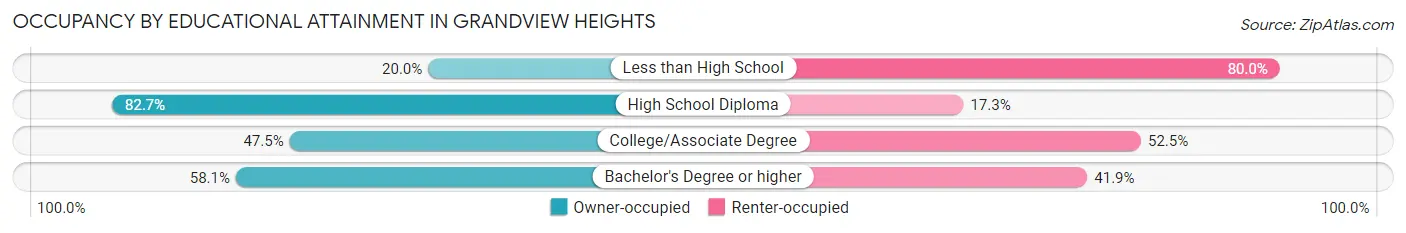
| Household Size | Owner-occupied | Renter-occupied |
| Less than High School | 9 (20.0%) | 36 (80.0%) |
| High School Diploma | 129 (82.7%) | 27 (17.3%) |
| College/Associate Degree | 254 (47.5%) | 281 (52.5%) |
| Bachelor's Degree or higher | 1,752 (58.1%) | 1,262 (41.9%) |
Occupancy by Age of Householder in Grandview Heights
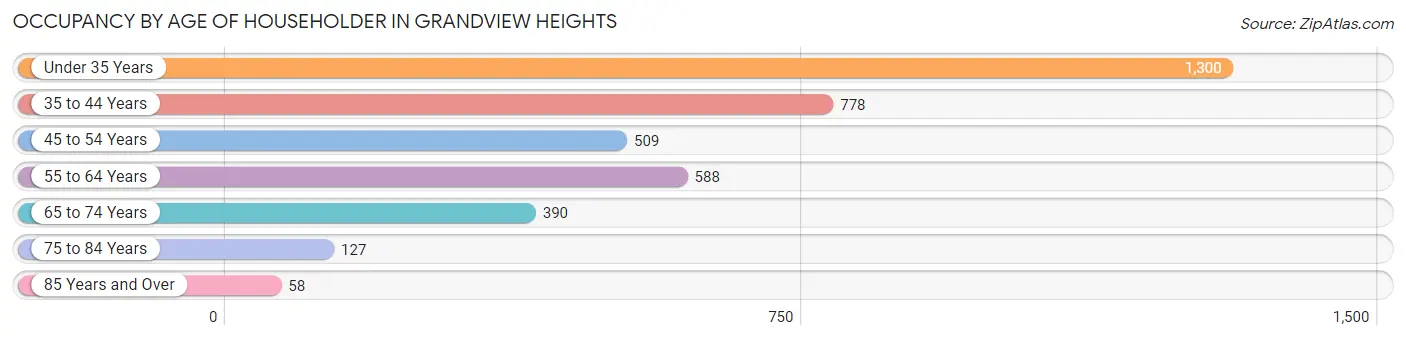
| Age Bracket | # Households | % Households |
| Under 35 Years | 1,300 | 34.7% |
| 35 to 44 Years | 778 | 20.7% |
| 45 to 54 Years | 509 | 13.6% |
| 55 to 64 Years | 588 | 15.7% |
| 65 to 74 Years | 390 | 10.4% |
| 75 to 84 Years | 127 | 3.4% |
| 85 Years and Over | 58 | 1.5% |
| Total | 3,750 | 100.0% |
Housing Finances in Grandview Heights
Median Income by Occupancy in Grandview Heights
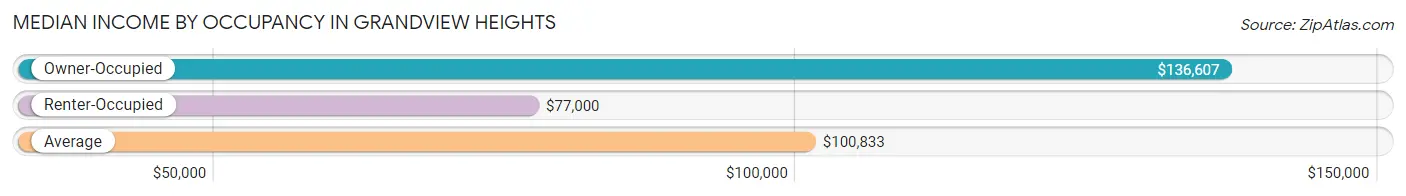
| Occupancy Type | # Households | Median Income |
| Owner-Occupied | 2,144 (57.2%) | $136,607 |
| Renter-Occupied | 1,606 (42.8%) | $77,000 |
| Average | 3,750 (100.0%) | $100,833 |
Occupancy by Householder Income Bracket in Grandview Heights
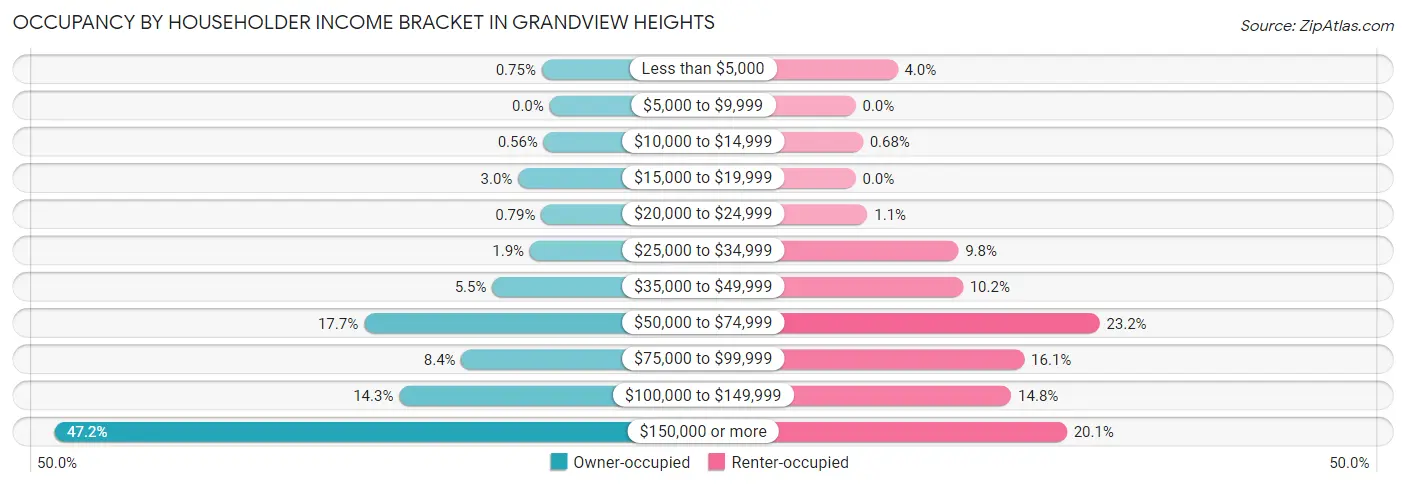
| Income Bracket | Owner-occupied | Renter-occupied |
| Less than $5,000 | 16 (0.7%) | 64 (4.0%) |
| $5,000 to $9,999 | 0 (0.0%) | 0 (0.0%) |
| $10,000 to $14,999 | 12 (0.6%) | 11 (0.7%) |
| $15,000 to $19,999 | 64 (3.0%) | 0 (0.0%) |
| $20,000 to $24,999 | 17 (0.8%) | 18 (1.1%) |
| $25,000 to $34,999 | 40 (1.9%) | 157 (9.8%) |
| $35,000 to $49,999 | 117 (5.5%) | 164 (10.2%) |
| $50,000 to $74,999 | 379 (17.7%) | 373 (23.2%) |
| $75,000 to $99,999 | 180 (8.4%) | 258 (16.1%) |
| $100,000 to $149,999 | 307 (14.3%) | 238 (14.8%) |
| $150,000 or more | 1,012 (47.2%) | 323 (20.1%) |
| Total | 2,144 (100.0%) | 1,606 (100.0%) |
Monthly Housing Cost Tiers in Grandview Heights
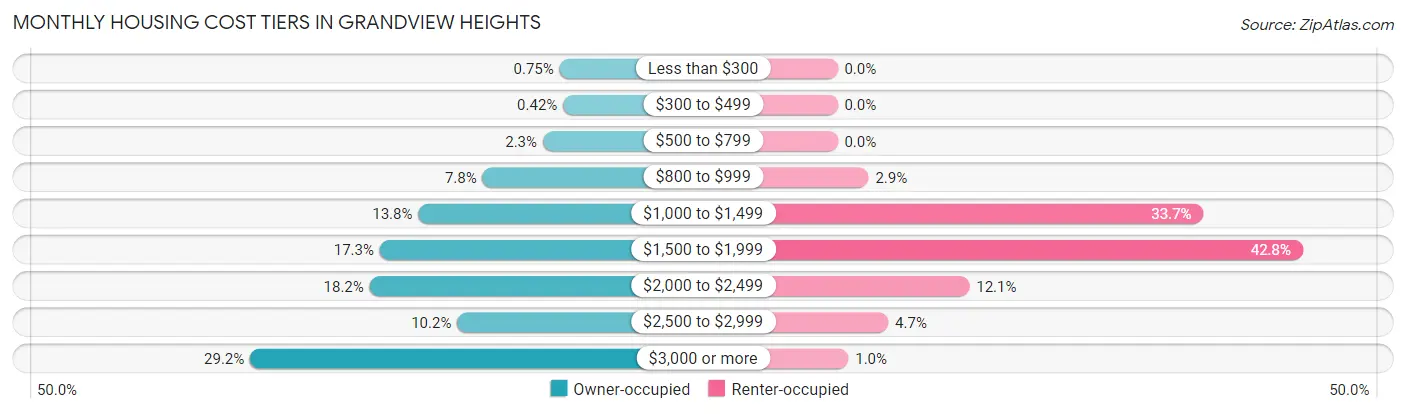
| Monthly Cost | Owner-occupied | Renter-occupied |
| Less than $300 | 16 (0.7%) | 0 (0.0%) |
| $300 to $499 | 9 (0.4%) | 0 (0.0%) |
| $500 to $799 | 49 (2.3%) | 0 (0.0%) |
| $800 to $999 | 168 (7.8%) | 46 (2.9%) |
| $1,000 to $1,499 | 295 (13.8%) | 541 (33.7%) |
| $1,500 to $1,999 | 371 (17.3%) | 688 (42.8%) |
| $2,000 to $2,499 | 391 (18.2%) | 195 (12.1%) |
| $2,500 to $2,999 | 218 (10.2%) | 75 (4.7%) |
| $3,000 or more | 627 (29.2%) | 16 (1.0%) |
| Total | 2,144 (100.0%) | 1,606 (100.0%) |
Physical Housing Characteristics in Grandview Heights
Housing Structures in Grandview Heights
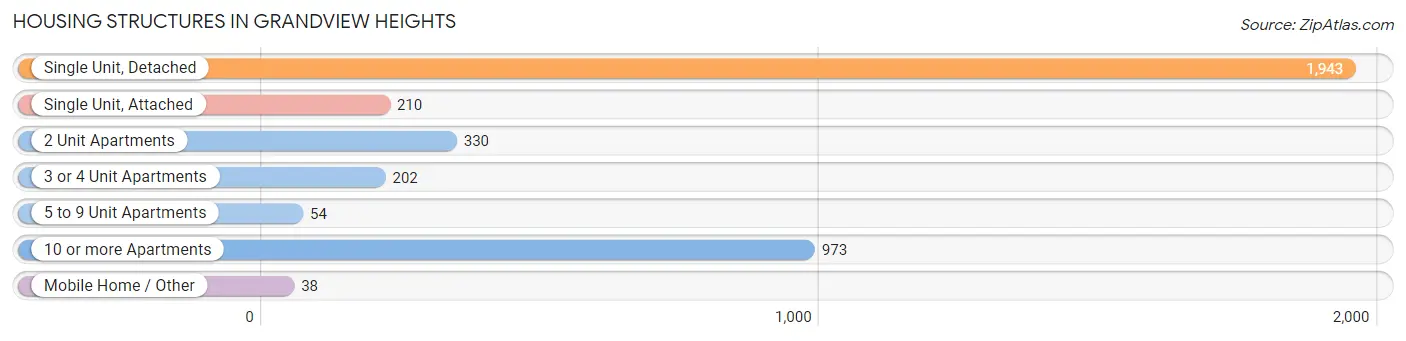
| Structure Type | # Housing Units | % Housing Units |
| Single Unit, Detached | 1,943 | 51.8% |
| Single Unit, Attached | 210 | 5.6% |
| 2 Unit Apartments | 330 | 8.8% |
| 3 or 4 Unit Apartments | 202 | 5.4% |
| 5 to 9 Unit Apartments | 54 | 1.4% |
| 10 or more Apartments | 973 | 26.0% |
| Mobile Home / Other | 38 | 1.0% |
| Total | 3,750 | 100.0% |
Housing Structures by Occupancy in Grandview Heights
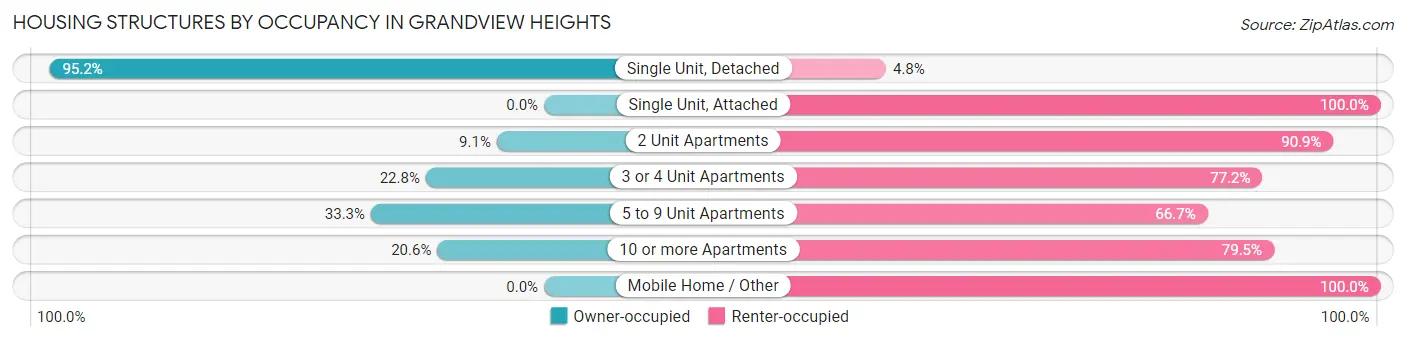
| Structure Type | Owner-occupied | Renter-occupied |
| Single Unit, Detached | 1,850 (95.2%) | 93 (4.8%) |
| Single Unit, Attached | 0 (0.0%) | 210 (100.0%) |
| 2 Unit Apartments | 30 (9.1%) | 300 (90.9%) |
| 3 or 4 Unit Apartments | 46 (22.8%) | 156 (77.2%) |
| 5 to 9 Unit Apartments | 18 (33.3%) | 36 (66.7%) |
| 10 or more Apartments | 200 (20.5%) | 773 (79.4%) |
| Mobile Home / Other | 0 (0.0%) | 38 (100.0%) |
| Total | 2,144 (57.2%) | 1,606 (42.8%) |
Housing Structures by Number of Rooms in Grandview Heights
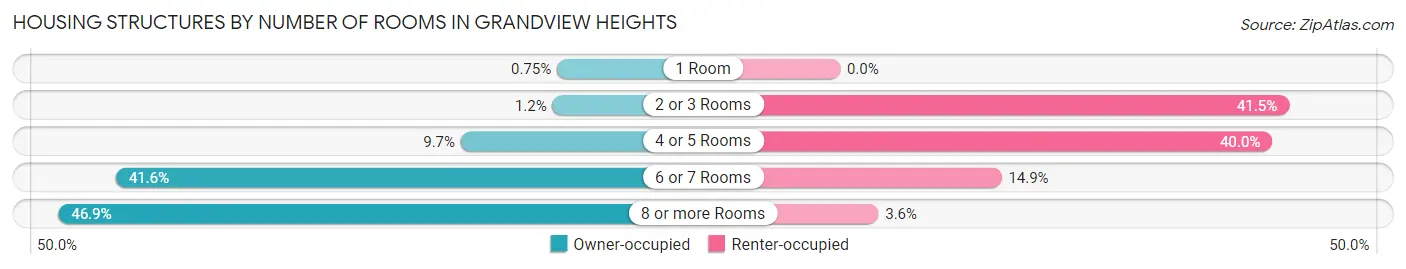
| Number of Rooms | Owner-occupied | Renter-occupied |
| 1 Room | 16 (0.7%) | 0 (0.0%) |
| 2 or 3 Rooms | 25 (1.2%) | 667 (41.5%) |
| 4 or 5 Rooms | 207 (9.7%) | 642 (40.0%) |
| 6 or 7 Rooms | 891 (41.6%) | 240 (14.9%) |
| 8 or more Rooms | 1,005 (46.9%) | 57 (3.5%) |
| Total | 2,144 (100.0%) | 1,606 (100.0%) |
Housing Structure by Heating Type in Grandview Heights
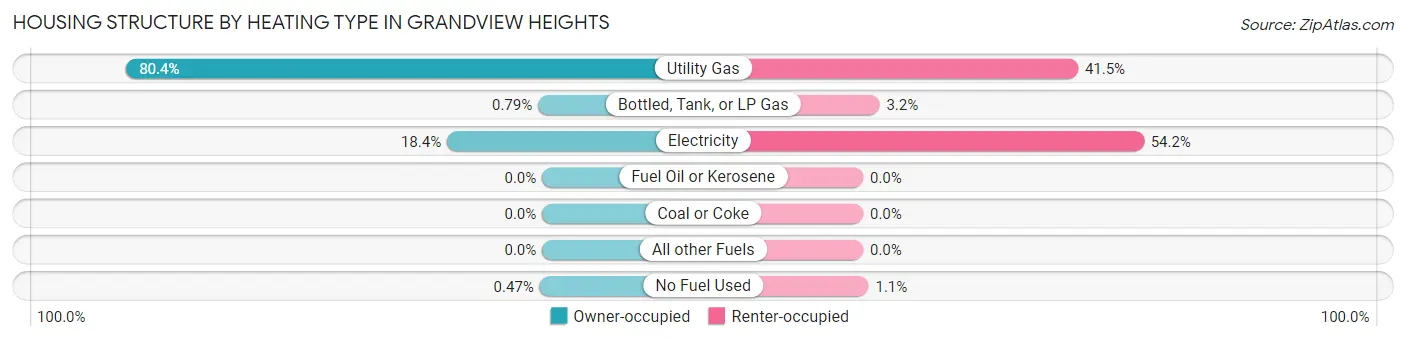
| Heating Type | Owner-occupied | Renter-occupied |
| Utility Gas | 1,723 (80.4%) | 667 (41.5%) |
| Bottled, Tank, or LP Gas | 17 (0.8%) | 51 (3.2%) |
| Electricity | 394 (18.4%) | 871 (54.2%) |
| Fuel Oil or Kerosene | 0 (0.0%) | 0 (0.0%) |
| Coal or Coke | 0 (0.0%) | 0 (0.0%) |
| All other Fuels | 0 (0.0%) | 0 (0.0%) |
| No Fuel Used | 10 (0.5%) | 17 (1.1%) |
| Total | 2,144 (100.0%) | 1,606 (100.0%) |
Household Vehicle Usage in Grandview Heights
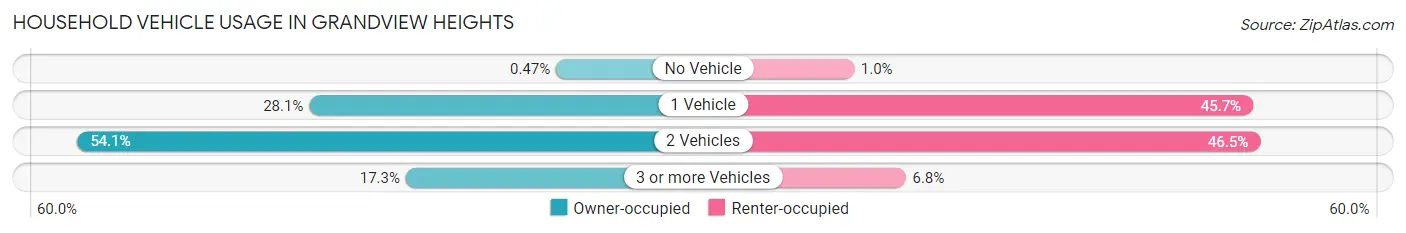
| Vehicles per Household | Owner-occupied | Renter-occupied |
| No Vehicle | 10 (0.5%) | 16 (1.0%) |
| 1 Vehicle | 603 (28.1%) | 734 (45.7%) |
| 2 Vehicles | 1,160 (54.1%) | 747 (46.5%) |
| 3 or more Vehicles | 371 (17.3%) | 109 (6.8%) |
| Total | 2,144 (100.0%) | 1,606 (100.0%) |
Real Estate & Mortgages in Grandview Heights
Real Estate and Mortgage Overview in Grandview Heights
| Characteristic | Without Mortgage | With Mortgage |
| Housing Units | 582 | 1,562 |
| Median Property Value | $443,200 | $577,300 |
| Median Household Income | $81,136 | $856 |
| Monthly Housing Costs | $1,122 | $627 |
| Real Estate Taxes | $7,976 | $0 |
Property Value by Mortgage Status in Grandview Heights
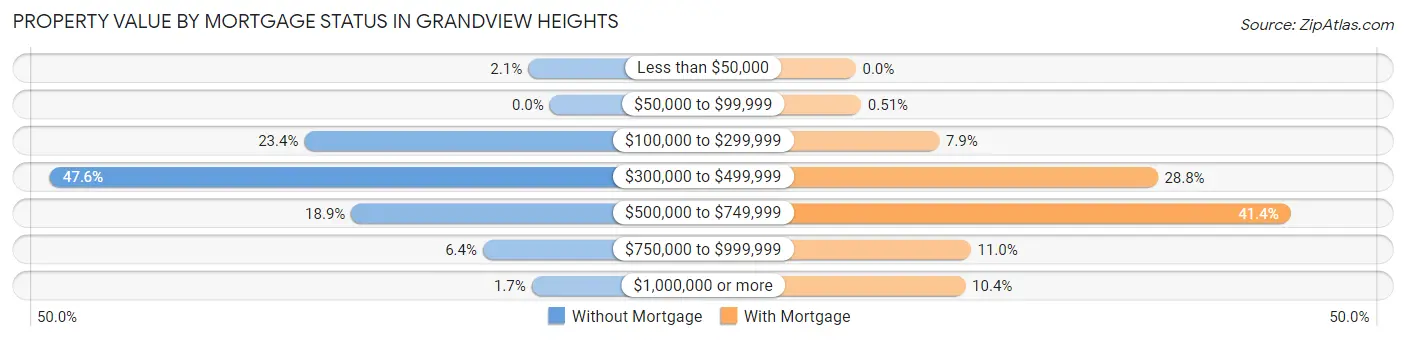
| Property Value | Without Mortgage | With Mortgage |
| Less than $50,000 | 12 (2.1%) | 0 (0.0%) |
| $50,000 to $99,999 | 0 (0.0%) | 8 (0.5%) |
| $100,000 to $299,999 | 136 (23.4%) | 124 (7.9%) |
| $300,000 to $499,999 | 277 (47.6%) | 449 (28.7%) |
| $500,000 to $749,999 | 110 (18.9%) | 647 (41.4%) |
| $750,000 to $999,999 | 37 (6.4%) | 171 (11.0%) |
| $1,000,000 or more | 10 (1.7%) | 163 (10.4%) |
| Total | 582 (100.0%) | 1,562 (100.0%) |
Household Income by Mortgage Status in Grandview Heights
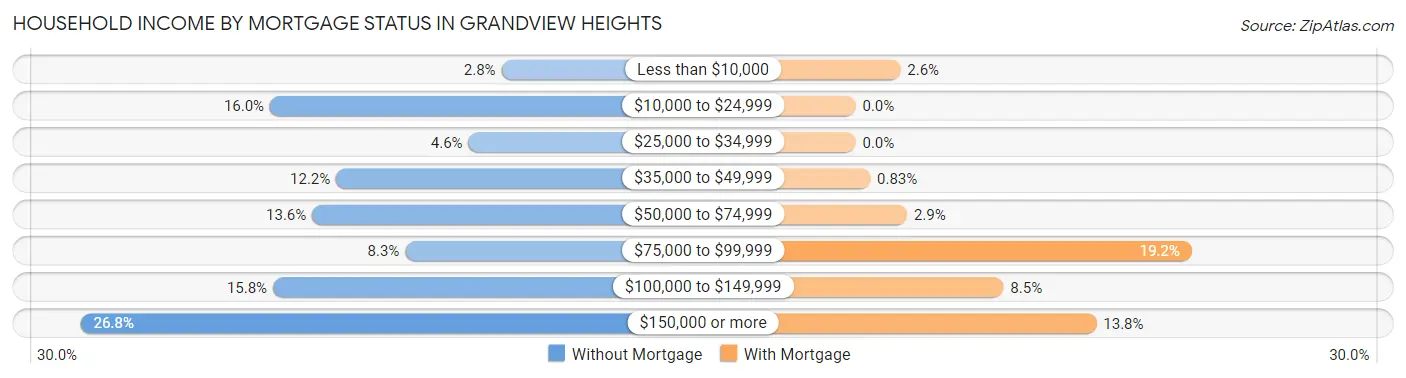
| Household Income | Without Mortgage | With Mortgage |
| Less than $10,000 | 16 (2.8%) | 40 (2.6%) |
| $10,000 to $24,999 | 93 (16.0%) | 0 (0.0%) |
| $25,000 to $34,999 | 27 (4.6%) | 0 (0.0%) |
| $35,000 to $49,999 | 71 (12.2%) | 13 (0.8%) |
| $50,000 to $74,999 | 79 (13.6%) | 46 (2.9%) |
| $75,000 to $99,999 | 48 (8.3%) | 300 (19.2%) |
| $100,000 to $149,999 | 92 (15.8%) | 132 (8.5%) |
| $150,000 or more | 156 (26.8%) | 215 (13.8%) |
| Total | 582 (100.0%) | 1,562 (100.0%) |
Property Value to Household Income Ratio in Grandview Heights
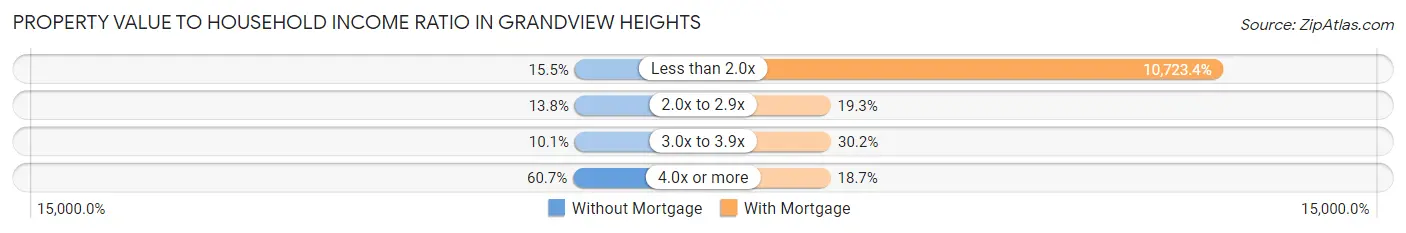
| Value-to-Income Ratio | Without Mortgage | With Mortgage |
| Less than 2.0x | 90 (15.5%) | 167,500 (10,723.4%) |
| 2.0x to 2.9x | 80 (13.8%) | 302 (19.3%) |
| 3.0x to 3.9x | 59 (10.1%) | 472 (30.2%) |
| 4.0x or more | 353 (60.7%) | 292 (18.7%) |
| Total | 582 (100.0%) | 1,562 (100.0%) |
Real Estate Taxes by Mortgage Status in Grandview Heights
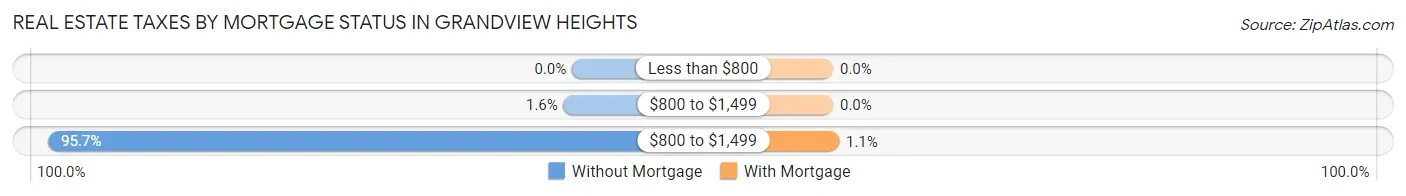
| Property Taxes | Without Mortgage | With Mortgage |
| Less than $800 | 0 (0.0%) | 0 (0.0%) |
| $800 to $1,499 | 9 (1.5%) | 0 (0.0%) |
| $800 to $1,499 | 557 (95.7%) | 17 (1.1%) |
| Total | 582 (100.0%) | 1,562 (100.0%) |
Health & Disability in Grandview Heights
Health Insurance Coverage by Age in Grandview Heights
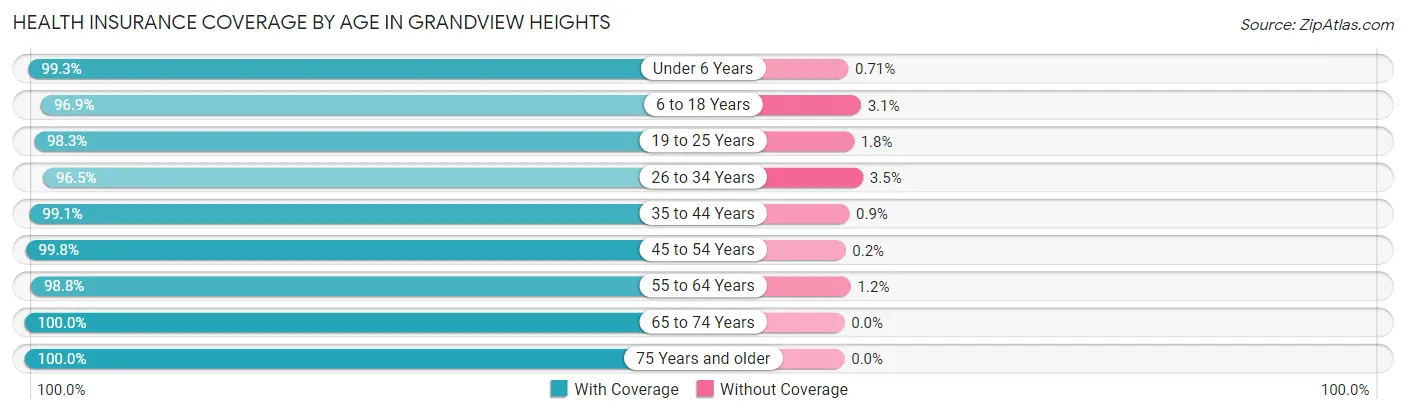
| Age Bracket | With Coverage | Without Coverage |
| Under 6 Years | 556 (99.3%) | 4 (0.7%) |
| 6 to 18 Years | 1,237 (96.9%) | 39 (3.1%) |
| 19 to 25 Years | 617 (98.3%) | 11 (1.8%) |
| 26 to 34 Years | 1,781 (96.5%) | 64 (3.5%) |
| 35 to 44 Years | 1,210 (99.1%) | 11 (0.9%) |
| 45 to 54 Years | 980 (99.8%) | 2 (0.2%) |
| 55 to 64 Years | 829 (98.8%) | 10 (1.2%) |
| 65 to 74 Years | 546 (100.0%) | 0 (0.0%) |
| 75 Years and older | 361 (100.0%) | 0 (0.0%) |
| Total | 8,117 (98.3%) | 141 (1.7%) |
Health Insurance Coverage by Citizenship Status in Grandview Heights
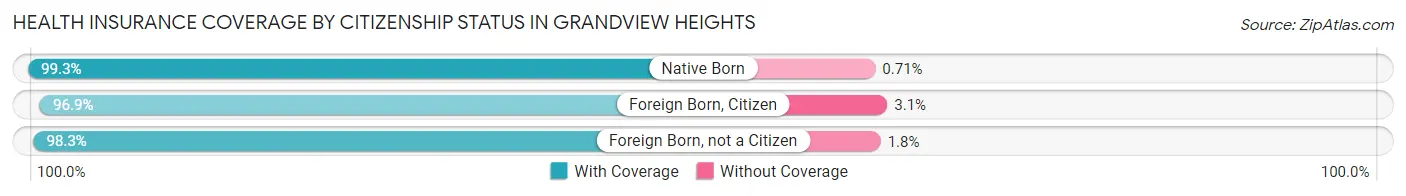
| Citizenship Status | With Coverage | Without Coverage |
| Native Born | 556 (99.3%) | 4 (0.7%) |
| Foreign Born, Citizen | 1,237 (96.9%) | 39 (3.1%) |
| Foreign Born, not a Citizen | 617 (98.3%) | 11 (1.8%) |
Health Insurance Coverage by Household Income in Grandview Heights
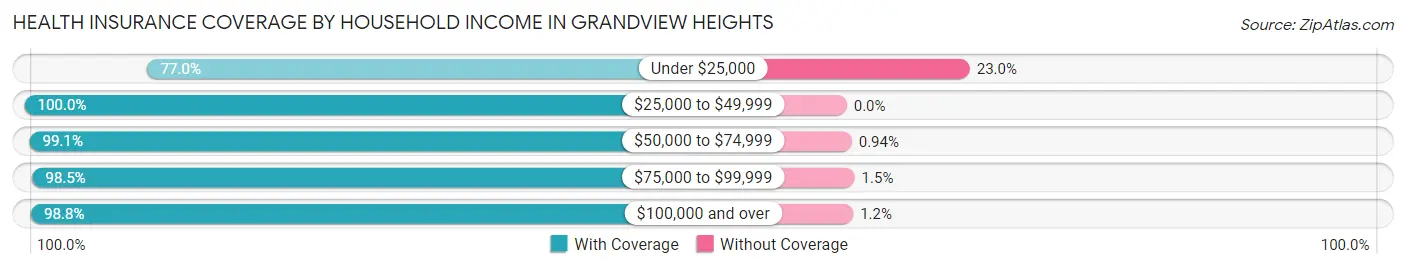
| Household Income | With Coverage | Without Coverage |
| Under $25,000 | 177 (77.0%) | 53 (23.0%) |
| $25,000 to $49,999 | 704 (100.0%) | 0 (0.0%) |
| $50,000 to $74,999 | 1,058 (99.1%) | 10 (0.9%) |
| $75,000 to $99,999 | 873 (98.5%) | 13 (1.5%) |
| $100,000 and over | 5,305 (98.8%) | 65 (1.2%) |
Public vs Private Health Insurance Coverage by Age in Grandview Heights
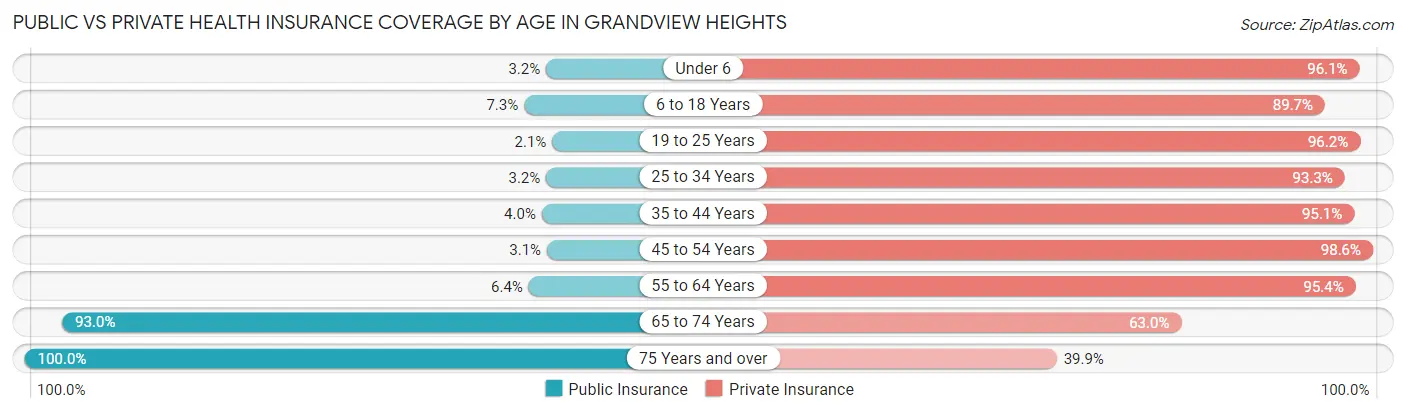
| Age Bracket | Public Insurance | Private Insurance |
| Under 6 | 18 (3.2%) | 538 (96.1%) |
| 6 to 18 Years | 93 (7.3%) | 1,144 (89.7%) |
| 19 to 25 Years | 13 (2.1%) | 604 (96.2%) |
| 25 to 34 Years | 59 (3.2%) | 1,722 (93.3%) |
| 35 to 44 Years | 49 (4.0%) | 1,161 (95.1%) |
| 45 to 54 Years | 30 (3.0%) | 968 (98.6%) |
| 55 to 64 Years | 54 (6.4%) | 800 (95.4%) |
| 65 to 74 Years | 508 (93.0%) | 344 (63.0%) |
| 75 Years and over | 361 (100.0%) | 144 (39.9%) |
| Total | 1,185 (14.3%) | 7,425 (89.9%) |
Disability Status by Sex by Age in Grandview Heights
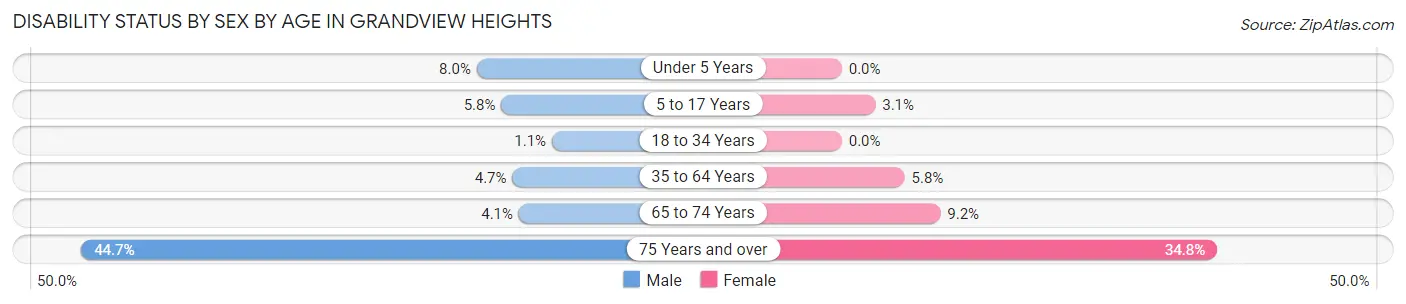
| Age Bracket | Male | Female |
| Under 5 Years | 18 (8.0%) | 0 (0.0%) |
| 5 to 17 Years | 40 (5.8%) | 19 (3.1%) |
| 18 to 34 Years | 13 (1.1%) | 0 (0.0%) |
| 35 to 64 Years | 79 (4.7%) | 80 (5.8%) |
| 65 to 74 Years | 9 (4.1%) | 30 (9.1%) |
| 75 Years and over | 51 (44.7%) | 86 (34.8%) |
Disability Class by Sex by Age in Grandview Heights
Disability Class: Hearing Difficulty
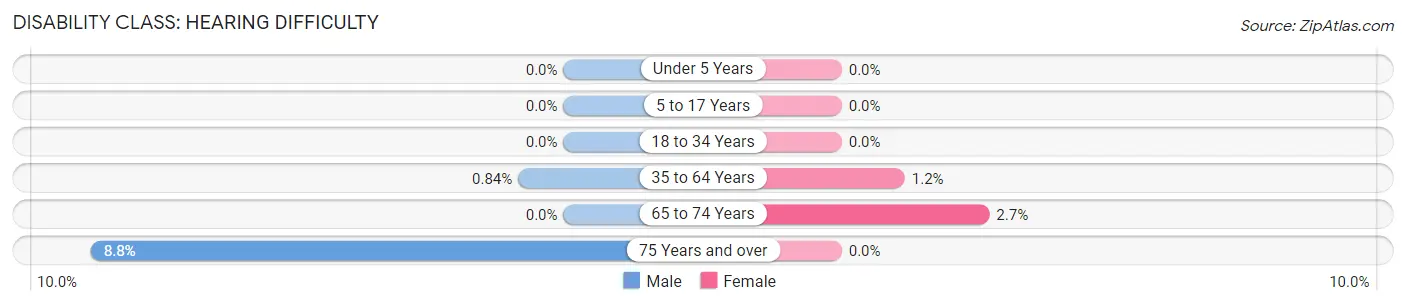
| Age Bracket | Male | Female |
| Under 5 Years | 0 (0.0%) | 0 (0.0%) |
| 5 to 17 Years | 0 (0.0%) | 0 (0.0%) |
| 18 to 34 Years | 0 (0.0%) | 0 (0.0%) |
| 35 to 64 Years | 14 (0.8%) | 16 (1.2%) |
| 65 to 74 Years | 0 (0.0%) | 9 (2.7%) |
| 75 Years and over | 10 (8.8%) | 0 (0.0%) |
Disability Class: Vision Difficulty
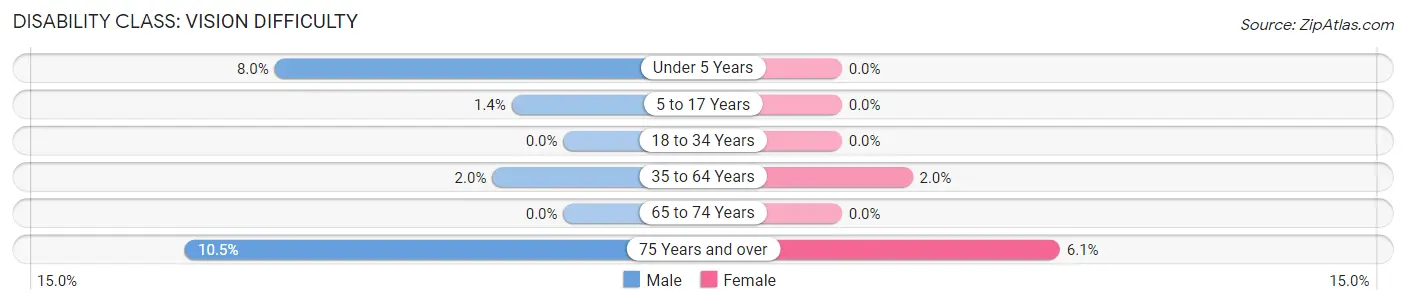
| Age Bracket | Male | Female |
| Under 5 Years | 18 (8.0%) | 0 (0.0%) |
| 5 to 17 Years | 10 (1.4%) | 0 (0.0%) |
| 18 to 34 Years | 0 (0.0%) | 0 (0.0%) |
| 35 to 64 Years | 33 (2.0%) | 27 (2.0%) |
| 65 to 74 Years | 0 (0.0%) | 0 (0.0%) |
| 75 Years and over | 12 (10.5%) | 15 (6.1%) |
Disability Class: Cognitive Difficulty
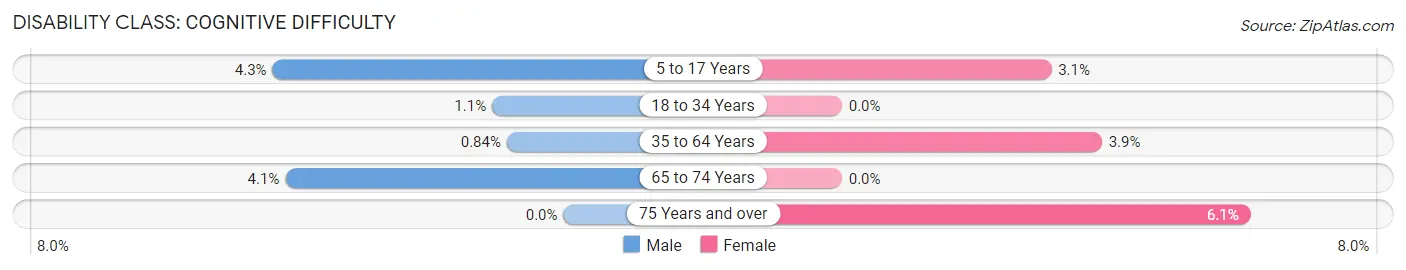
| Age Bracket | Male | Female |
| 5 to 17 Years | 30 (4.3%) | 19 (3.1%) |
| 18 to 34 Years | 13 (1.1%) | 0 (0.0%) |
| 35 to 64 Years | 14 (0.8%) | 53 (3.9%) |
| 65 to 74 Years | 9 (4.1%) | 0 (0.0%) |
| 75 Years and over | 0 (0.0%) | 15 (6.1%) |
Disability Class: Ambulatory Difficulty
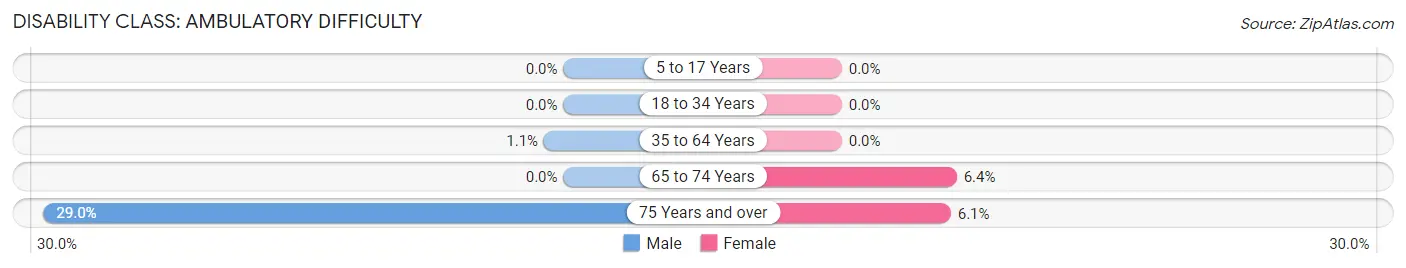
| Age Bracket | Male | Female |
| 5 to 17 Years | 0 (0.0%) | 0 (0.0%) |
| 18 to 34 Years | 0 (0.0%) | 0 (0.0%) |
| 35 to 64 Years | 18 (1.1%) | 0 (0.0%) |
| 65 to 74 Years | 0 (0.0%) | 21 (6.4%) |
| 75 Years and over | 33 (28.9%) | 15 (6.1%) |
Disability Class: Self-Care Difficulty
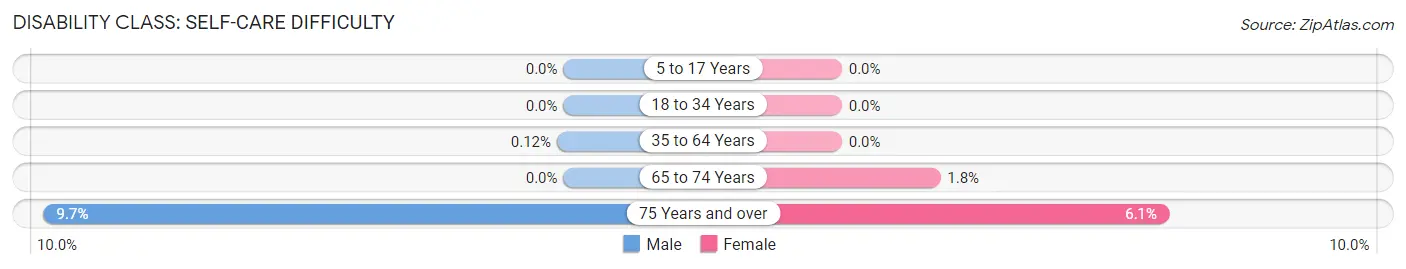
| Age Bracket | Male | Female |
| 5 to 17 Years | 0 (0.0%) | 0 (0.0%) |
| 18 to 34 Years | 0 (0.0%) | 0 (0.0%) |
| 35 to 64 Years | 2 (0.1%) | 0 (0.0%) |
| 65 to 74 Years | 0 (0.0%) | 6 (1.8%) |
| 75 Years and over | 11 (9.7%) | 15 (6.1%) |
Technology Access in Grandview Heights
Computing Device Access in Grandview Heights
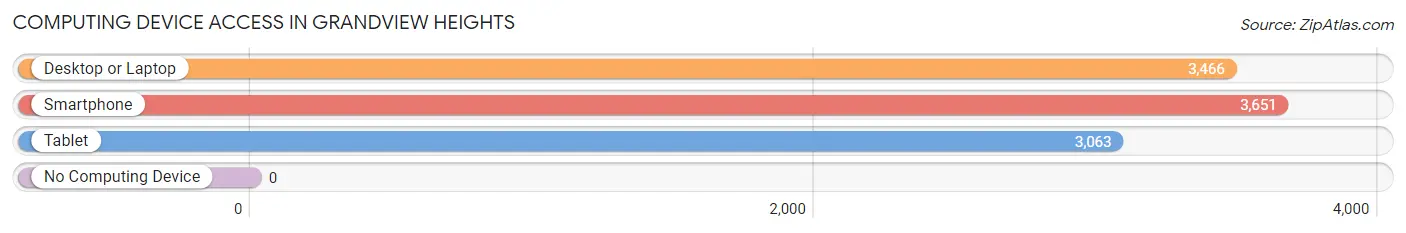
| Device Type | # Households | % Households |
| Desktop or Laptop | 3,466 | 92.4% |
| Smartphone | 3,651 | 97.4% |
| Tablet | 3,063 | 81.7% |
| No Computing Device | 0 | 0.0% |
| Total | 3,750 | 100.0% |
Internet Access in Grandview Heights
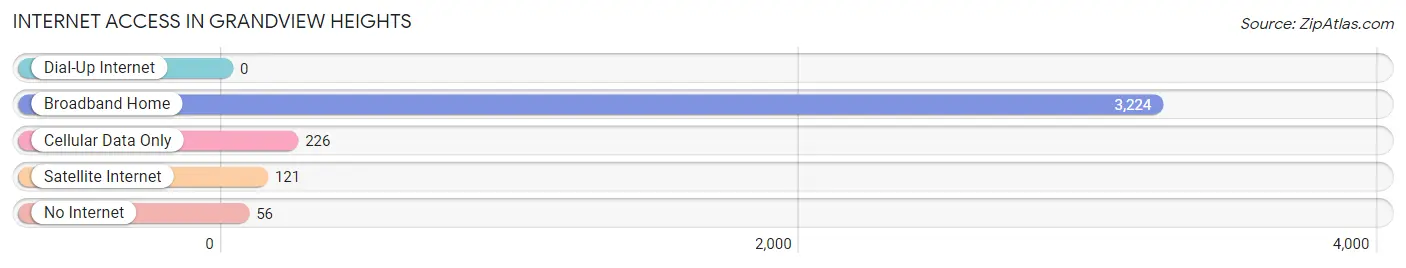
| Internet Type | # Households | % Households |
| Dial-Up Internet | 0 | 0.0% |
| Broadband Home | 3,224 | 86.0% |
| Cellular Data Only | 226 | 6.0% |
| Satellite Internet | 121 | 3.2% |
| No Internet | 56 | 1.5% |
| Total | 3,750 | 100.0% |
Grandview Heights Summary
History
The area now known as Grandview Heights, Ohio was first settled in 1812 by a group of pioneers from Virginia. The area was originally known as Grandview Township, and was part of Franklin County. In 1901, the village of Grandview Heights was incorporated, and the area was annexed to the city of Columbus in 1910.
Grandview Heights is known for its historic architecture, which includes many Victorian-style homes. The area was also home to the first public school in Franklin County, which opened in 1817.
Geography
Grandview Heights is located in Franklin County, Ohio, just north of the city of Columbus. The area is bordered by the Olentangy River to the east, and is situated on a plateau that overlooks the city of Columbus. The area is approximately 4.5 square miles in size, and has a population of approximately 8,000 people.
The area is known for its rolling hills and lush green spaces, which make it a popular destination for outdoor activities such as hiking, biking, and fishing. The area is also home to several parks, including Grandview Heights Park, which features a playground, picnic areas, and a walking path.
Economy
Grandview Heights is home to a variety of businesses, including retail stores, restaurants, and professional services. The area is also home to several corporate offices, including Nationwide Insurance, which is headquartered in Grandview Heights.
The area is also home to several educational institutions, including Grandview Heights High School, Grandview Heights Middle School, and Grandview Heights Elementary School. The area is also home to several private schools, including St. Agatha Catholic School and Grandview Heights Christian Academy.
Demographics
As of the 2010 census, the population of Grandview Heights was 8,723. The racial makeup of the area was 87.3% White, 5.3% African American, 0.3% Native American, 3.2% Asian, and 3.9% from other races. The median household income in Grandview Heights was $68,945, and the median age was 40.
Grandview Heights is a diverse community, with a variety of religious affiliations. The area is home to several churches, including St. Agatha Catholic Church, Grandview Heights United Methodist Church, and Grandview Heights Baptist Church.
Conclusion
Grandview Heights, Ohio is a vibrant and diverse community located in Franklin County, just north of the city of Columbus. The area is known for its historic architecture, lush green spaces, and variety of businesses and educational institutions. The area is also home to a diverse population, with a variety of religious affiliations and a median household income of $68,945. Grandview Heights is a great place to live, work, and play.
Common Questions
What is Per Capita Income in Grandview Heights?
Per Capita income in Grandview Heights is $72,009.
What is the Median Family Income in Grandview Heights?
Median Family Income in Grandview Heights is $176,563.
What is the Median Household income in Grandview Heights?
Median Household Income in Grandview Heights is $100,833.
What is Income or Wage Gap in Grandview Heights?
Income or Wage Gap in Grandview Heights is 11.9%.
Women in Grandview Heights earn 88.1 cents for every dollar earned by a man.
What is Inequality or Gini Index in Grandview Heights?
Inequality or Gini Index in Grandview Heights is 0.47.
What is the Total Population of Grandview Heights?
Total Population of Grandview Heights is 8,258.
What is the Total Male Population of Grandview Heights?
Total Male Population of Grandview Heights is 4,141.
What is the Total Female Population of Grandview Heights?
Total Female Population of Grandview Heights is 4,117.
What is the Ratio of Males per 100 Females in Grandview Heights?
There are 100.58 Males per 100 Females in Grandview Heights.
What is the Ratio of Females per 100 Males in Grandview Heights?
There are 99.42 Females per 100 Males in Grandview Heights.
What is the Median Population Age in Grandview Heights?
Median Population Age in Grandview Heights is 32.9 Years.
What is the Average Family Size in Grandview Heights
Average Family Size in Grandview Heights is 3.1 People.
What is the Average Household Size in Grandview Heights
Average Household Size in Grandview Heights is 2.2 People.
How Large is the Labor Force in Grandview Heights?
There are 5,274 People in the Labor Forcein in Grandview Heights.
What is the Percentage of People in the Labor Force in Grandview Heights?
80.8% of People are in the Labor Force in Grandview Heights.
What is the Unemployment Rate in Grandview Heights?
Unemployment Rate in Grandview Heights is 1.8%.