South Russell, OH Map & Demographics
South Russell Map
South Russell Overview
$80,439
PER CAPITA INCOME
$180,403
AVG FAMILY INCOME
$175,343
AVG HOUSEHOLD INCOME
19.7%
WAGE / INCOME GAP [ % ]
80.3¢/ $1
WAGE / INCOME GAP [ $ ]
0.47
INEQUALITY / GINI INDEX
3,966
TOTAL POPULATION
2,039
MALE POPULATION
1,927
FEMALE POPULATION
105.81
MALES / 100 FEMALES
94.51
FEMALES / 100 MALES
46.7
MEDIAN AGE
3.0
AVG FAMILY SIZE
2.8
AVG HOUSEHOLD SIZE
2,075
LABOR FORCE [ PEOPLE ]
63.2%
PERCENT IN LABOR FORCE
2.7%
UNEMPLOYMENT RATE
Income in South Russell
Income Overview in South Russell
Per Capita Income in South Russell is $80,439, while median incomes of families and households are $180,403 and $175,343 respectively.
| Characteristic | Number | Measure |
| Per Capita Income | 3,966 | $80,439 |
| Median Family Income | 1,214 | $180,403 |
| Mean Family Income | 1,214 | $229,207 |
| Median Household Income | 1,424 | $175,343 |
| Mean Household Income | 1,424 | $234,724 |
| Income Deficit | 1,214 | $0 |
| Wage / Income Gap (%) | 3,966 | 19.73% |
| Wage / Income Gap ($) | 3,966 | 80.27¢ per $1 |
| Gini / Inequality Index | 3,966 | 0.47 |
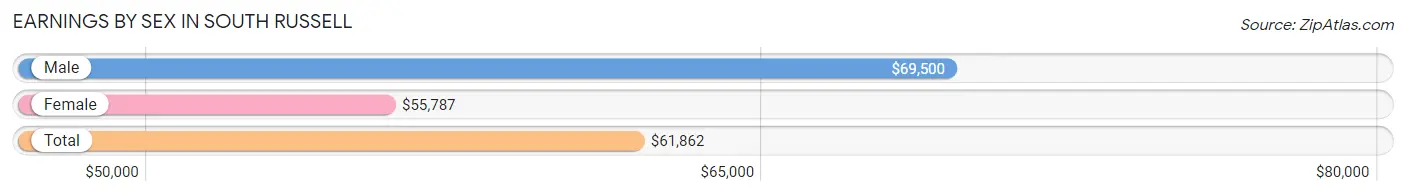
Earnings by Sex in South Russell
Average Earnings in South Russell are $61,862, $69,500 for men and $55,787 for women, a difference of 19.7%.
| Sex | Number | Average Earnings |
| Male | 1,234 (57.1%) | $69,500 |
| Female | 927 (42.9%) | $55,787 |
| Total | 2,161 (100.0%) | $61,862 |
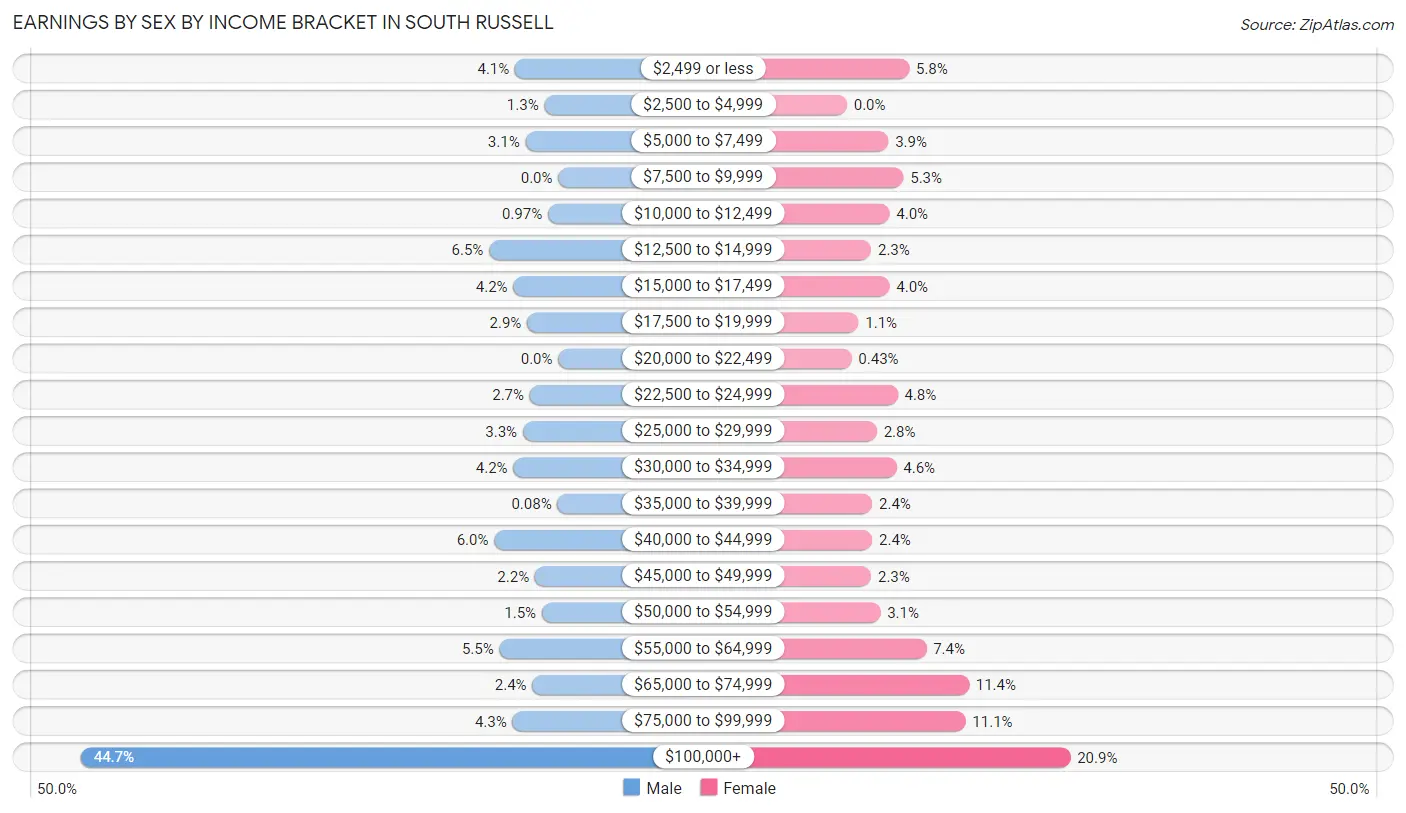
Earnings by Sex by Income Bracket in South Russell
The most common earnings brackets in South Russell are $100,000+ for men (552 | 44.7%) and $100,000+ for women (194 | 20.9%).
| Income | Male | Female |
| $2,499 or less | 50 (4.1%) | 54 (5.8%) |
| $2,500 to $4,999 | 16 (1.3%) | 0 (0.0%) |
| $5,000 to $7,499 | 38 (3.1%) | 36 (3.9%) |
| $7,500 to $9,999 | 0 (0.0%) | 49 (5.3%) |
| $10,000 to $12,499 | 12 (1.0%) | 37 (4.0%) |
| $12,500 to $14,999 | 80 (6.5%) | 21 (2.3%) |
| $15,000 to $17,499 | 52 (4.2%) | 37 (4.0%) |
| $17,500 to $19,999 | 36 (2.9%) | 10 (1.1%) |
| $20,000 to $22,499 | 0 (0.0%) | 4 (0.4%) |
| $22,500 to $24,999 | 33 (2.7%) | 44 (4.8%) |
| $25,000 to $29,999 | 41 (3.3%) | 26 (2.8%) |
| $30,000 to $34,999 | 52 (4.2%) | 43 (4.6%) |
| $35,000 to $39,999 | 1 (0.1%) | 22 (2.4%) |
| $40,000 to $44,999 | 74 (6.0%) | 22 (2.4%) |
| $45,000 to $49,999 | 27 (2.2%) | 21 (2.3%) |
| $50,000 to $54,999 | 19 (1.5%) | 29 (3.1%) |
| $55,000 to $64,999 | 68 (5.5%) | 69 (7.4%) |
| $65,000 to $74,999 | 30 (2.4%) | 106 (11.4%) |
| $75,000 to $99,999 | 53 (4.3%) | 103 (11.1%) |
| $100,000+ | 552 (44.7%) | 194 (20.9%) |
| Total | 1,234 (100.0%) | 927 (100.0%) |
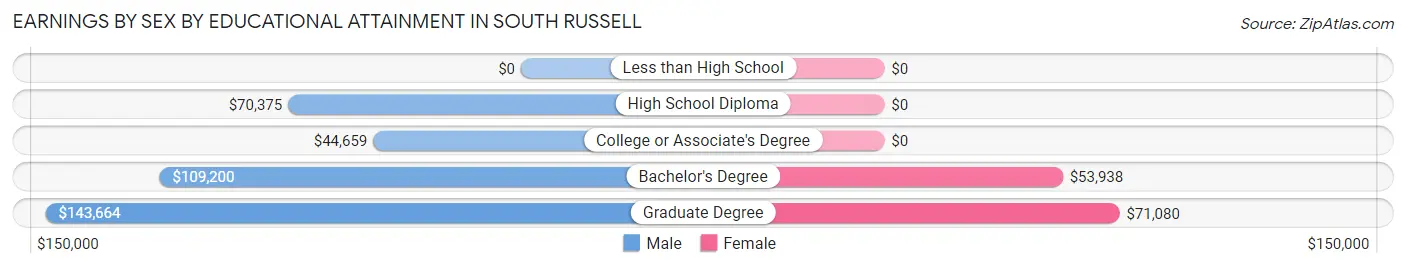
Earnings by Sex by Educational Attainment in South Russell
Average earnings in South Russell are $107,950 for men and $61,750 for women, a difference of 42.8%. Men with an educational attainment of graduate degree enjoy the highest average annual earnings of $143,664, while those with college or associate's degree education earn the least with $44,659. Women with an educational attainment of graduate degree earn the most with the average annual earnings of $71,080, while those with bachelor's degree education have the smallest earnings of $53,938.
| Educational Attainment | Male Income | Female Income |
| Less than High School | - | - |
| High School Diploma | $70,375 | $0 |
| College or Associate's Degree | $44,659 | $0 |
| Bachelor's Degree | $109,200 | $53,938 |
| Graduate Degree | $143,664 | $71,080 |
| Total | $107,950 | $61,750 |
Family Income in South Russell
Family Income Brackets in South Russell
According to the South Russell family income data, there are 480 families falling into the $200,000+ income range, which is the most common income bracket and makes up 39.5% of all families.
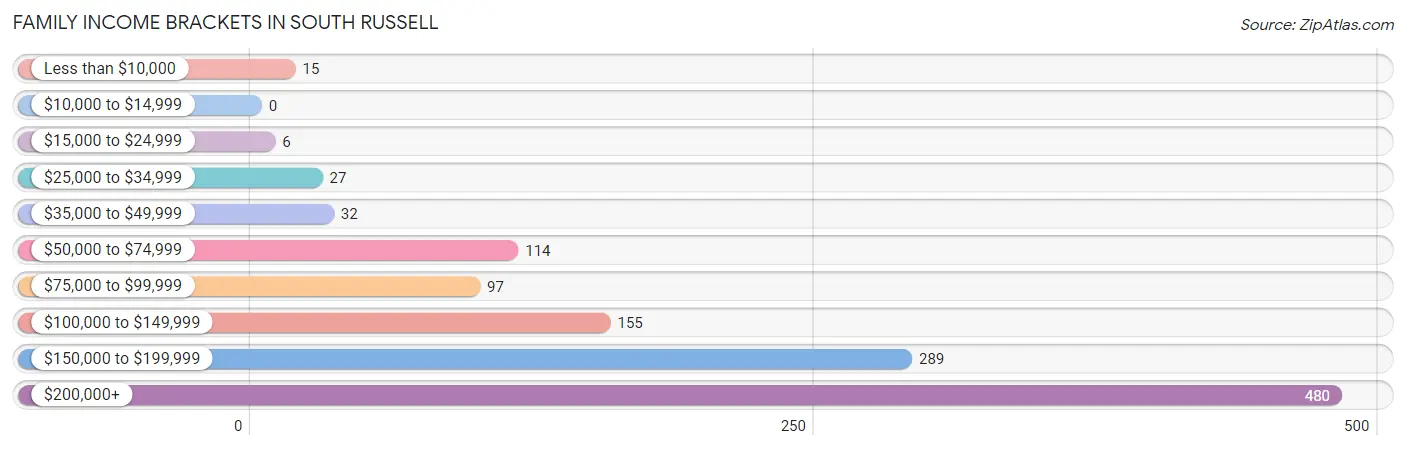
| Income Bracket | # Families | % Families |
| Less than $10,000 | 15 | 1.2% |
| $10,000 to $14,999 | 0 | 0.0% |
| $15,000 to $24,999 | 6 | 0.5% |
| $25,000 to $34,999 | 27 | 2.2% |
| $35,000 to $49,999 | 32 | 2.6% |
| $50,000 to $74,999 | 114 | 9.4% |
| $75,000 to $99,999 | 97 | 8.0% |
| $100,000 to $149,999 | 155 | 12.8% |
| $150,000 to $199,999 | 289 | 23.8% |
| $200,000+ | 480 | 39.5% |
Family Income by Famaliy Size in South Russell
4-person families (226 | 18.6%) account for the highest median family income in South Russell with $203,500 per family, while 2-person families (630 | 51.9%) have the highest median income of $76,490 per family member.
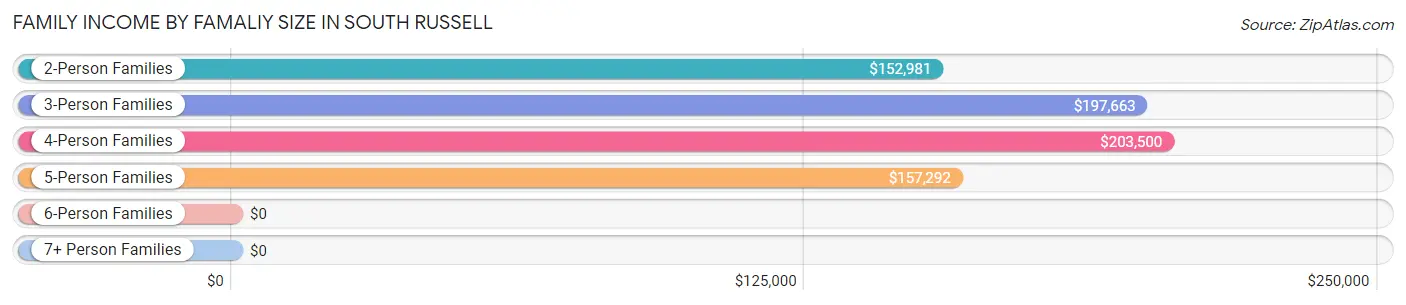
| Income Bracket | # Families | Median Income |
| 2-Person Families | 630 (51.9%) | $152,981 |
| 3-Person Families | 289 (23.8%) | $197,663 |
| 4-Person Families | 226 (18.6%) | $203,500 |
| 5-Person Families | 42 (3.5%) | $157,292 |
| 6-Person Families | 13 (1.1%) | $0 |
| 7+ Person Families | 14 (1.1%) | $0 |
| Total | 1,214 (100.0%) | $180,403 |
Family Income by Number of Earners in South Russell
The median family income in South Russell is $180,403, with families comprising 2 earners (519) having the highest median family income of $201,625, while families with 1 earner (353) have the lowest median family income of $106,369, accounting for 42.7% and 29.1% of families, respectively.
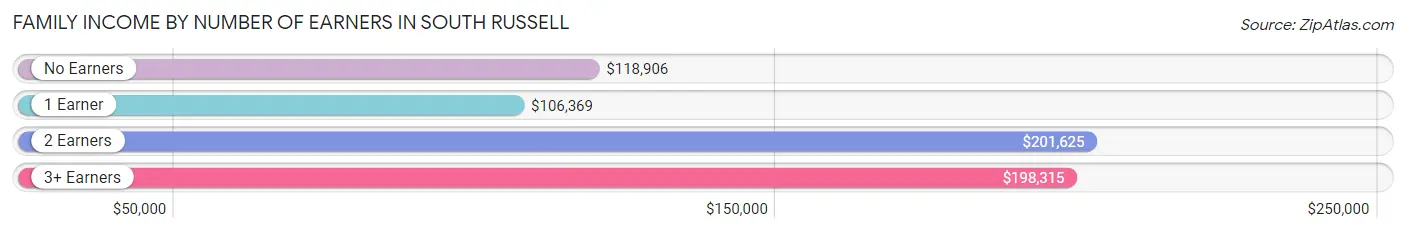
| Number of Earners | # Families | Median Income |
| No Earners | 195 (16.1%) | $118,906 |
| 1 Earner | 353 (29.1%) | $106,369 |
| 2 Earners | 519 (42.7%) | $201,625 |
| 3+ Earners | 147 (12.1%) | $198,315 |
| Total | 1,214 (100.0%) | $180,403 |
Household Income in South Russell
Household Income Brackets in South Russell
With 514 households falling in the category, the $200,000+ income range is the most frequent in South Russell, accounting for 36.1% of all households.
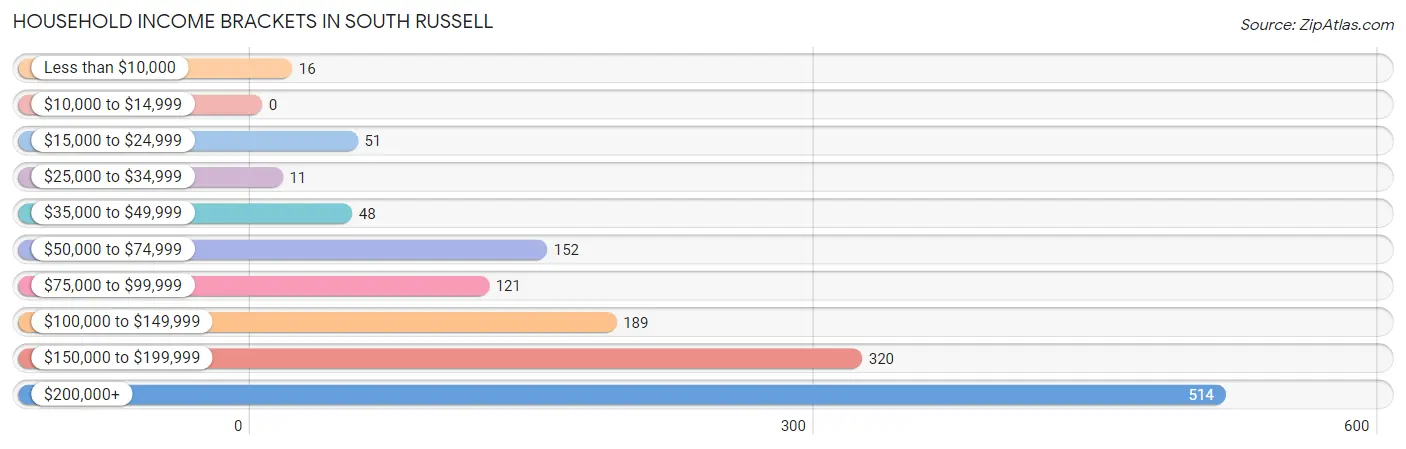
| Income Bracket | # Households | % Households |
| Less than $10,000 | 16 | 1.1% |
| $10,000 to $14,999 | 0 | 0.0% |
| $15,000 to $24,999 | 51 | 3.6% |
| $25,000 to $34,999 | 11 | 0.8% |
| $35,000 to $49,999 | 48 | 3.4% |
| $50,000 to $74,999 | 152 | 10.7% |
| $75,000 to $99,999 | 121 | 8.5% |
| $100,000 to $149,999 | 189 | 13.3% |
| $150,000 to $199,999 | 320 | 22.5% |
| $200,000+ | 514 | 36.1% |
Household Income by Householder Age in South Russell
The median household income in South Russell is $175,343, with the highest median household income of $199,527 found in the 45 to 64 years age bracket for the primary householder. A total of 660 households (46.4%) fall into this category. Meanwhile, the 15 to 24 years age bracket for the primary householder has the lowest median household income of $0, with 6 households (0.4%) in this group.
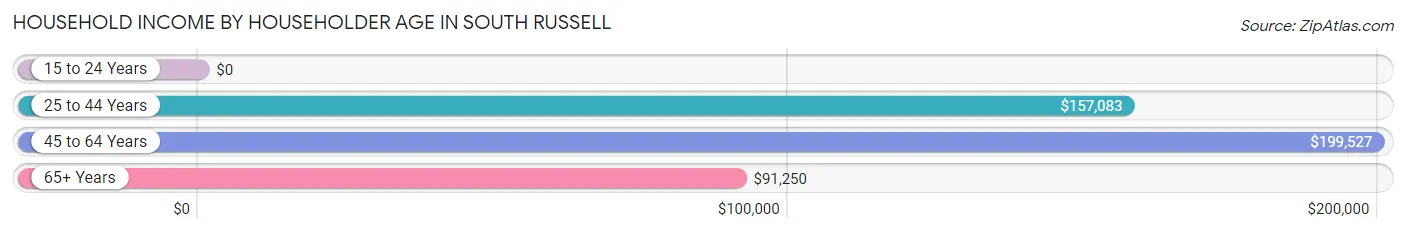
| Income Bracket | # Households | Median Income |
| 15 to 24 Years | 6 (0.4%) | $0 |
| 25 to 44 Years | 222 (15.6%) | $157,083 |
| 45 to 64 Years | 660 (46.4%) | $199,527 |
| 65+ Years | 536 (37.6%) | $91,250 |
| Total | 1,424 (100.0%) | $175,343 |
Poverty in South Russell
Income Below Poverty by Sex and Age in South Russell
With 2.8% poverty level for males and 2.8% for females among the residents of South Russell, under 5 year old males and 5 year old females are the most vulnerable to poverty, with 12 males (13.8%) and 15 females (60.0%) in their respective age groups living below the poverty level.
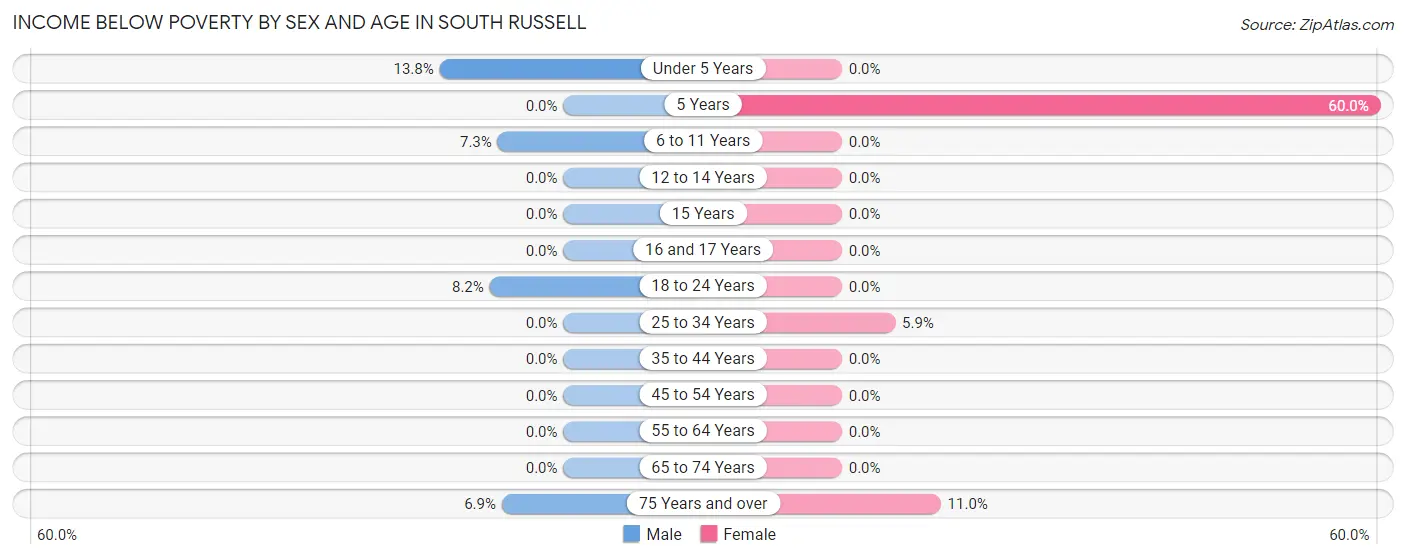
| Age Bracket | Male | Female |
| Under 5 Years | 12 (13.8%) | 0 (0.0%) |
| 5 Years | 0 (0.0%) | 15 (60.0%) |
| 6 to 11 Years | 15 (7.3%) | 0 (0.0%) |
| 12 to 14 Years | 0 (0.0%) | 0 (0.0%) |
| 15 Years | 0 (0.0%) | 0 (0.0%) |
| 16 and 17 Years | 0 (0.0%) | 0 (0.0%) |
| 18 to 24 Years | 16 (8.2%) | 0 (0.0%) |
| 25 to 34 Years | 0 (0.0%) | 13 (5.9%) |
| 35 to 44 Years | 0 (0.0%) | 0 (0.0%) |
| 45 to 54 Years | 0 (0.0%) | 0 (0.0%) |
| 55 to 64 Years | 0 (0.0%) | 0 (0.0%) |
| 65 to 74 Years | 0 (0.0%) | 0 (0.0%) |
| 75 Years and over | 15 (6.9%) | 25 (11.0%) |
| Total | 58 (2.8%) | 53 (2.8%) |
Income Above Poverty by Sex and Age in South Russell
According to the poverty statistics in South Russell, males aged 5 years and females aged under 5 years are the age groups that are most secure financially, with 100.0% of males and 100.0% of females in these age groups living above the poverty line.
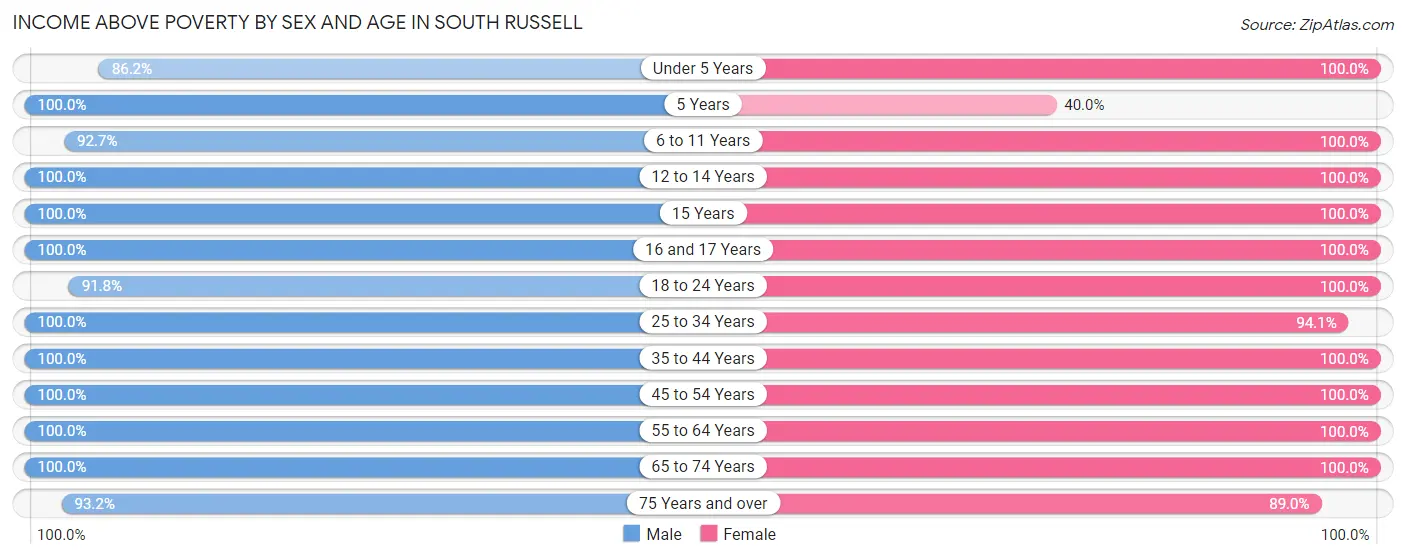
| Age Bracket | Male | Female |
| Under 5 Years | 75 (86.2%) | 57 (100.0%) |
| 5 Years | 25 (100.0%) | 10 (40.0%) |
| 6 to 11 Years | 190 (92.7%) | 59 (100.0%) |
| 12 to 14 Years | 107 (100.0%) | 84 (100.0%) |
| 15 Years | 19 (100.0%) | 14 (100.0%) |
| 16 and 17 Years | 71 (100.0%) | 125 (100.0%) |
| 18 to 24 Years | 179 (91.8%) | 123 (100.0%) |
| 25 to 34 Years | 152 (100.0%) | 206 (94.1%) |
| 35 to 44 Years | 160 (100.0%) | 132 (100.0%) |
| 45 to 54 Years | 230 (100.0%) | 286 (100.0%) |
| 55 to 64 Years | 349 (100.0%) | 365 (100.0%) |
| 65 to 74 Years | 220 (100.0%) | 211 (100.0%) |
| 75 Years and over | 204 (93.1%) | 202 (89.0%) |
| Total | 1,981 (97.2%) | 1,874 (97.3%) |
Income Below Poverty Among Married-Couple Families in South Russell
The poverty statistics for married-couple families in South Russell show that 1.5% or 15 of the total 1,023 families live below the poverty line. Families with no children have the highest poverty rate of 2.2%, comprising of 15 families. On the other hand, families with 1 or 2 children have the lowest poverty rate of 0.0%, which includes 0 families.
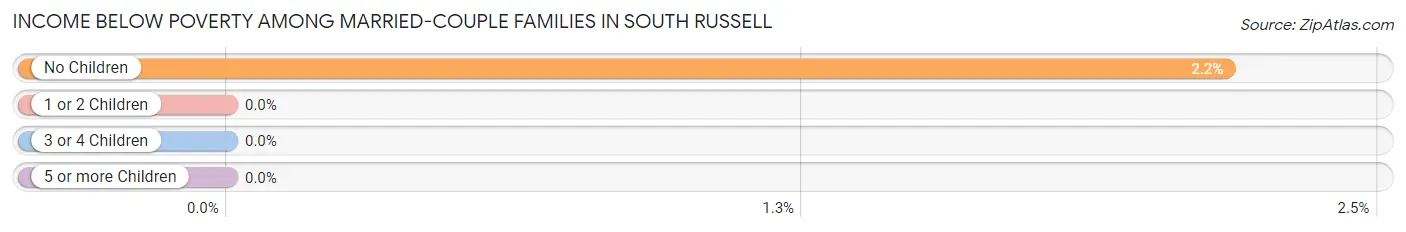
| Children | Above Poverty | Below Poverty |
| No Children | 676 (97.8%) | 15 (2.2%) |
| 1 or 2 Children | 296 (100.0%) | 0 (0.0%) |
| 3 or 4 Children | 22 (100.0%) | 0 (0.0%) |
| 5 or more Children | 14 (100.0%) | 0 (0.0%) |
| Total | 1,008 (98.5%) | 15 (1.5%) |
Income Below Poverty Among Single-Parent Households in South Russell
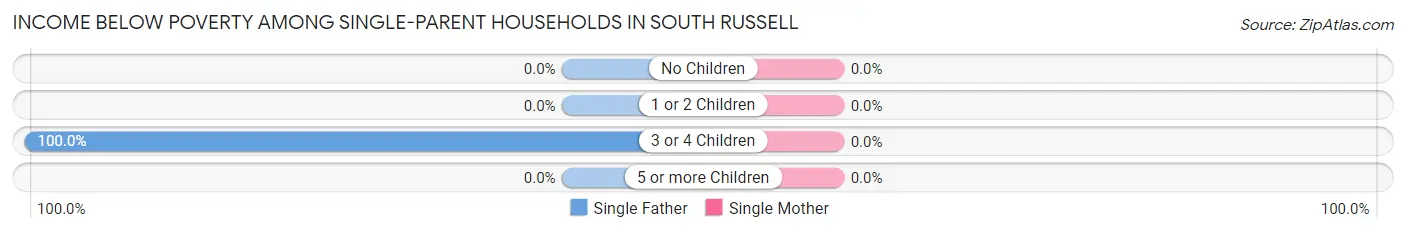
| Children | Single Father | Single Mother |
| No Children | 0 (0.0%) | 0 (0.0%) |
| 1 or 2 Children | 0 (0.0%) | 0 (0.0%) |
| 3 or 4 Children | 6 (100.0%) | 0 (0.0%) |
| 5 or more Children | 0 (0.0%) | 0 (0.0%) |
| Total | 6 (11.8%) | 0 (0.0%) |
Income Below Poverty Among Married-Couple vs Single-Parent Households in South Russell
The poverty data for South Russell shows that 15 of the married-couple family households (1.5%) and 6 of the single-parent households (3.1%) are living below the poverty level. Within the married-couple family households, those with no children have the highest poverty rate, with 15 households (2.2%) falling below the poverty line. Among the single-parent households, those with 3 or 4 children have the highest poverty rate, with 6 household (26.1%) living below poverty.
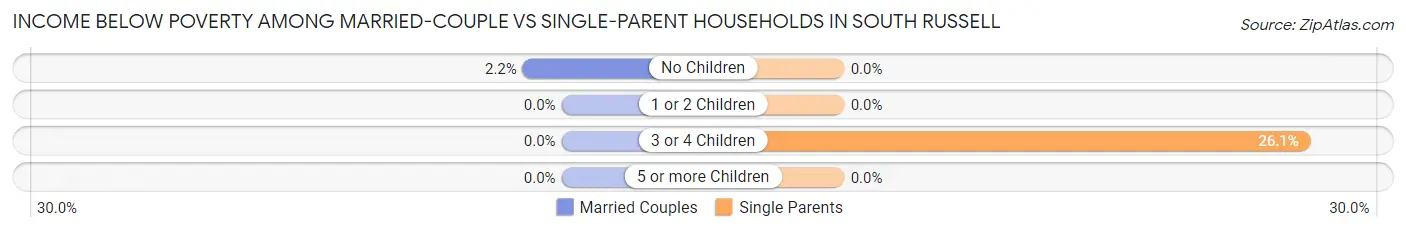
| Children | Married-Couple Families | Single-Parent Households |
| No Children | 15 (2.2%) | 0 (0.0%) |
| 1 or 2 Children | 0 (0.0%) | 0 (0.0%) |
| 3 or 4 Children | 0 (0.0%) | 6 (26.1%) |
| 5 or more Children | 0 (0.0%) | 0 (0.0%) |
| Total | 15 (1.5%) | 6 (3.1%) |
Race in South Russell
The most populous races in South Russell are White / Caucasian (3,927 | 99.0%), Two or more Races (36 | 0.9%), and Hispanic or Latino (28 | 0.7%).
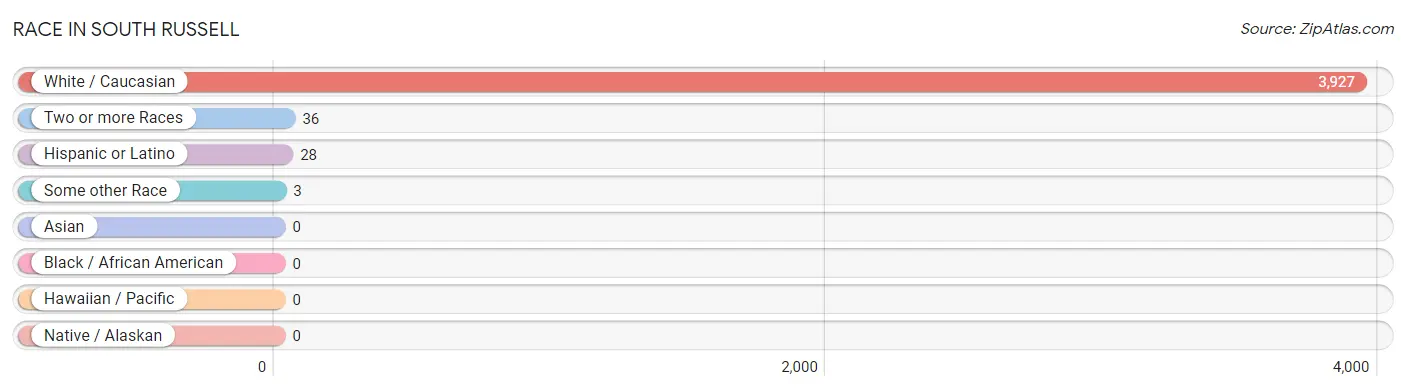
| Race | # Population | % Population |
| Asian | 0 | 0.0% |
| Black / African American | 0 | 0.0% |
| Hawaiian / Pacific | 0 | 0.0% |
| Hispanic or Latino | 28 | 0.7% |
| Native / Alaskan | 0 | 0.0% |
| White / Caucasian | 3,927 | 99.0% |
| Two or more Races | 36 | 0.9% |
| Some other Race | 3 | 0.1% |
| Total | 3,966 | 100.0% |
Ancestry in South Russell
The most populous ancestries reported in South Russell are English (1,079 | 27.2%), German (1,065 | 26.9%), Italian (573 | 14.4%), Irish (361 | 9.1%), and Polish (270 | 6.8%), together accounting for 84.4% of all South Russell residents.
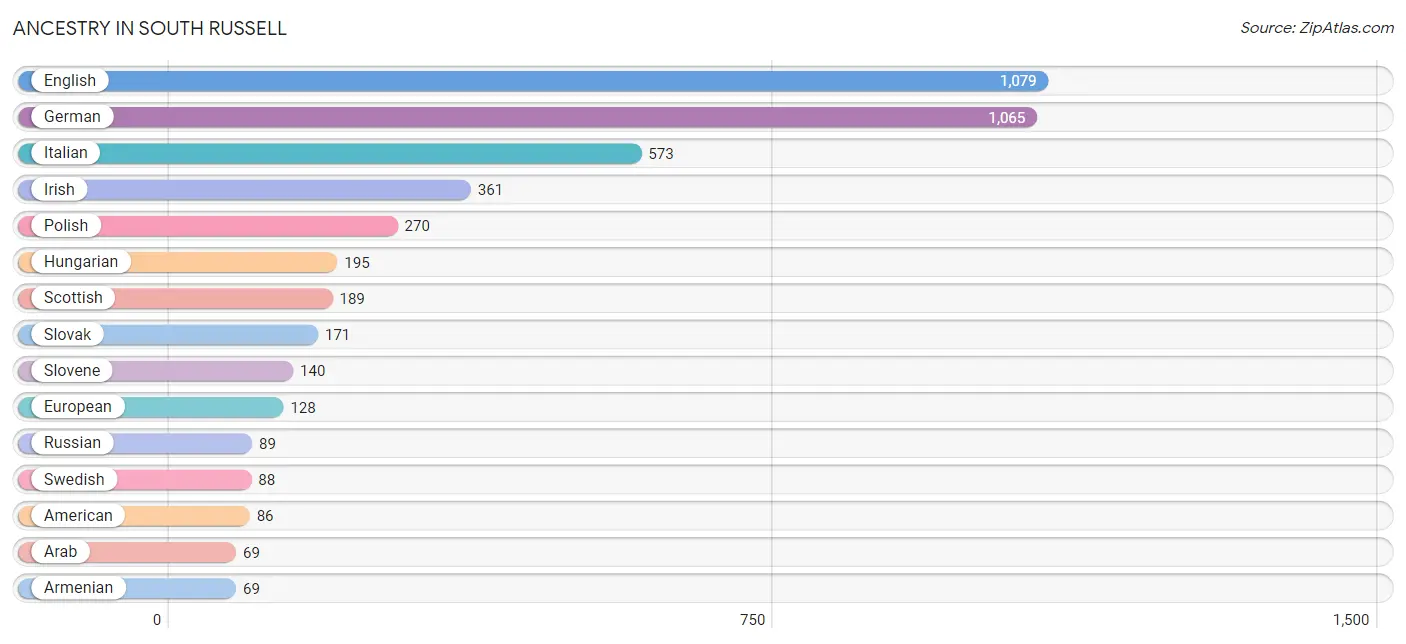
| Ancestry | # Population | % Population |
| African | 1 | 0.0% |
| American | 86 | 2.2% |
| Arab | 69 | 1.7% |
| Armenian | 69 | 1.7% |
| Austrian | 13 | 0.3% |
| Belgian | 63 | 1.6% |
| British | 21 | 0.5% |
| Canadian | 18 | 0.4% |
| Central American | 7 | 0.2% |
| Croatian | 13 | 0.3% |
| Czech | 8 | 0.2% |
| Czechoslovakian | 17 | 0.4% |
| Dutch | 9 | 0.2% |
| Eastern European | 20 | 0.5% |
| English | 1,079 | 27.2% |
| European | 128 | 3.2% |
| French | 60 | 1.5% |
| French Canadian | 7 | 0.2% |
| German | 1,065 | 26.9% |
| Greek | 21 | 0.5% |
| Hungarian | 195 | 4.9% |
| Indian (Asian) | 5 | 0.1% |
| Irish | 361 | 9.1% |
| Italian | 573 | 14.4% |
| Lebanese | 69 | 1.7% |
| Lithuanian | 16 | 0.4% |
| Mexican | 18 | 0.4% |
| Nicaraguan | 7 | 0.2% |
| Norwegian | 12 | 0.3% |
| Polish | 270 | 6.8% |
| Puerto Rican | 3 | 0.1% |
| Romanian | 39 | 1.0% |
| Russian | 89 | 2.2% |
| Scandinavian | 49 | 1.2% |
| Scotch-Irish | 21 | 0.5% |
| Scottish | 189 | 4.8% |
| Slovak | 171 | 4.3% |
| Slovene | 140 | 3.5% |
| Subsaharan African | 1 | 0.0% |
| Swedish | 88 | 2.2% |
| Swiss | 45 | 1.1% |
| Ukrainian | 31 | 0.8% |
| Welsh | 64 | 1.6% |
| Yugoslavian | 6 | 0.2% | View All 44 Rows |
Immigrants in South Russell
The most numerous immigrant groups reported in South Russell came from Europe (257 | 6.5%), Northern Europe (112 | 2.8%), England (72 | 1.8%), Eastern Europe (60 | 1.5%), and Russia (60 | 1.5%), together accounting for 14.1% of all South Russell residents.
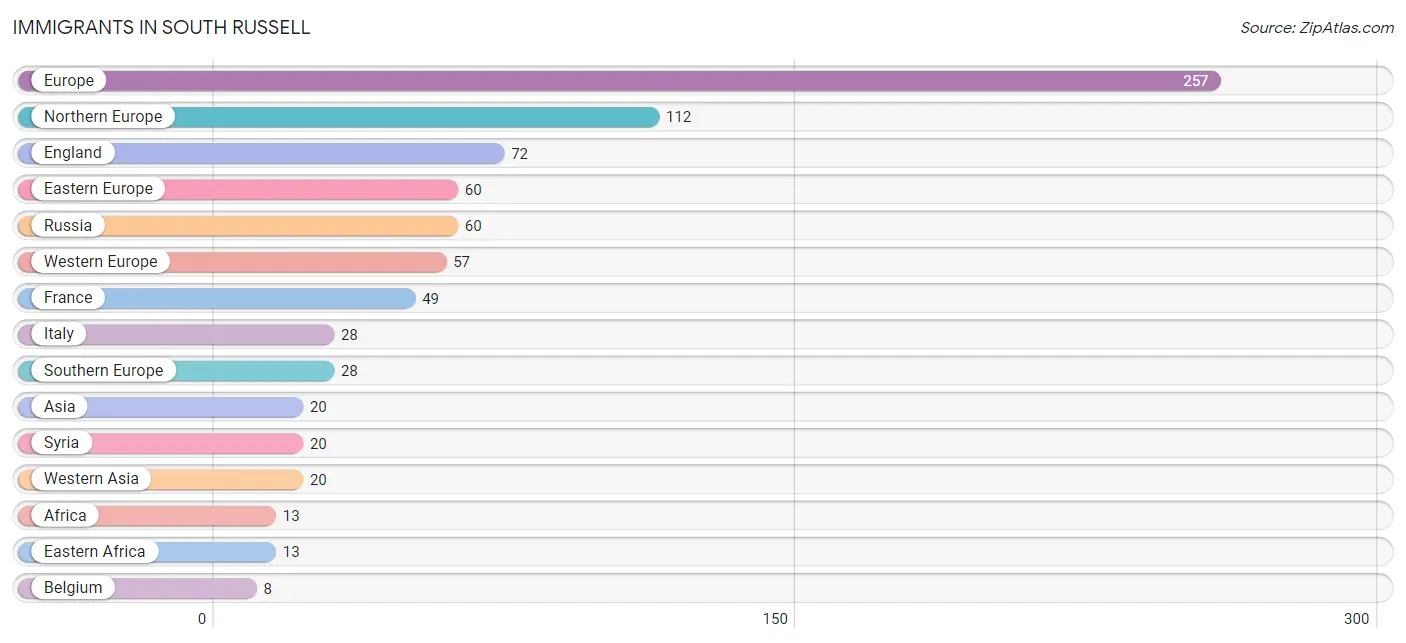
| Immigration Origin | # Population | % Population |
| Africa | 13 | 0.3% |
| Asia | 20 | 0.5% |
| Belgium | 8 | 0.2% |
| Central America | 7 | 0.2% |
| Eastern Africa | 13 | 0.3% |
| Eastern Europe | 60 | 1.5% |
| England | 72 | 1.8% |
| Europe | 257 | 6.5% |
| France | 49 | 1.2% |
| Italy | 28 | 0.7% |
| Latin America | 7 | 0.2% |
| Nicaragua | 7 | 0.2% |
| Northern Europe | 112 | 2.8% |
| Russia | 60 | 1.5% |
| Southern Europe | 28 | 0.7% |
| Syria | 20 | 0.5% |
| Western Asia | 20 | 0.5% |
| Western Europe | 57 | 1.4% | View All 18 Rows |
Sex and Age in South Russell
Sex and Age in South Russell
The most populous age groups in South Russell are 5 to 9 Years (194 | 9.5%) for men and 55 to 59 Years (218 | 11.3%) for women.
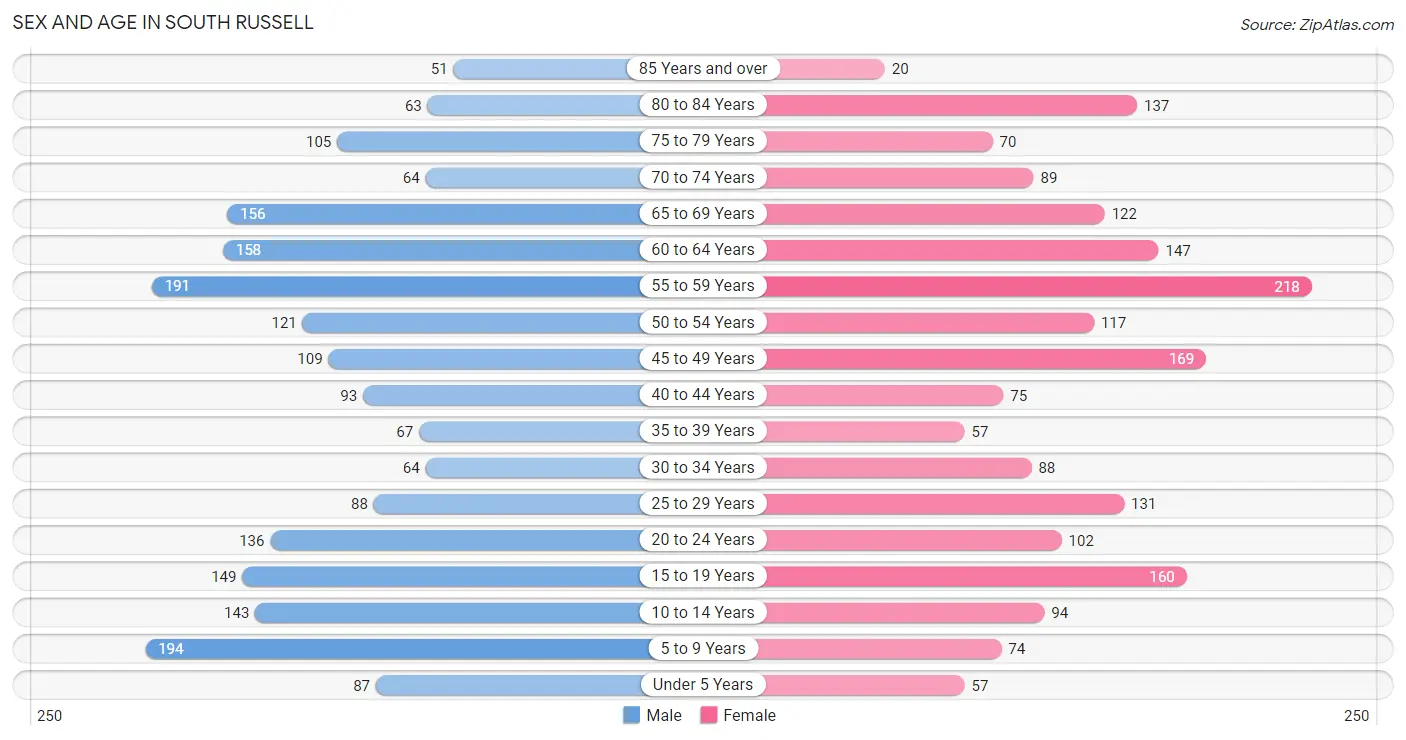
| Age Bracket | Male | Female |
| Under 5 Years | 87 (4.3%) | 57 (3.0%) |
| 5 to 9 Years | 194 (9.5%) | 74 (3.8%) |
| 10 to 14 Years | 143 (7.0%) | 94 (4.9%) |
| 15 to 19 Years | 149 (7.3%) | 160 (8.3%) |
| 20 to 24 Years | 136 (6.7%) | 102 (5.3%) |
| 25 to 29 Years | 88 (4.3%) | 131 (6.8%) |
| 30 to 34 Years | 64 (3.1%) | 88 (4.6%) |
| 35 to 39 Years | 67 (3.3%) | 57 (3.0%) |
| 40 to 44 Years | 93 (4.6%) | 75 (3.9%) |
| 45 to 49 Years | 109 (5.3%) | 169 (8.8%) |
| 50 to 54 Years | 121 (5.9%) | 117 (6.1%) |
| 55 to 59 Years | 191 (9.4%) | 218 (11.3%) |
| 60 to 64 Years | 158 (7.7%) | 147 (7.6%) |
| 65 to 69 Years | 156 (7.6%) | 122 (6.3%) |
| 70 to 74 Years | 64 (3.1%) | 89 (4.6%) |
| 75 to 79 Years | 105 (5.1%) | 70 (3.6%) |
| 80 to 84 Years | 63 (3.1%) | 137 (7.1%) |
| 85 Years and over | 51 (2.5%) | 20 (1.0%) |
| Total | 2,039 (100.0%) | 1,927 (100.0%) |
Families and Households in South Russell
Median Family Size in South Russell
The median family size in South Russell is 2.99 persons per family, with single female/mother families (140 | 11.5%) accounting for the largest median family size of 3.01 persons per family. On the other hand, single male/father families (51 | 4.2%) represent the smallest median family size with 2.94 persons per family.
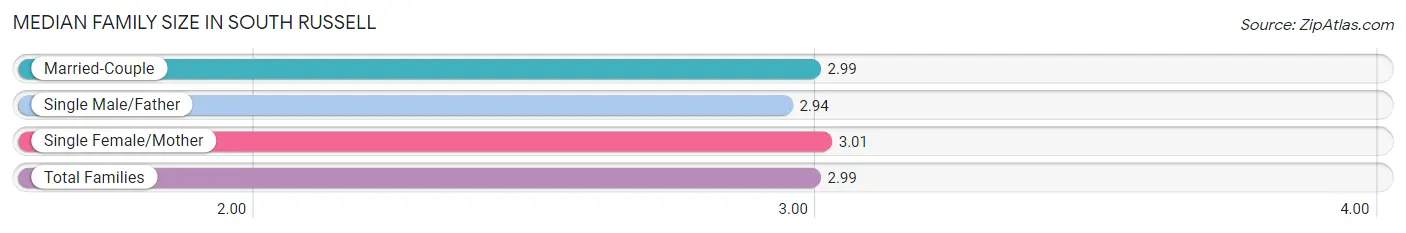
| Family Type | # Families | Family Size |
| Married-Couple | 1,023 (84.3%) | 2.99 |
| Single Male/Father | 51 (4.2%) | 2.94 |
| Single Female/Mother | 140 (11.5%) | 3.01 |
| Total Families | 1,214 (100.0%) | 2.99 |
Median Household Size in South Russell
The median household size in South Russell is 2.77 persons per household, with single male/father households (51 | 3.6%) accounting for the largest median household size of 3.45 persons per household. non-family households (210 | 14.7%) represent the smallest median household size with 1.30 persons per household.
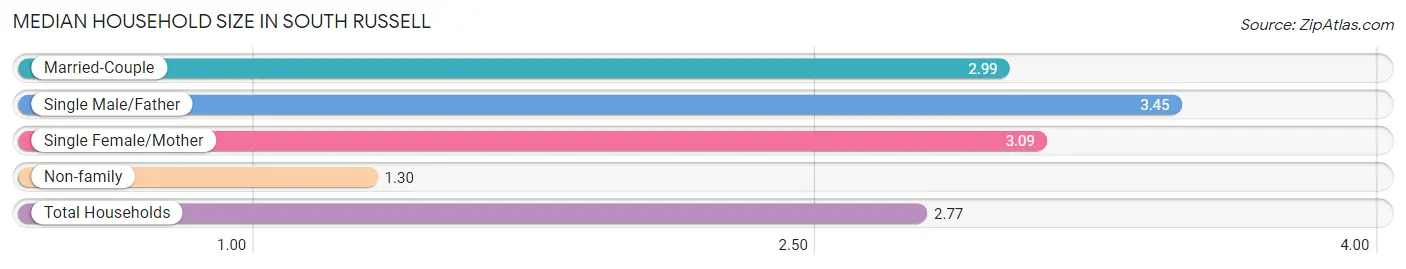
| Household Type | # Households | Household Size |
| Married-Couple | 1,023 (71.8%) | 2.99 |
| Single Male/Father | 51 (3.6%) | 3.45 |
| Single Female/Mother | 140 (9.8%) | 3.09 |
| Non-family | 210 (14.7%) | 1.30 |
| Total Households | 1,424 (100.0%) | 2.77 |
Household Size by Marriage Status in South Russell
Out of a total of 1,424 households in South Russell, 1,214 (85.3%) are family households, while 210 (14.7%) are nonfamily households. The most numerous type of family households are 2-person households, comprising 630, and the most common type of nonfamily households are 1-person households, comprising 147.
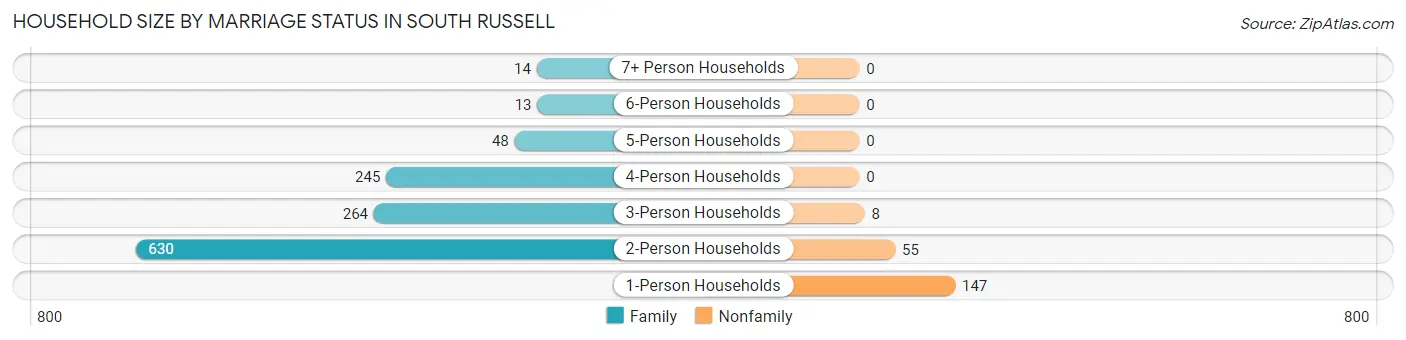
| Household Size | Family Households | Nonfamily Households |
| 1-Person Households | - | 147 (10.3%) |
| 2-Person Households | 630 (44.2%) | 55 (3.9%) |
| 3-Person Households | 264 (18.5%) | 8 (0.6%) |
| 4-Person Households | 245 (17.2%) | 0 (0.0%) |
| 5-Person Households | 48 (3.4%) | 0 (0.0%) |
| 6-Person Households | 13 (0.9%) | 0 (0.0%) |
| 7+ Person Households | 14 (1.0%) | 0 (0.0%) |
| Total | 1,214 (85.3%) | 210 (14.7%) |
Female Fertility in South Russell
Fertility by Age in South Russell
Average fertility rate in South Russell is 88.0 births per 1,000 women. Women in the age bracket of 20 to 34 years have the highest fertility rate with 178.0 births per 1,000 women. Women in the age bracket of 20 to 34 years acount for 81.4% of all women with births.
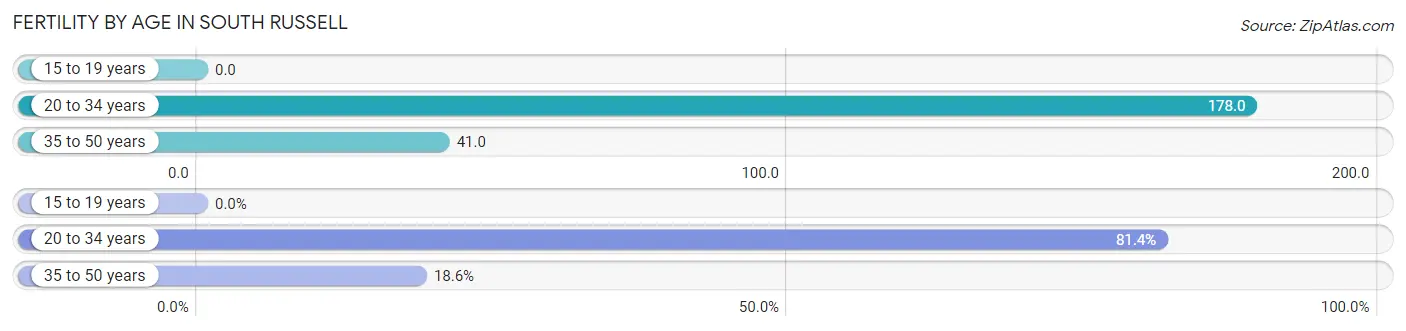
| Age Bracket | Women with Births | Births / 1,000 Women |
| 15 to 19 years | 0 (0.0%) | 0.0 |
| 20 to 34 years | 57 (81.4%) | 178.0 |
| 35 to 50 years | 13 (18.6%) | 41.0 |
| Total | 70 (100.0%) | 88.0 |
Fertility by Age by Marriage Status in South Russell
81.4% of women with births (70) in South Russell are married. The highest percentage of unmarried women with births falls into 20 to 34 years age bracket with 22.8% of them unmarried at the time of birth, while the lowest percentage of unmarried women with births belong to 35 to 50 years age bracket with 0.0% of them unmarried.
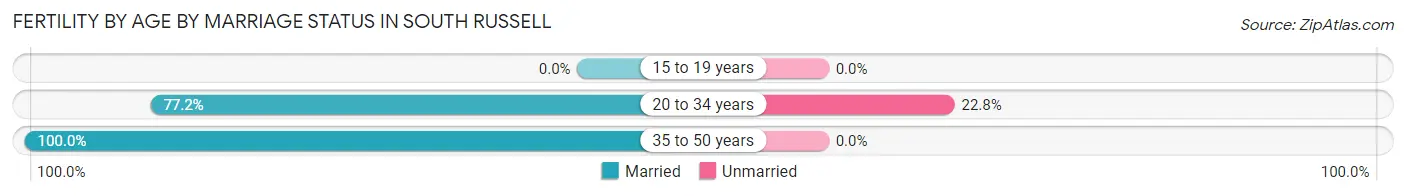
| Age Bracket | Married | Unmarried |
| 15 to 19 years | 0 (0.0%) | 0 (0.0%) |
| 20 to 34 years | 44 (77.2%) | 13 (22.8%) |
| 35 to 50 years | 13 (100.0%) | 0 (0.0%) |
| Total | 57 (81.4%) | 13 (18.6%) |
Fertility by Education in South Russell
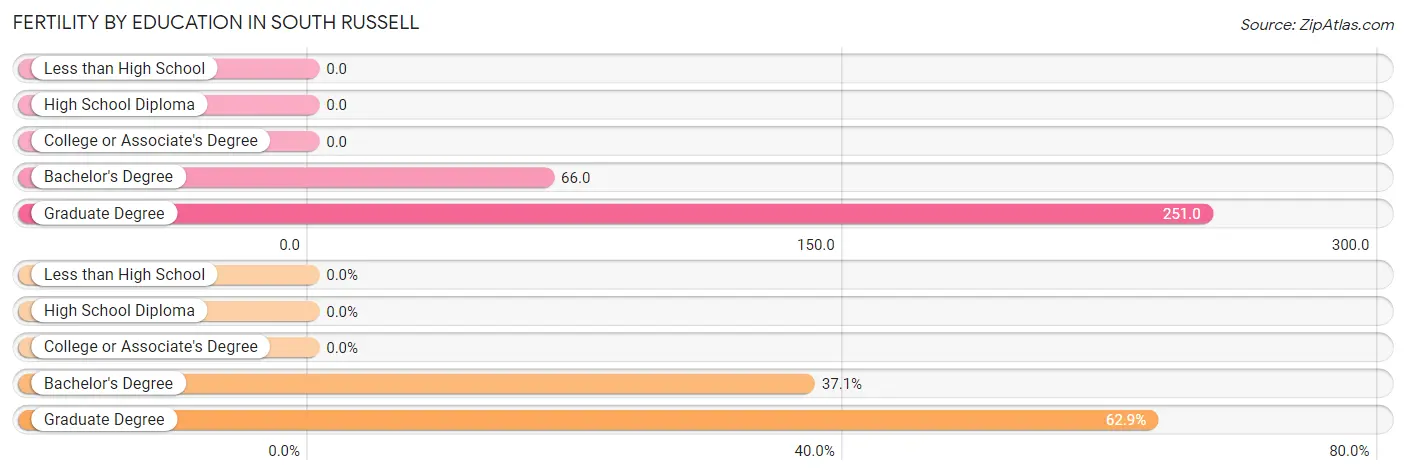
| Educational Attainment | Women with Births | Births / 1,000 Women |
| Less than High School | 0 (0.0%) | 0.0 |
| High School Diploma | 0 (0.0%) | 0.0 |
| College or Associate's Degree | 0 (0.0%) | 0.0 |
| Bachelor's Degree | 26 (37.1%) | 66.0 |
| Graduate Degree | 44 (62.9%) | 251.0 |
| Total | 70 (100.0%) | 88.0 |
Fertility by Education by Marriage Status in South Russell
18.6% of women with births in South Russell are unmarried. Women with the educational attainment of graduate degree are most likely to be married with 100.0% of them married at childbirth, while women with the educational attainment of bachelor's degree are least likely to be married with 50.0% of them unmarried at childbirth.
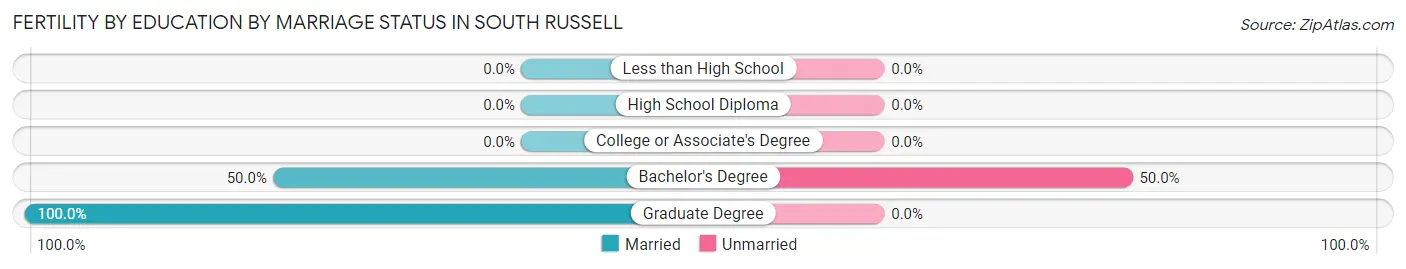
| Educational Attainment | Married | Unmarried |
| Less than High School | 0 (0.0%) | 0 (0.0%) |
| High School Diploma | 0 (0.0%) | 0 (0.0%) |
| College or Associate's Degree | 0 (0.0%) | 0 (0.0%) |
| Bachelor's Degree | 13 (50.0%) | 13 (50.0%) |
| Graduate Degree | 44 (100.0%) | 0 (0.0%) |
| Total | 57 (81.4%) | 13 (18.6%) |
Employment Characteristics in South Russell
Employment by Class of Employer in South Russell
Among the 2,007 employed individuals in South Russell, private company employees (1,275 | 63.5%), self-employed (not incorporated) (221 | 11.0%), and local government employees (182 | 9.1%) make up the most common classes of employment.
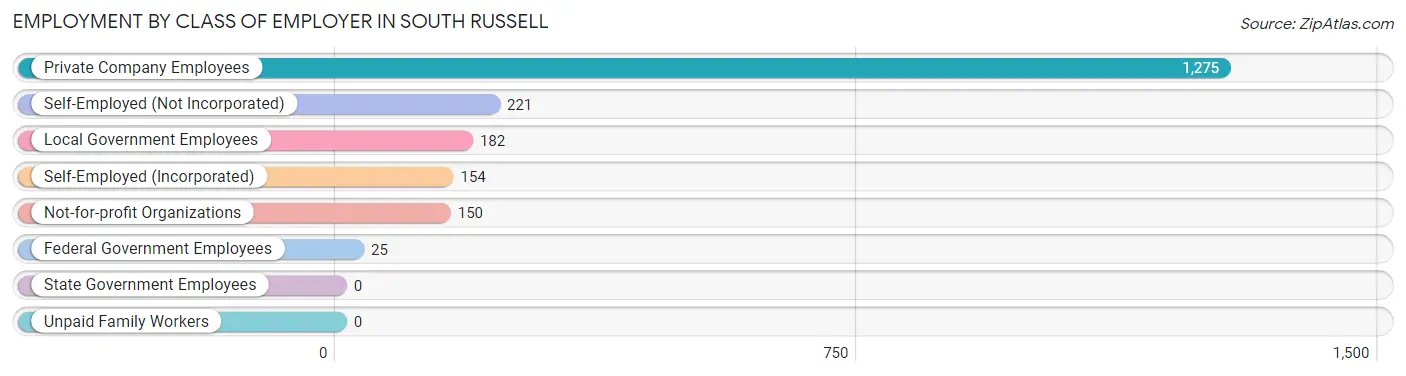
| Employer Class | # Employees | % Employees |
| Private Company Employees | 1,275 | 63.5% |
| Self-Employed (Incorporated) | 154 | 7.7% |
| Self-Employed (Not Incorporated) | 221 | 11.0% |
| Not-for-profit Organizations | 150 | 7.5% |
| Local Government Employees | 182 | 9.1% |
| State Government Employees | 0 | 0.0% |
| Federal Government Employees | 25 | 1.3% |
| Unpaid Family Workers | 0 | 0.0% |
| Total | 2,007 | 100.0% |
Employment Status by Age in South Russell
According to the labor force statistics for South Russell, out of the total population over 16 years of age (3,284), 63.2% or 2,075 individuals are in the labor force, with 2.7% or 56 of them unemployed. The age group with the highest labor force participation rate is 25 to 29 years, with 99.5% or 218 individuals in the labor force. Within the labor force, the 25 to 29 years age range has the highest percentage of unemployed individuals, with 16.1% or 35 of them being unemployed.
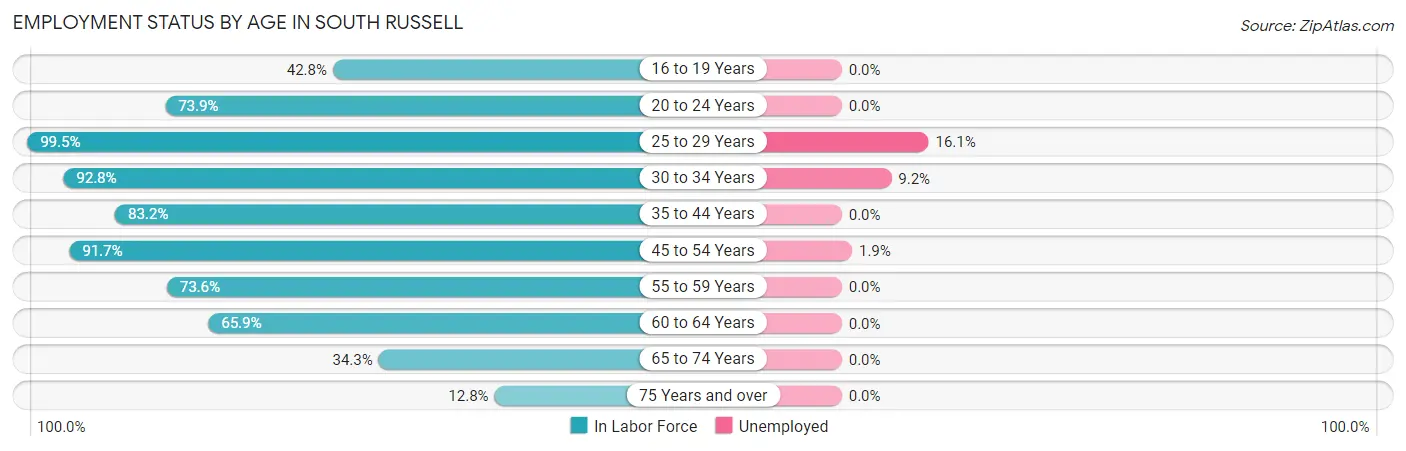
| Age Bracket | In Labor Force | Unemployed |
| 16 to 19 Years | 118 (42.8%) | 0 (0.0%) |
| 20 to 24 Years | 176 (73.9%) | 0 (0.0%) |
| 25 to 29 Years | 218 (99.5%) | 35 (16.1%) |
| 30 to 34 Years | 141 (92.8%) | 13 (9.2%) |
| 35 to 44 Years | 243 (83.2%) | 0 (0.0%) |
| 45 to 54 Years | 473 (91.7%) | 9 (1.9%) |
| 55 to 59 Years | 301 (73.6%) | 0 (0.0%) |
| 60 to 64 Years | 201 (65.9%) | 0 (0.0%) |
| 65 to 74 Years | 148 (34.3%) | 0 (0.0%) |
| 75 Years and over | 57 (12.8%) | 0 (0.0%) |
| Total | 2,075 (63.2%) | 56 (2.7%) |
Employment Status by Educational Attainment in South Russell
According to labor force statistics for South Russell, 83.3% of individuals (1,577) out of the total population between 25 and 64 years of age (1,893) are in the labor force, with 3.6% or 57 of them being unemployed. The group with the highest labor force participation rate are those with the educational attainment of high school diploma, with 100.0% or 129 individuals in the labor force. Within the labor force, individuals with bachelor's degree or higher education have the highest percentage of unemployment, with 4.5% or 57 of them being unemployed.
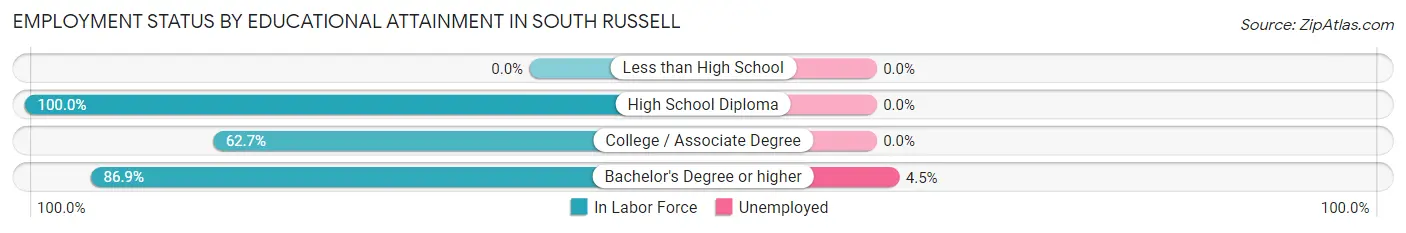
| Educational Attainment | In Labor Force | Unemployed |
| Less than High School | 0 (0.0%) | 0 (0.0%) |
| High School Diploma | 129 (100.0%) | 0 (0.0%) |
| College / Associate Degree | 170 (62.7%) | 0 (0.0%) |
| Bachelor's Degree or higher | 1,277 (86.9%) | 66 (4.5%) |
| Total | 1,577 (83.3%) | 68 (3.6%) |
Employment Occupations by Sex in South Russell
Management, Business, Science and Arts Occupations
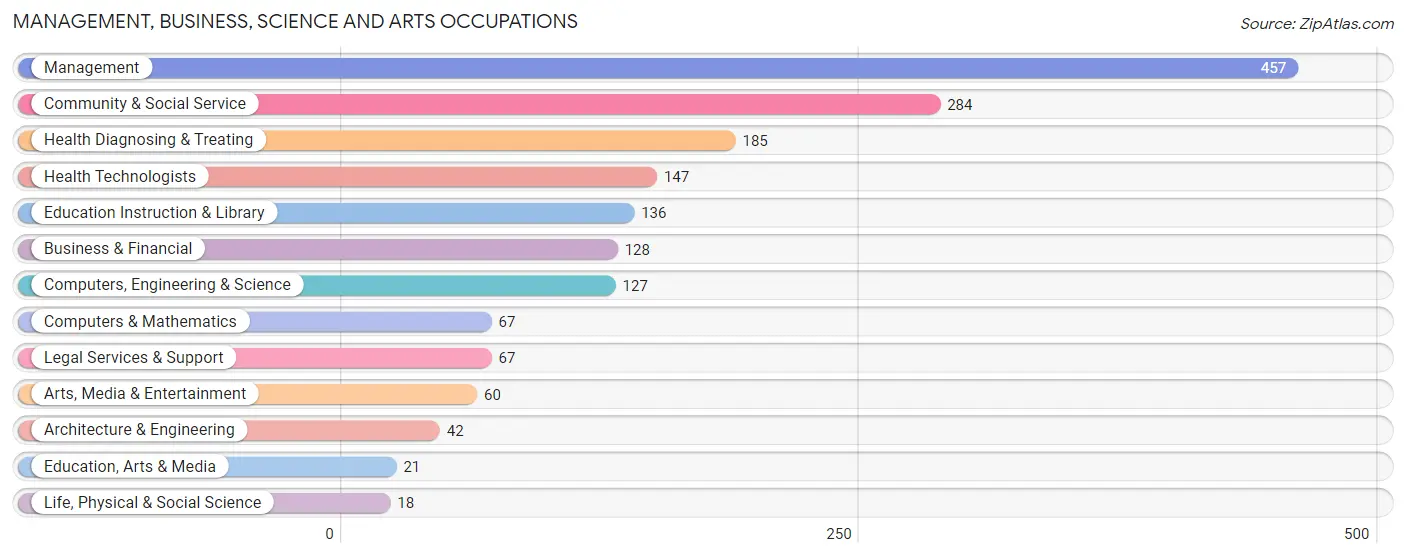
The most common Management, Business, Science and Arts occupations in South Russell are Management (457 | 22.6%), Community & Social Service (284 | 14.1%), Health Diagnosing & Treating (185 | 9.2%), Health Technologists (147 | 7.3%), and Education Instruction & Library (136 | 6.7%).
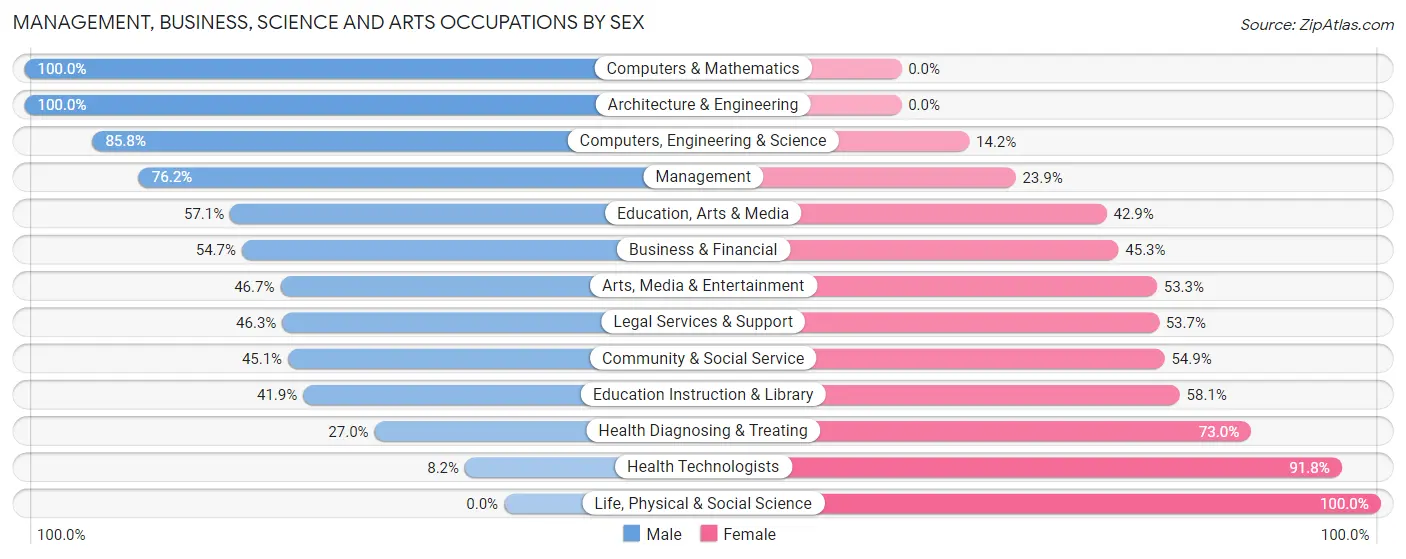
Management, Business, Science and Arts Occupations by Sex
Within the Management, Business, Science and Arts occupations in South Russell, the most male-oriented occupations are Computers & Mathematics (100.0%), Architecture & Engineering (100.0%), and Computers, Engineering & Science (85.8%), while the most female-oriented occupations are Life, Physical & Social Science (100.0%), Health Technologists (91.8%), and Health Diagnosing & Treating (73.0%).
| Occupation | Male | Female |
| Management | 348 (76.1%) | 109 (23.8%) |
| Business & Financial | 70 (54.7%) | 58 (45.3%) |
| Computers, Engineering & Science | 109 (85.8%) | 18 (14.2%) |
| Computers & Mathematics | 67 (100.0%) | 0 (0.0%) |
| Architecture & Engineering | 42 (100.0%) | 0 (0.0%) |
| Life, Physical & Social Science | 0 (0.0%) | 18 (100.0%) |
| Community & Social Service | 128 (45.1%) | 156 (54.9%) |
| Education, Arts & Media | 12 (57.1%) | 9 (42.9%) |
| Legal Services & Support | 31 (46.3%) | 36 (53.7%) |
| Education Instruction & Library | 57 (41.9%) | 79 (58.1%) |
| Arts, Media & Entertainment | 28 (46.7%) | 32 (53.3%) |
| Health Diagnosing & Treating | 50 (27.0%) | 135 (73.0%) |
| Health Technologists | 12 (8.2%) | 135 (91.8%) |
| Total (Category) | 705 (59.7%) | 476 (40.3%) |
| Total (Overall) | 1,187 (58.8%) | 832 (41.2%) |
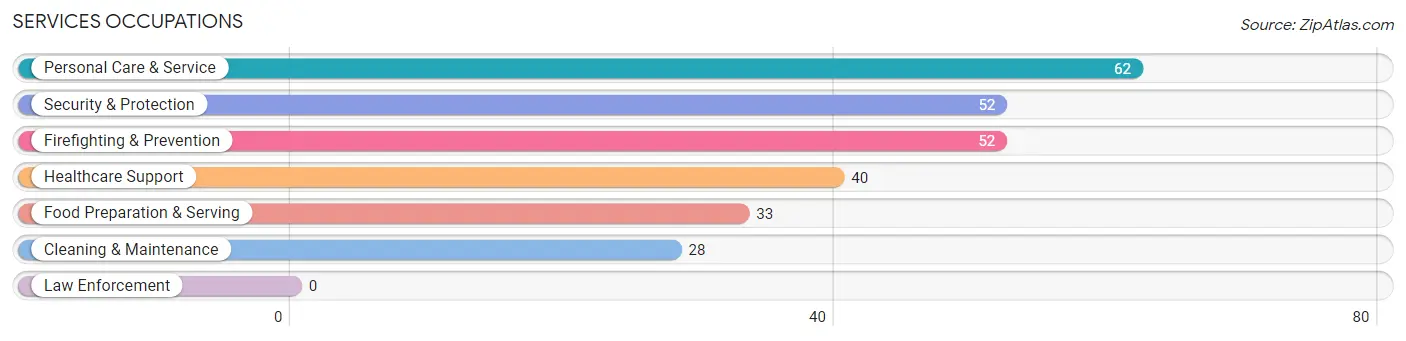
Services Occupations
The most common Services occupations in South Russell are Personal Care & Service (62 | 3.1%), Security & Protection (52 | 2.6%), Firefighting & Prevention (52 | 2.6%), Healthcare Support (40 | 2.0%), and Food Preparation & Serving (33 | 1.6%).
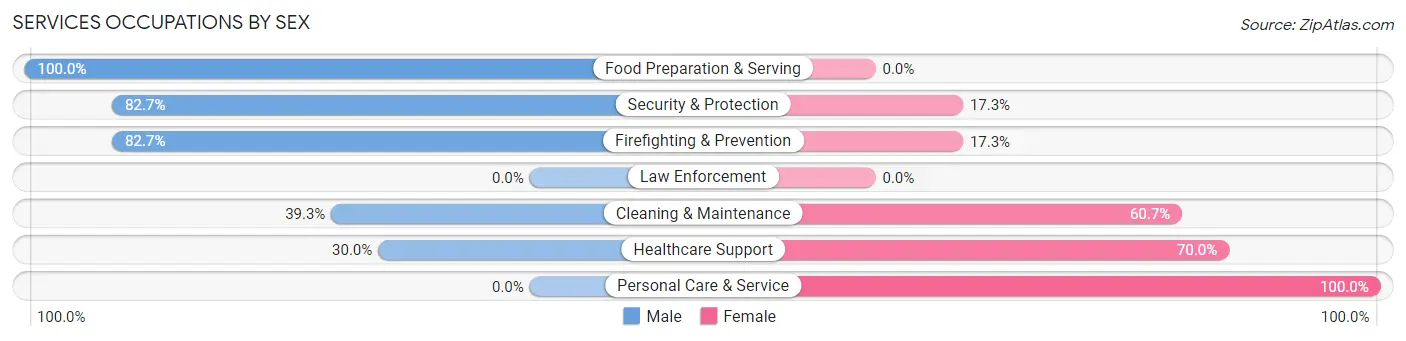
Services Occupations by Sex
Within the Services occupations in South Russell, the most male-oriented occupations are Food Preparation & Serving (100.0%), Security & Protection (82.7%), and Firefighting & Prevention (82.7%), while the most female-oriented occupations are Personal Care & Service (100.0%), Healthcare Support (70.0%), and Cleaning & Maintenance (60.7%).
| Occupation | Male | Female |
| Healthcare Support | 12 (30.0%) | 28 (70.0%) |
| Security & Protection | 43 (82.7%) | 9 (17.3%) |
| Firefighting & Prevention | 43 (82.7%) | 9 (17.3%) |
| Law Enforcement | 0 (0.0%) | 0 (0.0%) |
| Food Preparation & Serving | 33 (100.0%) | 0 (0.0%) |
| Cleaning & Maintenance | 11 (39.3%) | 17 (60.7%) |
| Personal Care & Service | 0 (0.0%) | 62 (100.0%) |
| Total (Category) | 99 (46.1%) | 116 (53.9%) |
| Total (Overall) | 1,187 (58.8%) | 832 (41.2%) |
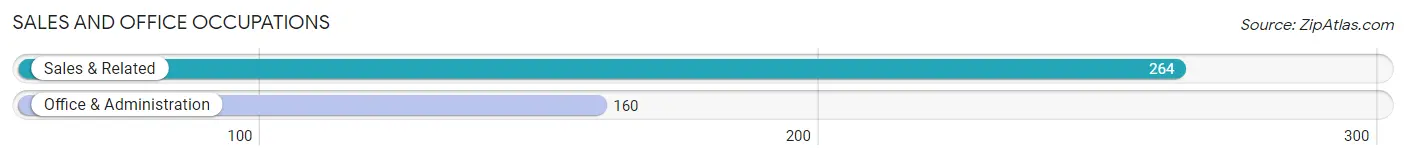
Sales and Office Occupations
The most common Sales and Office occupations in South Russell are Sales & Related (264 | 13.1%), and Office & Administration (160 | 7.9%).
Sales and Office Occupations by Sex
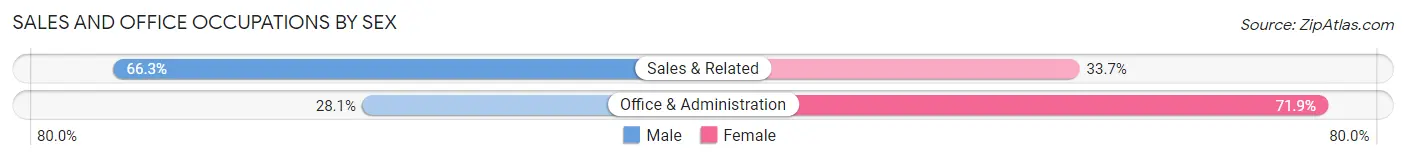
| Occupation | Male | Female |
| Sales & Related | 175 (66.3%) | 89 (33.7%) |
| Office & Administration | 45 (28.1%) | 115 (71.9%) |
| Total (Category) | 220 (51.9%) | 204 (48.1%) |
| Total (Overall) | 1,187 (58.8%) | 832 (41.2%) |
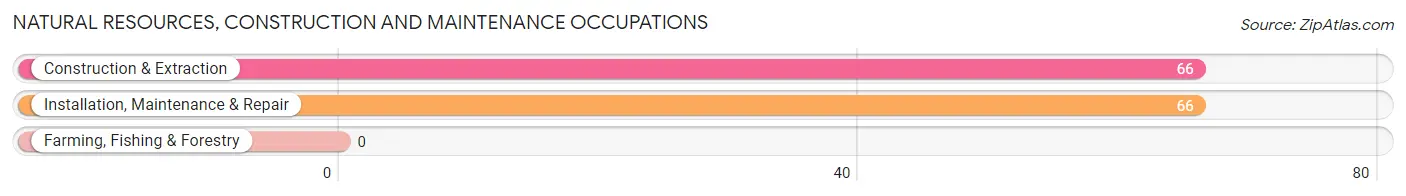
Natural Resources, Construction and Maintenance Occupations
The most common Natural Resources, Construction and Maintenance occupations in South Russell are Construction & Extraction (66 | 3.3%), and Installation, Maintenance & Repair (66 | 3.3%).
Natural Resources, Construction and Maintenance Occupations by Sex
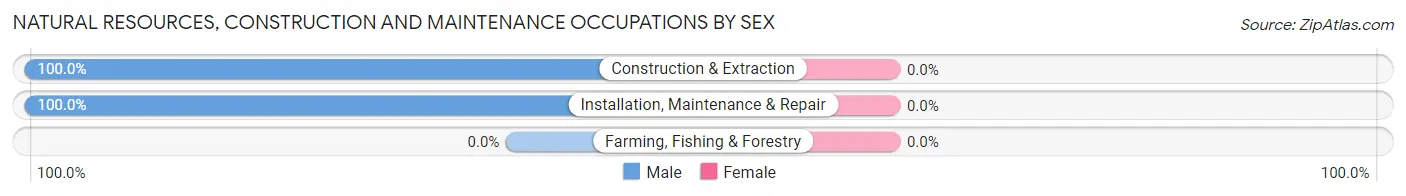
| Occupation | Male | Female |
| Farming, Fishing & Forestry | 0 (0.0%) | 0 (0.0%) |
| Construction & Extraction | 66 (100.0%) | 0 (0.0%) |
| Installation, Maintenance & Repair | 66 (100.0%) | 0 (0.0%) |
| Total (Category) | 132 (100.0%) | 0 (0.0%) |
| Total (Overall) | 1,187 (58.8%) | 832 (41.2%) |
Production, Transportation and Moving Occupations
The most common Production, Transportation and Moving occupations in South Russell are Production (46 | 2.3%), and Transportation (21 | 1.0%).
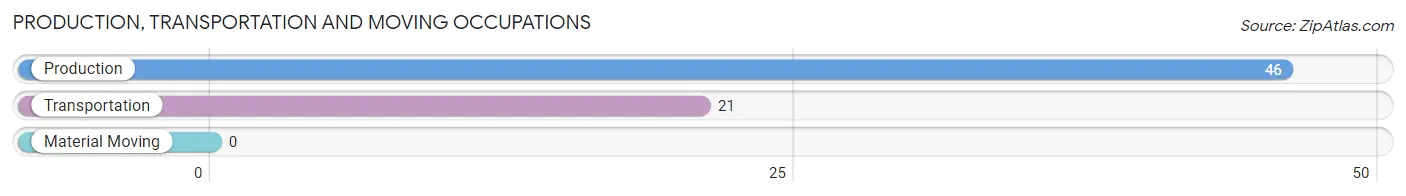
Production, Transportation and Moving Occupations by Sex
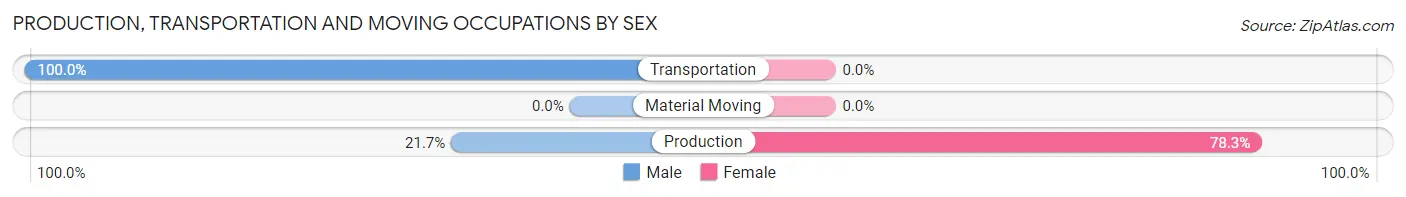
| Occupation | Male | Female |
| Production | 10 (21.7%) | 36 (78.3%) |
| Transportation | 21 (100.0%) | 0 (0.0%) |
| Material Moving | 0 (0.0%) | 0 (0.0%) |
| Total (Category) | 31 (46.3%) | 36 (53.7%) |
| Total (Overall) | 1,187 (58.8%) | 832 (41.2%) |
Employment Industries by Sex in South Russell
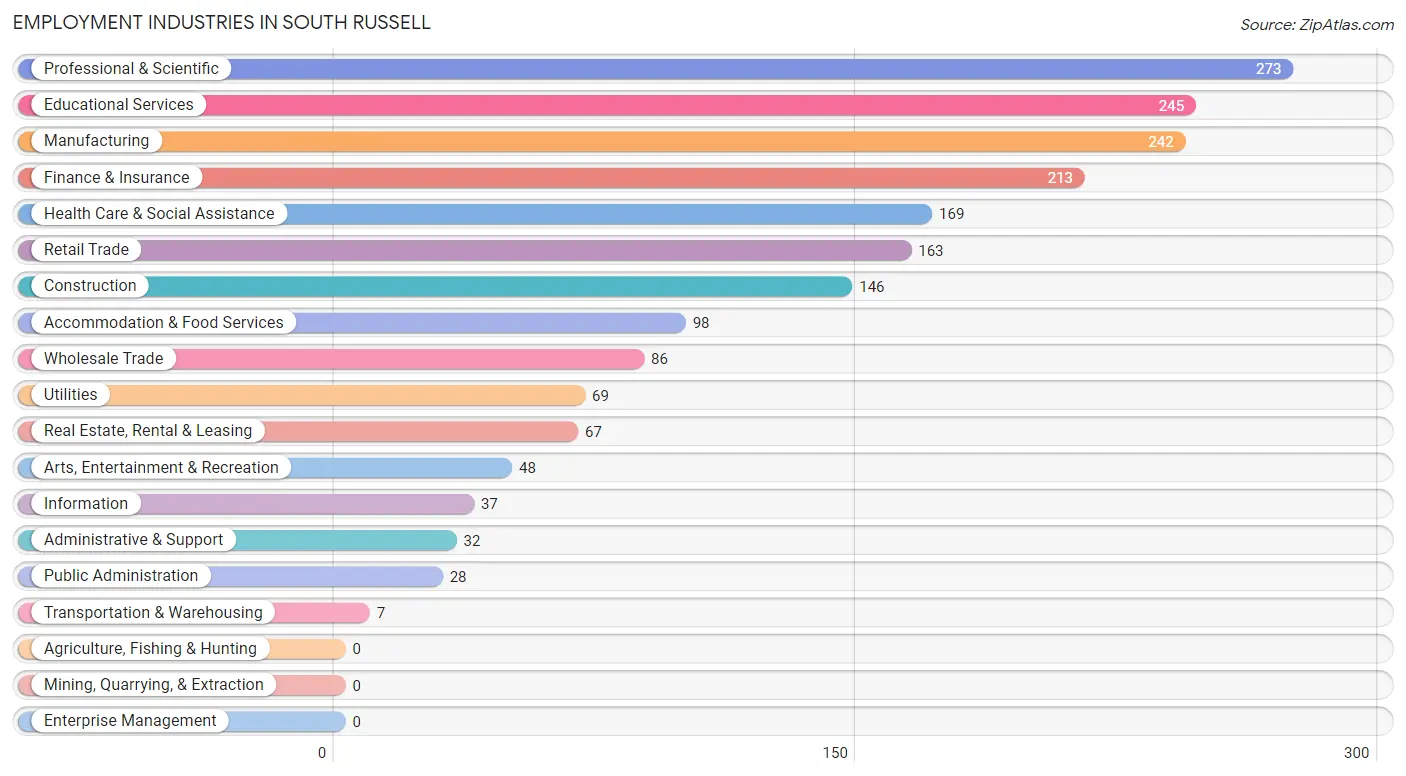
Employment Industries in South Russell
The major employment industries in South Russell include Professional & Scientific (273 | 13.5%), Educational Services (245 | 12.1%), Manufacturing (242 | 12.0%), Finance & Insurance (213 | 10.5%), and Health Care & Social Assistance (169 | 8.4%).
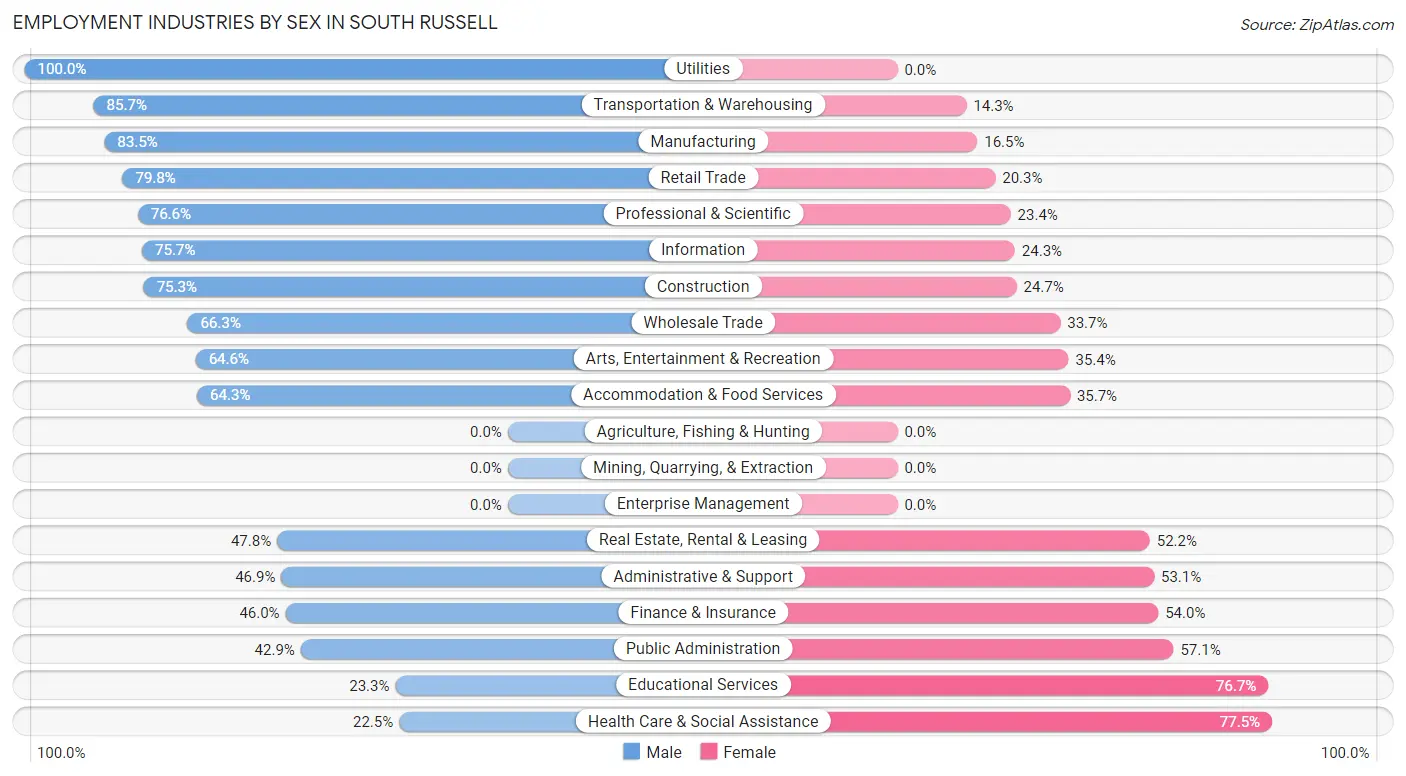
Employment Industries by Sex in South Russell
The South Russell industries that see more men than women are Utilities (100.0%), Transportation & Warehousing (85.7%), and Manufacturing (83.5%), whereas the industries that tend to have a higher number of women are Health Care & Social Assistance (77.5%), Educational Services (76.7%), and Public Administration (57.1%).
| Industry | Male | Female |
| Agriculture, Fishing & Hunting | 0 (0.0%) | 0 (0.0%) |
| Mining, Quarrying, & Extraction | 0 (0.0%) | 0 (0.0%) |
| Construction | 110 (75.3%) | 36 (24.7%) |
| Manufacturing | 202 (83.5%) | 40 (16.5%) |
| Wholesale Trade | 57 (66.3%) | 29 (33.7%) |
| Retail Trade | 130 (79.7%) | 33 (20.3%) |
| Transportation & Warehousing | 6 (85.7%) | 1 (14.3%) |
| Utilities | 69 (100.0%) | 0 (0.0%) |
| Information | 28 (75.7%) | 9 (24.3%) |
| Finance & Insurance | 98 (46.0%) | 115 (54.0%) |
| Real Estate, Rental & Leasing | 32 (47.8%) | 35 (52.2%) |
| Professional & Scientific | 209 (76.6%) | 64 (23.4%) |
| Enterprise Management | 0 (0.0%) | 0 (0.0%) |
| Administrative & Support | 15 (46.9%) | 17 (53.1%) |
| Educational Services | 57 (23.3%) | 188 (76.7%) |
| Health Care & Social Assistance | 38 (22.5%) | 131 (77.5%) |
| Arts, Entertainment & Recreation | 31 (64.6%) | 17 (35.4%) |
| Accommodation & Food Services | 63 (64.3%) | 35 (35.7%) |
| Public Administration | 12 (42.9%) | 16 (57.1%) |
| Total | 1,187 (58.8%) | 832 (41.2%) |
Education in South Russell
School Enrollment in South Russell
The most common levels of schooling among the 977 students in South Russell are high school (312 | 31.9%), middle school (213 | 21.8%), and elementary school (183 | 18.7%).
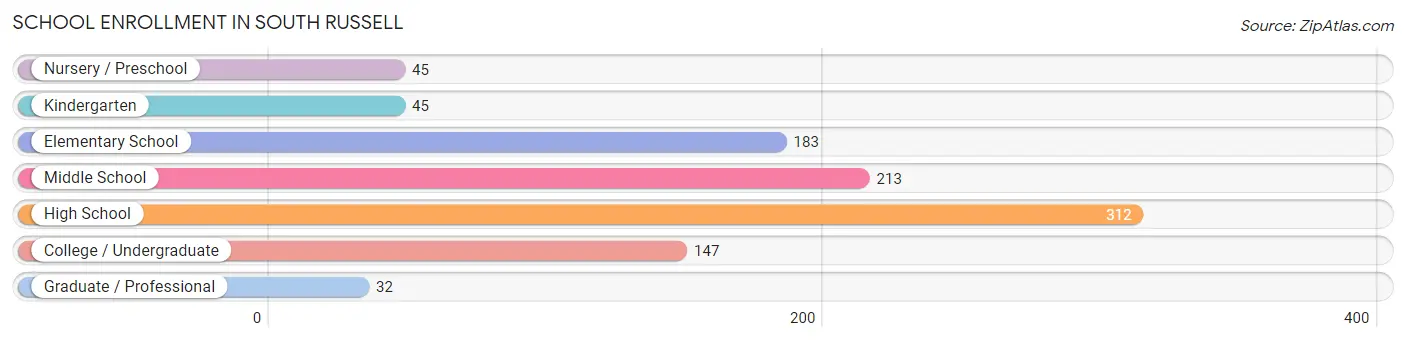
| School Level | # Students | % Students |
| Nursery / Preschool | 45 | 4.6% |
| Kindergarten | 45 | 4.6% |
| Elementary School | 183 | 18.7% |
| Middle School | 213 | 21.8% |
| High School | 312 | 31.9% |
| College / Undergraduate | 147 | 15.0% |
| Graduate / Professional | 32 | 3.3% |
| Total | 977 | 100.0% |
School Enrollment by Age by Funding Source in South Russell
Out of a total of 977 students who are enrolled in schools in South Russell, 109 (11.2%) attend a private institution, while the remaining 868 (88.8%) are enrolled in public schools. The age group of 3 to 4 year olds has the highest likelihood of being enrolled in private schools, with 9 (45.0% in the age bracket) enrolled. Conversely, the age group of 20 to 24 year olds has the lowest likelihood of being enrolled in a private school, with 95 (100.0% in the age bracket) attending a public institution.
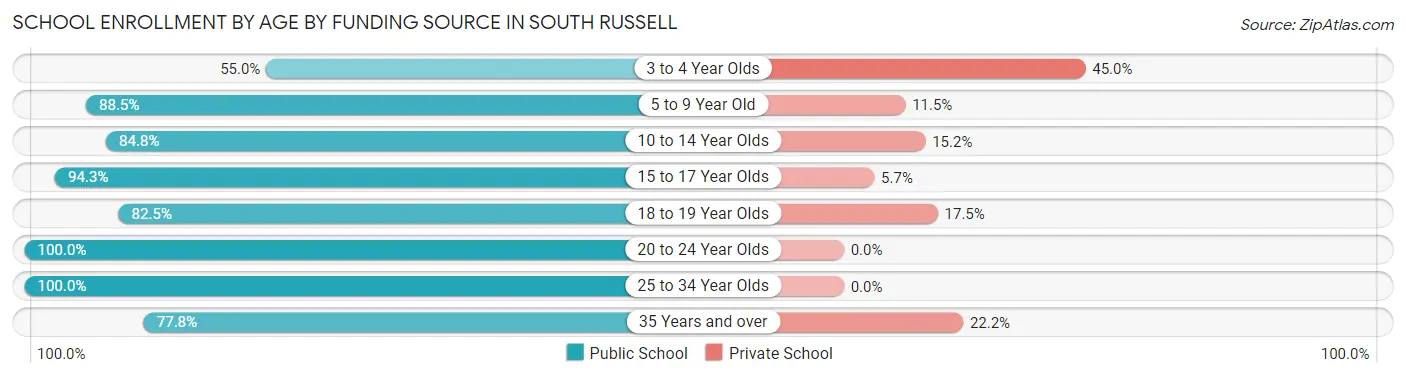
| Age Bracket | Public School | Private School |
| 3 to 4 Year Olds | 11 (55.0%) | 9 (45.0%) |
| 5 to 9 Year Old | 224 (88.5%) | 29 (11.5%) |
| 10 to 14 Year Olds | 201 (84.8%) | 36 (15.2%) |
| 15 to 17 Year Olds | 216 (94.3%) | 13 (5.7%) |
| 18 to 19 Year Olds | 66 (82.5%) | 14 (17.5%) |
| 20 to 24 Year Olds | 95 (100.0%) | 0 (0.0%) |
| 25 to 34 Year Olds | 27 (100.0%) | 0 (0.0%) |
| 35 Years and over | 28 (77.8%) | 8 (22.2%) |
| Total | 868 (88.8%) | 109 (11.2%) |
Educational Attainment by Field of Study in South Russell
Business (503 | 23.1%), engineering (214 | 9.8%), education (206 | 9.5%), social sciences (171 | 7.9%), and liberal arts & history (159 | 7.3%) are the most common fields of study among 2,176 individuals in South Russell who have obtained a bachelor's degree or higher.
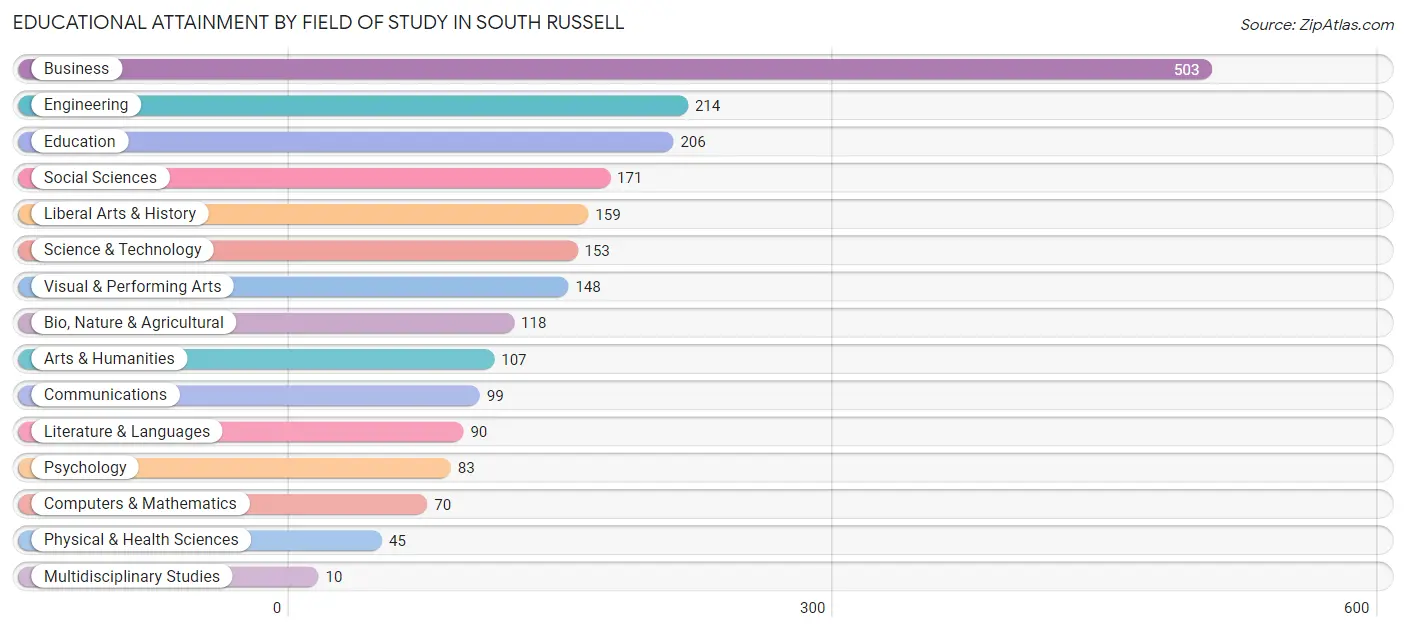
| Field of Study | # Graduates | % Graduates |
| Computers & Mathematics | 70 | 3.2% |
| Bio, Nature & Agricultural | 118 | 5.4% |
| Physical & Health Sciences | 45 | 2.1% |
| Psychology | 83 | 3.8% |
| Social Sciences | 171 | 7.9% |
| Engineering | 214 | 9.8% |
| Multidisciplinary Studies | 10 | 0.5% |
| Science & Technology | 153 | 7.0% |
| Business | 503 | 23.1% |
| Education | 206 | 9.5% |
| Literature & Languages | 90 | 4.1% |
| Liberal Arts & History | 159 | 7.3% |
| Visual & Performing Arts | 148 | 6.8% |
| Communications | 99 | 4.5% |
| Arts & Humanities | 107 | 4.9% |
| Total | 2,176 | 100.0% |
Transportation & Commute in South Russell
Vehicle Availability by Sex in South Russell
The most prevalent vehicle ownership categories in South Russell are males with 3 vehicles (593, accounting for 50.5%) and females with 3 vehicles (325, making up 71.3%).
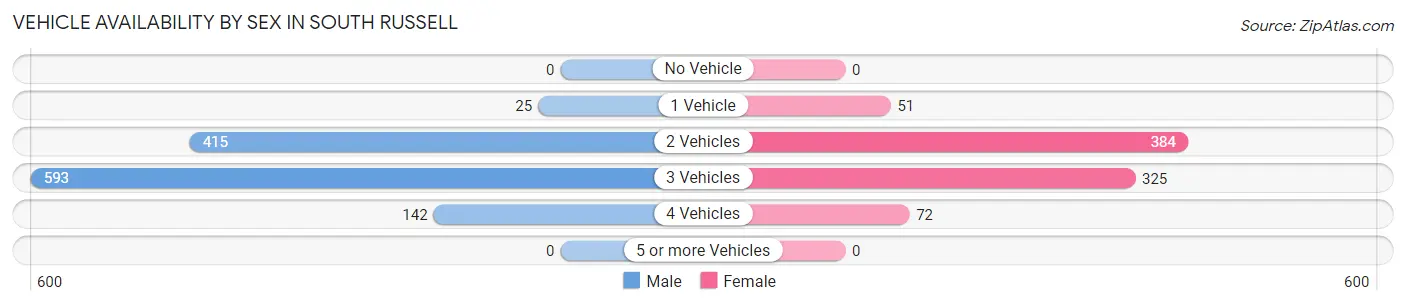
| Vehicles Available | Male | Female |
| No Vehicle | 0 (0.0%) | 0 (0.0%) |
| 1 Vehicle | 25 (2.1%) | 51 (6.1%) |
| 2 Vehicles | 415 (35.3%) | 384 (46.2%) |
| 3 Vehicles | 593 (50.5%) | 325 (39.1%) |
| 4 Vehicles | 142 (12.1%) | 72 (8.6%) |
| 5 or more Vehicles | 0 (0.0%) | 0 (0.0%) |
| Total | 1,175 (100.0%) | 832 (100.0%) |
Commute Time in South Russell
The most frequently occuring commute durations in South Russell are 20 to 24 minutes (388 commuters, 23.4%), 30 to 34 minutes (231 commuters, 13.9%), and 45 to 59 minutes (231 commuters, 13.9%).
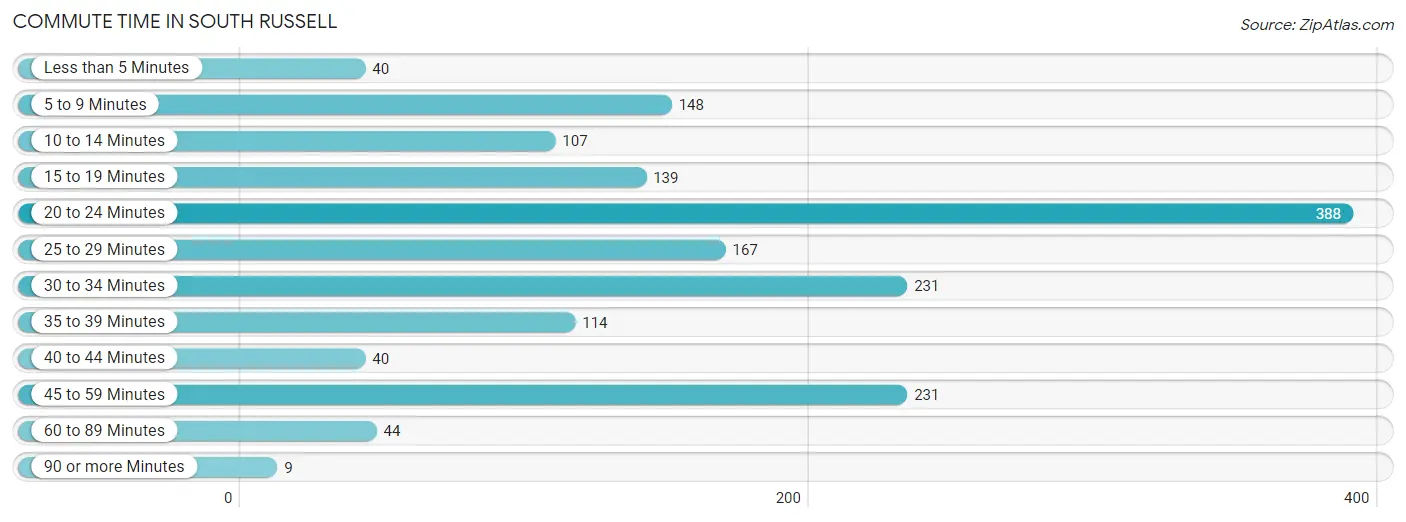
| Commute Time | # Commuters | % Commuters |
| Less than 5 Minutes | 40 | 2.4% |
| 5 to 9 Minutes | 148 | 8.9% |
| 10 to 14 Minutes | 107 | 6.5% |
| 15 to 19 Minutes | 139 | 8.4% |
| 20 to 24 Minutes | 388 | 23.4% |
| 25 to 29 Minutes | 167 | 10.1% |
| 30 to 34 Minutes | 231 | 13.9% |
| 35 to 39 Minutes | 114 | 6.9% |
| 40 to 44 Minutes | 40 | 2.4% |
| 45 to 59 Minutes | 231 | 13.9% |
| 60 to 89 Minutes | 44 | 2.6% |
| 90 or more Minutes | 9 | 0.5% |
Commute Time by Sex in South Russell
The most common commute times in South Russell are 20 to 24 minutes (248 commuters, 24.9%) for males and 20 to 24 minutes (140 commuters, 21.1%) for females.
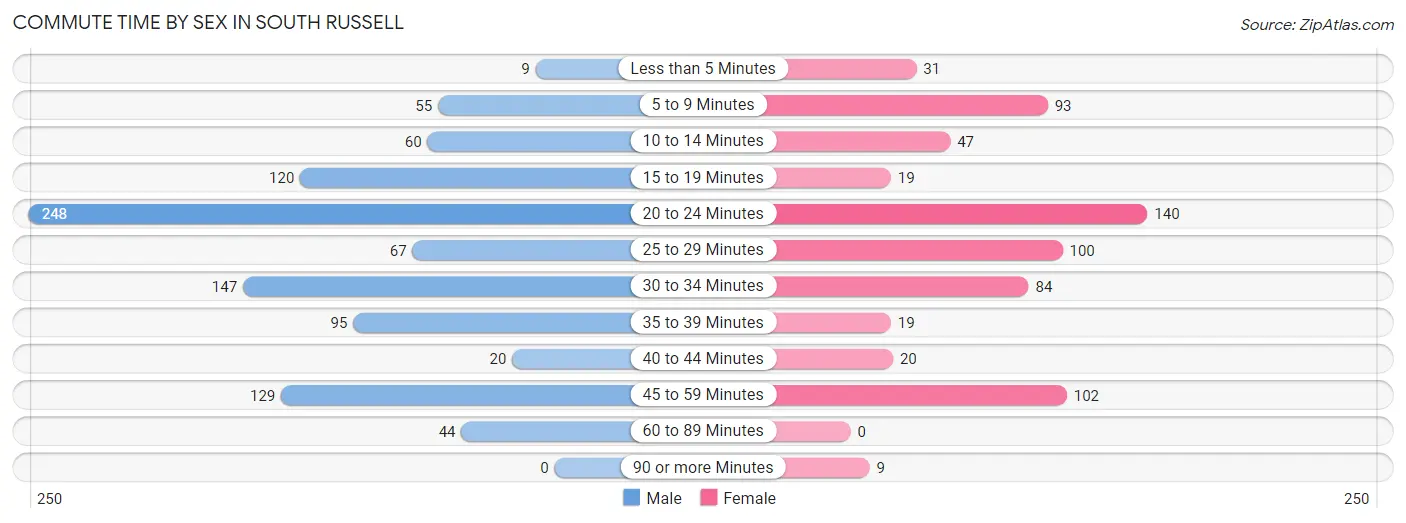
| Commute Time | Male | Female |
| Less than 5 Minutes | 9 (0.9%) | 31 (4.7%) |
| 5 to 9 Minutes | 55 (5.5%) | 93 (14.0%) |
| 10 to 14 Minutes | 60 (6.0%) | 47 (7.1%) |
| 15 to 19 Minutes | 120 (12.1%) | 19 (2.9%) |
| 20 to 24 Minutes | 248 (24.9%) | 140 (21.1%) |
| 25 to 29 Minutes | 67 (6.7%) | 100 (15.1%) |
| 30 to 34 Minutes | 147 (14.8%) | 84 (12.7%) |
| 35 to 39 Minutes | 95 (9.6%) | 19 (2.9%) |
| 40 to 44 Minutes | 20 (2.0%) | 20 (3.0%) |
| 45 to 59 Minutes | 129 (13.0%) | 102 (15.4%) |
| 60 to 89 Minutes | 44 (4.4%) | 0 (0.0%) |
| 90 or more Minutes | 0 (0.0%) | 9 (1.4%) |
Time of Departure to Work by Sex in South Russell
The most frequent times of departure to work in South Russell are 7:30 AM to 7:59 AM (256, 25.8%) for males and 7:30 AM to 7:59 AM (148, 22.3%) for females.
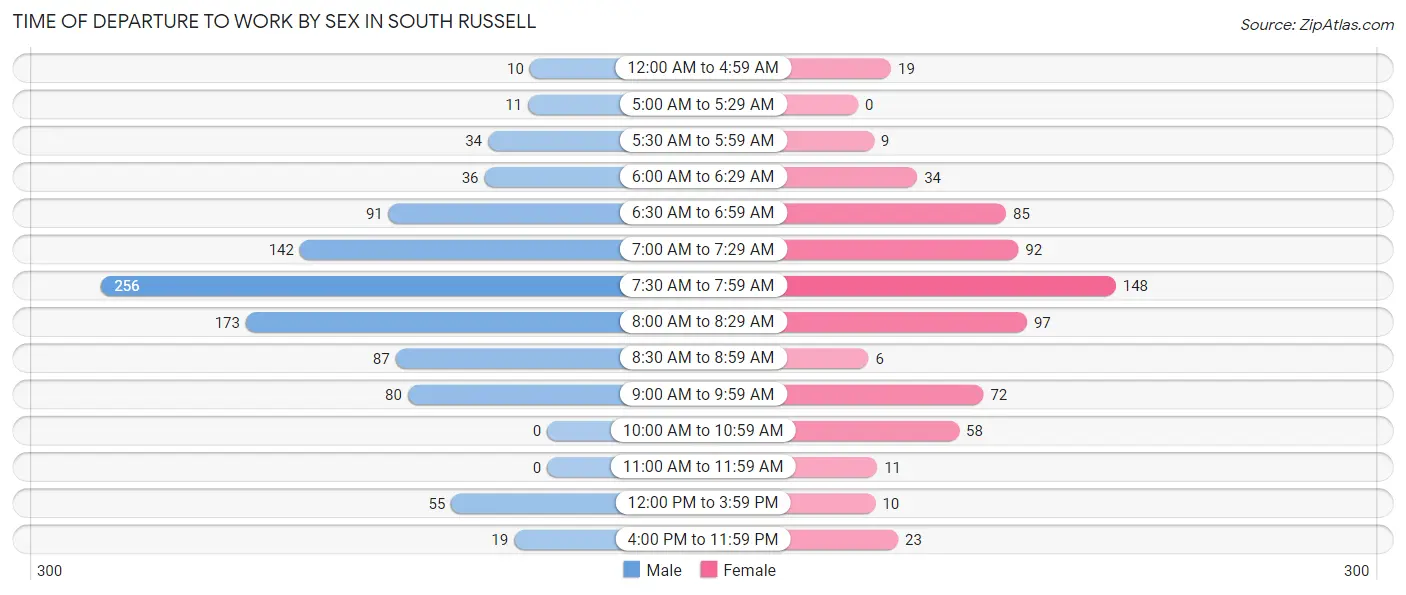
| Time of Departure | Male | Female |
| 12:00 AM to 4:59 AM | 10 (1.0%) | 19 (2.9%) |
| 5:00 AM to 5:29 AM | 11 (1.1%) | 0 (0.0%) |
| 5:30 AM to 5:59 AM | 34 (3.4%) | 9 (1.4%) |
| 6:00 AM to 6:29 AM | 36 (3.6%) | 34 (5.1%) |
| 6:30 AM to 6:59 AM | 91 (9.1%) | 85 (12.8%) |
| 7:00 AM to 7:29 AM | 142 (14.3%) | 92 (13.9%) |
| 7:30 AM to 7:59 AM | 256 (25.8%) | 148 (22.3%) |
| 8:00 AM to 8:29 AM | 173 (17.4%) | 97 (14.6%) |
| 8:30 AM to 8:59 AM | 87 (8.7%) | 6 (0.9%) |
| 9:00 AM to 9:59 AM | 80 (8.1%) | 72 (10.8%) |
| 10:00 AM to 10:59 AM | 0 (0.0%) | 58 (8.7%) |
| 11:00 AM to 11:59 AM | 0 (0.0%) | 11 (1.7%) |
| 12:00 PM to 3:59 PM | 55 (5.5%) | 10 (1.5%) |
| 4:00 PM to 11:59 PM | 19 (1.9%) | 23 (3.5%) |
| Total | 994 (100.0%) | 664 (100.0%) |
Housing Occupancy in South Russell
Occupancy by Ownership in South Russell
Of the total 1,424 dwellings in South Russell, owner-occupied units account for 1,388 (97.5%), while renter-occupied units make up 36 (2.5%).
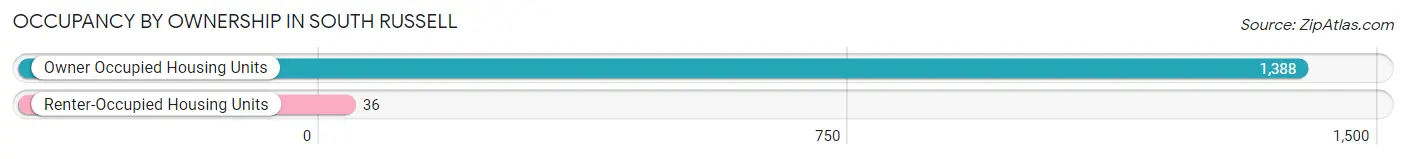
| Occupancy | # Housing Units | % Housing Units |
| Owner Occupied Housing Units | 1,388 | 97.5% |
| Renter-Occupied Housing Units | 36 | 2.5% |
| Total Occupied Housing Units | 1,424 | 100.0% |
Occupancy by Household Size in South Russell
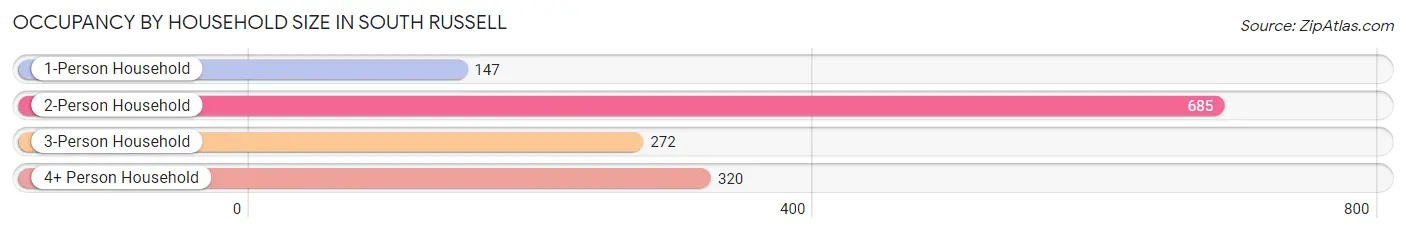
| Household Size | # Housing Units | % Housing Units |
| 1-Person Household | 147 | 10.3% |
| 2-Person Household | 685 | 48.1% |
| 3-Person Household | 272 | 19.1% |
| 4+ Person Household | 320 | 22.5% |
| Total Housing Units | 1,424 | 100.0% |
Occupancy by Ownership by Household Size in South Russell
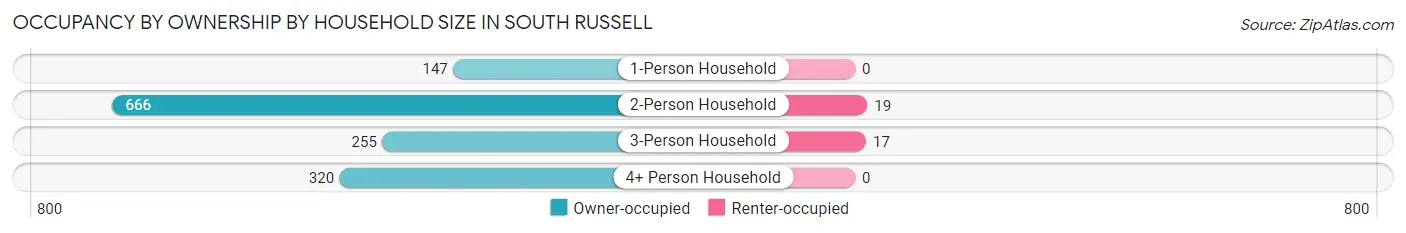
| Household Size | Owner-occupied | Renter-occupied |
| 1-Person Household | 147 (100.0%) | 0 (0.0%) |
| 2-Person Household | 666 (97.2%) | 19 (2.8%) |
| 3-Person Household | 255 (93.8%) | 17 (6.2%) |
| 4+ Person Household | 320 (100.0%) | 0 (0.0%) |
| Total Housing Units | 1,388 (97.5%) | 36 (2.5%) |
Occupancy by Educational Attainment in South Russell
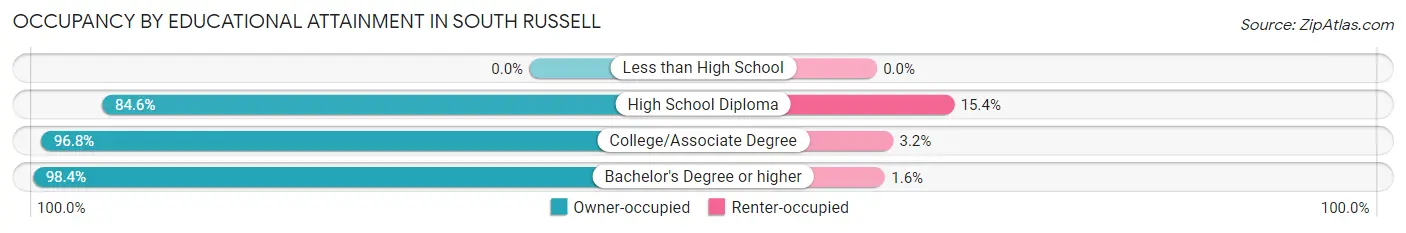
| Household Size | Owner-occupied | Renter-occupied |
| Less than High School | 0 (0.0%) | 0 (0.0%) |
| High School Diploma | 55 (84.6%) | 10 (15.4%) |
| College/Associate Degree | 239 (96.8%) | 8 (3.2%) |
| Bachelor's Degree or higher | 1,094 (98.4%) | 18 (1.6%) |
Occupancy by Age of Householder in South Russell
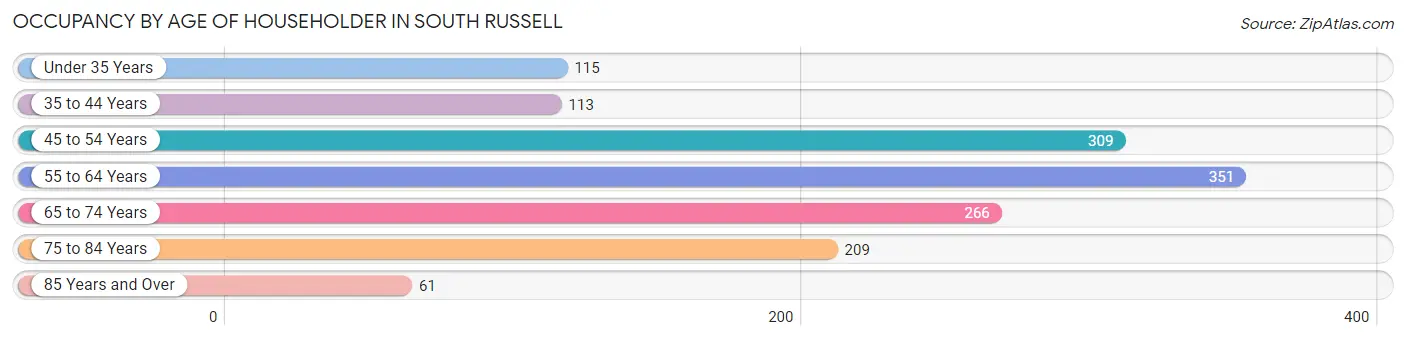
| Age Bracket | # Households | % Households |
| Under 35 Years | 115 | 8.1% |
| 35 to 44 Years | 113 | 7.9% |
| 45 to 54 Years | 309 | 21.7% |
| 55 to 64 Years | 351 | 24.6% |
| 65 to 74 Years | 266 | 18.7% |
| 75 to 84 Years | 209 | 14.7% |
| 85 Years and Over | 61 | 4.3% |
| Total | 1,424 | 100.0% |
Housing Finances in South Russell
Median Income by Occupancy in South Russell
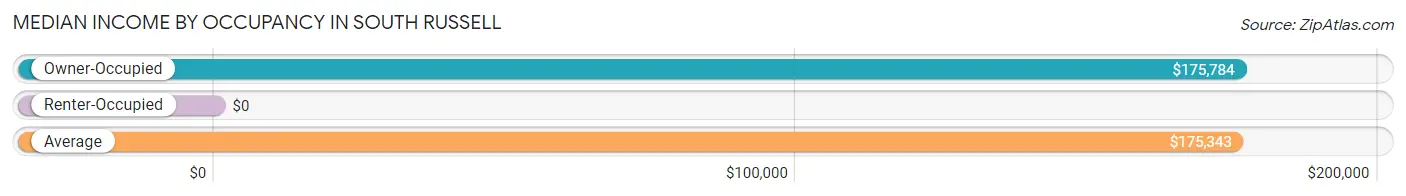
| Occupancy Type | # Households | Median Income |
| Owner-Occupied | 1,388 (97.5%) | $175,784 |
| Renter-Occupied | 36 (2.5%) | $0 |
| Average | 1,424 (100.0%) | $175,343 |
Occupancy by Householder Income Bracket in South Russell
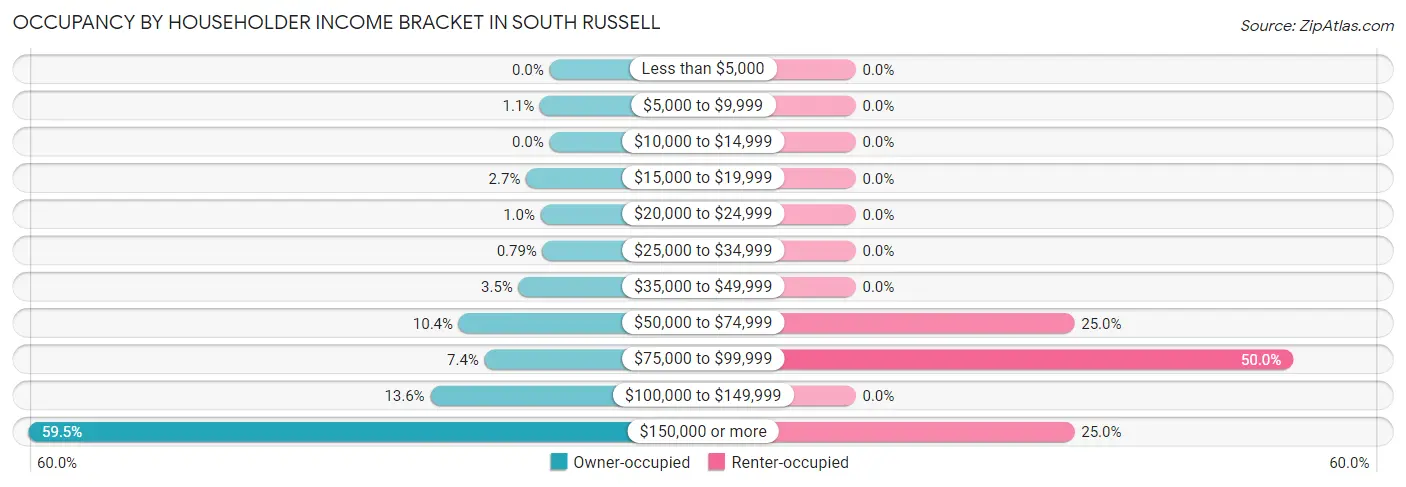
| Income Bracket | Owner-occupied | Renter-occupied |
| Less than $5,000 | 0 (0.0%) | 0 (0.0%) |
| $5,000 to $9,999 | 15 (1.1%) | 0 (0.0%) |
| $10,000 to $14,999 | 0 (0.0%) | 0 (0.0%) |
| $15,000 to $19,999 | 37 (2.7%) | 0 (0.0%) |
| $20,000 to $24,999 | 14 (1.0%) | 0 (0.0%) |
| $25,000 to $34,999 | 11 (0.8%) | 0 (0.0%) |
| $35,000 to $49,999 | 49 (3.5%) | 0 (0.0%) |
| $50,000 to $74,999 | 144 (10.4%) | 9 (25.0%) |
| $75,000 to $99,999 | 103 (7.4%) | 18 (50.0%) |
| $100,000 to $149,999 | 189 (13.6%) | 0 (0.0%) |
| $150,000 or more | 826 (59.5%) | 9 (25.0%) |
| Total | 1,388 (100.0%) | 36 (100.0%) |
Monthly Housing Cost Tiers in South Russell
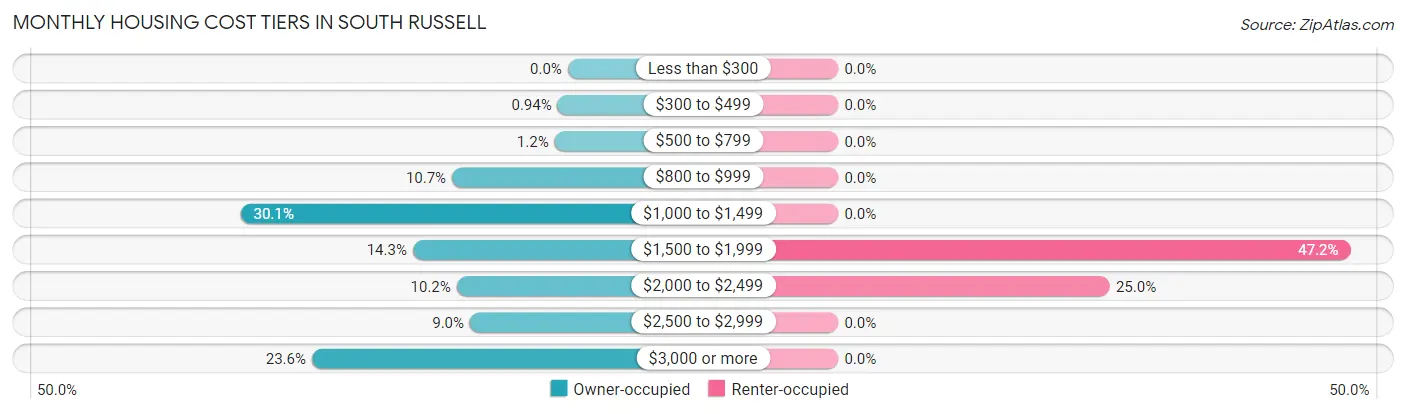
| Monthly Cost | Owner-occupied | Renter-occupied |
| Less than $300 | 0 (0.0%) | 0 (0.0%) |
| $300 to $499 | 13 (0.9%) | 0 (0.0%) |
| $500 to $799 | 17 (1.2%) | 0 (0.0%) |
| $800 to $999 | 148 (10.7%) | 0 (0.0%) |
| $1,000 to $1,499 | 418 (30.1%) | 0 (0.0%) |
| $1,500 to $1,999 | 198 (14.3%) | 17 (47.2%) |
| $2,000 to $2,499 | 142 (10.2%) | 9 (25.0%) |
| $2,500 to $2,999 | 125 (9.0%) | 0 (0.0%) |
| $3,000 or more | 327 (23.6%) | 0 (0.0%) |
| Total | 1,388 (100.0%) | 36 (100.0%) |
Physical Housing Characteristics in South Russell
Housing Structures in South Russell
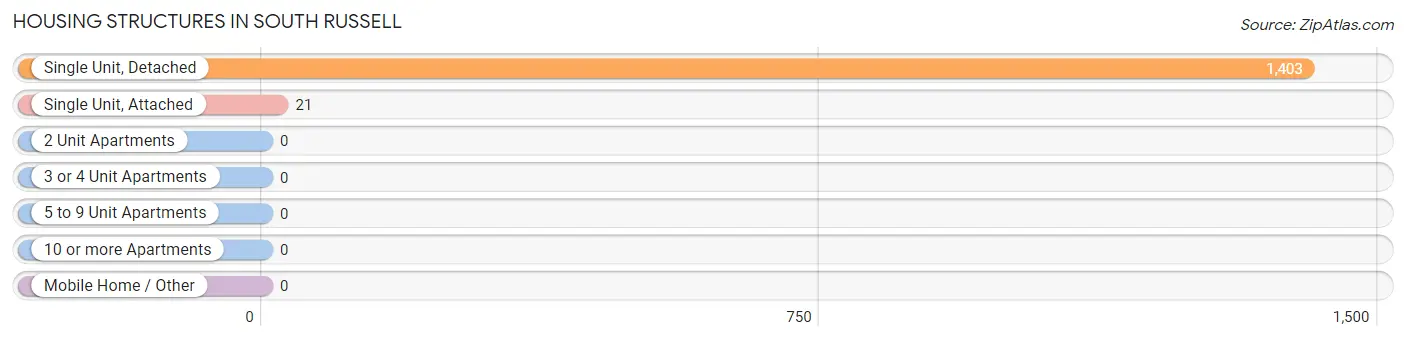
| Structure Type | # Housing Units | % Housing Units |
| Single Unit, Detached | 1,403 | 98.5% |
| Single Unit, Attached | 21 | 1.5% |
| 2 Unit Apartments | 0 | 0.0% |
| 3 or 4 Unit Apartments | 0 | 0.0% |
| 5 to 9 Unit Apartments | 0 | 0.0% |
| 10 or more Apartments | 0 | 0.0% |
| Mobile Home / Other | 0 | 0.0% |
| Total | 1,424 | 100.0% |
Housing Structures by Occupancy in South Russell
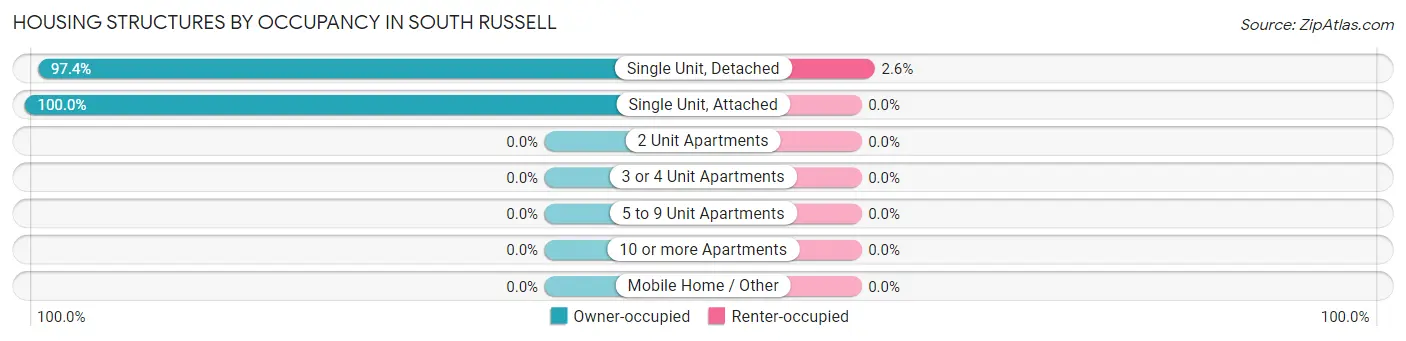
| Structure Type | Owner-occupied | Renter-occupied |
| Single Unit, Detached | 1,367 (97.4%) | 36 (2.6%) |
| Single Unit, Attached | 21 (100.0%) | 0 (0.0%) |
| 2 Unit Apartments | 0 (0.0%) | 0 (0.0%) |
| 3 or 4 Unit Apartments | 0 (0.0%) | 0 (0.0%) |
| 5 to 9 Unit Apartments | 0 (0.0%) | 0 (0.0%) |
| 10 or more Apartments | 0 (0.0%) | 0 (0.0%) |
| Mobile Home / Other | 0 (0.0%) | 0 (0.0%) |
| Total | 1,388 (97.5%) | 36 (2.5%) |
Housing Structures by Number of Rooms in South Russell
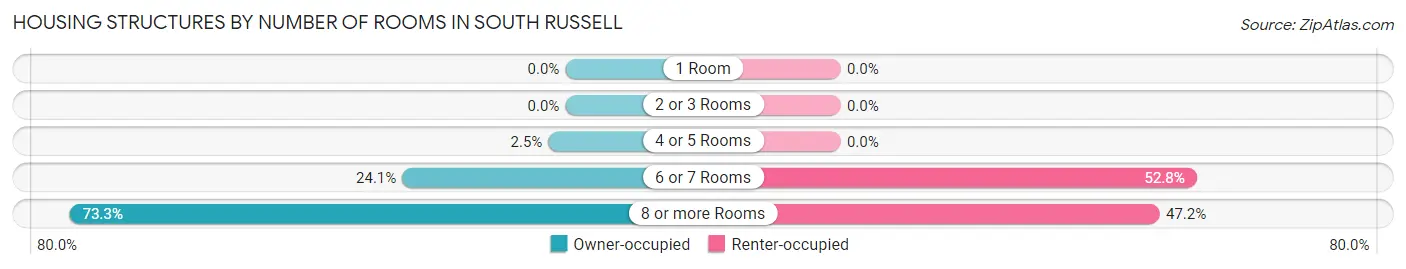
| Number of Rooms | Owner-occupied | Renter-occupied |
| 1 Room | 0 (0.0%) | 0 (0.0%) |
| 2 or 3 Rooms | 0 (0.0%) | 0 (0.0%) |
| 4 or 5 Rooms | 35 (2.5%) | 0 (0.0%) |
| 6 or 7 Rooms | 335 (24.1%) | 19 (52.8%) |
| 8 or more Rooms | 1,018 (73.3%) | 17 (47.2%) |
| Total | 1,388 (100.0%) | 36 (100.0%) |
Housing Structure by Heating Type in South Russell
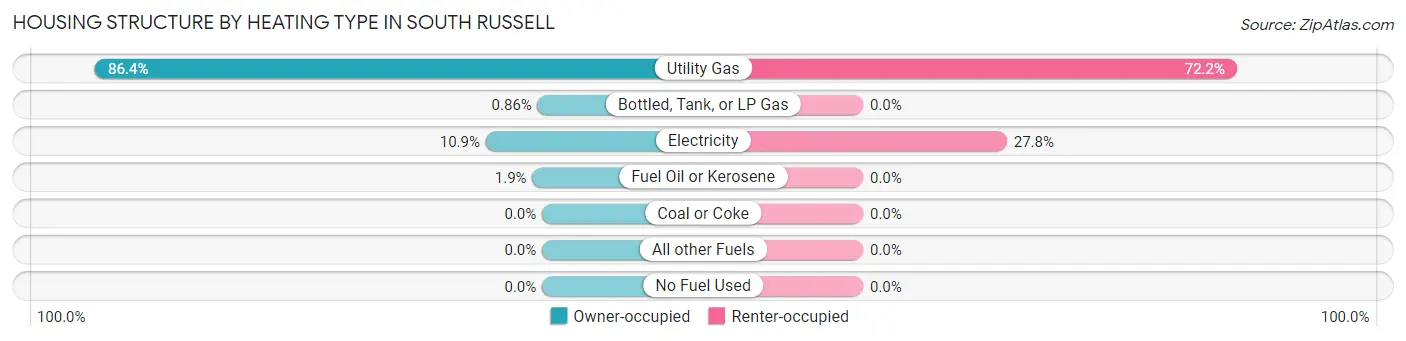
| Heating Type | Owner-occupied | Renter-occupied |
| Utility Gas | 1,199 (86.4%) | 26 (72.2%) |
| Bottled, Tank, or LP Gas | 12 (0.9%) | 0 (0.0%) |
| Electricity | 151 (10.9%) | 10 (27.8%) |
| Fuel Oil or Kerosene | 26 (1.9%) | 0 (0.0%) |
| Coal or Coke | 0 (0.0%) | 0 (0.0%) |
| All other Fuels | 0 (0.0%) | 0 (0.0%) |
| No Fuel Used | 0 (0.0%) | 0 (0.0%) |
| Total | 1,388 (100.0%) | 36 (100.0%) |
Household Vehicle Usage in South Russell
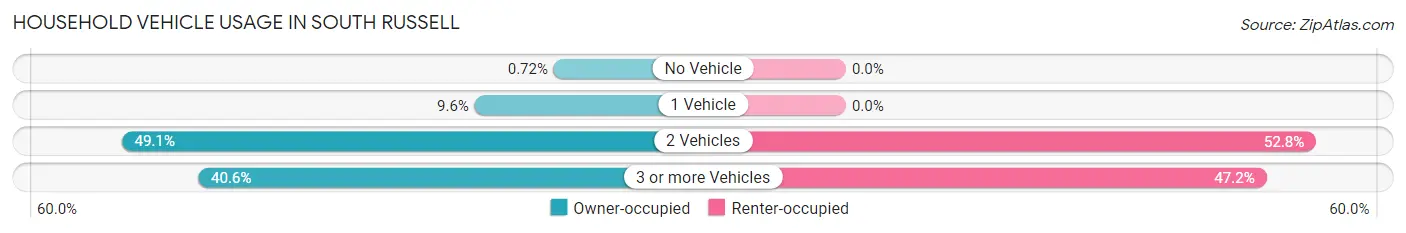
| Vehicles per Household | Owner-occupied | Renter-occupied |
| No Vehicle | 10 (0.7%) | 0 (0.0%) |
| 1 Vehicle | 133 (9.6%) | 0 (0.0%) |
| 2 Vehicles | 682 (49.1%) | 19 (52.8%) |
| 3 or more Vehicles | 563 (40.6%) | 17 (47.2%) |
| Total | 1,388 (100.0%) | 36 (100.0%) |
Real Estate & Mortgages in South Russell
Real Estate and Mortgage Overview in South Russell
| Characteristic | Without Mortgage | With Mortgage |
| Housing Units | 533 | 855 |
| Median Property Value | $390,200 | $384,600 |
| Median Household Income | $139,625 | $588 |
| Monthly Housing Costs | $1,134 | $327 |
| Real Estate Taxes | $8,005 | $10 |
Property Value by Mortgage Status in South Russell
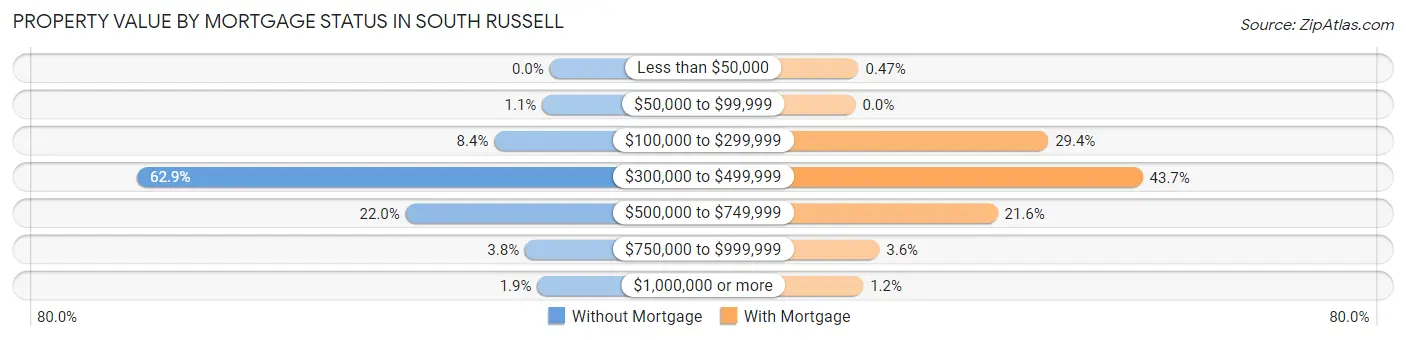
| Property Value | Without Mortgage | With Mortgage |
| Less than $50,000 | 0 (0.0%) | 4 (0.5%) |
| $50,000 to $99,999 | 6 (1.1%) | 0 (0.0%) |
| $100,000 to $299,999 | 45 (8.4%) | 251 (29.4%) |
| $300,000 to $499,999 | 335 (62.8%) | 374 (43.7%) |
| $500,000 to $749,999 | 117 (22.0%) | 185 (21.6%) |
| $750,000 to $999,999 | 20 (3.7%) | 31 (3.6%) |
| $1,000,000 or more | 10 (1.9%) | 10 (1.2%) |
| Total | 533 (100.0%) | 855 (100.0%) |
Household Income by Mortgage Status in South Russell
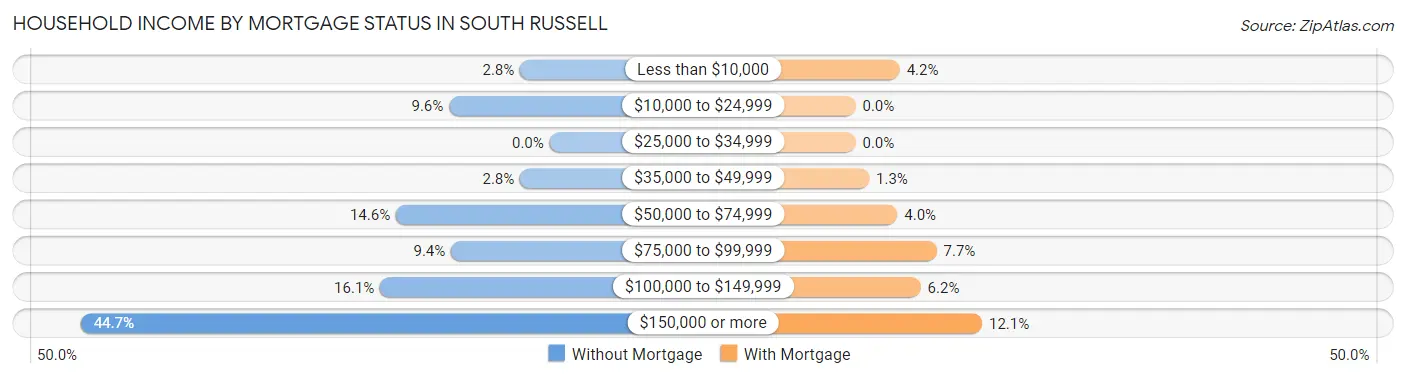
| Household Income | Without Mortgage | With Mortgage |
| Less than $10,000 | 15 (2.8%) | 36 (4.2%) |
| $10,000 to $24,999 | 51 (9.6%) | 0 (0.0%) |
| $25,000 to $34,999 | 0 (0.0%) | 0 (0.0%) |
| $35,000 to $49,999 | 15 (2.8%) | 11 (1.3%) |
| $50,000 to $74,999 | 78 (14.6%) | 34 (4.0%) |
| $75,000 to $99,999 | 50 (9.4%) | 66 (7.7%) |
| $100,000 to $149,999 | 86 (16.1%) | 53 (6.2%) |
| $150,000 or more | 238 (44.7%) | 103 (12.0%) |
| Total | 533 (100.0%) | 855 (100.0%) |
Property Value to Household Income Ratio in South Russell
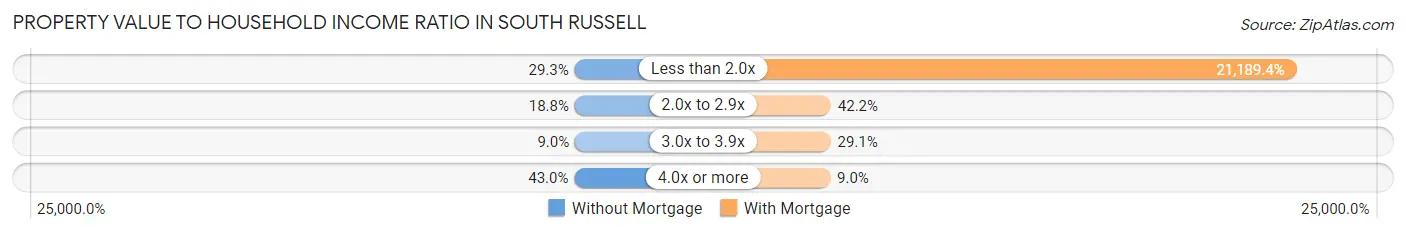
| Value-to-Income Ratio | Without Mortgage | With Mortgage |
| Less than 2.0x | 156 (29.3%) | 181,169 (21,189.4%) |
| 2.0x to 2.9x | 100 (18.8%) | 361 (42.2%) |
| 3.0x to 3.9x | 48 (9.0%) | 249 (29.1%) |
| 4.0x or more | 229 (43.0%) | 77 (9.0%) |
| Total | 533 (100.0%) | 855 (100.0%) |
Real Estate Taxes by Mortgage Status in South Russell
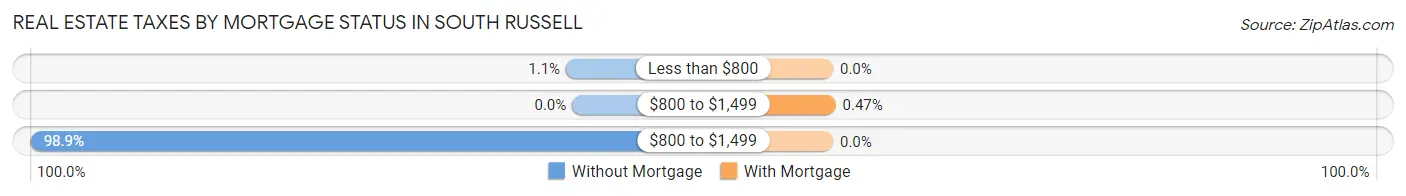
| Property Taxes | Without Mortgage | With Mortgage |
| Less than $800 | 6 (1.1%) | 0 (0.0%) |
| $800 to $1,499 | 0 (0.0%) | 4 (0.5%) |
| $800 to $1,499 | 527 (98.9%) | 0 (0.0%) |
| Total | 533 (100.0%) | 855 (100.0%) |
Health & Disability in South Russell
Health Insurance Coverage by Age in South Russell
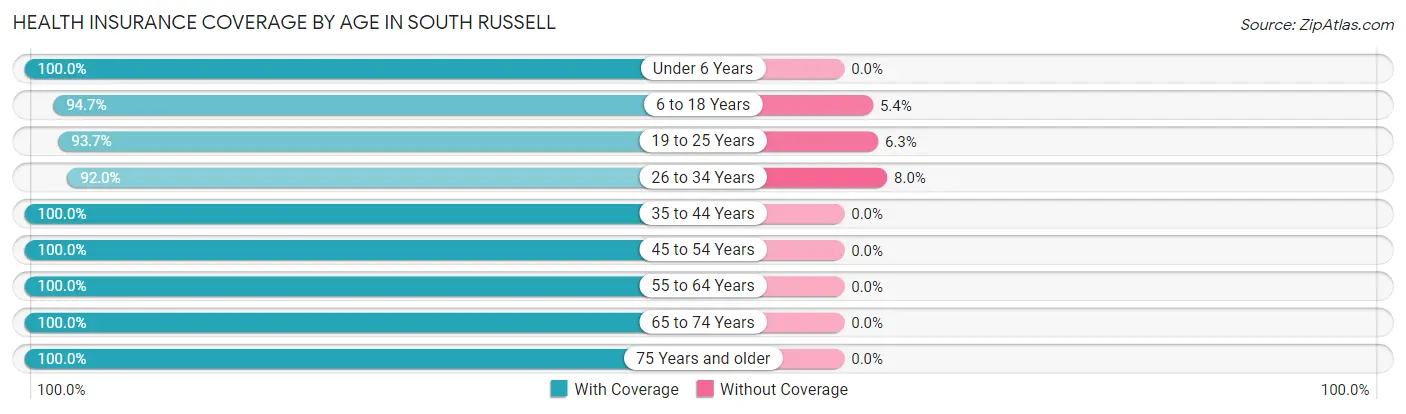
| Age Bracket | With Coverage | Without Coverage |
| Under 6 Years | 194 (100.0%) | 0 (0.0%) |
| 6 to 18 Years | 690 (94.7%) | 39 (5.3%) |
| 19 to 25 Years | 298 (93.7%) | 20 (6.3%) |
| 26 to 34 Years | 300 (92.0%) | 26 (8.0%) |
| 35 to 44 Years | 292 (100.0%) | 0 (0.0%) |
| 45 to 54 Years | 516 (100.0%) | 0 (0.0%) |
| 55 to 64 Years | 714 (100.0%) | 0 (0.0%) |
| 65 to 74 Years | 431 (100.0%) | 0 (0.0%) |
| 75 Years and older | 446 (100.0%) | 0 (0.0%) |
| Total | 3,881 (97.9%) | 85 (2.1%) |
Health Insurance Coverage by Citizenship Status in South Russell
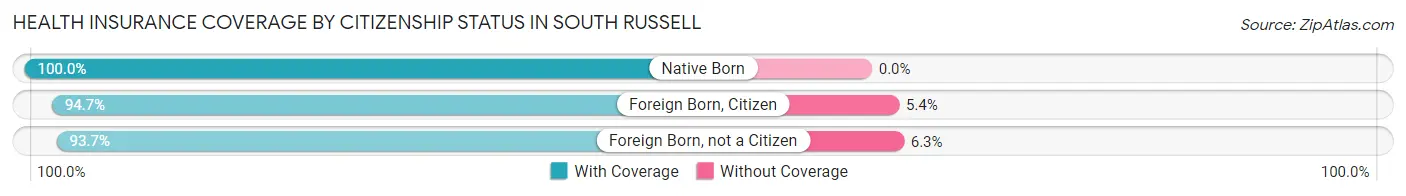
| Citizenship Status | With Coverage | Without Coverage |
| Native Born | 194 (100.0%) | 0 (0.0%) |
| Foreign Born, Citizen | 690 (94.7%) | 39 (5.3%) |
| Foreign Born, not a Citizen | 298 (93.7%) | 20 (6.3%) |
Health Insurance Coverage by Household Income in South Russell
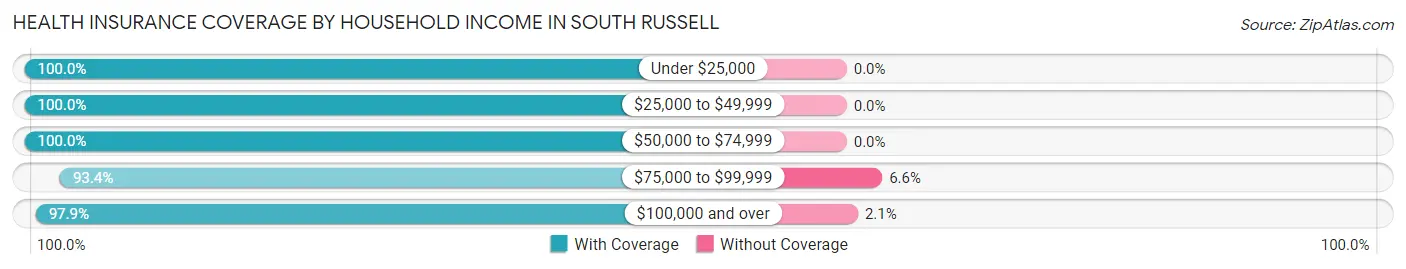
| Household Income | With Coverage | Without Coverage |
| Under $25,000 | 136 (100.0%) | 0 (0.0%) |
| $25,000 to $49,999 | 119 (100.0%) | 0 (0.0%) |
| $50,000 to $74,999 | 275 (100.0%) | 0 (0.0%) |
| $75,000 to $99,999 | 281 (93.4%) | 20 (6.6%) |
| $100,000 and over | 3,047 (97.9%) | 65 (2.1%) |
Public vs Private Health Insurance Coverage by Age in South Russell
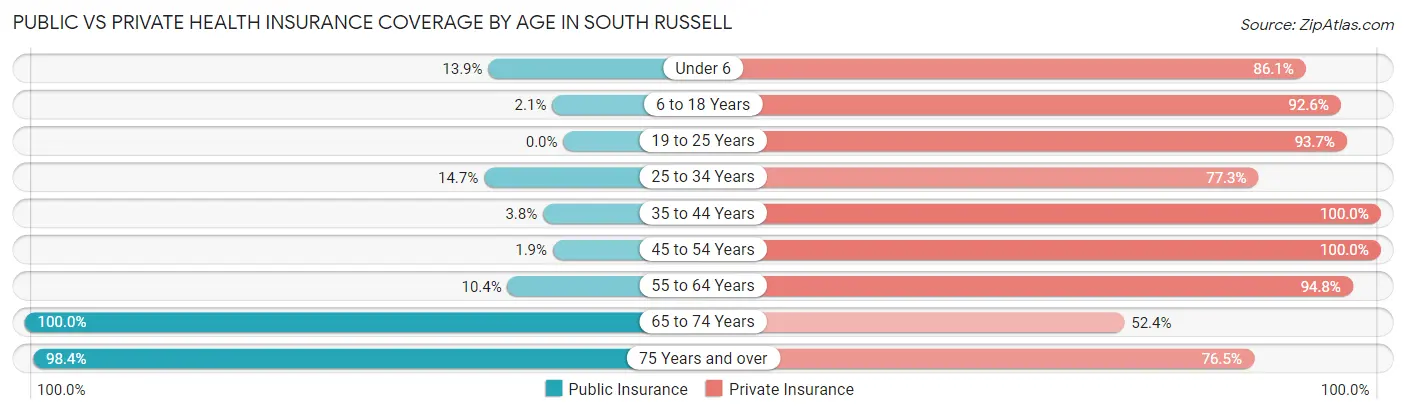
| Age Bracket | Public Insurance | Private Insurance |
| Under 6 | 27 (13.9%) | 167 (86.1%) |
| 6 to 18 Years | 15 (2.1%) | 675 (92.6%) |
| 19 to 25 Years | 0 (0.0%) | 298 (93.7%) |
| 25 to 34 Years | 48 (14.7%) | 252 (77.3%) |
| 35 to 44 Years | 11 (3.8%) | 292 (100.0%) |
| 45 to 54 Years | 10 (1.9%) | 516 (100.0%) |
| 55 to 64 Years | 74 (10.4%) | 677 (94.8%) |
| 65 to 74 Years | 431 (100.0%) | 226 (52.4%) |
| 75 Years and over | 439 (98.4%) | 341 (76.5%) |
| Total | 1,055 (26.6%) | 3,444 (86.8%) |
Disability Status by Sex by Age in South Russell
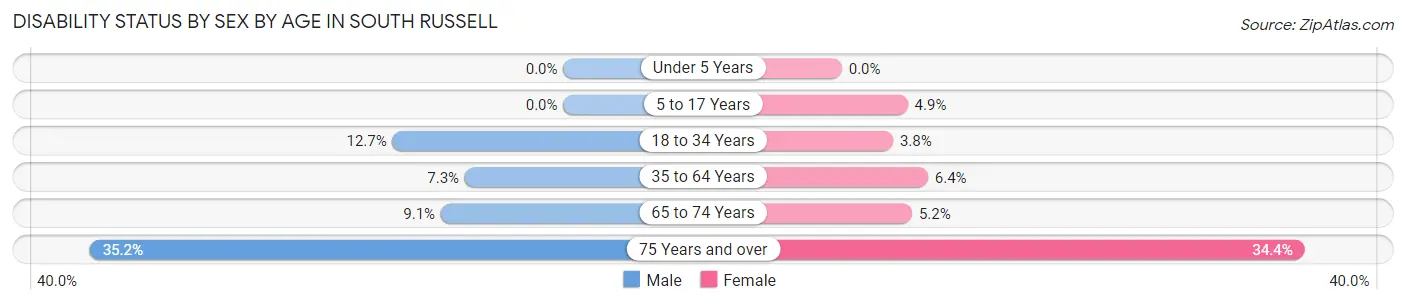
| Age Bracket | Male | Female |
| Under 5 Years | 0 (0.0%) | 0 (0.0%) |
| 5 to 17 Years | 0 (0.0%) | 15 (4.9%) |
| 18 to 34 Years | 44 (12.7%) | 13 (3.8%) |
| 35 to 64 Years | 54 (7.3%) | 50 (6.4%) |
| 65 to 74 Years | 20 (9.1%) | 11 (5.2%) |
| 75 Years and over | 77 (35.2%) | 78 (34.4%) |
Disability Class by Sex by Age in South Russell
Disability Class: Hearing Difficulty
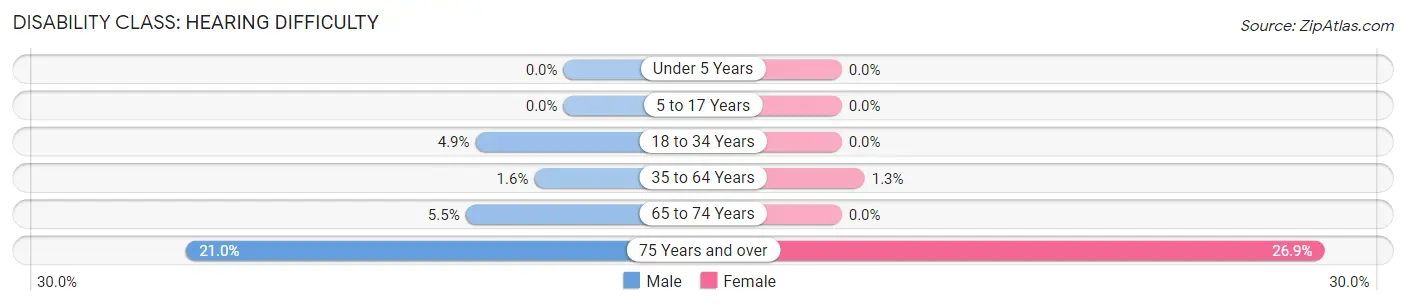
| Age Bracket | Male | Female |
| Under 5 Years | 0 (0.0%) | 0 (0.0%) |
| 5 to 17 Years | 0 (0.0%) | 0 (0.0%) |
| 18 to 34 Years | 17 (4.9%) | 0 (0.0%) |
| 35 to 64 Years | 12 (1.6%) | 10 (1.3%) |
| 65 to 74 Years | 12 (5.4%) | 0 (0.0%) |
| 75 Years and over | 46 (21.0%) | 61 (26.9%) |
Disability Class: Vision Difficulty
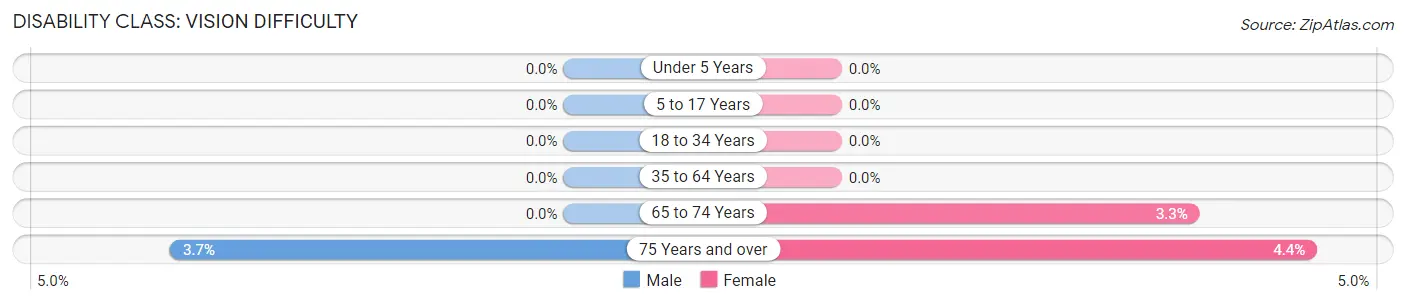
| Age Bracket | Male | Female |
| Under 5 Years | 0 (0.0%) | 0 (0.0%) |
| 5 to 17 Years | 0 (0.0%) | 0 (0.0%) |
| 18 to 34 Years | 0 (0.0%) | 0 (0.0%) |
| 35 to 64 Years | 0 (0.0%) | 0 (0.0%) |
| 65 to 74 Years | 0 (0.0%) | 7 (3.3%) |
| 75 Years and over | 8 (3.6%) | 10 (4.4%) |
Disability Class: Cognitive Difficulty
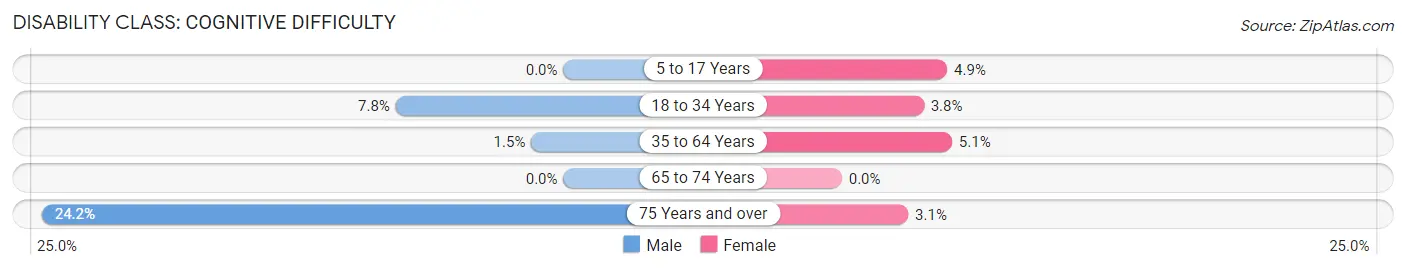
| Age Bracket | Male | Female |
| 5 to 17 Years | 0 (0.0%) | 15 (4.9%) |
| 18 to 34 Years | 27 (7.8%) | 13 (3.8%) |
| 35 to 64 Years | 11 (1.5%) | 40 (5.1%) |
| 65 to 74 Years | 0 (0.0%) | 0 (0.0%) |
| 75 Years and over | 53 (24.2%) | 7 (3.1%) |
Disability Class: Ambulatory Difficulty
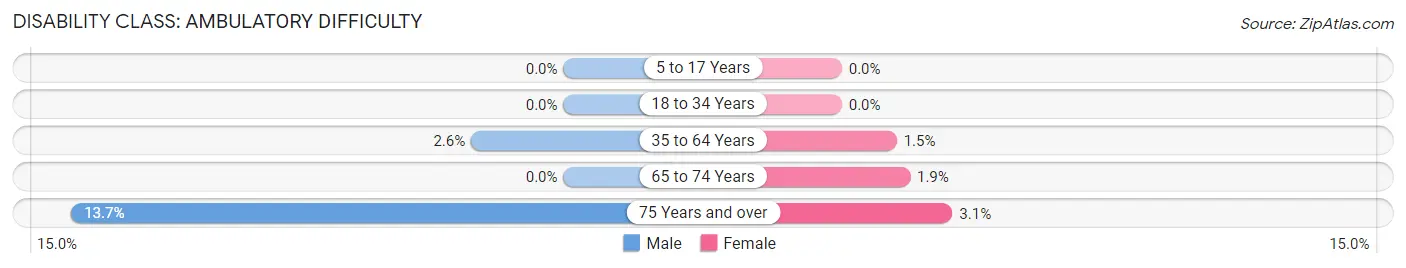
| Age Bracket | Male | Female |
| 5 to 17 Years | 0 (0.0%) | 0 (0.0%) |
| 18 to 34 Years | 0 (0.0%) | 0 (0.0%) |
| 35 to 64 Years | 19 (2.6%) | 12 (1.5%) |
| 65 to 74 Years | 0 (0.0%) | 4 (1.9%) |
| 75 Years and over | 30 (13.7%) | 7 (3.1%) |
Disability Class: Self-Care Difficulty
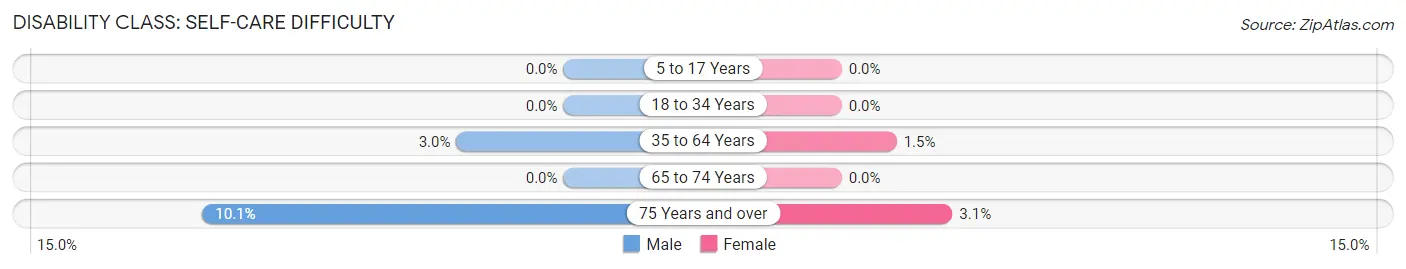
| Age Bracket | Male | Female |
| 5 to 17 Years | 0 (0.0%) | 0 (0.0%) |
| 18 to 34 Years | 0 (0.0%) | 0 (0.0%) |
| 35 to 64 Years | 22 (3.0%) | 12 (1.5%) |
| 65 to 74 Years | 0 (0.0%) | 0 (0.0%) |
| 75 Years and over | 22 (10.1%) | 7 (3.1%) |
Technology Access in South Russell
Computing Device Access in South Russell
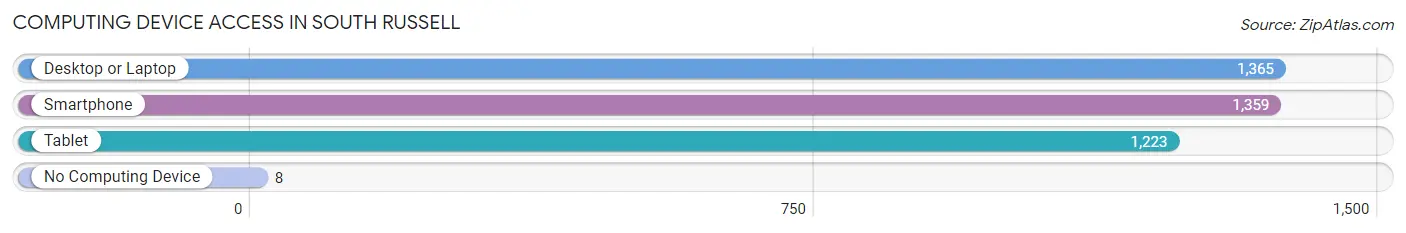
| Device Type | # Households | % Households |
| Desktop or Laptop | 1,365 | 95.9% |
| Smartphone | 1,359 | 95.4% |
| Tablet | 1,223 | 85.9% |
| No Computing Device | 8 | 0.6% |
| Total | 1,424 | 100.0% |
Internet Access in South Russell
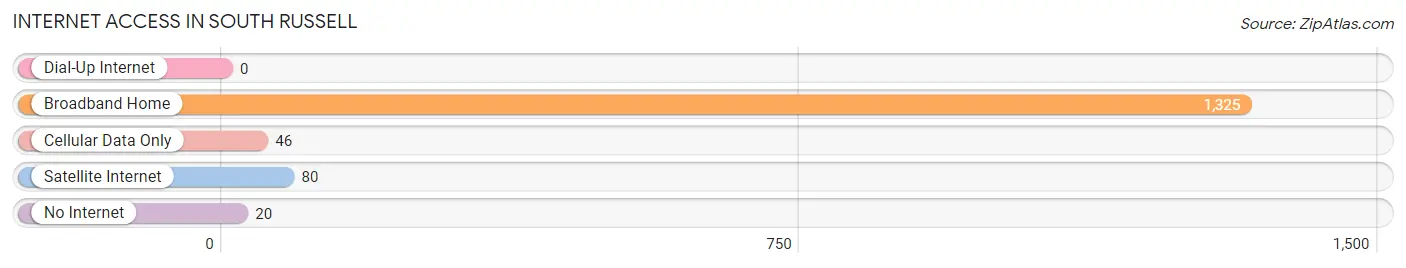
| Internet Type | # Households | % Households |
| Dial-Up Internet | 0 | 0.0% |
| Broadband Home | 1,325 | 93.0% |
| Cellular Data Only | 46 | 3.2% |
| Satellite Internet | 80 | 5.6% |
| No Internet | 20 | 1.4% |
| Total | 1,424 | 100.0% |
South Russell Summary
History
South Russell is a village located in Geauga County, Ohio. It is part of the Greater Cleveland area and is situated about 25 miles east of downtown Cleveland. The village was founded in 1818 by a group of settlers from Connecticut. The settlers were attracted to the area due to its fertile soil and abundant natural resources. The village was originally known as Russellville, but the name was changed to South Russell in 1837.
The village was an important stop on the Underground Railroad, with many of the settlers being abolitionists. The village was also home to a number of prominent figures in the abolitionist movement, including John Brown and Harriet Tubman.
The village was also home to a number of industries, including a sawmill, a gristmill, a tannery, and a woolen mill. These industries helped to fuel the local economy and provided employment for many of the residents.
The village was also home to a number of churches, including the First Congregational Church, which was founded in 1819. The church was an important part of the community and served as a gathering place for the residents.
Geography
South Russell is located in Geauga County, Ohio. It is situated about 25 miles east of downtown Cleveland. The village is located in the Chagrin River Valley, which is a tributary of the Cuyahoga River. The village is surrounded by rolling hills and is home to a number of parks and recreational areas.
The village is located in a humid continental climate zone, with hot summers and cold winters. The average temperature in the summer is around 75 degrees Fahrenheit, while the average temperature in the winter is around 30 degrees Fahrenheit.
Economy
The economy of South Russell is largely based on agriculture and manufacturing. The village is home to a number of farms, which produce a variety of crops, including corn, soybeans, and wheat. The village is also home to a number of manufacturing companies, which produce a variety of products, including furniture, clothing, and automotive parts.
The village is also home to a number of small businesses, including restaurants, shops, and other services. The village is also home to a number of professional services, such as lawyers, accountants, and doctors.
Demographics
As of the 2010 census, the population of South Russell was 2,945. The population is largely white, with about 95% of the population being Caucasian. The median household income is $68,750, and the median home value is $220,000. The village is home to a number of schools, including South Russell Elementary School and Chagrin Falls High School.
Conclusion
South Russell is a small village located in Geauga County, Ohio. It is part of the Greater Cleveland area and is situated about 25 miles east of downtown Cleveland. The village was founded in 1818 by a group of settlers from Connecticut and was an important stop on the Underground Railroad. The village is home to a number of industries, including a sawmill, a gristmill, a tannery, and a woolen mill. The village is also home to a number of churches, including the First Congregational Church. The economy of South Russell is largely based on agriculture and manufacturing, and the village is home to a number of small businesses. As of the 2010 census, the population of South Russell was 2,945. The population is largely white, with about 95% of the population being Caucasian.
Common Questions
What is Per Capita Income in South Russell?
Per Capita income in South Russell is $80,439.
What is the Median Family Income in South Russell?
Median Family Income in South Russell is $180,403.
What is the Median Household income in South Russell?
Median Household Income in South Russell is $175,343.
What is Income or Wage Gap in South Russell?
Income or Wage Gap in South Russell is 19.7%.
Women in South Russell earn 80.3 cents for every dollar earned by a man.
What is Inequality or Gini Index in South Russell?
Inequality or Gini Index in South Russell is 0.47.
What is the Total Population of South Russell?
Total Population of South Russell is 3,966.
What is the Total Male Population of South Russell?
Total Male Population of South Russell is 2,039.
What is the Total Female Population of South Russell?
Total Female Population of South Russell is 1,927.
What is the Ratio of Males per 100 Females in South Russell?
There are 105.81 Males per 100 Females in South Russell.
What is the Ratio of Females per 100 Males in South Russell?
There are 94.51 Females per 100 Males in South Russell.
What is the Median Population Age in South Russell?
Median Population Age in South Russell is 46.7 Years.
What is the Average Family Size in South Russell
Average Family Size in South Russell is 3.0 People.
What is the Average Household Size in South Russell
Average Household Size in South Russell is 2.8 People.
How Large is the Labor Force in South Russell?
There are 2,075 People in the Labor Forcein in South Russell.
What is the Percentage of People in the Labor Force in South Russell?
63.2% of People are in the Labor Force in South Russell.
What is the Unemployment Rate in South Russell?
Unemployment Rate in South Russell is 2.7%.