Worthington, OH Map & Demographics
Worthington Map
Worthington Overview
$65,990
PER CAPITA INCOME
$147,880
AVG FAMILY INCOME
$119,408
AVG HOUSEHOLD INCOME
24.9%
WAGE / INCOME GAP [ % ]
75.1¢/ $1
WAGE / INCOME GAP [ $ ]
0.45
INEQUALITY / GINI INDEX
14,997
TOTAL POPULATION
7,001
MALE POPULATION
7,996
FEMALE POPULATION
87.56
MALES / 100 FEMALES
114.21
FEMALES / 100 MALES
40.9
MEDIAN AGE
3.0
AVG FAMILY SIZE
2.5
AVG HOUSEHOLD SIZE
7,643
LABOR FORCE [ PEOPLE ]
66.4%
PERCENT IN LABOR FORCE
3.6%
UNEMPLOYMENT RATE
Income in Worthington
Income Overview in Worthington
Per Capita Income in Worthington is $65,990, while median incomes of families and households are $147,880 and $119,408 respectively.
| Characteristic | Number | Measure |
| Per Capita Income | 14,997 | $65,990 |
| Median Family Income | 4,163 | $147,880 |
| Mean Family Income | 4,163 | $196,547 |
| Median Household Income | 6,034 | $119,408 |
| Mean Household Income | 6,034 | $162,209 |
| Income Deficit | 4,163 | $0 |
| Wage / Income Gap (%) | 14,997 | 24.88% |
| Wage / Income Gap ($) | 14,997 | 75.12¢ per $1 |
| Gini / Inequality Index | 14,997 | 0.45 |
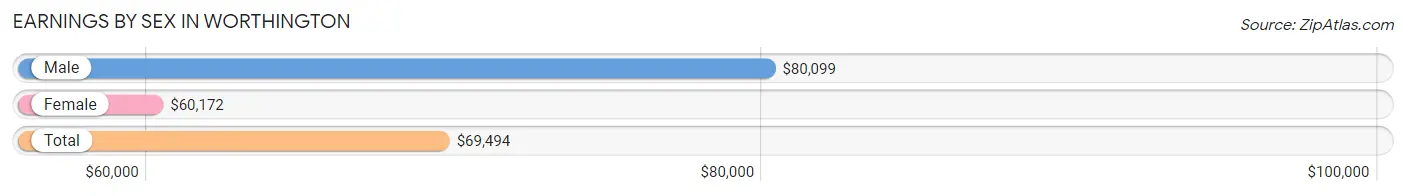
Earnings by Sex in Worthington
Average Earnings in Worthington are $69,494, $80,099 for men and $60,172 for women, a difference of 24.9%.
| Sex | Number | Average Earnings |
| Male | 4,165 (52.1%) | $80,099 |
| Female | 3,827 (47.9%) | $60,172 |
| Total | 7,992 (100.0%) | $69,494 |
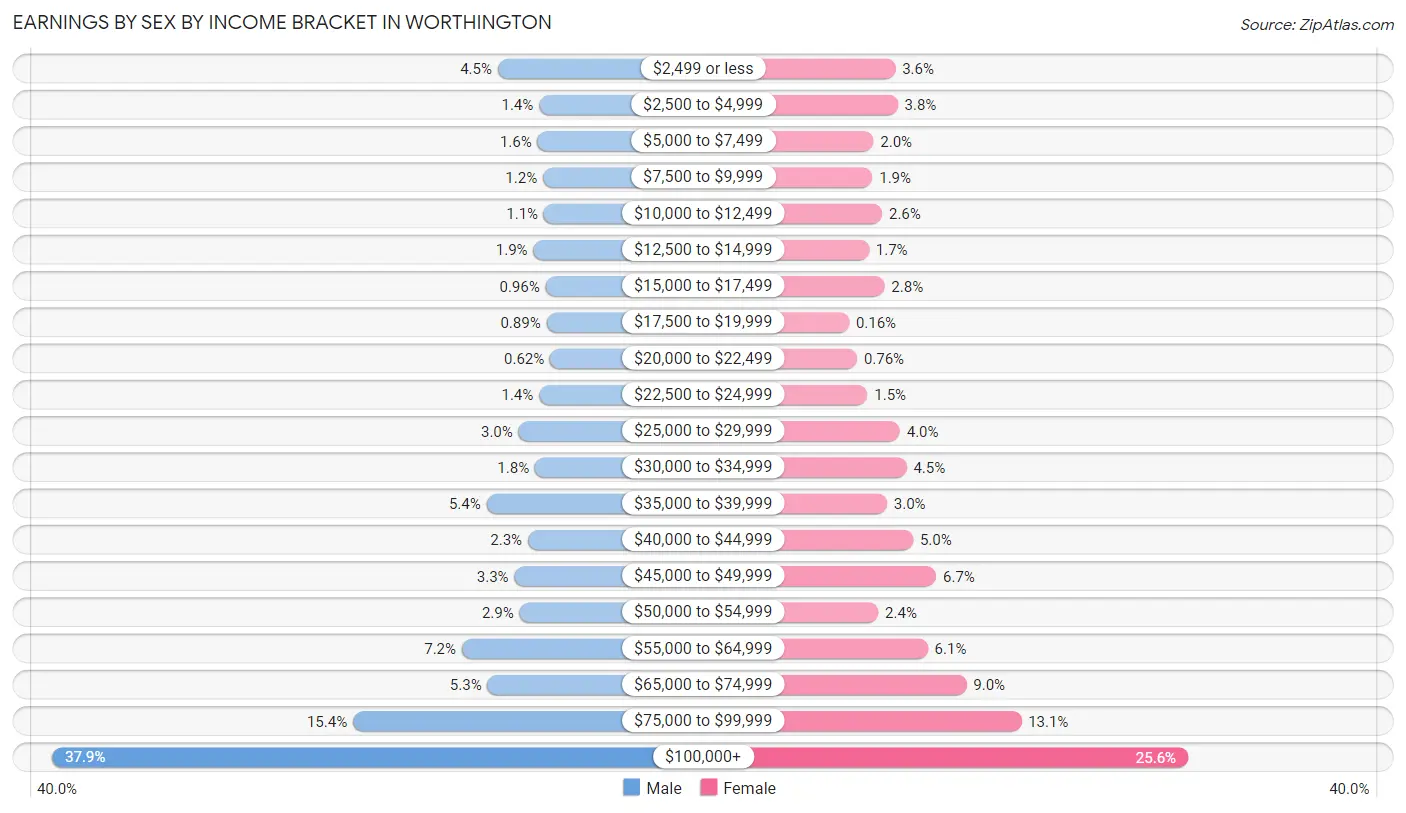
Earnings by Sex by Income Bracket in Worthington
The most common earnings brackets in Worthington are $100,000+ for men (1,580 | 37.9%) and $100,000+ for women (978 | 25.6%).
| Income | Male | Female |
| $2,499 or less | 189 (4.5%) | 139 (3.6%) |
| $2,500 to $4,999 | 60 (1.4%) | 146 (3.8%) |
| $5,000 to $7,499 | 65 (1.6%) | 76 (2.0%) |
| $7,500 to $9,999 | 48 (1.1%) | 73 (1.9%) |
| $10,000 to $12,499 | 45 (1.1%) | 101 (2.6%) |
| $12,500 to $14,999 | 78 (1.9%) | 63 (1.7%) |
| $15,000 to $17,499 | 40 (1.0%) | 108 (2.8%) |
| $17,500 to $19,999 | 37 (0.9%) | 6 (0.2%) |
| $20,000 to $22,499 | 26 (0.6%) | 29 (0.8%) |
| $22,500 to $24,999 | 60 (1.4%) | 59 (1.5%) |
| $25,000 to $29,999 | 124 (3.0%) | 152 (4.0%) |
| $30,000 to $34,999 | 73 (1.8%) | 171 (4.5%) |
| $35,000 to $39,999 | 224 (5.4%) | 115 (3.0%) |
| $40,000 to $44,999 | 95 (2.3%) | 190 (5.0%) |
| $45,000 to $49,999 | 137 (3.3%) | 256 (6.7%) |
| $50,000 to $54,999 | 121 (2.9%) | 90 (2.4%) |
| $55,000 to $64,999 | 301 (7.2%) | 232 (6.1%) |
| $65,000 to $74,999 | 221 (5.3%) | 343 (9.0%) |
| $75,000 to $99,999 | 641 (15.4%) | 500 (13.1%) |
| $100,000+ | 1,580 (37.9%) | 978 (25.6%) |
| Total | 4,165 (100.0%) | 3,827 (100.0%) |
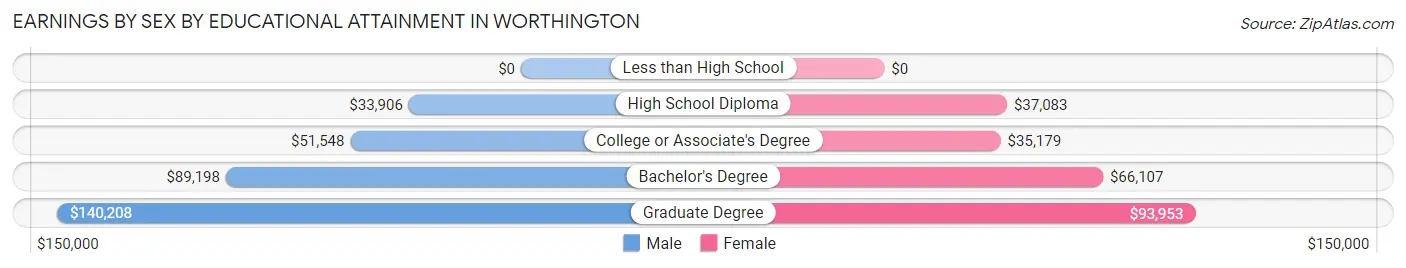
Earnings by Sex by Educational Attainment in Worthington
Average earnings in Worthington are $86,996 for men and $68,047 for women, a difference of 21.8%. Men with an educational attainment of graduate degree enjoy the highest average annual earnings of $140,208, while those with high school diploma education earn the least with $33,906. Women with an educational attainment of graduate degree earn the most with the average annual earnings of $93,953, while those with college or associate's degree education have the smallest earnings of $35,179.
| Educational Attainment | Male Income | Female Income |
| Less than High School | - | - |
| High School Diploma | $33,906 | $37,083 |
| College or Associate's Degree | $51,548 | $35,179 |
| Bachelor's Degree | $89,198 | $66,107 |
| Graduate Degree | $140,208 | $93,953 |
| Total | $86,996 | $68,047 |
Family Income in Worthington
Family Income Brackets in Worthington
According to the Worthington family income data, there are 1,403 families falling into the $200,000+ income range, which is the most common income bracket and makes up 33.7% of all families. Conversely, the less than $10,000 income bracket is the least frequent group with only 8 families (0.2%) belonging to this category.
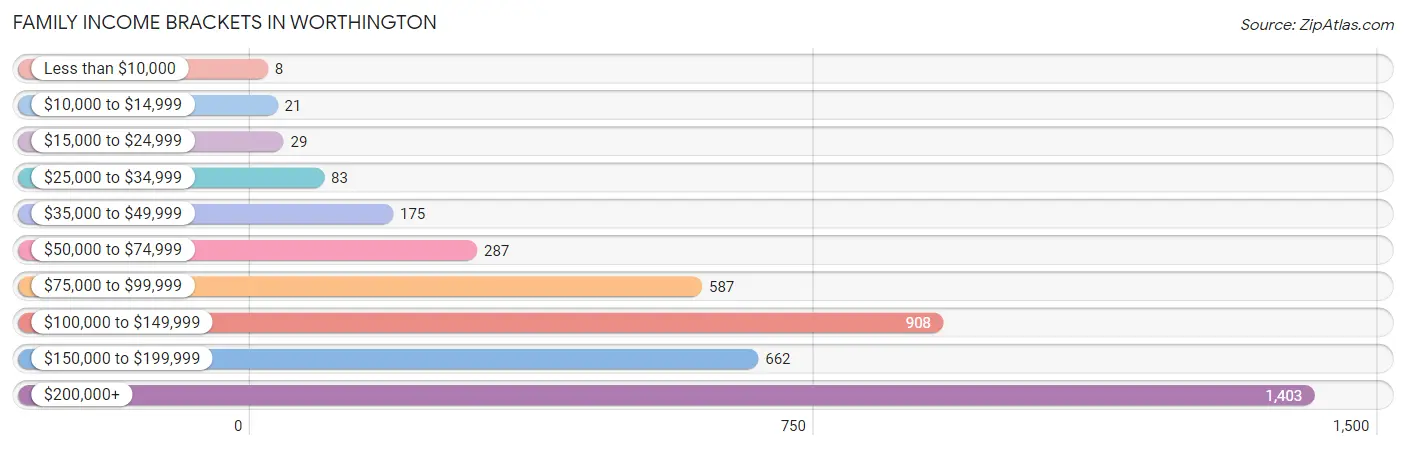
| Income Bracket | # Families | % Families |
| Less than $10,000 | 8 | 0.2% |
| $10,000 to $14,999 | 21 | 0.5% |
| $15,000 to $24,999 | 29 | 0.7% |
| $25,000 to $34,999 | 83 | 2.0% |
| $35,000 to $49,999 | 175 | 4.2% |
| $50,000 to $74,999 | 287 | 6.9% |
| $75,000 to $99,999 | 587 | 14.1% |
| $100,000 to $149,999 | 908 | 21.8% |
| $150,000 to $199,999 | 662 | 15.9% |
| $200,000+ | 1,403 | 33.7% |
Family Income by Famaliy Size in Worthington
5-person families (351 | 8.4%) account for the highest median family income in Worthington with $226,307 per family, while 2-person families (1,872 | 45.0%) have the highest median income of $65,208 per family member.
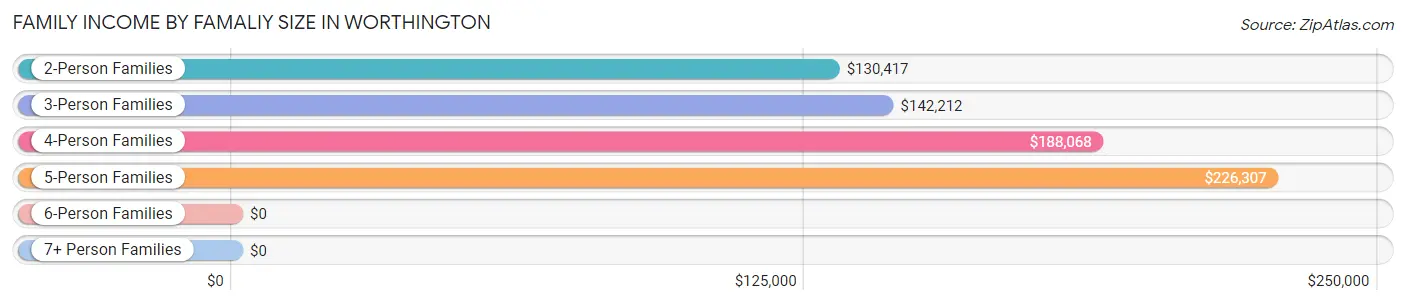
| Income Bracket | # Families | Median Income |
| 2-Person Families | 1,872 (45.0%) | $130,417 |
| 3-Person Families | 946 (22.7%) | $142,212 |
| 4-Person Families | 961 (23.1%) | $188,068 |
| 5-Person Families | 351 (8.4%) | $226,307 |
| 6-Person Families | 33 (0.8%) | $0 |
| 7+ Person Families | 0 (0.0%) | $0 |
| Total | 4,163 (100.0%) | $147,880 |
Family Income by Number of Earners in Worthington
The median family income in Worthington is $147,880, with families comprising 2 earners (2,230) having the highest median family income of $185,500, while families with no earners (508) have the lowest median family income of $98,056, accounting for 53.6% and 12.2% of families, respectively.
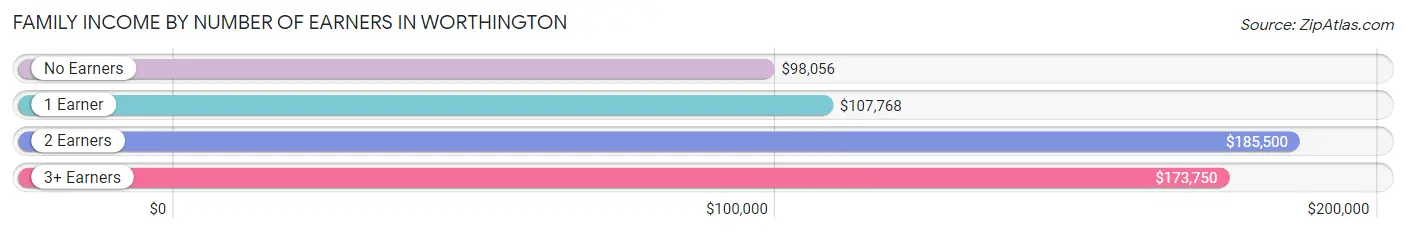
| Number of Earners | # Families | Median Income |
| No Earners | 508 (12.2%) | $98,056 |
| 1 Earner | 1,065 (25.6%) | $107,768 |
| 2 Earners | 2,230 (53.6%) | $185,500 |
| 3+ Earners | 360 (8.6%) | $173,750 |
| Total | 4,163 (100.0%) | $147,880 |
Household Income in Worthington
Household Income Brackets in Worthington
With 1,521 households falling in the category, the $200,000+ income range is the most frequent in Worthington, accounting for 25.2% of all households. In contrast, only 48 households (0.8%) fall into the $10,000 to $14,999 income bracket, making it the least populous group.
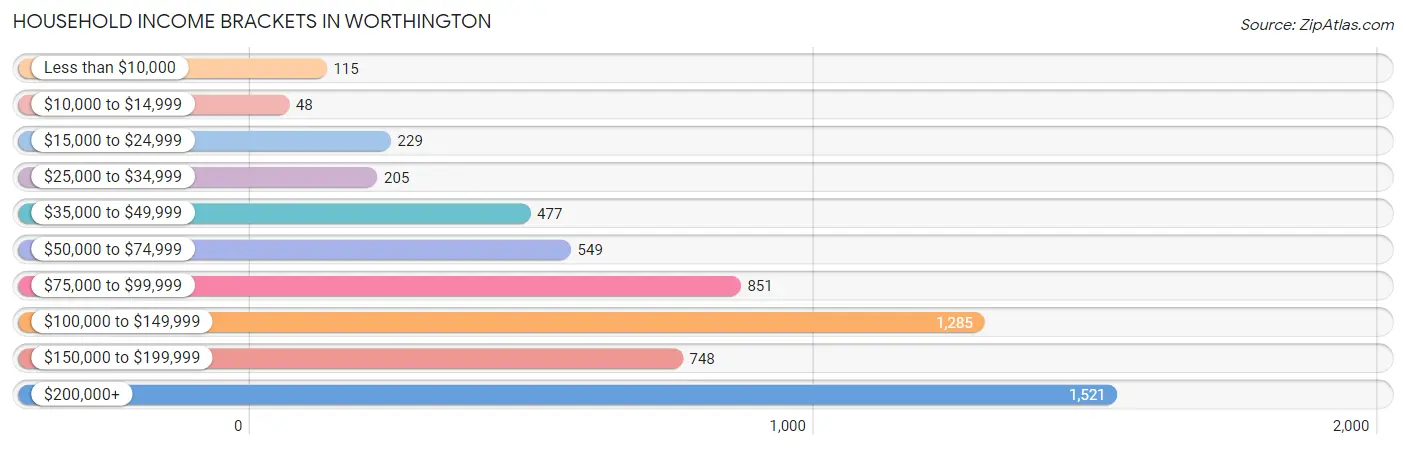
| Income Bracket | # Households | % Households |
| Less than $10,000 | 115 | 1.9% |
| $10,000 to $14,999 | 48 | 0.8% |
| $15,000 to $24,999 | 229 | 3.8% |
| $25,000 to $34,999 | 205 | 3.4% |
| $35,000 to $49,999 | 477 | 7.9% |
| $50,000 to $74,999 | 549 | 9.1% |
| $75,000 to $99,999 | 851 | 14.1% |
| $100,000 to $149,999 | 1,285 | 21.3% |
| $150,000 to $199,999 | 748 | 12.4% |
| $200,000+ | 1,521 | 25.2% |
Household Income by Householder Age in Worthington
The median household income in Worthington is $119,408, with the highest median household income of $159,188 found in the 25 to 44 years age bracket for the primary householder. A total of 1,922 households (31.9%) fall into this category. Meanwhile, the 15 to 24 years age bracket for the primary householder has the lowest median household income of $0, with 75 households (1.2%) in this group.
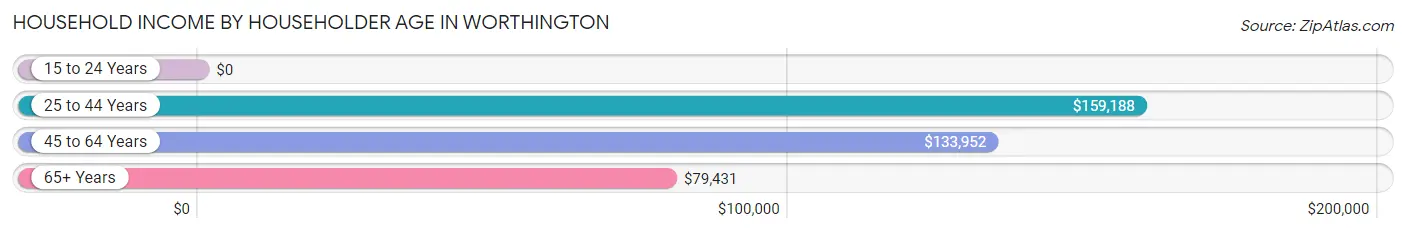
| Income Bracket | # Households | Median Income |
| 15 to 24 Years | 75 (1.2%) | $0 |
| 25 to 44 Years | 1,922 (31.9%) | $159,188 |
| 45 to 64 Years | 2,022 (33.5%) | $133,952 |
| 65+ Years | 2,015 (33.4%) | $79,431 |
| Total | 6,034 (100.0%) | $119,408 |
Poverty in Worthington
Income Below Poverty by Sex and Age in Worthington
With 2.7% poverty level for males and 2.2% for females among the residents of Worthington, 65 to 74 year old males and 15 year old females are the most vulnerable to poverty, with 73 males (9.0%) and 7 females (10.4%) in their respective age groups living below the poverty level.
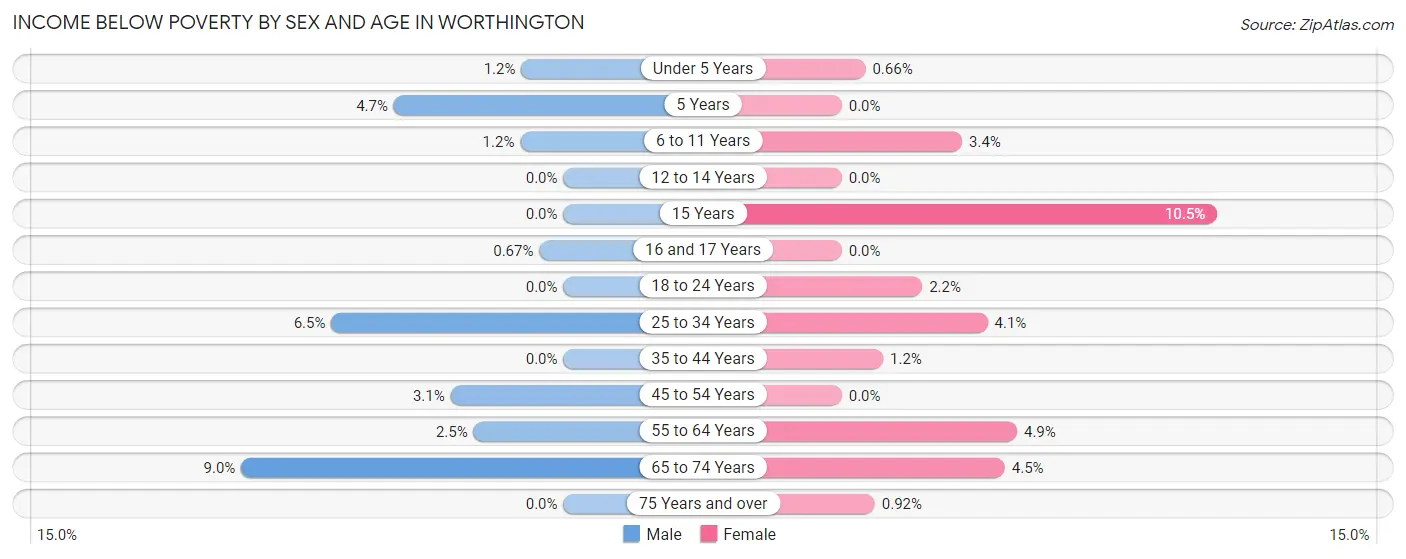
| Age Bracket | Male | Female |
| Under 5 Years | 6 (1.2%) | 4 (0.7%) |
| 5 Years | 6 (4.7%) | 0 (0.0%) |
| 6 to 11 Years | 8 (1.2%) | 24 (3.4%) |
| 12 to 14 Years | 0 (0.0%) | 0 (0.0%) |
| 15 Years | 0 (0.0%) | 7 (10.4%) |
| 16 and 17 Years | 1 (0.7%) | 0 (0.0%) |
| 18 to 24 Years | 0 (0.0%) | 7 (2.2%) |
| 25 to 34 Years | 51 (6.5%) | 29 (4.1%) |
| 35 to 44 Years | 0 (0.0%) | 15 (1.1%) |
| 45 to 54 Years | 27 (3.1%) | 0 (0.0%) |
| 55 to 64 Years | 18 (2.5%) | 42 (4.9%) |
| 65 to 74 Years | 73 (9.0%) | 41 (4.5%) |
| 75 Years and over | 0 (0.0%) | 6 (0.9%) |
| Total | 190 (2.7%) | 175 (2.2%) |
Income Above Poverty by Sex and Age in Worthington
According to the poverty statistics in Worthington, males aged 12 to 14 years and females aged 5 years are the age groups that are most secure financially, with 100.0% of males and 100.0% of females in these age groups living above the poverty line.
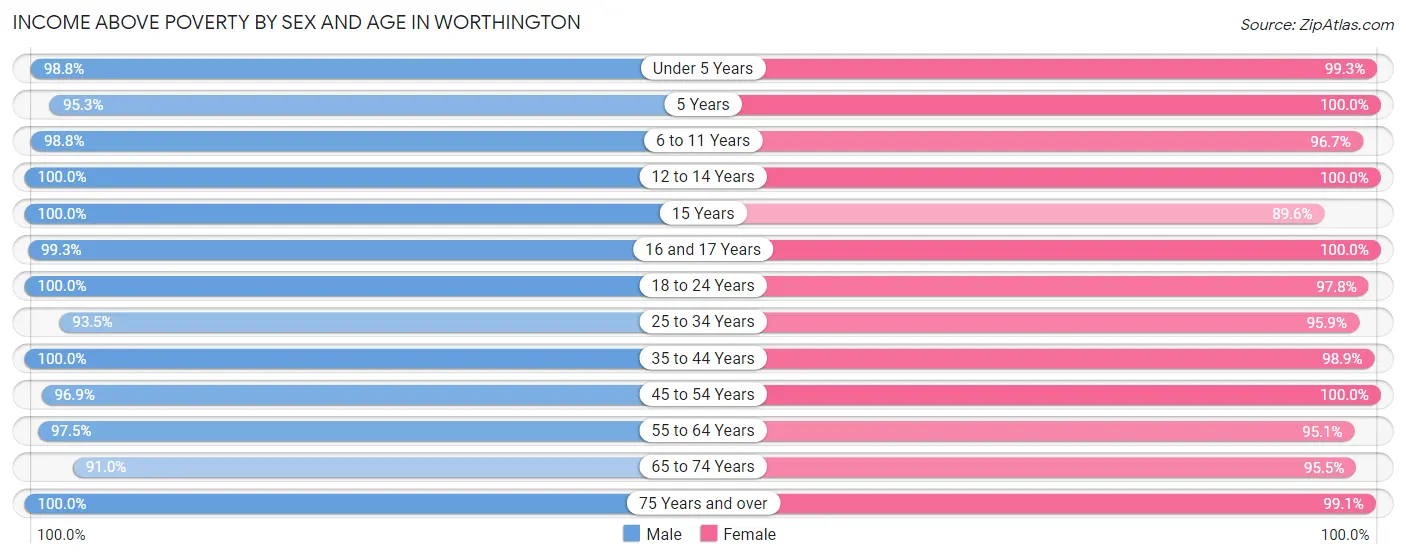
| Age Bracket | Male | Female |
| Under 5 Years | 507 (98.8%) | 600 (99.3%) |
| 5 Years | 121 (95.3%) | 149 (100.0%) |
| 6 to 11 Years | 661 (98.8%) | 693 (96.7%) |
| 12 to 14 Years | 151 (100.0%) | 399 (100.0%) |
| 15 Years | 58 (100.0%) | 60 (89.5%) |
| 16 and 17 Years | 149 (99.3%) | 175 (100.0%) |
| 18 to 24 Years | 227 (100.0%) | 305 (97.8%) |
| 25 to 34 Years | 739 (93.5%) | 686 (95.9%) |
| 35 to 44 Years | 1,262 (100.0%) | 1,292 (98.9%) |
| 45 to 54 Years | 833 (96.9%) | 942 (100.0%) |
| 55 to 64 Years | 701 (97.5%) | 819 (95.1%) |
| 65 to 74 Years | 741 (91.0%) | 862 (95.5%) |
| 75 Years and over | 587 (100.0%) | 645 (99.1%) |
| Total | 6,737 (97.3%) | 7,627 (97.8%) |
Income Below Poverty Among Married-Couple Families in Worthington
The poverty statistics for married-couple families in Worthington show that 0.9% or 31 of the total 3,504 families live below the poverty line. Families with 3 or 4 children have the highest poverty rate of 1.9%, comprising of 6 families. On the other hand, families with 1 or 2 children have the lowest poverty rate of 0.5%, which includes 7 families.
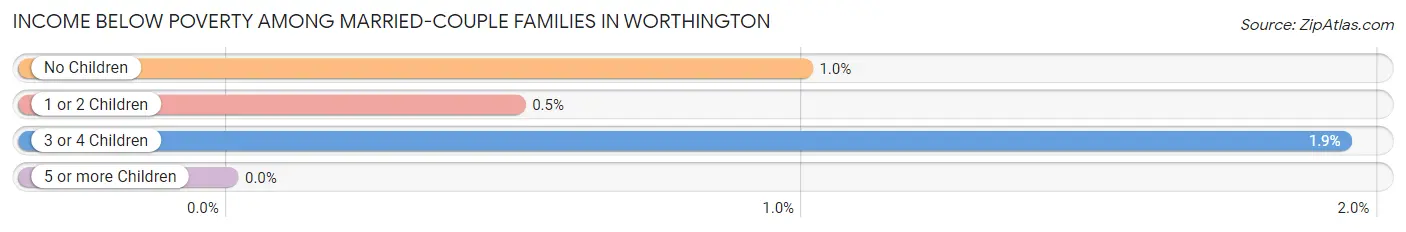
| Children | Above Poverty | Below Poverty |
| No Children | 1,782 (99.0%) | 18 (1.0%) |
| 1 or 2 Children | 1,387 (99.5%) | 7 (0.5%) |
| 3 or 4 Children | 304 (98.1%) | 6 (1.9%) |
| 5 or more Children | 0 (0.0%) | 0 (0.0%) |
| Total | 3,473 (99.1%) | 31 (0.9%) |
Income Below Poverty Among Single-Parent Households in Worthington
According to the poverty data in Worthington, 9.7% or 14 single-father households and 2.7% or 14 single-mother households are living below the poverty line. Among single-father households, those with no children have the highest poverty rate, with 6 households (11.3%) experiencing poverty. Likewise, among single-mother households, those with 1 or 2 children have the highest poverty rate, with 14 households (6.0%) falling below the poverty line.
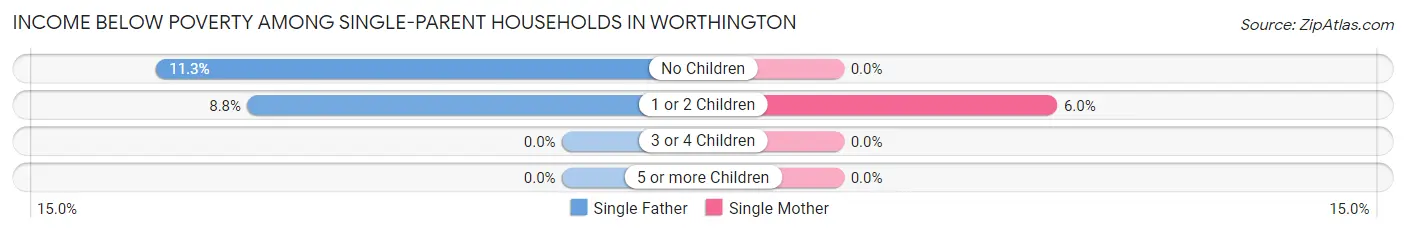
| Children | Single Father | Single Mother |
| No Children | 6 (11.3%) | 0 (0.0%) |
| 1 or 2 Children | 8 (8.8%) | 14 (6.0%) |
| 3 or 4 Children | 0 (0.0%) | 0 (0.0%) |
| 5 or more Children | 0 (0.0%) | 0 (0.0%) |
| Total | 14 (9.7%) | 14 (2.7%) |
Income Below Poverty Among Married-Couple vs Single-Parent Households in Worthington
The poverty data for Worthington shows that 31 of the married-couple family households (0.9%) and 28 of the single-parent households (4.3%) are living below the poverty level. Within the married-couple family households, those with 3 or 4 children have the highest poverty rate, with 6 households (1.9%) falling below the poverty line. Among the single-parent households, those with 1 or 2 children have the highest poverty rate, with 22 household (6.8%) living below poverty.
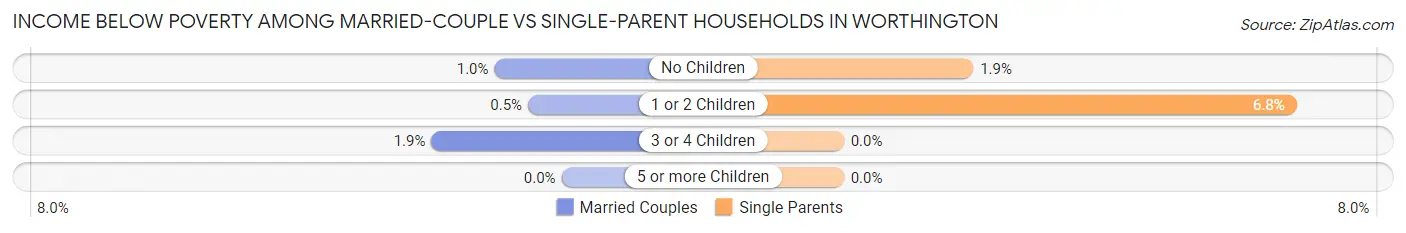
| Children | Married-Couple Families | Single-Parent Households |
| No Children | 18 (1.0%) | 6 (1.9%) |
| 1 or 2 Children | 7 (0.5%) | 22 (6.8%) |
| 3 or 4 Children | 6 (1.9%) | 0 (0.0%) |
| 5 or more Children | 0 (0.0%) | 0 (0.0%) |
| Total | 31 (0.9%) | 28 (4.3%) |
Race in Worthington
The most populous races in Worthington are White / Caucasian (13,661 | 91.1%), Black / African American (577 | 3.8%), and Two or more Races (564 | 3.8%).
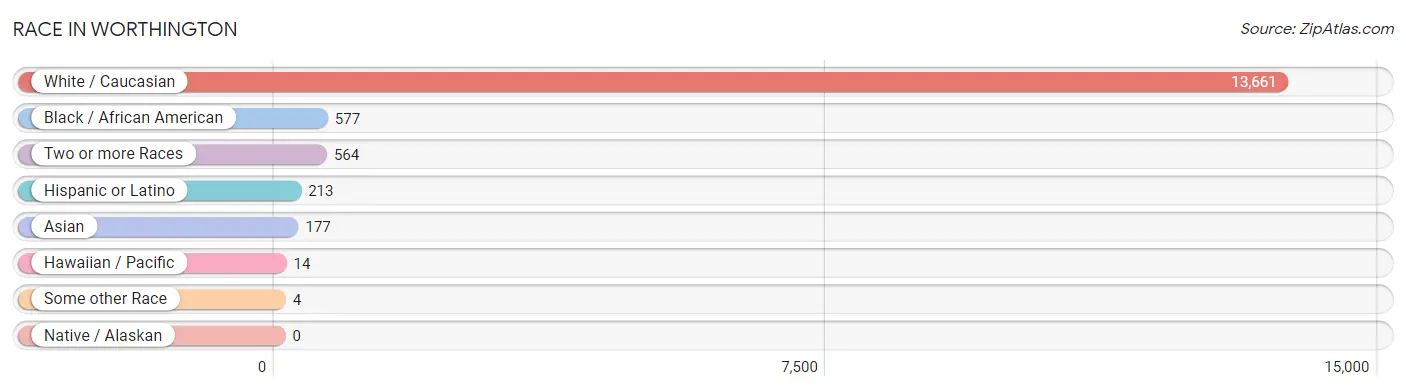
| Race | # Population | % Population |
| Asian | 177 | 1.2% |
| Black / African American | 577 | 3.8% |
| Hawaiian / Pacific | 14 | 0.1% |
| Hispanic or Latino | 213 | 1.4% |
| Native / Alaskan | 0 | 0.0% |
| White / Caucasian | 13,661 | 91.1% |
| Two or more Races | 564 | 3.8% |
| Some other Race | 4 | 0.0% |
| Total | 14,997 | 100.0% |
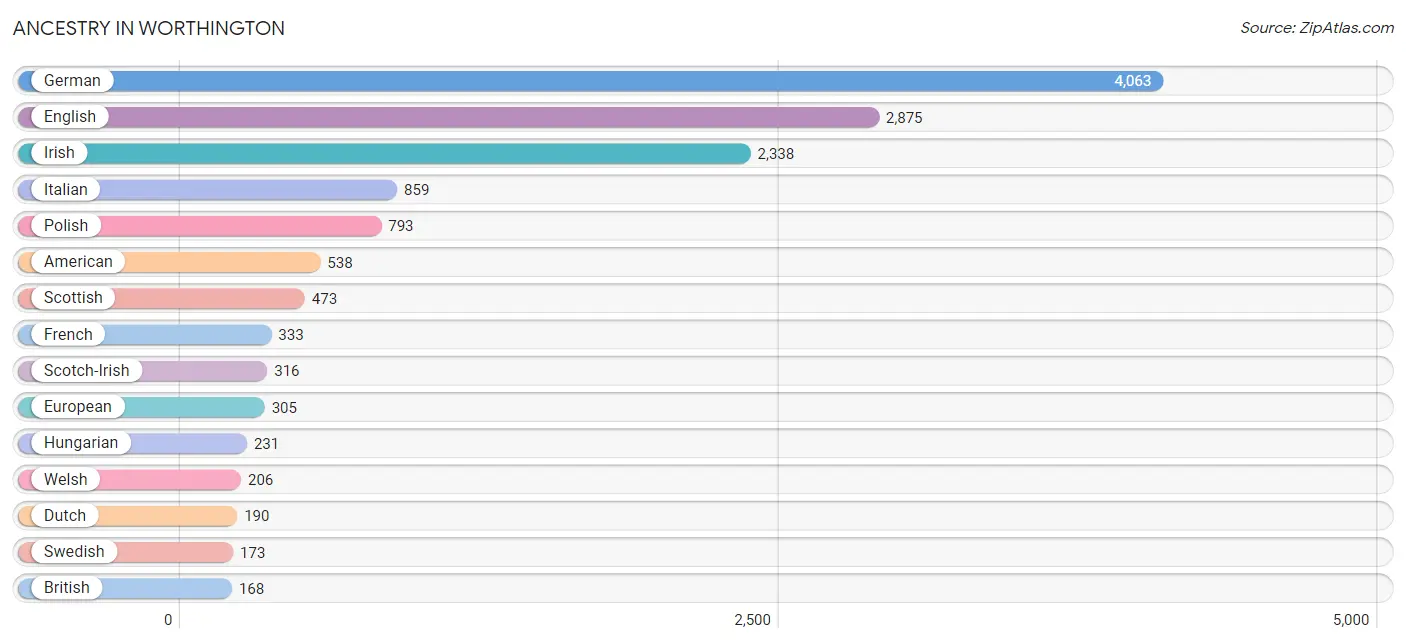
Ancestry in Worthington
The most populous ancestries reported in Worthington are German (4,063 | 27.1%), English (2,875 | 19.2%), Irish (2,338 | 15.6%), Italian (859 | 5.7%), and Polish (793 | 5.3%), together accounting for 72.9% of all Worthington residents.
| Ancestry | # Population | % Population |
| African | 25 | 0.2% |
| American | 538 | 3.6% |
| Arab | 33 | 0.2% |
| Austrian | 24 | 0.2% |
| Belgian | 32 | 0.2% |
| Bhutanese | 75 | 0.5% |
| Brazilian | 32 | 0.2% |
| British | 168 | 1.1% |
| Burmese | 15 | 0.1% |
| Canadian | 115 | 0.8% |
| Cherokee | 4 | 0.0% |
| Chilean | 4 | 0.0% |
| Colombian | 5 | 0.0% |
| Croatian | 75 | 0.5% |
| Czech | 70 | 0.5% |
| Danish | 41 | 0.3% |
| Dutch | 190 | 1.3% |
| Eastern European | 147 | 1.0% |
| Ecuadorian | 18 | 0.1% |
| English | 2,875 | 19.2% |
| Ethiopian | 22 | 0.2% |
| European | 305 | 2.0% |
| Filipino | 22 | 0.2% |
| Finnish | 32 | 0.2% |
| French | 333 | 2.2% |
| French Canadian | 60 | 0.4% |
| German | 4,063 | 27.1% |
| Ghanaian | 9 | 0.1% |
| Greek | 59 | 0.4% |
| Hungarian | 231 | 1.5% |
| Indian (Asian) | 85 | 0.6% |
| Irish | 2,338 | 15.6% |
| Italian | 859 | 5.7% |
| Korean | 111 | 0.7% |
| Laotian | 14 | 0.1% |
| Lebanese | 14 | 0.1% |
| Lithuanian | 8 | 0.1% |
| Mexican | 121 | 0.8% |
| Moroccan | 7 | 0.1% |
| Native Hawaiian | 37 | 0.3% |
| Northern European | 47 | 0.3% |
| Norwegian | 149 | 1.0% |
| Pakistani | 44 | 0.3% |
| Polish | 793 | 5.3% |
| Portuguese | 68 | 0.4% |
| Romanian | 28 | 0.2% |
| Russian | 156 | 1.0% |
| Scandinavian | 70 | 0.5% |
| Scotch-Irish | 316 | 2.1% |
| Scottish | 473 | 3.2% |
| Slavic | 12 | 0.1% |
| Slovak | 52 | 0.4% |
| Slovene | 18 | 0.1% |
| Somali | 7 | 0.1% |
| South American | 27 | 0.2% |
| Spanish | 65 | 0.4% |
| Sri Lankan | 10 | 0.1% |
| Subsaharan African | 110 | 0.7% |
| Swedish | 173 | 1.1% |
| Swiss | 44 | 0.3% |
| Syrian | 12 | 0.1% |
| Thai | 25 | 0.2% |
| Turkish | 7 | 0.1% |
| Ukrainian | 25 | 0.2% |
| Welsh | 206 | 1.4% |
| Yugoslavian | 22 | 0.2% | View All 66 Rows |
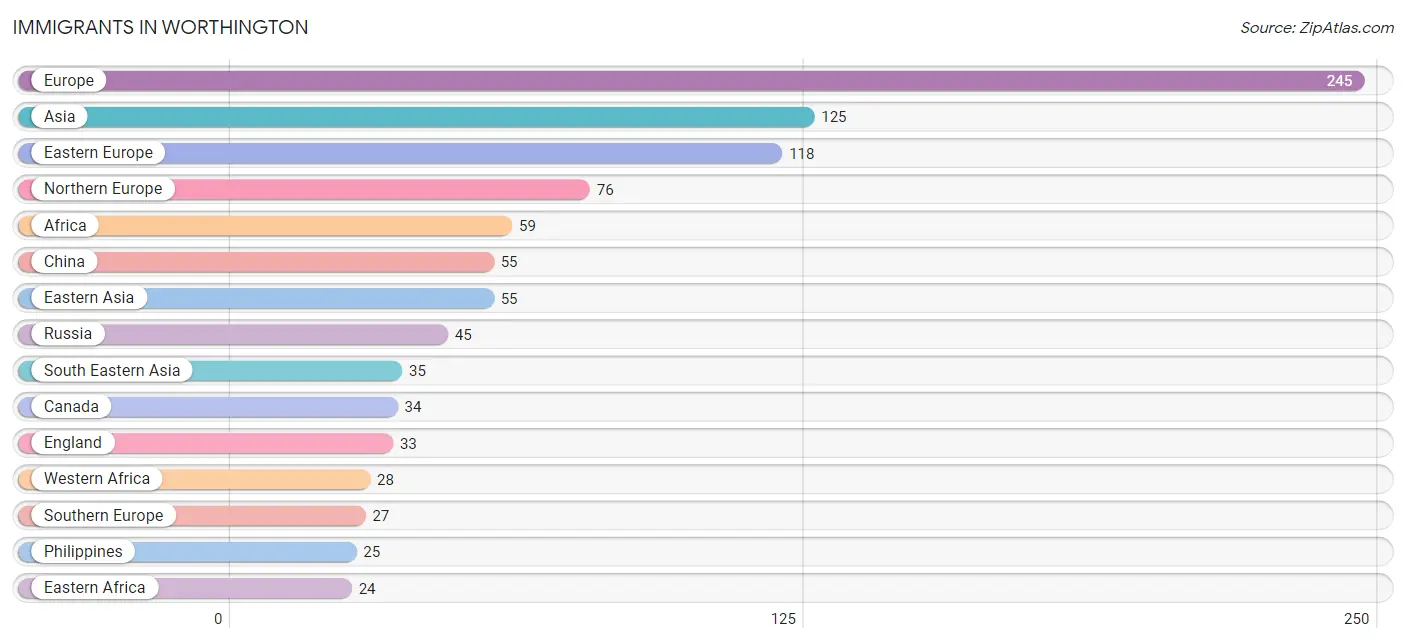
Immigrants in Worthington
The most numerous immigrant groups reported in Worthington came from Europe (245 | 1.6%), Asia (125 | 0.8%), Eastern Europe (118 | 0.8%), Northern Europe (76 | 0.5%), and Africa (59 | 0.4%), together accounting for 4.2% of all Worthington residents.
| Immigration Origin | # Population | % Population |
| Africa | 59 | 0.4% |
| Asia | 125 | 0.8% |
| Australia | 10 | 0.1% |
| Brazil | 16 | 0.1% |
| Canada | 34 | 0.2% |
| Chile | 4 | 0.0% |
| China | 55 | 0.4% |
| Denmark | 7 | 0.1% |
| Eastern Africa | 24 | 0.2% |
| Eastern Asia | 55 | 0.4% |
| Eastern Europe | 118 | 0.8% |
| Ecuador | 4 | 0.0% |
| Egypt | 7 | 0.1% |
| England | 33 | 0.2% |
| Ethiopia | 11 | 0.1% |
| Europe | 245 | 1.6% |
| Germany | 24 | 0.2% |
| Ghana | 9 | 0.1% |
| Greece | 17 | 0.1% |
| Hungary | 11 | 0.1% |
| India | 19 | 0.1% |
| Israel | 10 | 0.1% |
| Italy | 10 | 0.1% |
| Latin America | 24 | 0.2% |
| Northern Africa | 7 | 0.1% |
| Northern Europe | 76 | 0.5% |
| Oceania | 10 | 0.1% |
| Philippines | 25 | 0.2% |
| Poland | 21 | 0.1% |
| Romania | 9 | 0.1% |
| Russia | 45 | 0.3% |
| Somalia | 13 | 0.1% |
| South America | 24 | 0.2% |
| South Central Asia | 19 | 0.1% |
| South Eastern Asia | 35 | 0.2% |
| Southern Europe | 27 | 0.2% |
| Syria | 6 | 0.0% |
| Taiwan | 17 | 0.1% |
| Vietnam | 10 | 0.1% |
| Western Africa | 28 | 0.2% |
| Western Asia | 16 | 0.1% |
| Western Europe | 24 | 0.2% | View All 42 Rows |
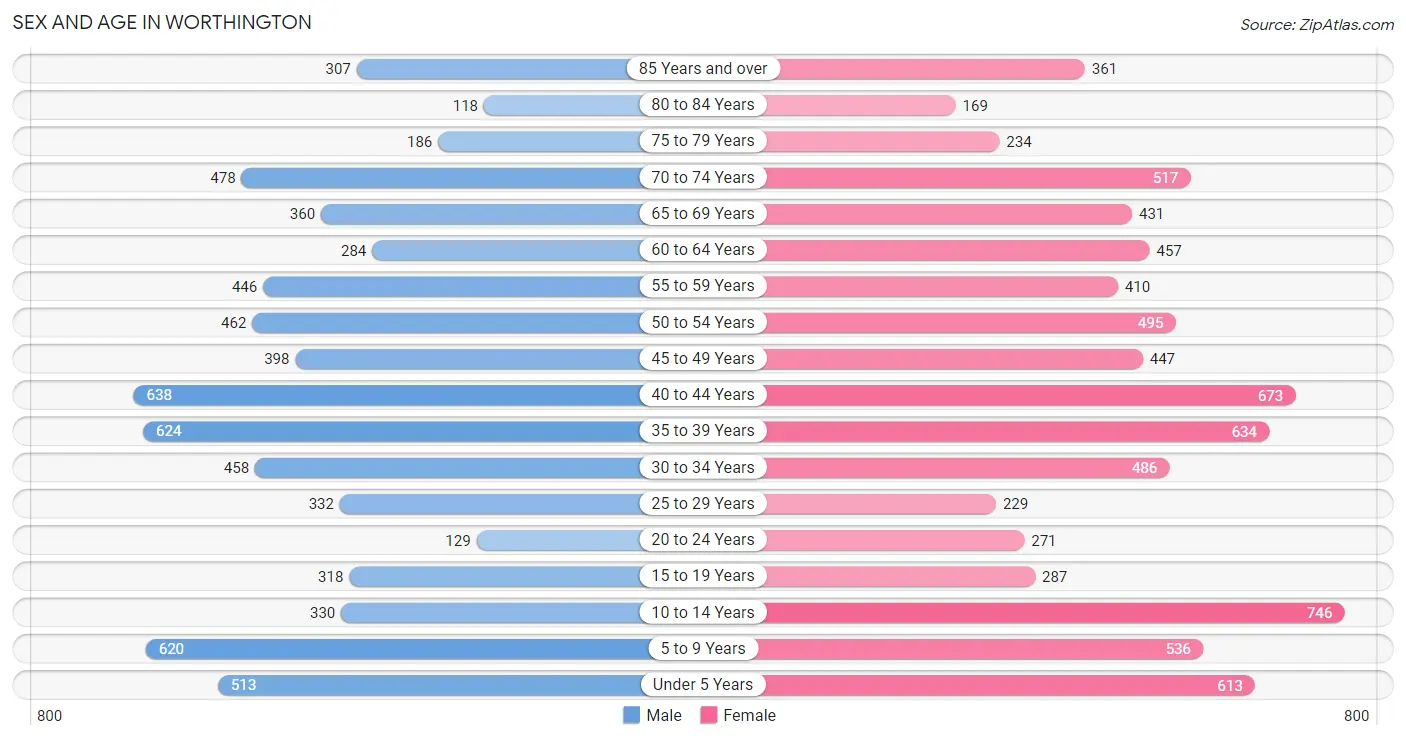
Sex and Age in Worthington
Sex and Age in Worthington
The most populous age groups in Worthington are 40 to 44 Years (638 | 9.1%) for men and 10 to 14 Years (746 | 9.3%) for women.
| Age Bracket | Male | Female |
| Under 5 Years | 513 (7.3%) | 613 (7.7%) |
| 5 to 9 Years | 620 (8.9%) | 536 (6.7%) |
| 10 to 14 Years | 330 (4.7%) | 746 (9.3%) |
| 15 to 19 Years | 318 (4.5%) | 287 (3.6%) |
| 20 to 24 Years | 129 (1.8%) | 271 (3.4%) |
| 25 to 29 Years | 332 (4.7%) | 229 (2.9%) |
| 30 to 34 Years | 458 (6.5%) | 486 (6.1%) |
| 35 to 39 Years | 624 (8.9%) | 634 (7.9%) |
| 40 to 44 Years | 638 (9.1%) | 673 (8.4%) |
| 45 to 49 Years | 398 (5.7%) | 447 (5.6%) |
| 50 to 54 Years | 462 (6.6%) | 495 (6.2%) |
| 55 to 59 Years | 446 (6.4%) | 410 (5.1%) |
| 60 to 64 Years | 284 (4.1%) | 457 (5.7%) |
| 65 to 69 Years | 360 (5.1%) | 431 (5.4%) |
| 70 to 74 Years | 478 (6.8%) | 517 (6.5%) |
| 75 to 79 Years | 186 (2.7%) | 234 (2.9%) |
| 80 to 84 Years | 118 (1.7%) | 169 (2.1%) |
| 85 Years and over | 307 (4.4%) | 361 (4.5%) |
| Total | 7,001 (100.0%) | 7,996 (100.0%) |
Families and Households in Worthington
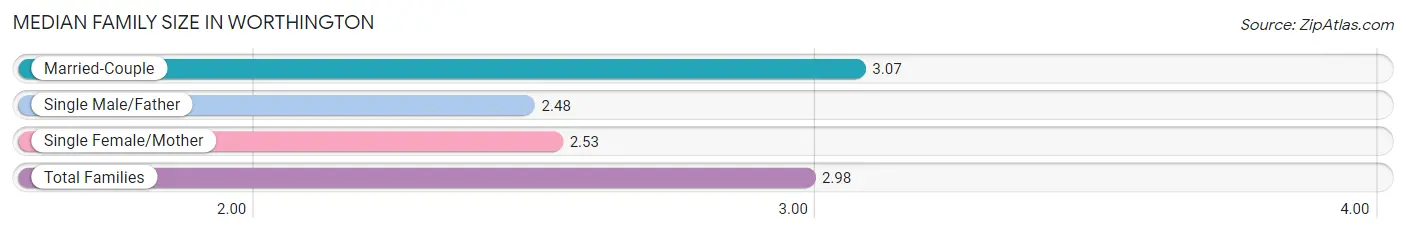
Median Family Size in Worthington
The median family size in Worthington is 2.98 persons per family, with married-couple families (3,504 | 84.2%) accounting for the largest median family size of 3.07 persons per family. On the other hand, single male/father families (144 | 3.5%) represent the smallest median family size with 2.48 persons per family.
| Family Type | # Families | Family Size |
| Married-Couple | 3,504 (84.2%) | 3.07 |
| Single Male/Father | 144 (3.5%) | 2.48 |
| Single Female/Mother | 515 (12.4%) | 2.53 |
| Total Families | 4,163 (100.0%) | 2.98 |
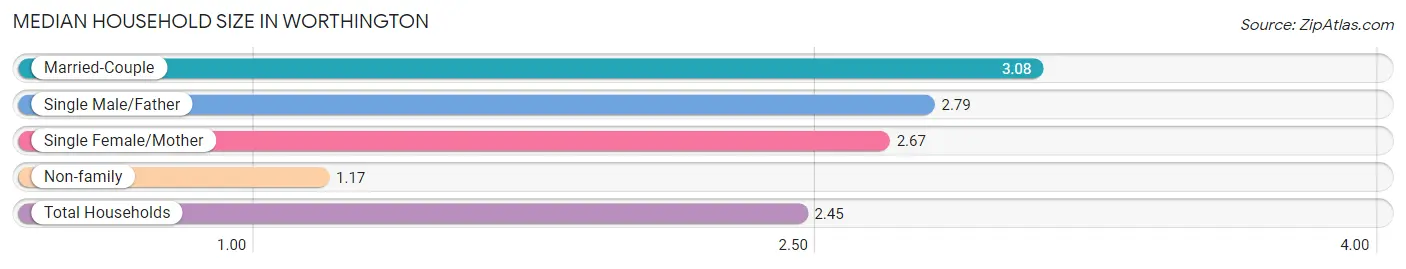
Median Household Size in Worthington
The median household size in Worthington is 2.45 persons per household, with married-couple households (3,504 | 58.1%) accounting for the largest median household size of 3.08 persons per household. non-family households (1,871 | 31.0%) represent the smallest median household size with 1.17 persons per household.
| Household Type | # Households | Household Size |
| Married-Couple | 3,504 (58.1%) | 3.08 |
| Single Male/Father | 144 (2.4%) | 2.79 |
| Single Female/Mother | 515 (8.5%) | 2.67 |
| Non-family | 1,871 (31.0%) | 1.17 |
| Total Households | 6,034 (100.0%) | 2.45 |
Household Size by Marriage Status in Worthington
Out of a total of 6,034 households in Worthington, 4,163 (69.0%) are family households, while 1,871 (31.0%) are nonfamily households. The most numerous type of family households are 2-person households, comprising 1,848, and the most common type of nonfamily households are 1-person households, comprising 1,623.
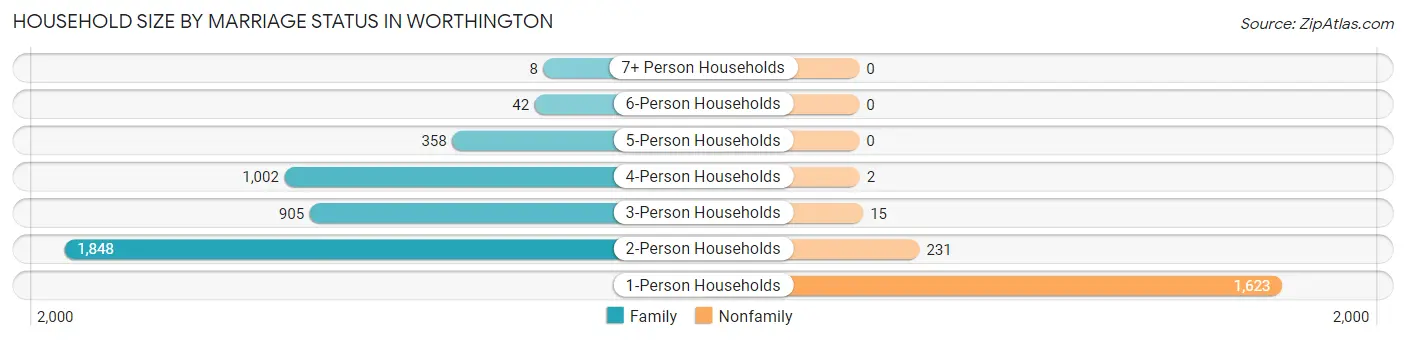
| Household Size | Family Households | Nonfamily Households |
| 1-Person Households | - | 1,623 (26.9%) |
| 2-Person Households | 1,848 (30.6%) | 231 (3.8%) |
| 3-Person Households | 905 (15.0%) | 15 (0.3%) |
| 4-Person Households | 1,002 (16.6%) | 2 (0.0%) |
| 5-Person Households | 358 (5.9%) | 0 (0.0%) |
| 6-Person Households | 42 (0.7%) | 0 (0.0%) |
| 7+ Person Households | 8 (0.1%) | 0 (0.0%) |
| Total | 4,163 (69.0%) | 1,871 (31.0%) |
Female Fertility in Worthington
Fertility by Age in Worthington
Average fertility rate in Worthington is 78.0 births per 1,000 women. Women in the age bracket of 20 to 34 years have the highest fertility rate with 153.0 births per 1,000 women. Women in the age bracket of 20 to 34 years acount for 60.6% of all women with births.
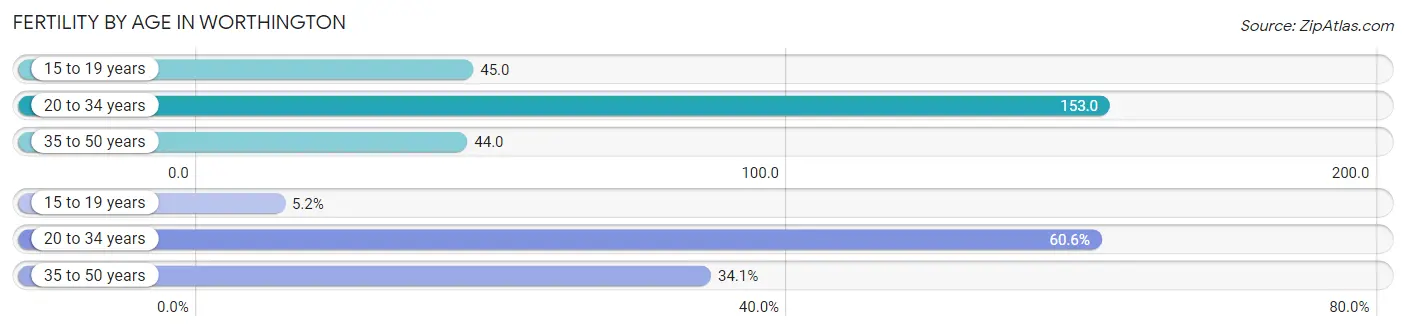
| Age Bracket | Women with Births | Births / 1,000 Women |
| 15 to 19 years | 13 (5.2%) | 45.0 |
| 20 to 34 years | 151 (60.6%) | 153.0 |
| 35 to 50 years | 85 (34.1%) | 44.0 |
| Total | 249 (100.0%) | 78.0 |
Fertility by Age by Marriage Status in Worthington
88.0% of women with births (249) in Worthington are married. The highest percentage of unmarried women with births falls into 15 to 19 years age bracket with 100.0% of them unmarried at the time of birth, while the lowest percentage of unmarried women with births belong to 35 to 50 years age bracket with 0.0% of them unmarried.
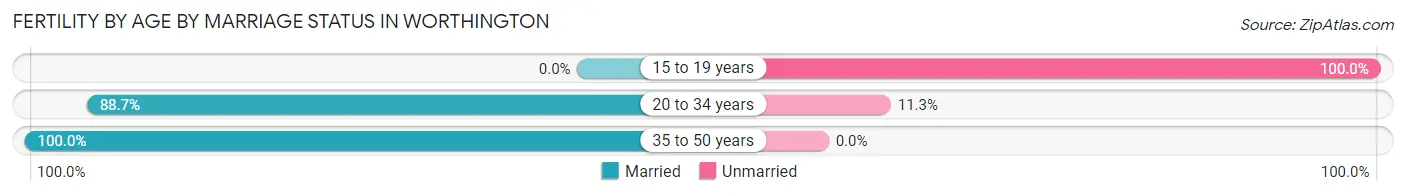
| Age Bracket | Married | Unmarried |
| 15 to 19 years | 0 (0.0%) | 13 (100.0%) |
| 20 to 34 years | 134 (88.7%) | 17 (11.3%) |
| 35 to 50 years | 85 (100.0%) | 0 (0.0%) |
| Total | 219 (87.9%) | 30 (12.0%) |
Fertility by Education in Worthington
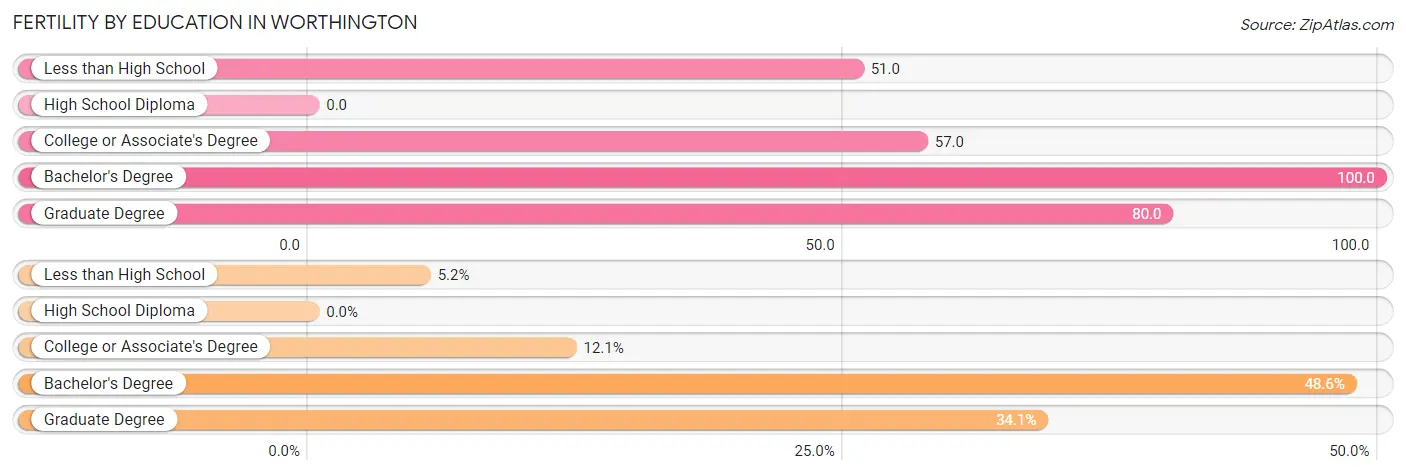
| Educational Attainment | Women with Births | Births / 1,000 Women |
| Less than High School | 13 (5.2%) | 51.0 |
| High School Diploma | 0 (0.0%) | 0.0 |
| College or Associate's Degree | 30 (12.0%) | 57.0 |
| Bachelor's Degree | 121 (48.6%) | 100.0 |
| Graduate Degree | 85 (34.1%) | 80.0 |
| Total | 249 (100.0%) | 78.0 |
Fertility by Education by Marriage Status in Worthington
12.0% of women with births in Worthington are unmarried. Women with the educational attainment of bachelor's degree are most likely to be married with 100.0% of them married at childbirth, while women with the educational attainment of less than high school are least likely to be married with 100.0% of them unmarried at childbirth.
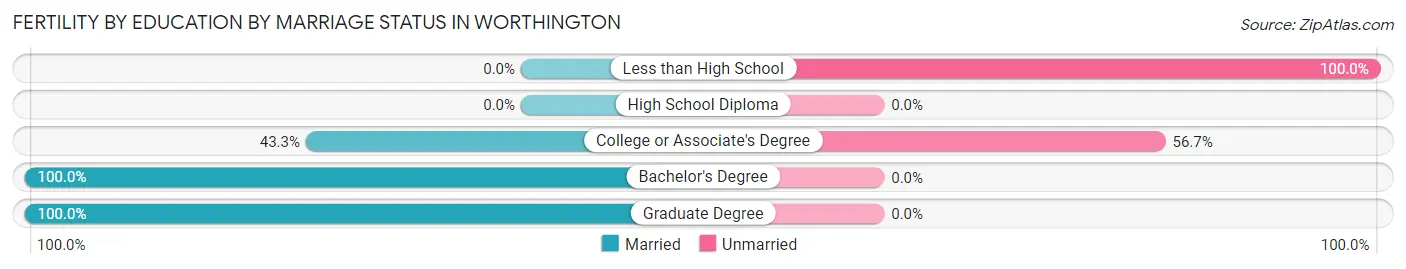
| Educational Attainment | Married | Unmarried |
| Less than High School | 0 (0.0%) | 13 (100.0%) |
| High School Diploma | 0 (0.0%) | 0 (0.0%) |
| College or Associate's Degree | 13 (43.3%) | 17 (56.7%) |
| Bachelor's Degree | 121 (100.0%) | 0 (0.0%) |
| Graduate Degree | 85 (100.0%) | 0 (0.0%) |
| Total | 219 (87.9%) | 30 (12.0%) |
Employment Characteristics in Worthington
Employment by Class of Employer in Worthington
Among the 7,156 employed individuals in Worthington, private company employees (4,230 | 59.1%), not-for-profit organizations (942 | 13.2%), and state government employees (569 | 8.0%) make up the most common classes of employment.
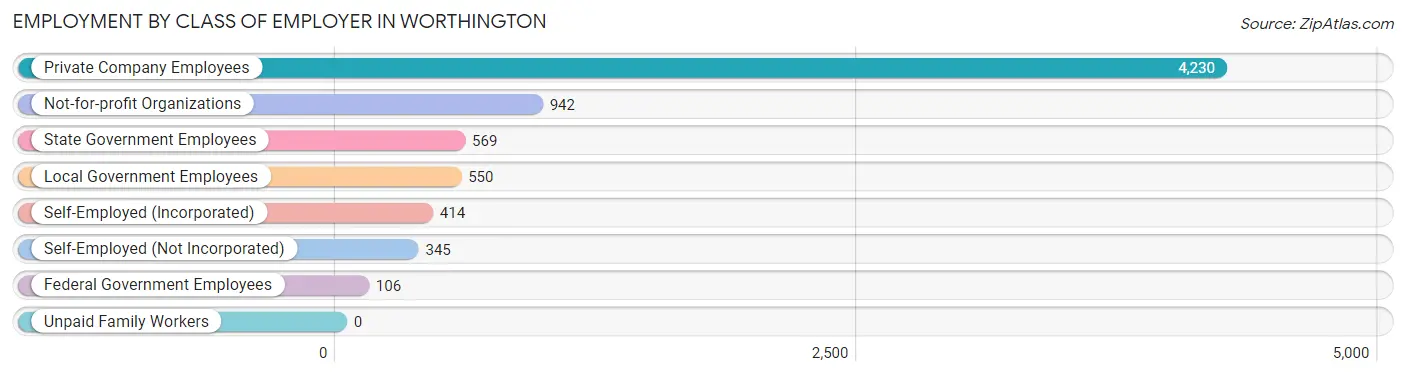
| Employer Class | # Employees | % Employees |
| Private Company Employees | 4,230 | 59.1% |
| Self-Employed (Incorporated) | 414 | 5.8% |
| Self-Employed (Not Incorporated) | 345 | 4.8% |
| Not-for-profit Organizations | 942 | 13.2% |
| Local Government Employees | 550 | 7.7% |
| State Government Employees | 569 | 8.0% |
| Federal Government Employees | 106 | 1.5% |
| Unpaid Family Workers | 0 | 0.0% |
| Total | 7,156 | 100.0% |
Employment Status by Age in Worthington
According to the labor force statistics for Worthington, out of the total population over 16 years of age (11,510), 66.4% or 7,643 individuals are in the labor force, with 3.6% or 275 of them unemployed. The age group with the highest labor force participation rate is 35 to 44 years, with 93.4% or 2,399 individuals in the labor force. Within the labor force, the 25 to 29 years age range has the highest percentage of unemployed individuals, with 28.0% or 143 of them being unemployed.
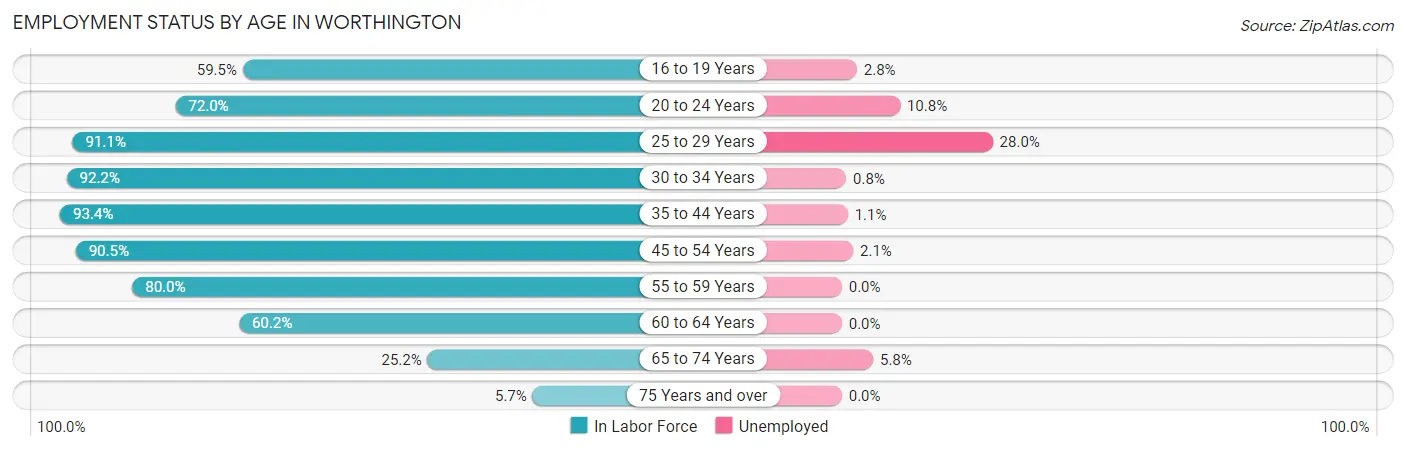
| Age Bracket | In Labor Force | Unemployed |
| 16 to 19 Years | 283 (59.5%) | 8 (2.8%) |
| 20 to 24 Years | 288 (72.0%) | 31 (10.8%) |
| 25 to 29 Years | 511 (91.1%) | 143 (28.0%) |
| 30 to 34 Years | 870 (92.2%) | 7 (0.8%) |
| 35 to 44 Years | 2,399 (93.4%) | 26 (1.1%) |
| 45 to 54 Years | 1,631 (90.5%) | 34 (2.1%) |
| 55 to 59 Years | 685 (80.0%) | 0 (0.0%) |
| 60 to 64 Years | 446 (60.2%) | 0 (0.0%) |
| 65 to 74 Years | 450 (25.2%) | 26 (5.8%) |
| 75 Years and over | 78 (5.7%) | 0 (0.0%) |
| Total | 7,643 (66.4%) | 275 (3.6%) |
Employment Status by Educational Attainment in Worthington
According to labor force statistics for Worthington, 87.5% of individuals (6,539) out of the total population between 25 and 64 years of age (7,473) are in the labor force, with 3.2% or 209 of them being unemployed. The group with the highest labor force participation rate are those with the educational attainment of bachelor's degree or higher, with 89.6% or 4,948 individuals in the labor force. Within the labor force, individuals with college / associate degree education have the highest percentage of unemployment, with 11.2% or 153 of them being unemployed.
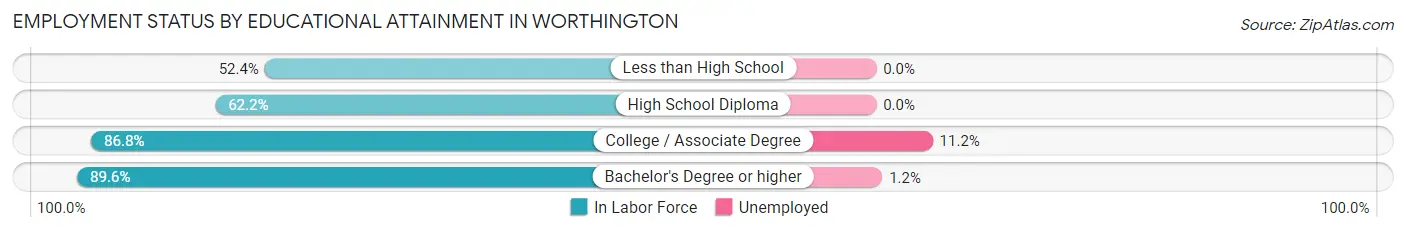
| Educational Attainment | In Labor Force | Unemployed |
| Less than High School | 22 (52.4%) | 0 (0.0%) |
| High School Diploma | 206 (62.2%) | 0 (0.0%) |
| College / Associate Degree | 1,370 (86.8%) | 177 (11.2%) |
| Bachelor's Degree or higher | 4,948 (89.6%) | 66 (1.2%) |
| Total | 6,539 (87.5%) | 239 (3.2%) |
Employment Occupations by Sex in Worthington
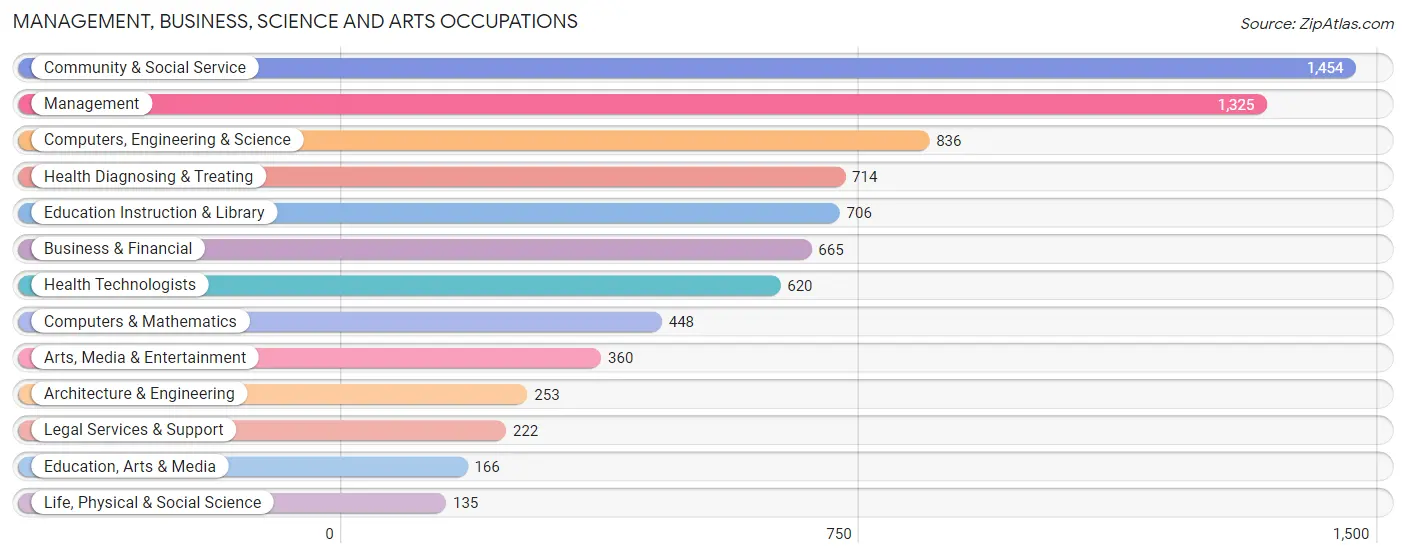
Management, Business, Science and Arts Occupations
The most common Management, Business, Science and Arts occupations in Worthington are Community & Social Service (1,454 | 19.7%), Management (1,325 | 18.0%), Computers, Engineering & Science (836 | 11.4%), Health Diagnosing & Treating (714 | 9.7%), and Education Instruction & Library (706 | 9.6%).
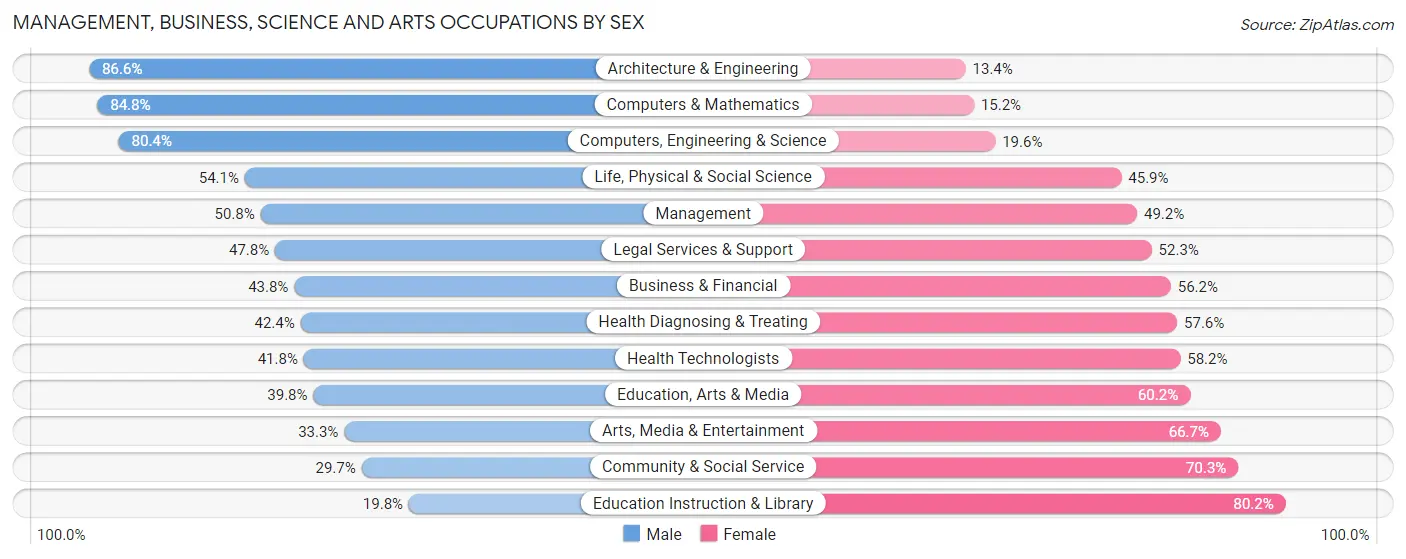
Management, Business, Science and Arts Occupations by Sex
Within the Management, Business, Science and Arts occupations in Worthington, the most male-oriented occupations are Architecture & Engineering (86.6%), Computers & Mathematics (84.8%), and Computers, Engineering & Science (80.4%), while the most female-oriented occupations are Education Instruction & Library (80.2%), Community & Social Service (70.3%), and Arts, Media & Entertainment (66.7%).
| Occupation | Male | Female |
| Management | 673 (50.8%) | 652 (49.2%) |
| Business & Financial | 291 (43.8%) | 374 (56.2%) |
| Computers, Engineering & Science | 672 (80.4%) | 164 (19.6%) |
| Computers & Mathematics | 380 (84.8%) | 68 (15.2%) |
| Architecture & Engineering | 219 (86.6%) | 34 (13.4%) |
| Life, Physical & Social Science | 73 (54.1%) | 62 (45.9%) |
| Community & Social Service | 432 (29.7%) | 1,022 (70.3%) |
| Education, Arts & Media | 66 (39.8%) | 100 (60.2%) |
| Legal Services & Support | 106 (47.7%) | 116 (52.2%) |
| Education Instruction & Library | 140 (19.8%) | 566 (80.2%) |
| Arts, Media & Entertainment | 120 (33.3%) | 240 (66.7%) |
| Health Diagnosing & Treating | 303 (42.4%) | 411 (57.6%) |
| Health Technologists | 259 (41.8%) | 361 (58.2%) |
| Total (Category) | 2,371 (47.5%) | 2,623 (52.5%) |
| Total (Overall) | 3,792 (51.5%) | 3,573 (48.5%) |
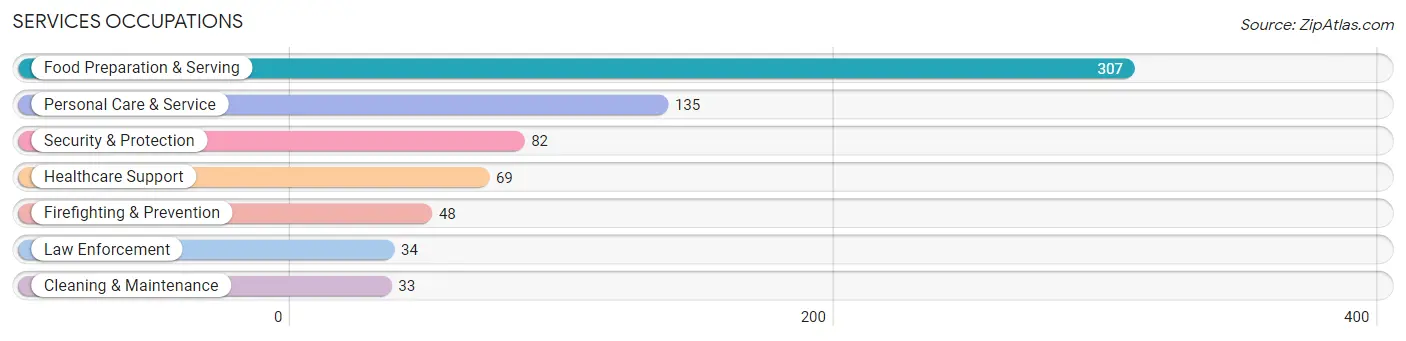
Services Occupations
The most common Services occupations in Worthington are Food Preparation & Serving (307 | 4.2%), Personal Care & Service (135 | 1.8%), Security & Protection (82 | 1.1%), Healthcare Support (69 | 0.9%), and Firefighting & Prevention (48 | 0.6%).
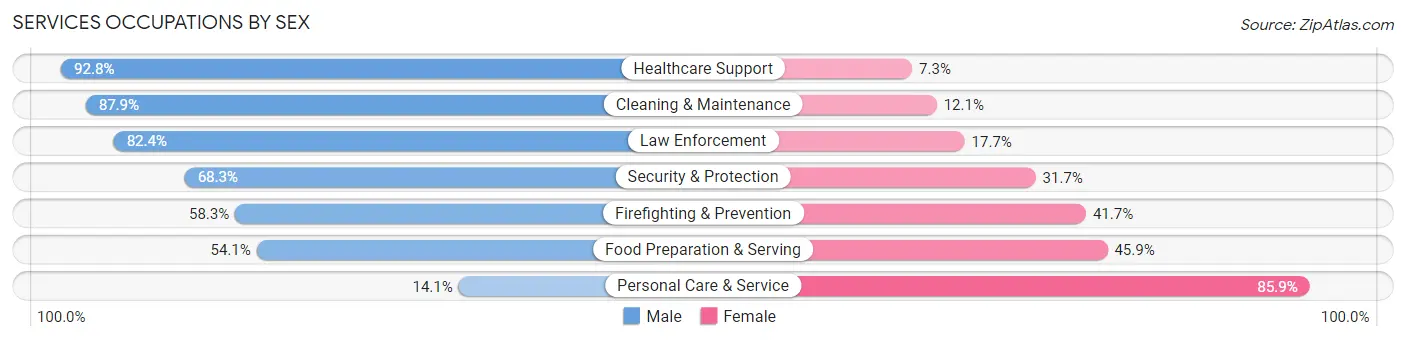
Services Occupations by Sex
Within the Services occupations in Worthington, the most male-oriented occupations are Healthcare Support (92.7%), Cleaning & Maintenance (87.9%), and Law Enforcement (82.4%), while the most female-oriented occupations are Personal Care & Service (85.9%), Food Preparation & Serving (45.9%), and Firefighting & Prevention (41.7%).
| Occupation | Male | Female |
| Healthcare Support | 64 (92.7%) | 5 (7.2%) |
| Security & Protection | 56 (68.3%) | 26 (31.7%) |
| Firefighting & Prevention | 28 (58.3%) | 20 (41.7%) |
| Law Enforcement | 28 (82.4%) | 6 (17.6%) |
| Food Preparation & Serving | 166 (54.1%) | 141 (45.9%) |
| Cleaning & Maintenance | 29 (87.9%) | 4 (12.1%) |
| Personal Care & Service | 19 (14.1%) | 116 (85.9%) |
| Total (Category) | 334 (53.3%) | 292 (46.7%) |
| Total (Overall) | 3,792 (51.5%) | 3,573 (48.5%) |
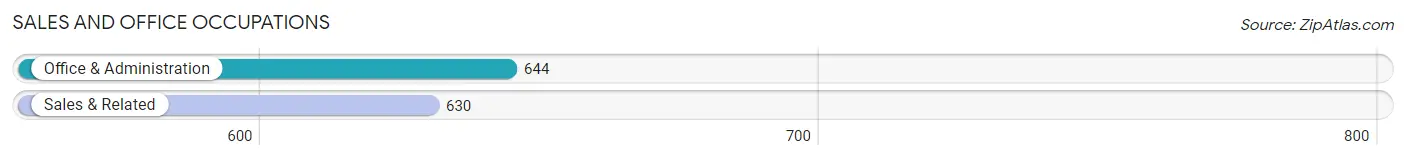
Sales and Office Occupations
The most common Sales and Office occupations in Worthington are Office & Administration (644 | 8.7%), and Sales & Related (630 | 8.6%).
Sales and Office Occupations by Sex
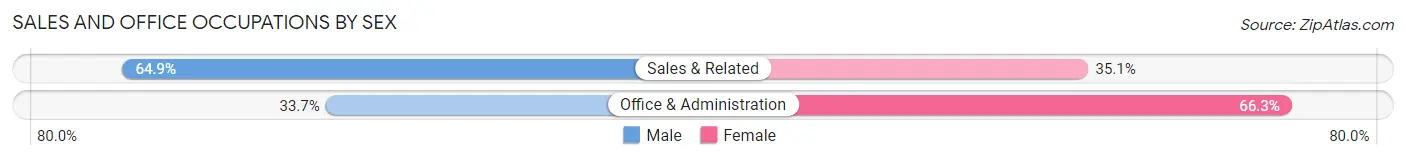
| Occupation | Male | Female |
| Sales & Related | 409 (64.9%) | 221 (35.1%) |
| Office & Administration | 217 (33.7%) | 427 (66.3%) |
| Total (Category) | 626 (49.1%) | 648 (50.9%) |
| Total (Overall) | 3,792 (51.5%) | 3,573 (48.5%) |
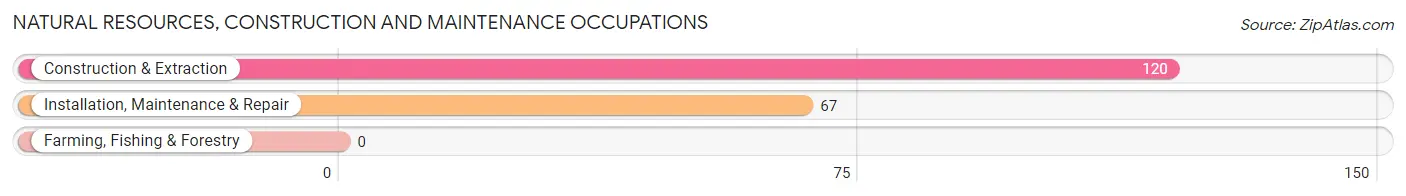
Natural Resources, Construction and Maintenance Occupations
The most common Natural Resources, Construction and Maintenance occupations in Worthington are Construction & Extraction (120 | 1.6%), and Installation, Maintenance & Repair (67 | 0.9%).
Natural Resources, Construction and Maintenance Occupations by Sex
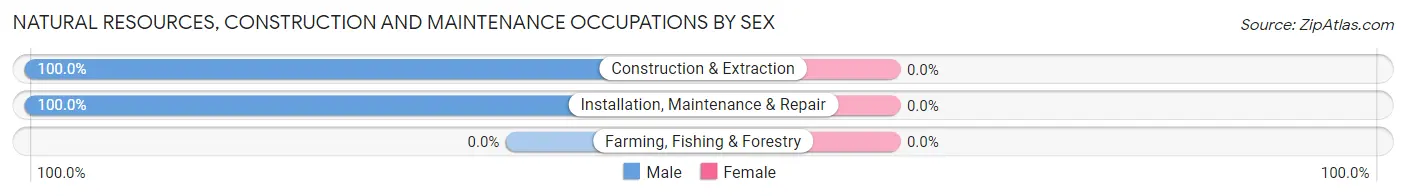
| Occupation | Male | Female |
| Farming, Fishing & Forestry | 0 (0.0%) | 0 (0.0%) |
| Construction & Extraction | 120 (100.0%) | 0 (0.0%) |
| Installation, Maintenance & Repair | 67 (100.0%) | 0 (0.0%) |
| Total (Category) | 187 (100.0%) | 0 (0.0%) |
| Total (Overall) | 3,792 (51.5%) | 3,573 (48.5%) |
Production, Transportation and Moving Occupations
The most common Production, Transportation and Moving occupations in Worthington are Transportation (129 | 1.8%), Material Moving (127 | 1.7%), and Production (28 | 0.4%).
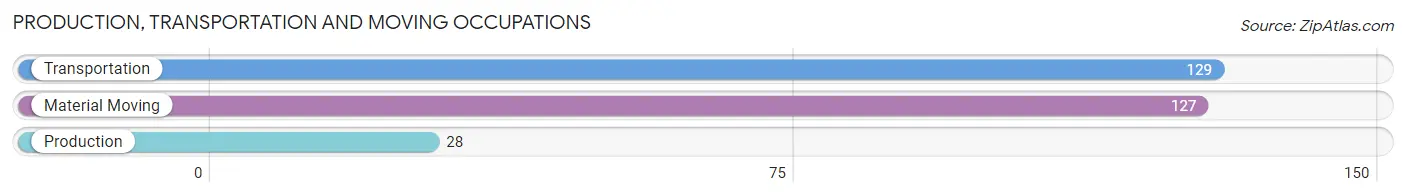
Production, Transportation and Moving Occupations by Sex
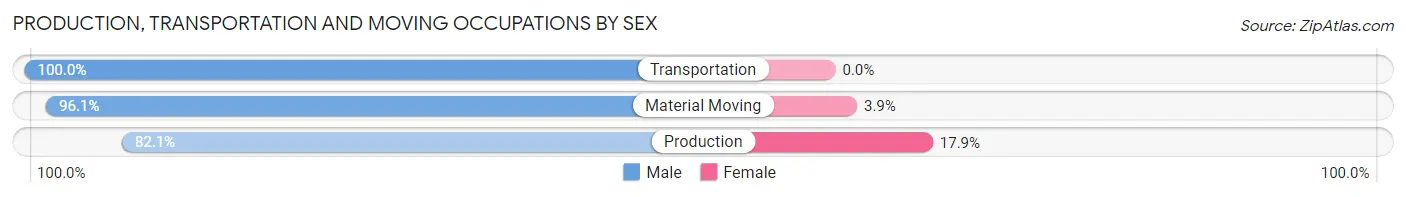
| Occupation | Male | Female |
| Production | 23 (82.1%) | 5 (17.9%) |
| Transportation | 129 (100.0%) | 0 (0.0%) |
| Material Moving | 122 (96.1%) | 5 (3.9%) |
| Total (Category) | 274 (96.5%) | 10 (3.5%) |
| Total (Overall) | 3,792 (51.5%) | 3,573 (48.5%) |
Employment Industries by Sex in Worthington
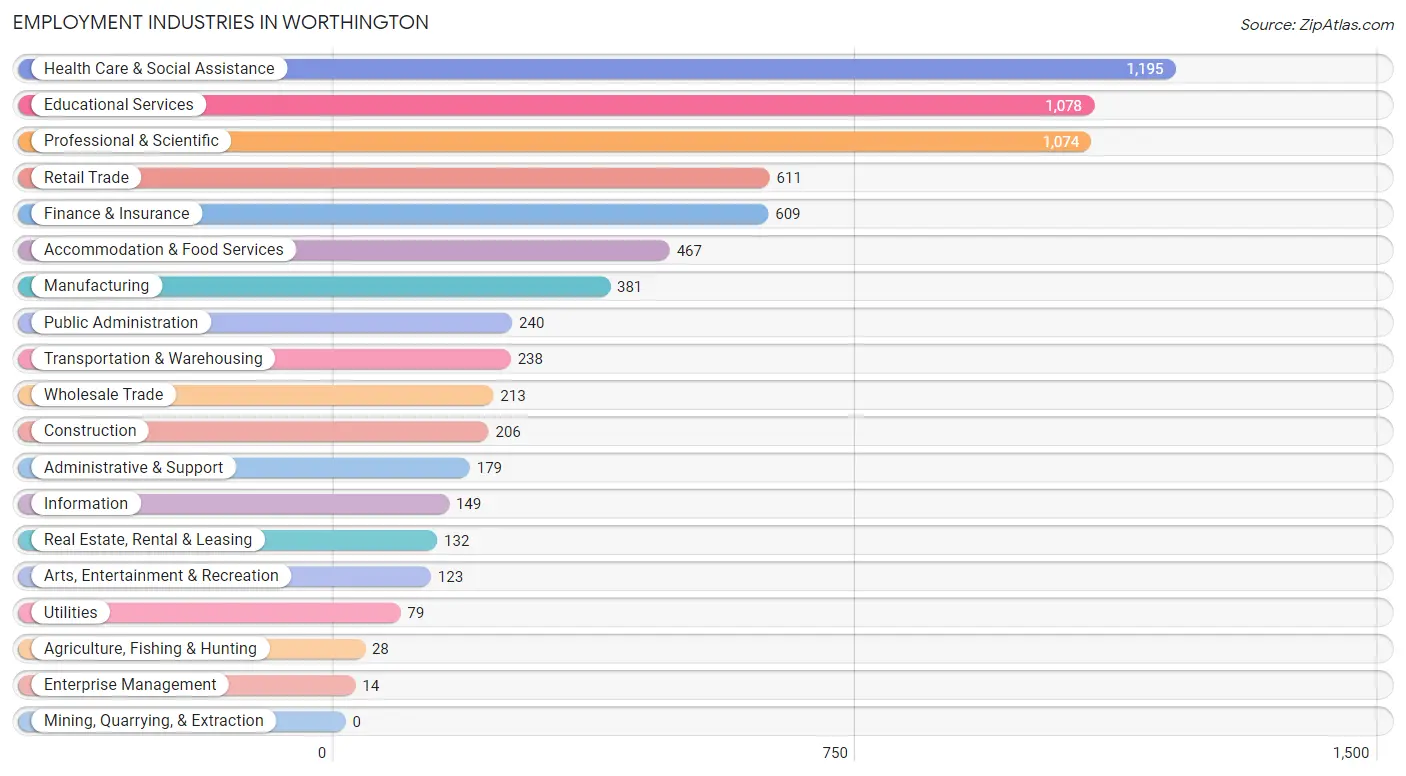
Employment Industries in Worthington
The major employment industries in Worthington include Health Care & Social Assistance (1,195 | 16.2%), Educational Services (1,078 | 14.6%), Professional & Scientific (1,074 | 14.6%), Retail Trade (611 | 8.3%), and Finance & Insurance (609 | 8.3%).
Employment Industries by Sex in Worthington
The Worthington industries that see more men than women are Enterprise Management (100.0%), Transportation & Warehousing (87.8%), and Construction (86.4%), whereas the industries that tend to have a higher number of women are Agriculture, Fishing & Hunting (100.0%), Information (79.2%), and Educational Services (68.4%).
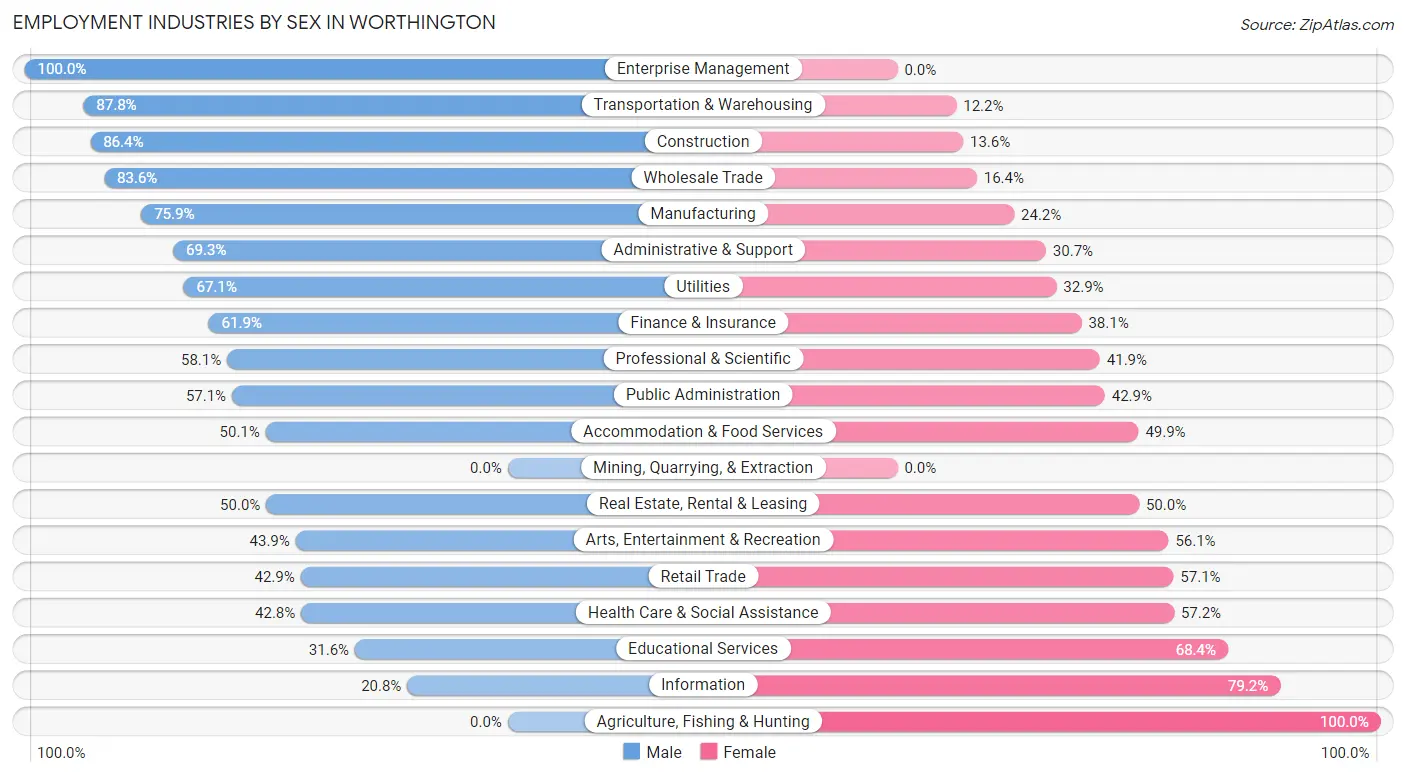
| Industry | Male | Female |
| Agriculture, Fishing & Hunting | 0 (0.0%) | 28 (100.0%) |
| Mining, Quarrying, & Extraction | 0 (0.0%) | 0 (0.0%) |
| Construction | 178 (86.4%) | 28 (13.6%) |
| Manufacturing | 289 (75.8%) | 92 (24.1%) |
| Wholesale Trade | 178 (83.6%) | 35 (16.4%) |
| Retail Trade | 262 (42.9%) | 349 (57.1%) |
| Transportation & Warehousing | 209 (87.8%) | 29 (12.2%) |
| Utilities | 53 (67.1%) | 26 (32.9%) |
| Information | 31 (20.8%) | 118 (79.2%) |
| Finance & Insurance | 377 (61.9%) | 232 (38.1%) |
| Real Estate, Rental & Leasing | 66 (50.0%) | 66 (50.0%) |
| Professional & Scientific | 624 (58.1%) | 450 (41.9%) |
| Enterprise Management | 14 (100.0%) | 0 (0.0%) |
| Administrative & Support | 124 (69.3%) | 55 (30.7%) |
| Educational Services | 341 (31.6%) | 737 (68.4%) |
| Health Care & Social Assistance | 511 (42.8%) | 684 (57.2%) |
| Arts, Entertainment & Recreation | 54 (43.9%) | 69 (56.1%) |
| Accommodation & Food Services | 234 (50.1%) | 233 (49.9%) |
| Public Administration | 137 (57.1%) | 103 (42.9%) |
| Total | 3,792 (51.5%) | 3,573 (48.5%) |
Education in Worthington
School Enrollment in Worthington
The most common levels of schooling among the 3,544 students in Worthington are middle school (926 | 26.1%), elementary school (781 | 22.0%), and high school (566 | 16.0%).
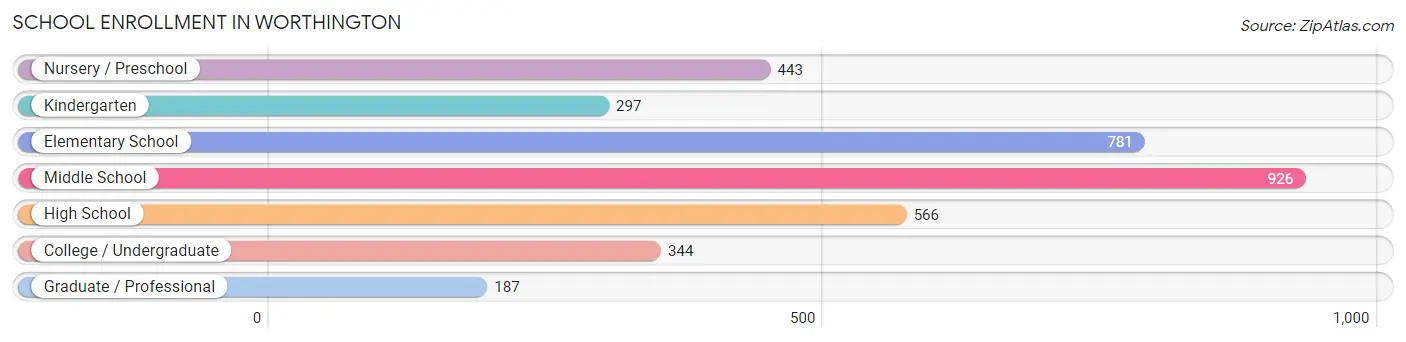
| School Level | # Students | % Students |
| Nursery / Preschool | 443 | 12.5% |
| Kindergarten | 297 | 8.4% |
| Elementary School | 781 | 22.0% |
| Middle School | 926 | 26.1% |
| High School | 566 | 16.0% |
| College / Undergraduate | 344 | 9.7% |
| Graduate / Professional | 187 | 5.3% |
| Total | 3,544 | 100.0% |
School Enrollment by Age by Funding Source in Worthington
Out of a total of 3,544 students who are enrolled in schools in Worthington, 758 (21.4%) attend a private institution, while the remaining 2,786 (78.6%) are enrolled in public schools. The age group of 3 to 4 year olds has the highest likelihood of being enrolled in private schools, with 207 (68.1% in the age bracket) enrolled. Conversely, the age group of 15 to 17 year olds has the lowest likelihood of being enrolled in a private school, with 420 (91.1% in the age bracket) attending a public institution.
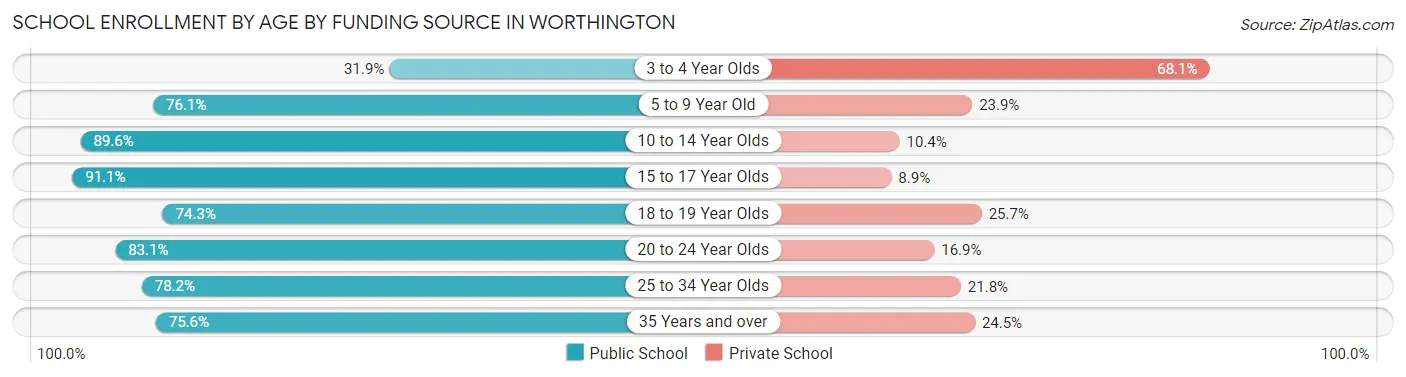
| Age Bracket | Public School | Private School |
| 3 to 4 Year Olds | 97 (31.9%) | 207 (68.1%) |
| 5 to 9 Year Old | 858 (76.1%) | 270 (23.9%) |
| 10 to 14 Year Olds | 964 (89.6%) | 112 (10.4%) |
| 15 to 17 Year Olds | 420 (91.1%) | 41 (8.9%) |
| 18 to 19 Year Olds | 78 (74.3%) | 27 (25.7%) |
| 20 to 24 Year Olds | 128 (83.1%) | 26 (16.9%) |
| 25 to 34 Year Olds | 68 (78.2%) | 19 (21.8%) |
| 35 Years and over | 173 (75.5%) | 56 (24.4%) |
| Total | 2,786 (78.6%) | 758 (21.4%) |
Educational Attainment by Field of Study in Worthington
Business (1,379 | 16.6%), education (1,184 | 14.3%), social sciences (921 | 11.1%), science & technology (637 | 7.7%), and bio, nature & agricultural (587 | 7.1%) are the most common fields of study among 8,297 individuals in Worthington who have obtained a bachelor's degree or higher.
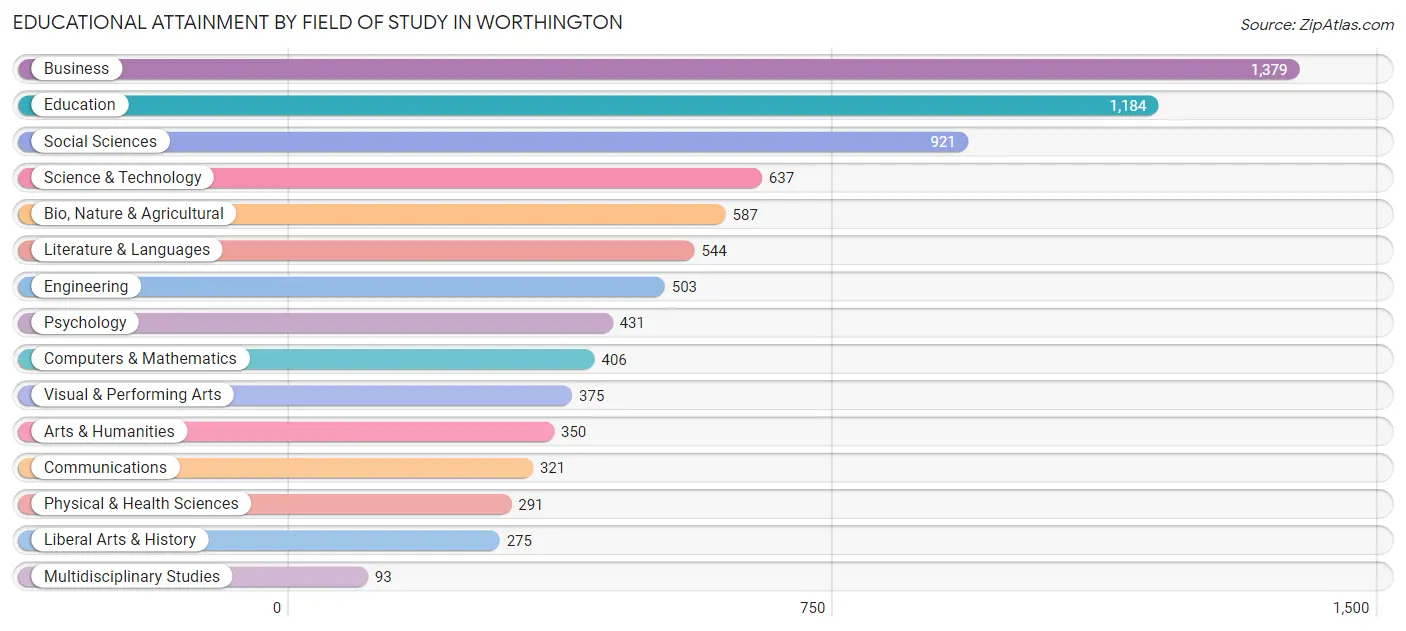
| Field of Study | # Graduates | % Graduates |
| Computers & Mathematics | 406 | 4.9% |
| Bio, Nature & Agricultural | 587 | 7.1% |
| Physical & Health Sciences | 291 | 3.5% |
| Psychology | 431 | 5.2% |
| Social Sciences | 921 | 11.1% |
| Engineering | 503 | 6.1% |
| Multidisciplinary Studies | 93 | 1.1% |
| Science & Technology | 637 | 7.7% |
| Business | 1,379 | 16.6% |
| Education | 1,184 | 14.3% |
| Literature & Languages | 544 | 6.6% |
| Liberal Arts & History | 275 | 3.3% |
| Visual & Performing Arts | 375 | 4.5% |
| Communications | 321 | 3.9% |
| Arts & Humanities | 350 | 4.2% |
| Total | 8,297 | 100.0% |
Transportation & Commute in Worthington
Vehicle Availability by Sex in Worthington
The most prevalent vehicle ownership categories in Worthington are males with 2 vehicles (2,297, accounting for 61.8%) and females with 2 vehicles (1,913, making up 66.8%).
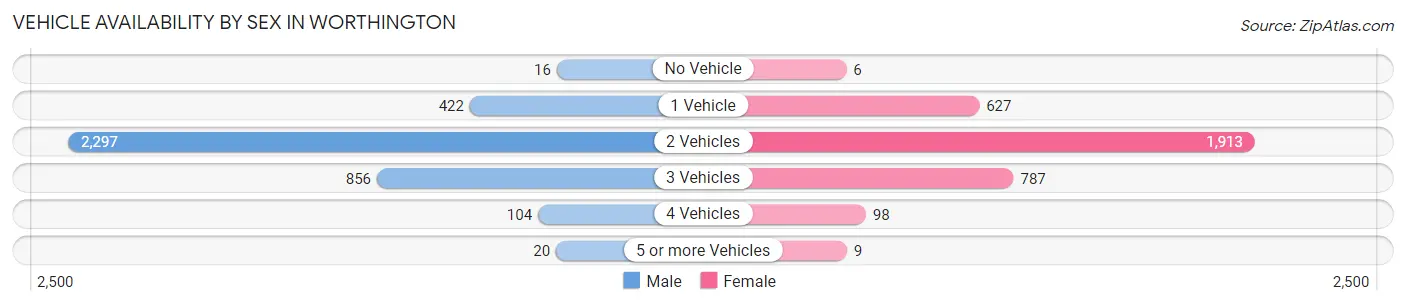
| Vehicles Available | Male | Female |
| No Vehicle | 16 (0.4%) | 6 (0.2%) |
| 1 Vehicle | 422 (11.4%) | 627 (18.2%) |
| 2 Vehicles | 2,297 (61.8%) | 1,913 (55.6%) |
| 3 Vehicles | 856 (23.0%) | 787 (22.9%) |
| 4 Vehicles | 104 (2.8%) | 98 (2.9%) |
| 5 or more Vehicles | 20 (0.5%) | 9 (0.3%) |
| Total | 3,715 (100.0%) | 3,440 (100.0%) |
Commute Time in Worthington
The most frequently occuring commute durations in Worthington are 20 to 24 minutes (1,471 commuters, 23.9%), 15 to 19 minutes (1,436 commuters, 23.3%), and 10 to 14 minutes (800 commuters, 13.0%).
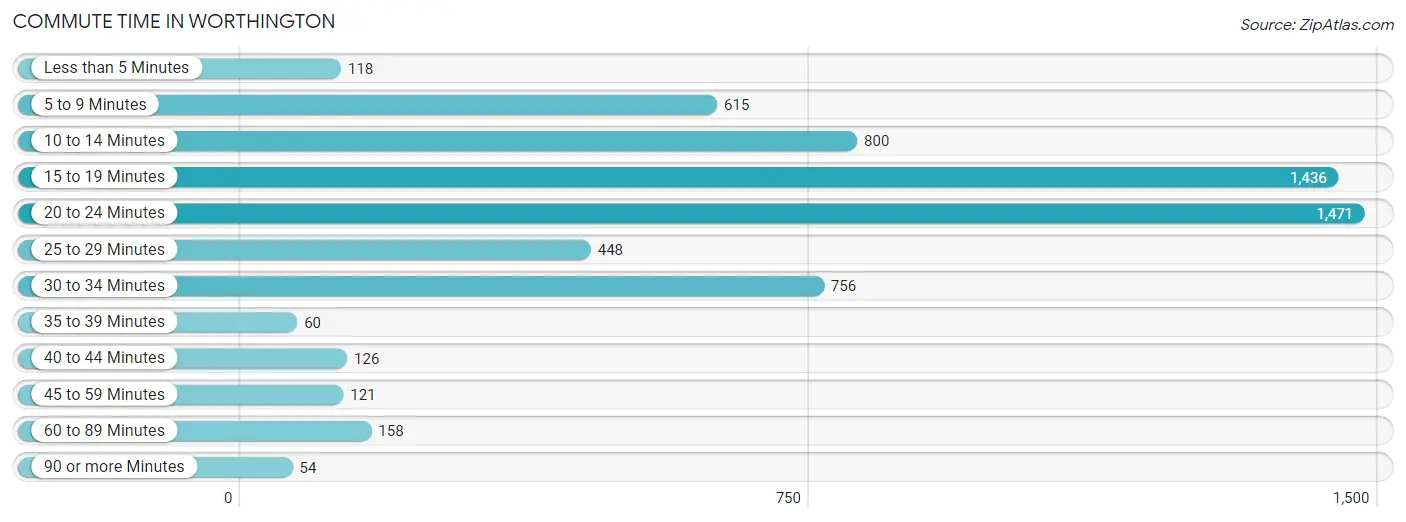
| Commute Time | # Commuters | % Commuters |
| Less than 5 Minutes | 118 | 1.9% |
| 5 to 9 Minutes | 615 | 10.0% |
| 10 to 14 Minutes | 800 | 13.0% |
| 15 to 19 Minutes | 1,436 | 23.3% |
| 20 to 24 Minutes | 1,471 | 23.9% |
| 25 to 29 Minutes | 448 | 7.3% |
| 30 to 34 Minutes | 756 | 12.3% |
| 35 to 39 Minutes | 60 | 1.0% |
| 40 to 44 Minutes | 126 | 2.0% |
| 45 to 59 Minutes | 121 | 2.0% |
| 60 to 89 Minutes | 158 | 2.6% |
| 90 or more Minutes | 54 | 0.9% |
Commute Time by Sex in Worthington
The most common commute times in Worthington are 20 to 24 minutes (836 commuters, 26.0%) for males and 15 to 19 minutes (713 commuters, 24.2%) for females.
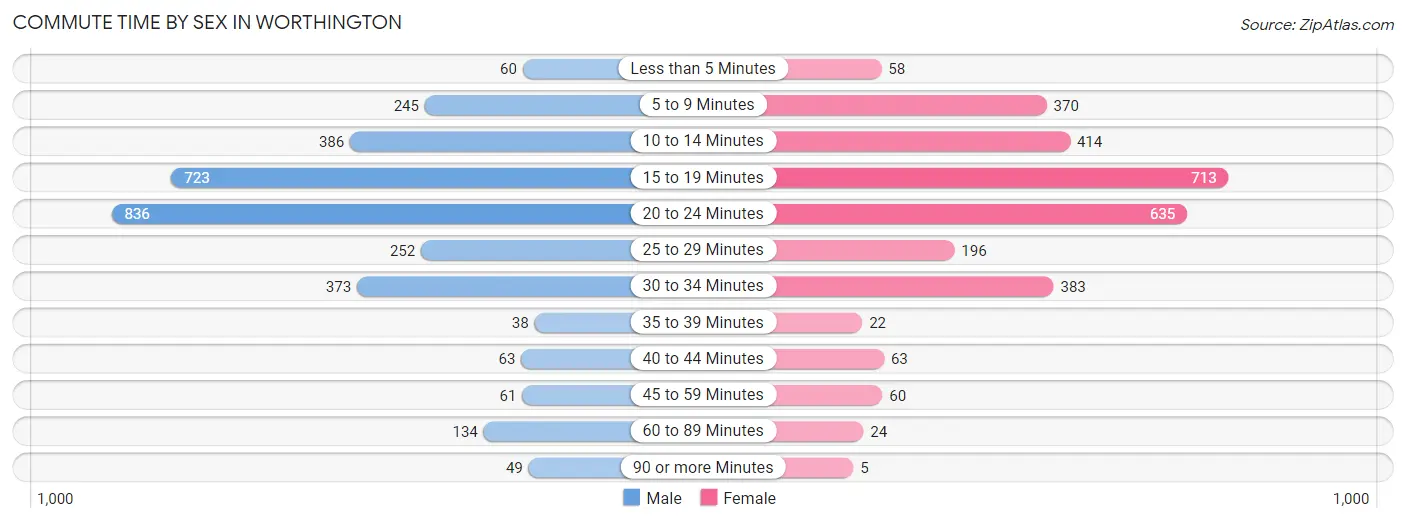
| Commute Time | Male | Female |
| Less than 5 Minutes | 60 (1.9%) | 58 (2.0%) |
| 5 to 9 Minutes | 245 (7.6%) | 370 (12.6%) |
| 10 to 14 Minutes | 386 (12.0%) | 414 (14.1%) |
| 15 to 19 Minutes | 723 (22.5%) | 713 (24.2%) |
| 20 to 24 Minutes | 836 (26.0%) | 635 (21.6%) |
| 25 to 29 Minutes | 252 (7.8%) | 196 (6.7%) |
| 30 to 34 Minutes | 373 (11.6%) | 383 (13.0%) |
| 35 to 39 Minutes | 38 (1.2%) | 22 (0.7%) |
| 40 to 44 Minutes | 63 (2.0%) | 63 (2.1%) |
| 45 to 59 Minutes | 61 (1.9%) | 60 (2.0%) |
| 60 to 89 Minutes | 134 (4.2%) | 24 (0.8%) |
| 90 or more Minutes | 49 (1.5%) | 5 (0.2%) |
Time of Departure to Work by Sex in Worthington
The most frequent times of departure to work in Worthington are 8:00 AM to 8:29 AM (720, 22.4%) for males and 7:30 AM to 7:59 AM (738, 25.1%) for females.
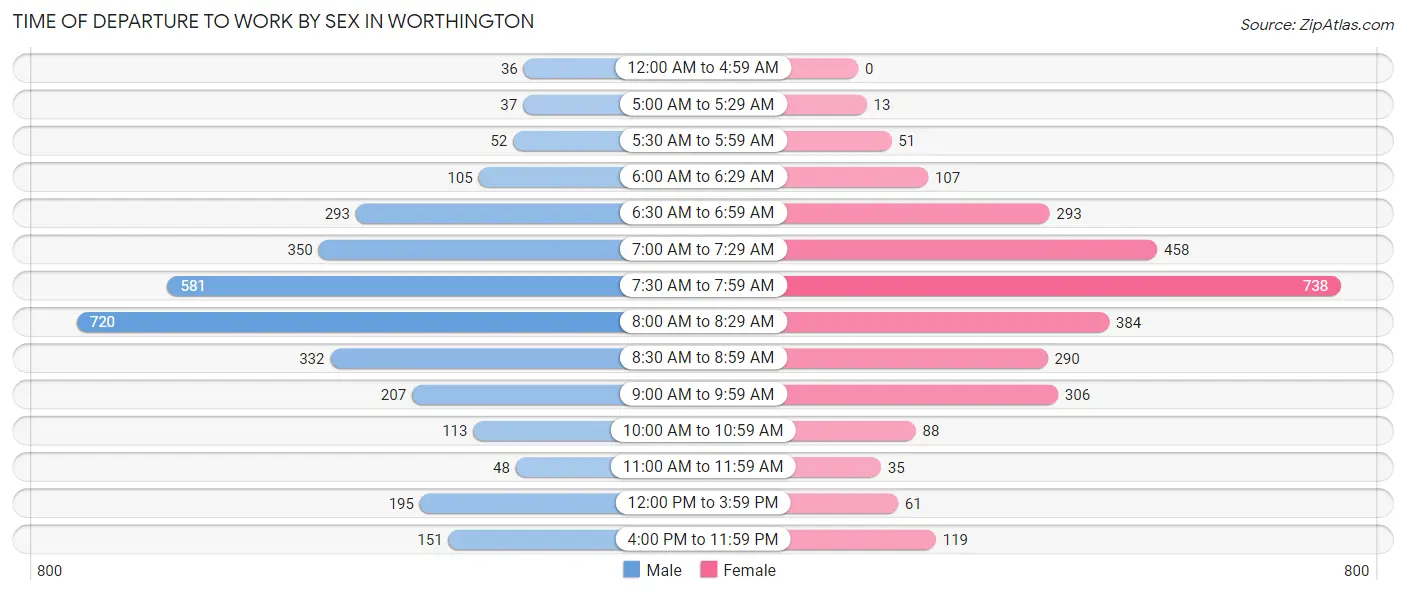
| Time of Departure | Male | Female |
| 12:00 AM to 4:59 AM | 36 (1.1%) | 0 (0.0%) |
| 5:00 AM to 5:29 AM | 37 (1.1%) | 13 (0.4%) |
| 5:30 AM to 5:59 AM | 52 (1.6%) | 51 (1.7%) |
| 6:00 AM to 6:29 AM | 105 (3.3%) | 107 (3.6%) |
| 6:30 AM to 6:59 AM | 293 (9.1%) | 293 (10.0%) |
| 7:00 AM to 7:29 AM | 350 (10.9%) | 458 (15.6%) |
| 7:30 AM to 7:59 AM | 581 (18.0%) | 738 (25.1%) |
| 8:00 AM to 8:29 AM | 720 (22.4%) | 384 (13.1%) |
| 8:30 AM to 8:59 AM | 332 (10.3%) | 290 (9.9%) |
| 9:00 AM to 9:59 AM | 207 (6.4%) | 306 (10.4%) |
| 10:00 AM to 10:59 AM | 113 (3.5%) | 88 (3.0%) |
| 11:00 AM to 11:59 AM | 48 (1.5%) | 35 (1.2%) |
| 12:00 PM to 3:59 PM | 195 (6.1%) | 61 (2.1%) |
| 4:00 PM to 11:59 PM | 151 (4.7%) | 119 (4.0%) |
| Total | 3,220 (100.0%) | 2,943 (100.0%) |
Housing Occupancy in Worthington
Occupancy by Ownership in Worthington
Of the total 6,034 dwellings in Worthington, owner-occupied units account for 4,936 (81.8%), while renter-occupied units make up 1,098 (18.2%).
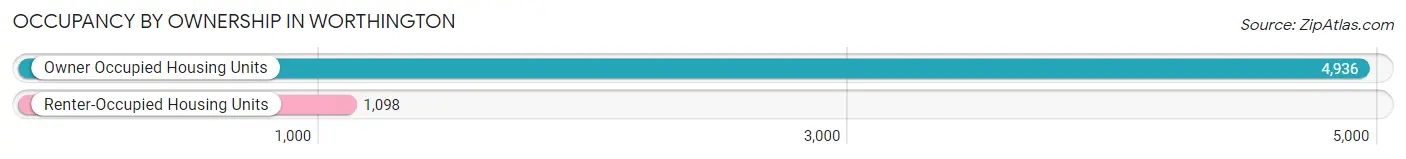
| Occupancy | # Housing Units | % Housing Units |
| Owner Occupied Housing Units | 4,936 | 81.8% |
| Renter-Occupied Housing Units | 1,098 | 18.2% |
| Total Occupied Housing Units | 6,034 | 100.0% |
Occupancy by Household Size in Worthington
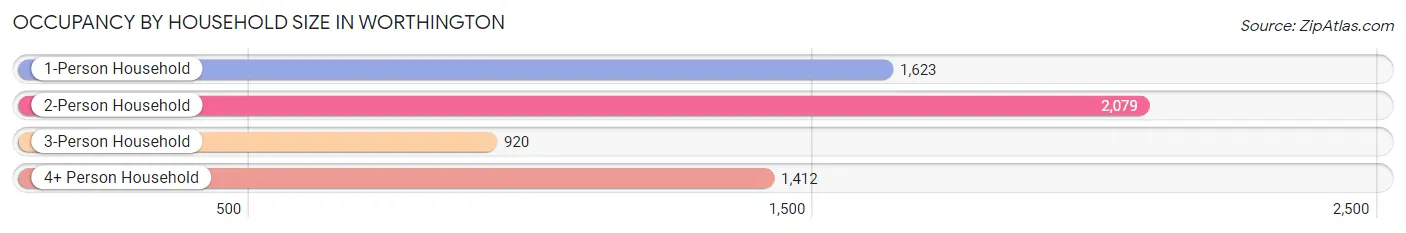
| Household Size | # Housing Units | % Housing Units |
| 1-Person Household | 1,623 | 26.9% |
| 2-Person Household | 2,079 | 34.4% |
| 3-Person Household | 920 | 15.2% |
| 4+ Person Household | 1,412 | 23.4% |
| Total Housing Units | 6,034 | 100.0% |
Occupancy by Ownership by Household Size in Worthington
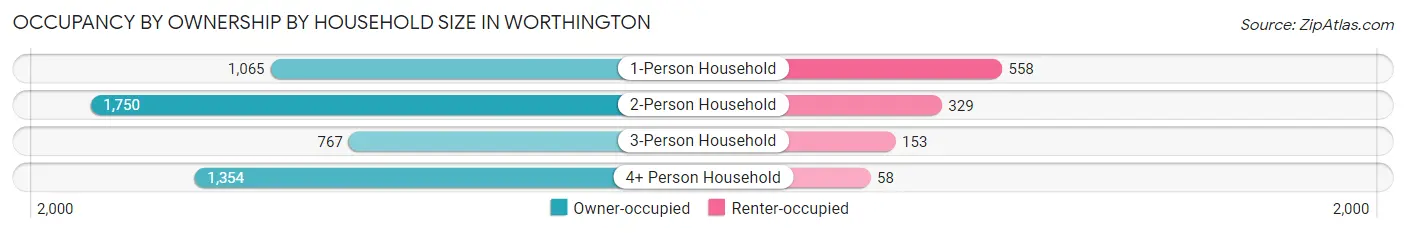
| Household Size | Owner-occupied | Renter-occupied |
| 1-Person Household | 1,065 (65.6%) | 558 (34.4%) |
| 2-Person Household | 1,750 (84.2%) | 329 (15.8%) |
| 3-Person Household | 767 (83.4%) | 153 (16.6%) |
| 4+ Person Household | 1,354 (95.9%) | 58 (4.1%) |
| Total Housing Units | 4,936 (81.8%) | 1,098 (18.2%) |
Occupancy by Educational Attainment in Worthington
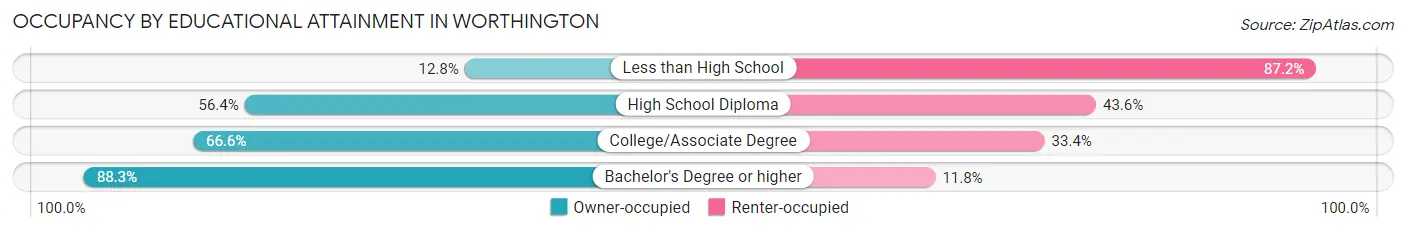
| Household Size | Owner-occupied | Renter-occupied |
| Less than High School | 6 (12.8%) | 41 (87.2%) |
| High School Diploma | 229 (56.4%) | 177 (43.6%) |
| College/Associate Degree | 690 (66.6%) | 346 (33.4%) |
| Bachelor's Degree or higher | 4,011 (88.2%) | 534 (11.7%) |
Occupancy by Age of Householder in Worthington
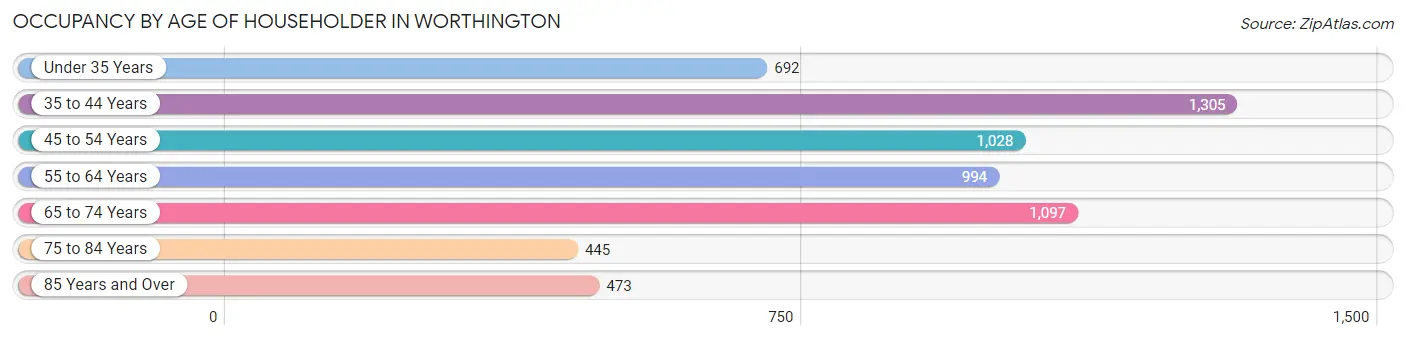
| Age Bracket | # Households | % Households |
| Under 35 Years | 692 | 11.5% |
| 35 to 44 Years | 1,305 | 21.6% |
| 45 to 54 Years | 1,028 | 17.0% |
| 55 to 64 Years | 994 | 16.5% |
| 65 to 74 Years | 1,097 | 18.2% |
| 75 to 84 Years | 445 | 7.4% |
| 85 Years and Over | 473 | 7.8% |
| Total | 6,034 | 100.0% |
Housing Finances in Worthington
Median Income by Occupancy in Worthington
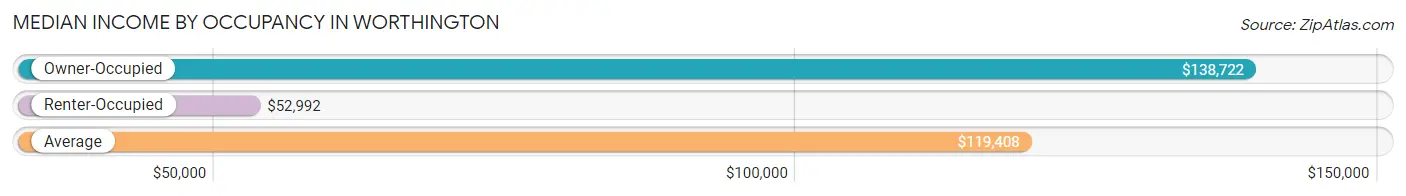
| Occupancy Type | # Households | Median Income |
| Owner-Occupied | 4,936 (81.8%) | $138,722 |
| Renter-Occupied | 1,098 (18.2%) | $52,992 |
| Average | 6,034 (100.0%) | $119,408 |
Occupancy by Householder Income Bracket in Worthington
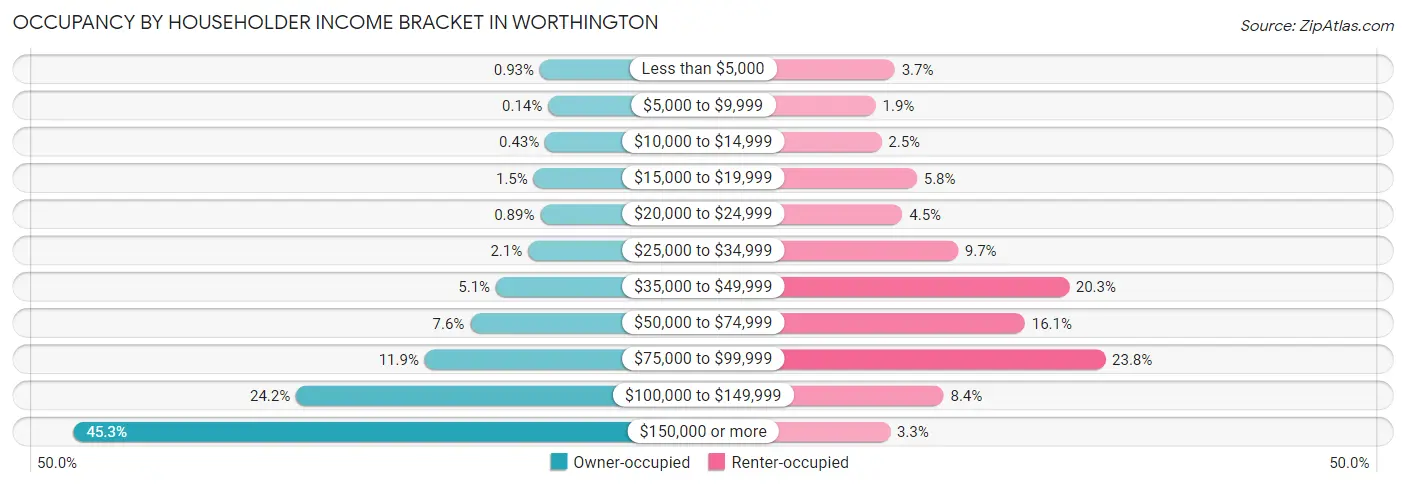
| Income Bracket | Owner-occupied | Renter-occupied |
| Less than $5,000 | 46 (0.9%) | 41 (3.7%) |
| $5,000 to $9,999 | 7 (0.1%) | 21 (1.9%) |
| $10,000 to $14,999 | 21 (0.4%) | 27 (2.5%) |
| $15,000 to $19,999 | 75 (1.5%) | 64 (5.8%) |
| $20,000 to $24,999 | 44 (0.9%) | 49 (4.5%) |
| $25,000 to $34,999 | 101 (2.1%) | 107 (9.7%) |
| $35,000 to $49,999 | 252 (5.1%) | 223 (20.3%) |
| $50,000 to $74,999 | 373 (7.6%) | 177 (16.1%) |
| $75,000 to $99,999 | 587 (11.9%) | 261 (23.8%) |
| $100,000 to $149,999 | 1,192 (24.1%) | 92 (8.4%) |
| $150,000 or more | 2,238 (45.3%) | 36 (3.3%) |
| Total | 4,936 (100.0%) | 1,098 (100.0%) |
Monthly Housing Cost Tiers in Worthington
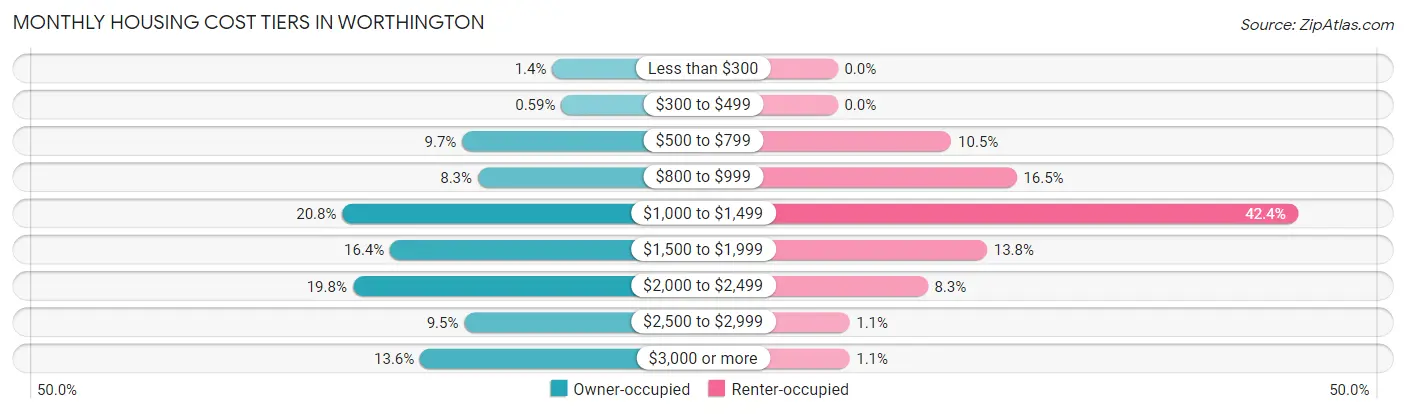
| Monthly Cost | Owner-occupied | Renter-occupied |
| Less than $300 | 70 (1.4%) | 0 (0.0%) |
| $300 to $499 | 29 (0.6%) | 0 (0.0%) |
| $500 to $799 | 480 (9.7%) | 115 (10.5%) |
| $800 to $999 | 408 (8.3%) | 181 (16.5%) |
| $1,000 to $1,499 | 1,024 (20.7%) | 465 (42.3%) |
| $1,500 to $1,999 | 807 (16.4%) | 151 (13.8%) |
| $2,000 to $2,499 | 977 (19.8%) | 91 (8.3%) |
| $2,500 to $2,999 | 470 (9.5%) | 12 (1.1%) |
| $3,000 or more | 671 (13.6%) | 12 (1.1%) |
| Total | 4,936 (100.0%) | 1,098 (100.0%) |
Physical Housing Characteristics in Worthington
Housing Structures in Worthington
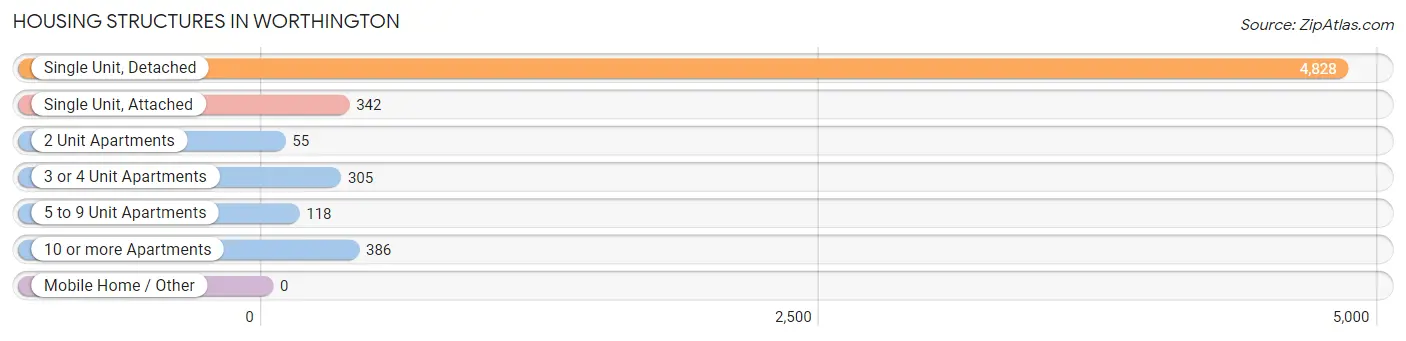
| Structure Type | # Housing Units | % Housing Units |
| Single Unit, Detached | 4,828 | 80.0% |
| Single Unit, Attached | 342 | 5.7% |
| 2 Unit Apartments | 55 | 0.9% |
| 3 or 4 Unit Apartments | 305 | 5.1% |
| 5 to 9 Unit Apartments | 118 | 2.0% |
| 10 or more Apartments | 386 | 6.4% |
| Mobile Home / Other | 0 | 0.0% |
| Total | 6,034 | 100.0% |
Housing Structures by Occupancy in Worthington
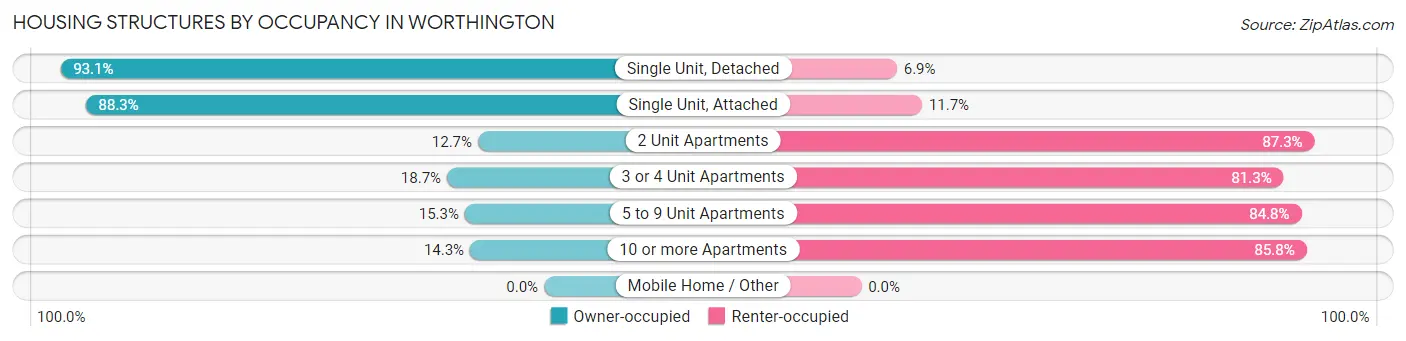
| Structure Type | Owner-occupied | Renter-occupied |
| Single Unit, Detached | 4,497 (93.1%) | 331 (6.9%) |
| Single Unit, Attached | 302 (88.3%) | 40 (11.7%) |
| 2 Unit Apartments | 7 (12.7%) | 48 (87.3%) |
| 3 or 4 Unit Apartments | 57 (18.7%) | 248 (81.3%) |
| 5 to 9 Unit Apartments | 18 (15.2%) | 100 (84.8%) |
| 10 or more Apartments | 55 (14.2%) | 331 (85.8%) |
| Mobile Home / Other | 0 (0.0%) | 0 (0.0%) |
| Total | 4,936 (81.8%) | 1,098 (18.2%) |
Housing Structures by Number of Rooms in Worthington
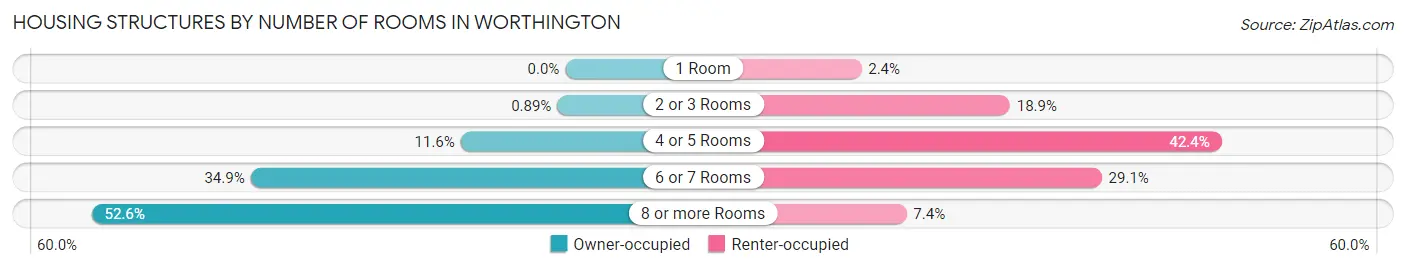
| Number of Rooms | Owner-occupied | Renter-occupied |
| 1 Room | 0 (0.0%) | 26 (2.4%) |
| 2 or 3 Rooms | 44 (0.9%) | 207 (18.9%) |
| 4 or 5 Rooms | 573 (11.6%) | 465 (42.3%) |
| 6 or 7 Rooms | 1,724 (34.9%) | 319 (29.0%) |
| 8 or more Rooms | 2,595 (52.6%) | 81 (7.4%) |
| Total | 4,936 (100.0%) | 1,098 (100.0%) |
Housing Structure by Heating Type in Worthington
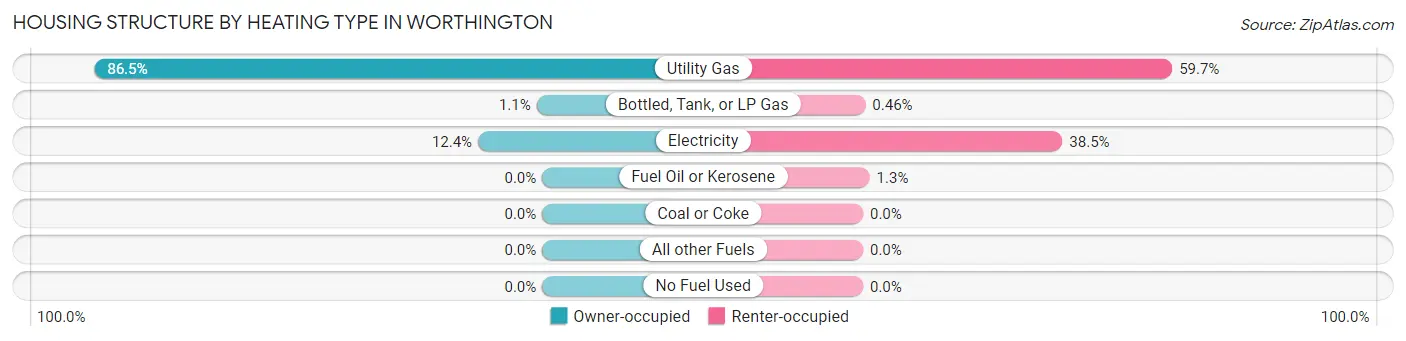
| Heating Type | Owner-occupied | Renter-occupied |
| Utility Gas | 4,271 (86.5%) | 656 (59.7%) |
| Bottled, Tank, or LP Gas | 53 (1.1%) | 5 (0.5%) |
| Electricity | 612 (12.4%) | 423 (38.5%) |
| Fuel Oil or Kerosene | 0 (0.0%) | 14 (1.3%) |
| Coal or Coke | 0 (0.0%) | 0 (0.0%) |
| All other Fuels | 0 (0.0%) | 0 (0.0%) |
| No Fuel Used | 0 (0.0%) | 0 (0.0%) |
| Total | 4,936 (100.0%) | 1,098 (100.0%) |
Household Vehicle Usage in Worthington
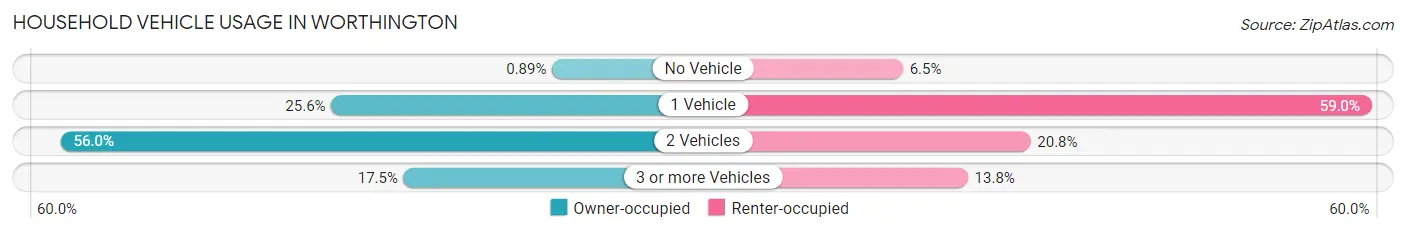
| Vehicles per Household | Owner-occupied | Renter-occupied |
| No Vehicle | 44 (0.9%) | 71 (6.5%) |
| 1 Vehicle | 1,265 (25.6%) | 648 (59.0%) |
| 2 Vehicles | 2,762 (56.0%) | 228 (20.8%) |
| 3 or more Vehicles | 865 (17.5%) | 151 (13.8%) |
| Total | 4,936 (100.0%) | 1,098 (100.0%) |
Real Estate & Mortgages in Worthington
Real Estate and Mortgage Overview in Worthington
| Characteristic | Without Mortgage | With Mortgage |
| Housing Units | 1,790 | 3,146 |
| Median Property Value | $356,800 | $389,900 |
| Median Household Income | $115,313 | $1,741 |
| Monthly Housing Costs | $979 | $671 |
| Real Estate Taxes | $7,050 | $0 |
Property Value by Mortgage Status in Worthington
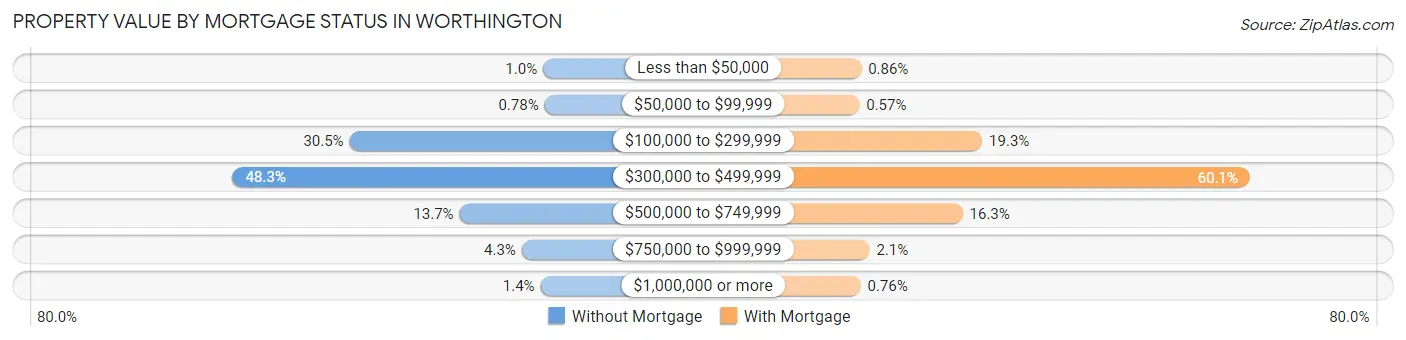
| Property Value | Without Mortgage | With Mortgage |
| Less than $50,000 | 18 (1.0%) | 27 (0.9%) |
| $50,000 to $99,999 | 14 (0.8%) | 18 (0.6%) |
| $100,000 to $299,999 | 546 (30.5%) | 607 (19.3%) |
| $300,000 to $499,999 | 865 (48.3%) | 1,890 (60.1%) |
| $500,000 to $749,999 | 246 (13.7%) | 513 (16.3%) |
| $750,000 to $999,999 | 76 (4.3%) | 67 (2.1%) |
| $1,000,000 or more | 25 (1.4%) | 24 (0.8%) |
| Total | 1,790 (100.0%) | 3,146 (100.0%) |
Household Income by Mortgage Status in Worthington
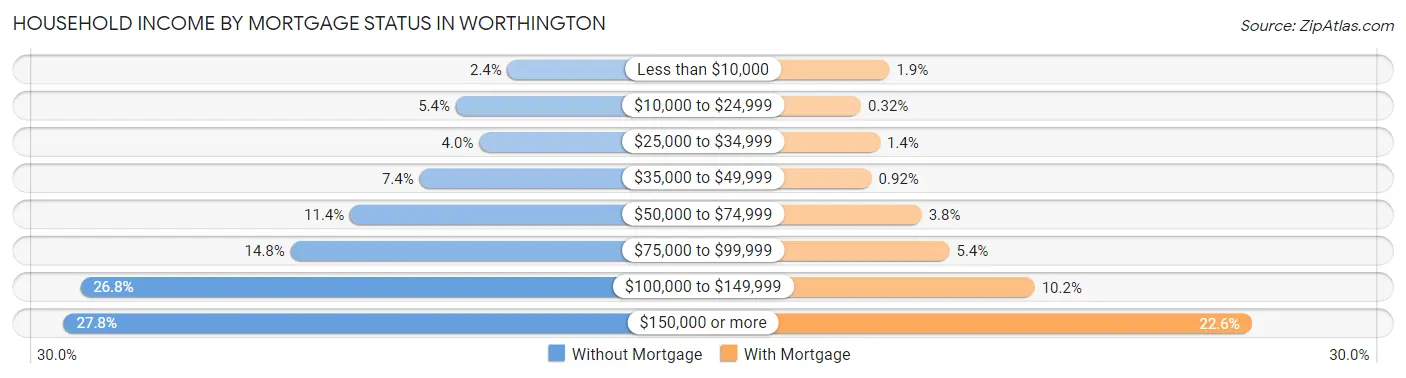
| Household Income | Without Mortgage | With Mortgage |
| Less than $10,000 | 43 (2.4%) | 61 (1.9%) |
| $10,000 to $24,999 | 96 (5.4%) | 10 (0.3%) |
| $25,000 to $34,999 | 72 (4.0%) | 44 (1.4%) |
| $35,000 to $49,999 | 133 (7.4%) | 29 (0.9%) |
| $50,000 to $74,999 | 204 (11.4%) | 119 (3.8%) |
| $75,000 to $99,999 | 265 (14.8%) | 169 (5.4%) |
| $100,000 to $149,999 | 480 (26.8%) | 322 (10.2%) |
| $150,000 or more | 497 (27.8%) | 712 (22.6%) |
| Total | 1,790 (100.0%) | 3,146 (100.0%) |
Property Value to Household Income Ratio in Worthington
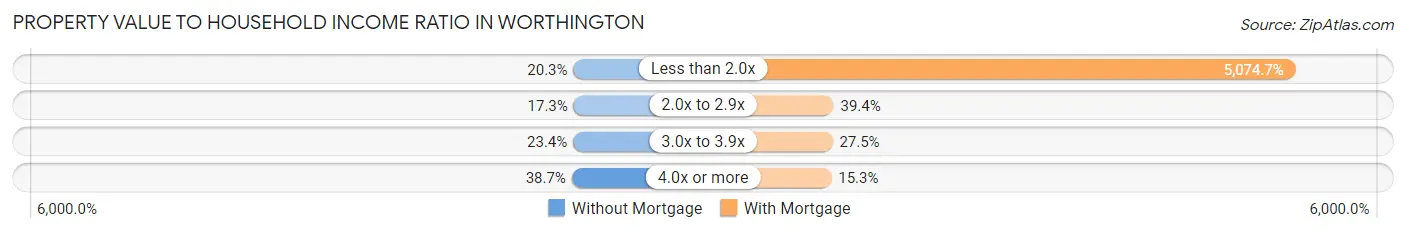
| Value-to-Income Ratio | Without Mortgage | With Mortgage |
| Less than 2.0x | 364 (20.3%) | 159,650 (5,074.7%) |
| 2.0x to 2.9x | 309 (17.3%) | 1,239 (39.4%) |
| 3.0x to 3.9x | 418 (23.4%) | 864 (27.5%) |
| 4.0x or more | 693 (38.7%) | 480 (15.3%) |
| Total | 1,790 (100.0%) | 3,146 (100.0%) |
Real Estate Taxes by Mortgage Status in Worthington
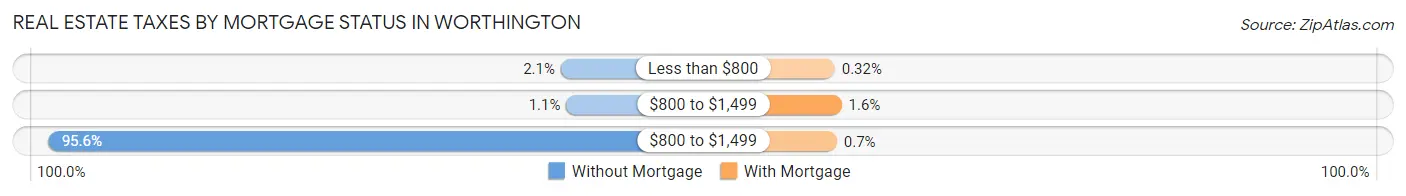
| Property Taxes | Without Mortgage | With Mortgage |
| Less than $800 | 37 (2.1%) | 10 (0.3%) |
| $800 to $1,499 | 19 (1.1%) | 49 (1.6%) |
| $800 to $1,499 | 1,711 (95.6%) | 22 (0.7%) |
| Total | 1,790 (100.0%) | 3,146 (100.0%) |
Health & Disability in Worthington
Health Insurance Coverage by Age in Worthington
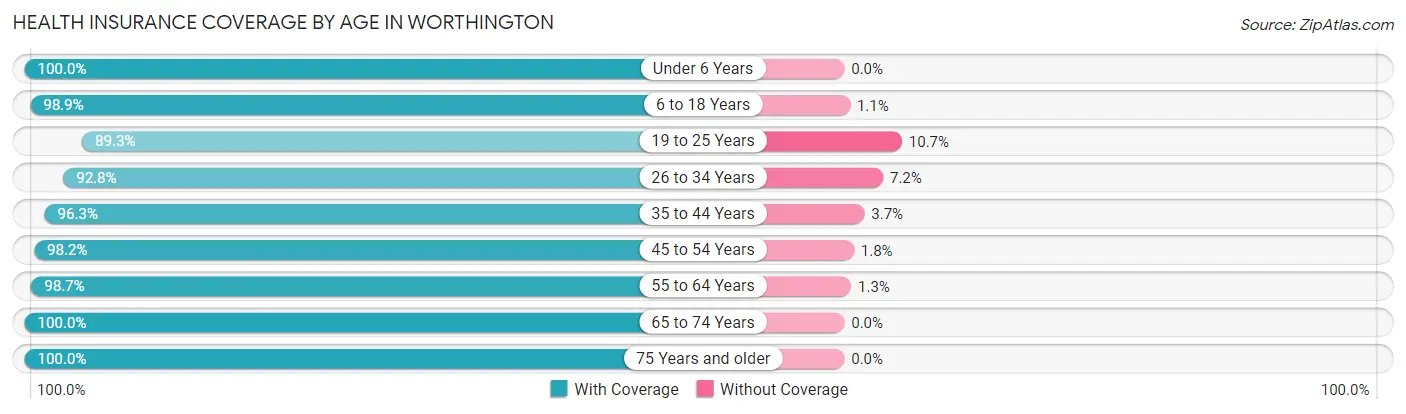
| Age Bracket | With Coverage | Without Coverage |
| Under 6 Years | 1,402 (100.0%) | 0 (0.0%) |
| 6 to 18 Years | 2,429 (98.9%) | 26 (1.1%) |
| 19 to 25 Years | 457 (89.3%) | 55 (10.7%) |
| 26 to 34 Years | 1,376 (92.8%) | 107 (7.2%) |
| 35 to 44 Years | 2,473 (96.3%) | 96 (3.7%) |
| 45 to 54 Years | 1,770 (98.2%) | 32 (1.8%) |
| 55 to 64 Years | 1,560 (98.7%) | 20 (1.3%) |
| 65 to 74 Years | 1,717 (100.0%) | 0 (0.0%) |
| 75 Years and older | 1,238 (100.0%) | 0 (0.0%) |
| Total | 14,422 (97.7%) | 336 (2.3%) |
Health Insurance Coverage by Citizenship Status in Worthington
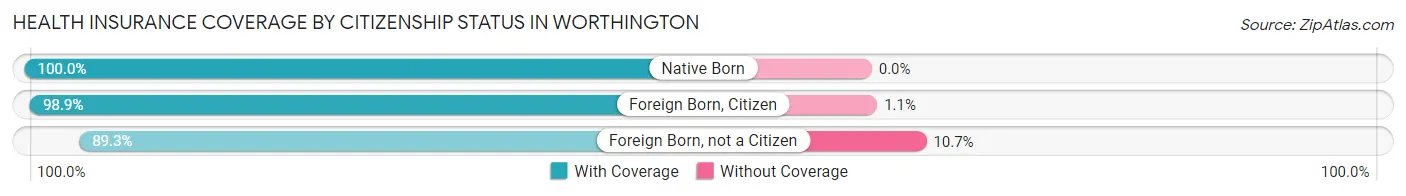
| Citizenship Status | With Coverage | Without Coverage |
| Native Born | 1,402 (100.0%) | 0 (0.0%) |
| Foreign Born, Citizen | 2,429 (98.9%) | 26 (1.1%) |
| Foreign Born, not a Citizen | 457 (89.3%) | 55 (10.7%) |
Health Insurance Coverage by Household Income in Worthington
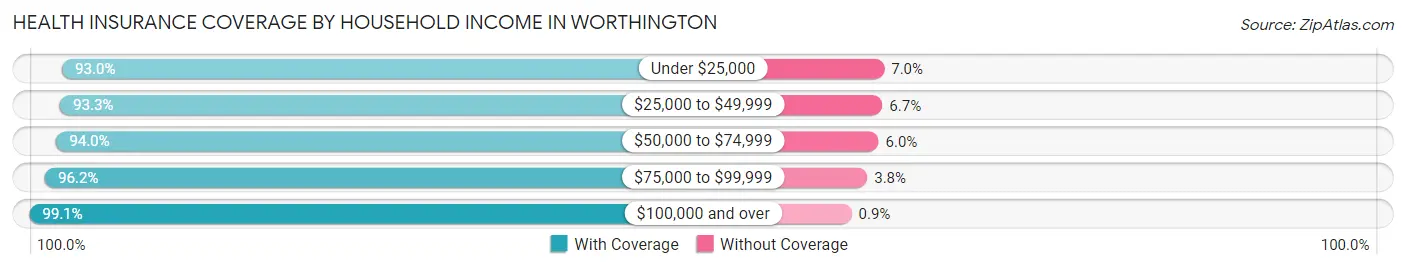
| Household Income | With Coverage | Without Coverage |
| Under $25,000 | 477 (93.0%) | 36 (7.0%) |
| $25,000 to $49,999 | 966 (93.3%) | 69 (6.7%) |
| $50,000 to $74,999 | 1,010 (94.0%) | 64 (6.0%) |
| $75,000 to $99,999 | 1,879 (96.2%) | 75 (3.8%) |
| $100,000 and over | 10,087 (99.1%) | 92 (0.9%) |
Public vs Private Health Insurance Coverage by Age in Worthington
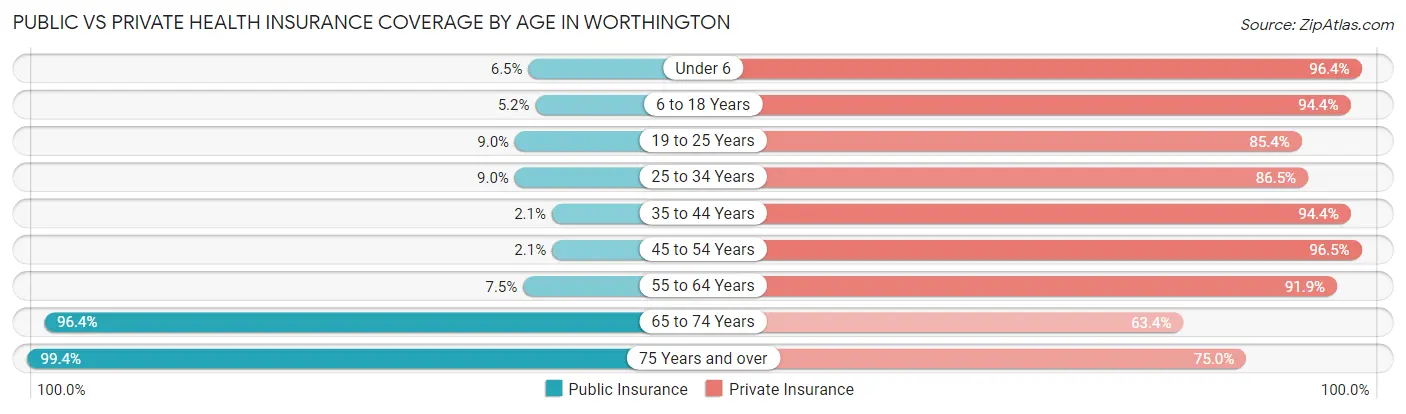
| Age Bracket | Public Insurance | Private Insurance |
| Under 6 | 91 (6.5%) | 1,352 (96.4%) |
| 6 to 18 Years | 128 (5.2%) | 2,317 (94.4%) |
| 19 to 25 Years | 46 (9.0%) | 437 (85.4%) |
| 25 to 34 Years | 134 (9.0%) | 1,283 (86.5%) |
| 35 to 44 Years | 55 (2.1%) | 2,426 (94.4%) |
| 45 to 54 Years | 38 (2.1%) | 1,738 (96.5%) |
| 55 to 64 Years | 118 (7.5%) | 1,452 (91.9%) |
| 65 to 74 Years | 1,655 (96.4%) | 1,088 (63.4%) |
| 75 Years and over | 1,231 (99.4%) | 929 (75.0%) |
| Total | 3,496 (23.7%) | 13,022 (88.2%) |
Disability Status by Sex by Age in Worthington
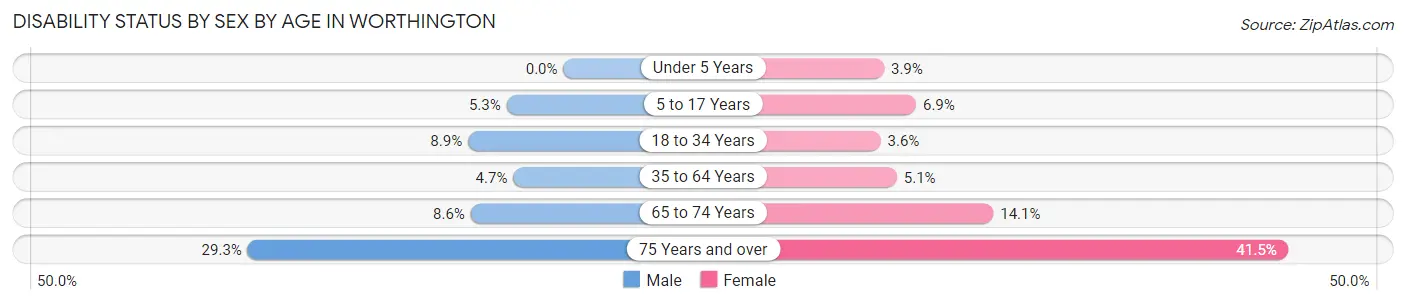
| Age Bracket | Male | Female |
| Under 5 Years | 0 (0.0%) | 24 (3.9%) |
| 5 to 17 Years | 61 (5.3%) | 105 (6.9%) |
| 18 to 34 Years | 90 (8.8%) | 37 (3.6%) |
| 35 to 64 Years | 132 (4.6%) | 159 (5.1%) |
| 65 to 74 Years | 70 (8.6%) | 127 (14.1%) |
| 75 Years and over | 172 (29.3%) | 270 (41.5%) |
Disability Class by Sex by Age in Worthington
Disability Class: Hearing Difficulty
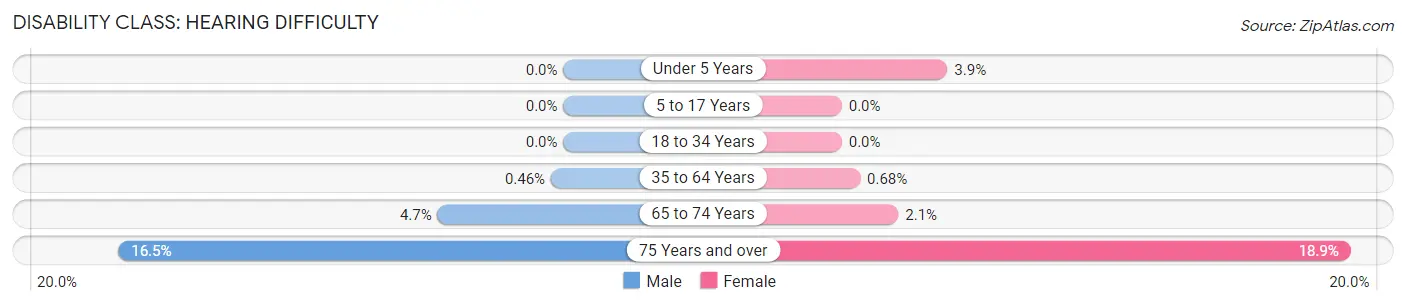
| Age Bracket | Male | Female |
| Under 5 Years | 0 (0.0%) | 24 (3.9%) |
| 5 to 17 Years | 0 (0.0%) | 0 (0.0%) |
| 18 to 34 Years | 0 (0.0%) | 0 (0.0%) |
| 35 to 64 Years | 13 (0.5%) | 21 (0.7%) |
| 65 to 74 Years | 38 (4.7%) | 19 (2.1%) |
| 75 Years and over | 97 (16.5%) | 123 (18.9%) |
Disability Class: Vision Difficulty
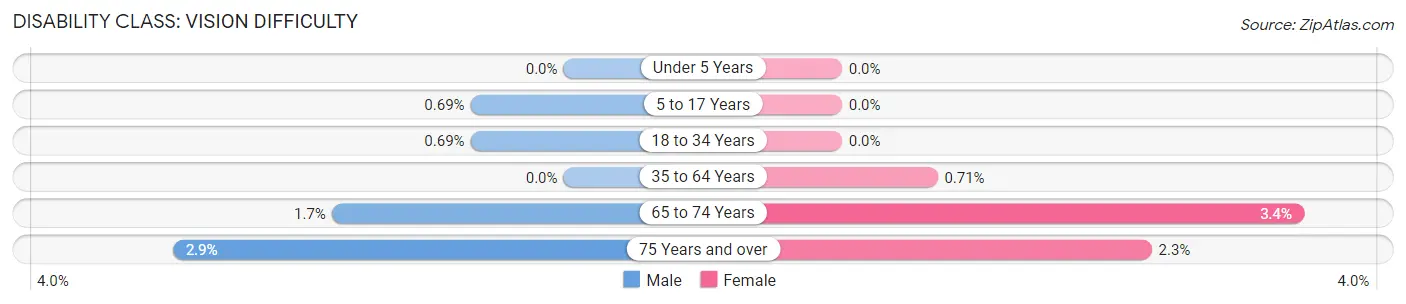
| Age Bracket | Male | Female |
| Under 5 Years | 0 (0.0%) | 0 (0.0%) |
| 5 to 17 Years | 8 (0.7%) | 0 (0.0%) |
| 18 to 34 Years | 7 (0.7%) | 0 (0.0%) |
| 35 to 64 Years | 0 (0.0%) | 22 (0.7%) |
| 65 to 74 Years | 14 (1.7%) | 31 (3.4%) |
| 75 Years and over | 17 (2.9%) | 15 (2.3%) |
Disability Class: Cognitive Difficulty
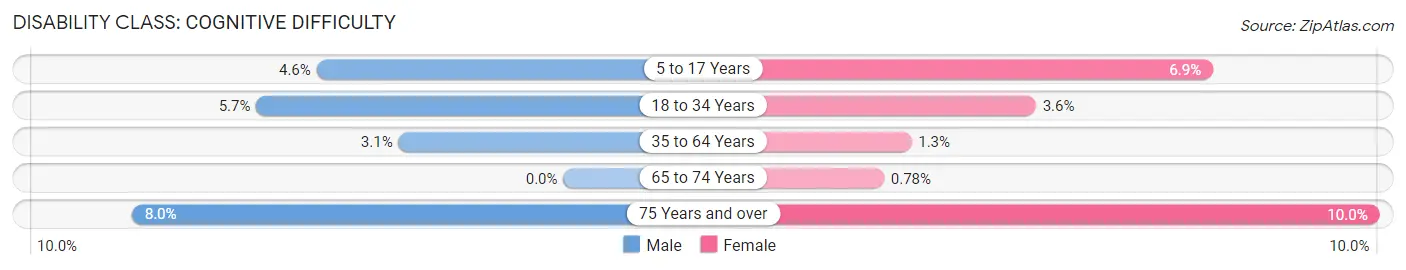
| Age Bracket | Male | Female |
| 5 to 17 Years | 53 (4.6%) | 105 (6.9%) |
| 18 to 34 Years | 58 (5.7%) | 37 (3.6%) |
| 35 to 64 Years | 87 (3.1%) | 40 (1.3%) |
| 65 to 74 Years | 0 (0.0%) | 7 (0.8%) |
| 75 Years and over | 47 (8.0%) | 65 (10.0%) |
Disability Class: Ambulatory Difficulty
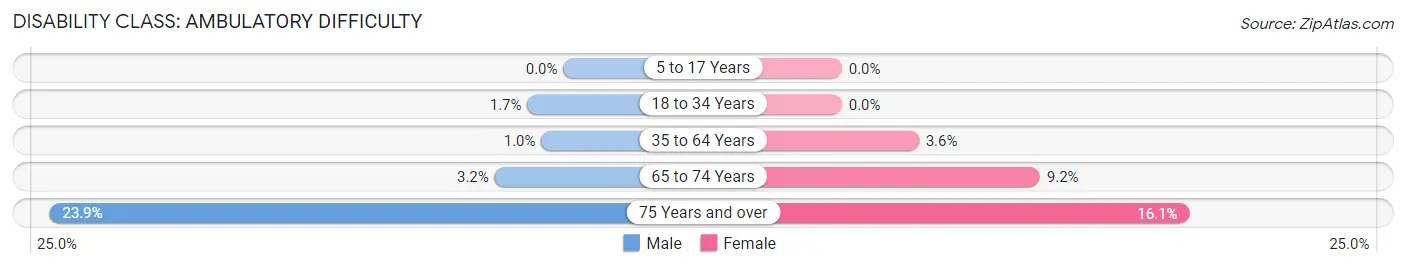
| Age Bracket | Male | Female |
| 5 to 17 Years | 0 (0.0%) | 0 (0.0%) |
| 18 to 34 Years | 17 (1.7%) | 0 (0.0%) |
| 35 to 64 Years | 29 (1.0%) | 111 (3.6%) |
| 65 to 74 Years | 26 (3.2%) | 83 (9.2%) |
| 75 Years and over | 140 (23.8%) | 105 (16.1%) |
Disability Class: Self-Care Difficulty
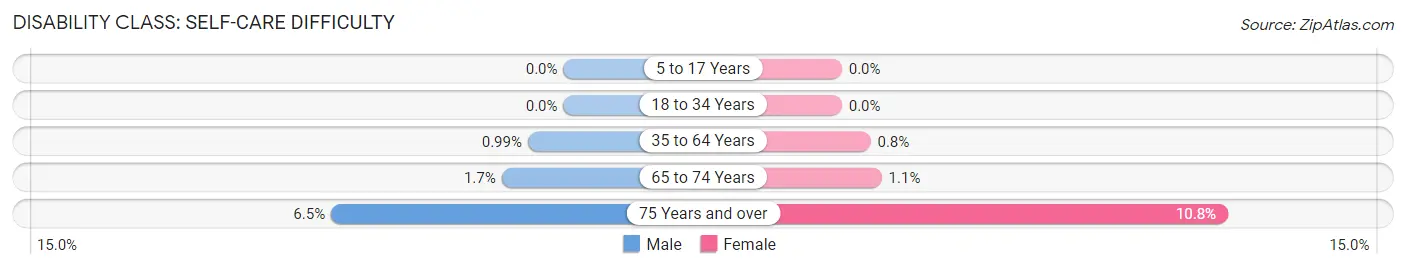
| Age Bracket | Male | Female |
| 5 to 17 Years | 0 (0.0%) | 0 (0.0%) |
| 18 to 34 Years | 0 (0.0%) | 0 (0.0%) |
| 35 to 64 Years | 28 (1.0%) | 25 (0.8%) |
| 65 to 74 Years | 14 (1.7%) | 10 (1.1%) |
| 75 Years and over | 38 (6.5%) | 70 (10.7%) |
Technology Access in Worthington
Computing Device Access in Worthington
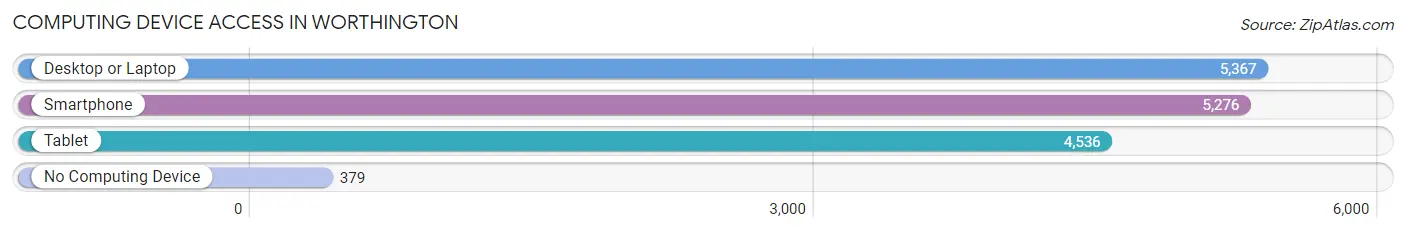
| Device Type | # Households | % Households |
| Desktop or Laptop | 5,367 | 88.9% |
| Smartphone | 5,276 | 87.4% |
| Tablet | 4,536 | 75.2% |
| No Computing Device | 379 | 6.3% |
| Total | 6,034 | 100.0% |
Internet Access in Worthington
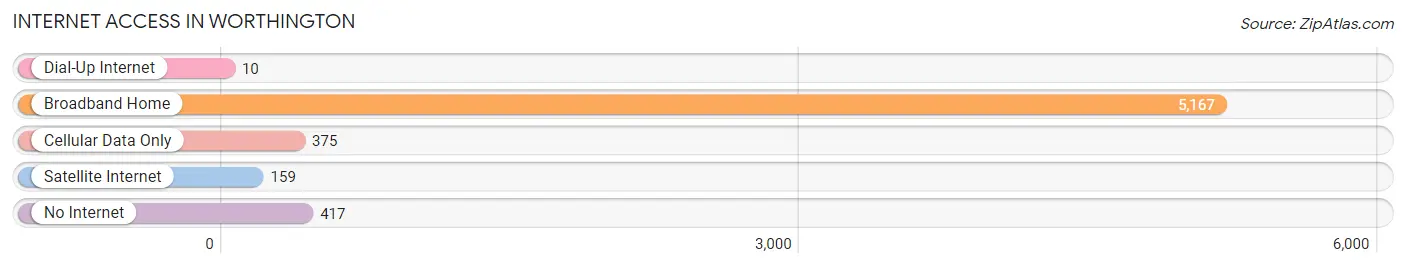
| Internet Type | # Households | % Households |
| Dial-Up Internet | 10 | 0.2% |
| Broadband Home | 5,167 | 85.6% |
| Cellular Data Only | 375 | 6.2% |
| Satellite Internet | 159 | 2.6% |
| No Internet | 417 | 6.9% |
| Total | 6,034 | 100.0% |
Worthington Summary
Worthington, Ohio is a city located in Franklin County, Ohio, United States. It is a suburb of Columbus, the state capital and largest city in Ohio. The population of Worthington was 13,575 at the 2010 census.
History
Worthington was founded in 1803 by James Kilbourne, a surveyor and Revolutionary War veteran. Kilbourne purchased land from the United States government and laid out the town of Worthington. The town was named after Thomas Worthington, the sixth governor of Ohio.
In 1811, Worthington was incorporated as a village. The village grew slowly until the arrival of the railroad in 1851. The railroad brought new industry and growth to the area, and by 1875, the population had grown to 1,500.
In the late 19th century, Worthington became a popular summer resort for wealthy Columbus residents. The town was home to several large resorts, including the Worthington Inn, which was built in 1876.
Geography
Worthington is located at 40°7′25″N 83°2′17″W (40.123611, -83.038194). According to the United States Census Bureau, the city has a total area of 4.45 square miles (11.54 km2), all land.
Economy
Worthington is home to several large employers, including Nationwide Insurance, Cardinal Health, and the Ohio State University. The city is also home to several small businesses, including restaurants, retail stores, and professional services.
Demographics
As of the 2010 census, there were 13,575 people, 5,845 households, and 3,541 families residing in the city. The population density was 3,039.2 people per square mile (1,174.2/km2). There were 6,093 housing units at an average density of 1,366.3 per square mile (528.2/km2). The racial makeup of the city was 87.2% White, 5.3% African American, 0.2% Native American, 4.7% Asian, 0.7% from other races, and 1.9% from two or more races. Hispanic or Latino of any race were 2.3% of the population.
There were 5,845 households, out of which 28.2% had children under the age of 18 living with them, 48.2% were married couples living together, 9.7% had a female householder with no husband present, and 38.7% were non-families. 32.2% of all households were made up of individuals, and 11.2% had someone living alone who was 65 years of age or older. The average household size was 2.30 and the average family size was 2.94.
In the city, the population was spread out, with 22.7% under the age of 18, 8.2% from 18 to 24, 28.2% from 25 to 44, 25.3% from 45 to 64, and 15.6% who were 65 years of age or older. The median age was 38.7 years. For every 100 females, there were 91.2 males. For every 100 females age 18 and over, there were 88.2 males.
The median income for a household in the city was $62,917, and the median income for a family was $80,890. Males had a median income of $56,945 versus $41,945 for females. The per capita income for the city was $35,945. About 4.2% of families and 6.2% of the population were below the poverty line, including 8.2% of those under age 18 and 4.2% of those age 65 or over.
Common Questions
What is Per Capita Income in Worthington?
Per Capita income in Worthington is $65,990.
What is the Median Family Income in Worthington?
Median Family Income in Worthington is $147,880.
What is the Median Household income in Worthington?
Median Household Income in Worthington is $119,408.
What is Income or Wage Gap in Worthington?
Income or Wage Gap in Worthington is 24.9%.
Women in Worthington earn 75.1 cents for every dollar earned by a man.
What is Inequality or Gini Index in Worthington?
Inequality or Gini Index in Worthington is 0.45.
What is the Total Population of Worthington?
Total Population of Worthington is 14,997.
What is the Total Male Population of Worthington?
Total Male Population of Worthington is 7,001.
What is the Total Female Population of Worthington?
Total Female Population of Worthington is 7,996.
What is the Ratio of Males per 100 Females in Worthington?
There are 87.56 Males per 100 Females in Worthington.
What is the Ratio of Females per 100 Males in Worthington?
There are 114.21 Females per 100 Males in Worthington.
What is the Median Population Age in Worthington?
Median Population Age in Worthington is 40.9 Years.
What is the Average Family Size in Worthington
Average Family Size in Worthington is 3.0 People.
What is the Average Household Size in Worthington
Average Household Size in Worthington is 2.5 People.
How Large is the Labor Force in Worthington?
There are 7,643 People in the Labor Forcein in Worthington.
What is the Percentage of People in the Labor Force in Worthington?
66.4% of People are in the Labor Force in Worthington.
What is the Unemployment Rate in Worthington?
Unemployment Rate in Worthington is 3.6%.