Sixteen Mile Stand, OH Map & Demographics
Sixteen Mile Stand Map
Sixteen Mile Stand Overview
$63,270
PER CAPITA INCOME
$182,026
AVG FAMILY INCOME
$117,377
AVG HOUSEHOLD INCOME
52.3%
WAGE / INCOME GAP [ % ]
47.7¢/ $1
WAGE / INCOME GAP [ $ ]
0.41
INEQUALITY / GINI INDEX
3,677
TOTAL POPULATION
1,786
MALE POPULATION
1,891
FEMALE POPULATION
94.45
MALES / 100 FEMALES
105.88
FEMALES / 100 MALES
39.7
MEDIAN AGE
3.2
AVG FAMILY SIZE
2.6
AVG HOUSEHOLD SIZE
2,207
LABOR FORCE [ PEOPLE ]
77.4%
PERCENT IN LABOR FORCE
2.1%
UNEMPLOYMENT RATE
Income in Sixteen Mile Stand
Income Overview in Sixteen Mile Stand
Per Capita Income in Sixteen Mile Stand is $63,270, while median incomes of families and households are $182,026 and $117,377 respectively.
| Characteristic | Number | Measure |
| Per Capita Income | 3,677 | $63,270 |
| Median Family Income | 975 | $182,026 |
| Mean Family Income | 975 | $200,114 |
| Median Household Income | 1,389 | $117,377 |
| Mean Household Income | 1,389 | $160,500 |
| Income Deficit | 975 | $0 |
| Wage / Income Gap (%) | 3,677 | 52.28% |
| Wage / Income Gap ($) | 3,677 | 47.72¢ per $1 |
| Gini / Inequality Index | 3,677 | 0.41 |
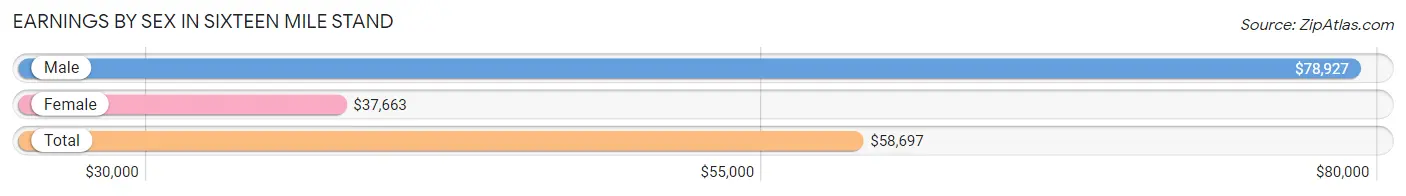
Earnings by Sex in Sixteen Mile Stand
Average Earnings in Sixteen Mile Stand are $58,697, $78,927 for men and $37,663 for women, a difference of 52.3%.
| Sex | Number | Average Earnings |
| Male | 1,172 (51.6%) | $78,927 |
| Female | 1,097 (48.3%) | $37,663 |
| Total | 2,269 (100.0%) | $58,697 |
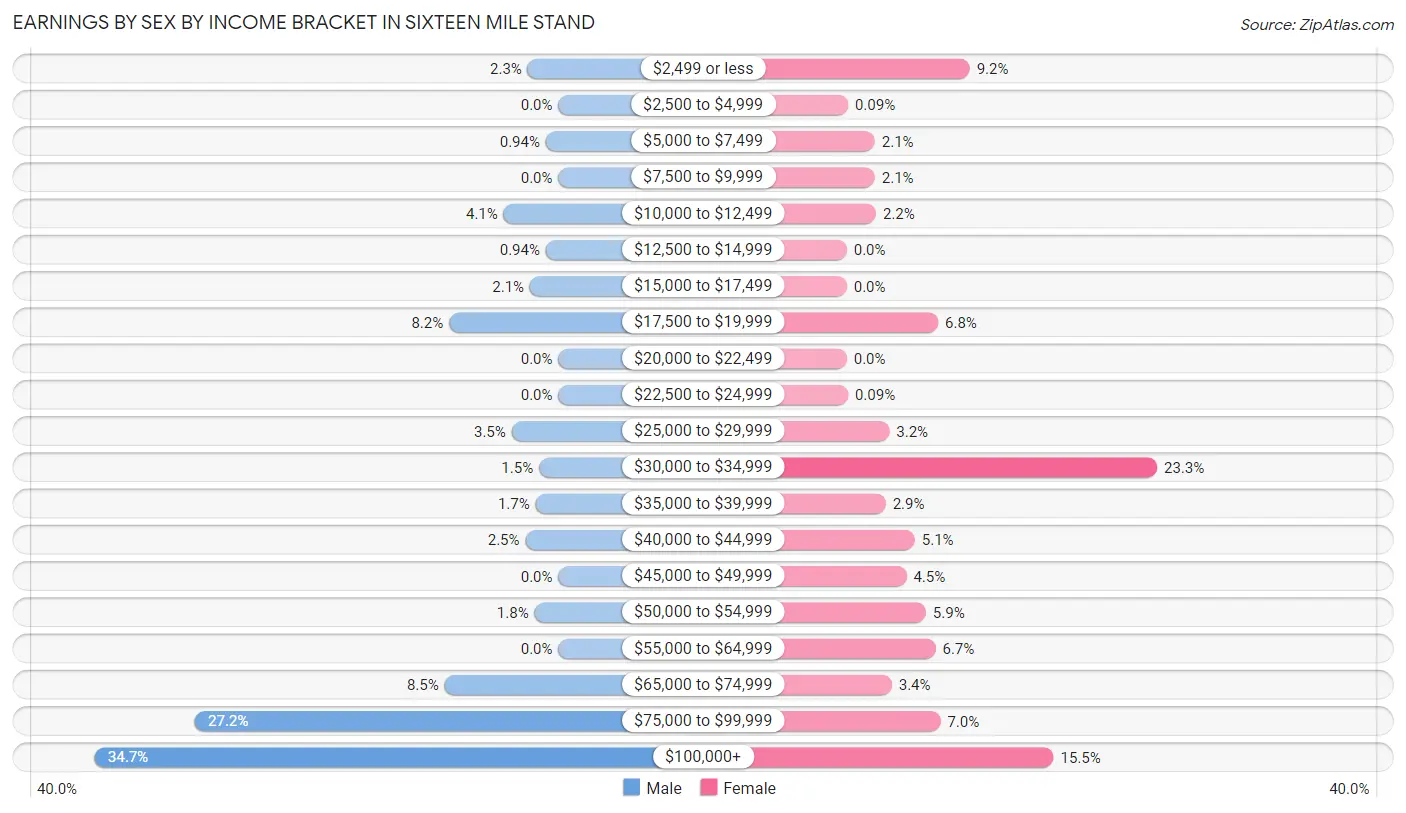
Earnings by Sex by Income Bracket in Sixteen Mile Stand
The most common earnings brackets in Sixteen Mile Stand are $100,000+ for men (407 | 34.7%) and $30,000 to $34,999 for women (255 | 23.3%).
| Income | Male | Female |
| $2,499 or less | 27 (2.3%) | 101 (9.2%) |
| $2,500 to $4,999 | 0 (0.0%) | 1 (0.1%) |
| $5,000 to $7,499 | 11 (0.9%) | 23 (2.1%) |
| $7,500 to $9,999 | 0 (0.0%) | 23 (2.1%) |
| $10,000 to $12,499 | 48 (4.1%) | 24 (2.2%) |
| $12,500 to $14,999 | 11 (0.9%) | 0 (0.0%) |
| $15,000 to $17,499 | 25 (2.1%) | 0 (0.0%) |
| $17,500 to $19,999 | 96 (8.2%) | 75 (6.8%) |
| $20,000 to $22,499 | 0 (0.0%) | 0 (0.0%) |
| $22,500 to $24,999 | 0 (0.0%) | 1 (0.1%) |
| $25,000 to $29,999 | 41 (3.5%) | 35 (3.2%) |
| $30,000 to $34,999 | 17 (1.5%) | 255 (23.3%) |
| $35,000 to $39,999 | 20 (1.7%) | 32 (2.9%) |
| $40,000 to $44,999 | 29 (2.5%) | 56 (5.1%) |
| $45,000 to $49,999 | 0 (0.0%) | 49 (4.5%) |
| $50,000 to $54,999 | 21 (1.8%) | 65 (5.9%) |
| $55,000 to $64,999 | 0 (0.0%) | 73 (6.7%) |
| $65,000 to $74,999 | 100 (8.5%) | 37 (3.4%) |
| $75,000 to $99,999 | 319 (27.2%) | 77 (7.0%) |
| $100,000+ | 407 (34.7%) | 170 (15.5%) |
| Total | 1,172 (100.0%) | 1,097 (100.0%) |
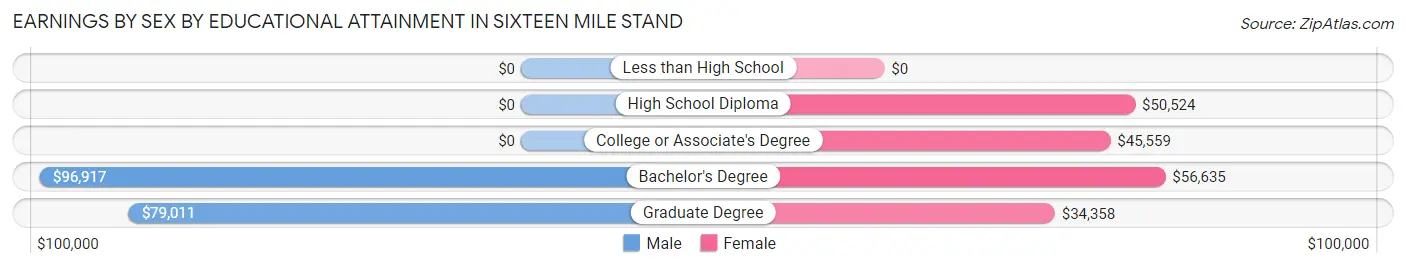
Earnings by Sex by Educational Attainment in Sixteen Mile Stand
Average earnings in Sixteen Mile Stand are $79,576 for men and $43,472 for women, a difference of 45.4%. Men with an educational attainment of bachelor's degree enjoy the highest average annual earnings of $96,917, while those with graduate degree education earn the least with $79,011. Women with an educational attainment of bachelor's degree earn the most with the average annual earnings of $56,635, while those with graduate degree education have the smallest earnings of $34,358.
| Educational Attainment | Male Income | Female Income |
| Less than High School | - | - |
| High School Diploma | - | - |
| College or Associate's Degree | - | - |
| Bachelor's Degree | $96,917 | $56,635 |
| Graduate Degree | $79,011 | $34,358 |
| Total | $79,576 | $43,472 |
Family Income in Sixteen Mile Stand
Family Income Brackets in Sixteen Mile Stand
According to the Sixteen Mile Stand family income data, there are 482 families falling into the $200,000+ income range, which is the most common income bracket and makes up 49.4% of all families.
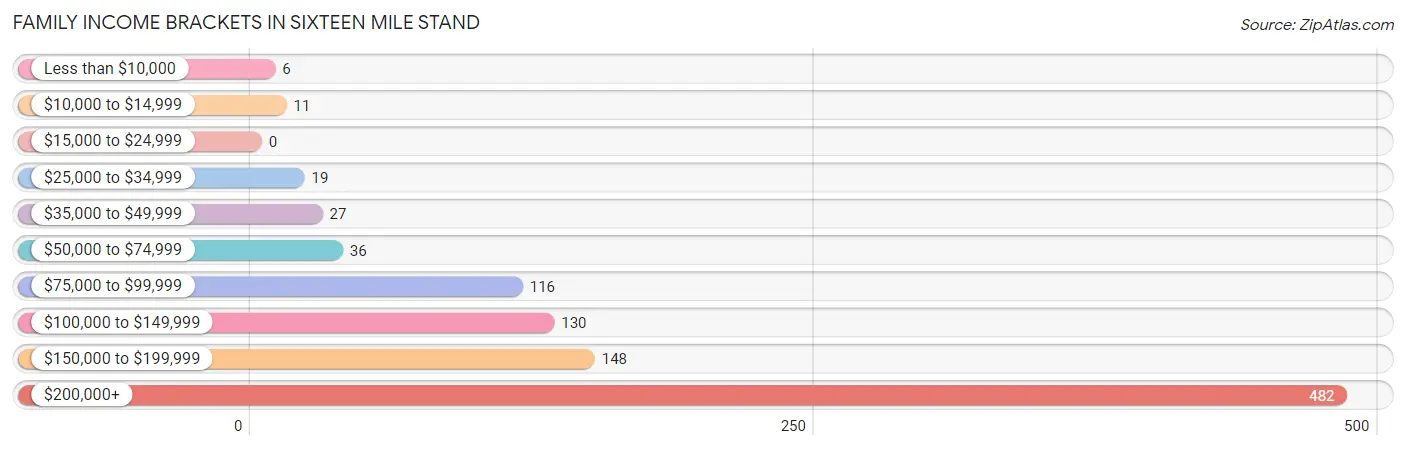
| Income Bracket | # Families | % Families |
| Less than $10,000 | 6 | 0.6% |
| $10,000 to $14,999 | 11 | 1.1% |
| $15,000 to $24,999 | 0 | 0.0% |
| $25,000 to $34,999 | 19 | 1.9% |
| $35,000 to $49,999 | 27 | 2.8% |
| $50,000 to $74,999 | 36 | 3.7% |
| $75,000 to $99,999 | 116 | 11.9% |
| $100,000 to $149,999 | 130 | 13.3% |
| $150,000 to $199,999 | 148 | 15.2% |
| $200,000+ | 482 | 49.4% |
Family Income by Famaliy Size in Sixteen Mile Stand
4-person families (204 | 20.9%) account for the highest median family income in Sixteen Mile Stand with $222,045 per family, while 3-person families (372 | 38.2%) have the highest median income of $71,677 per family member.
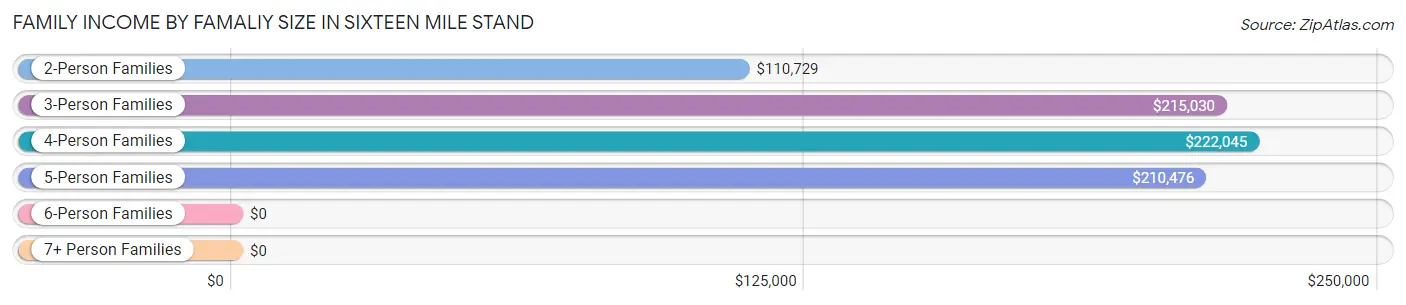
| Income Bracket | # Families | Median Income |
| 2-Person Families | 293 (30.0%) | $110,729 |
| 3-Person Families | 372 (38.2%) | $215,030 |
| 4-Person Families | 204 (20.9%) | $222,045 |
| 5-Person Families | 78 (8.0%) | $210,476 |
| 6-Person Families | 0 (0.0%) | $0 |
| 7+ Person Families | 28 (2.9%) | $0 |
| Total | 975 (100.0%) | $182,026 |
Family Income by Number of Earners in Sixteen Mile Stand
The median family income in Sixteen Mile Stand is $182,026, with families comprising 3+ earners (255) having the highest median family income of $216,303, while families with 1 earner (277) have the lowest median family income of $85,893, accounting for 26.2% and 28.4% of families, respectively.
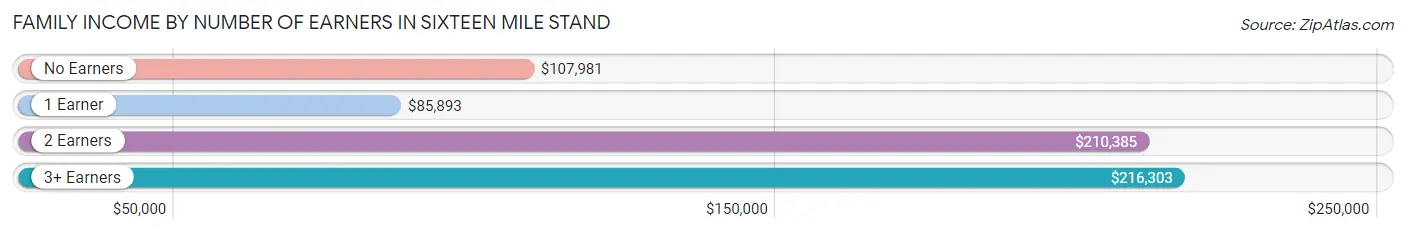
| Number of Earners | # Families | Median Income |
| No Earners | 37 (3.8%) | $107,981 |
| 1 Earner | 277 (28.4%) | $85,893 |
| 2 Earners | 406 (41.6%) | $210,385 |
| 3+ Earners | 255 (26.2%) | $216,303 |
| Total | 975 (100.0%) | $182,026 |
Household Income in Sixteen Mile Stand
Household Income Brackets in Sixteen Mile Stand
With 490 households falling in the category, the $200,000+ income range is the most frequent in Sixteen Mile Stand, accounting for 35.3% of all households. In contrast, only 22 households (1.6%) fall into the $10,000 to $14,999 income bracket, making it the least populous group.
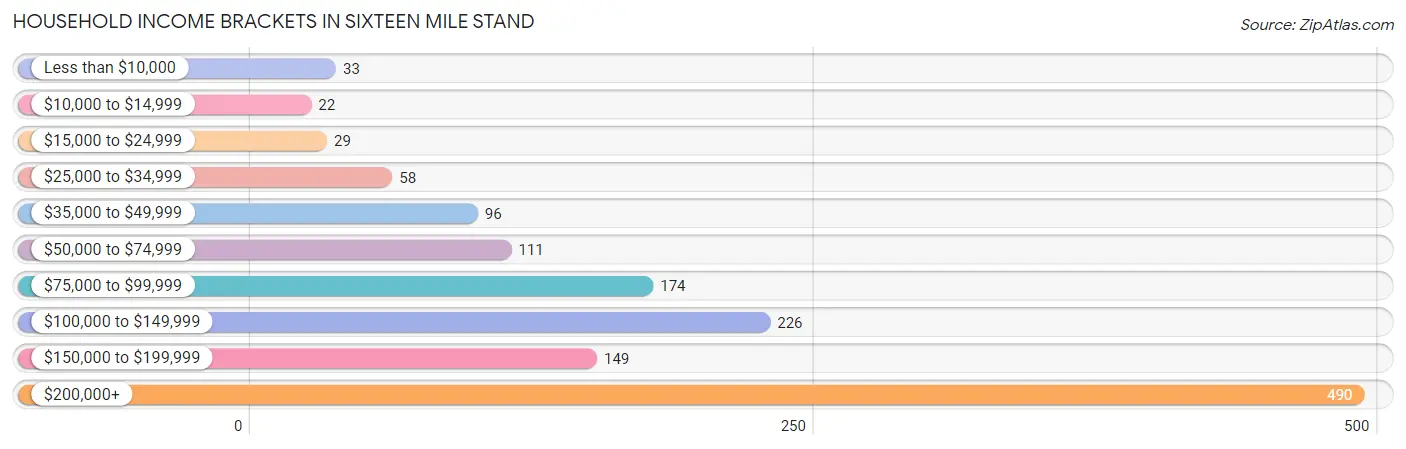
| Income Bracket | # Households | % Households |
| Less than $10,000 | 33 | 2.4% |
| $10,000 to $14,999 | 22 | 1.6% |
| $15,000 to $24,999 | 29 | 2.1% |
| $25,000 to $34,999 | 58 | 4.2% |
| $35,000 to $49,999 | 96 | 6.9% |
| $50,000 to $74,999 | 111 | 8.0% |
| $75,000 to $99,999 | 174 | 12.5% |
| $100,000 to $149,999 | 226 | 16.3% |
| $150,000 to $199,999 | 149 | 10.7% |
| $200,000+ | 490 | 35.3% |
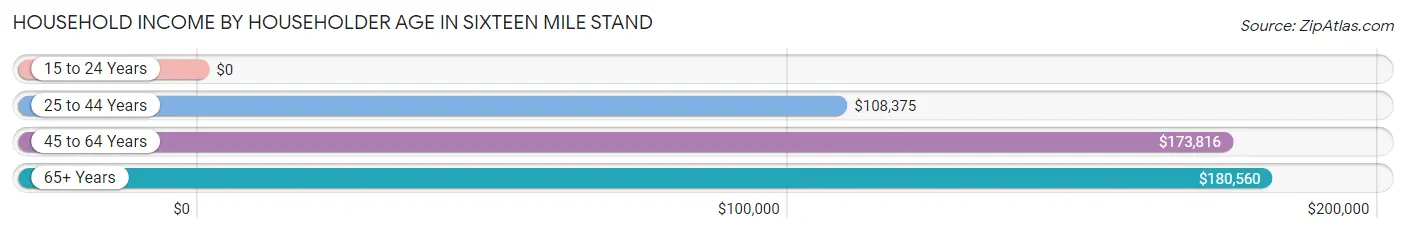
Household Income by Householder Age in Sixteen Mile Stand
The median household income in Sixteen Mile Stand is $117,377, with the highest median household income of $180,560 found in the 65+ years age bracket for the primary householder. A total of 413 households (29.7%) fall into this category. Meanwhile, the 15 to 24 years age bracket for the primary householder has the lowest median household income of $0, with 32 households (2.3%) in this group.
| Income Bracket | # Households | Median Income |
| 15 to 24 Years | 32 (2.3%) | $0 |
| 25 to 44 Years | 470 (33.8%) | $108,375 |
| 45 to 64 Years | 474 (34.1%) | $173,816 |
| 65+ Years | 413 (29.7%) | $180,560 |
| Total | 1,389 (100.0%) | $117,377 |
Poverty in Sixteen Mile Stand
Income Below Poverty by Sex and Age in Sixteen Mile Stand
With 3.7% poverty level for males and 4.0% for females among the residents of Sixteen Mile Stand, 55 to 64 year old males and 15 year old females are the most vulnerable to poverty, with 40 males (20.0%) and 19 females (59.4%) in their respective age groups living below the poverty level.
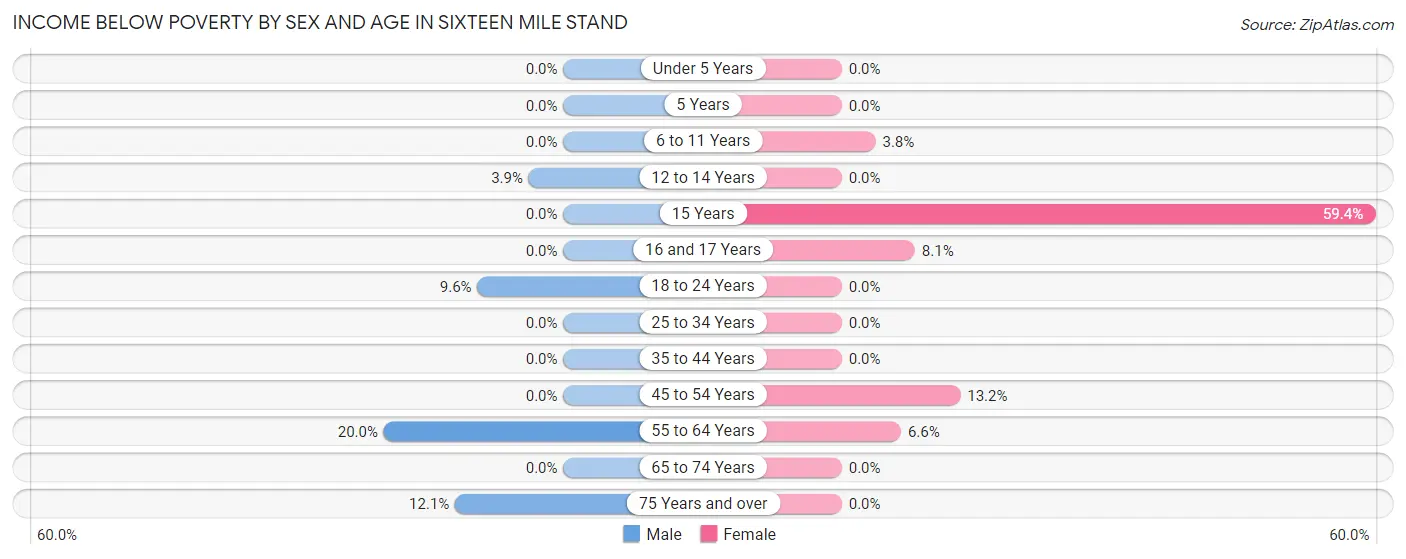
| Age Bracket | Male | Female |
| Under 5 Years | 0 (0.0%) | 0 (0.0%) |
| 5 Years | 0 (0.0%) | 0 (0.0%) |
| 6 to 11 Years | 0 (0.0%) | 5 (3.8%) |
| 12 to 14 Years | 5 (3.8%) | 0 (0.0%) |
| 15 Years | 0 (0.0%) | 19 (59.4%) |
| 16 and 17 Years | 0 (0.0%) | 7 (8.1%) |
| 18 to 24 Years | 11 (9.6%) | 0 (0.0%) |
| 25 to 34 Years | 0 (0.0%) | 0 (0.0%) |
| 35 to 44 Years | 0 (0.0%) | 0 (0.0%) |
| 45 to 54 Years | 0 (0.0%) | 33 (13.2%) |
| 55 to 64 Years | 40 (20.0%) | 11 (6.6%) |
| 65 to 74 Years | 0 (0.0%) | 0 (0.0%) |
| 75 Years and over | 10 (12.0%) | 0 (0.0%) |
| Total | 66 (3.7%) | 75 (4.0%) |
Income Above Poverty by Sex and Age in Sixteen Mile Stand
According to the poverty statistics in Sixteen Mile Stand, males aged under 5 years and females aged under 5 years are the age groups that are most secure financially, with 100.0% of males and 100.0% of females in these age groups living above the poverty line.
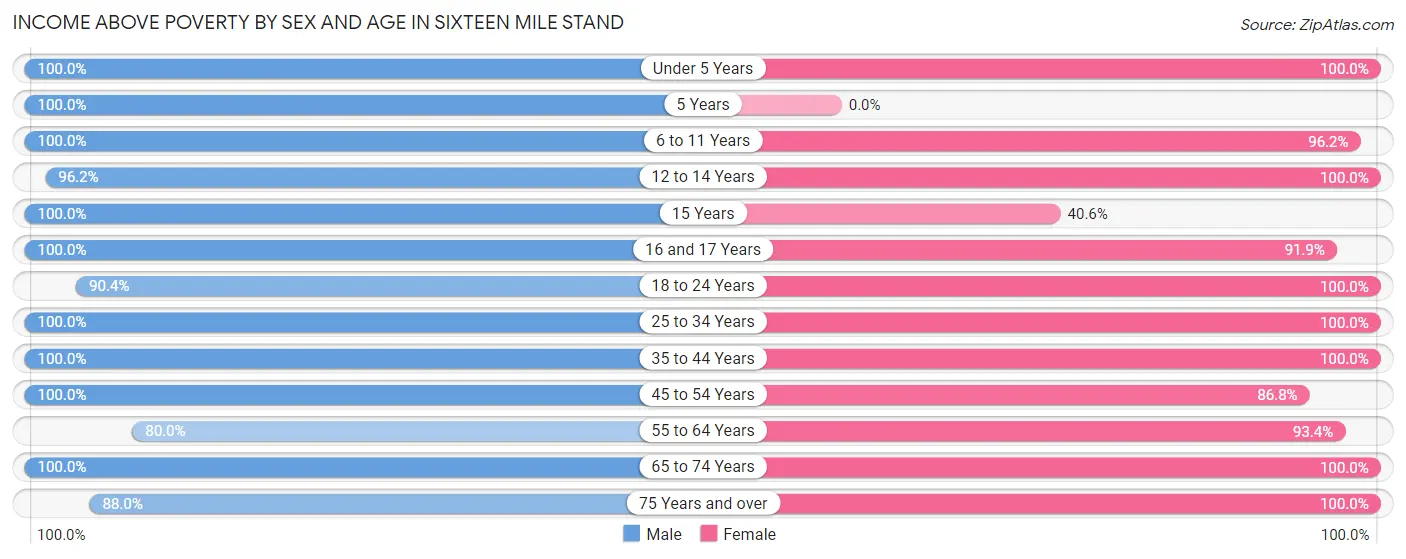
| Age Bracket | Male | Female |
| Under 5 Years | 48 (100.0%) | 207 (100.0%) |
| 5 Years | 26 (100.0%) | 0 (0.0%) |
| 6 to 11 Years | 153 (100.0%) | 128 (96.2%) |
| 12 to 14 Years | 125 (96.2%) | 24 (100.0%) |
| 15 Years | 53 (100.0%) | 13 (40.6%) |
| 16 and 17 Years | 13 (100.0%) | 79 (91.9%) |
| 18 to 24 Years | 104 (90.4%) | 68 (100.0%) |
| 25 to 34 Years | 224 (100.0%) | 182 (100.0%) |
| 35 to 44 Years | 300 (100.0%) | 275 (100.0%) |
| 45 to 54 Years | 119 (100.0%) | 217 (86.8%) |
| 55 to 64 Years | 160 (80.0%) | 156 (93.4%) |
| 65 to 74 Years | 303 (100.0%) | 422 (100.0%) |
| 75 Years and over | 73 (87.9%) | 45 (100.0%) |
| Total | 1,701 (96.3%) | 1,816 (96.0%) |
Income Below Poverty Among Married-Couple Families in Sixteen Mile Stand
The poverty statistics for married-couple families in Sixteen Mile Stand show that 1.3% or 11 of the total 872 families live below the poverty line. Families with no children have the highest poverty rate of 2.5%, comprising of 11 families. On the other hand, families with 1 or 2 children have the lowest poverty rate of 0.0%, which includes 0 families.
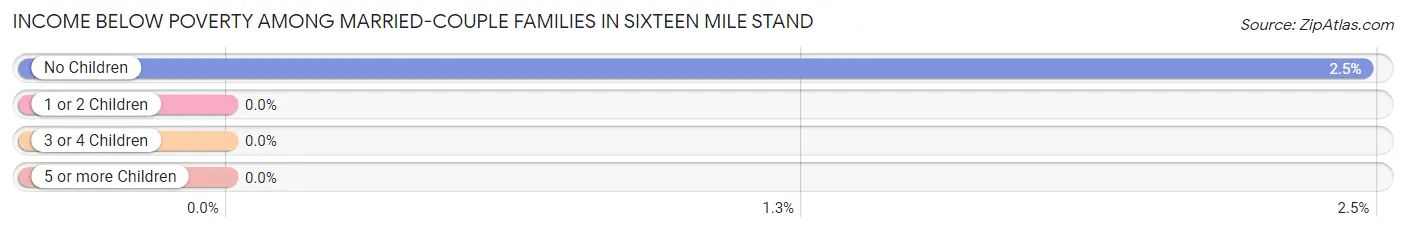
| Children | Above Poverty | Below Poverty |
| No Children | 434 (97.5%) | 11 (2.5%) |
| 1 or 2 Children | 334 (100.0%) | 0 (0.0%) |
| 3 or 4 Children | 65 (100.0%) | 0 (0.0%) |
| 5 or more Children | 28 (100.0%) | 0 (0.0%) |
| Total | 861 (98.7%) | 11 (1.3%) |
Income Below Poverty Among Single-Parent Households in Sixteen Mile Stand
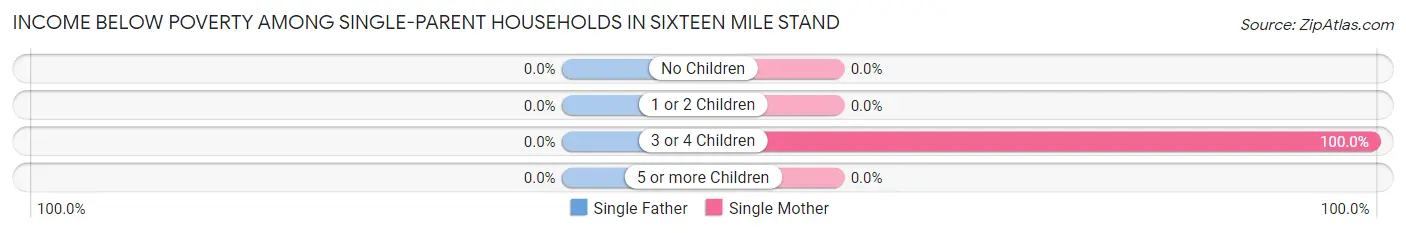
| Children | Single Father | Single Mother |
| No Children | 0 (0.0%) | 0 (0.0%) |
| 1 or 2 Children | 0 (0.0%) | 0 (0.0%) |
| 3 or 4 Children | 0 (0.0%) | 6 (100.0%) |
| 5 or more Children | 0 (0.0%) | 0 (0.0%) |
| Total | 0 (0.0%) | 6 (6.4%) |
Income Below Poverty Among Married-Couple vs Single-Parent Households in Sixteen Mile Stand
The poverty data for Sixteen Mile Stand shows that 11 of the married-couple family households (1.3%) and 6 of the single-parent households (5.8%) are living below the poverty level. Within the married-couple family households, those with no children have the highest poverty rate, with 11 households (2.5%) falling below the poverty line. Among the single-parent households, those with 3 or 4 children have the highest poverty rate, with 6 household (100.0%) living below poverty.
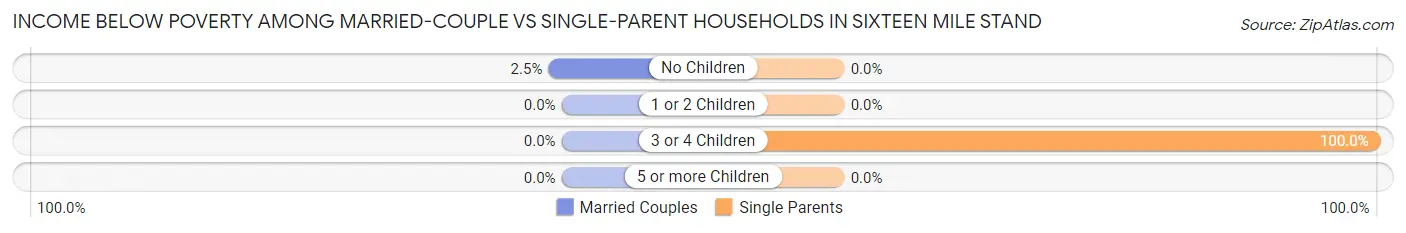
| Children | Married-Couple Families | Single-Parent Households |
| No Children | 11 (2.5%) | 0 (0.0%) |
| 1 or 2 Children | 0 (0.0%) | 0 (0.0%) |
| 3 or 4 Children | 0 (0.0%) | 6 (100.0%) |
| 5 or more Children | 0 (0.0%) | 0 (0.0%) |
| Total | 11 (1.3%) | 6 (5.8%) |
Race in Sixteen Mile Stand
The most populous races in Sixteen Mile Stand are White / Caucasian (2,338 | 63.6%), Asian (743 | 20.2%), and Some other Race (476 | 13.0%).
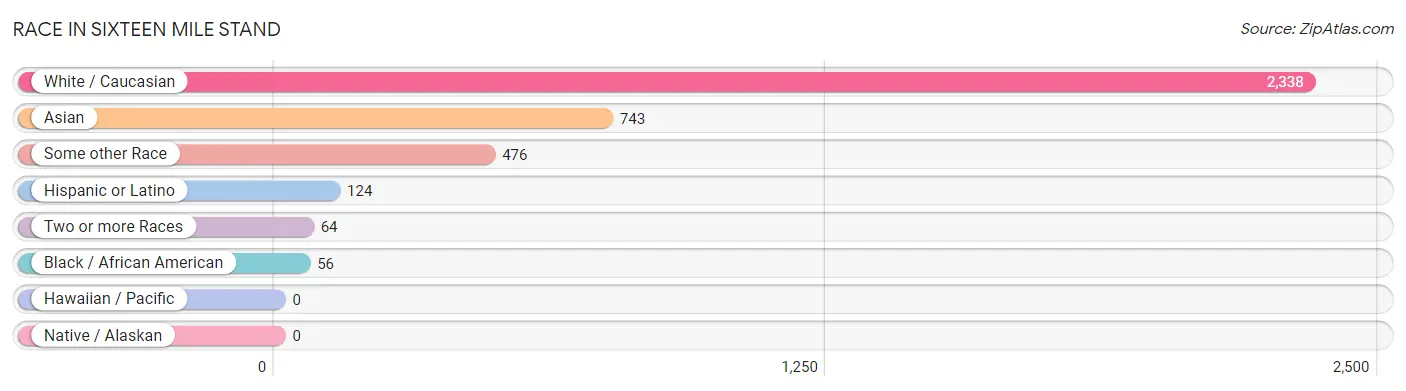
| Race | # Population | % Population |
| Asian | 743 | 20.2% |
| Black / African American | 56 | 1.5% |
| Hawaiian / Pacific | 0 | 0.0% |
| Hispanic or Latino | 124 | 3.4% |
| Native / Alaskan | 0 | 0.0% |
| White / Caucasian | 2,338 | 63.6% |
| Two or more Races | 64 | 1.7% |
| Some other Race | 476 | 13.0% |
| Total | 3,677 | 100.0% |
Ancestry in Sixteen Mile Stand
The most populous ancestries reported in Sixteen Mile Stand are German (825 | 22.4%), Thai (515 | 14.0%), Irish (402 | 10.9%), English (318 | 8.6%), and French (180 | 4.9%), together accounting for 60.9% of all Sixteen Mile Stand residents.
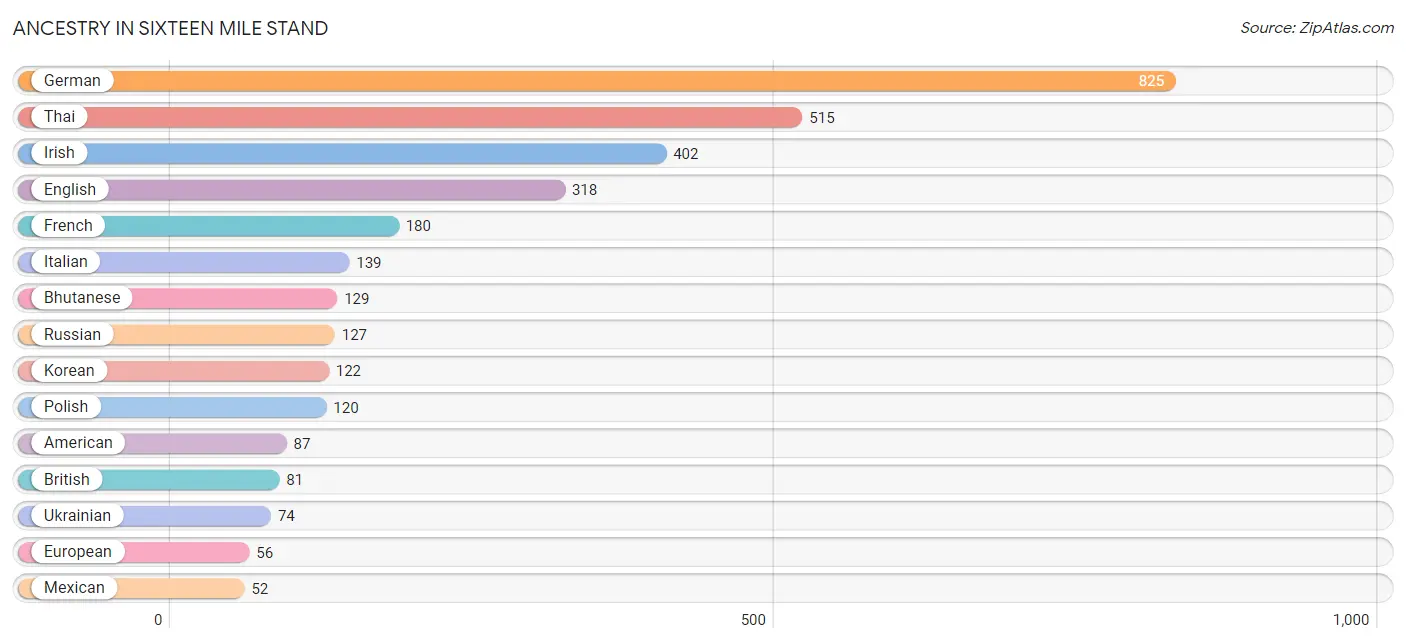
| Ancestry | # Population | % Population |
| American | 87 | 2.4% |
| Arab | 16 | 0.4% |
| Belgian | 39 | 1.1% |
| Bhutanese | 129 | 3.5% |
| Bolivian | 17 | 0.5% |
| British | 81 | 2.2% |
| Cherokee | 1 | 0.0% |
| Chilean | 26 | 0.7% |
| Croatian | 17 | 0.5% |
| Dutch | 23 | 0.6% |
| Eastern European | 35 | 0.9% |
| English | 318 | 8.6% |
| European | 56 | 1.5% |
| French | 180 | 4.9% |
| German | 825 | 22.4% |
| Ghanaian | 10 | 0.3% |
| Indian (Asian) | 15 | 0.4% |
| Irish | 402 | 10.9% |
| Italian | 139 | 3.8% |
| Korean | 122 | 3.3% |
| Mexican | 52 | 1.4% |
| Northern European | 11 | 0.3% |
| Polish | 120 | 3.3% |
| Russian | 127 | 3.5% |
| Scandinavian | 11 | 0.3% |
| Scotch-Irish | 10 | 0.3% |
| Scottish | 46 | 1.3% |
| Slovak | 19 | 0.5% |
| South American | 49 | 1.3% |
| Spaniard | 23 | 0.6% |
| Subsaharan African | 10 | 0.3% |
| Swedish | 13 | 0.4% |
| Swiss | 13 | 0.4% |
| Thai | 515 | 14.0% |
| Ukrainian | 74 | 2.0% |
| Venezuelan | 6 | 0.2% |
| Welsh | 30 | 0.8% | View All 37 Rows |
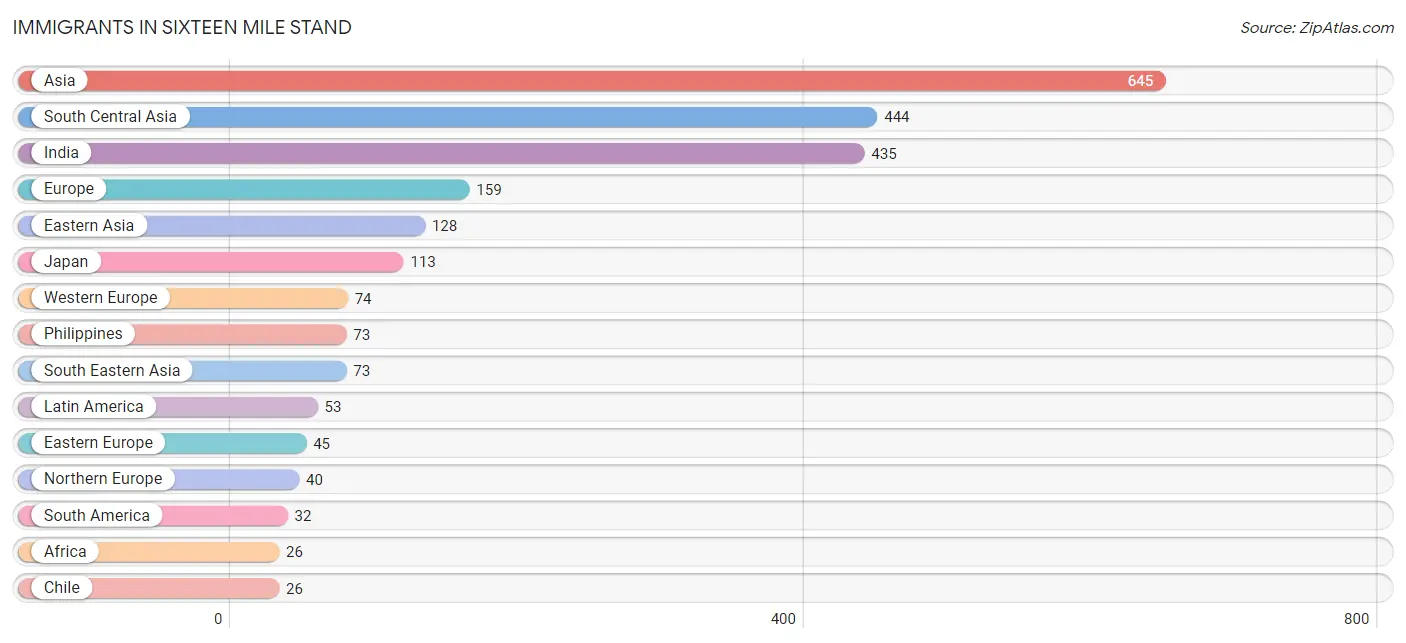
Immigrants in Sixteen Mile Stand
The most numerous immigrant groups reported in Sixteen Mile Stand came from Asia (645 | 17.5%), South Central Asia (444 | 12.1%), India (435 | 11.8%), Europe (159 | 4.3%), and Eastern Asia (128 | 3.5%), together accounting for 49.3% of all Sixteen Mile Stand residents.
| Immigration Origin | # Population | % Population |
| Africa | 26 | 0.7% |
| Asia | 645 | 17.5% |
| Belgium | 13 | 0.4% |
| Central America | 21 | 0.6% |
| Chile | 26 | 0.7% |
| China | 15 | 0.4% |
| Eastern Asia | 128 | 3.5% |
| Eastern Europe | 45 | 1.2% |
| Egypt | 16 | 0.4% |
| Europe | 159 | 4.3% |
| France | 13 | 0.4% |
| Germany | 22 | 0.6% |
| Ghana | 10 | 0.3% |
| India | 435 | 11.8% |
| Japan | 113 | 3.1% |
| Latin America | 53 | 1.4% |
| Mexico | 21 | 0.6% |
| Northern Africa | 16 | 0.4% |
| Northern Europe | 40 | 1.1% |
| Pakistan | 9 | 0.2% |
| Philippines | 73 | 2.0% |
| Russia | 23 | 0.6% |
| South America | 32 | 0.9% |
| South Central Asia | 444 | 12.1% |
| South Eastern Asia | 73 | 2.0% |
| Switzerland | 26 | 0.7% |
| Ukraine | 22 | 0.6% |
| Venezuela | 6 | 0.2% |
| Western Africa | 10 | 0.3% |
| Western Europe | 74 | 2.0% | View All 30 Rows |
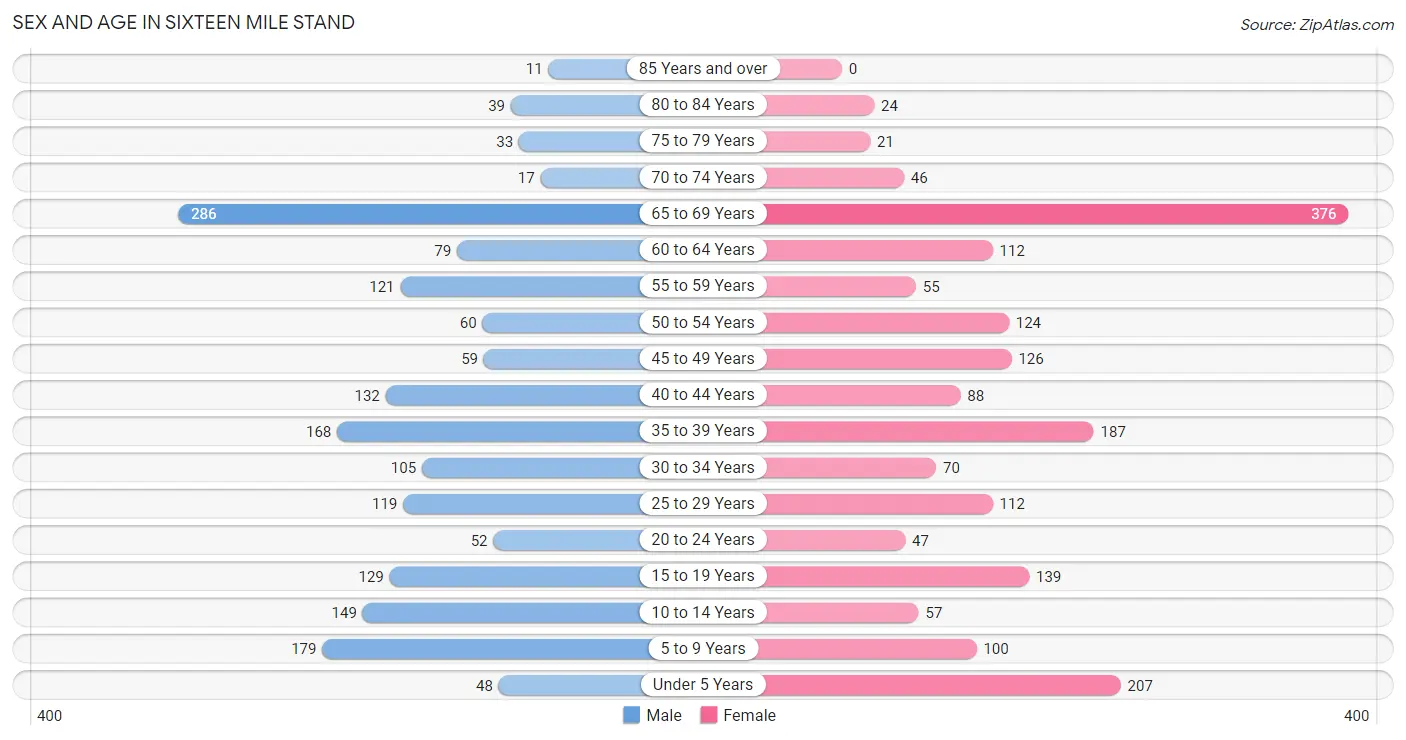
Sex and Age in Sixteen Mile Stand
Sex and Age in Sixteen Mile Stand
The most populous age groups in Sixteen Mile Stand are 65 to 69 Years (286 | 16.0%) for men and 65 to 69 Years (376 | 19.9%) for women.
| Age Bracket | Male | Female |
| Under 5 Years | 48 (2.7%) | 207 (11.0%) |
| 5 to 9 Years | 179 (10.0%) | 100 (5.3%) |
| 10 to 14 Years | 149 (8.3%) | 57 (3.0%) |
| 15 to 19 Years | 129 (7.2%) | 139 (7.3%) |
| 20 to 24 Years | 52 (2.9%) | 47 (2.5%) |
| 25 to 29 Years | 119 (6.7%) | 112 (5.9%) |
| 30 to 34 Years | 105 (5.9%) | 70 (3.7%) |
| 35 to 39 Years | 168 (9.4%) | 187 (9.9%) |
| 40 to 44 Years | 132 (7.4%) | 88 (4.6%) |
| 45 to 49 Years | 59 (3.3%) | 126 (6.7%) |
| 50 to 54 Years | 60 (3.4%) | 124 (6.6%) |
| 55 to 59 Years | 121 (6.8%) | 55 (2.9%) |
| 60 to 64 Years | 79 (4.4%) | 112 (5.9%) |
| 65 to 69 Years | 286 (16.0%) | 376 (19.9%) |
| 70 to 74 Years | 17 (0.9%) | 46 (2.4%) |
| 75 to 79 Years | 33 (1.8%) | 21 (1.1%) |
| 80 to 84 Years | 39 (2.2%) | 24 (1.3%) |
| 85 Years and over | 11 (0.6%) | 0 (0.0%) |
| Total | 1,786 (100.0%) | 1,891 (100.0%) |
Families and Households in Sixteen Mile Stand
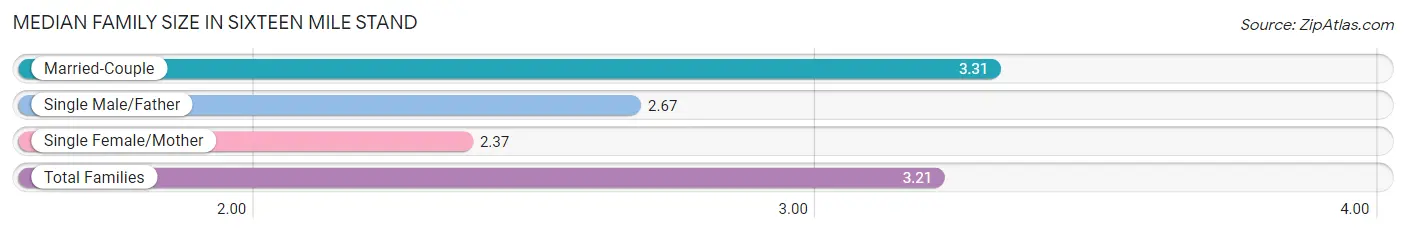
Median Family Size in Sixteen Mile Stand
The median family size in Sixteen Mile Stand is 3.21 persons per family, with married-couple families (872 | 89.4%) accounting for the largest median family size of 3.31 persons per family. On the other hand, single female/mother families (94 | 9.6%) represent the smallest median family size with 2.37 persons per family.
| Family Type | # Families | Family Size |
| Married-Couple | 872 (89.4%) | 3.31 |
| Single Male/Father | 9 (0.9%) | 2.67 |
| Single Female/Mother | 94 (9.6%) | 2.37 |
| Total Families | 975 (100.0%) | 3.21 |
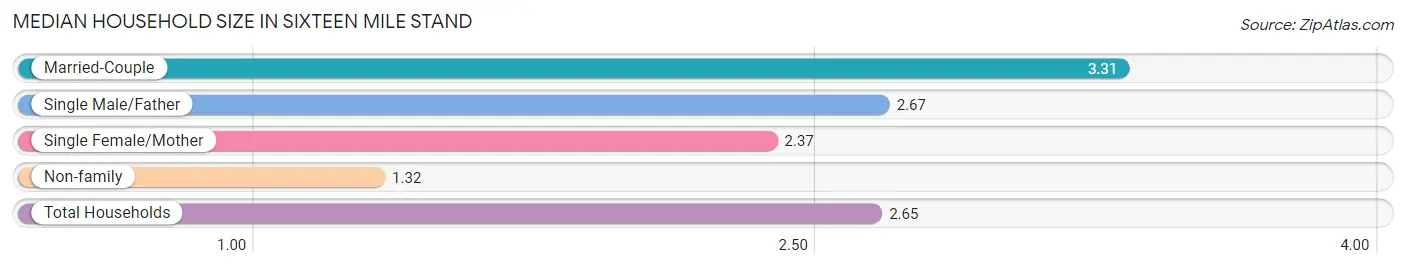
Median Household Size in Sixteen Mile Stand
The median household size in Sixteen Mile Stand is 2.65 persons per household, with married-couple households (872 | 62.8%) accounting for the largest median household size of 3.31 persons per household. non-family households (414 | 29.8%) represent the smallest median household size with 1.32 persons per household.
| Household Type | # Households | Household Size |
| Married-Couple | 872 (62.8%) | 3.31 |
| Single Male/Father | 9 (0.6%) | 2.67 |
| Single Female/Mother | 94 (6.8%) | 2.37 |
| Non-family | 414 (29.8%) | 1.32 |
| Total Households | 1,389 (100.0%) | 2.65 |
Household Size by Marriage Status in Sixteen Mile Stand
Out of a total of 1,389 households in Sixteen Mile Stand, 975 (70.2%) are family households, while 414 (29.8%) are nonfamily households. The most numerous type of family households are 3-person households, comprising 372, and the most common type of nonfamily households are 1-person households, comprising 357.
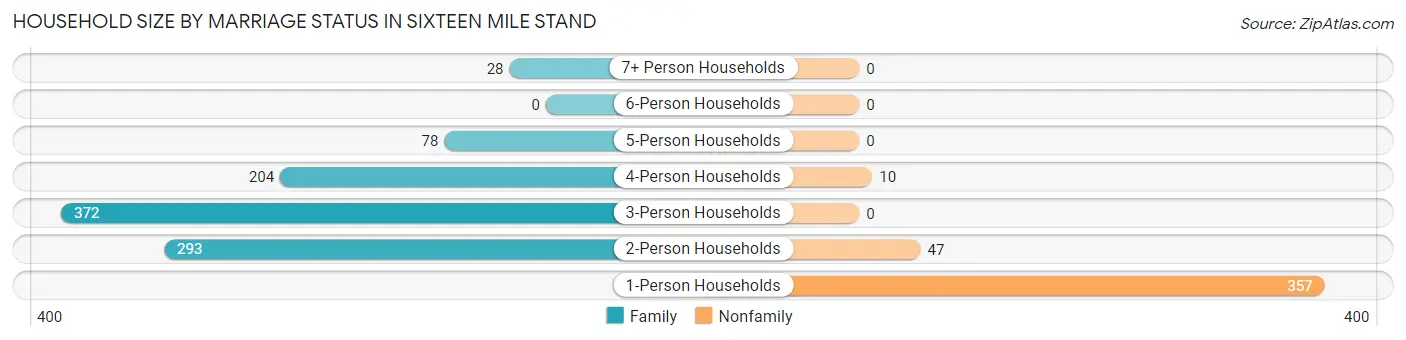
| Household Size | Family Households | Nonfamily Households |
| 1-Person Households | - | 357 (25.7%) |
| 2-Person Households | 293 (21.1%) | 47 (3.4%) |
| 3-Person Households | 372 (26.8%) | 0 (0.0%) |
| 4-Person Households | 204 (14.7%) | 10 (0.7%) |
| 5-Person Households | 78 (5.6%) | 0 (0.0%) |
| 6-Person Households | 0 (0.0%) | 0 (0.0%) |
| 7+ Person Households | 28 (2.0%) | 0 (0.0%) |
| Total | 975 (70.2%) | 414 (29.8%) |
Female Fertility in Sixteen Mile Stand
Fertility by Age in Sixteen Mile Stand
Average fertility rate in Sixteen Mile Stand is 44.0 births per 1,000 women. Women in the age bracket of 35 to 50 years have the highest fertility rate with 80.0 births per 1,000 women. Women in the age bracket of 35 to 50 years acount for 100.0% of all women with births.
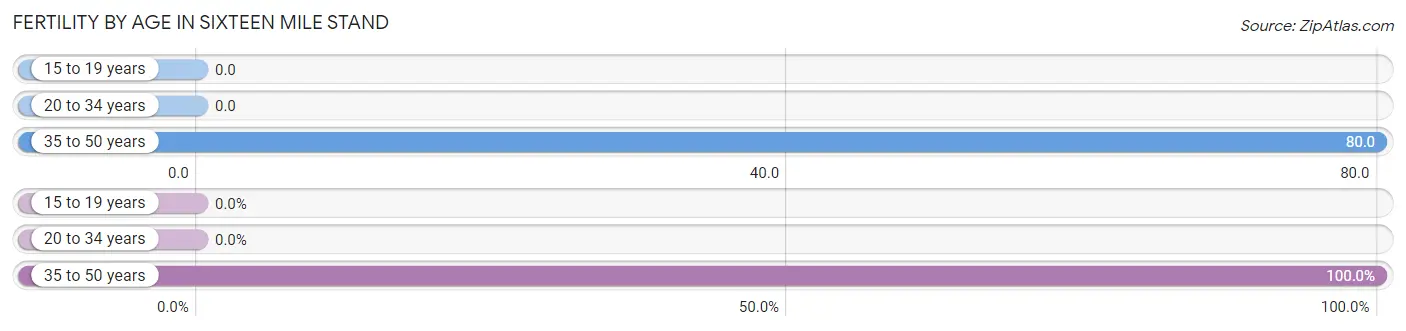
| Age Bracket | Women with Births | Births / 1,000 Women |
| 15 to 19 years | 0 (0.0%) | 0.0 |
| 20 to 34 years | 0 (0.0%) | 0.0 |
| 35 to 50 years | 35 (100.0%) | 80.0 |
| Total | 35 (100.0%) | 44.0 |
Fertility by Age by Marriage Status in Sixteen Mile Stand
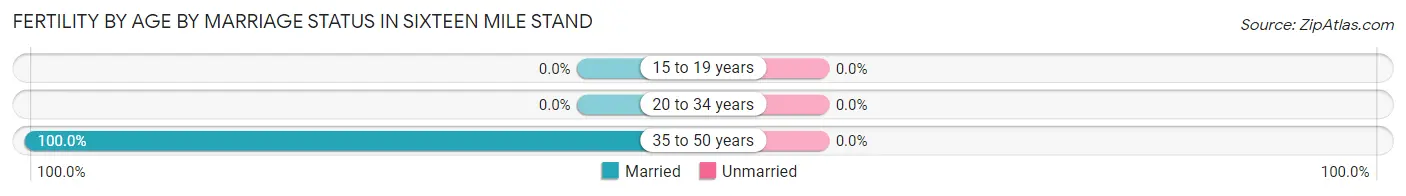
| Age Bracket | Married | Unmarried |
| 15 to 19 years | 0 (0.0%) | 0 (0.0%) |
| 20 to 34 years | 0 (0.0%) | 0 (0.0%) |
| 35 to 50 years | 35 (100.0%) | 0 (0.0%) |
| Total | 35 (100.0%) | 0 (0.0%) |
Fertility by Education in Sixteen Mile Stand
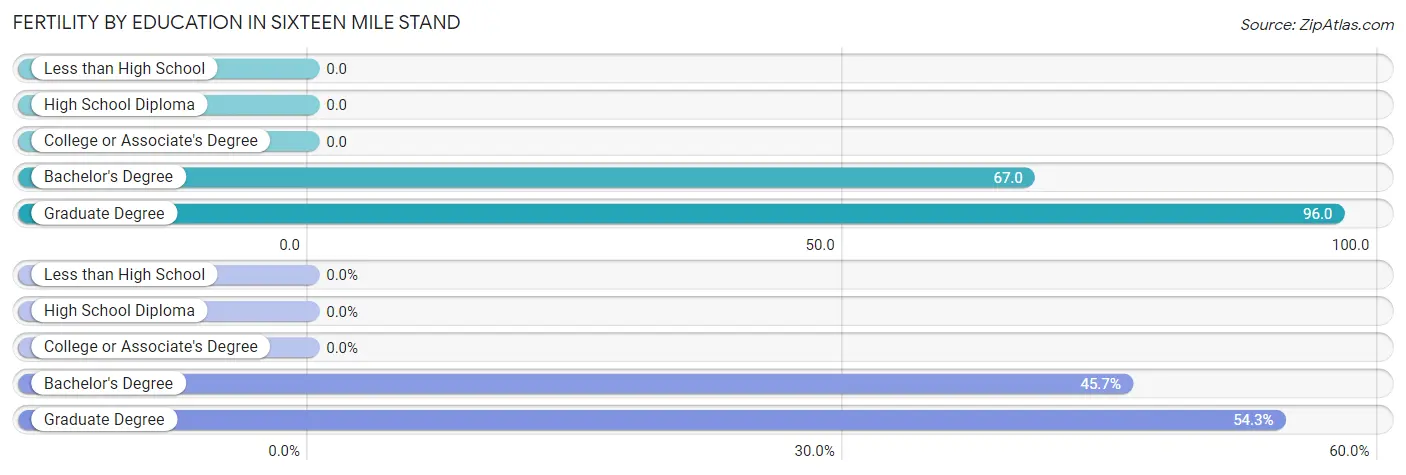
| Educational Attainment | Women with Births | Births / 1,000 Women |
| Less than High School | 0 (0.0%) | 0.0 |
| High School Diploma | 0 (0.0%) | 0.0 |
| College or Associate's Degree | 0 (0.0%) | 0.0 |
| Bachelor's Degree | 16 (45.7%) | 67.0 |
| Graduate Degree | 19 (54.3%) | 96.0 |
| Total | 35 (100.0%) | 44.0 |
Fertility by Education by Marriage Status in Sixteen Mile Stand
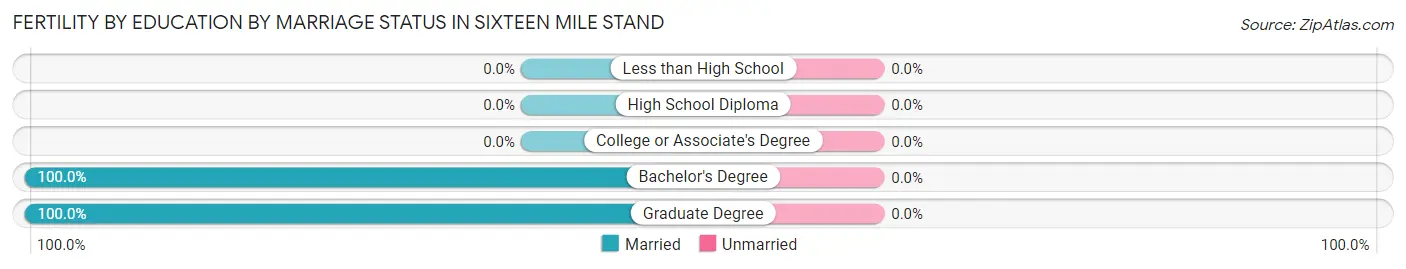
| Educational Attainment | Married | Unmarried |
| Less than High School | 0 (0.0%) | 0 (0.0%) |
| High School Diploma | 0 (0.0%) | 0 (0.0%) |
| College or Associate's Degree | 0 (0.0%) | 0 (0.0%) |
| Bachelor's Degree | 16 (100.0%) | 0 (0.0%) |
| Graduate Degree | 19 (100.0%) | 0 (0.0%) |
| Total | 35 (100.0%) | 0 (0.0%) |
Employment Characteristics in Sixteen Mile Stand
Employment by Class of Employer in Sixteen Mile Stand
Among the 2,161 employed individuals in Sixteen Mile Stand, private company employees (1,321 | 61.1%), self-employed (not incorporated) (453 | 21.0%), and not-for-profit organizations (174 | 8.1%) make up the most common classes of employment.
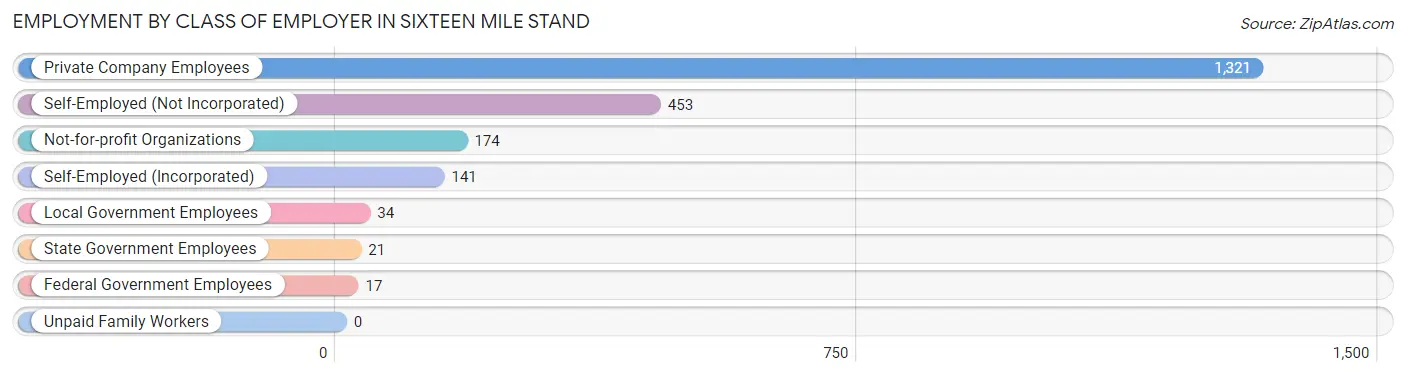
| Employer Class | # Employees | % Employees |
| Private Company Employees | 1,321 | 61.1% |
| Self-Employed (Incorporated) | 141 | 6.5% |
| Self-Employed (Not Incorporated) | 453 | 21.0% |
| Not-for-profit Organizations | 174 | 8.1% |
| Local Government Employees | 34 | 1.6% |
| State Government Employees | 21 | 1.0% |
| Federal Government Employees | 17 | 0.8% |
| Unpaid Family Workers | 0 | 0.0% |
| Total | 2,161 | 100.0% |
Employment Status by Age in Sixteen Mile Stand
According to the labor force statistics for Sixteen Mile Stand, out of the total population over 16 years of age (2,852), 77.4% or 2,207 individuals are in the labor force, with 2.1% or 46 of them unemployed. The age group with the highest labor force participation rate is 25 to 29 years, with 100.0% or 231 individuals in the labor force. Within the labor force, the 20 to 24 years age range has the highest percentage of unemployed individuals, with 12.8% or 10 of them being unemployed.
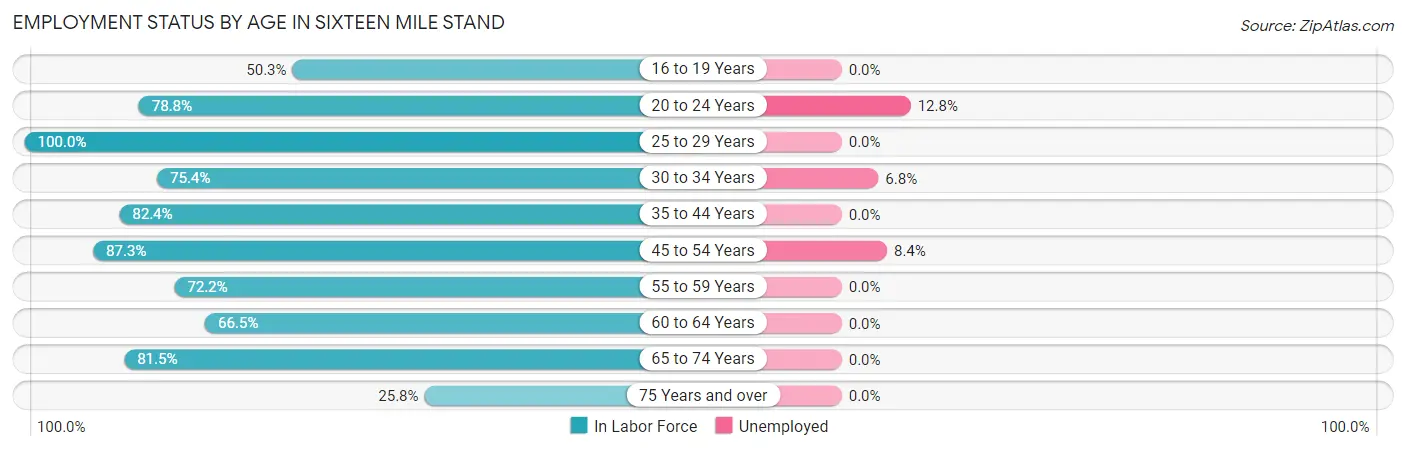
| Age Bracket | In Labor Force | Unemployed |
| 16 to 19 Years | 92 (50.3%) | 0 (0.0%) |
| 20 to 24 Years | 78 (78.8%) | 10 (12.8%) |
| 25 to 29 Years | 231 (100.0%) | 0 (0.0%) |
| 30 to 34 Years | 132 (75.4%) | 9 (6.8%) |
| 35 to 44 Years | 474 (82.4%) | 0 (0.0%) |
| 45 to 54 Years | 322 (87.3%) | 27 (8.4%) |
| 55 to 59 Years | 127 (72.2%) | 0 (0.0%) |
| 60 to 64 Years | 127 (66.5%) | 0 (0.0%) |
| 65 to 74 Years | 591 (81.5%) | 0 (0.0%) |
| 75 Years and over | 33 (25.8%) | 0 (0.0%) |
| Total | 2,207 (77.4%) | 46 (2.1%) |
Employment Status by Educational Attainment in Sixteen Mile Stand
According to labor force statistics for Sixteen Mile Stand, 82.3% of individuals (1,413) out of the total population between 25 and 64 years of age (1,717) are in the labor force, with 2.5% or 35 of them being unemployed. The group with the highest labor force participation rate are those with the educational attainment of less than high school, with 100.0% or 10 individuals in the labor force. Within the labor force, individuals with less than high school education have the highest percentage of unemployment, with 100.0% or 10 of them being unemployed.
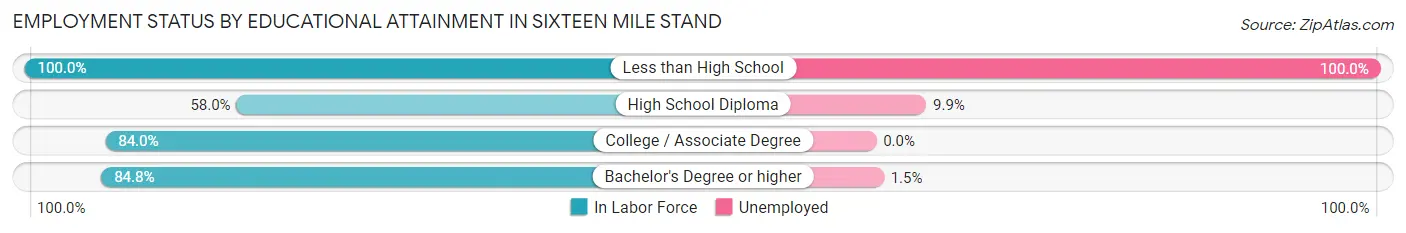
| Educational Attainment | In Labor Force | Unemployed |
| Less than High School | 10 (100.0%) | 10 (100.0%) |
| High School Diploma | 91 (58.0%) | 16 (9.9%) |
| College / Associate Degree | 178 (84.0%) | 0 (0.0%) |
| Bachelor's Degree or higher | 1,135 (84.8%) | 20 (1.5%) |
| Total | 1,413 (82.3%) | 43 (2.5%) |
Employment Occupations by Sex in Sixteen Mile Stand
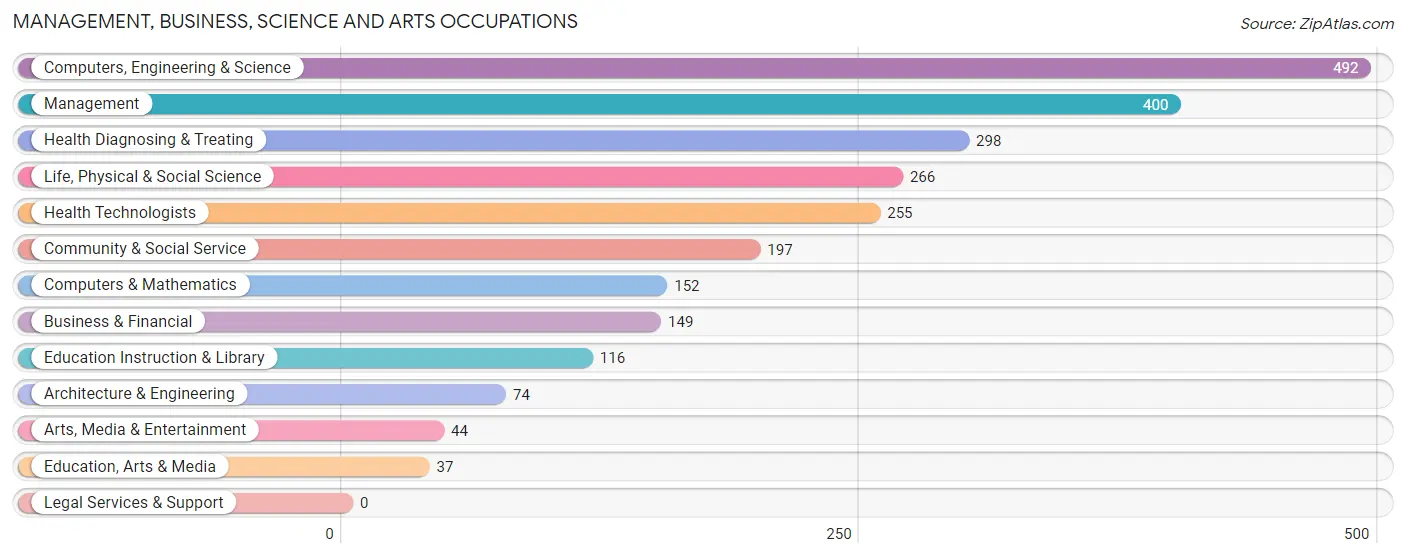
Management, Business, Science and Arts Occupations
The most common Management, Business, Science and Arts occupations in Sixteen Mile Stand are Computers, Engineering & Science (492 | 22.8%), Management (400 | 18.5%), Health Diagnosing & Treating (298 | 13.8%), Life, Physical & Social Science (266 | 12.3%), and Health Technologists (255 | 11.8%).
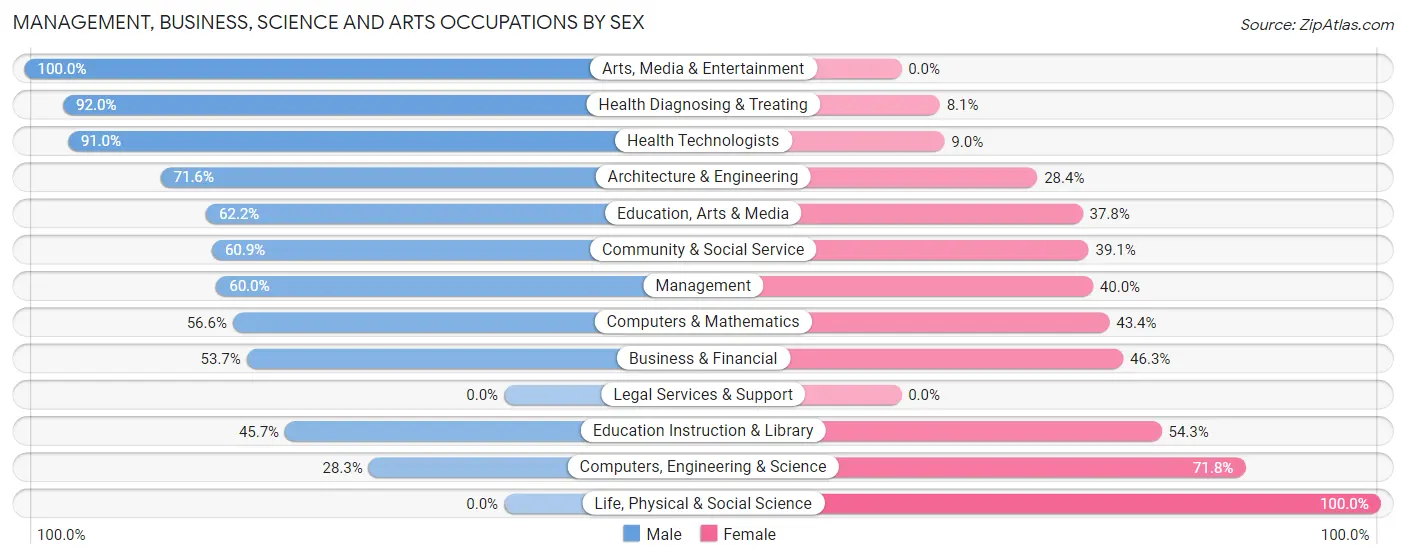
Management, Business, Science and Arts Occupations by Sex
Within the Management, Business, Science and Arts occupations in Sixteen Mile Stand, the most male-oriented occupations are Arts, Media & Entertainment (100.0%), Health Diagnosing & Treating (91.9%), and Health Technologists (91.0%), while the most female-oriented occupations are Life, Physical & Social Science (100.0%), Computers, Engineering & Science (71.8%), and Education Instruction & Library (54.3%).
| Occupation | Male | Female |
| Management | 240 (60.0%) | 160 (40.0%) |
| Business & Financial | 80 (53.7%) | 69 (46.3%) |
| Computers, Engineering & Science | 139 (28.2%) | 353 (71.8%) |
| Computers & Mathematics | 86 (56.6%) | 66 (43.4%) |
| Architecture & Engineering | 53 (71.6%) | 21 (28.4%) |
| Life, Physical & Social Science | 0 (0.0%) | 266 (100.0%) |
| Community & Social Service | 120 (60.9%) | 77 (39.1%) |
| Education, Arts & Media | 23 (62.2%) | 14 (37.8%) |
| Legal Services & Support | 0 (0.0%) | 0 (0.0%) |
| Education Instruction & Library | 53 (45.7%) | 63 (54.3%) |
| Arts, Media & Entertainment | 44 (100.0%) | 0 (0.0%) |
| Health Diagnosing & Treating | 274 (91.9%) | 24 (8.1%) |
| Health Technologists | 232 (91.0%) | 23 (9.0%) |
| Total (Category) | 853 (55.5%) | 683 (44.5%) |
| Total (Overall) | 1,129 (52.2%) | 1,032 (47.8%) |
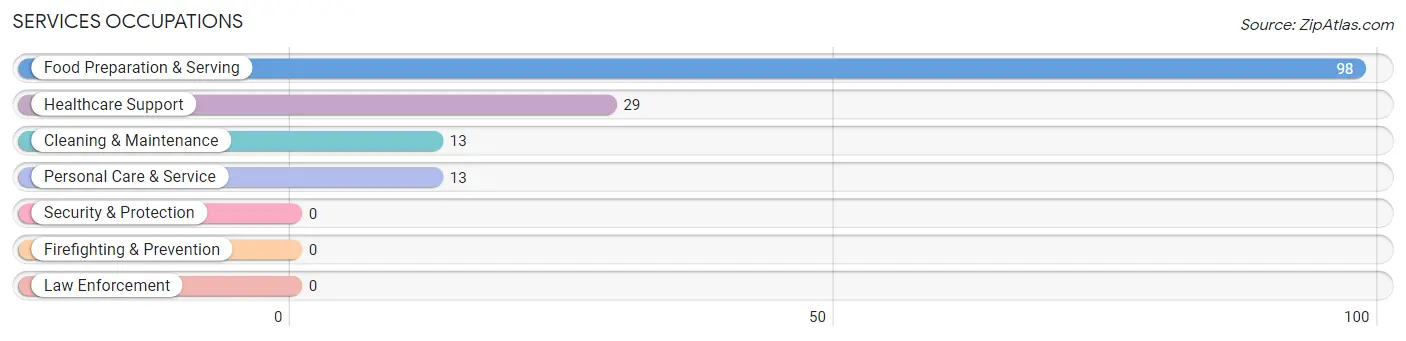
Services Occupations
The most common Services occupations in Sixteen Mile Stand are Food Preparation & Serving (98 | 4.5%), Healthcare Support (29 | 1.3%), Cleaning & Maintenance (13 | 0.6%), and Personal Care & Service (13 | 0.6%).
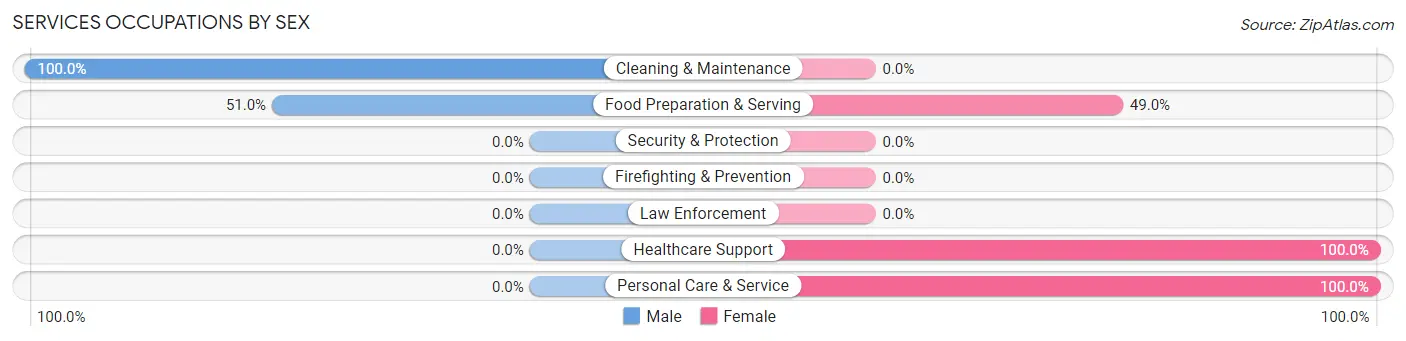
Services Occupations by Sex
Within the Services occupations in Sixteen Mile Stand, the most male-oriented occupations are Cleaning & Maintenance (100.0%), and Food Preparation & Serving (51.0%), while the most female-oriented occupations are Healthcare Support (100.0%), Personal Care & Service (100.0%), and Food Preparation & Serving (49.0%).
| Occupation | Male | Female |
| Healthcare Support | 0 (0.0%) | 29 (100.0%) |
| Security & Protection | 0 (0.0%) | 0 (0.0%) |
| Firefighting & Prevention | 0 (0.0%) | 0 (0.0%) |
| Law Enforcement | 0 (0.0%) | 0 (0.0%) |
| Food Preparation & Serving | 50 (51.0%) | 48 (49.0%) |
| Cleaning & Maintenance | 13 (100.0%) | 0 (0.0%) |
| Personal Care & Service | 0 (0.0%) | 13 (100.0%) |
| Total (Category) | 63 (41.2%) | 90 (58.8%) |
| Total (Overall) | 1,129 (52.2%) | 1,032 (47.8%) |
Sales and Office Occupations
The most common Sales and Office occupations in Sixteen Mile Stand are Sales & Related (184 | 8.5%), and Office & Administration (116 | 5.4%).
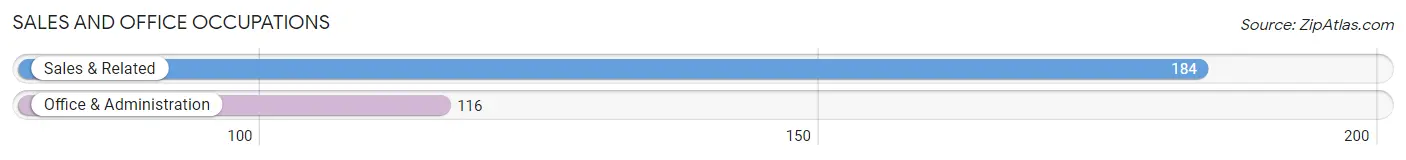
Sales and Office Occupations by Sex
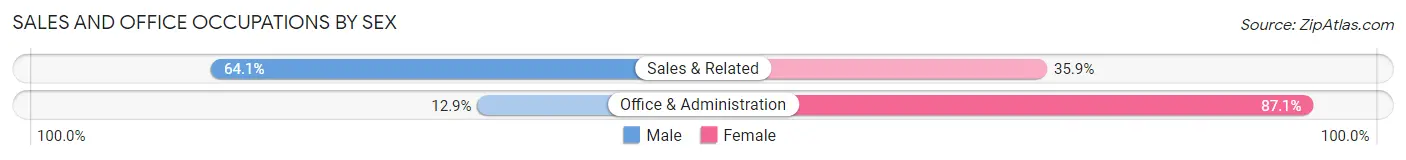
| Occupation | Male | Female |
| Sales & Related | 118 (64.1%) | 66 (35.9%) |
| Office & Administration | 15 (12.9%) | 101 (87.1%) |
| Total (Category) | 133 (44.3%) | 167 (55.7%) |
| Total (Overall) | 1,129 (52.2%) | 1,032 (47.8%) |
Natural Resources, Construction and Maintenance Occupations
The most common Natural Resources, Construction and Maintenance occupations in Sixteen Mile Stand are , and Construction & Extraction (27 | 1.3%).
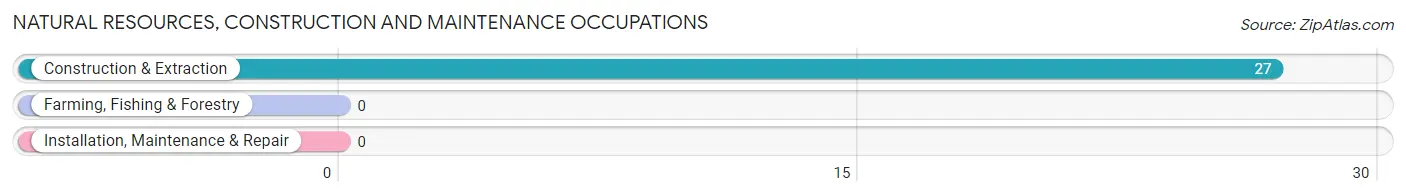
Natural Resources, Construction and Maintenance Occupations by Sex
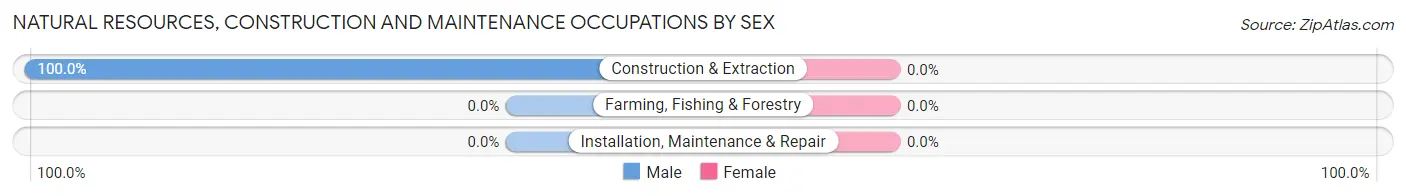
| Occupation | Male | Female |
| Farming, Fishing & Forestry | 0 (0.0%) | 0 (0.0%) |
| Construction & Extraction | 27 (100.0%) | 0 (0.0%) |
| Installation, Maintenance & Repair | 0 (0.0%) | 0 (0.0%) |
| Total (Category) | 27 (100.0%) | 0 (0.0%) |
| Total (Overall) | 1,129 (52.2%) | 1,032 (47.8%) |
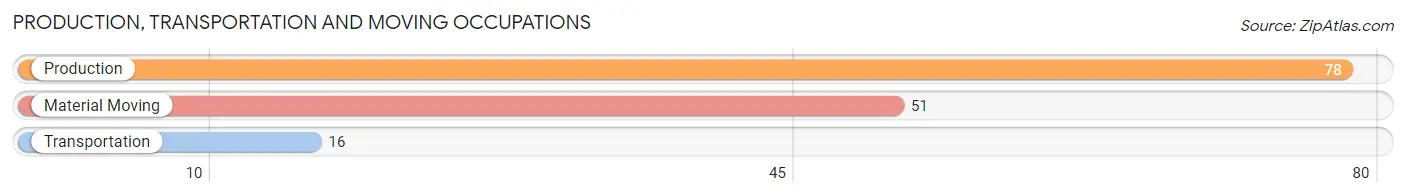
Production, Transportation and Moving Occupations
The most common Production, Transportation and Moving occupations in Sixteen Mile Stand are Production (78 | 3.6%), Material Moving (51 | 2.4%), and Transportation (16 | 0.7%).
Production, Transportation and Moving Occupations by Sex
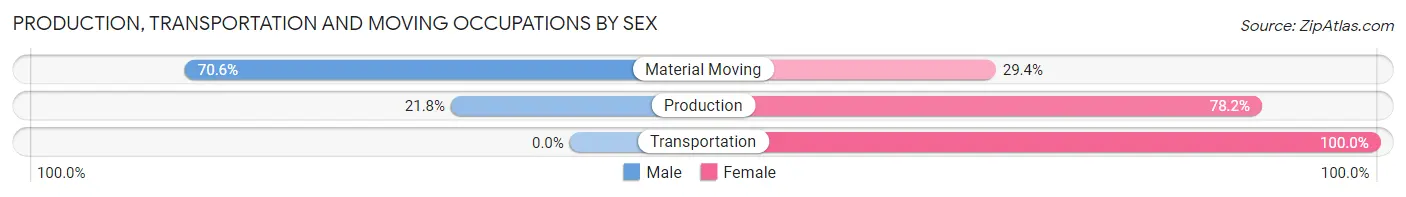
| Occupation | Male | Female |
| Production | 17 (21.8%) | 61 (78.2%) |
| Transportation | 0 (0.0%) | 16 (100.0%) |
| Material Moving | 36 (70.6%) | 15 (29.4%) |
| Total (Category) | 53 (36.5%) | 92 (63.4%) |
| Total (Overall) | 1,129 (52.2%) | 1,032 (47.8%) |
Employment Industries by Sex in Sixteen Mile Stand
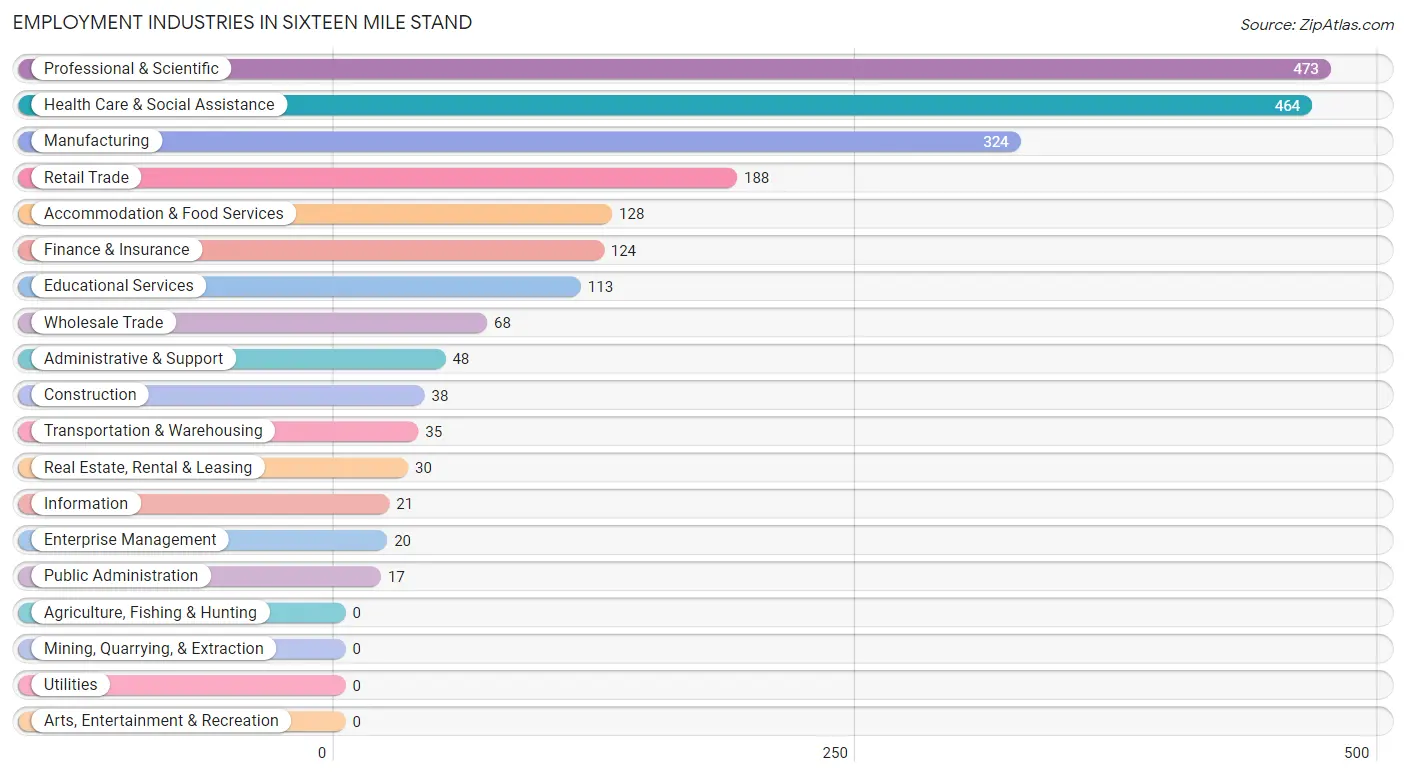
Employment Industries in Sixteen Mile Stand
The major employment industries in Sixteen Mile Stand include Professional & Scientific (473 | 21.9%), Health Care & Social Assistance (464 | 21.5%), Manufacturing (324 | 15.0%), Retail Trade (188 | 8.7%), and Accommodation & Food Services (128 | 5.9%).
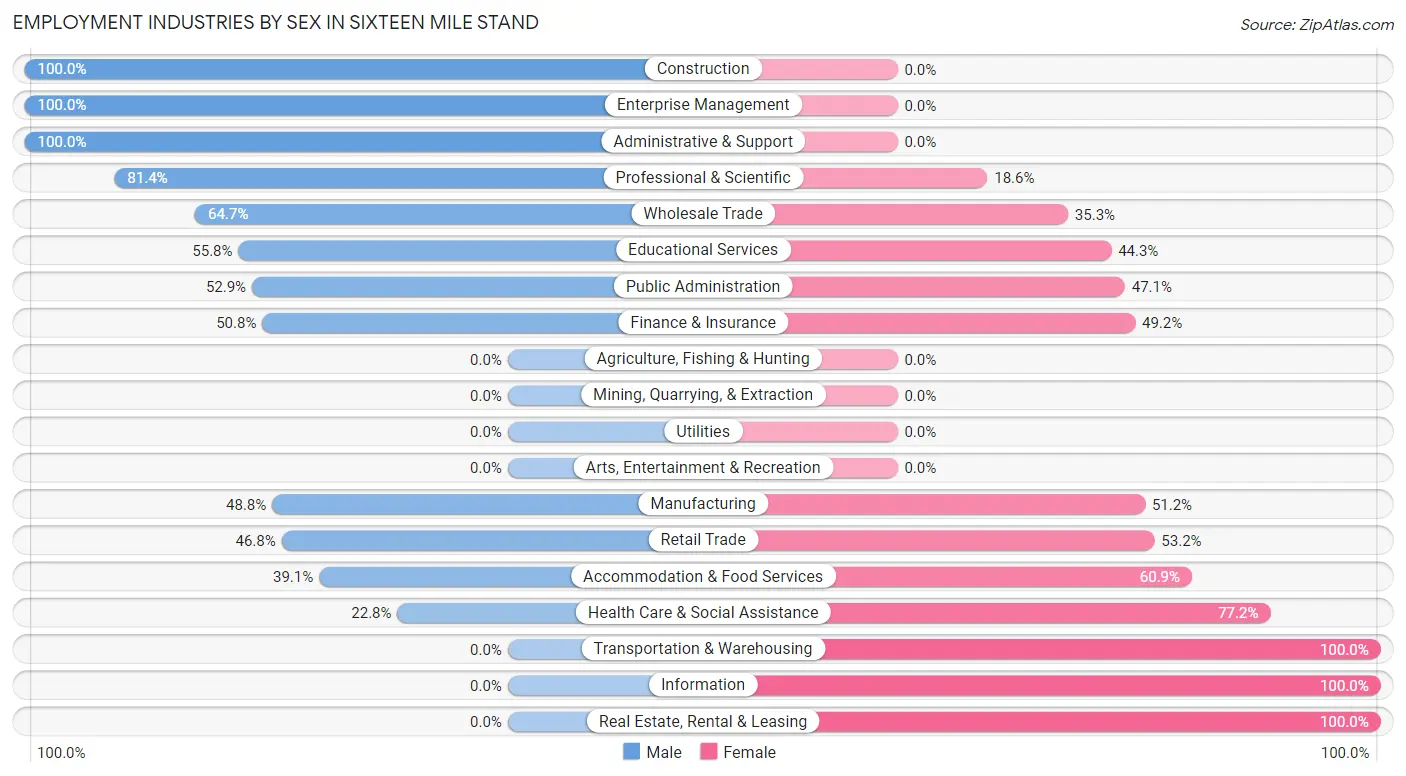
Employment Industries by Sex in Sixteen Mile Stand
The Sixteen Mile Stand industries that see more men than women are Construction (100.0%), Enterprise Management (100.0%), and Administrative & Support (100.0%), whereas the industries that tend to have a higher number of women are Transportation & Warehousing (100.0%), Information (100.0%), and Real Estate, Rental & Leasing (100.0%).
| Industry | Male | Female |
| Agriculture, Fishing & Hunting | 0 (0.0%) | 0 (0.0%) |
| Mining, Quarrying, & Extraction | 0 (0.0%) | 0 (0.0%) |
| Construction | 38 (100.0%) | 0 (0.0%) |
| Manufacturing | 158 (48.8%) | 166 (51.2%) |
| Wholesale Trade | 44 (64.7%) | 24 (35.3%) |
| Retail Trade | 88 (46.8%) | 100 (53.2%) |
| Transportation & Warehousing | 0 (0.0%) | 35 (100.0%) |
| Utilities | 0 (0.0%) | 0 (0.0%) |
| Information | 0 (0.0%) | 21 (100.0%) |
| Finance & Insurance | 63 (50.8%) | 61 (49.2%) |
| Real Estate, Rental & Leasing | 0 (0.0%) | 30 (100.0%) |
| Professional & Scientific | 385 (81.4%) | 88 (18.6%) |
| Enterprise Management | 20 (100.0%) | 0 (0.0%) |
| Administrative & Support | 48 (100.0%) | 0 (0.0%) |
| Educational Services | 63 (55.7%) | 50 (44.3%) |
| Health Care & Social Assistance | 106 (22.8%) | 358 (77.2%) |
| Arts, Entertainment & Recreation | 0 (0.0%) | 0 (0.0%) |
| Accommodation & Food Services | 50 (39.1%) | 78 (60.9%) |
| Public Administration | 9 (52.9%) | 8 (47.1%) |
| Total | 1,129 (52.2%) | 1,032 (47.8%) |
Education in Sixteen Mile Stand
School Enrollment in Sixteen Mile Stand
The most common levels of schooling among the 970 students in Sixteen Mile Stand are elementary school (259 | 26.7%), high school (253 | 26.1%), and middle school (173 | 17.8%).
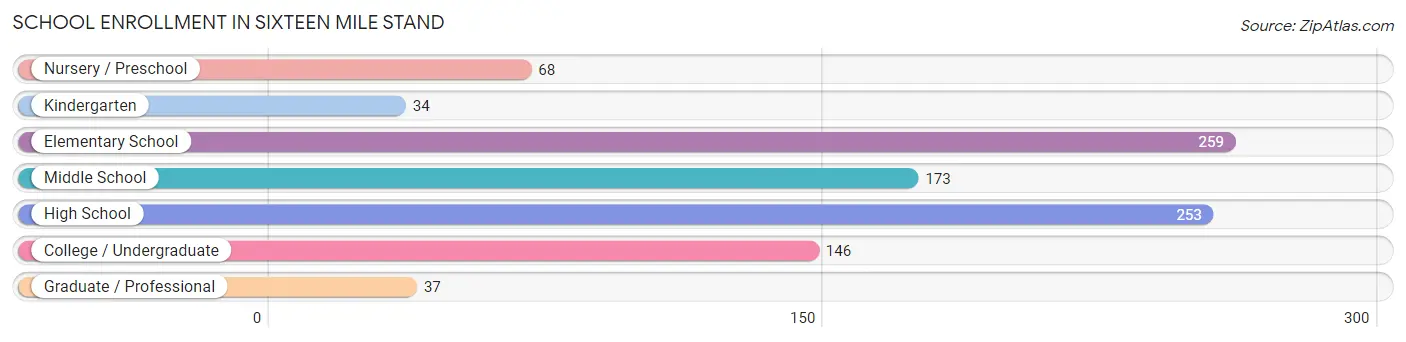
| School Level | # Students | % Students |
| Nursery / Preschool | 68 | 7.0% |
| Kindergarten | 34 | 3.5% |
| Elementary School | 259 | 26.7% |
| Middle School | 173 | 17.8% |
| High School | 253 | 26.1% |
| College / Undergraduate | 146 | 15.0% |
| Graduate / Professional | 37 | 3.8% |
| Total | 970 | 100.0% |
School Enrollment by Age by Funding Source in Sixteen Mile Stand
Out of a total of 970 students who are enrolled in schools in Sixteen Mile Stand, 186 (19.2%) attend a private institution, while the remaining 784 (80.8%) are enrolled in public schools. The age group of 3 to 4 year olds has the highest likelihood of being enrolled in private schools, with 68 (100.0% in the age bracket) enrolled. Conversely, the age group of 5 to 9 year old has the lowest likelihood of being enrolled in a private school, with 279 (100.0% in the age bracket) attending a public institution.
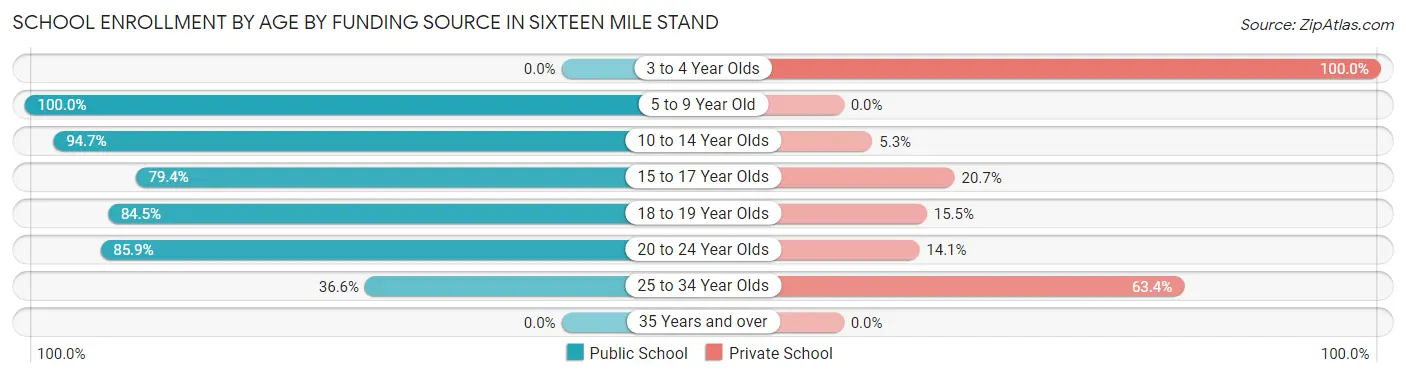
| Age Bracket | Public School | Private School |
| 3 to 4 Year Olds | 0 (0.0%) | 68 (100.0%) |
| 5 to 9 Year Old | 279 (100.0%) | 0 (0.0%) |
| 10 to 14 Year Olds | 195 (94.7%) | 11 (5.3%) |
| 15 to 17 Year Olds | 146 (79.3%) | 38 (20.6%) |
| 18 to 19 Year Olds | 71 (84.5%) | 13 (15.5%) |
| 20 to 24 Year Olds | 67 (85.9%) | 11 (14.1%) |
| 25 to 34 Year Olds | 26 (36.6%) | 45 (63.4%) |
| 35 Years and over | 0 (0.0%) | 0 (0.0%) |
| Total | 784 (80.8%) | 186 (19.2%) |
Educational Attainment by Field of Study in Sixteen Mile Stand
Business (357 | 16.0%), psychology (293 | 13.1%), engineering (292 | 13.1%), bio, nature & agricultural (266 | 11.9%), and science & technology (261 | 11.7%) are the most common fields of study among 2,232 individuals in Sixteen Mile Stand who have obtained a bachelor's degree or higher.
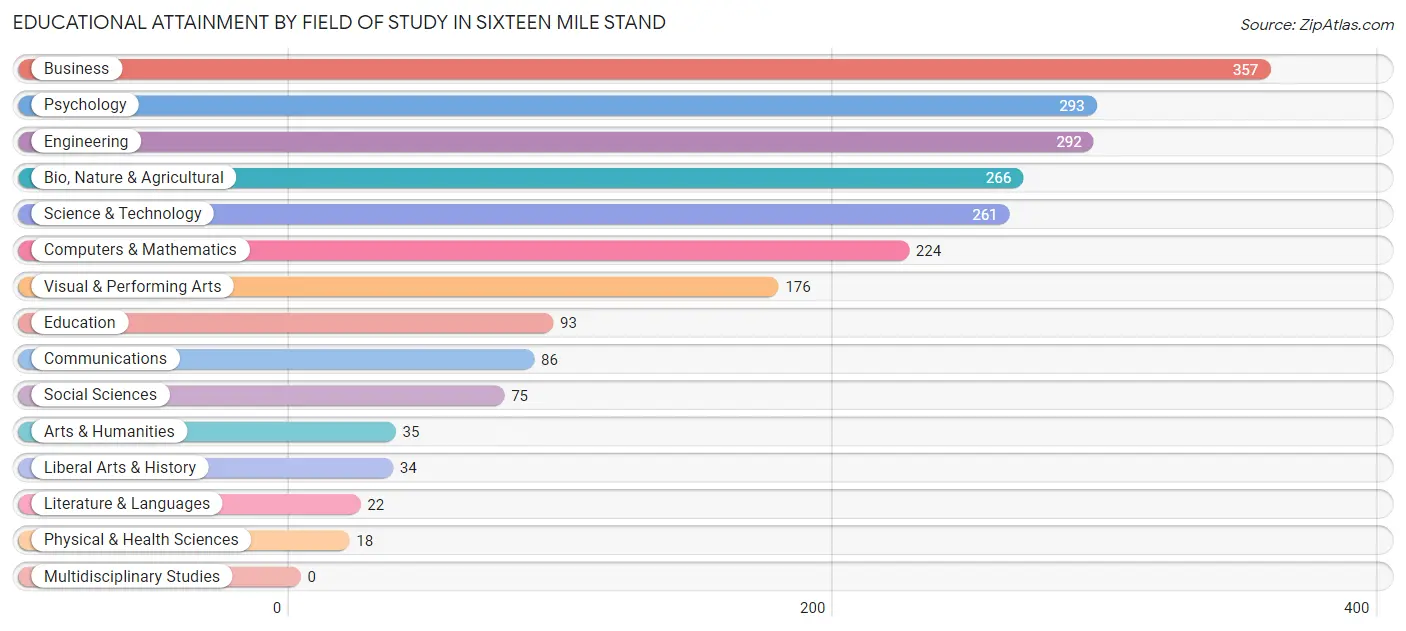
| Field of Study | # Graduates | % Graduates |
| Computers & Mathematics | 224 | 10.0% |
| Bio, Nature & Agricultural | 266 | 11.9% |
| Physical & Health Sciences | 18 | 0.8% |
| Psychology | 293 | 13.1% |
| Social Sciences | 75 | 3.4% |
| Engineering | 292 | 13.1% |
| Multidisciplinary Studies | 0 | 0.0% |
| Science & Technology | 261 | 11.7% |
| Business | 357 | 16.0% |
| Education | 93 | 4.2% |
| Literature & Languages | 22 | 1.0% |
| Liberal Arts & History | 34 | 1.5% |
| Visual & Performing Arts | 176 | 7.9% |
| Communications | 86 | 3.8% |
| Arts & Humanities | 35 | 1.6% |
| Total | 2,232 | 100.0% |
Transportation & Commute in Sixteen Mile Stand
Vehicle Availability by Sex in Sixteen Mile Stand
The most prevalent vehicle ownership categories in Sixteen Mile Stand are males with 3 vehicles (465, accounting for 41.2%) and females with 3 vehicles (484, making up 45.1%).
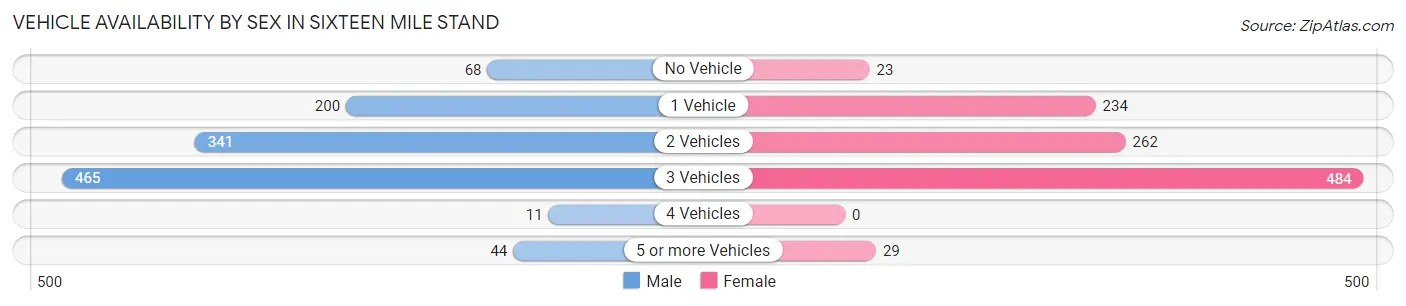
| Vehicles Available | Male | Female |
| No Vehicle | 68 (6.0%) | 23 (2.2%) |
| 1 Vehicle | 200 (17.7%) | 234 (22.7%) |
| 2 Vehicles | 341 (30.2%) | 262 (25.4%) |
| 3 Vehicles | 465 (41.2%) | 484 (46.9%) |
| 4 Vehicles | 11 (1.0%) | 0 (0.0%) |
| 5 or more Vehicles | 44 (3.9%) | 29 (2.8%) |
| Total | 1,129 (100.0%) | 1,032 (100.0%) |
Commute Time in Sixteen Mile Stand
The most frequently occuring commute durations in Sixteen Mile Stand are 10 to 14 minutes (265 commuters, 18.9%), 15 to 19 minutes (252 commuters, 17.9%), and 20 to 24 minutes (156 commuters, 11.1%).
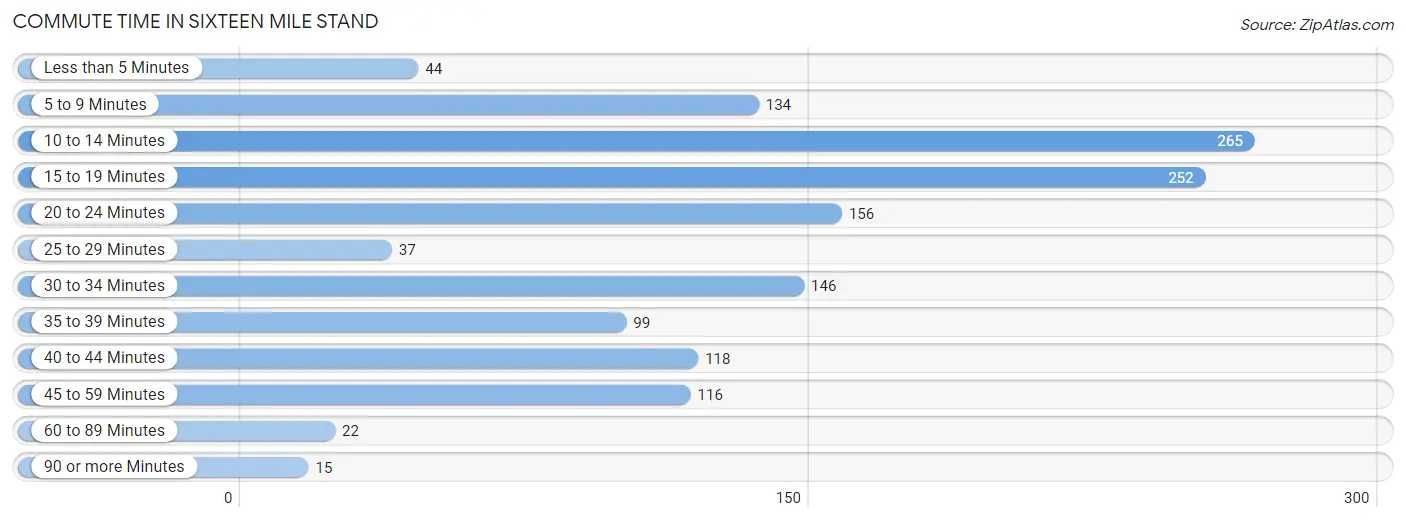
| Commute Time | # Commuters | % Commuters |
| Less than 5 Minutes | 44 | 3.1% |
| 5 to 9 Minutes | 134 | 9.5% |
| 10 to 14 Minutes | 265 | 18.9% |
| 15 to 19 Minutes | 252 | 17.9% |
| 20 to 24 Minutes | 156 | 11.1% |
| 25 to 29 Minutes | 37 | 2.6% |
| 30 to 34 Minutes | 146 | 10.4% |
| 35 to 39 Minutes | 99 | 7.0% |
| 40 to 44 Minutes | 118 | 8.4% |
| 45 to 59 Minutes | 116 | 8.3% |
| 60 to 89 Minutes | 22 | 1.6% |
| 90 or more Minutes | 15 | 1.1% |
Commute Time by Sex in Sixteen Mile Stand
The most common commute times in Sixteen Mile Stand are 10 to 14 minutes (196 commuters, 25.5%) for males and 15 to 19 minutes (155 commuters, 24.4%) for females.
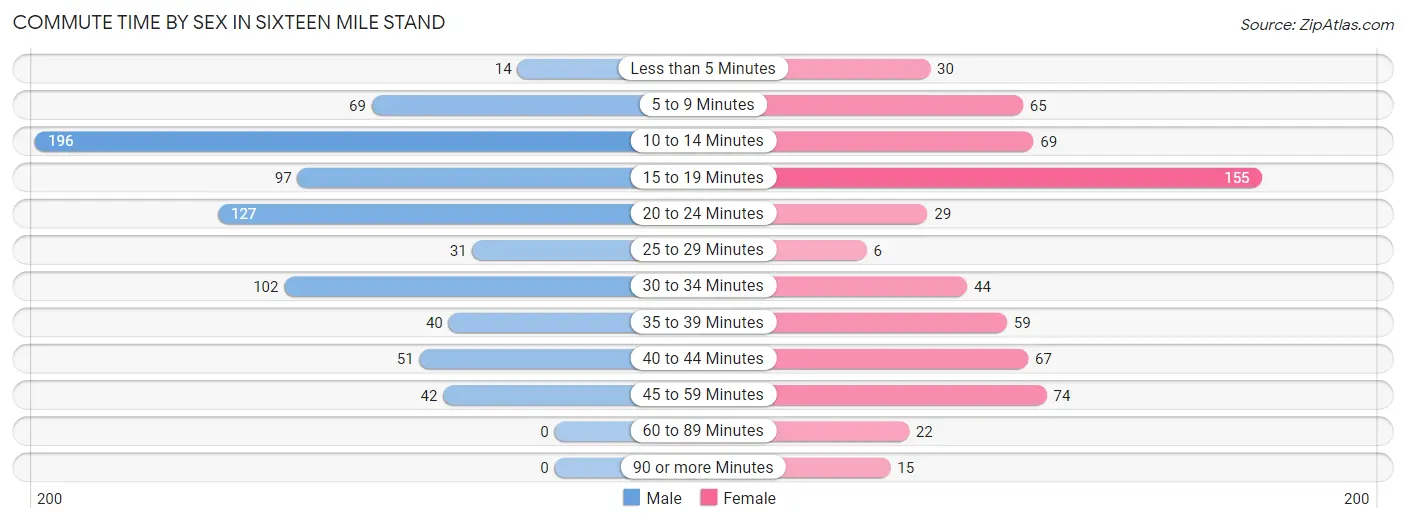
| Commute Time | Male | Female |
| Less than 5 Minutes | 14 (1.8%) | 30 (4.7%) |
| 5 to 9 Minutes | 69 (9.0%) | 65 (10.2%) |
| 10 to 14 Minutes | 196 (25.5%) | 69 (10.9%) |
| 15 to 19 Minutes | 97 (12.6%) | 155 (24.4%) |
| 20 to 24 Minutes | 127 (16.5%) | 29 (4.6%) |
| 25 to 29 Minutes | 31 (4.0%) | 6 (0.9%) |
| 30 to 34 Minutes | 102 (13.3%) | 44 (6.9%) |
| 35 to 39 Minutes | 40 (5.2%) | 59 (9.3%) |
| 40 to 44 Minutes | 51 (6.6%) | 67 (10.5%) |
| 45 to 59 Minutes | 42 (5.5%) | 74 (11.7%) |
| 60 to 89 Minutes | 0 (0.0%) | 22 (3.5%) |
| 90 or more Minutes | 0 (0.0%) | 15 (2.4%) |
Time of Departure to Work by Sex in Sixteen Mile Stand
The most frequent times of departure to work in Sixteen Mile Stand are 8:00 AM to 8:29 AM (155, 20.2%) for males and 7:00 AM to 7:29 AM (130, 20.5%) for females.
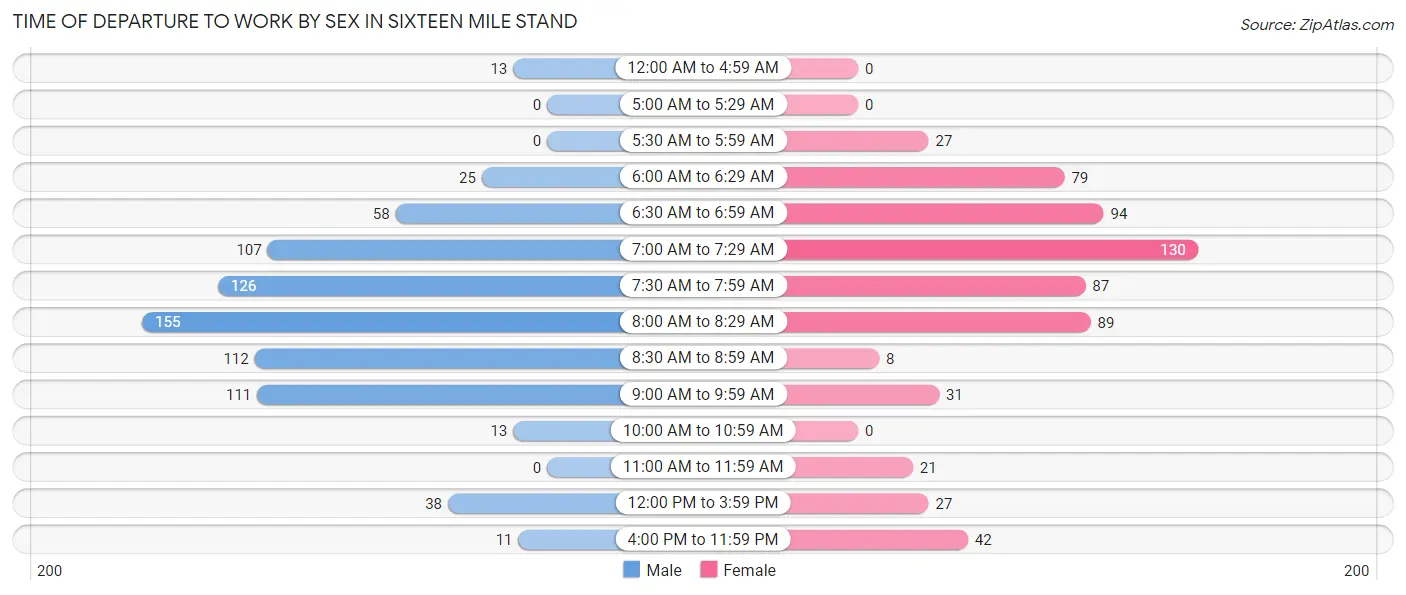
| Time of Departure | Male | Female |
| 12:00 AM to 4:59 AM | 13 (1.7%) | 0 (0.0%) |
| 5:00 AM to 5:29 AM | 0 (0.0%) | 0 (0.0%) |
| 5:30 AM to 5:59 AM | 0 (0.0%) | 27 (4.3%) |
| 6:00 AM to 6:29 AM | 25 (3.3%) | 79 (12.4%) |
| 6:30 AM to 6:59 AM | 58 (7.5%) | 94 (14.8%) |
| 7:00 AM to 7:29 AM | 107 (13.9%) | 130 (20.5%) |
| 7:30 AM to 7:59 AM | 126 (16.4%) | 87 (13.7%) |
| 8:00 AM to 8:29 AM | 155 (20.2%) | 89 (14.0%) |
| 8:30 AM to 8:59 AM | 112 (14.6%) | 8 (1.3%) |
| 9:00 AM to 9:59 AM | 111 (14.4%) | 31 (4.9%) |
| 10:00 AM to 10:59 AM | 13 (1.7%) | 0 (0.0%) |
| 11:00 AM to 11:59 AM | 0 (0.0%) | 21 (3.3%) |
| 12:00 PM to 3:59 PM | 38 (4.9%) | 27 (4.3%) |
| 4:00 PM to 11:59 PM | 11 (1.4%) | 42 (6.6%) |
| Total | 769 (100.0%) | 635 (100.0%) |
Housing Occupancy in Sixteen Mile Stand
Occupancy by Ownership in Sixteen Mile Stand
Of the total 1,389 dwellings in Sixteen Mile Stand, owner-occupied units account for 773 (55.6%), while renter-occupied units make up 616 (44.4%).
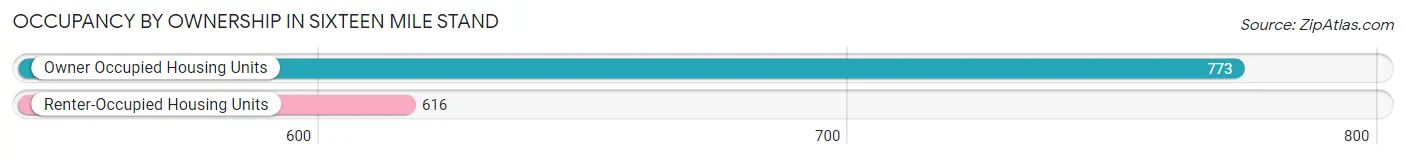
| Occupancy | # Housing Units | % Housing Units |
| Owner Occupied Housing Units | 773 | 55.6% |
| Renter-Occupied Housing Units | 616 | 44.4% |
| Total Occupied Housing Units | 1,389 | 100.0% |
Occupancy by Household Size in Sixteen Mile Stand
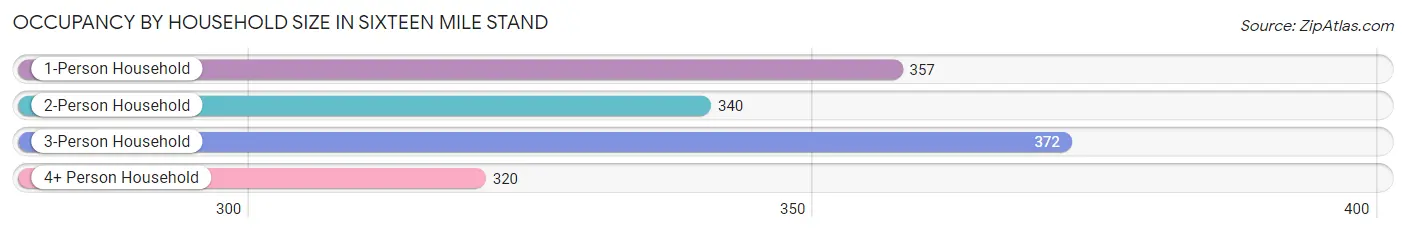
| Household Size | # Housing Units | % Housing Units |
| 1-Person Household | 357 | 25.7% |
| 2-Person Household | 340 | 24.5% |
| 3-Person Household | 372 | 26.8% |
| 4+ Person Household | 320 | 23.0% |
| Total Housing Units | 1,389 | 100.0% |
Occupancy by Ownership by Household Size in Sixteen Mile Stand
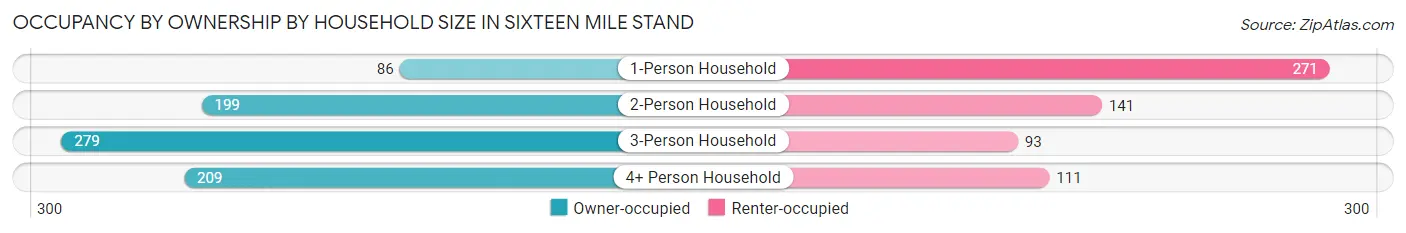
| Household Size | Owner-occupied | Renter-occupied |
| 1-Person Household | 86 (24.1%) | 271 (75.9%) |
| 2-Person Household | 199 (58.5%) | 141 (41.5%) |
| 3-Person Household | 279 (75.0%) | 93 (25.0%) |
| 4+ Person Household | 209 (65.3%) | 111 (34.7%) |
| Total Housing Units | 773 (55.6%) | 616 (44.4%) |
Occupancy by Educational Attainment in Sixteen Mile Stand
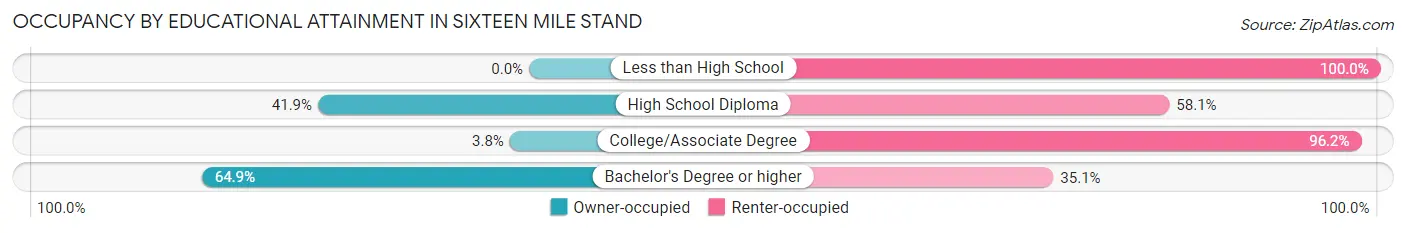
| Household Size | Owner-occupied | Renter-occupied |
| Less than High School | 0 (0.0%) | 19 (100.0%) |
| High School Diploma | 36 (41.9%) | 50 (58.1%) |
| College/Associate Degree | 6 (3.8%) | 151 (96.2%) |
| Bachelor's Degree or higher | 731 (64.9%) | 396 (35.1%) |
Occupancy by Age of Householder in Sixteen Mile Stand
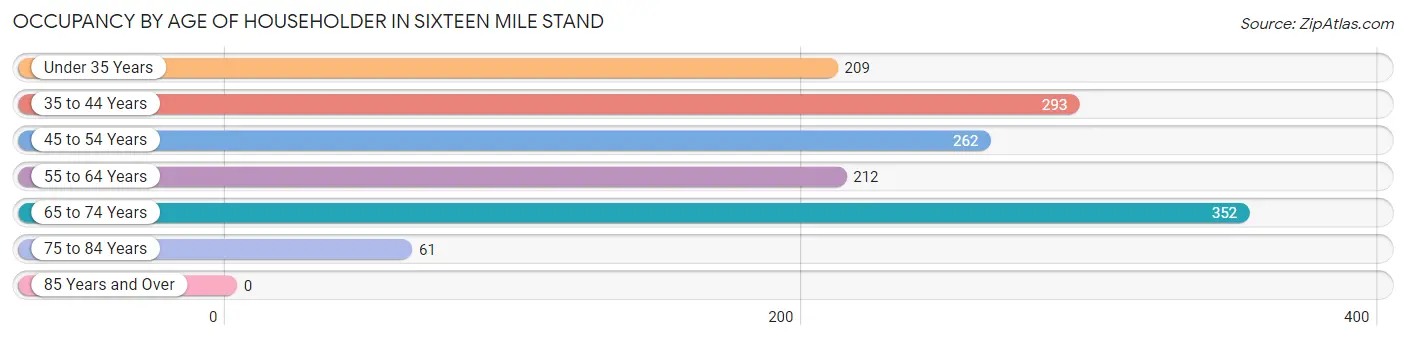
| Age Bracket | # Households | % Households |
| Under 35 Years | 209 | 15.0% |
| 35 to 44 Years | 293 | 21.1% |
| 45 to 54 Years | 262 | 18.9% |
| 55 to 64 Years | 212 | 15.3% |
| 65 to 74 Years | 352 | 25.3% |
| 75 to 84 Years | 61 | 4.4% |
| 85 Years and Over | 0 | 0.0% |
| Total | 1,389 | 100.0% |
Housing Finances in Sixteen Mile Stand
Median Income by Occupancy in Sixteen Mile Stand
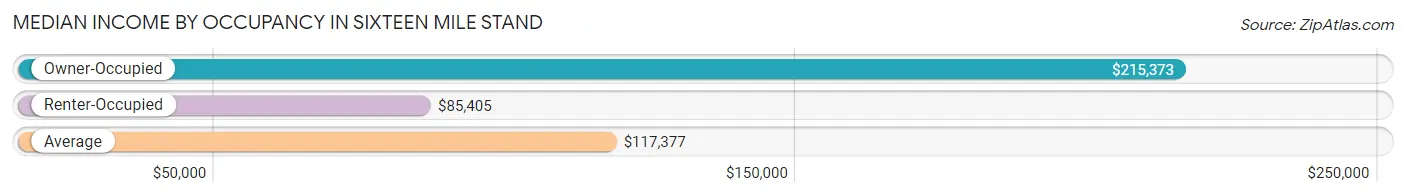
| Occupancy Type | # Households | Median Income |
| Owner-Occupied | 773 (55.6%) | $215,373 |
| Renter-Occupied | 616 (44.4%) | $85,405 |
| Average | 1,389 (100.0%) | $117,377 |
Occupancy by Householder Income Bracket in Sixteen Mile Stand
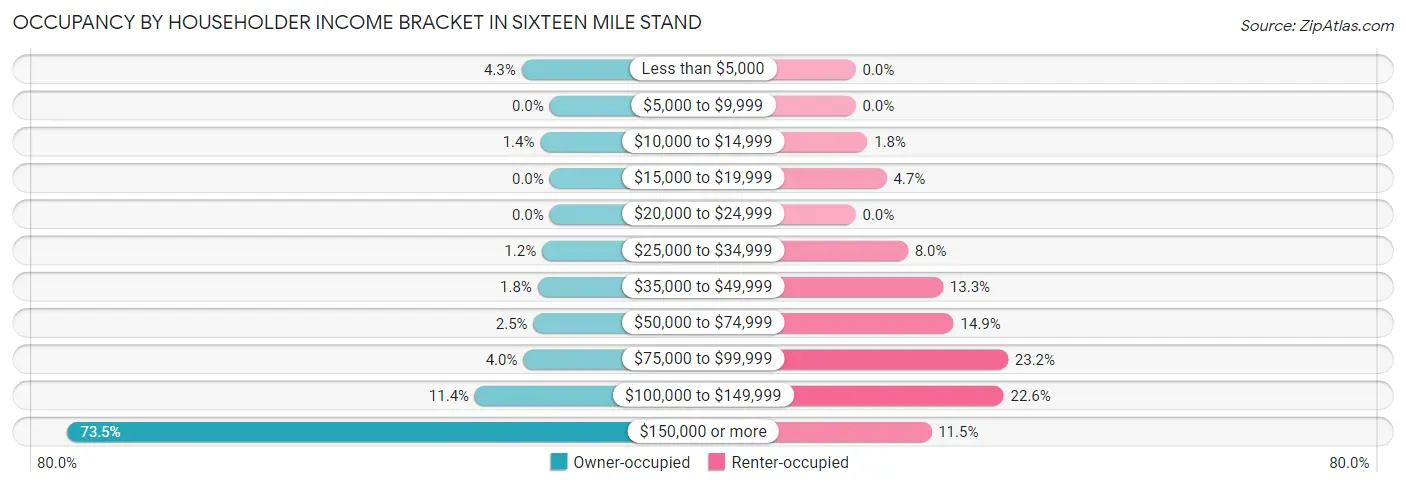
| Income Bracket | Owner-occupied | Renter-occupied |
| Less than $5,000 | 33 (4.3%) | 0 (0.0%) |
| $5,000 to $9,999 | 0 (0.0%) | 0 (0.0%) |
| $10,000 to $14,999 | 11 (1.4%) | 11 (1.8%) |
| $15,000 to $19,999 | 0 (0.0%) | 29 (4.7%) |
| $20,000 to $24,999 | 0 (0.0%) | 0 (0.0%) |
| $25,000 to $34,999 | 9 (1.2%) | 49 (8.0%) |
| $35,000 to $49,999 | 14 (1.8%) | 82 (13.3%) |
| $50,000 to $74,999 | 19 (2.5%) | 92 (14.9%) |
| $75,000 to $99,999 | 31 (4.0%) | 143 (23.2%) |
| $100,000 to $149,999 | 88 (11.4%) | 139 (22.6%) |
| $150,000 or more | 568 (73.5%) | 71 (11.5%) |
| Total | 773 (100.0%) | 616 (100.0%) |
Monthly Housing Cost Tiers in Sixteen Mile Stand
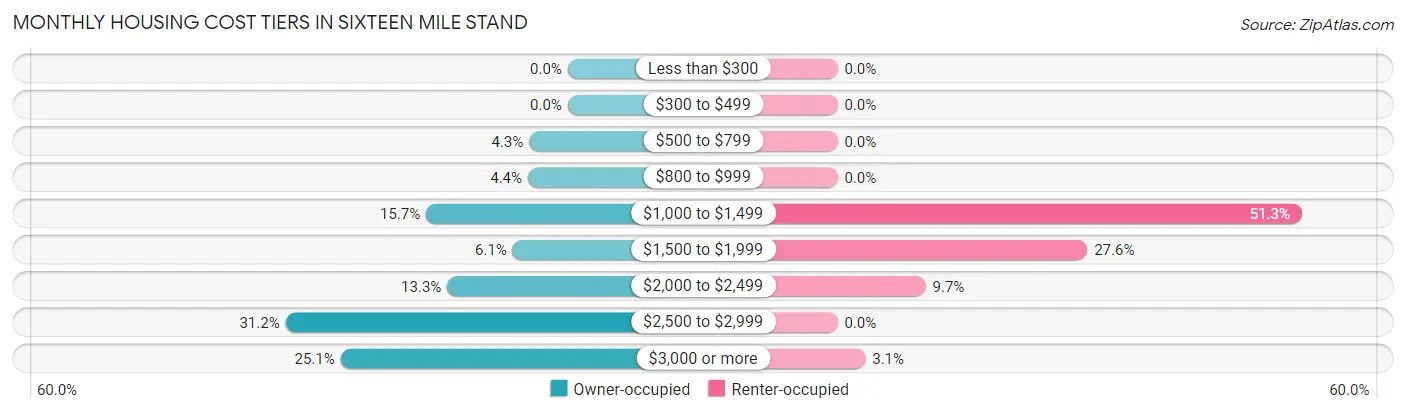
| Monthly Cost | Owner-occupied | Renter-occupied |
| Less than $300 | 0 (0.0%) | 0 (0.0%) |
| $300 to $499 | 0 (0.0%) | 0 (0.0%) |
| $500 to $799 | 33 (4.3%) | 0 (0.0%) |
| $800 to $999 | 34 (4.4%) | 0 (0.0%) |
| $1,000 to $1,499 | 121 (15.7%) | 316 (51.3%) |
| $1,500 to $1,999 | 47 (6.1%) | 170 (27.6%) |
| $2,000 to $2,499 | 103 (13.3%) | 60 (9.7%) |
| $2,500 to $2,999 | 241 (31.2%) | 0 (0.0%) |
| $3,000 or more | 194 (25.1%) | 19 (3.1%) |
| Total | 773 (100.0%) | 616 (100.0%) |
Physical Housing Characteristics in Sixteen Mile Stand
Housing Structures in Sixteen Mile Stand
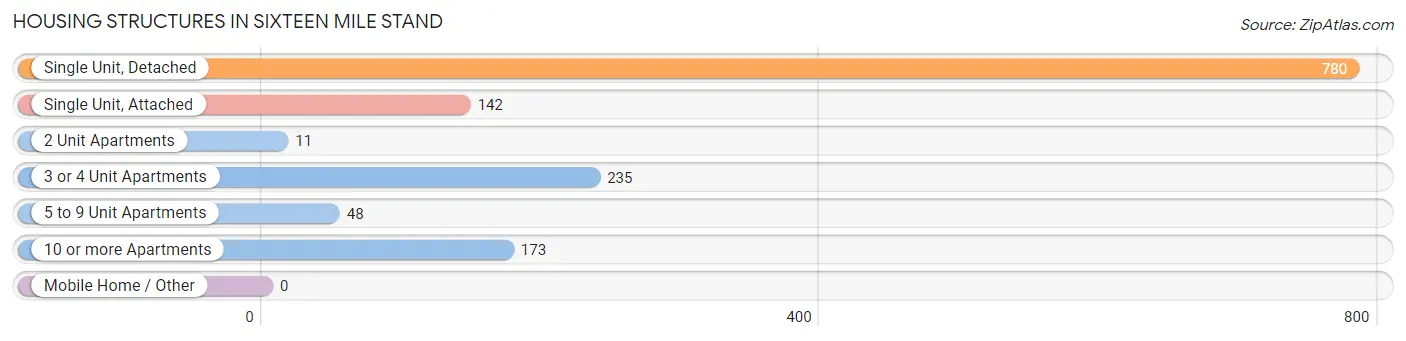
| Structure Type | # Housing Units | % Housing Units |
| Single Unit, Detached | 780 | 56.2% |
| Single Unit, Attached | 142 | 10.2% |
| 2 Unit Apartments | 11 | 0.8% |
| 3 or 4 Unit Apartments | 235 | 16.9% |
| 5 to 9 Unit Apartments | 48 | 3.5% |
| 10 or more Apartments | 173 | 12.5% |
| Mobile Home / Other | 0 | 0.0% |
| Total | 1,389 | 100.0% |
Housing Structures by Occupancy in Sixteen Mile Stand
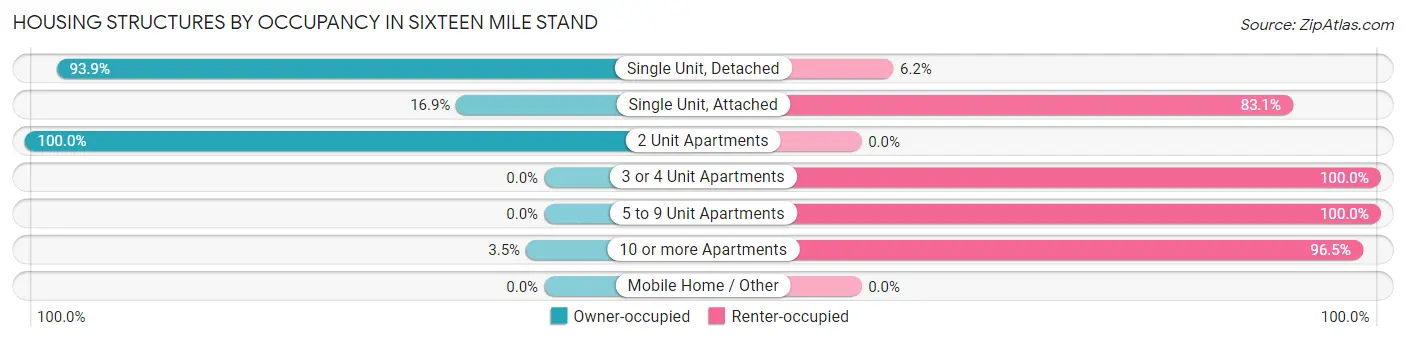
| Structure Type | Owner-occupied | Renter-occupied |
| Single Unit, Detached | 732 (93.9%) | 48 (6.1%) |
| Single Unit, Attached | 24 (16.9%) | 118 (83.1%) |
| 2 Unit Apartments | 11 (100.0%) | 0 (0.0%) |
| 3 or 4 Unit Apartments | 0 (0.0%) | 235 (100.0%) |
| 5 to 9 Unit Apartments | 0 (0.0%) | 48 (100.0%) |
| 10 or more Apartments | 6 (3.5%) | 167 (96.5%) |
| Mobile Home / Other | 0 (0.0%) | 0 (0.0%) |
| Total | 773 (55.6%) | 616 (44.4%) |
Housing Structures by Number of Rooms in Sixteen Mile Stand
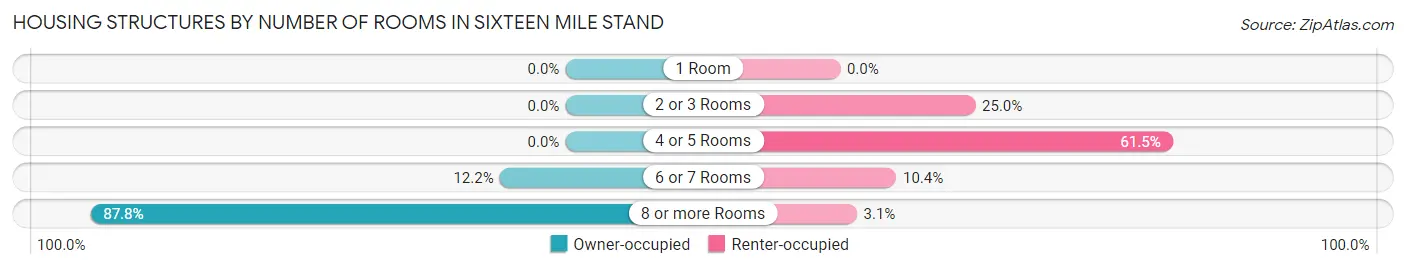
| Number of Rooms | Owner-occupied | Renter-occupied |
| 1 Room | 0 (0.0%) | 0 (0.0%) |
| 2 or 3 Rooms | 0 (0.0%) | 154 (25.0%) |
| 4 or 5 Rooms | 0 (0.0%) | 379 (61.5%) |
| 6 or 7 Rooms | 94 (12.2%) | 64 (10.4%) |
| 8 or more Rooms | 679 (87.8%) | 19 (3.1%) |
| Total | 773 (100.0%) | 616 (100.0%) |
Housing Structure by Heating Type in Sixteen Mile Stand
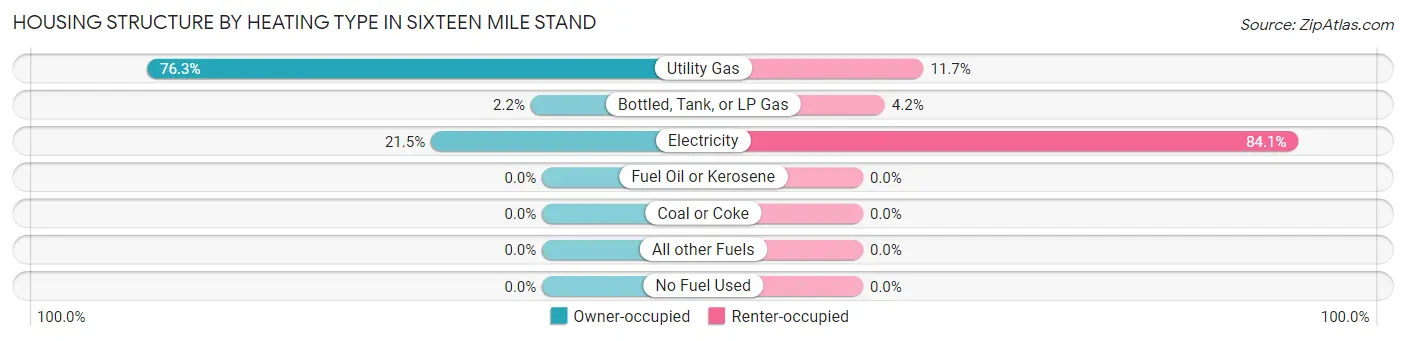
| Heating Type | Owner-occupied | Renter-occupied |
| Utility Gas | 590 (76.3%) | 72 (11.7%) |
| Bottled, Tank, or LP Gas | 17 (2.2%) | 26 (4.2%) |
| Electricity | 166 (21.5%) | 518 (84.1%) |
| Fuel Oil or Kerosene | 0 (0.0%) | 0 (0.0%) |
| Coal or Coke | 0 (0.0%) | 0 (0.0%) |
| All other Fuels | 0 (0.0%) | 0 (0.0%) |
| No Fuel Used | 0 (0.0%) | 0 (0.0%) |
| Total | 773 (100.0%) | 616 (100.0%) |
Household Vehicle Usage in Sixteen Mile Stand
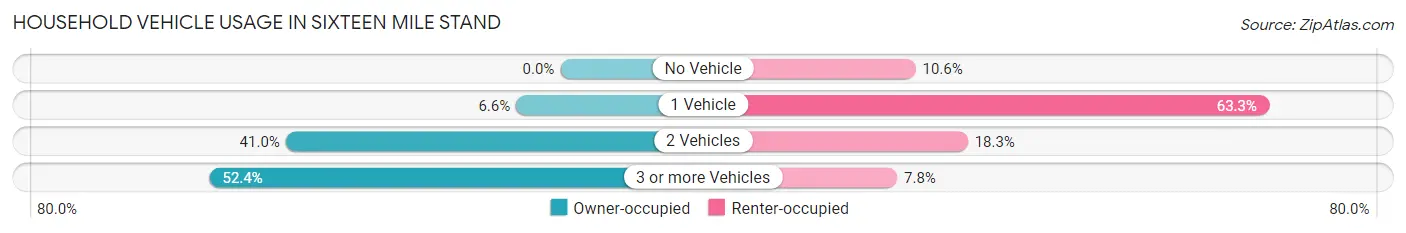
| Vehicles per Household | Owner-occupied | Renter-occupied |
| No Vehicle | 0 (0.0%) | 65 (10.5%) |
| 1 Vehicle | 51 (6.6%) | 390 (63.3%) |
| 2 Vehicles | 317 (41.0%) | 113 (18.3%) |
| 3 or more Vehicles | 405 (52.4%) | 48 (7.8%) |
| Total | 773 (100.0%) | 616 (100.0%) |
Real Estate & Mortgages in Sixteen Mile Stand
Real Estate and Mortgage Overview in Sixteen Mile Stand
| Characteristic | Without Mortgage | With Mortgage |
| Housing Units | 205 | 568 |
| Median Property Value | $556,500 | $583,300 |
| Median Household Income | $108,173 | $475 |
| Monthly Housing Costs | $1,123 | $194 |
| Real Estate Taxes | $8,168 | $11 |
Property Value by Mortgage Status in Sixteen Mile Stand
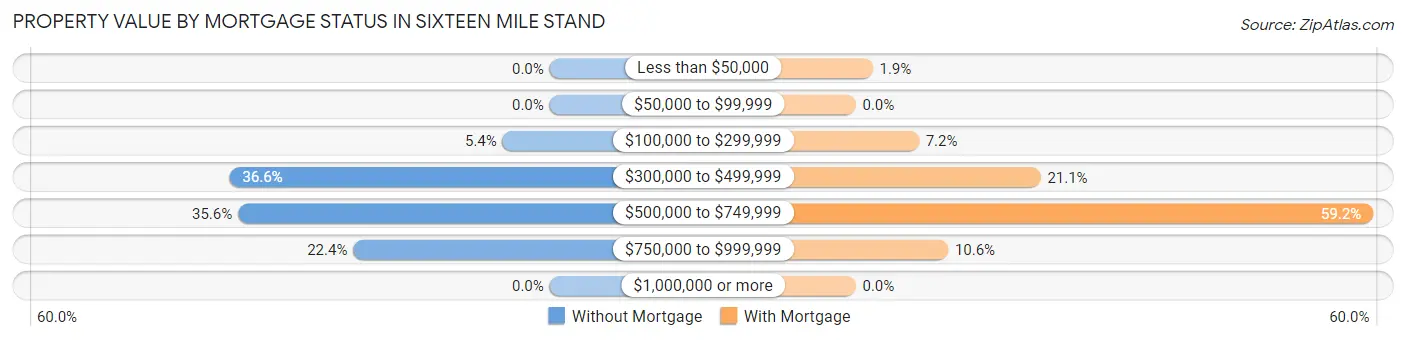
| Property Value | Without Mortgage | With Mortgage |
| Less than $50,000 | 0 (0.0%) | 11 (1.9%) |
| $50,000 to $99,999 | 0 (0.0%) | 0 (0.0%) |
| $100,000 to $299,999 | 11 (5.4%) | 41 (7.2%) |
| $300,000 to $499,999 | 75 (36.6%) | 120 (21.1%) |
| $500,000 to $749,999 | 73 (35.6%) | 336 (59.2%) |
| $750,000 to $999,999 | 46 (22.4%) | 60 (10.6%) |
| $1,000,000 or more | 0 (0.0%) | 0 (0.0%) |
| Total | 205 (100.0%) | 568 (100.0%) |
Household Income by Mortgage Status in Sixteen Mile Stand
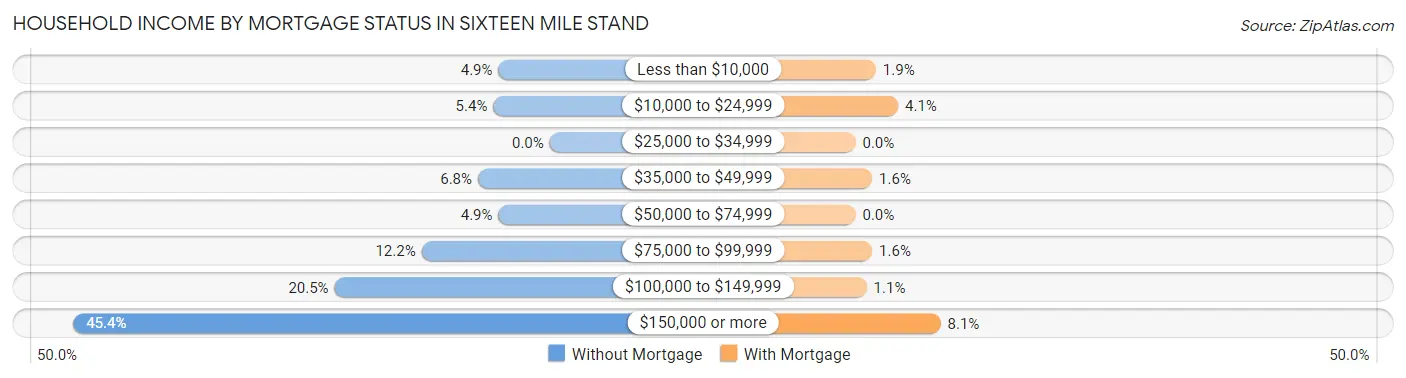
| Household Income | Without Mortgage | With Mortgage |
| Less than $10,000 | 10 (4.9%) | 11 (1.9%) |
| $10,000 to $24,999 | 11 (5.4%) | 23 (4.1%) |
| $25,000 to $34,999 | 0 (0.0%) | 0 (0.0%) |
| $35,000 to $49,999 | 14 (6.8%) | 9 (1.6%) |
| $50,000 to $74,999 | 10 (4.9%) | 0 (0.0%) |
| $75,000 to $99,999 | 25 (12.2%) | 9 (1.6%) |
| $100,000 to $149,999 | 42 (20.5%) | 6 (1.1%) |
| $150,000 or more | 93 (45.4%) | 46 (8.1%) |
| Total | 205 (100.0%) | 568 (100.0%) |
Property Value to Household Income Ratio in Sixteen Mile Stand
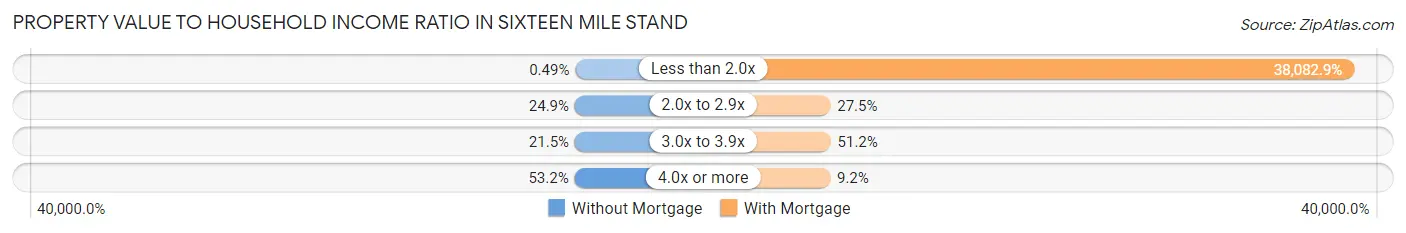
| Value-to-Income Ratio | Without Mortgage | With Mortgage |
| Less than 2.0x | 1 (0.5%) | 216,311 (38,082.9%) |
| 2.0x to 2.9x | 51 (24.9%) | 156 (27.5%) |
| 3.0x to 3.9x | 44 (21.5%) | 291 (51.2%) |
| 4.0x or more | 109 (53.2%) | 52 (9.1%) |
| Total | 205 (100.0%) | 568 (100.0%) |
Real Estate Taxes by Mortgage Status in Sixteen Mile Stand
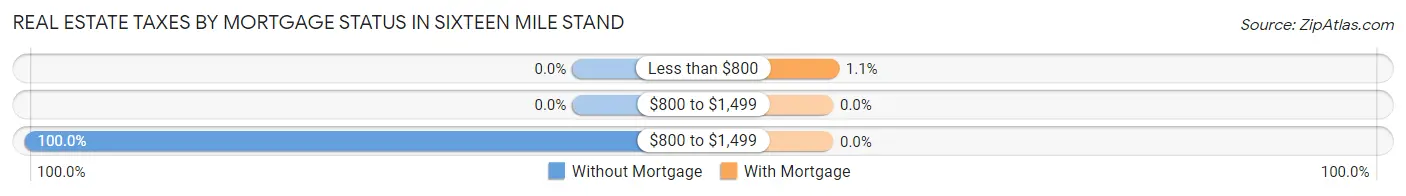
| Property Taxes | Without Mortgage | With Mortgage |
| Less than $800 | 0 (0.0%) | 6 (1.1%) |
| $800 to $1,499 | 0 (0.0%) | 0 (0.0%) |
| $800 to $1,499 | 205 (100.0%) | 0 (0.0%) |
| Total | 205 (100.0%) | 568 (100.0%) |
Health & Disability in Sixteen Mile Stand
Health Insurance Coverage by Age in Sixteen Mile Stand
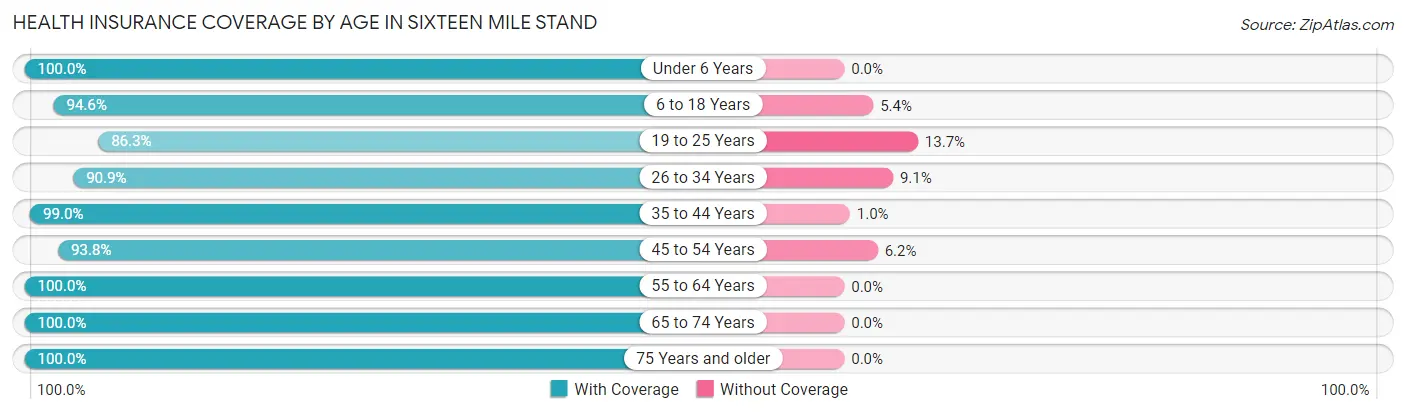
| Age Bracket | With Coverage | Without Coverage |
| Under 6 Years | 281 (100.0%) | 0 (0.0%) |
| 6 to 18 Years | 666 (94.6%) | 38 (5.4%) |
| 19 to 25 Years | 132 (86.3%) | 21 (13.7%) |
| 26 to 34 Years | 341 (90.9%) | 34 (9.1%) |
| 35 to 44 Years | 569 (99.0%) | 6 (1.0%) |
| 45 to 54 Years | 346 (93.8%) | 23 (6.2%) |
| 55 to 64 Years | 367 (100.0%) | 0 (0.0%) |
| 65 to 74 Years | 725 (100.0%) | 0 (0.0%) |
| 75 Years and older | 128 (100.0%) | 0 (0.0%) |
| Total | 3,555 (96.7%) | 122 (3.3%) |
Health Insurance Coverage by Citizenship Status in Sixteen Mile Stand
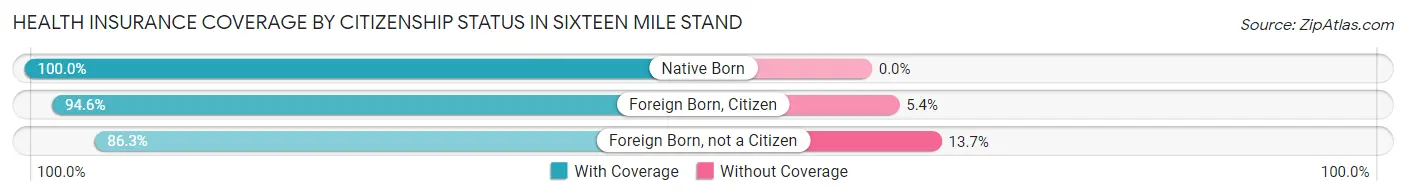
| Citizenship Status | With Coverage | Without Coverage |
| Native Born | 281 (100.0%) | 0 (0.0%) |
| Foreign Born, Citizen | 666 (94.6%) | 38 (5.4%) |
| Foreign Born, not a Citizen | 132 (86.3%) | 21 (13.7%) |
Health Insurance Coverage by Household Income in Sixteen Mile Stand
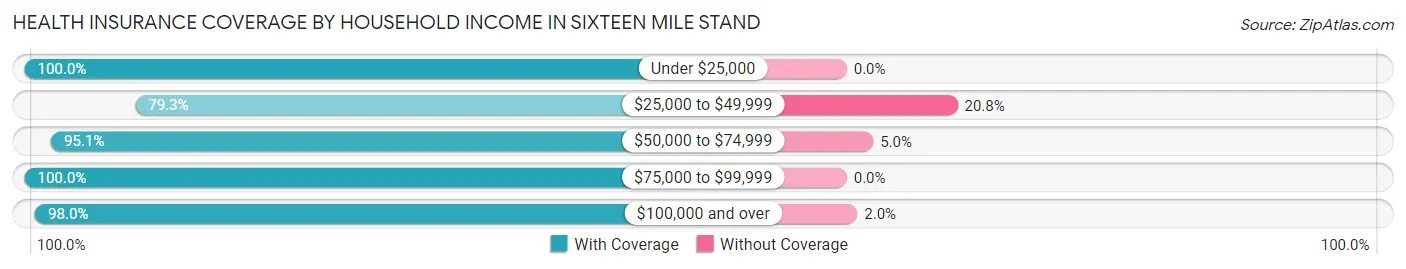
| Household Income | With Coverage | Without Coverage |
| Under $25,000 | 112 (100.0%) | 0 (0.0%) |
| $25,000 to $49,999 | 233 (79.2%) | 61 (20.7%) |
| $50,000 to $74,999 | 173 (95.1%) | 9 (5.0%) |
| $75,000 to $99,999 | 457 (100.0%) | 0 (0.0%) |
| $100,000 and over | 2,580 (98.0%) | 52 (2.0%) |
Public vs Private Health Insurance Coverage by Age in Sixteen Mile Stand
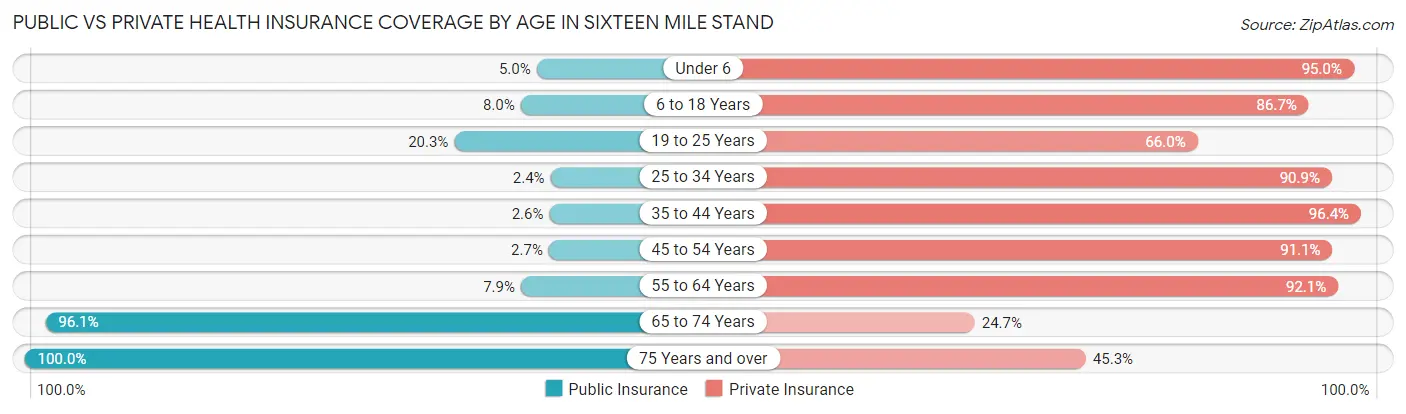
| Age Bracket | Public Insurance | Private Insurance |
| Under 6 | 14 (5.0%) | 267 (95.0%) |
| 6 to 18 Years | 56 (8.0%) | 610 (86.7%) |
| 19 to 25 Years | 31 (20.3%) | 101 (66.0%) |
| 25 to 34 Years | 9 (2.4%) | 341 (90.9%) |
| 35 to 44 Years | 15 (2.6%) | 554 (96.4%) |
| 45 to 54 Years | 10 (2.7%) | 336 (91.1%) |
| 55 to 64 Years | 29 (7.9%) | 338 (92.1%) |
| 65 to 74 Years | 697 (96.1%) | 179 (24.7%) |
| 75 Years and over | 128 (100.0%) | 58 (45.3%) |
| Total | 989 (26.9%) | 2,784 (75.7%) |
Disability Status by Sex by Age in Sixteen Mile Stand
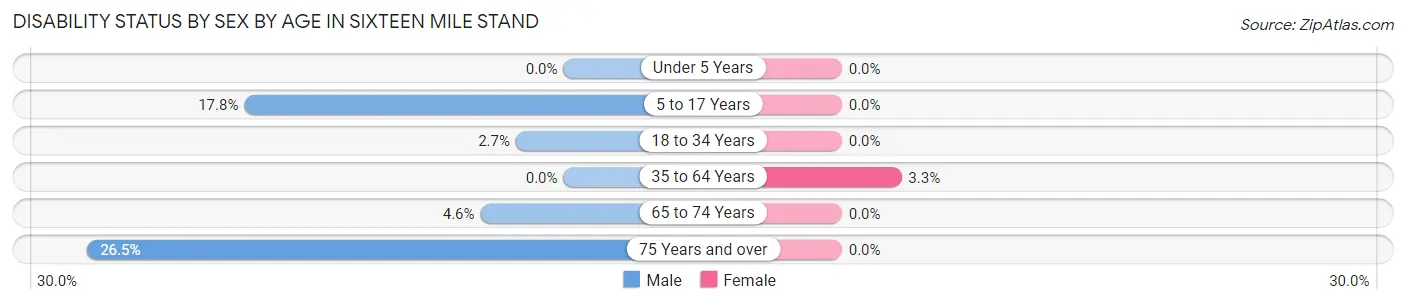
| Age Bracket | Male | Female |
| Under 5 Years | 0 (0.0%) | 0 (0.0%) |
| 5 to 17 Years | 70 (17.8%) | 0 (0.0%) |
| 18 to 34 Years | 9 (2.6%) | 0 (0.0%) |
| 35 to 64 Years | 0 (0.0%) | 23 (3.3%) |
| 65 to 74 Years | 14 (4.6%) | 0 (0.0%) |
| 75 Years and over | 22 (26.5%) | 0 (0.0%) |
Disability Class by Sex by Age in Sixteen Mile Stand
Disability Class: Hearing Difficulty
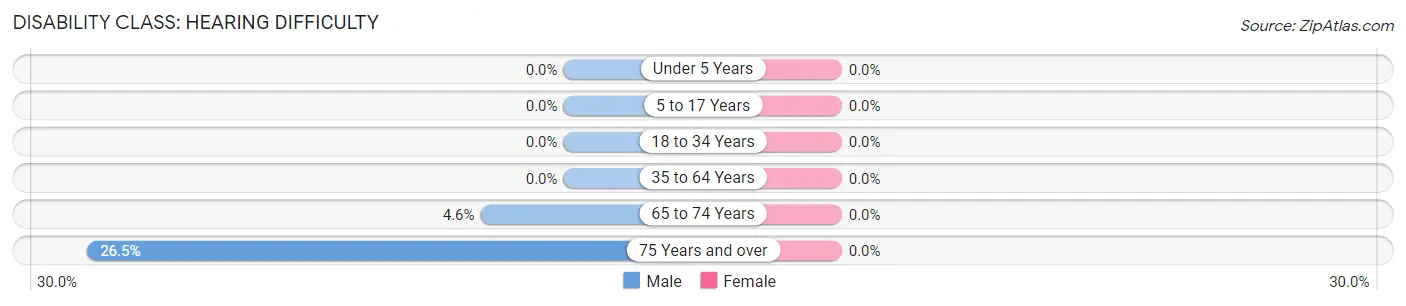
| Age Bracket | Male | Female |
| Under 5 Years | 0 (0.0%) | 0 (0.0%) |
| 5 to 17 Years | 0 (0.0%) | 0 (0.0%) |
| 18 to 34 Years | 0 (0.0%) | 0 (0.0%) |
| 35 to 64 Years | 0 (0.0%) | 0 (0.0%) |
| 65 to 74 Years | 14 (4.6%) | 0 (0.0%) |
| 75 Years and over | 22 (26.5%) | 0 (0.0%) |
Disability Class: Vision Difficulty
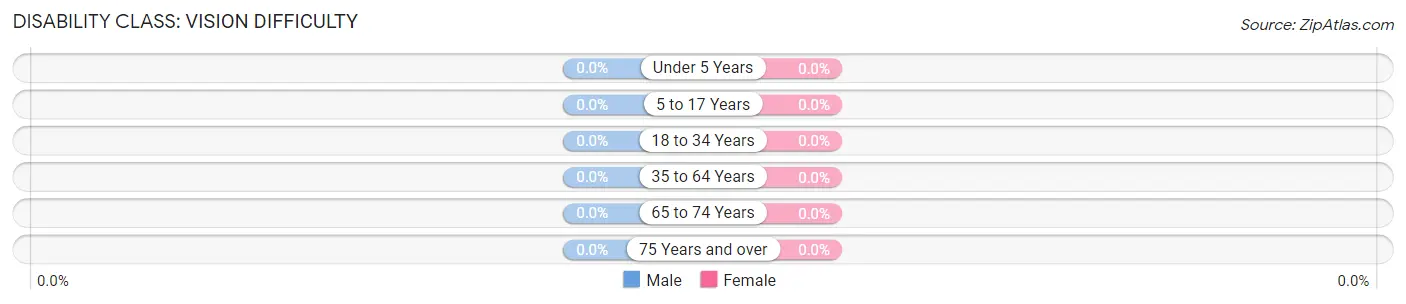
| Age Bracket | Male | Female |
| Under 5 Years | 0 (0.0%) | 0 (0.0%) |
| 5 to 17 Years | 0 (0.0%) | 0 (0.0%) |
| 18 to 34 Years | 0 (0.0%) | 0 (0.0%) |
| 35 to 64 Years | 0 (0.0%) | 0 (0.0%) |
| 65 to 74 Years | 0 (0.0%) | 0 (0.0%) |
| 75 Years and over | 0 (0.0%) | 0 (0.0%) |
Disability Class: Cognitive Difficulty
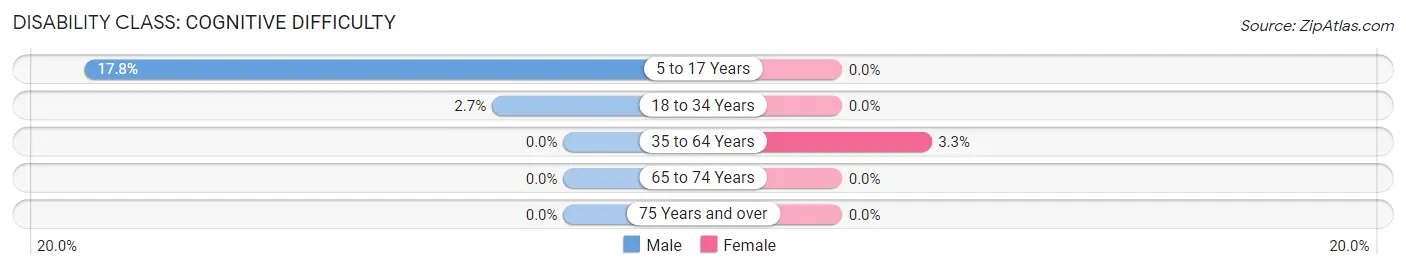
| Age Bracket | Male | Female |
| 5 to 17 Years | 70 (17.8%) | 0 (0.0%) |
| 18 to 34 Years | 9 (2.6%) | 0 (0.0%) |
| 35 to 64 Years | 0 (0.0%) | 23 (3.3%) |
| 65 to 74 Years | 0 (0.0%) | 0 (0.0%) |
| 75 Years and over | 0 (0.0%) | 0 (0.0%) |
Disability Class: Ambulatory Difficulty
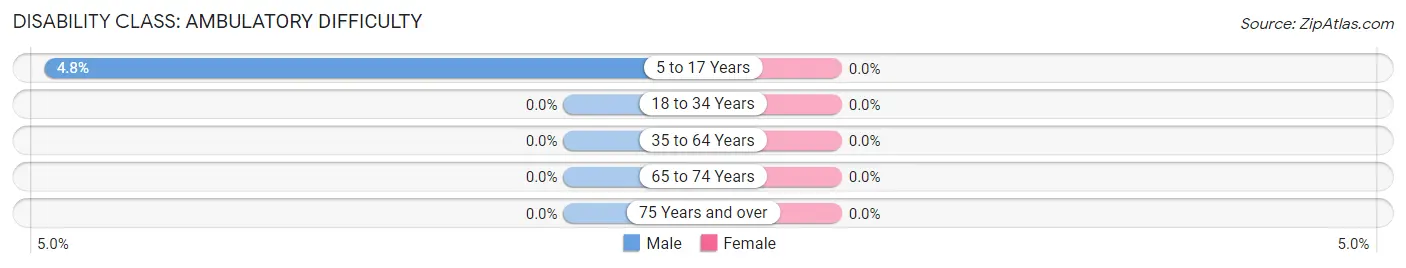
| Age Bracket | Male | Female |
| 5 to 17 Years | 19 (4.8%) | 0 (0.0%) |
| 18 to 34 Years | 0 (0.0%) | 0 (0.0%) |
| 35 to 64 Years | 0 (0.0%) | 0 (0.0%) |
| 65 to 74 Years | 0 (0.0%) | 0 (0.0%) |
| 75 Years and over | 0 (0.0%) | 0 (0.0%) |
Disability Class: Self-Care Difficulty
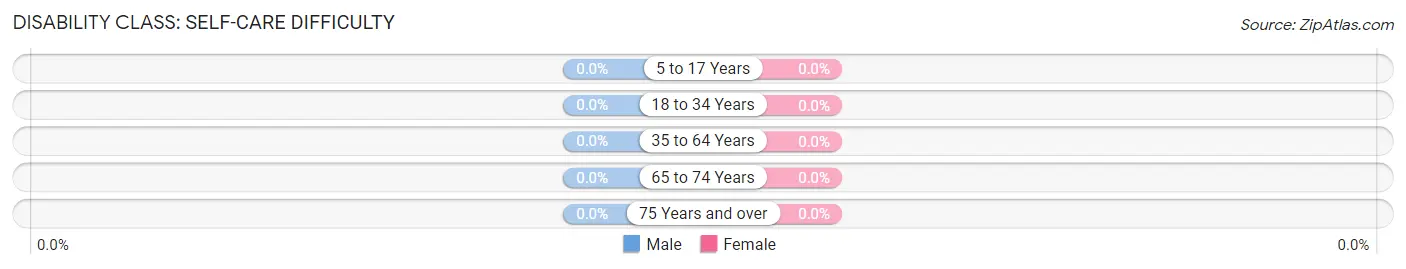
| Age Bracket | Male | Female |
| 5 to 17 Years | 0 (0.0%) | 0 (0.0%) |
| 18 to 34 Years | 0 (0.0%) | 0 (0.0%) |
| 35 to 64 Years | 0 (0.0%) | 0 (0.0%) |
| 65 to 74 Years | 0 (0.0%) | 0 (0.0%) |
| 75 Years and over | 0 (0.0%) | 0 (0.0%) |
Technology Access in Sixteen Mile Stand
Computing Device Access in Sixteen Mile Stand
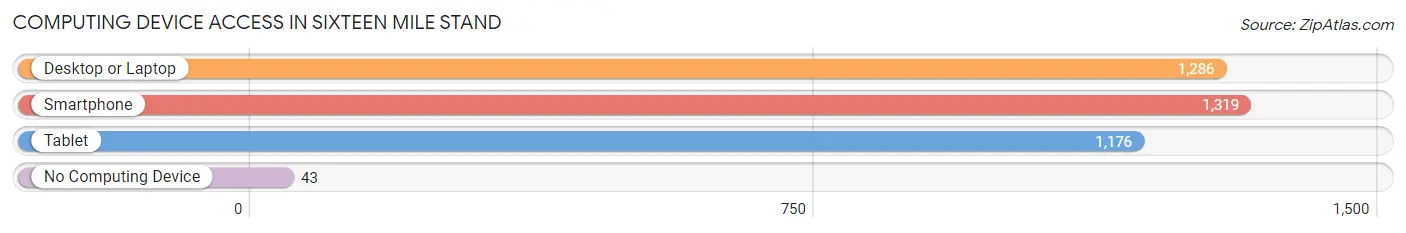
| Device Type | # Households | % Households |
| Desktop or Laptop | 1,286 | 92.6% |
| Smartphone | 1,319 | 95.0% |
| Tablet | 1,176 | 84.7% |
| No Computing Device | 43 | 3.1% |
| Total | 1,389 | 100.0% |
Internet Access in Sixteen Mile Stand
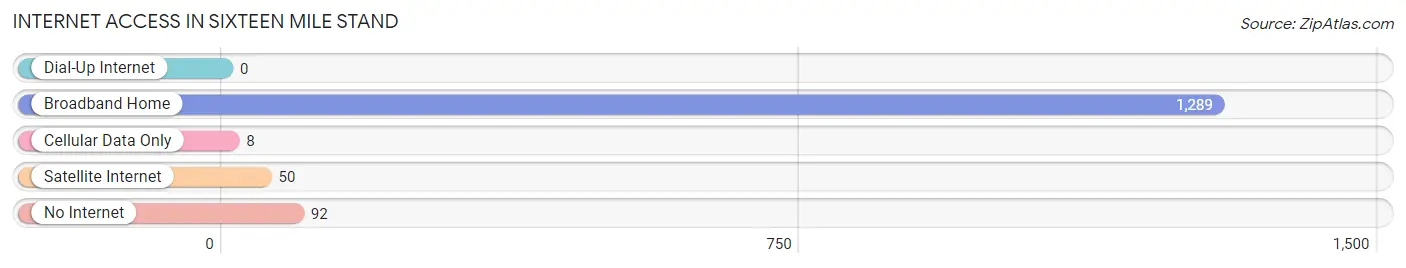
| Internet Type | # Households | % Households |
| Dial-Up Internet | 0 | 0.0% |
| Broadband Home | 1,289 | 92.8% |
| Cellular Data Only | 8 | 0.6% |
| Satellite Internet | 50 | 3.6% |
| No Internet | 92 | 6.6% |
| Total | 1,389 | 100.0% |
Sixteen Mile Stand Summary
Sixteen Mile Stand is an unincorporated community located in the southwestern corner of Warren County, Ohio. It is situated along the Little Miami River, approximately 16 miles east of Cincinnati. The community is part of the Cincinnati Metropolitan Statistical Area and is home to a population of approximately 1,000 people.
Geography
Sixteen Mile Stand is located at 39°25'25"N 84°14'45"W (39.423750, -84.245833). It is situated along the Little Miami River, approximately 16 miles east of Cincinnati. The community is part of the Cincinnati Metropolitan Statistical Area and is home to a population of approximately 1,000 people. The terrain is mostly flat with some rolling hills. The area is heavily wooded with a mix of deciduous and coniferous trees.
History
Sixteen Mile Stand was first settled in the early 1800s by a group of settlers from Pennsylvania. The community was named for the fact that it was located 16 miles from Cincinnati. The area was primarily agricultural, with the main crops being corn, wheat, and hay. The community was also home to a number of small businesses, including a general store, a blacksmith, and a sawmill.
In the late 1800s, the community began to grow and develop. The railroad was extended to the area, and a number of new businesses opened, including a hotel, a bank, and a post office. The community also had a number of churches, including the Methodist Episcopal Church, the Presbyterian Church, and the Baptist Church.
Economy
Sixteen Mile Stand is primarily a residential community, with most of the population employed in the nearby cities of Cincinnati and Dayton. The area is home to a number of small businesses, including a general store, a gas station, and a few restaurants. The community also has a number of churches, including the Methodist Episcopal Church, the Presbyterian Church, and the Baptist Church.
Demographics
As of the 2010 census, the population of Sixteen Mile Stand was 1,000. The racial makeup of the community was 97.2% White, 0.7% African American, 0.3% Native American, 0.3% Asian, and 1.5% from other races. The median household income was $45,000, and the median family income was $50,000.
Conclusion
Sixteen Mile Stand is a small, unincorporated community located in the southwestern corner of Warren County, Ohio. It is situated along the Little Miami River, approximately 16 miles east of Cincinnati. The community is part of the Cincinnati Metropolitan Statistical Area and is home to a population of approximately 1,000 people. The area is primarily residential, with most of the population employed in the nearby cities of Cincinnati and Dayton. The area is also home to a number of small businesses, churches, and other amenities.
Common Questions
What is Per Capita Income in Sixteen Mile Stand?
Per Capita income in Sixteen Mile Stand is $63,270.
What is the Median Family Income in Sixteen Mile Stand?
Median Family Income in Sixteen Mile Stand is $182,026.
What is the Median Household income in Sixteen Mile Stand?
Median Household Income in Sixteen Mile Stand is $117,377.
What is Income or Wage Gap in Sixteen Mile Stand?
Income or Wage Gap in Sixteen Mile Stand is 52.3%.
Women in Sixteen Mile Stand earn 47.7 cents for every dollar earned by a man.
What is Inequality or Gini Index in Sixteen Mile Stand?
Inequality or Gini Index in Sixteen Mile Stand is 0.41.
What is the Total Population of Sixteen Mile Stand?
Total Population of Sixteen Mile Stand is 3,677.
What is the Total Male Population of Sixteen Mile Stand?
Total Male Population of Sixteen Mile Stand is 1,786.
What is the Total Female Population of Sixteen Mile Stand?
Total Female Population of Sixteen Mile Stand is 1,891.
What is the Ratio of Males per 100 Females in Sixteen Mile Stand?
There are 94.45 Males per 100 Females in Sixteen Mile Stand.
What is the Ratio of Females per 100 Males in Sixteen Mile Stand?
There are 105.88 Females per 100 Males in Sixteen Mile Stand.
What is the Median Population Age in Sixteen Mile Stand?
Median Population Age in Sixteen Mile Stand is 39.7 Years.
What is the Average Family Size in Sixteen Mile Stand
Average Family Size in Sixteen Mile Stand is 3.2 People.
What is the Average Household Size in Sixteen Mile Stand
Average Household Size in Sixteen Mile Stand is 2.6 People.
How Large is the Labor Force in Sixteen Mile Stand?
There are 2,207 People in the Labor Forcein in Sixteen Mile Stand.
What is the Percentage of People in the Labor Force in Sixteen Mile Stand?
77.4% of People are in the Labor Force in Sixteen Mile Stand.
What is the Unemployment Rate in Sixteen Mile Stand?
Unemployment Rate in Sixteen Mile Stand is 2.1%.