Zip Codes with the Highest Percentage of Population Employed in Legal Services & Support in Hamilton, OH
RELATED REPORTS & OPTIONS
Legal Services & Support
Hamilton
Compare Zip Codes
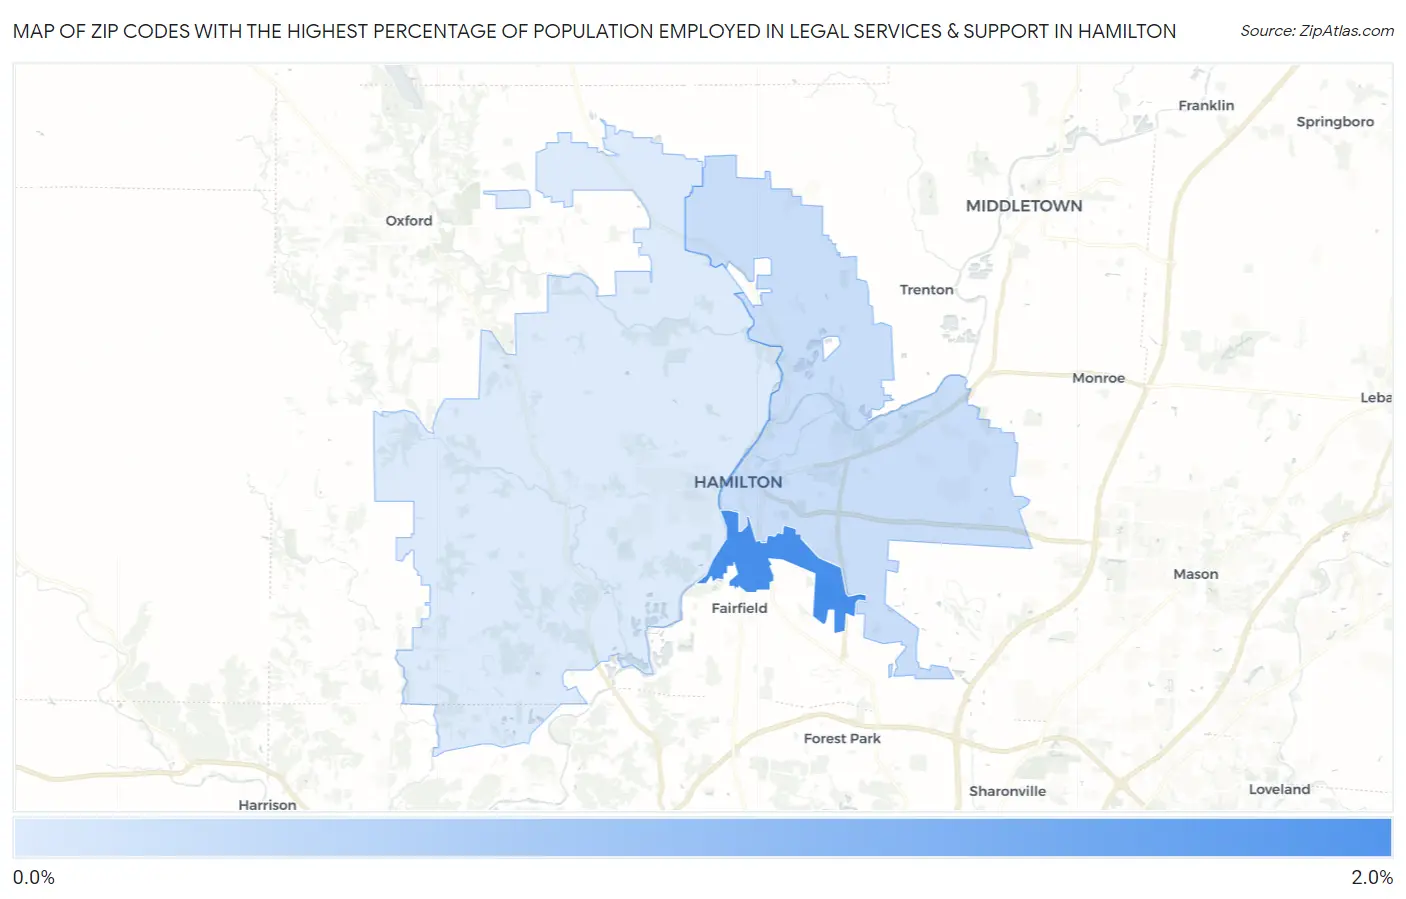
Map of Zip Codes with the Highest Percentage of Population Employed in Legal Services & Support in Hamilton
0.22%
1.6%
Zip Codes with the Highest Percentage of Population Employed in Legal Services & Support in Hamilton, OH
| Zip Code | % Employed | vs State | vs National | |
| 1. | 45015 | 1.6% | 0.92%(+0.673)#128 | 1.2%(+0.414)#4,686 |
| 2. | 45011 | 0.41% | 0.92%(-0.514)#465 | 1.2%(-0.773)#13,717 |
| 3. | 45013 | 0.22% | 0.92%(-0.709)#576 | 1.2%(-0.967)#16,018 |
1
Common Questions
What are the Top Zip Codes with the Highest Percentage of Population Employed in Legal Services & Support in Hamilton, OH?
Top Zip Codes with the Highest Percentage of Population Employed in Legal Services & Support in Hamilton, OH are:
What zip code has the Highest Percentage of Population Employed in Legal Services & Support in Hamilton, OH?
45015 has the Highest Percentage of Population Employed in Legal Services & Support in Hamilton, OH with 1.6%.
What is the Percentage of Population Employed in Legal Services & Support in Hamilton, OH?
Percentage of Population Employed in Legal Services & Support in Hamilton is 0.43%.
What is the Percentage of Population Employed in Legal Services & Support in Ohio?
Percentage of Population Employed in Legal Services & Support in Ohio is 0.92%.
What is the Percentage of Population Employed in Legal Services & Support in the United States?
Percentage of Population Employed in Legal Services & Support in the United States is 1.2%.