Willoughby Hills, OH Map & Demographics
Willoughby Hills Map
Willoughby Hills Overview
$48,153
PER CAPITA INCOME
$96,571
AVG FAMILY INCOME
$63,438
AVG HOUSEHOLD INCOME
35.7%
WAGE / INCOME GAP [ % ]
64.3¢/ $1
WAGE / INCOME GAP [ $ ]
0.45
INEQUALITY / GINI INDEX
9,972
TOTAL POPULATION
4,664
MALE POPULATION
5,308
FEMALE POPULATION
87.87
MALES / 100 FEMALES
113.81
FEMALES / 100 MALES
38.6
MEDIAN AGE
2.5
AVG FAMILY SIZE
1.9
AVG HOUSEHOLD SIZE
6,212
LABOR FORCE [ PEOPLE ]
73.1%
PERCENT IN LABOR FORCE
6.4%
UNEMPLOYMENT RATE
Willoughby Hills Area Codes
Income in Willoughby Hills
Income Overview in Willoughby Hills
Per Capita Income in Willoughby Hills is $48,153, while median incomes of families and households are $96,571 and $63,438 respectively.
| Characteristic | Number | Measure |
| Per Capita Income | 9,972 | $48,153 |
| Median Family Income | 2,806 | $96,571 |
| Mean Family Income | 2,806 | $119,729 |
| Median Household Income | 5,176 | $63,438 |
| Mean Household Income | 5,176 | $92,431 |
| Income Deficit | 2,806 | $0 |
| Wage / Income Gap (%) | 9,972 | 35.73% |
| Wage / Income Gap ($) | 9,972 | 64.27¢ per $1 |
| Gini / Inequality Index | 9,972 | 0.45 |
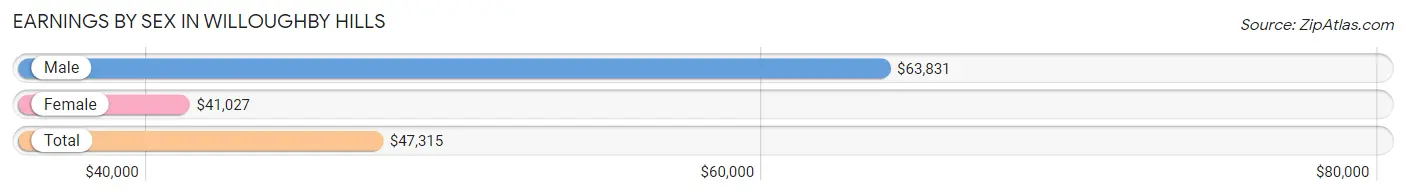
Earnings by Sex in Willoughby Hills
Average Earnings in Willoughby Hills are $47,315, $63,831 for men and $41,027 for women, a difference of 35.7%.
| Sex | Number | Average Earnings |
| Male | 3,003 (47.8%) | $63,831 |
| Female | 3,282 (52.2%) | $41,027 |
| Total | 6,285 (100.0%) | $47,315 |
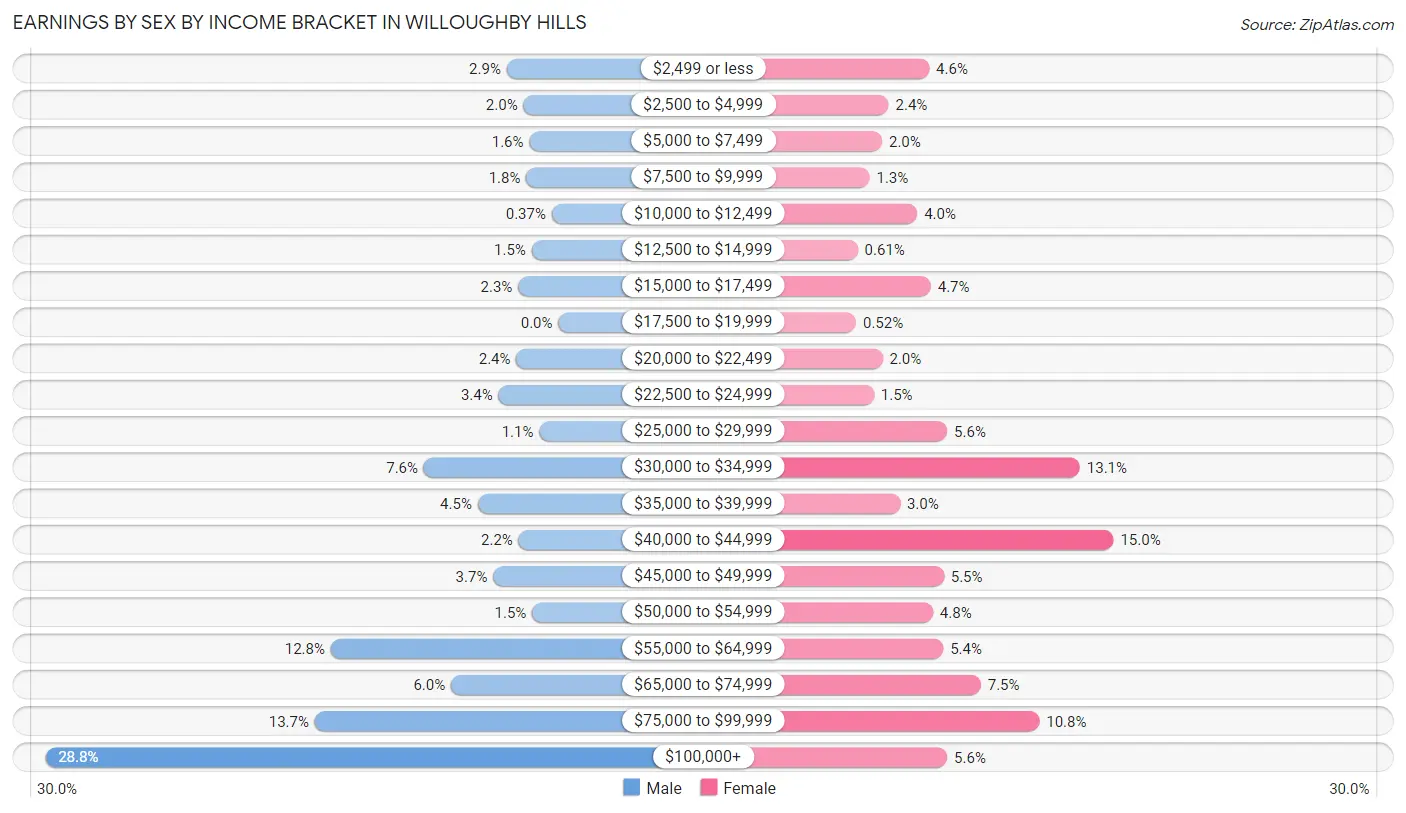
Earnings by Sex by Income Bracket in Willoughby Hills
The most common earnings brackets in Willoughby Hills are $100,000+ for men (866 | 28.8%) and $40,000 to $44,999 for women (492 | 15.0%).
| Income | Male | Female |
| $2,499 or less | 87 (2.9%) | 152 (4.6%) |
| $2,500 to $4,999 | 59 (2.0%) | 77 (2.4%) |
| $5,000 to $7,499 | 49 (1.6%) | 65 (2.0%) |
| $7,500 to $9,999 | 54 (1.8%) | 42 (1.3%) |
| $10,000 to $12,499 | 11 (0.4%) | 130 (4.0%) |
| $12,500 to $14,999 | 45 (1.5%) | 20 (0.6%) |
| $15,000 to $17,499 | 68 (2.3%) | 155 (4.7%) |
| $17,500 to $19,999 | 0 (0.0%) | 17 (0.5%) |
| $20,000 to $22,499 | 71 (2.4%) | 66 (2.0%) |
| $22,500 to $24,999 | 101 (3.4%) | 50 (1.5%) |
| $25,000 to $29,999 | 32 (1.1%) | 185 (5.6%) |
| $30,000 to $34,999 | 227 (7.6%) | 430 (13.1%) |
| $35,000 to $39,999 | 136 (4.5%) | 98 (3.0%) |
| $40,000 to $44,999 | 67 (2.2%) | 492 (15.0%) |
| $45,000 to $49,999 | 110 (3.7%) | 179 (5.4%) |
| $50,000 to $54,999 | 44 (1.5%) | 159 (4.8%) |
| $55,000 to $64,999 | 384 (12.8%) | 178 (5.4%) |
| $65,000 to $74,999 | 181 (6.0%) | 247 (7.5%) |
| $75,000 to $99,999 | 411 (13.7%) | 355 (10.8%) |
| $100,000+ | 866 (28.8%) | 185 (5.6%) |
| Total | 3,003 (100.0%) | 3,282 (100.0%) |
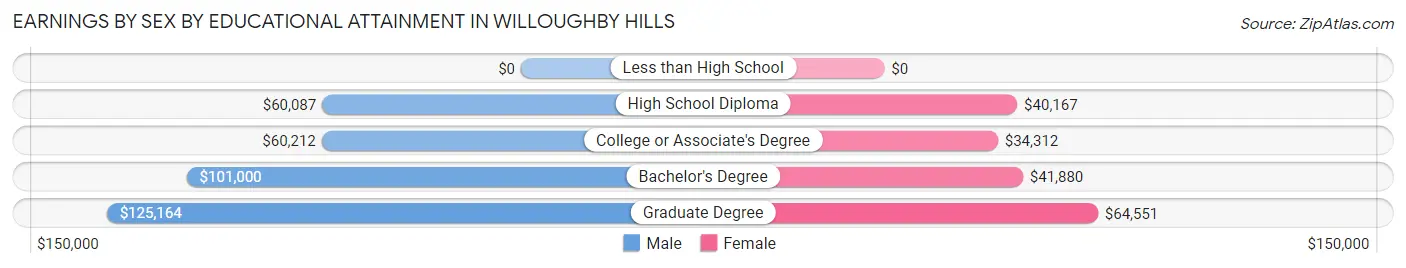
Earnings by Sex by Educational Attainment in Willoughby Hills
Average earnings in Willoughby Hills are $71,537 for men and $41,597 for women, a difference of 41.8%. Men with an educational attainment of graduate degree enjoy the highest average annual earnings of $125,164, while those with high school diploma education earn the least with $60,087. Women with an educational attainment of graduate degree earn the most with the average annual earnings of $64,551, while those with college or associate's degree education have the smallest earnings of $34,312.
| Educational Attainment | Male Income | Female Income |
| Less than High School | - | - |
| High School Diploma | $60,087 | $40,167 |
| College or Associate's Degree | $60,212 | $34,312 |
| Bachelor's Degree | $101,000 | $41,880 |
| Graduate Degree | $125,164 | $64,551 |
| Total | $71,537 | $41,597 |
Family Income in Willoughby Hills
Family Income Brackets in Willoughby Hills
According to the Willoughby Hills family income data, there are 575 families falling into the $35,000 to $49,999 income range, which is the most common income bracket and makes up 20.5% of all families.
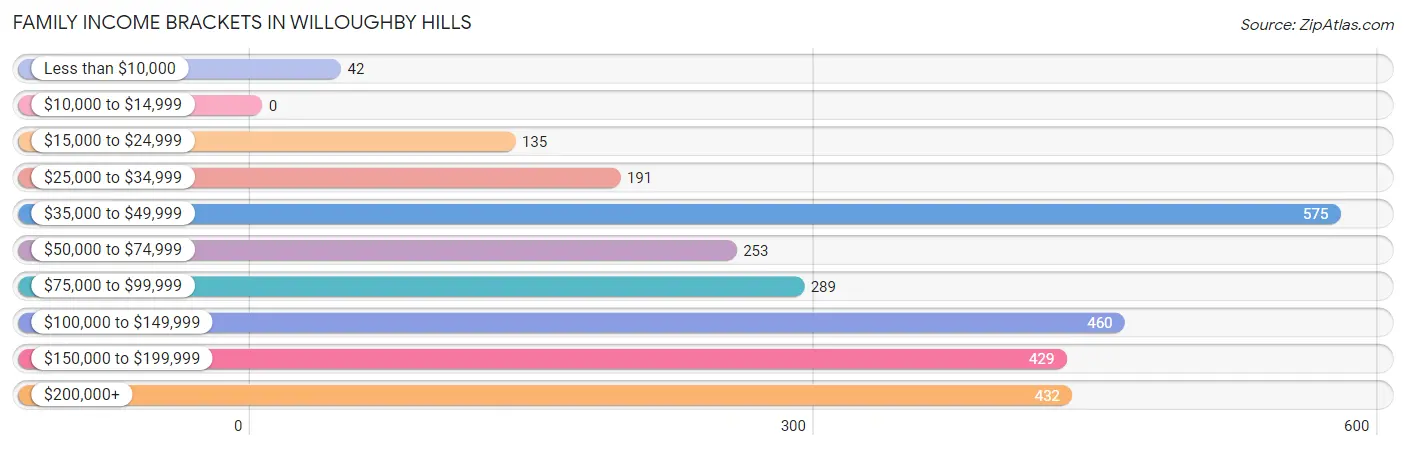
| Income Bracket | # Families | % Families |
| Less than $10,000 | 42 | 1.5% |
| $10,000 to $14,999 | 0 | 0.0% |
| $15,000 to $24,999 | 135 | 4.8% |
| $25,000 to $34,999 | 191 | 6.8% |
| $35,000 to $49,999 | 575 | 20.5% |
| $50,000 to $74,999 | 253 | 9.0% |
| $75,000 to $99,999 | 289 | 10.3% |
| $100,000 to $149,999 | 460 | 16.4% |
| $150,000 to $199,999 | 429 | 15.3% |
| $200,000+ | 432 | 15.4% |
Family Income by Famaliy Size in Willoughby Hills
4-person families (439 | 15.7%) account for the highest median family income in Willoughby Hills with $175,854 per family, while 4-person families (439 | 15.7%) have the highest median income of $43,964 per family member.
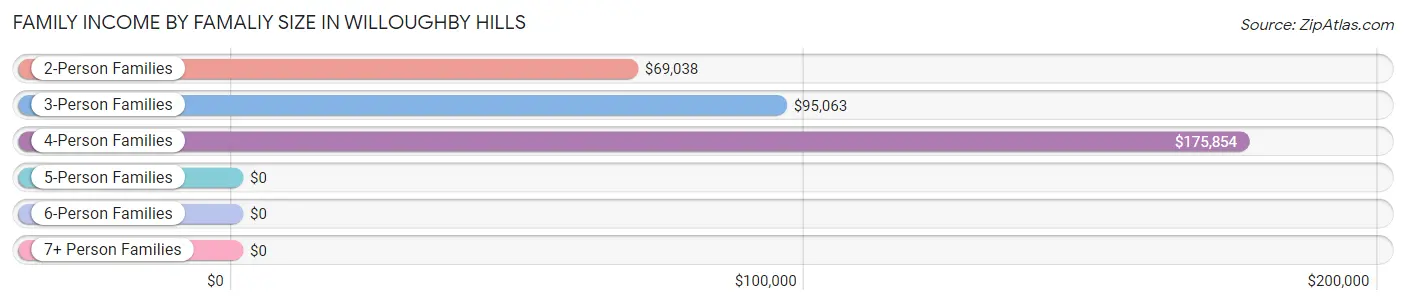
| Income Bracket | # Families | Median Income |
| 2-Person Families | 1,824 (65.0%) | $69,038 |
| 3-Person Families | 403 (14.4%) | $95,063 |
| 4-Person Families | 439 (15.7%) | $175,854 |
| 5-Person Families | 115 (4.1%) | $0 |
| 6-Person Families | 25 (0.9%) | $0 |
| 7+ Person Families | 0 (0.0%) | $0 |
| Total | 2,806 (100.0%) | $96,571 |
Family Income by Number of Earners in Willoughby Hills
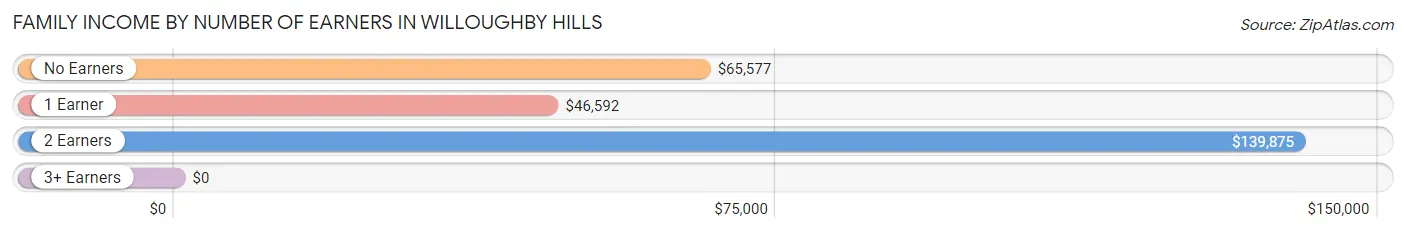
| Number of Earners | # Families | Median Income |
| No Earners | 406 (14.5%) | $65,577 |
| 1 Earner | 869 (31.0%) | $46,592 |
| 2 Earners | 1,369 (48.8%) | $139,875 |
| 3+ Earners | 162 (5.8%) | $0 |
| Total | 2,806 (100.0%) | $96,571 |
Household Income in Willoughby Hills
Household Income Brackets in Willoughby Hills
With 1,118 households falling in the category, the $35,000 to $49,999 income range is the most frequent in Willoughby Hills, accounting for 21.6% of all households. In contrast, only 119 households (2.3%) fall into the less than $10,000 income bracket, making it the least populous group.
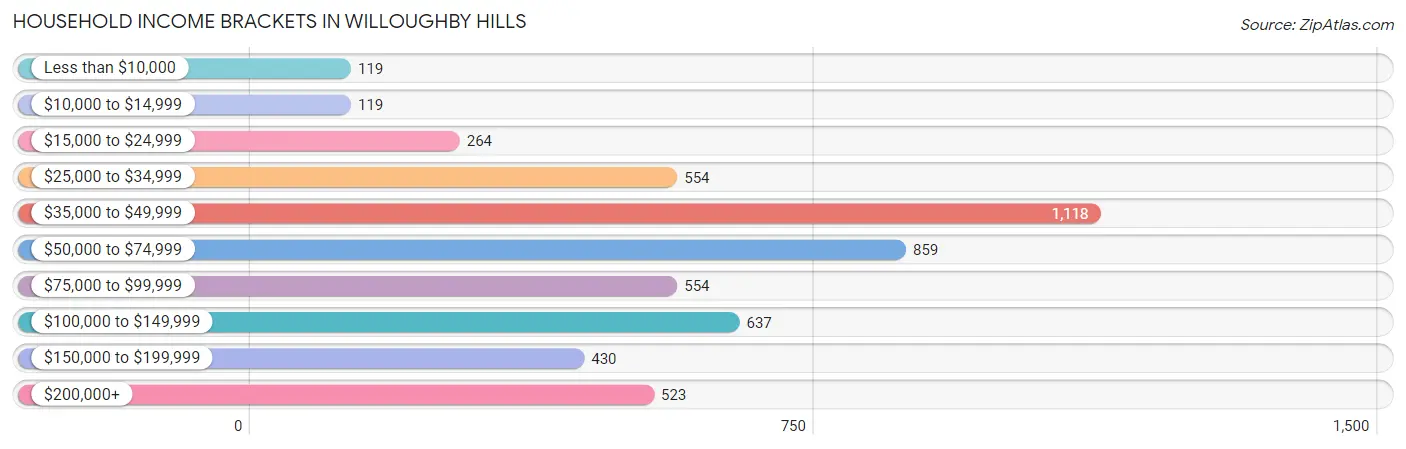
| Income Bracket | # Households | % Households |
| Less than $10,000 | 119 | 2.3% |
| $10,000 to $14,999 | 119 | 2.3% |
| $15,000 to $24,999 | 264 | 5.1% |
| $25,000 to $34,999 | 554 | 10.7% |
| $35,000 to $49,999 | 1,118 | 21.6% |
| $50,000 to $74,999 | 859 | 16.6% |
| $75,000 to $99,999 | 554 | 10.7% |
| $100,000 to $149,999 | 637 | 12.3% |
| $150,000 to $199,999 | 430 | 8.3% |
| $200,000+ | 523 | 10.1% |
Household Income by Householder Age in Willoughby Hills
The median household income in Willoughby Hills is $63,438, with the highest median household income of $75,951 found in the 45 to 64 years age bracket for the primary householder. A total of 1,582 households (30.6%) fall into this category. Meanwhile, the 15 to 24 years age bracket for the primary householder has the lowest median household income of $39,500, with 304 households (5.9%) in this group.
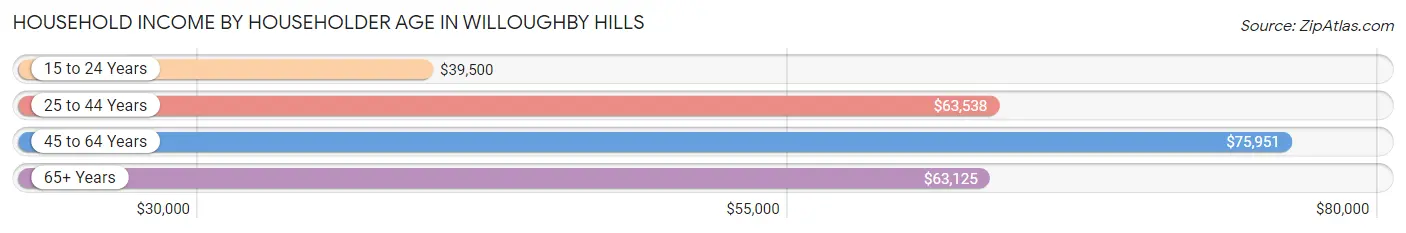
| Income Bracket | # Households | Median Income |
| 15 to 24 Years | 304 (5.9%) | $39,500 |
| 25 to 44 Years | 2,070 (40.0%) | $63,538 |
| 45 to 64 Years | 1,582 (30.6%) | $75,951 |
| 65+ Years | 1,220 (23.6%) | $63,125 |
| Total | 5,176 (100.0%) | $63,438 |
Poverty in Willoughby Hills
Income Below Poverty by Sex and Age in Willoughby Hills
With 6.1% poverty level for males and 9.5% for females among the residents of Willoughby Hills, 16 and 17 year old males and 6 to 11 year old females are the most vulnerable to poverty, with 29 males (23.4%) and 77 females (23.0%) in their respective age groups living below the poverty level.
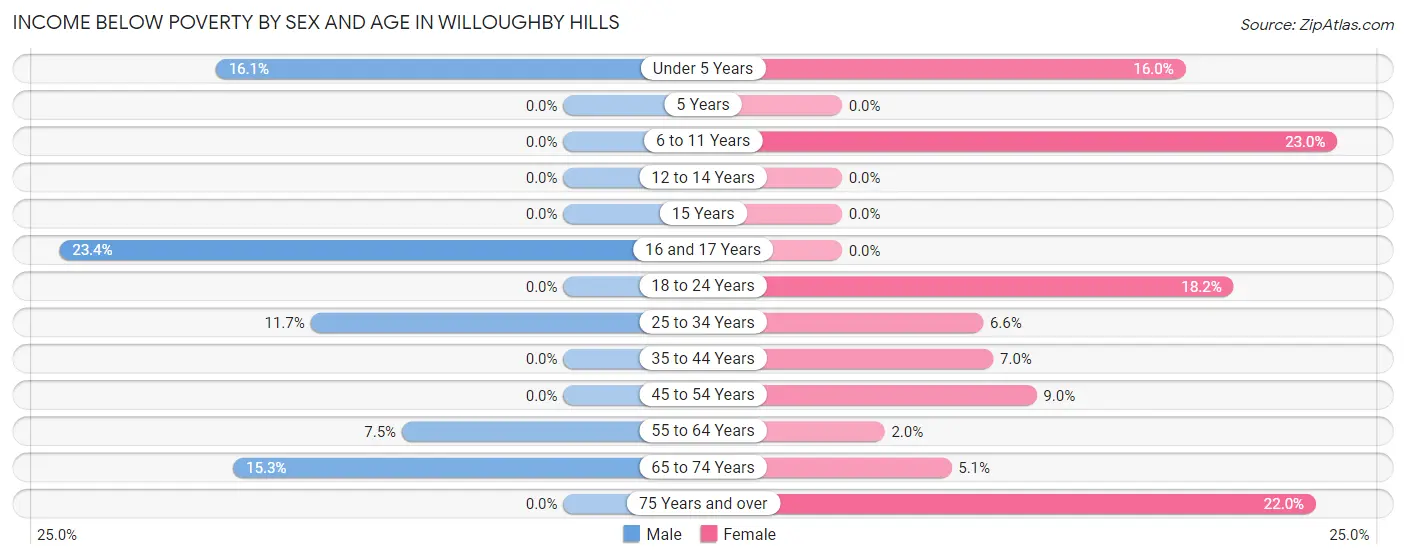
| Age Bracket | Male | Female |
| Under 5 Years | 35 (16.1%) | 37 (16.0%) |
| 5 Years | 0 (0.0%) | 0 (0.0%) |
| 6 to 11 Years | 0 (0.0%) | 77 (23.0%) |
| 12 to 14 Years | 0 (0.0%) | 0 (0.0%) |
| 15 Years | 0 (0.0%) | 0 (0.0%) |
| 16 and 17 Years | 29 (23.4%) | 0 (0.0%) |
| 18 to 24 Years | 0 (0.0%) | 66 (18.2%) |
| 25 to 34 Years | 90 (11.7%) | 70 (6.6%) |
| 35 to 44 Years | 0 (0.0%) | 54 (7.0%) |
| 45 to 54 Years | 0 (0.0%) | 41 (9.0%) |
| 55 to 64 Years | 62 (7.5%) | 15 (2.0%) |
| 65 to 74 Years | 70 (15.3%) | 27 (5.1%) |
| 75 Years and over | 0 (0.0%) | 112 (22.0%) |
| Total | 286 (6.1%) | 499 (9.5%) |
Income Above Poverty by Sex and Age in Willoughby Hills
According to the poverty statistics in Willoughby Hills, males aged 5 years and females aged 5 years are the age groups that are most secure financially, with 100.0% of males and 100.0% of females in these age groups living above the poverty line.
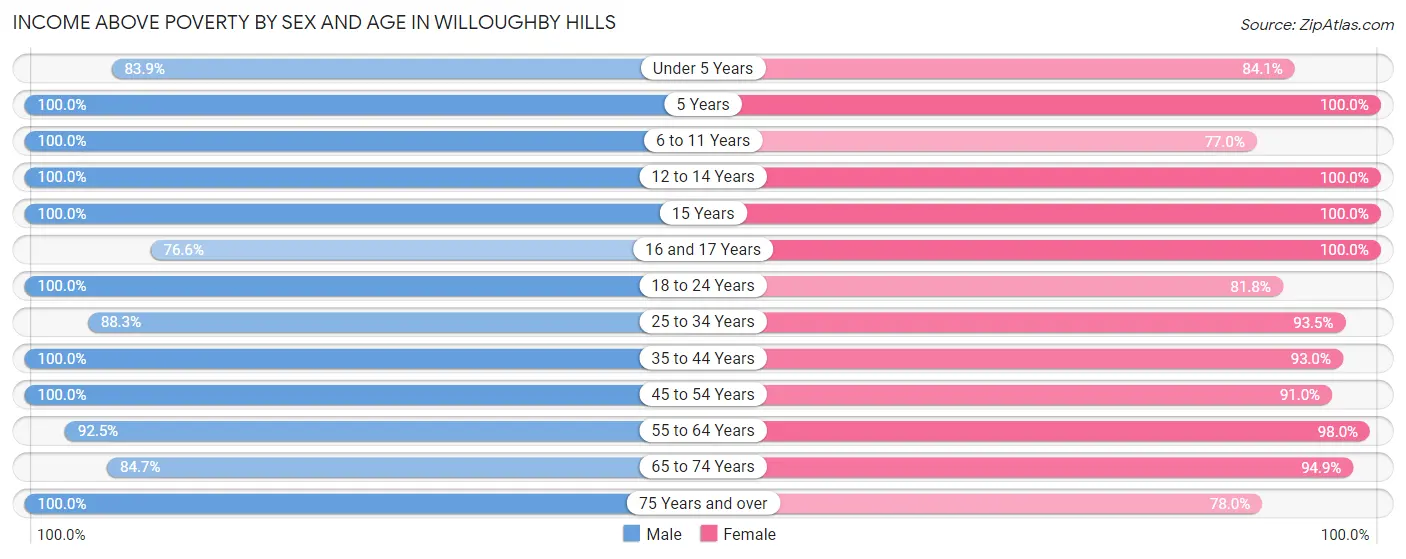
| Age Bracket | Male | Female |
| Under 5 Years | 182 (83.9%) | 195 (84.1%) |
| 5 Years | 42 (100.0%) | 27 (100.0%) |
| 6 to 11 Years | 317 (100.0%) | 258 (77.0%) |
| 12 to 14 Years | 104 (100.0%) | 119 (100.0%) |
| 15 Years | 21 (100.0%) | 11 (100.0%) |
| 16 and 17 Years | 95 (76.6%) | 81 (100.0%) |
| 18 to 24 Years | 280 (100.0%) | 297 (81.8%) |
| 25 to 34 Years | 677 (88.3%) | 999 (93.4%) |
| 35 to 44 Years | 669 (100.0%) | 715 (93.0%) |
| 45 to 54 Years | 482 (100.0%) | 413 (91.0%) |
| 55 to 64 Years | 766 (92.5%) | 743 (98.0%) |
| 65 to 74 Years | 387 (84.7%) | 504 (94.9%) |
| 75 Years and over | 353 (100.0%) | 397 (78.0%) |
| Total | 4,375 (93.9%) | 4,759 (90.5%) |
Income Below Poverty Among Married-Couple Families in Willoughby Hills
The poverty statistics for married-couple families in Willoughby Hills show that 1.7% or 31 of the total 1,780 families live below the poverty line. Families with no children have the highest poverty rate of 2.4%, comprising of 31 families. On the other hand, families with 1 or 2 children have the lowest poverty rate of 0.0%, which includes 0 families.
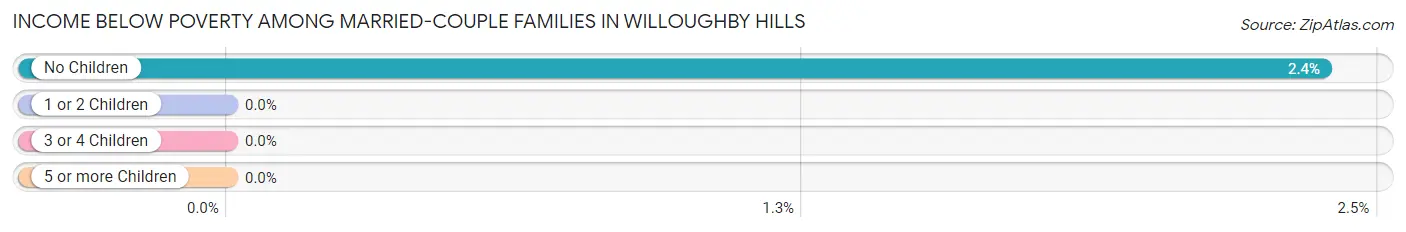
| Children | Above Poverty | Below Poverty |
| No Children | 1,270 (97.6%) | 31 (2.4%) |
| 1 or 2 Children | 437 (100.0%) | 0 (0.0%) |
| 3 or 4 Children | 42 (100.0%) | 0 (0.0%) |
| 5 or more Children | 0 (0.0%) | 0 (0.0%) |
| Total | 1,749 (98.3%) | 31 (1.7%) |
Income Below Poverty Among Single-Parent Households in Willoughby Hills
According to the poverty data in Willoughby Hills, 4.3% or 11 single-father households and 14.3% or 110 single-mother households are living below the poverty line. Among single-father households, those with no children have the highest poverty rate, with 11 households (7.2%) experiencing poverty. Likewise, among single-mother households, those with 1 or 2 children have the highest poverty rate, with 110 households (23.2%) falling below the poverty line.
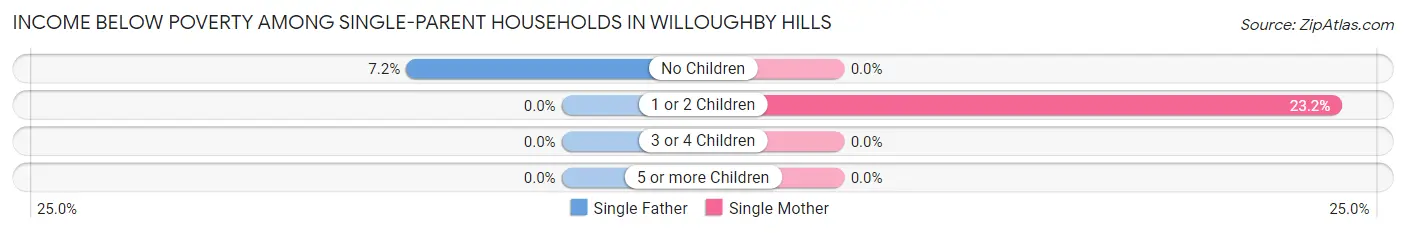
| Children | Single Father | Single Mother |
| No Children | 11 (7.2%) | 0 (0.0%) |
| 1 or 2 Children | 0 (0.0%) | 110 (23.2%) |
| 3 or 4 Children | 0 (0.0%) | 0 (0.0%) |
| 5 or more Children | 0 (0.0%) | 0 (0.0%) |
| Total | 11 (4.3%) | 110 (14.3%) |
Income Below Poverty Among Married-Couple vs Single-Parent Households in Willoughby Hills
The poverty data for Willoughby Hills shows that 31 of the married-couple family households (1.7%) and 121 of the single-parent households (11.8%) are living below the poverty level. Within the married-couple family households, those with no children have the highest poverty rate, with 31 households (2.4%) falling below the poverty line. Among the single-parent households, those with 1 or 2 children have the highest poverty rate, with 110 household (21.0%) living below poverty.
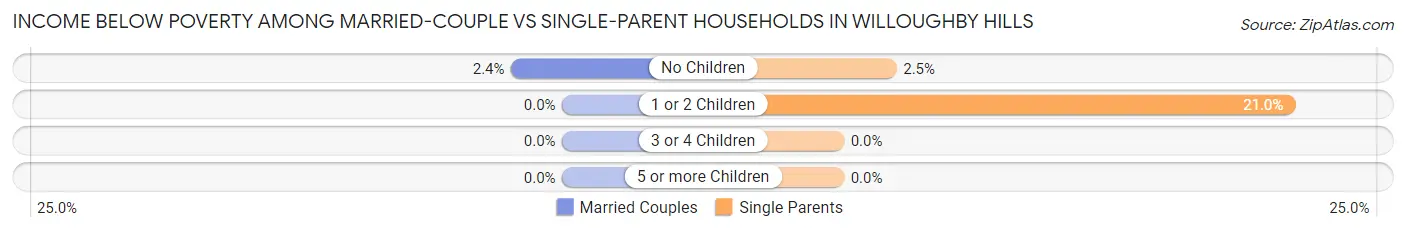
| Children | Married-Couple Families | Single-Parent Households |
| No Children | 31 (2.4%) | 11 (2.5%) |
| 1 or 2 Children | 0 (0.0%) | 110 (21.0%) |
| 3 or 4 Children | 0 (0.0%) | 0 (0.0%) |
| 5 or more Children | 0 (0.0%) | 0 (0.0%) |
| Total | 31 (1.7%) | 121 (11.8%) |
Race in Willoughby Hills
The most populous races in Willoughby Hills are White / Caucasian (7,047 | 70.7%), Black / African American (2,206 | 22.1%), and Asian (526 | 5.3%).
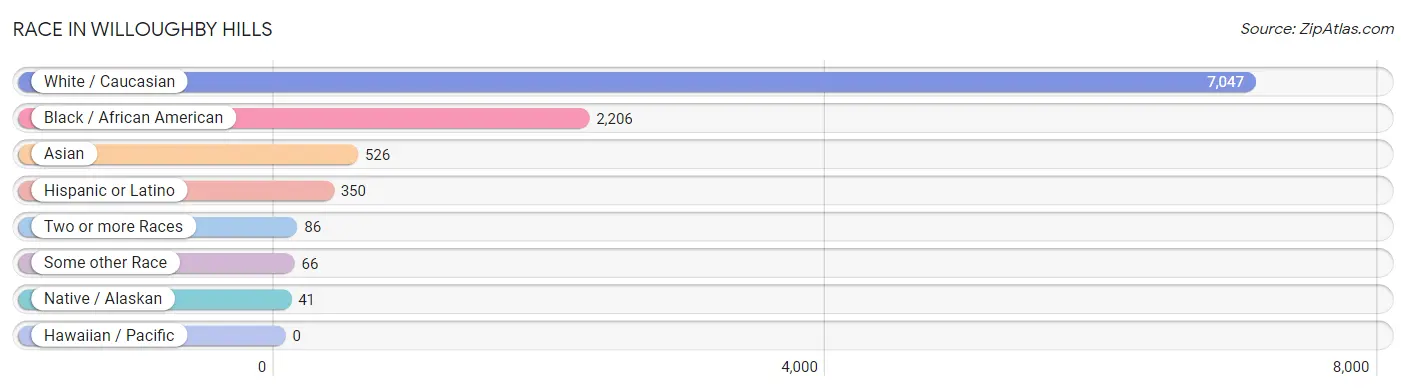
| Race | # Population | % Population |
| Asian | 526 | 5.3% |
| Black / African American | 2,206 | 22.1% |
| Hawaiian / Pacific | 0 | 0.0% |
| Hispanic or Latino | 350 | 3.5% |
| Native / Alaskan | 41 | 0.4% |
| White / Caucasian | 7,047 | 70.7% |
| Two or more Races | 86 | 0.9% |
| Some other Race | 66 | 0.7% |
| Total | 9,972 | 100.0% |
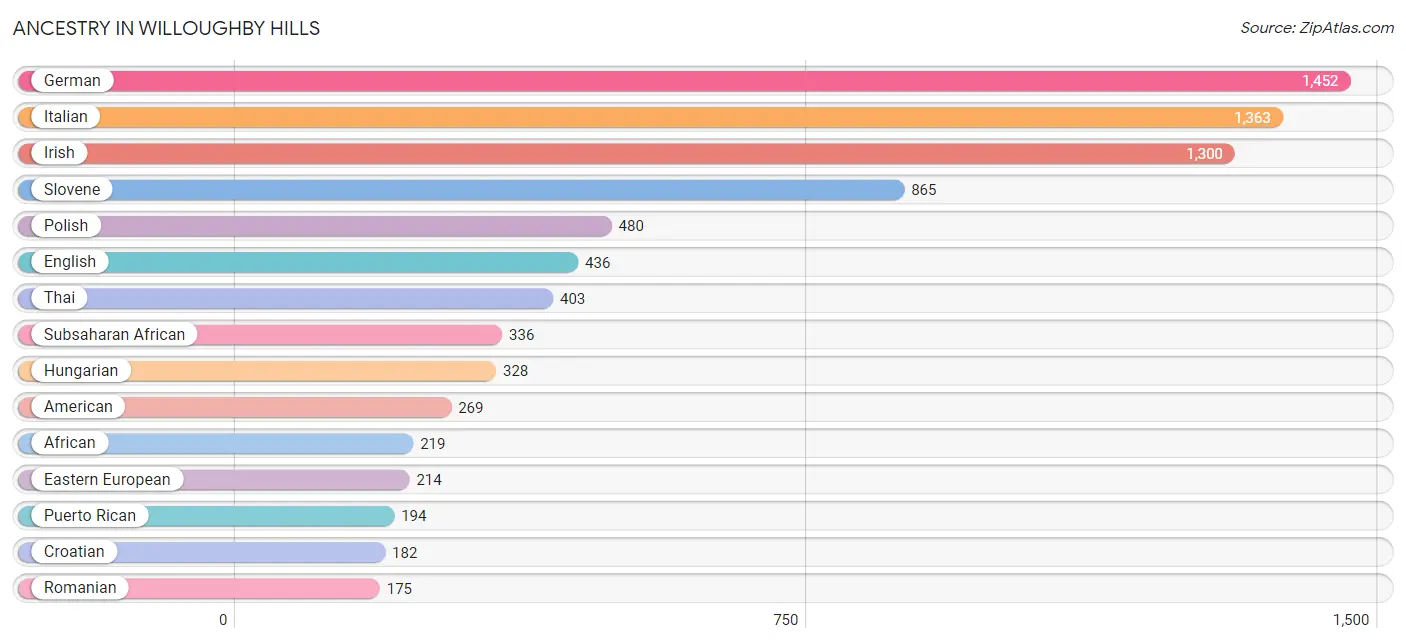
Ancestry in Willoughby Hills
The most populous ancestries reported in Willoughby Hills are German (1,452 | 14.6%), Italian (1,363 | 13.7%), Irish (1,300 | 13.0%), Slovene (865 | 8.7%), and Polish (480 | 4.8%), together accounting for 54.7% of all Willoughby Hills residents.
| Ancestry | # Population | % Population |
| African | 219 | 2.2% |
| Alaska Native | 28 | 0.3% |
| American | 269 | 2.7% |
| Argentinean | 8 | 0.1% |
| Armenian | 26 | 0.3% |
| Assyrian / Chaldean / Syriac | 26 | 0.3% |
| Australian | 9 | 0.1% |
| Austrian | 33 | 0.3% |
| Bhutanese | 31 | 0.3% |
| British | 105 | 1.1% |
| Central American | 66 | 0.7% |
| Colombian | 38 | 0.4% |
| Croatian | 182 | 1.8% |
| Crow | 5 | 0.1% |
| Cuban | 1 | 0.0% |
| Czech | 52 | 0.5% |
| Dutch | 50 | 0.5% |
| Eastern European | 214 | 2.1% |
| English | 436 | 4.4% |
| Estonian | 15 | 0.2% |
| European | 72 | 0.7% |
| Finnish | 38 | 0.4% |
| French | 70 | 0.7% |
| German | 1,452 | 14.6% |
| Greek | 9 | 0.1% |
| Honduran | 66 | 0.7% |
| Hungarian | 328 | 3.3% |
| Indian (Asian) | 36 | 0.4% |
| Irish | 1,300 | 13.0% |
| Italian | 1,363 | 13.7% |
| Japanese | 17 | 0.2% |
| Kenyan | 93 | 0.9% |
| Lithuanian | 105 | 1.1% |
| Macedonian | 14 | 0.1% |
| Mexican | 25 | 0.3% |
| Norwegian | 148 | 1.5% |
| Polish | 480 | 4.8% |
| Puerto Rican | 194 | 1.9% |
| Romanian | 175 | 1.8% |
| Russian | 8 | 0.1% |
| Scandinavian | 15 | 0.2% |
| Scotch-Irish | 5 | 0.1% |
| Scottish | 135 | 1.3% |
| Slavic | 21 | 0.2% |
| Slovak | 128 | 1.3% |
| Slovene | 865 | 8.7% |
| South American | 46 | 0.5% |
| Spaniard | 18 | 0.2% |
| Sri Lankan | 74 | 0.7% |
| Subsaharan African | 336 | 3.4% |
| Swedish | 90 | 0.9% |
| Swiss | 15 | 0.2% |
| Thai | 403 | 4.0% |
| Ukrainian | 58 | 0.6% |
| Welsh | 111 | 1.1% |
| Yugoslavian | 21 | 0.2% | View All 56 Rows |
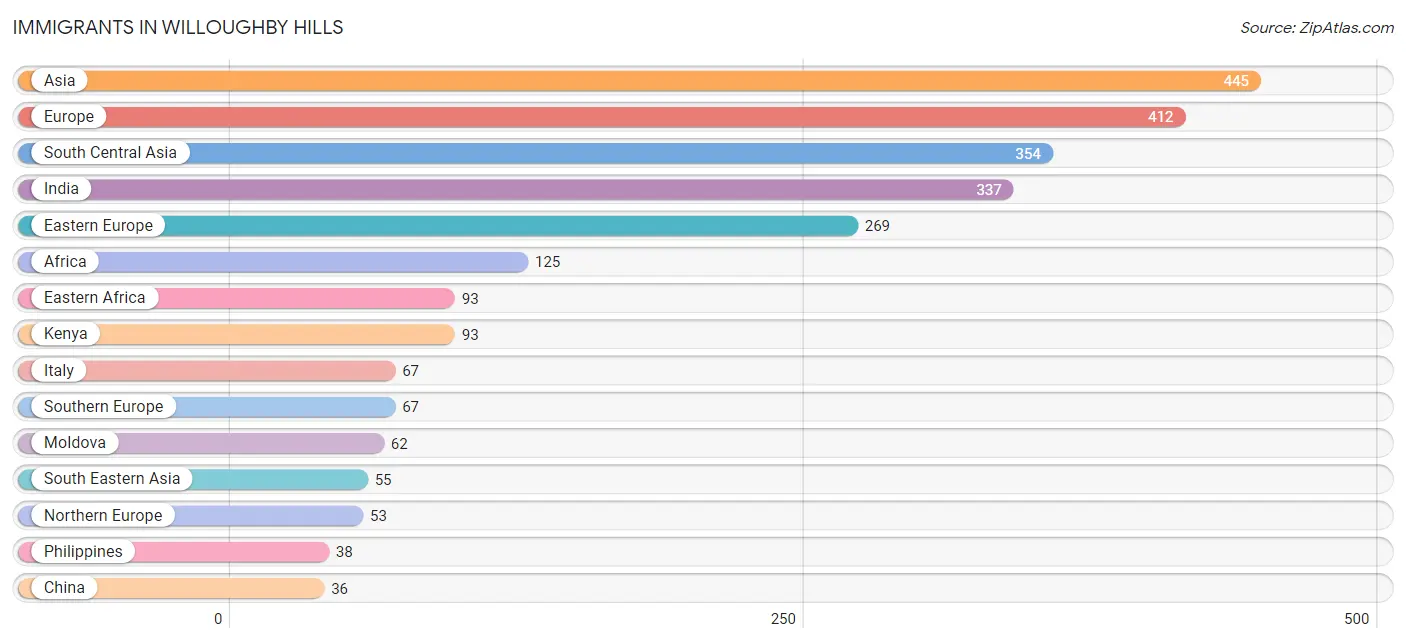
Immigrants in Willoughby Hills
The most numerous immigrant groups reported in Willoughby Hills came from Asia (445 | 4.5%), Europe (412 | 4.1%), South Central Asia (354 | 3.5%), India (337 | 3.4%), and Eastern Europe (269 | 2.7%), together accounting for 18.2% of all Willoughby Hills residents.
| Immigration Origin | # Population | % Population |
| Africa | 125 | 1.3% |
| Argentina | 8 | 0.1% |
| Asia | 445 | 4.5% |
| Australia | 9 | 0.1% |
| Cambodia | 17 | 0.2% |
| Central America | 23 | 0.2% |
| China | 36 | 0.4% |
| Eastern Africa | 93 | 0.9% |
| Eastern Asia | 36 | 0.4% |
| Eastern Europe | 269 | 2.7% |
| Europe | 412 | 4.1% |
| Germany | 19 | 0.2% |
| Hong Kong | 36 | 0.4% |
| India | 337 | 3.4% |
| Ireland | 20 | 0.2% |
| Italy | 67 | 0.7% |
| Kenya | 93 | 0.9% |
| Latin America | 31 | 0.3% |
| Mexico | 23 | 0.2% |
| Moldova | 62 | 0.6% |
| Nepal | 17 | 0.2% |
| Netherlands | 4 | 0.0% |
| Northern Europe | 53 | 0.5% |
| Oceania | 9 | 0.1% |
| Philippines | 38 | 0.4% |
| Romania | 10 | 0.1% |
| Sierra Leone | 32 | 0.3% |
| South America | 8 | 0.1% |
| South Central Asia | 354 | 3.5% |
| South Eastern Asia | 55 | 0.5% |
| Southern Europe | 67 | 0.7% |
| Western Africa | 32 | 0.3% |
| Western Europe | 23 | 0.2% | View All 33 Rows |
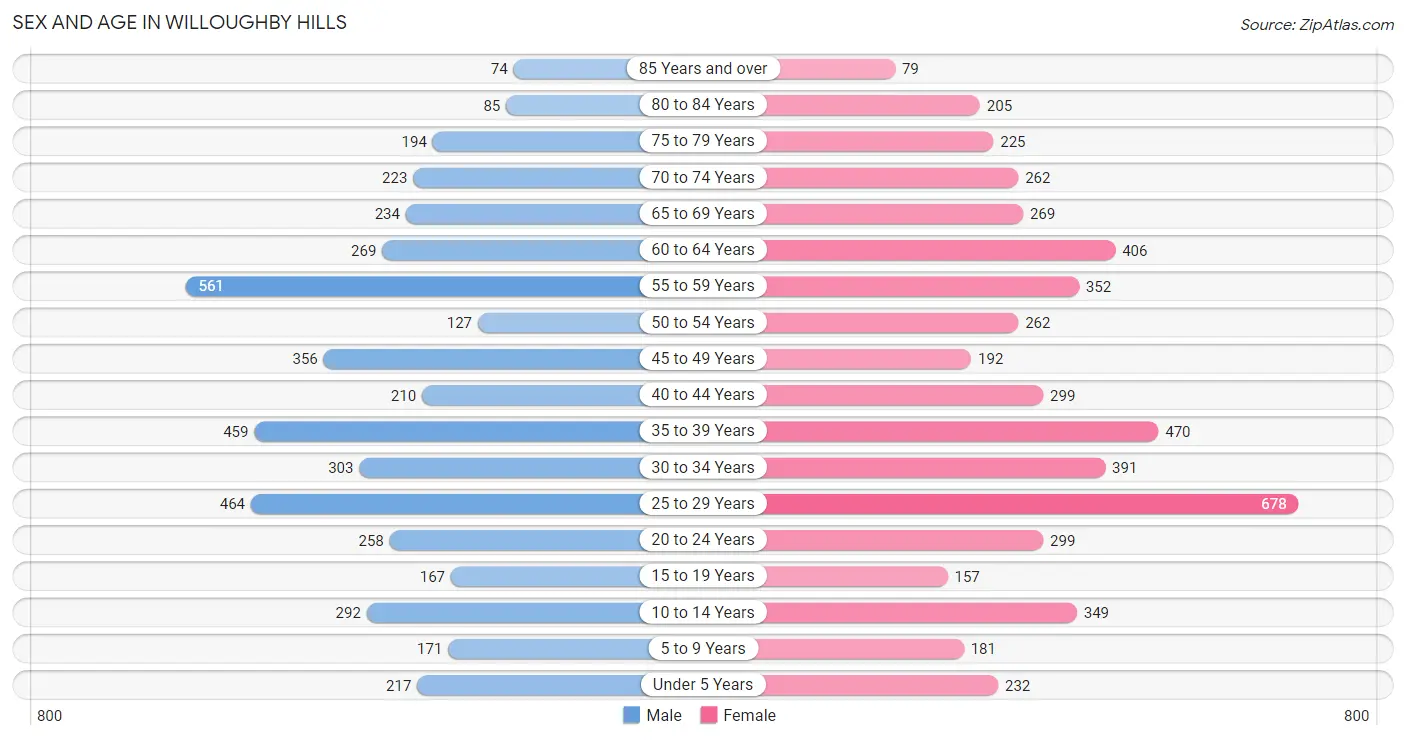
Sex and Age in Willoughby Hills
Sex and Age in Willoughby Hills
The most populous age groups in Willoughby Hills are 55 to 59 Years (561 | 12.0%) for men and 25 to 29 Years (678 | 12.8%) for women.
| Age Bracket | Male | Female |
| Under 5 Years | 217 (4.6%) | 232 (4.4%) |
| 5 to 9 Years | 171 (3.7%) | 181 (3.4%) |
| 10 to 14 Years | 292 (6.3%) | 349 (6.6%) |
| 15 to 19 Years | 167 (3.6%) | 157 (3.0%) |
| 20 to 24 Years | 258 (5.5%) | 299 (5.6%) |
| 25 to 29 Years | 464 (10.0%) | 678 (12.8%) |
| 30 to 34 Years | 303 (6.5%) | 391 (7.4%) |
| 35 to 39 Years | 459 (9.8%) | 470 (8.8%) |
| 40 to 44 Years | 210 (4.5%) | 299 (5.6%) |
| 45 to 49 Years | 356 (7.6%) | 192 (3.6%) |
| 50 to 54 Years | 127 (2.7%) | 262 (4.9%) |
| 55 to 59 Years | 561 (12.0%) | 352 (6.6%) |
| 60 to 64 Years | 269 (5.8%) | 406 (7.6%) |
| 65 to 69 Years | 234 (5.0%) | 269 (5.1%) |
| 70 to 74 Years | 223 (4.8%) | 262 (4.9%) |
| 75 to 79 Years | 194 (4.2%) | 225 (4.2%) |
| 80 to 84 Years | 85 (1.8%) | 205 (3.9%) |
| 85 Years and over | 74 (1.6%) | 79 (1.5%) |
| Total | 4,664 (100.0%) | 5,308 (100.0%) |
Families and Households in Willoughby Hills
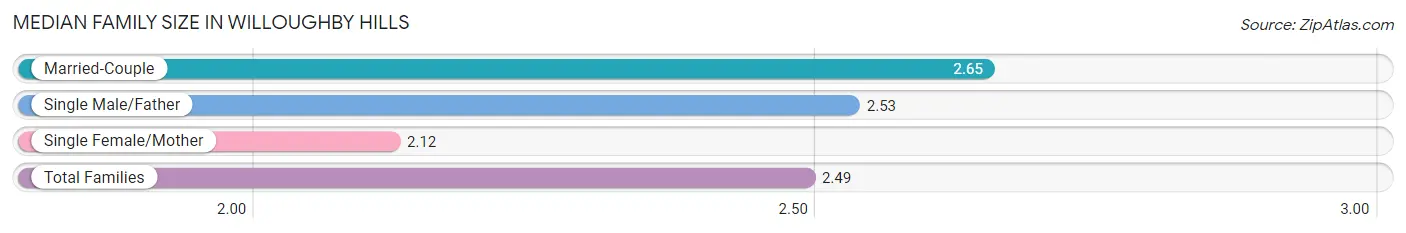
Median Family Size in Willoughby Hills
The median family size in Willoughby Hills is 2.49 persons per family, with married-couple families (1,780 | 63.4%) accounting for the largest median family size of 2.65 persons per family. On the other hand, single female/mother families (771 | 27.5%) represent the smallest median family size with 2.12 persons per family.
| Family Type | # Families | Family Size |
| Married-Couple | 1,780 (63.4%) | 2.65 |
| Single Male/Father | 255 (9.1%) | 2.53 |
| Single Female/Mother | 771 (27.5%) | 2.12 |
| Total Families | 2,806 (100.0%) | 2.49 |
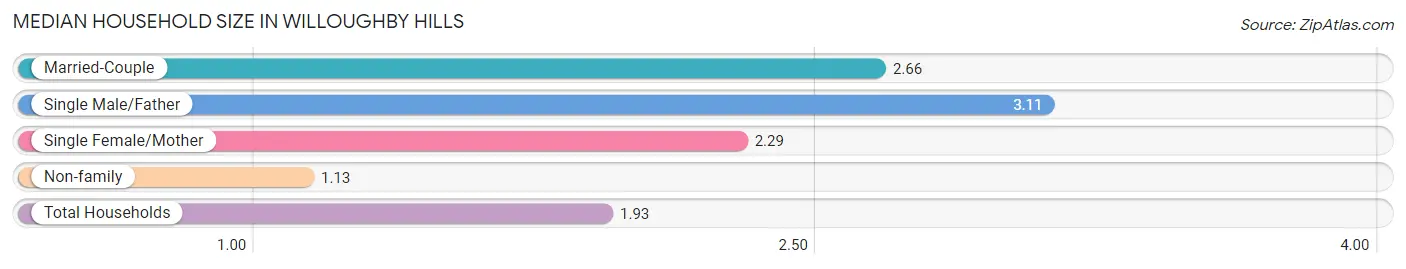
Median Household Size in Willoughby Hills
The median household size in Willoughby Hills is 1.93 persons per household, with single male/father households (255 | 4.9%) accounting for the largest median household size of 3.11 persons per household. non-family households (2,370 | 45.8%) represent the smallest median household size with 1.13 persons per household.
| Household Type | # Households | Household Size |
| Married-Couple | 1,780 (34.4%) | 2.66 |
| Single Male/Father | 255 (4.9%) | 3.11 |
| Single Female/Mother | 771 (14.9%) | 2.29 |
| Non-family | 2,370 (45.8%) | 1.13 |
| Total Households | 5,176 (100.0%) | 1.93 |
Household Size by Marriage Status in Willoughby Hills
Out of a total of 5,176 households in Willoughby Hills, 2,806 (54.2%) are family households, while 2,370 (45.8%) are nonfamily households. The most numerous type of family households are 2-person households, comprising 1,736, and the most common type of nonfamily households are 1-person households, comprising 2,001.
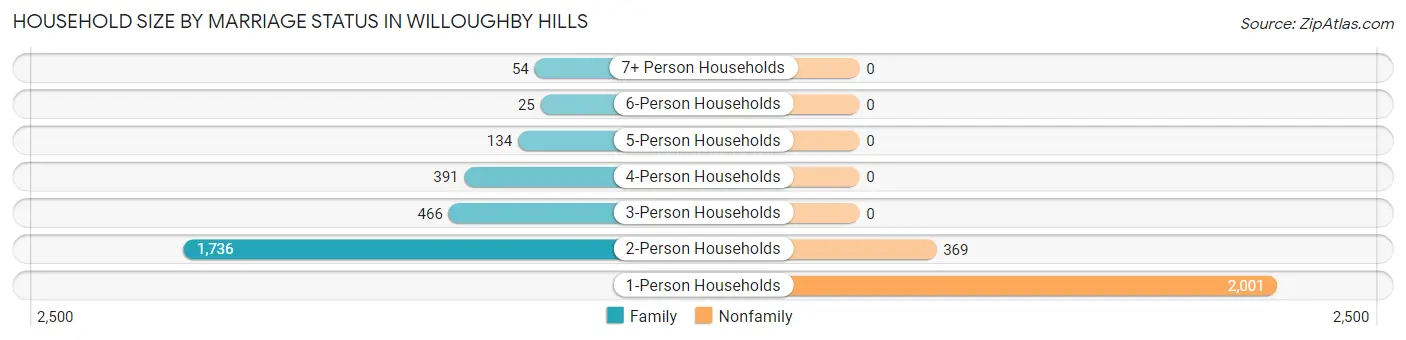
| Household Size | Family Households | Nonfamily Households |
| 1-Person Households | - | 2,001 (38.7%) |
| 2-Person Households | 1,736 (33.5%) | 369 (7.1%) |
| 3-Person Households | 466 (9.0%) | 0 (0.0%) |
| 4-Person Households | 391 (7.5%) | 0 (0.0%) |
| 5-Person Households | 134 (2.6%) | 0 (0.0%) |
| 6-Person Households | 25 (0.5%) | 0 (0.0%) |
| 7+ Person Households | 54 (1.0%) | 0 (0.0%) |
| Total | 2,806 (54.2%) | 2,370 (45.8%) |
Female Fertility in Willoughby Hills
Fertility by Age in Willoughby Hills
Average fertility rate in Willoughby Hills is 20.0 births per 1,000 women. Women in the age bracket of 20 to 34 years have the highest fertility rate with 37.0 births per 1,000 women. Women in the age bracket of 20 to 34 years acount for 100.0% of all women with births.
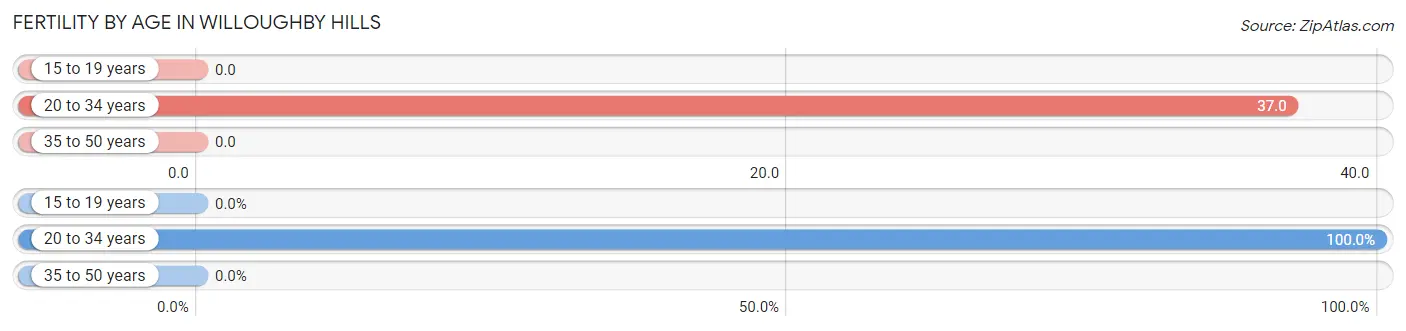
| Age Bracket | Women with Births | Births / 1,000 Women |
| 15 to 19 years | 0 (0.0%) | 0.0 |
| 20 to 34 years | 50 (100.0%) | 37.0 |
| 35 to 50 years | 0 (0.0%) | 0.0 |
| Total | 50 (100.0%) | 20.0 |
Fertility by Age by Marriage Status in Willoughby Hills
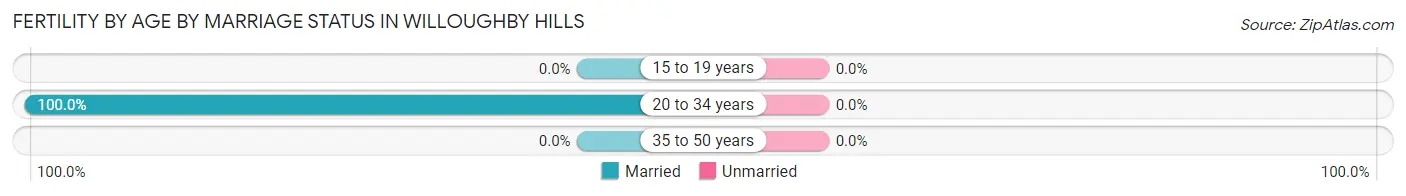
| Age Bracket | Married | Unmarried |
| 15 to 19 years | 0 (0.0%) | 0 (0.0%) |
| 20 to 34 years | 50 (100.0%) | 0 (0.0%) |
| 35 to 50 years | 0 (0.0%) | 0 (0.0%) |
| Total | 50 (100.0%) | 0 (0.0%) |
Fertility by Education in Willoughby Hills
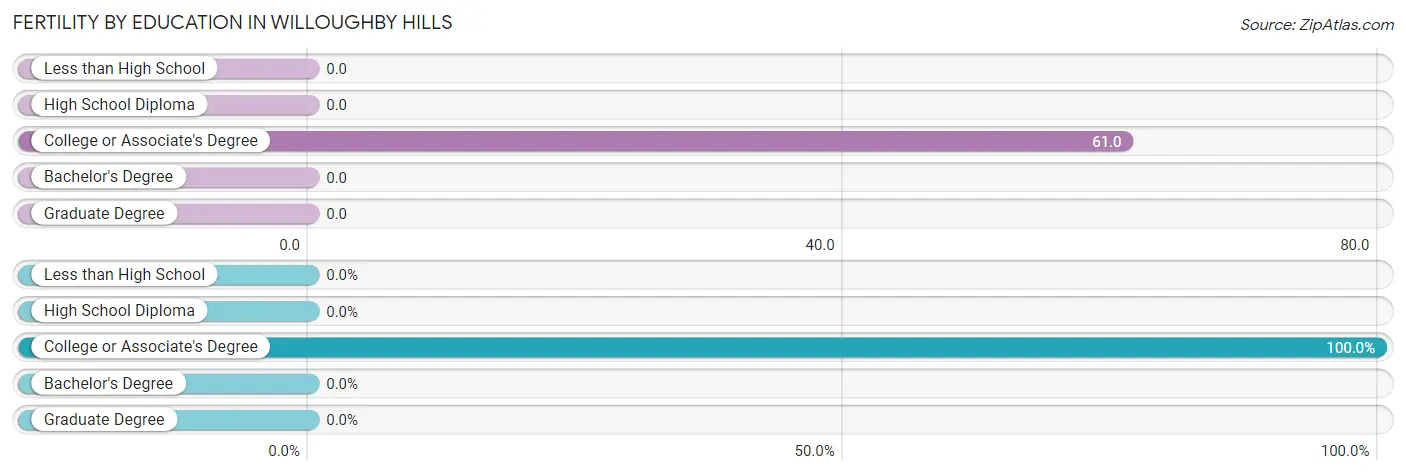
| Educational Attainment | Women with Births | Births / 1,000 Women |
| Less than High School | 0 (0.0%) | 0.0 |
| High School Diploma | 0 (0.0%) | 0.0 |
| College or Associate's Degree | 50 (100.0%) | 61.0 |
| Bachelor's Degree | 0 (0.0%) | 0.0 |
| Graduate Degree | 0 (0.0%) | 0.0 |
| Total | 50 (100.0%) | 20.0 |
Fertility by Education by Marriage Status in Willoughby Hills
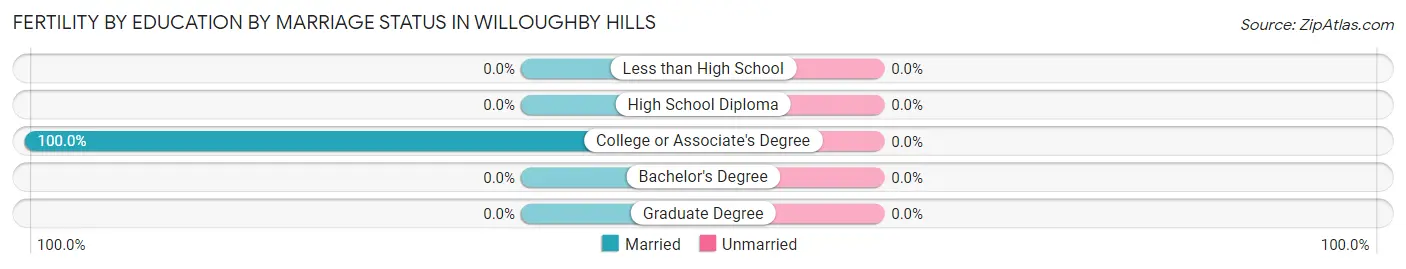
| Educational Attainment | Married | Unmarried |
| Less than High School | 0 (0.0%) | 0 (0.0%) |
| High School Diploma | 0 (0.0%) | 0 (0.0%) |
| College or Associate's Degree | 50 (100.0%) | 0 (0.0%) |
| Bachelor's Degree | 0 (0.0%) | 0 (0.0%) |
| Graduate Degree | 0 (0.0%) | 0 (0.0%) |
| Total | 50 (100.0%) | 0 (0.0%) |
Employment Characteristics in Willoughby Hills
Employment by Class of Employer in Willoughby Hills
Among the 5,757 employed individuals in Willoughby Hills, private company employees (4,158 | 72.2%), self-employed (incorporated) (440 | 7.6%), and local government employees (398 | 6.9%) make up the most common classes of employment.
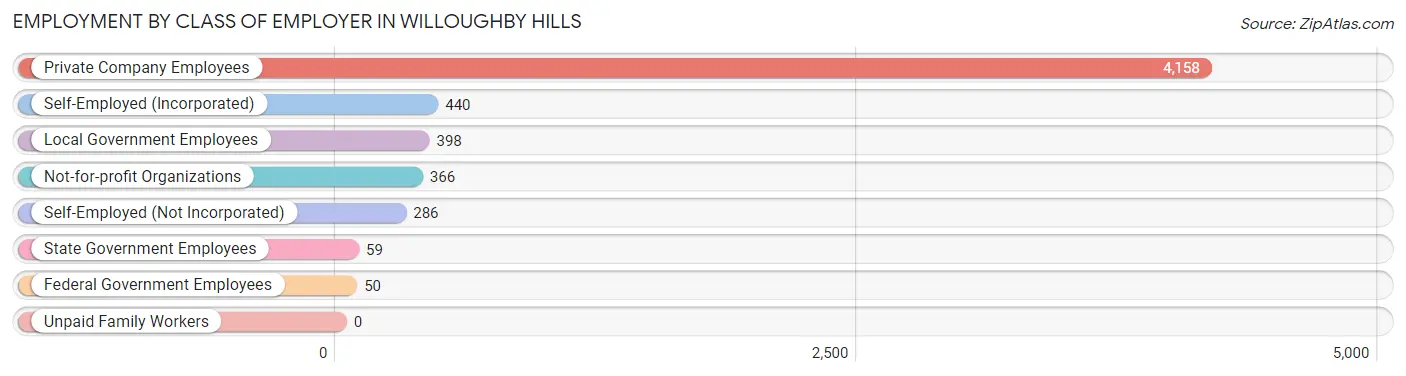
| Employer Class | # Employees | % Employees |
| Private Company Employees | 4,158 | 72.2% |
| Self-Employed (Incorporated) | 440 | 7.6% |
| Self-Employed (Not Incorporated) | 286 | 5.0% |
| Not-for-profit Organizations | 366 | 6.4% |
| Local Government Employees | 398 | 6.9% |
| State Government Employees | 59 | 1.0% |
| Federal Government Employees | 50 | 0.9% |
| Unpaid Family Workers | 0 | 0.0% |
| Total | 5,757 | 100.0% |
Employment Status by Age in Willoughby Hills
According to the labor force statistics for Willoughby Hills, out of the total population over 16 years of age (8,498), 73.1% or 6,212 individuals are in the labor force, with 6.4% or 398 of them unemployed. The age group with the highest labor force participation rate is 35 to 44 years, with 95.7% or 1,376 individuals in the labor force. Within the labor force, the 16 to 19 years age range has the highest percentage of unemployed individuals, with 33.3% or 65 of them being unemployed.
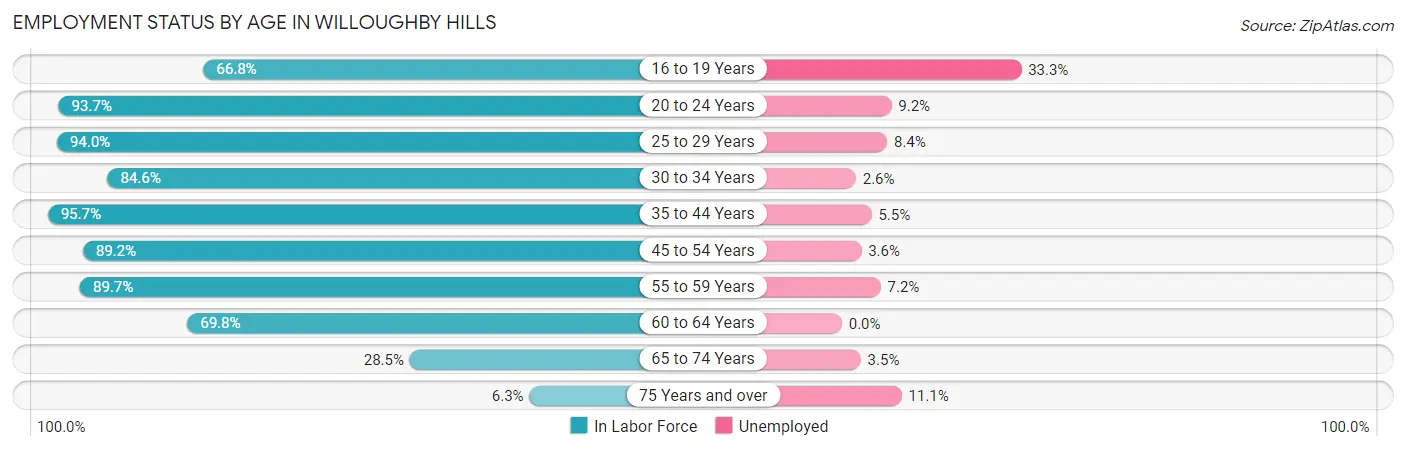
| Age Bracket | In Labor Force | Unemployed |
| 16 to 19 Years | 195 (66.8%) | 65 (33.3%) |
| 20 to 24 Years | 522 (93.7%) | 48 (9.2%) |
| 25 to 29 Years | 1,073 (94.0%) | 90 (8.4%) |
| 30 to 34 Years | 587 (84.6%) | 15 (2.6%) |
| 35 to 44 Years | 1,376 (95.7%) | 76 (5.5%) |
| 45 to 54 Years | 836 (89.2%) | 30 (3.6%) |
| 55 to 59 Years | 819 (89.7%) | 59 (7.2%) |
| 60 to 64 Years | 471 (69.8%) | 0 (0.0%) |
| 65 to 74 Years | 282 (28.5%) | 10 (3.5%) |
| 75 Years and over | 54 (6.3%) | 6 (11.1%) |
| Total | 6,212 (73.1%) | 398 (6.4%) |
Employment Status by Educational Attainment in Willoughby Hills
According to labor force statistics for Willoughby Hills, 89.0% of individuals (5,161) out of the total population between 25 and 64 years of age (5,799) are in the labor force, with 5.2% or 268 of them being unemployed. The group with the highest labor force participation rate are those with the educational attainment of less than high school, with 91.5% or 161 individuals in the labor force. Within the labor force, individuals with high school diploma education have the highest percentage of unemployment, with 8.4% or 100 of them being unemployed.
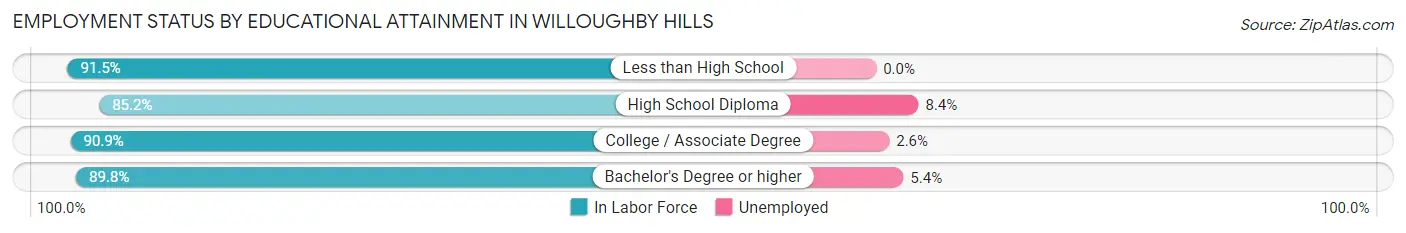
| Educational Attainment | In Labor Force | Unemployed |
| Less than High School | 161 (91.5%) | 0 (0.0%) |
| High School Diploma | 1,188 (85.2%) | 117 (8.4%) |
| College / Associate Degree | 1,362 (90.9%) | 39 (2.6%) |
| Bachelor's Degree or higher | 2,452 (89.8%) | 147 (5.4%) |
| Total | 5,161 (89.0%) | 302 (5.2%) |
Employment Occupations by Sex in Willoughby Hills
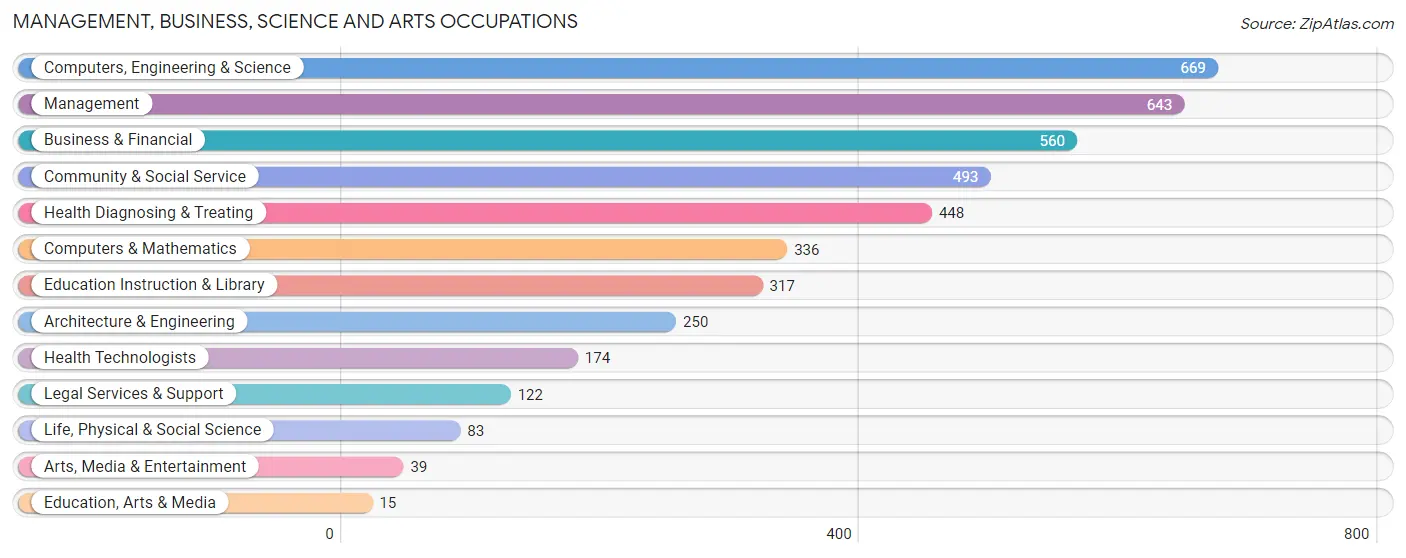
Management, Business, Science and Arts Occupations
The most common Management, Business, Science and Arts occupations in Willoughby Hills are Computers, Engineering & Science (669 | 11.5%), Management (643 | 11.1%), Business & Financial (560 | 9.6%), Community & Social Service (493 | 8.5%), and Health Diagnosing & Treating (448 | 7.7%).
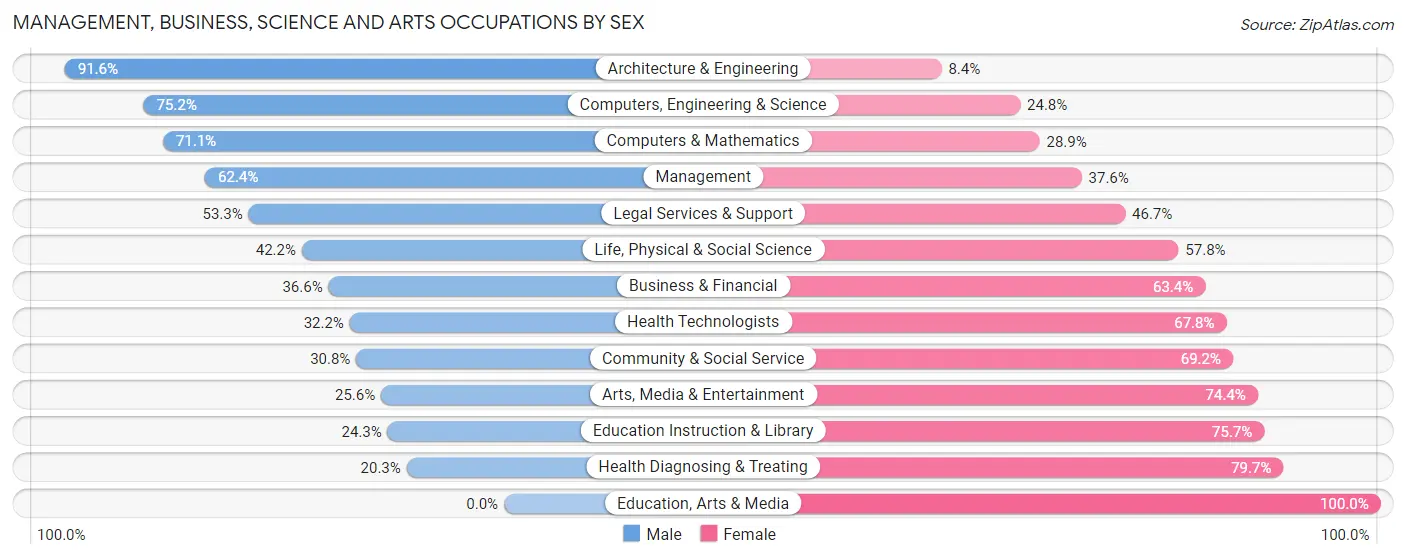
Management, Business, Science and Arts Occupations by Sex
Within the Management, Business, Science and Arts occupations in Willoughby Hills, the most male-oriented occupations are Architecture & Engineering (91.6%), Computers, Engineering & Science (75.2%), and Computers & Mathematics (71.1%), while the most female-oriented occupations are Education, Arts & Media (100.0%), Health Diagnosing & Treating (79.7%), and Education Instruction & Library (75.7%).
| Occupation | Male | Female |
| Management | 401 (62.4%) | 242 (37.6%) |
| Business & Financial | 205 (36.6%) | 355 (63.4%) |
| Computers, Engineering & Science | 503 (75.2%) | 166 (24.8%) |
| Computers & Mathematics | 239 (71.1%) | 97 (28.9%) |
| Architecture & Engineering | 229 (91.6%) | 21 (8.4%) |
| Life, Physical & Social Science | 35 (42.2%) | 48 (57.8%) |
| Community & Social Service | 152 (30.8%) | 341 (69.2%) |
| Education, Arts & Media | 0 (0.0%) | 15 (100.0%) |
| Legal Services & Support | 65 (53.3%) | 57 (46.7%) |
| Education Instruction & Library | 77 (24.3%) | 240 (75.7%) |
| Arts, Media & Entertainment | 10 (25.6%) | 29 (74.4%) |
| Health Diagnosing & Treating | 91 (20.3%) | 357 (79.7%) |
| Health Technologists | 56 (32.2%) | 118 (67.8%) |
| Total (Category) | 1,352 (48.1%) | 1,461 (51.9%) |
| Total (Overall) | 2,824 (48.5%) | 2,993 (51.4%) |
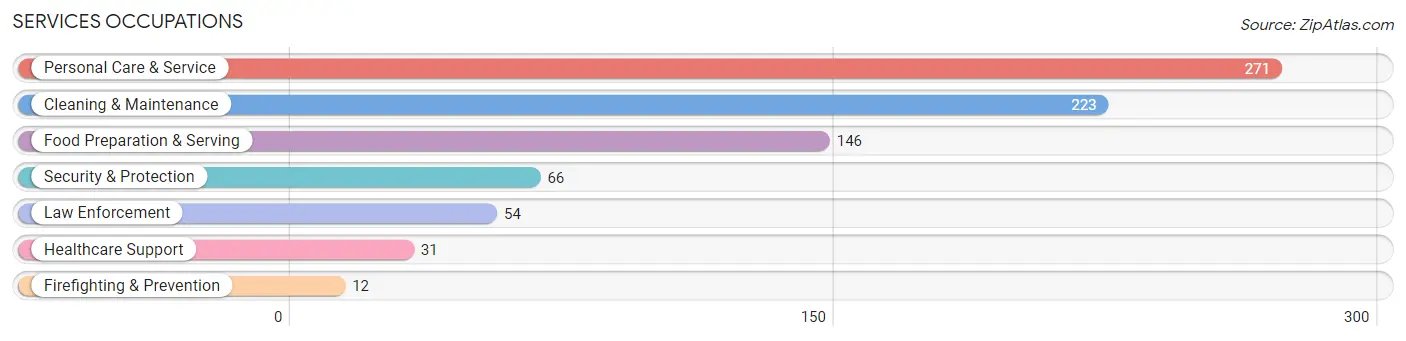
Services Occupations
The most common Services occupations in Willoughby Hills are Personal Care & Service (271 | 4.7%), Cleaning & Maintenance (223 | 3.8%), Food Preparation & Serving (146 | 2.5%), Security & Protection (66 | 1.1%), and Law Enforcement (54 | 0.9%).
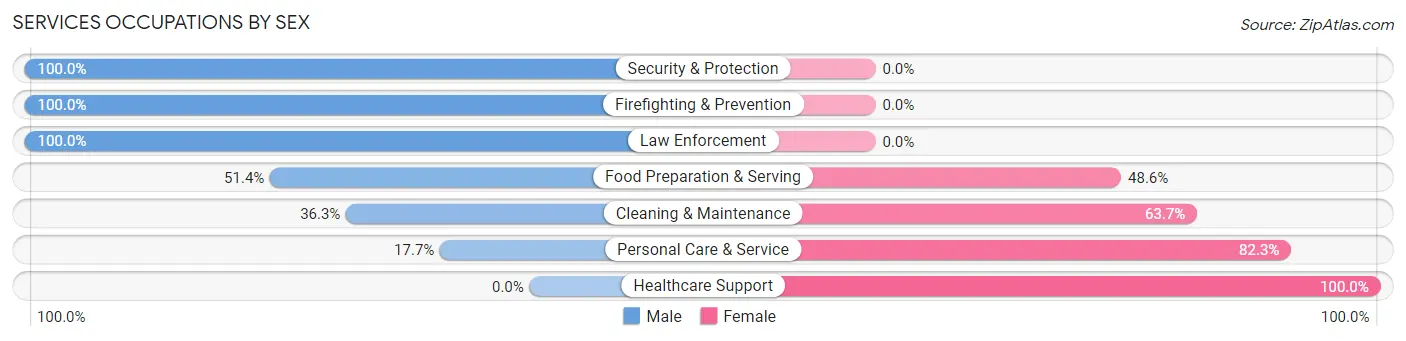
Services Occupations by Sex
Within the Services occupations in Willoughby Hills, the most male-oriented occupations are Security & Protection (100.0%), Firefighting & Prevention (100.0%), and Law Enforcement (100.0%), while the most female-oriented occupations are Healthcare Support (100.0%), Personal Care & Service (82.3%), and Cleaning & Maintenance (63.7%).
| Occupation | Male | Female |
| Healthcare Support | 0 (0.0%) | 31 (100.0%) |
| Security & Protection | 66 (100.0%) | 0 (0.0%) |
| Firefighting & Prevention | 12 (100.0%) | 0 (0.0%) |
| Law Enforcement | 54 (100.0%) | 0 (0.0%) |
| Food Preparation & Serving | 75 (51.4%) | 71 (48.6%) |
| Cleaning & Maintenance | 81 (36.3%) | 142 (63.7%) |
| Personal Care & Service | 48 (17.7%) | 223 (82.3%) |
| Total (Category) | 270 (36.6%) | 467 (63.4%) |
| Total (Overall) | 2,824 (48.5%) | 2,993 (51.4%) |
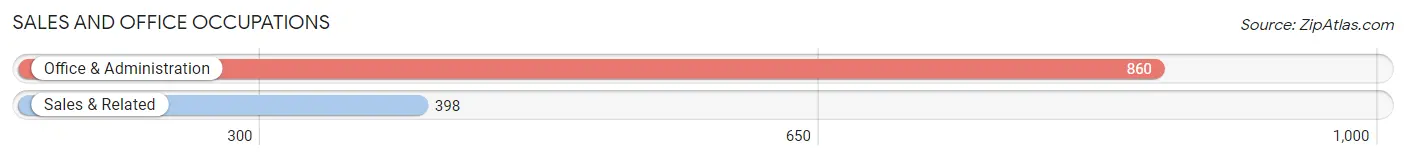
Sales and Office Occupations
The most common Sales and Office occupations in Willoughby Hills are Office & Administration (860 | 14.8%), and Sales & Related (398 | 6.8%).
Sales and Office Occupations by Sex
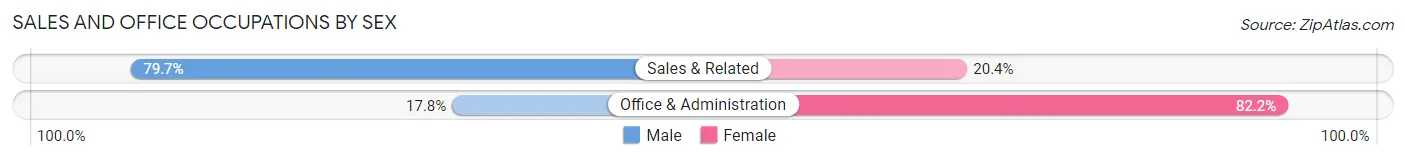
| Occupation | Male | Female |
| Sales & Related | 317 (79.6%) | 81 (20.3%) |
| Office & Administration | 153 (17.8%) | 707 (82.2%) |
| Total (Category) | 470 (37.4%) | 788 (62.6%) |
| Total (Overall) | 2,824 (48.5%) | 2,993 (51.4%) |
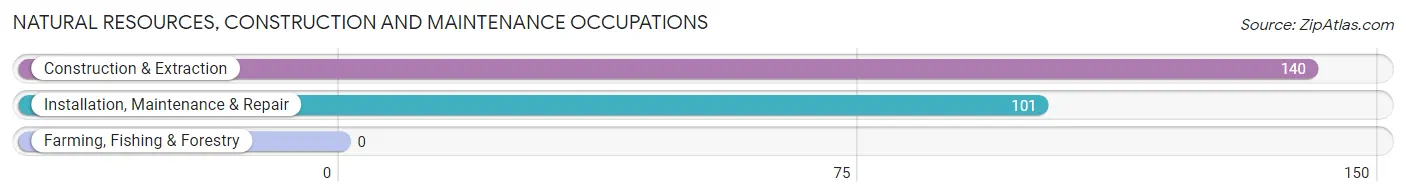
Natural Resources, Construction and Maintenance Occupations
The most common Natural Resources, Construction and Maintenance occupations in Willoughby Hills are Construction & Extraction (140 | 2.4%), and Installation, Maintenance & Repair (101 | 1.7%).
Natural Resources, Construction and Maintenance Occupations by Sex
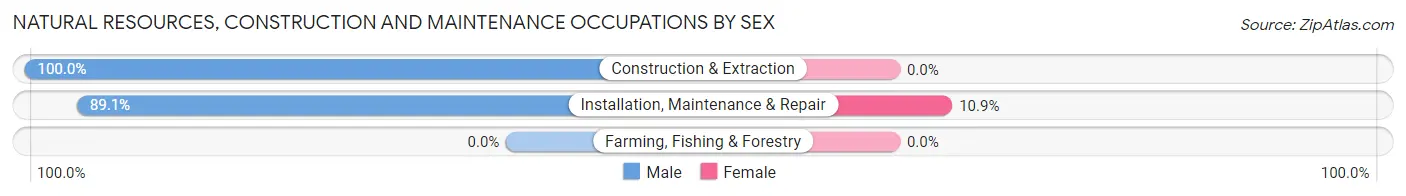
| Occupation | Male | Female |
| Farming, Fishing & Forestry | 0 (0.0%) | 0 (0.0%) |
| Construction & Extraction | 140 (100.0%) | 0 (0.0%) |
| Installation, Maintenance & Repair | 90 (89.1%) | 11 (10.9%) |
| Total (Category) | 230 (95.4%) | 11 (4.6%) |
| Total (Overall) | 2,824 (48.5%) | 2,993 (51.4%) |
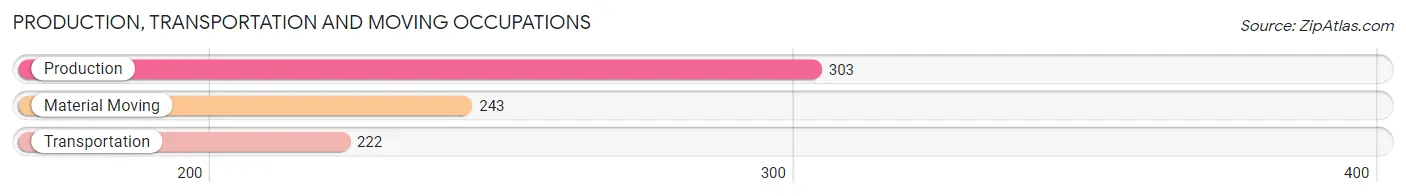
Production, Transportation and Moving Occupations
The most common Production, Transportation and Moving occupations in Willoughby Hills are Production (303 | 5.2%), Material Moving (243 | 4.2%), and Transportation (222 | 3.8%).
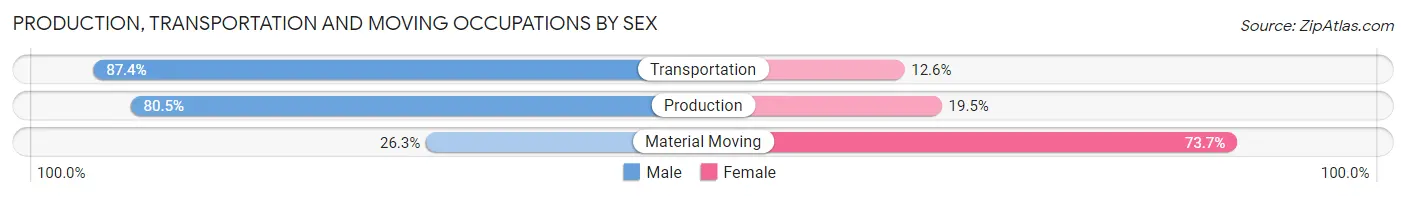
Production, Transportation and Moving Occupations by Sex
| Occupation | Male | Female |
| Production | 244 (80.5%) | 59 (19.5%) |
| Transportation | 194 (87.4%) | 28 (12.6%) |
| Material Moving | 64 (26.3%) | 179 (73.7%) |
| Total (Category) | 502 (65.4%) | 266 (34.6%) |
| Total (Overall) | 2,824 (48.5%) | 2,993 (51.4%) |
Employment Industries by Sex in Willoughby Hills
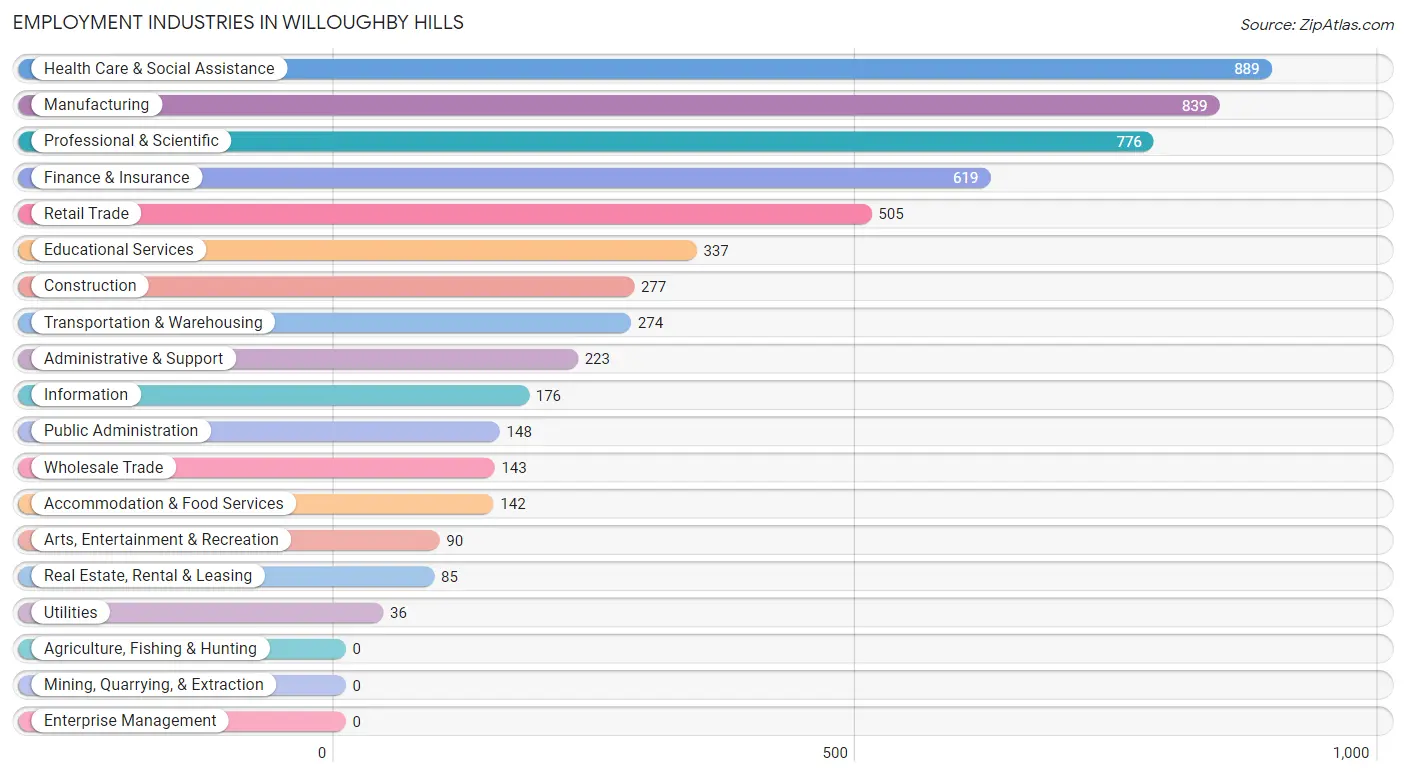
Employment Industries in Willoughby Hills
The major employment industries in Willoughby Hills include Health Care & Social Assistance (889 | 15.3%), Manufacturing (839 | 14.4%), Professional & Scientific (776 | 13.3%), Finance & Insurance (619 | 10.6%), and Retail Trade (505 | 8.7%).
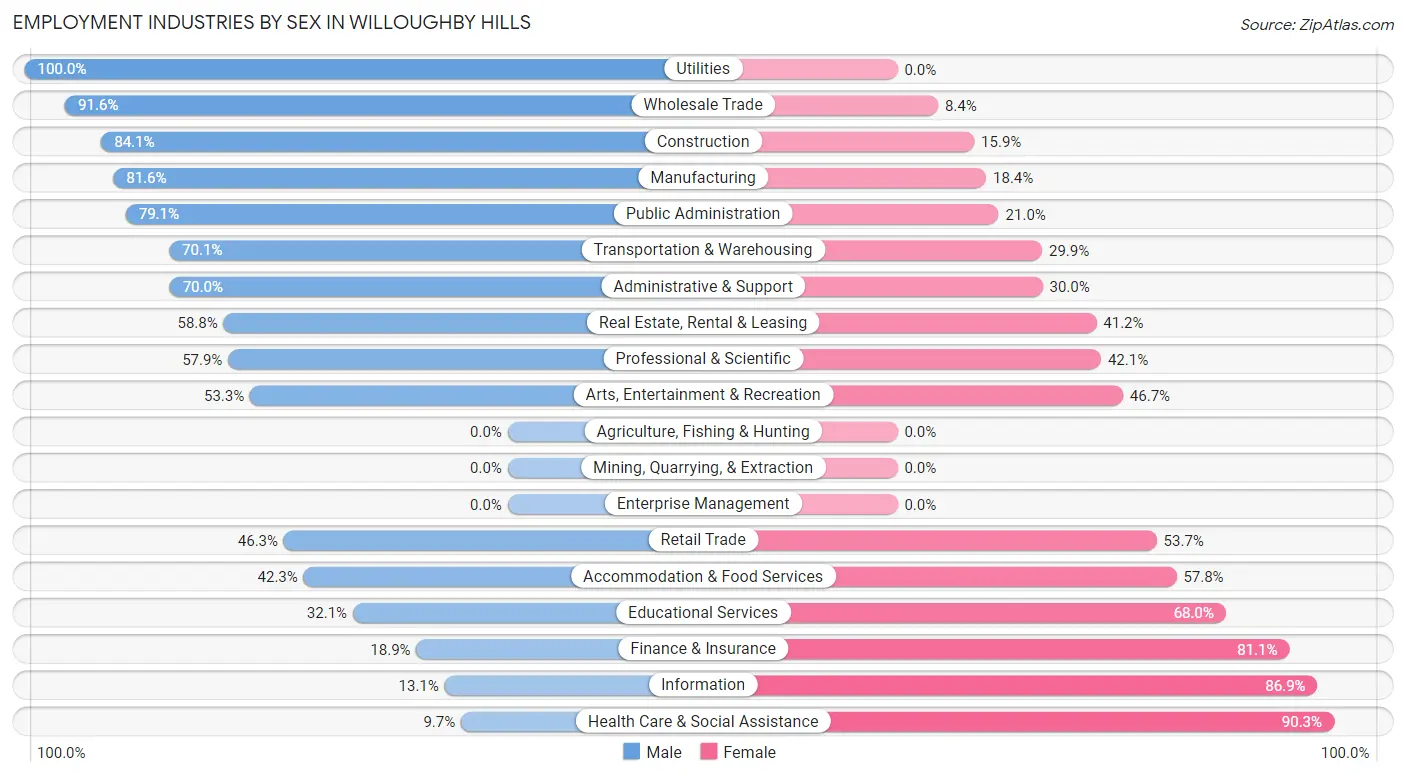
Employment Industries by Sex in Willoughby Hills
The Willoughby Hills industries that see more men than women are Utilities (100.0%), Wholesale Trade (91.6%), and Construction (84.1%), whereas the industries that tend to have a higher number of women are Health Care & Social Assistance (90.3%), Information (86.9%), and Finance & Insurance (81.1%).
| Industry | Male | Female |
| Agriculture, Fishing & Hunting | 0 (0.0%) | 0 (0.0%) |
| Mining, Quarrying, & Extraction | 0 (0.0%) | 0 (0.0%) |
| Construction | 233 (84.1%) | 44 (15.9%) |
| Manufacturing | 685 (81.6%) | 154 (18.4%) |
| Wholesale Trade | 131 (91.6%) | 12 (8.4%) |
| Retail Trade | 234 (46.3%) | 271 (53.7%) |
| Transportation & Warehousing | 192 (70.1%) | 82 (29.9%) |
| Utilities | 36 (100.0%) | 0 (0.0%) |
| Information | 23 (13.1%) | 153 (86.9%) |
| Finance & Insurance | 117 (18.9%) | 502 (81.1%) |
| Real Estate, Rental & Leasing | 50 (58.8%) | 35 (41.2%) |
| Professional & Scientific | 449 (57.9%) | 327 (42.1%) |
| Enterprise Management | 0 (0.0%) | 0 (0.0%) |
| Administrative & Support | 156 (70.0%) | 67 (30.0%) |
| Educational Services | 108 (32.1%) | 229 (67.9%) |
| Health Care & Social Assistance | 86 (9.7%) | 803 (90.3%) |
| Arts, Entertainment & Recreation | 48 (53.3%) | 42 (46.7%) |
| Accommodation & Food Services | 60 (42.2%) | 82 (57.8%) |
| Public Administration | 117 (79.0%) | 31 (20.9%) |
| Total | 2,824 (48.5%) | 2,993 (51.4%) |
Education in Willoughby Hills
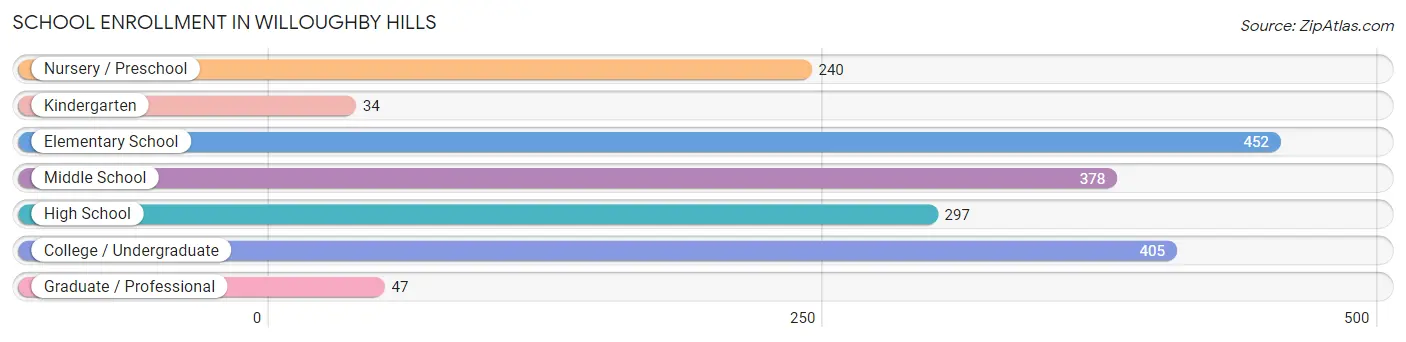
School Enrollment in Willoughby Hills
The most common levels of schooling among the 1,853 students in Willoughby Hills are elementary school (452 | 24.4%), college / undergraduate (405 | 21.9%), and middle school (378 | 20.4%).
| School Level | # Students | % Students |
| Nursery / Preschool | 240 | 13.0% |
| Kindergarten | 34 | 1.8% |
| Elementary School | 452 | 24.4% |
| Middle School | 378 | 20.4% |
| High School | 297 | 16.0% |
| College / Undergraduate | 405 | 21.9% |
| Graduate / Professional | 47 | 2.5% |
| Total | 1,853 | 100.0% |
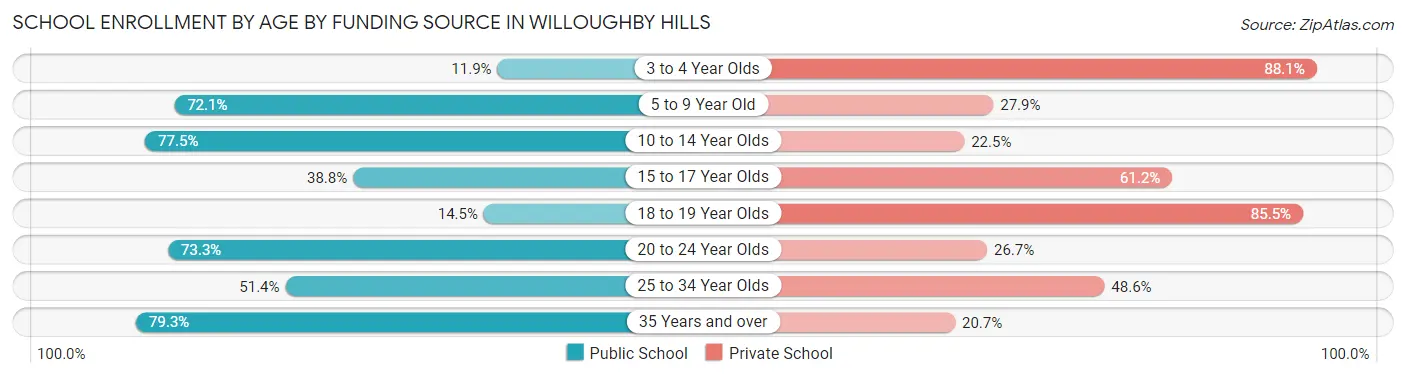
School Enrollment by Age by Funding Source in Willoughby Hills
Out of a total of 1,853 students who are enrolled in schools in Willoughby Hills, 730 (39.4%) attend a private institution, while the remaining 1,123 (60.6%) are enrolled in public schools. The age group of 3 to 4 year olds has the highest likelihood of being enrolled in private schools, with 192 (88.1% in the age bracket) enrolled. Conversely, the age group of 35 years and over has the lowest likelihood of being enrolled in a private school, with 107 (79.3% in the age bracket) attending a public institution.
| Age Bracket | Public School | Private School |
| 3 to 4 Year Olds | 26 (11.9%) | 192 (88.1%) |
| 5 to 9 Year Old | 220 (72.1%) | 85 (27.9%) |
| 10 to 14 Year Olds | 497 (77.5%) | 144 (22.5%) |
| 15 to 17 Year Olds | 92 (38.8%) | 145 (61.2%) |
| 18 to 19 Year Olds | 11 (14.5%) | 65 (85.5%) |
| 20 to 24 Year Olds | 151 (73.3%) | 55 (26.7%) |
| 25 to 34 Year Olds | 18 (51.4%) | 17 (48.6%) |
| 35 Years and over | 107 (79.3%) | 28 (20.7%) |
| Total | 1,123 (60.6%) | 730 (39.4%) |
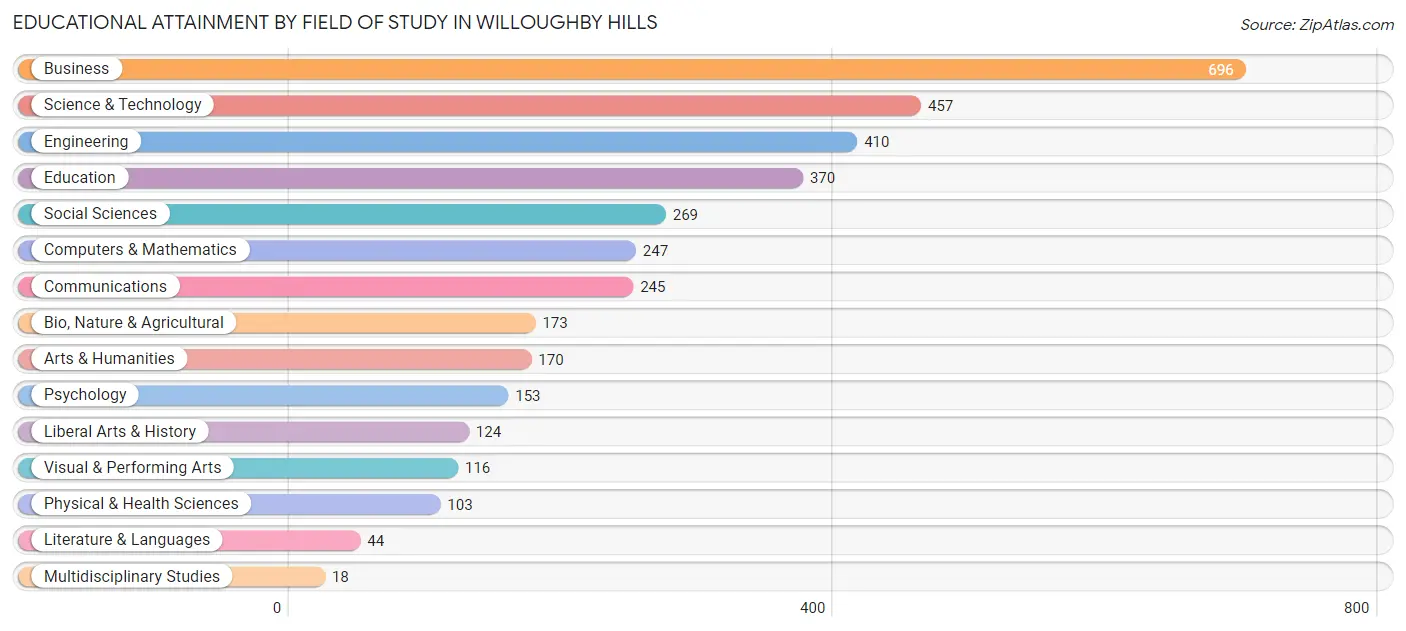
Educational Attainment by Field of Study in Willoughby Hills
Business (696 | 19.4%), science & technology (457 | 12.7%), engineering (410 | 11.4%), education (370 | 10.3%), and social sciences (269 | 7.5%) are the most common fields of study among 3,595 individuals in Willoughby Hills who have obtained a bachelor's degree or higher.
| Field of Study | # Graduates | % Graduates |
| Computers & Mathematics | 247 | 6.9% |
| Bio, Nature & Agricultural | 173 | 4.8% |
| Physical & Health Sciences | 103 | 2.9% |
| Psychology | 153 | 4.3% |
| Social Sciences | 269 | 7.5% |
| Engineering | 410 | 11.4% |
| Multidisciplinary Studies | 18 | 0.5% |
| Science & Technology | 457 | 12.7% |
| Business | 696 | 19.4% |
| Education | 370 | 10.3% |
| Literature & Languages | 44 | 1.2% |
| Liberal Arts & History | 124 | 3.5% |
| Visual & Performing Arts | 116 | 3.2% |
| Communications | 245 | 6.8% |
| Arts & Humanities | 170 | 4.7% |
| Total | 3,595 | 100.0% |
Transportation & Commute in Willoughby Hills
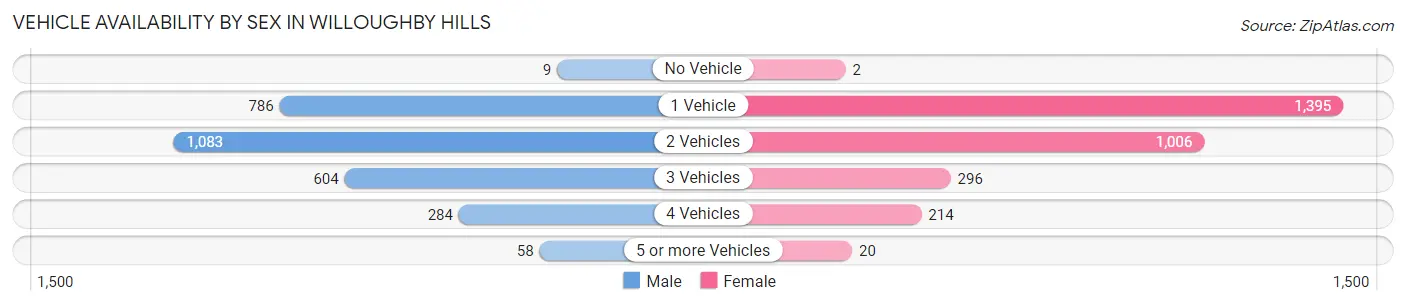
Vehicle Availability by Sex in Willoughby Hills
The most prevalent vehicle ownership categories in Willoughby Hills are males with 2 vehicles (1,083, accounting for 38.4%) and females with 2 vehicles (1,006, making up 36.9%).
| Vehicles Available | Male | Female |
| No Vehicle | 9 (0.3%) | 2 (0.1%) |
| 1 Vehicle | 786 (27.8%) | 1,395 (47.6%) |
| 2 Vehicles | 1,083 (38.4%) | 1,006 (34.3%) |
| 3 Vehicles | 604 (21.4%) | 296 (10.1%) |
| 4 Vehicles | 284 (10.1%) | 214 (7.3%) |
| 5 or more Vehicles | 58 (2.1%) | 20 (0.7%) |
| Total | 2,824 (100.0%) | 2,933 (100.0%) |
Commute Time in Willoughby Hills
The most frequently occuring commute durations in Willoughby Hills are 20 to 24 minutes (1,254 commuters, 27.1%), 15 to 19 minutes (988 commuters, 21.3%), and 30 to 34 minutes (698 commuters, 15.1%).
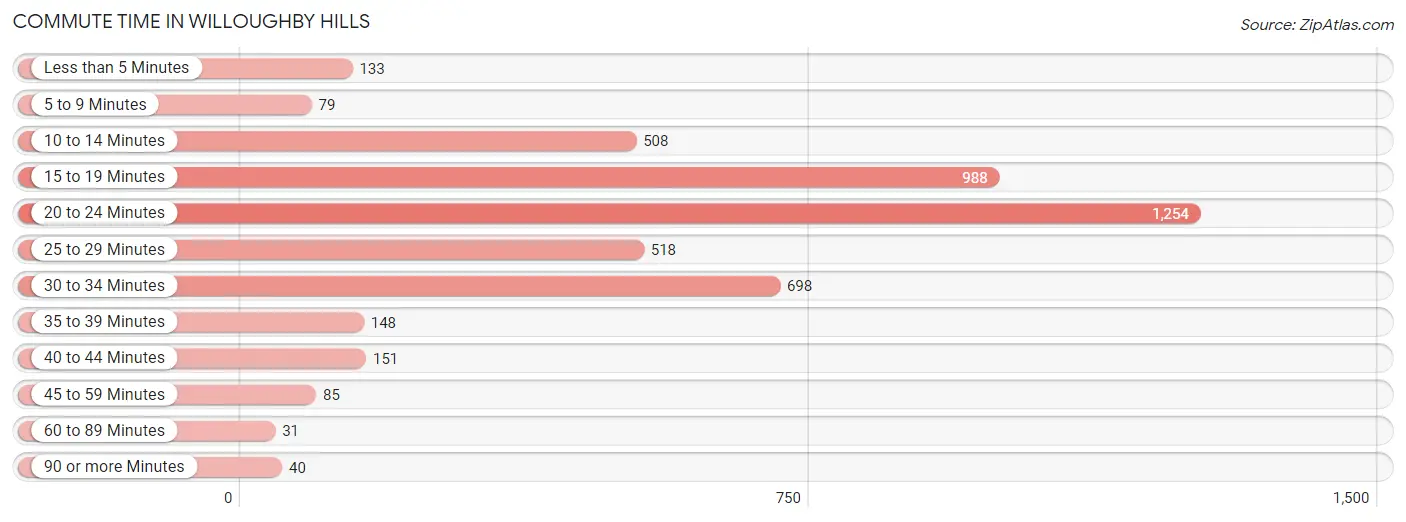
| Commute Time | # Commuters | % Commuters |
| Less than 5 Minutes | 133 | 2.9% |
| 5 to 9 Minutes | 79 | 1.7% |
| 10 to 14 Minutes | 508 | 11.0% |
| 15 to 19 Minutes | 988 | 21.3% |
| 20 to 24 Minutes | 1,254 | 27.1% |
| 25 to 29 Minutes | 518 | 11.2% |
| 30 to 34 Minutes | 698 | 15.1% |
| 35 to 39 Minutes | 148 | 3.2% |
| 40 to 44 Minutes | 151 | 3.3% |
| 45 to 59 Minutes | 85 | 1.8% |
| 60 to 89 Minutes | 31 | 0.7% |
| 90 or more Minutes | 40 | 0.9% |
Commute Time by Sex in Willoughby Hills
The most common commute times in Willoughby Hills are 20 to 24 minutes (814 commuters, 33.2%) for males and 20 to 24 minutes (440 commuters, 20.2%) for females.
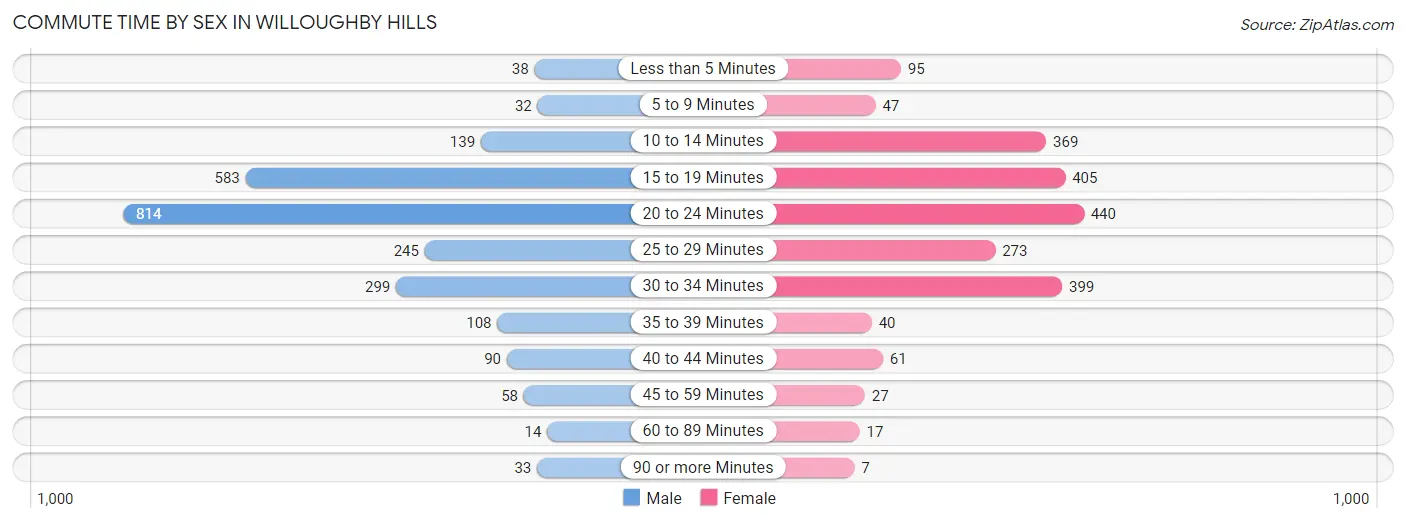
| Commute Time | Male | Female |
| Less than 5 Minutes | 38 (1.5%) | 95 (4.4%) |
| 5 to 9 Minutes | 32 (1.3%) | 47 (2.2%) |
| 10 to 14 Minutes | 139 (5.7%) | 369 (16.9%) |
| 15 to 19 Minutes | 583 (23.8%) | 405 (18.6%) |
| 20 to 24 Minutes | 814 (33.2%) | 440 (20.2%) |
| 25 to 29 Minutes | 245 (10.0%) | 273 (12.5%) |
| 30 to 34 Minutes | 299 (12.2%) | 399 (18.3%) |
| 35 to 39 Minutes | 108 (4.4%) | 40 (1.8%) |
| 40 to 44 Minutes | 90 (3.7%) | 61 (2.8%) |
| 45 to 59 Minutes | 58 (2.4%) | 27 (1.2%) |
| 60 to 89 Minutes | 14 (0.6%) | 17 (0.8%) |
| 90 or more Minutes | 33 (1.3%) | 7 (0.3%) |
Time of Departure to Work by Sex in Willoughby Hills
The most frequent times of departure to work in Willoughby Hills are 7:00 AM to 7:29 AM (463, 18.9%) for males and 9:00 AM to 9:59 AM (347, 15.9%) for females.
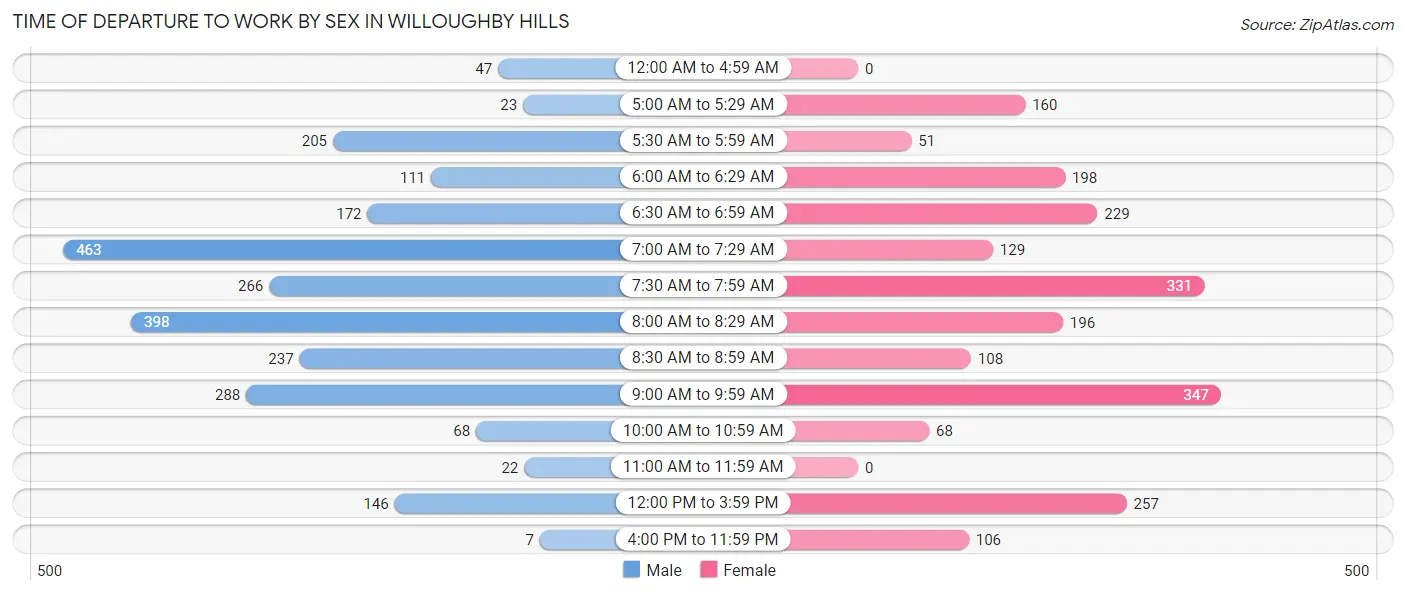
| Time of Departure | Male | Female |
| 12:00 AM to 4:59 AM | 47 (1.9%) | 0 (0.0%) |
| 5:00 AM to 5:29 AM | 23 (0.9%) | 160 (7.3%) |
| 5:30 AM to 5:59 AM | 205 (8.4%) | 51 (2.3%) |
| 6:00 AM to 6:29 AM | 111 (4.5%) | 198 (9.1%) |
| 6:30 AM to 6:59 AM | 172 (7.0%) | 229 (10.5%) |
| 7:00 AM to 7:29 AM | 463 (18.9%) | 129 (5.9%) |
| 7:30 AM to 7:59 AM | 266 (10.8%) | 331 (15.2%) |
| 8:00 AM to 8:29 AM | 398 (16.2%) | 196 (9.0%) |
| 8:30 AM to 8:59 AM | 237 (9.7%) | 108 (5.0%) |
| 9:00 AM to 9:59 AM | 288 (11.7%) | 347 (15.9%) |
| 10:00 AM to 10:59 AM | 68 (2.8%) | 68 (3.1%) |
| 11:00 AM to 11:59 AM | 22 (0.9%) | 0 (0.0%) |
| 12:00 PM to 3:59 PM | 146 (5.9%) | 257 (11.8%) |
| 4:00 PM to 11:59 PM | 7 (0.3%) | 106 (4.9%) |
| Total | 2,453 (100.0%) | 2,180 (100.0%) |
Housing Occupancy in Willoughby Hills
Occupancy by Ownership in Willoughby Hills
Of the total 5,176 dwellings in Willoughby Hills, owner-occupied units account for 2,292 (44.3%), while renter-occupied units make up 2,884 (55.7%).
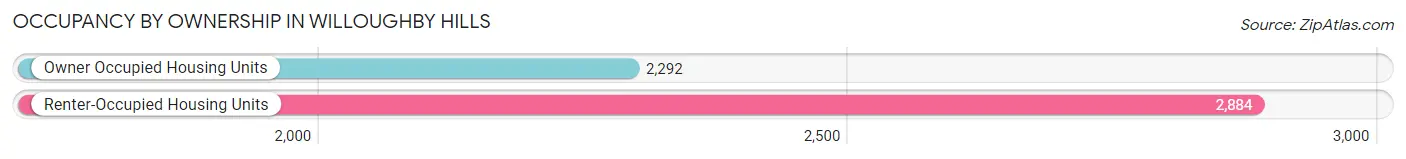
| Occupancy | # Housing Units | % Housing Units |
| Owner Occupied Housing Units | 2,292 | 44.3% |
| Renter-Occupied Housing Units | 2,884 | 55.7% |
| Total Occupied Housing Units | 5,176 | 100.0% |
Occupancy by Household Size in Willoughby Hills
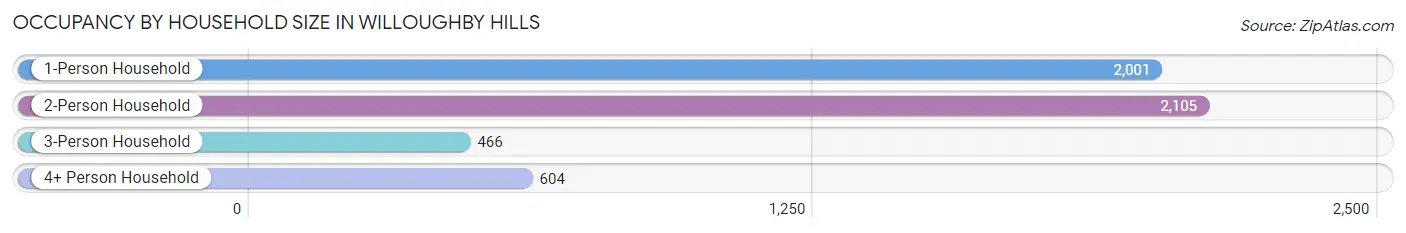
| Household Size | # Housing Units | % Housing Units |
| 1-Person Household | 2,001 | 38.7% |
| 2-Person Household | 2,105 | 40.7% |
| 3-Person Household | 466 | 9.0% |
| 4+ Person Household | 604 | 11.7% |
| Total Housing Units | 5,176 | 100.0% |
Occupancy by Ownership by Household Size in Willoughby Hills
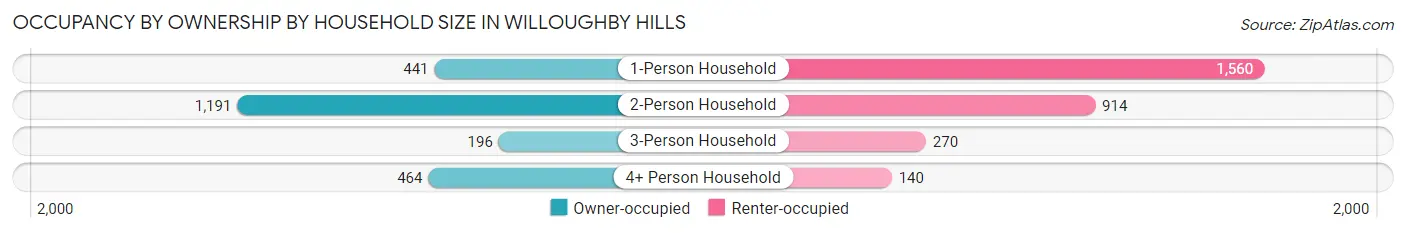
| Household Size | Owner-occupied | Renter-occupied |
| 1-Person Household | 441 (22.0%) | 1,560 (78.0%) |
| 2-Person Household | 1,191 (56.6%) | 914 (43.4%) |
| 3-Person Household | 196 (42.1%) | 270 (57.9%) |
| 4+ Person Household | 464 (76.8%) | 140 (23.2%) |
| Total Housing Units | 2,292 (44.3%) | 2,884 (55.7%) |
Occupancy by Educational Attainment in Willoughby Hills
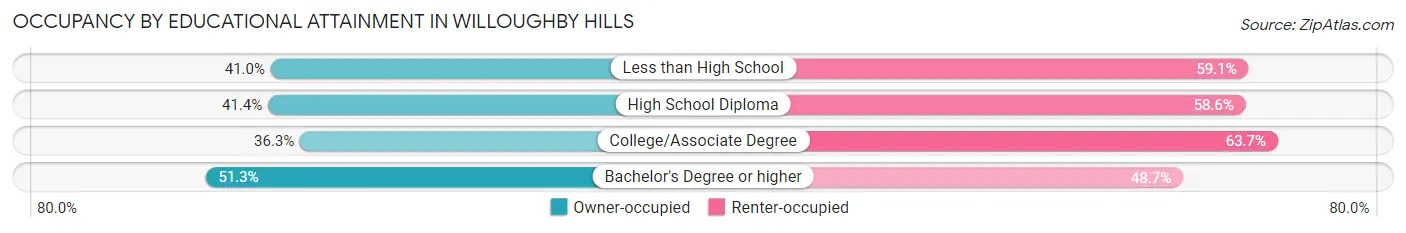
| Household Size | Owner-occupied | Renter-occupied |
| Less than High School | 95 (40.9%) | 137 (59.1%) |
| High School Diploma | 519 (41.4%) | 735 (58.6%) |
| College/Associate Degree | 522 (36.3%) | 916 (63.7%) |
| Bachelor's Degree or higher | 1,156 (51.3%) | 1,096 (48.7%) |
Occupancy by Age of Householder in Willoughby Hills
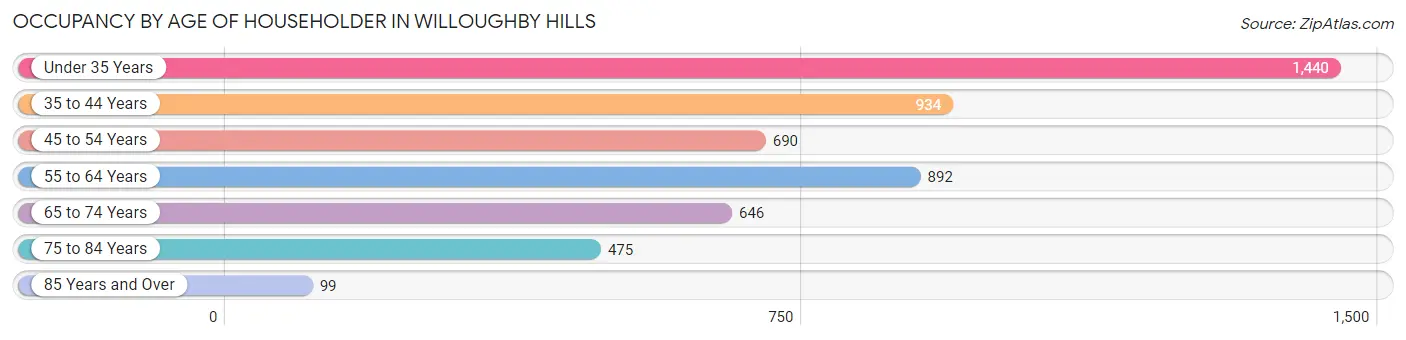
| Age Bracket | # Households | % Households |
| Under 35 Years | 1,440 | 27.8% |
| 35 to 44 Years | 934 | 18.0% |
| 45 to 54 Years | 690 | 13.3% |
| 55 to 64 Years | 892 | 17.2% |
| 65 to 74 Years | 646 | 12.5% |
| 75 to 84 Years | 475 | 9.2% |
| 85 Years and Over | 99 | 1.9% |
| Total | 5,176 | 100.0% |
Housing Finances in Willoughby Hills
Median Income by Occupancy in Willoughby Hills
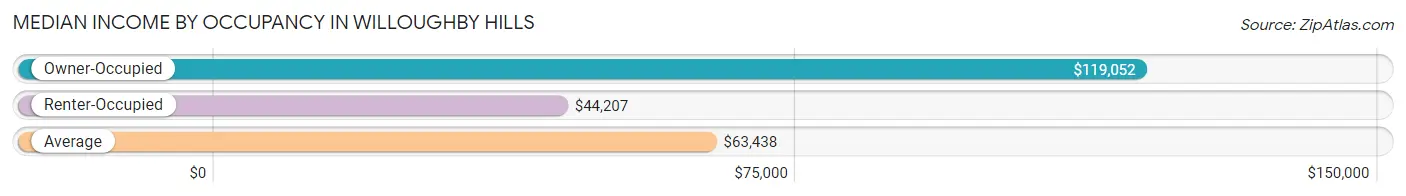
| Occupancy Type | # Households | Median Income |
| Owner-Occupied | 2,292 (44.3%) | $119,052 |
| Renter-Occupied | 2,884 (55.7%) | $44,207 |
| Average | 5,176 (100.0%) | $63,438 |
Occupancy by Householder Income Bracket in Willoughby Hills
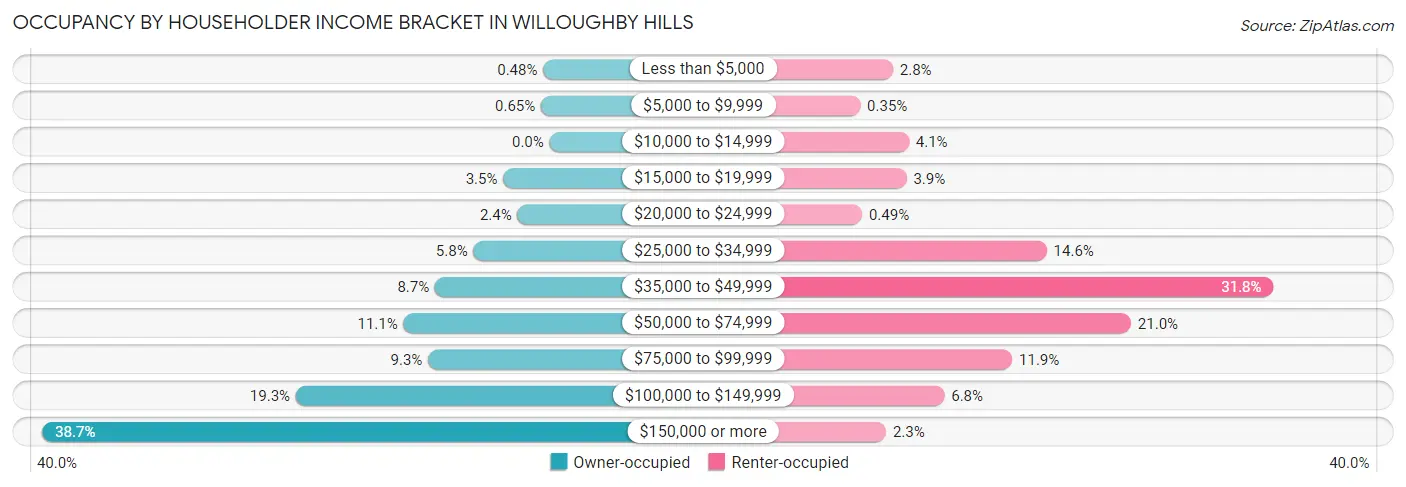
| Income Bracket | Owner-occupied | Renter-occupied |
| Less than $5,000 | 11 (0.5%) | 82 (2.8%) |
| $5,000 to $9,999 | 15 (0.6%) | 10 (0.4%) |
| $10,000 to $14,999 | 0 (0.0%) | 117 (4.1%) |
| $15,000 to $19,999 | 81 (3.5%) | 112 (3.9%) |
| $20,000 to $24,999 | 56 (2.4%) | 14 (0.5%) |
| $25,000 to $34,999 | 133 (5.8%) | 420 (14.6%) |
| $35,000 to $49,999 | 200 (8.7%) | 918 (31.8%) |
| $50,000 to $74,999 | 255 (11.1%) | 605 (21.0%) |
| $75,000 to $99,999 | 212 (9.2%) | 344 (11.9%) |
| $100,000 to $149,999 | 443 (19.3%) | 195 (6.8%) |
| $150,000 or more | 886 (38.7%) | 67 (2.3%) |
| Total | 2,292 (100.0%) | 2,884 (100.0%) |
Monthly Housing Cost Tiers in Willoughby Hills
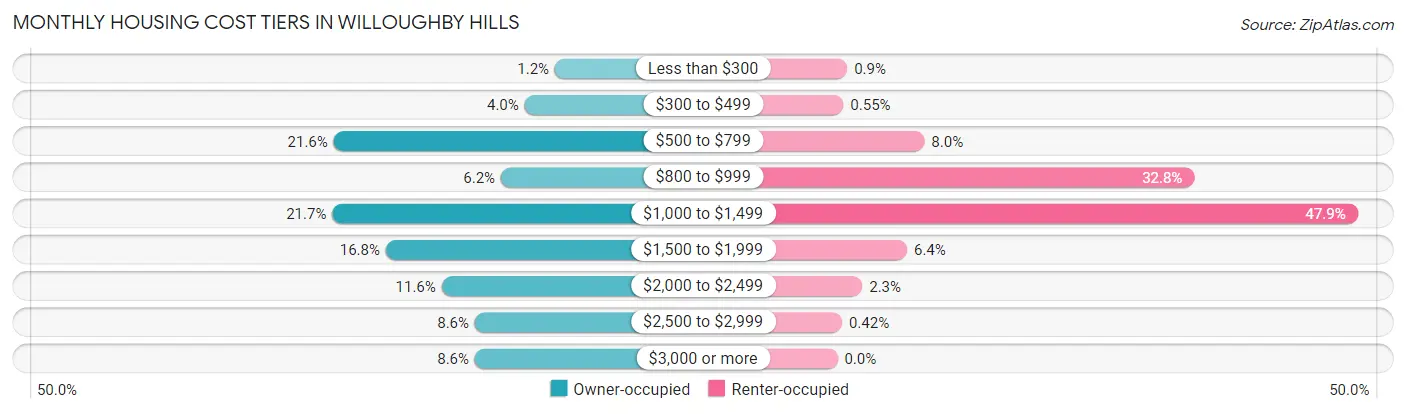
| Monthly Cost | Owner-occupied | Renter-occupied |
| Less than $300 | 27 (1.2%) | 26 (0.9%) |
| $300 to $499 | 91 (4.0%) | 16 (0.5%) |
| $500 to $799 | 494 (21.5%) | 231 (8.0%) |
| $800 to $999 | 141 (6.1%) | 947 (32.8%) |
| $1,000 to $1,499 | 497 (21.7%) | 1,381 (47.9%) |
| $1,500 to $1,999 | 384 (16.8%) | 185 (6.4%) |
| $2,000 to $2,499 | 266 (11.6%) | 66 (2.3%) |
| $2,500 to $2,999 | 196 (8.6%) | 12 (0.4%) |
| $3,000 or more | 196 (8.6%) | 0 (0.0%) |
| Total | 2,292 (100.0%) | 2,884 (100.0%) |
Physical Housing Characteristics in Willoughby Hills
Housing Structures in Willoughby Hills
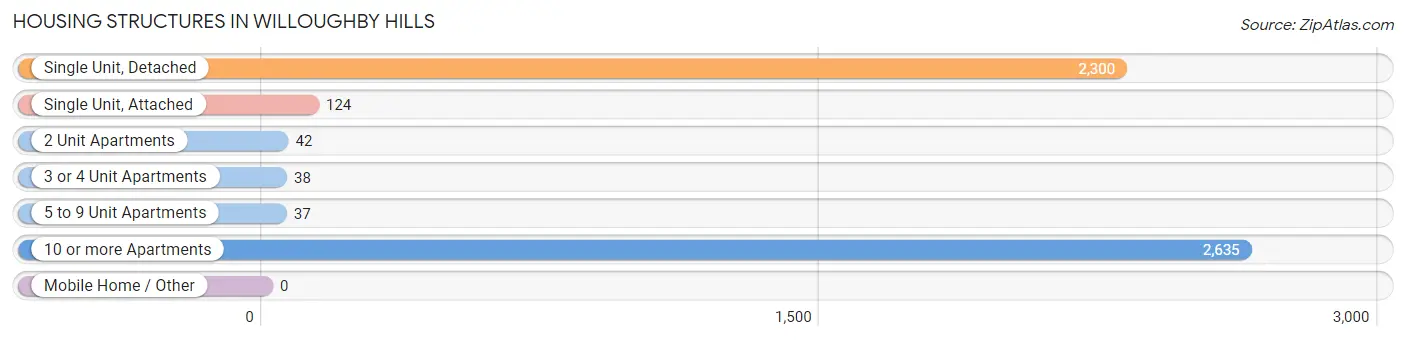
| Structure Type | # Housing Units | % Housing Units |
| Single Unit, Detached | 2,300 | 44.4% |
| Single Unit, Attached | 124 | 2.4% |
| 2 Unit Apartments | 42 | 0.8% |
| 3 or 4 Unit Apartments | 38 | 0.7% |
| 5 to 9 Unit Apartments | 37 | 0.7% |
| 10 or more Apartments | 2,635 | 50.9% |
| Mobile Home / Other | 0 | 0.0% |
| Total | 5,176 | 100.0% |
Housing Structures by Occupancy in Willoughby Hills
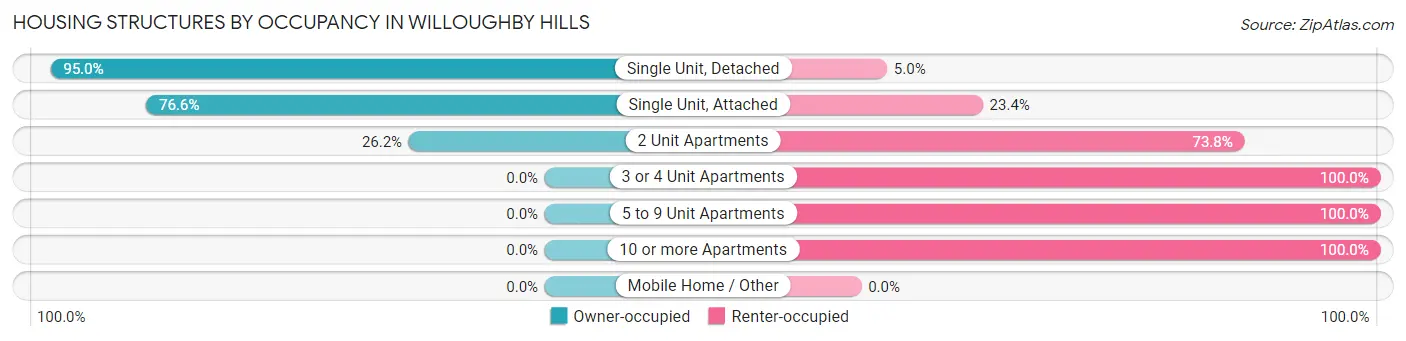
| Structure Type | Owner-occupied | Renter-occupied |
| Single Unit, Detached | 2,186 (95.0%) | 114 (5.0%) |
| Single Unit, Attached | 95 (76.6%) | 29 (23.4%) |
| 2 Unit Apartments | 11 (26.2%) | 31 (73.8%) |
| 3 or 4 Unit Apartments | 0 (0.0%) | 38 (100.0%) |
| 5 to 9 Unit Apartments | 0 (0.0%) | 37 (100.0%) |
| 10 or more Apartments | 0 (0.0%) | 2,635 (100.0%) |
| Mobile Home / Other | 0 (0.0%) | 0 (0.0%) |
| Total | 2,292 (44.3%) | 2,884 (55.7%) |
Housing Structures by Number of Rooms in Willoughby Hills
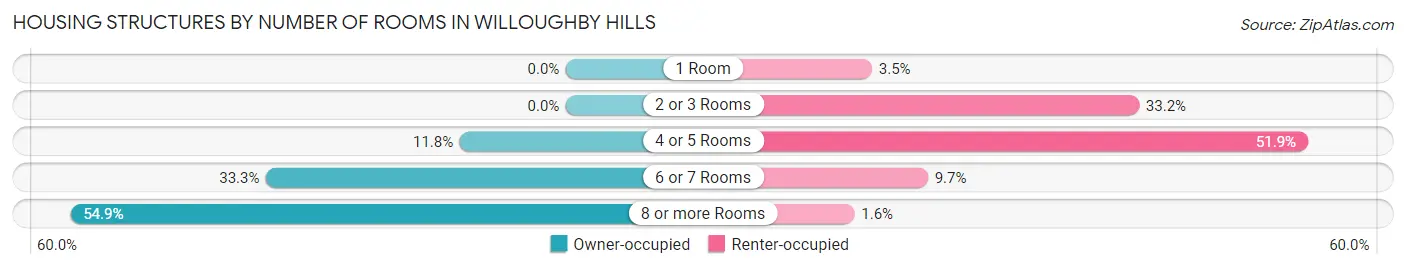
| Number of Rooms | Owner-occupied | Renter-occupied |
| 1 Room | 0 (0.0%) | 102 (3.5%) |
| 2 or 3 Rooms | 0 (0.0%) | 957 (33.2%) |
| 4 or 5 Rooms | 270 (11.8%) | 1,498 (51.9%) |
| 6 or 7 Rooms | 763 (33.3%) | 281 (9.7%) |
| 8 or more Rooms | 1,259 (54.9%) | 46 (1.6%) |
| Total | 2,292 (100.0%) | 2,884 (100.0%) |
Housing Structure by Heating Type in Willoughby Hills
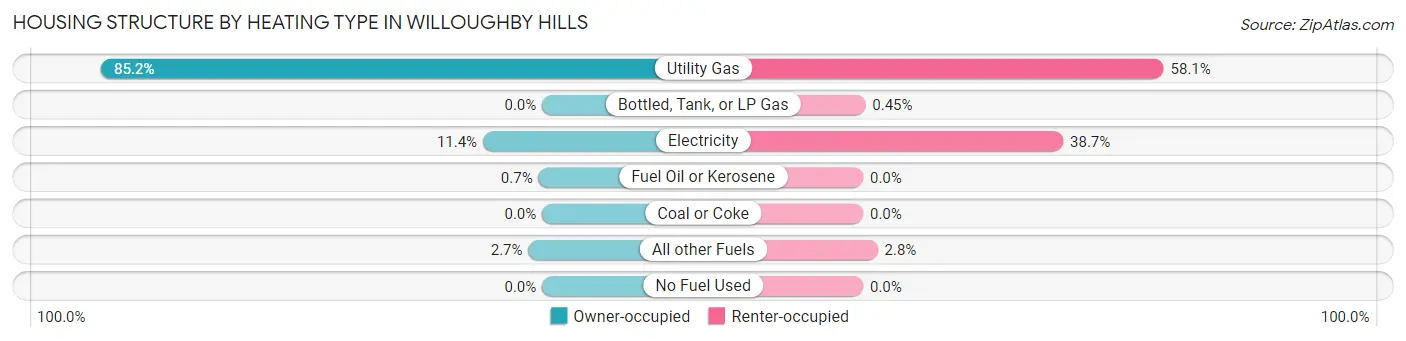
| Heating Type | Owner-occupied | Renter-occupied |
| Utility Gas | 1,953 (85.2%) | 1,675 (58.1%) |
| Bottled, Tank, or LP Gas | 0 (0.0%) | 13 (0.4%) |
| Electricity | 262 (11.4%) | 1,115 (38.7%) |
| Fuel Oil or Kerosene | 16 (0.7%) | 0 (0.0%) |
| Coal or Coke | 0 (0.0%) | 0 (0.0%) |
| All other Fuels | 61 (2.7%) | 81 (2.8%) |
| No Fuel Used | 0 (0.0%) | 0 (0.0%) |
| Total | 2,292 (100.0%) | 2,884 (100.0%) |
Household Vehicle Usage in Willoughby Hills
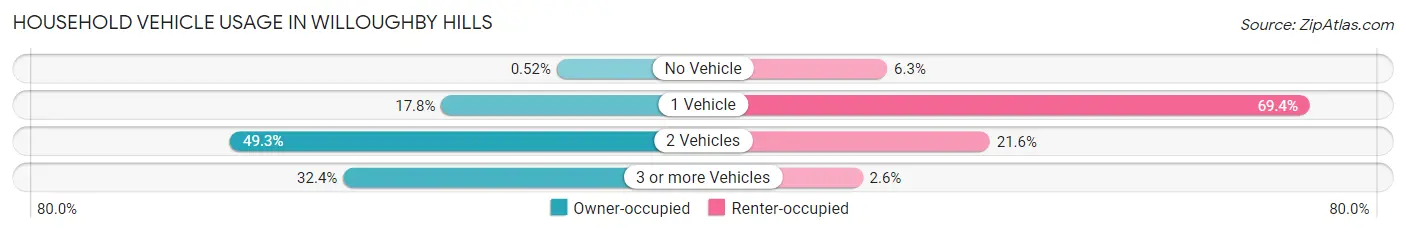
| Vehicles per Household | Owner-occupied | Renter-occupied |
| No Vehicle | 12 (0.5%) | 182 (6.3%) |
| 1 Vehicle | 407 (17.8%) | 2,002 (69.4%) |
| 2 Vehicles | 1,130 (49.3%) | 624 (21.6%) |
| 3 or more Vehicles | 743 (32.4%) | 76 (2.6%) |
| Total | 2,292 (100.0%) | 2,884 (100.0%) |
Real Estate & Mortgages in Willoughby Hills
Real Estate and Mortgage Overview in Willoughby Hills
| Characteristic | Without Mortgage | With Mortgage |
| Housing Units | 999 | 1,293 |
| Median Property Value | $255,200 | $327,800 |
| Median Household Income | $78,906 | $583 |
| Monthly Housing Costs | $732 | $196 |
| Real Estate Taxes | $4,856 | $0 |
Property Value by Mortgage Status in Willoughby Hills
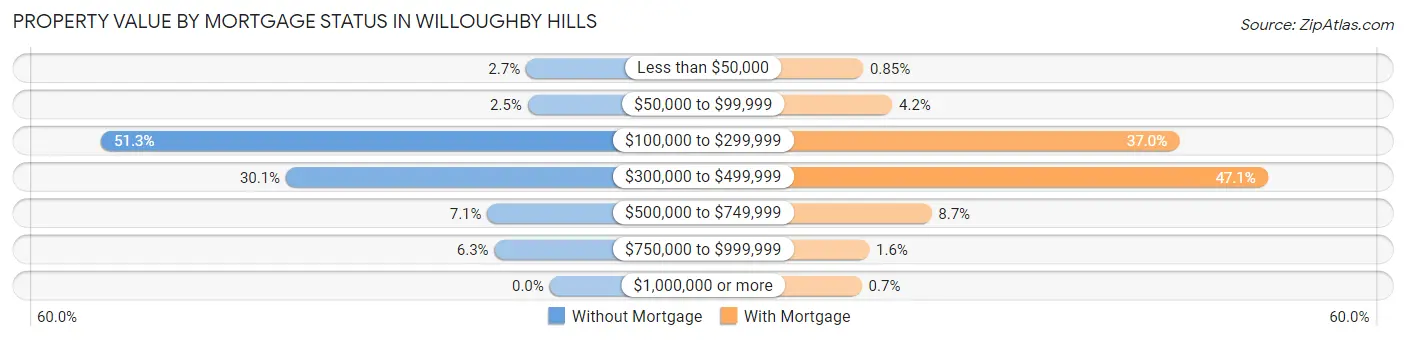
| Property Value | Without Mortgage | With Mortgage |
| Less than $50,000 | 27 (2.7%) | 11 (0.9%) |
| $50,000 to $99,999 | 25 (2.5%) | 54 (4.2%) |
| $100,000 to $299,999 | 512 (51.2%) | 478 (37.0%) |
| $300,000 to $499,999 | 301 (30.1%) | 609 (47.1%) |
| $500,000 to $749,999 | 71 (7.1%) | 112 (8.7%) |
| $750,000 to $999,999 | 63 (6.3%) | 20 (1.5%) |
| $1,000,000 or more | 0 (0.0%) | 9 (0.7%) |
| Total | 999 (100.0%) | 1,293 (100.0%) |
Household Income by Mortgage Status in Willoughby Hills
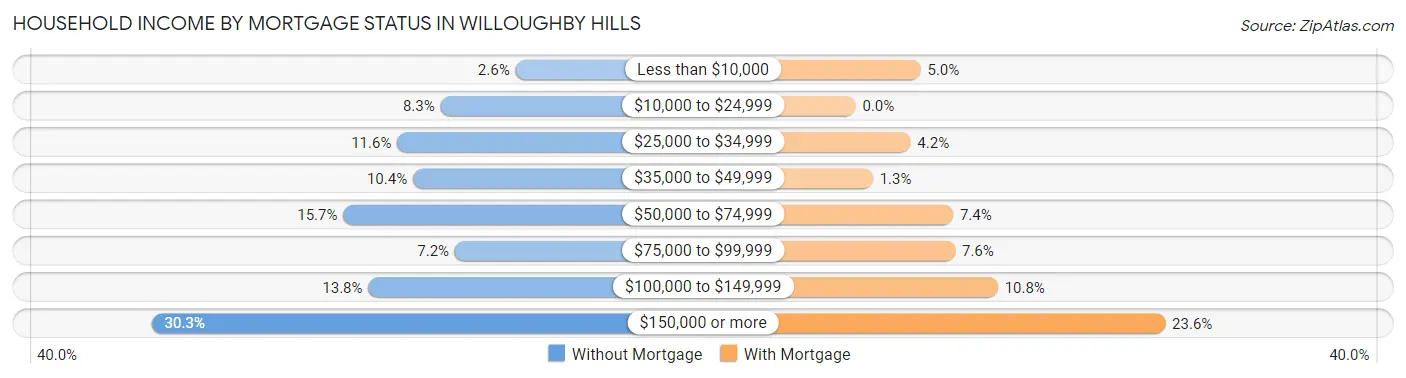
| Household Income | Without Mortgage | With Mortgage |
| Less than $10,000 | 26 (2.6%) | 64 (5.0%) |
| $10,000 to $24,999 | 83 (8.3%) | 0 (0.0%) |
| $25,000 to $34,999 | 116 (11.6%) | 54 (4.2%) |
| $35,000 to $49,999 | 104 (10.4%) | 17 (1.3%) |
| $50,000 to $74,999 | 157 (15.7%) | 96 (7.4%) |
| $75,000 to $99,999 | 72 (7.2%) | 98 (7.6%) |
| $100,000 to $149,999 | 138 (13.8%) | 140 (10.8%) |
| $150,000 or more | 303 (30.3%) | 305 (23.6%) |
| Total | 999 (100.0%) | 1,293 (100.0%) |
Property Value to Household Income Ratio in Willoughby Hills
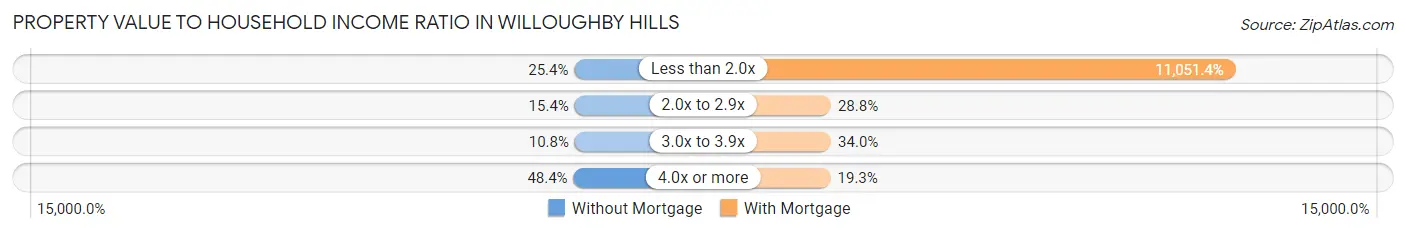
| Value-to-Income Ratio | Without Mortgage | With Mortgage |
| Less than 2.0x | 254 (25.4%) | 142,894 (11,051.3%) |
| 2.0x to 2.9x | 154 (15.4%) | 372 (28.8%) |
| 3.0x to 3.9x | 108 (10.8%) | 440 (34.0%) |
| 4.0x or more | 483 (48.3%) | 249 (19.3%) |
| Total | 999 (100.0%) | 1,293 (100.0%) |
Real Estate Taxes by Mortgage Status in Willoughby Hills
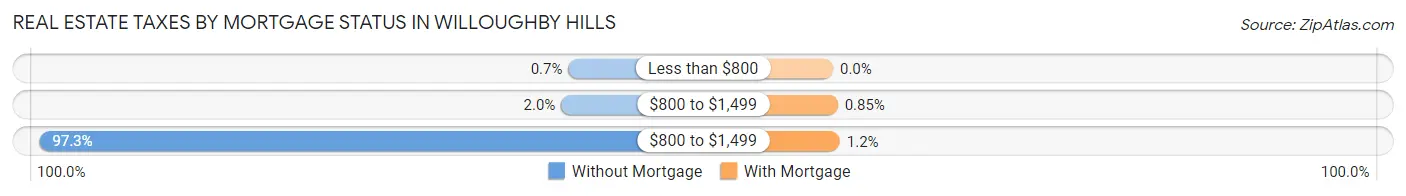
| Property Taxes | Without Mortgage | With Mortgage |
| Less than $800 | 7 (0.7%) | 0 (0.0%) |
| $800 to $1,499 | 20 (2.0%) | 11 (0.9%) |
| $800 to $1,499 | 972 (97.3%) | 16 (1.2%) |
| Total | 999 (100.0%) | 1,293 (100.0%) |
Health & Disability in Willoughby Hills
Health Insurance Coverage by Age in Willoughby Hills
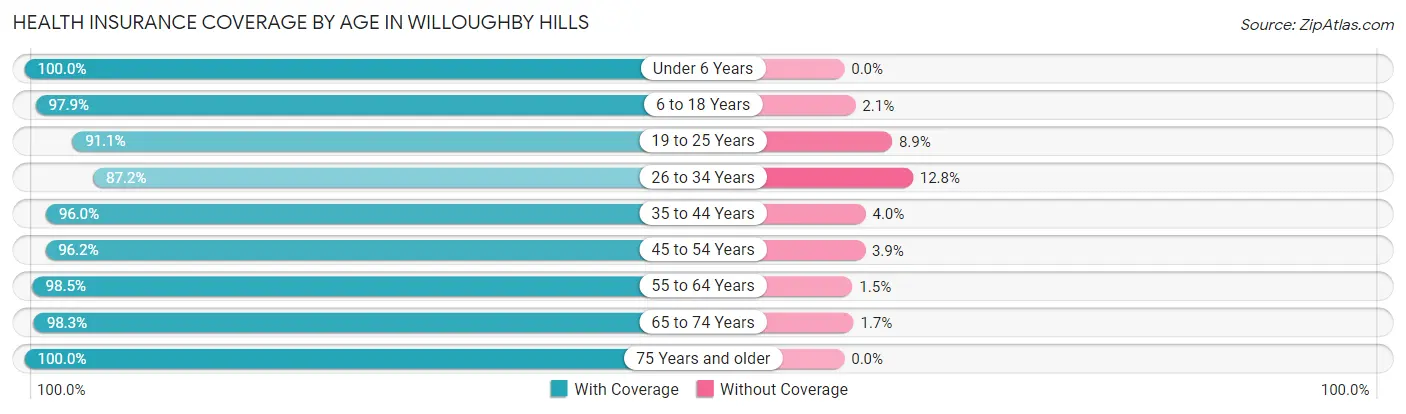
| Age Bracket | With Coverage | Without Coverage |
| Under 6 Years | 518 (100.0%) | 0 (0.0%) |
| 6 to 18 Years | 1,137 (97.9%) | 24 (2.1%) |
| 19 to 25 Years | 810 (91.1%) | 79 (8.9%) |
| 26 to 34 Years | 1,387 (87.2%) | 203 (12.8%) |
| 35 to 44 Years | 1,381 (96.0%) | 57 (4.0%) |
| 45 to 54 Years | 900 (96.2%) | 36 (3.8%) |
| 55 to 64 Years | 1,562 (98.5%) | 24 (1.5%) |
| 65 to 74 Years | 971 (98.3%) | 17 (1.7%) |
| 75 Years and older | 862 (100.0%) | 0 (0.0%) |
| Total | 9,528 (95.6%) | 440 (4.4%) |
Health Insurance Coverage by Citizenship Status in Willoughby Hills
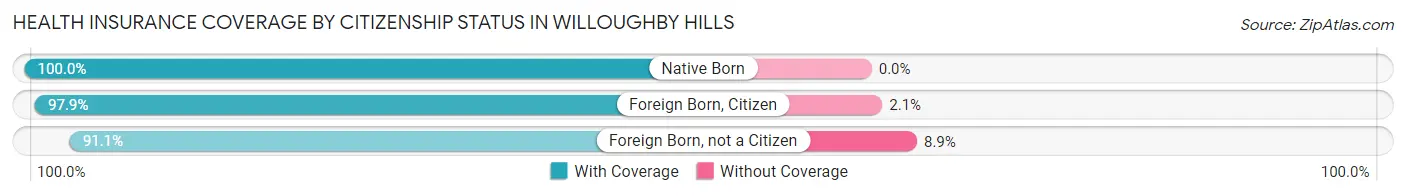
| Citizenship Status | With Coverage | Without Coverage |
| Native Born | 518 (100.0%) | 0 (0.0%) |
| Foreign Born, Citizen | 1,137 (97.9%) | 24 (2.1%) |
| Foreign Born, not a Citizen | 810 (91.1%) | 79 (8.9%) |
Health Insurance Coverage by Household Income in Willoughby Hills
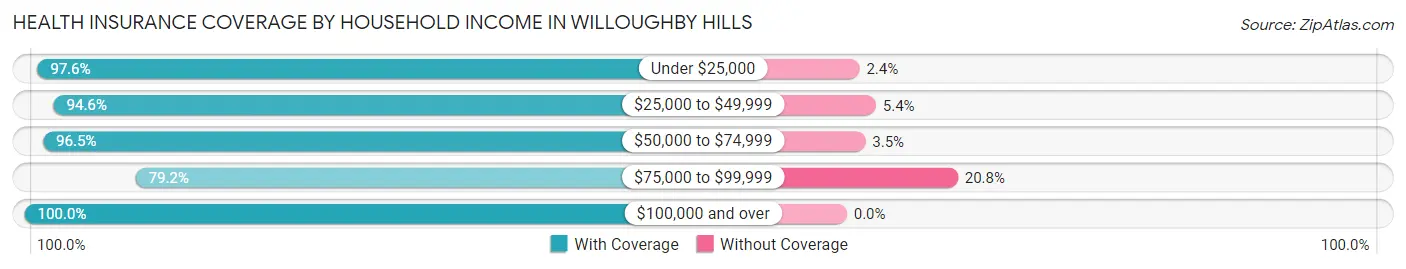
| Household Income | With Coverage | Without Coverage |
| Under $25,000 | 696 (97.6%) | 17 (2.4%) |
| $25,000 to $49,999 | 2,381 (94.6%) | 137 (5.4%) |
| $50,000 to $74,999 | 1,137 (96.5%) | 41 (3.5%) |
| $75,000 to $99,999 | 933 (79.2%) | 245 (20.8%) |
| $100,000 and over | 4,379 (100.0%) | 0 (0.0%) |
Public vs Private Health Insurance Coverage by Age in Willoughby Hills
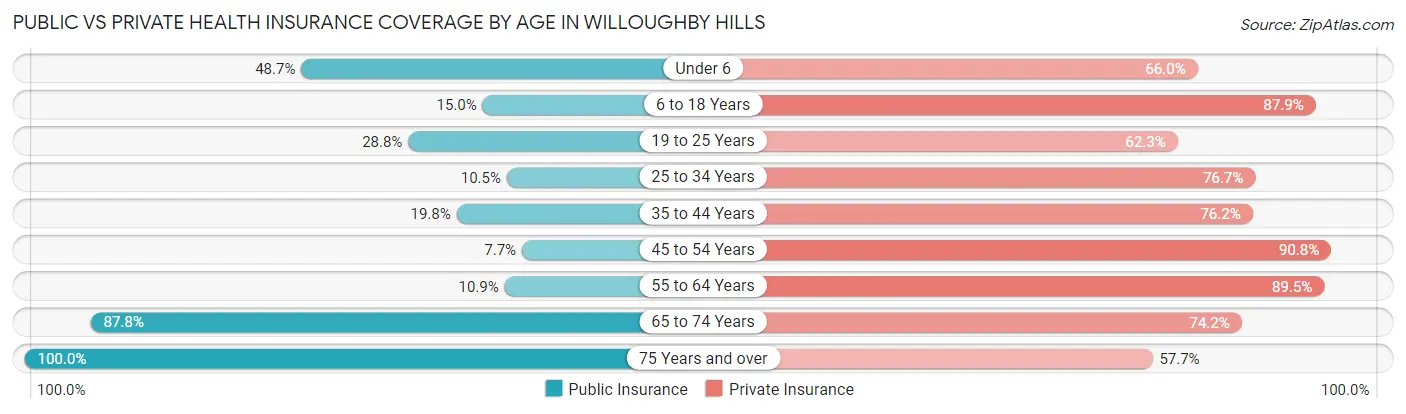
| Age Bracket | Public Insurance | Private Insurance |
| Under 6 | 252 (48.6%) | 342 (66.0%) |
| 6 to 18 Years | 174 (15.0%) | 1,021 (87.9%) |
| 19 to 25 Years | 256 (28.8%) | 554 (62.3%) |
| 25 to 34 Years | 167 (10.5%) | 1,220 (76.7%) |
| 35 to 44 Years | 285 (19.8%) | 1,096 (76.2%) |
| 45 to 54 Years | 72 (7.7%) | 850 (90.8%) |
| 55 to 64 Years | 173 (10.9%) | 1,420 (89.5%) |
| 65 to 74 Years | 867 (87.7%) | 733 (74.2%) |
| 75 Years and over | 862 (100.0%) | 497 (57.7%) |
| Total | 3,108 (31.2%) | 7,733 (77.6%) |
Disability Status by Sex by Age in Willoughby Hills
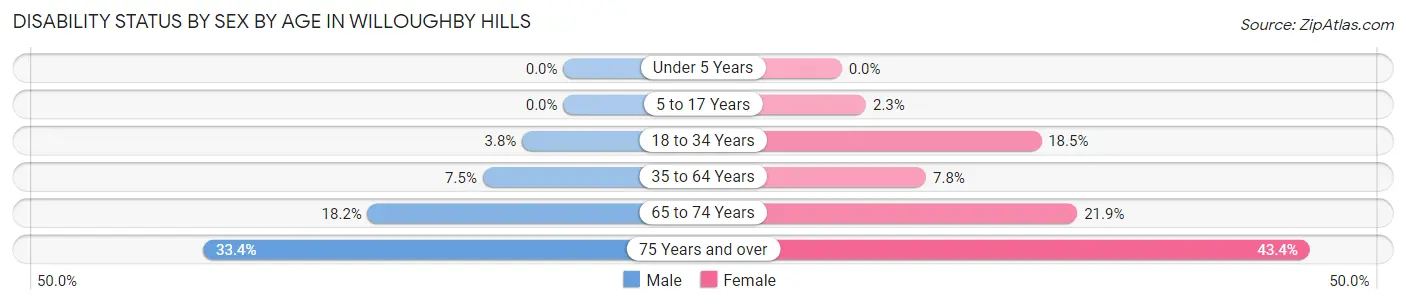
| Age Bracket | Male | Female |
| Under 5 Years | 0 (0.0%) | 0 (0.0%) |
| 5 to 17 Years | 0 (0.0%) | 14 (2.2%) |
| 18 to 34 Years | 40 (3.8%) | 265 (18.5%) |
| 35 to 64 Years | 148 (7.5%) | 155 (7.8%) |
| 65 to 74 Years | 83 (18.2%) | 116 (21.8%) |
| 75 Years and over | 118 (33.4%) | 221 (43.4%) |
Disability Class by Sex by Age in Willoughby Hills
Disability Class: Hearing Difficulty
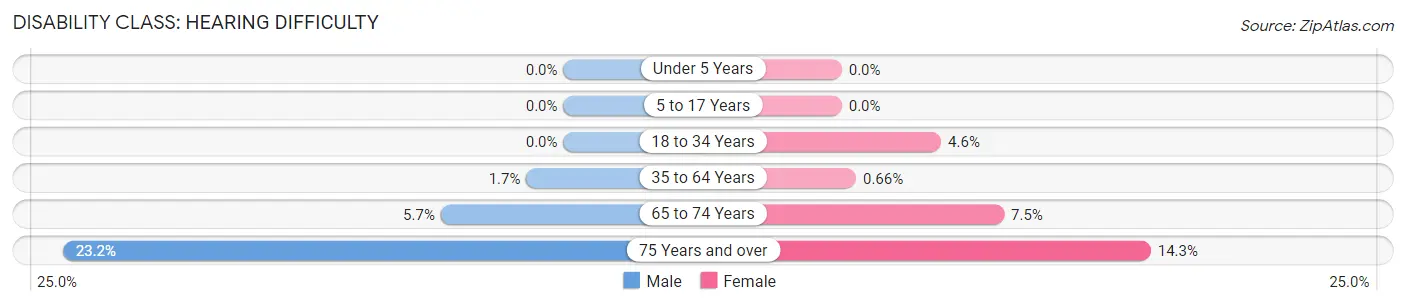
| Age Bracket | Male | Female |
| Under 5 Years | 0 (0.0%) | 0 (0.0%) |
| 5 to 17 Years | 0 (0.0%) | 0 (0.0%) |
| 18 to 34 Years | 0 (0.0%) | 66 (4.6%) |
| 35 to 64 Years | 34 (1.7%) | 13 (0.7%) |
| 65 to 74 Years | 26 (5.7%) | 40 (7.5%) |
| 75 Years and over | 82 (23.2%) | 73 (14.3%) |
Disability Class: Vision Difficulty
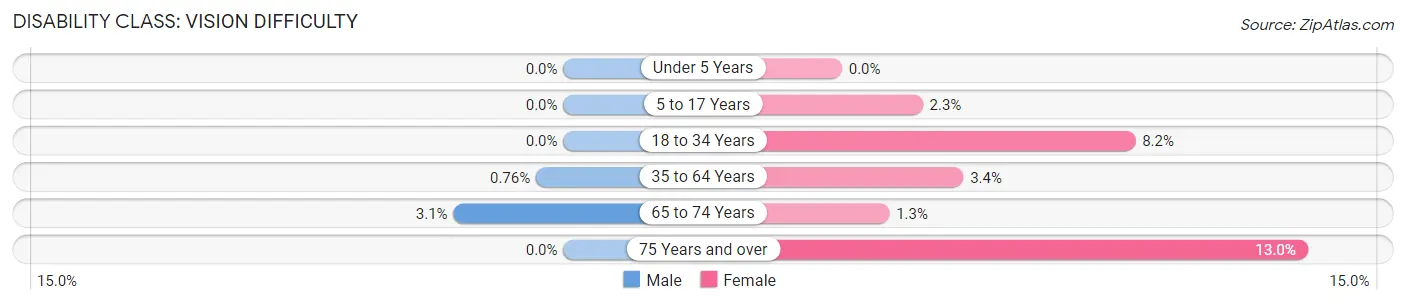
| Age Bracket | Male | Female |
| Under 5 Years | 0 (0.0%) | 0 (0.0%) |
| 5 to 17 Years | 0 (0.0%) | 14 (2.2%) |
| 18 to 34 Years | 0 (0.0%) | 117 (8.2%) |
| 35 to 64 Years | 15 (0.8%) | 67 (3.4%) |
| 65 to 74 Years | 14 (3.1%) | 7 (1.3%) |
| 75 Years and over | 0 (0.0%) | 66 (13.0%) |
Disability Class: Cognitive Difficulty
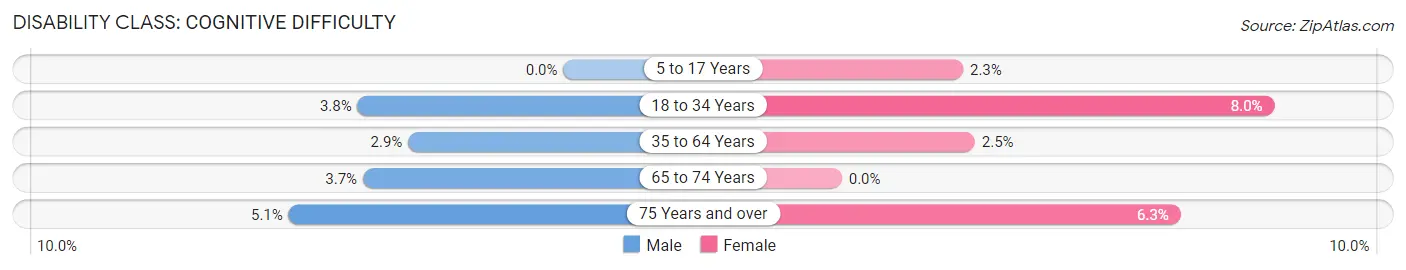
| Age Bracket | Male | Female |
| 5 to 17 Years | 0 (0.0%) | 14 (2.2%) |
| 18 to 34 Years | 40 (3.8%) | 115 (8.0%) |
| 35 to 64 Years | 57 (2.9%) | 49 (2.5%) |
| 65 to 74 Years | 17 (3.7%) | 0 (0.0%) |
| 75 Years and over | 18 (5.1%) | 32 (6.3%) |
Disability Class: Ambulatory Difficulty
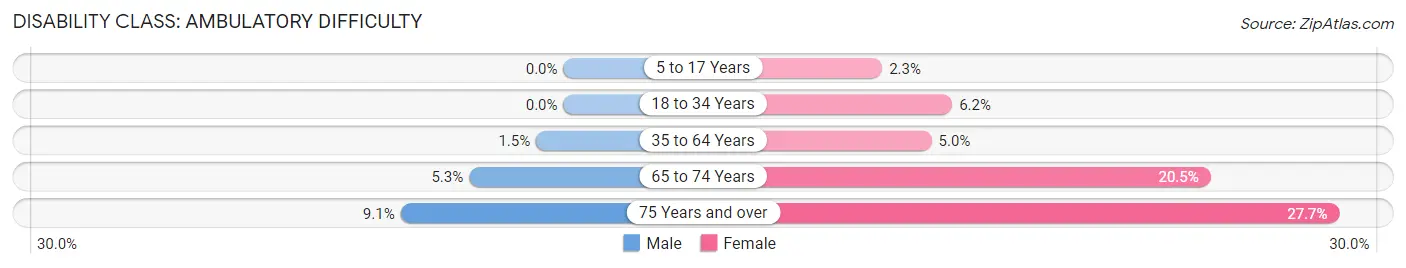
| Age Bracket | Male | Female |
| 5 to 17 Years | 0 (0.0%) | 14 (2.2%) |
| 18 to 34 Years | 0 (0.0%) | 88 (6.1%) |
| 35 to 64 Years | 30 (1.5%) | 99 (5.0%) |
| 65 to 74 Years | 24 (5.2%) | 109 (20.5%) |
| 75 Years and over | 32 (9.1%) | 141 (27.7%) |
Disability Class: Self-Care Difficulty
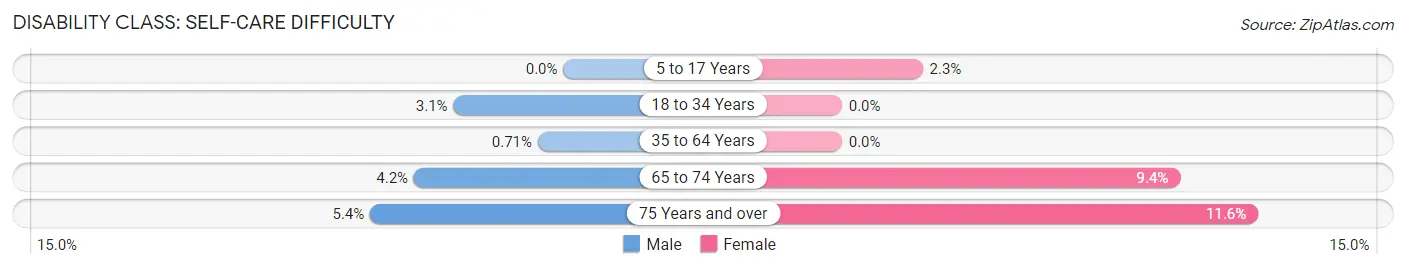
| Age Bracket | Male | Female |
| 5 to 17 Years | 0 (0.0%) | 14 (2.2%) |
| 18 to 34 Years | 32 (3.1%) | 0 (0.0%) |
| 35 to 64 Years | 14 (0.7%) | 0 (0.0%) |
| 65 to 74 Years | 19 (4.2%) | 50 (9.4%) |
| 75 Years and over | 19 (5.4%) | 59 (11.6%) |
Technology Access in Willoughby Hills
Computing Device Access in Willoughby Hills
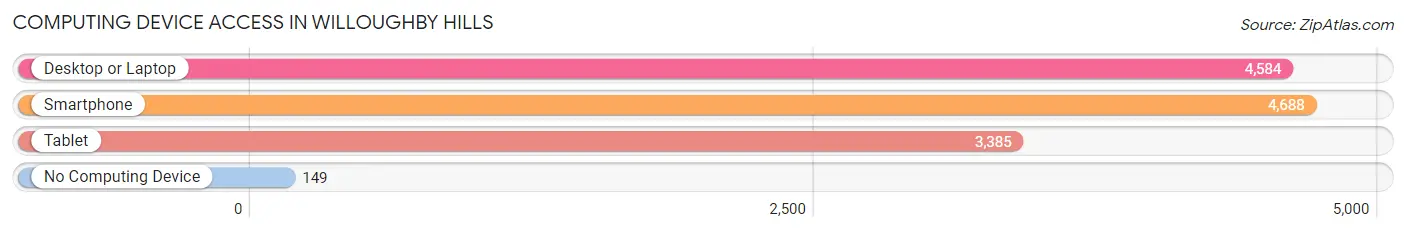
| Device Type | # Households | % Households |
| Desktop or Laptop | 4,584 | 88.6% |
| Smartphone | 4,688 | 90.6% |
| Tablet | 3,385 | 65.4% |
| No Computing Device | 149 | 2.9% |
| Total | 5,176 | 100.0% |
Internet Access in Willoughby Hills
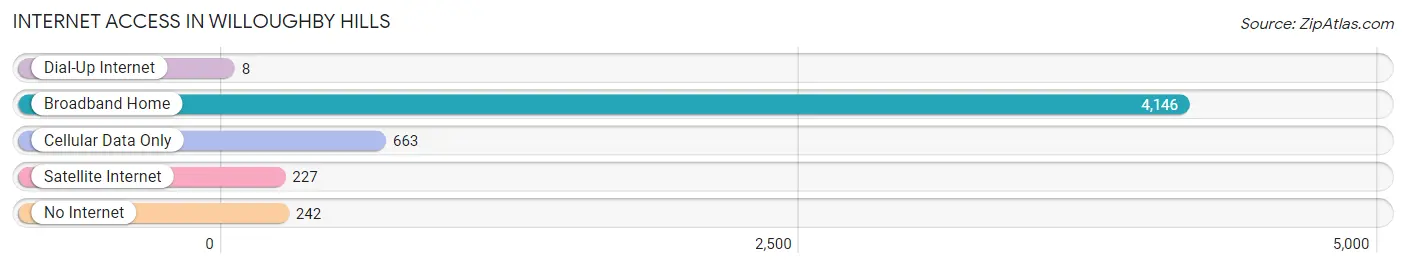
| Internet Type | # Households | % Households |
| Dial-Up Internet | 8 | 0.2% |
| Broadband Home | 4,146 | 80.1% |
| Cellular Data Only | 663 | 12.8% |
| Satellite Internet | 227 | 4.4% |
| No Internet | 242 | 4.7% |
| Total | 5,176 | 100.0% |
Willoughby Hills Summary
Willoughby Hills is a city located in Lake County, Ohio, United States. It is a suburb of Cleveland and is located approximately 20 miles east of the city. The population was 8,246 at the 2010 census.
History
Willoughby Hills was first settled in 1815 by a group of settlers from Connecticut. The area was originally known as Chagrin Township, and was later renamed Willoughby Township in 1820. The township was named after the nearby city of Willoughby, which was named after a British poet, William Willoughby.
In the late 19th century, the area began to develop as a residential suburb of Cleveland. The first post office was established in 1887, and the first school was built in 1895. The city was officially incorporated in 1951.
Geography
Willoughby Hills is located at 41°35'17" North, 81°25'45" West (41.588, -81.429). According to the United States Census Bureau, the city has a total area of 8.2 square miles, of which 8.1 square miles is land and 0.1 square miles is water.
Economy
Willoughby Hills is home to a variety of businesses, including retail stores, restaurants, and professional services. The city is also home to a number of corporate headquarters, including the headquarters of the Cleveland Clinic, the Cleveland Clinic Foundation, and the Cleveland Clinic Health System.
Demographics
As of the census of 2010, there were 8,246 people, 3,541 households, and 2,521 families residing in the city. The population density was 1,015.3 people per square mile. The racial makeup of the city was 92.2% White, 3.2% African American, 0.3% Native American, 1.7% Asian, 0.1% Pacific Islander, 0.7% from other races, and 2.0% from two or more races. Hispanic or Latino of any race were 2.7% of the population.
The median income for a household in the city was $63,945, and the median income for a family was $76,945. The per capita income for the city was $31,945. About 3.2% of families and 4.3% of the population were below the poverty line, including 5.2% of those under age 18 and 4.2% of those age 65 or over.
Common Questions
What is Per Capita Income in Willoughby Hills?
Per Capita income in Willoughby Hills is $48,153.
What is the Median Family Income in Willoughby Hills?
Median Family Income in Willoughby Hills is $96,571.
What is the Median Household income in Willoughby Hills?
Median Household Income in Willoughby Hills is $63,438.
What is Income or Wage Gap in Willoughby Hills?
Income or Wage Gap in Willoughby Hills is 35.7%.
Women in Willoughby Hills earn 64.3 cents for every dollar earned by a man.
What is Inequality or Gini Index in Willoughby Hills?
Inequality or Gini Index in Willoughby Hills is 0.45.
What is the Total Population of Willoughby Hills?
Total Population of Willoughby Hills is 9,972.
What is the Total Male Population of Willoughby Hills?
Total Male Population of Willoughby Hills is 4,664.
What is the Total Female Population of Willoughby Hills?
Total Female Population of Willoughby Hills is 5,308.
What is the Ratio of Males per 100 Females in Willoughby Hills?
There are 87.87 Males per 100 Females in Willoughby Hills.
What is the Ratio of Females per 100 Males in Willoughby Hills?
There are 113.81 Females per 100 Males in Willoughby Hills.
What is the Median Population Age in Willoughby Hills?
Median Population Age in Willoughby Hills is 38.6 Years.
What is the Average Family Size in Willoughby Hills
Average Family Size in Willoughby Hills is 2.5 People.
What is the Average Household Size in Willoughby Hills
Average Household Size in Willoughby Hills is 1.9 People.
How Large is the Labor Force in Willoughby Hills?
There are 6,212 People in the Labor Forcein in Willoughby Hills.
What is the Percentage of People in the Labor Force in Willoughby Hills?
73.1% of People are in the Labor Force in Willoughby Hills.
What is the Unemployment Rate in Willoughby Hills?
Unemployment Rate in Willoughby Hills is 6.4%.