Lakeside, OH Map & Demographics
Lakeside Map
Lakeside Overview
$78,443
PER CAPITA INCOME
$98,676
AVG FAMILY INCOME
$84,417
AVG HOUSEHOLD INCOME
52.0%
WAGE / INCOME GAP [ % ]
48.0¢/ $1
WAGE / INCOME GAP [ $ ]
0.54
INEQUALITY / GINI INDEX
588
TOTAL POPULATION
298
MALE POPULATION
290
FEMALE POPULATION
102.76
MALES / 100 FEMALES
97.32
FEMALES / 100 MALES
69.4
MEDIAN AGE
2.2
AVG FAMILY SIZE
1.8
AVG HOUSEHOLD SIZE
140
LABOR FORCE [ PEOPLE ]
25.0%
PERCENT IN LABOR FORCE
5.0%
UNEMPLOYMENT RATE
Income in Lakeside
Income Overview in Lakeside
Per Capita Income in Lakeside is $78,443, while median incomes of families and households are $98,676 and $84,417 respectively.
| Characteristic | Number | Measure |
| Per Capita Income | 588 | $78,443 |
| Median Family Income | 186 | $98,676 |
| Mean Family Income | 186 | $160,351 |
| Median Household Income | 314 | $84,417 |
| Mean Household Income | 314 | $152,090 |
| Income Deficit | 186 | $0 |
| Wage / Income Gap (%) | 588 | 51.96% |
| Wage / Income Gap ($) | 588 | 48.04¢ per $1 |
| Gini / Inequality Index | 588 | 0.54 |
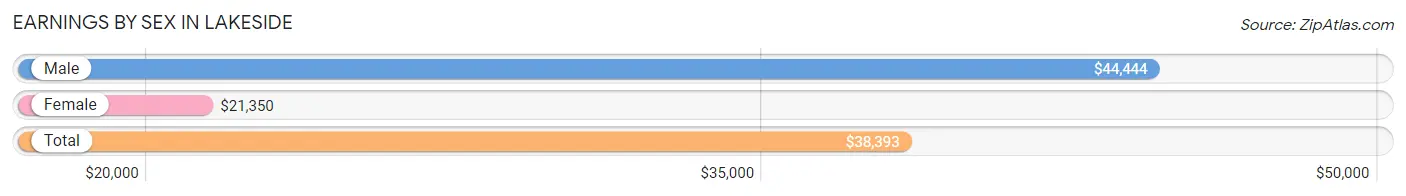
Earnings by Sex in Lakeside
Average Earnings in Lakeside are $38,393, $44,444 for men and $21,350 for women, a difference of 52.0%.
| Sex | Number | Average Earnings |
| Male | 118 (61.8%) | $44,444 |
| Female | 73 (38.2%) | $21,350 |
| Total | 191 (100.0%) | $38,393 |
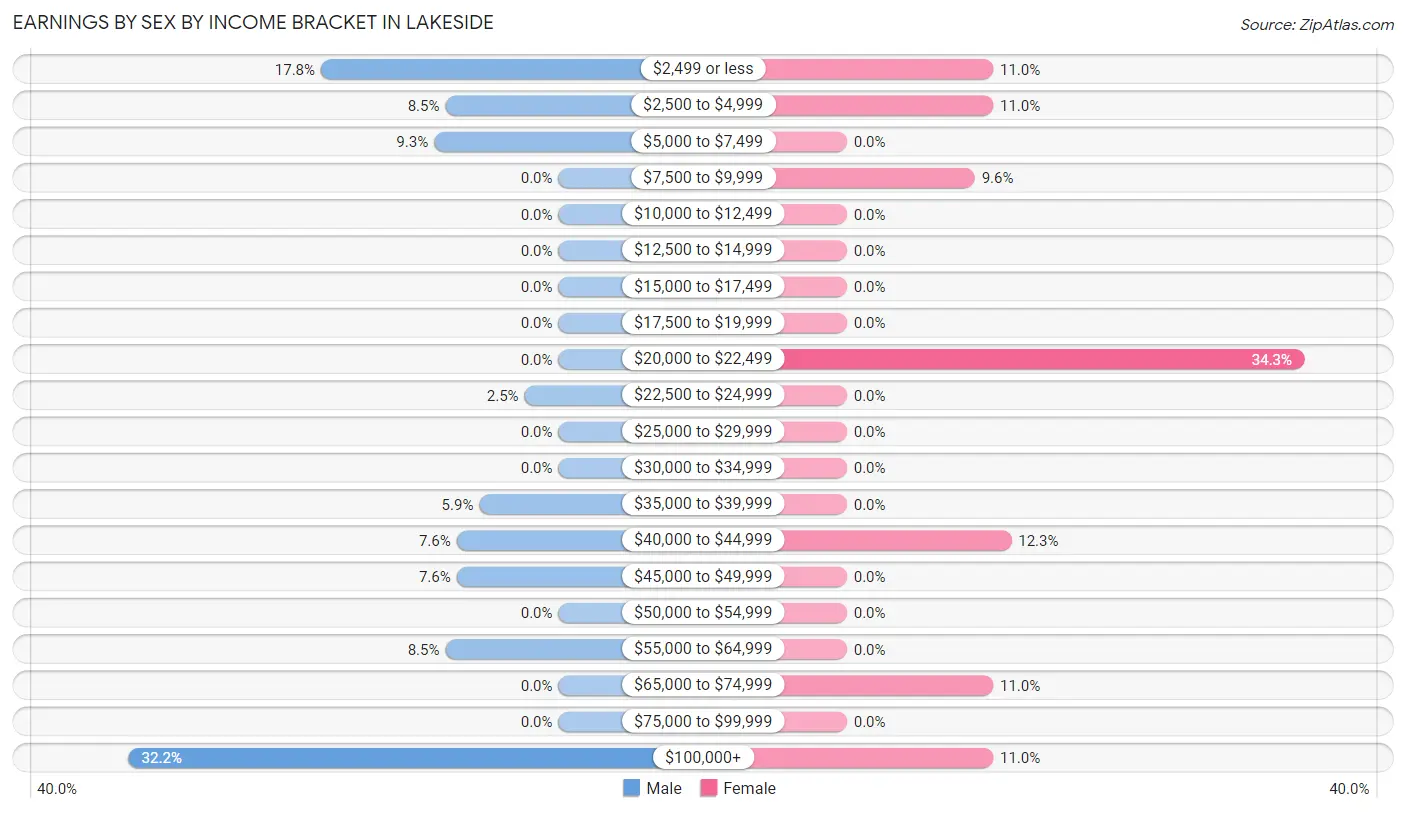
Earnings by Sex by Income Bracket in Lakeside
The most common earnings brackets in Lakeside are $100,000+ for men (38 | 32.2%) and $20,000 to $22,499 for women (25 | 34.3%).
| Income | Male | Female |
| $2,499 or less | 21 (17.8%) | 8 (11.0%) |
| $2,500 to $4,999 | 10 (8.5%) | 8 (11.0%) |
| $5,000 to $7,499 | 11 (9.3%) | 0 (0.0%) |
| $7,500 to $9,999 | 0 (0.0%) | 7 (9.6%) |
| $10,000 to $12,499 | 0 (0.0%) | 0 (0.0%) |
| $12,500 to $14,999 | 0 (0.0%) | 0 (0.0%) |
| $15,000 to $17,499 | 0 (0.0%) | 0 (0.0%) |
| $17,500 to $19,999 | 0 (0.0%) | 0 (0.0%) |
| $20,000 to $22,499 | 0 (0.0%) | 25 (34.3%) |
| $22,500 to $24,999 | 3 (2.5%) | 0 (0.0%) |
| $25,000 to $29,999 | 0 (0.0%) | 0 (0.0%) |
| $30,000 to $34,999 | 0 (0.0%) | 0 (0.0%) |
| $35,000 to $39,999 | 7 (5.9%) | 0 (0.0%) |
| $40,000 to $44,999 | 9 (7.6%) | 9 (12.3%) |
| $45,000 to $49,999 | 9 (7.6%) | 0 (0.0%) |
| $50,000 to $54,999 | 0 (0.0%) | 0 (0.0%) |
| $55,000 to $64,999 | 10 (8.5%) | 0 (0.0%) |
| $65,000 to $74,999 | 0 (0.0%) | 8 (11.0%) |
| $75,000 to $99,999 | 0 (0.0%) | 0 (0.0%) |
| $100,000+ | 38 (32.2%) | 8 (11.0%) |
| Total | 118 (100.0%) | 73 (100.0%) |
Earnings by Sex by Educational Attainment in Lakeside
| Educational Attainment | Male Income | Female Income |
| Less than High School | - | - |
| High School Diploma | - | - |
| College or Associate's Degree | - | - |
| Bachelor's Degree | - | - |
| Graduate Degree | - | - |
| Total | $44,444 | $21,350 |
Family Income in Lakeside
Family Income Brackets in Lakeside
According to the Lakeside family income data, there are 85 families falling into the $75,000 to $99,999 income range, which is the most common income bracket and makes up 45.7% of all families.
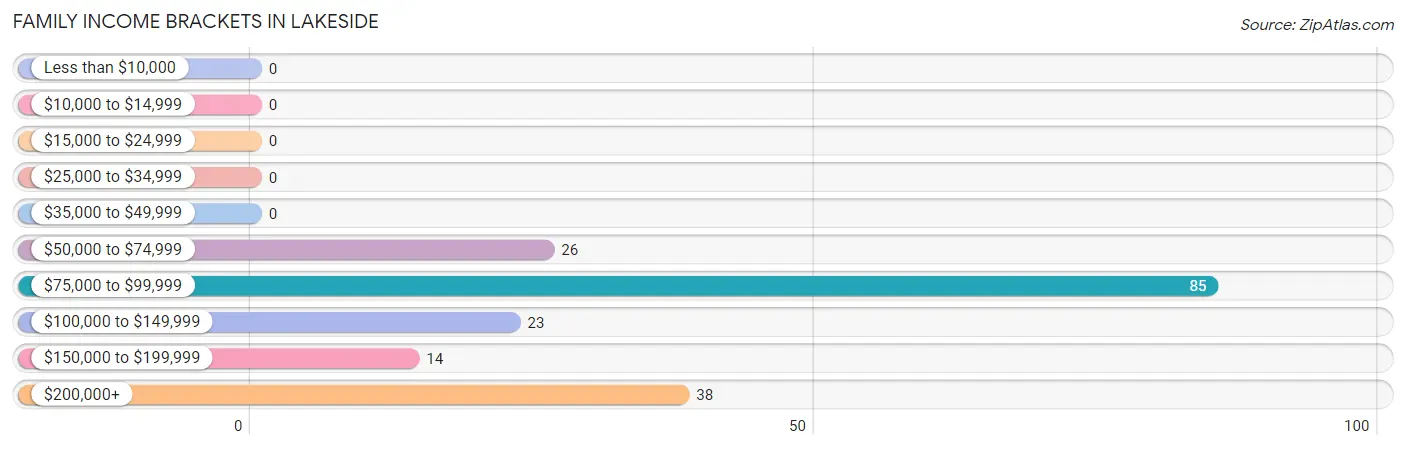
| Income Bracket | # Families | % Families |
| Less than $10,000 | 0 | 0.0% |
| $10,000 to $14,999 | 0 | 0.0% |
| $15,000 to $24,999 | 0 | 0.0% |
| $25,000 to $34,999 | 0 | 0.0% |
| $35,000 to $49,999 | 0 | 0.0% |
| $50,000 to $74,999 | 26 | 14.0% |
| $75,000 to $99,999 | 85 | 45.7% |
| $100,000 to $149,999 | 23 | 12.4% |
| $150,000 to $199,999 | 14 | 7.5% |
| $200,000+ | 38 | 20.4% |
Family Income by Famaliy Size in Lakeside
2-person families (139 | 74.7%) account for the highest median family income in Lakeside with $84,958 per family, while 2-person families (139 | 74.7%) have the highest median income of $42,479 per family member.
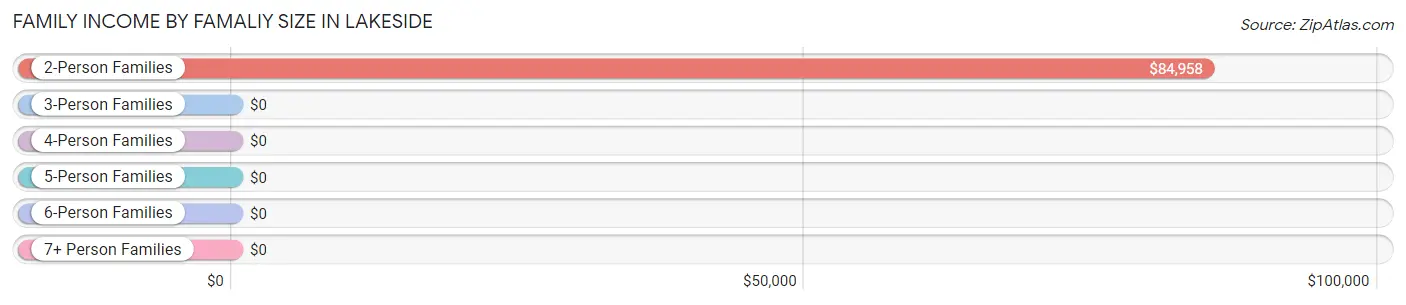
| Income Bracket | # Families | Median Income |
| 2-Person Families | 139 (74.7%) | $84,958 |
| 3-Person Families | 5 (2.7%) | $0 |
| 4-Person Families | 42 (22.6%) | $0 |
| 5-Person Families | 0 (0.0%) | $0 |
| 6-Person Families | 0 (0.0%) | $0 |
| 7+ Person Families | 0 (0.0%) | $0 |
| Total | 186 (100.0%) | $98,676 |
Family Income by Number of Earners in Lakeside
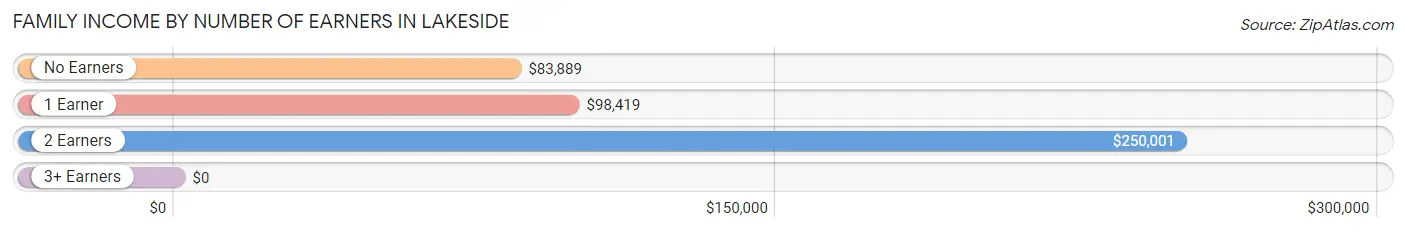
| Number of Earners | # Families | Median Income |
| No Earners | 76 (40.9%) | $83,889 |
| 1 Earner | 81 (43.5%) | $98,419 |
| 2 Earners | 29 (15.6%) | $250,001 |
| 3+ Earners | 0 (0.0%) | $0 |
| Total | 186 (100.0%) | $98,676 |
Household Income in Lakeside
Household Income Brackets in Lakeside
With 94 households falling in the category, the $75,000 to $99,999 income range is the most frequent in Lakeside, accounting for 29.9% of all households.
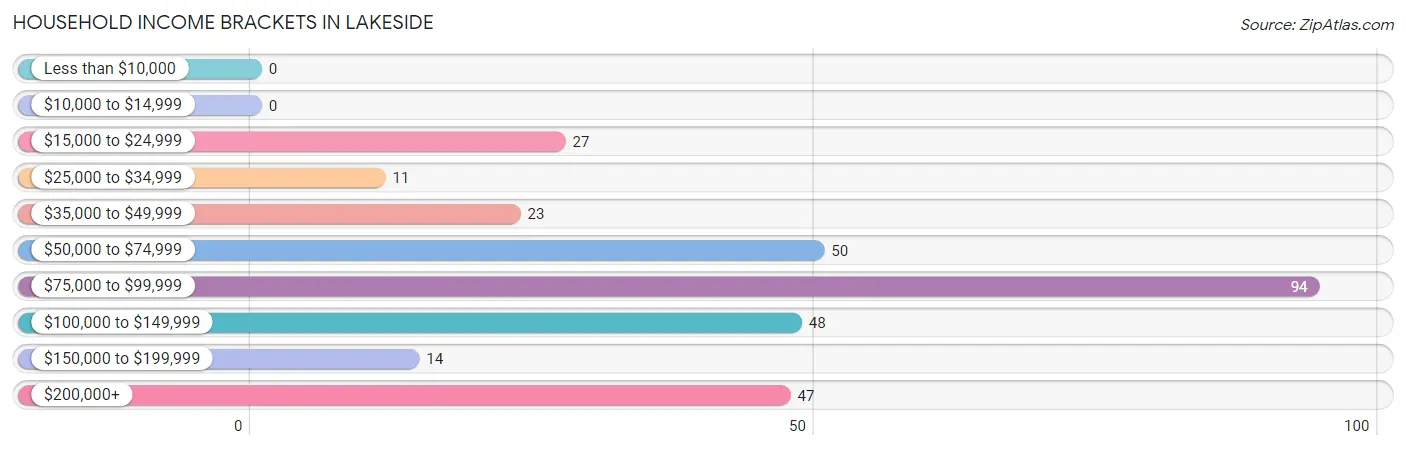
| Income Bracket | # Households | % Households |
| Less than $10,000 | 0 | 0.0% |
| $10,000 to $14,999 | 0 | 0.0% |
| $15,000 to $24,999 | 27 | 8.6% |
| $25,000 to $34,999 | 11 | 3.5% |
| $35,000 to $49,999 | 23 | 7.3% |
| $50,000 to $74,999 | 50 | 15.9% |
| $75,000 to $99,999 | 94 | 29.9% |
| $100,000 to $149,999 | 48 | 15.3% |
| $150,000 to $199,999 | 14 | 4.5% |
| $200,000+ | 47 | 15.0% |
Household Income by Householder Age in Lakeside
The median household income in Lakeside is $84,417, with the highest median household income of $83,417 found in the 65+ years age bracket for the primary householder. A total of 232 households (73.9%) fall into this category.
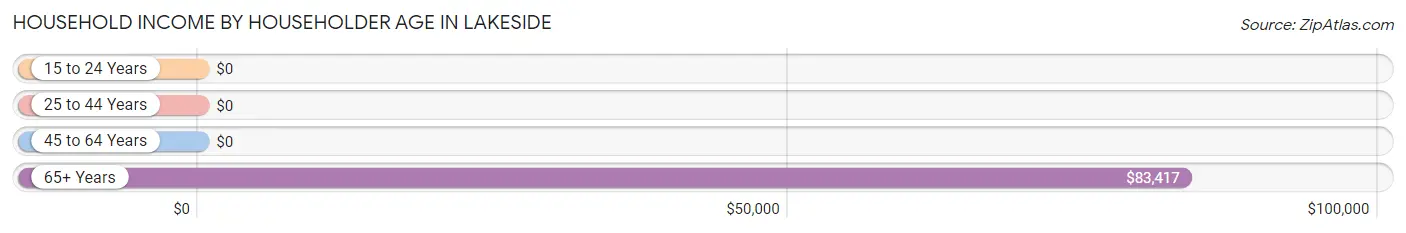
| Income Bracket | # Households | Median Income |
| 15 to 24 Years | 0 (0.0%) | $0 |
| 25 to 44 Years | 28 (8.9%) | $0 |
| 45 to 64 Years | 54 (17.2%) | $0 |
| 65+ Years | 232 (73.9%) | $83,417 |
| Total | 314 (100.0%) | $84,417 |
Poverty in Lakeside
Income Below Poverty by Sex and Age in Lakeside
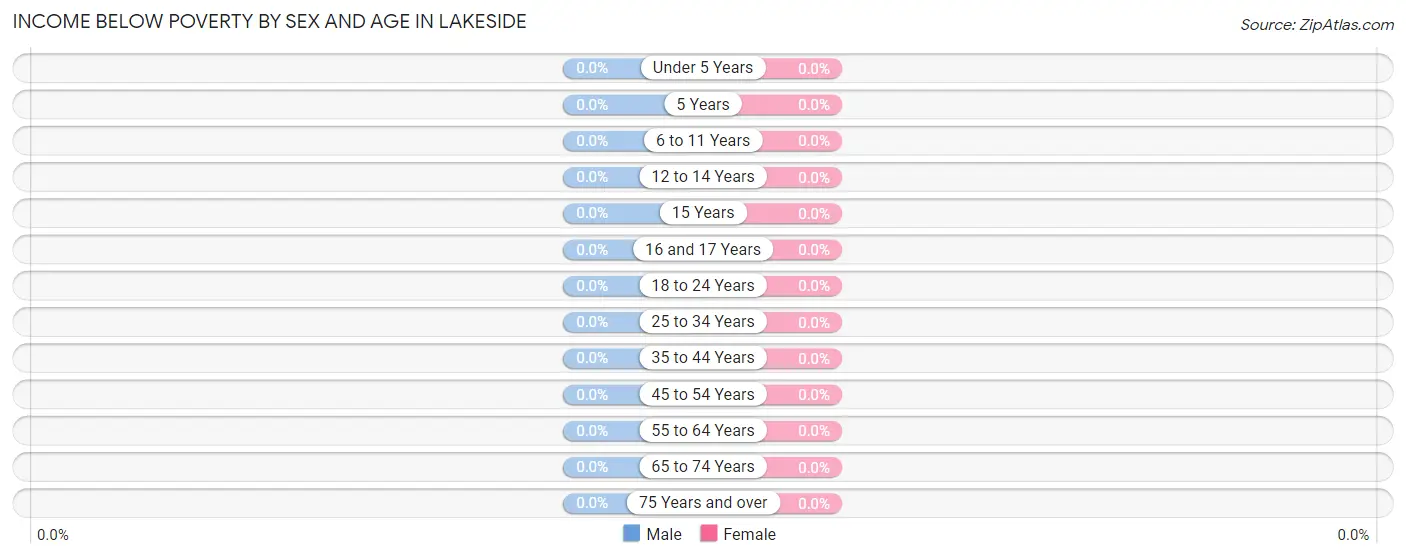
| Age Bracket | Male | Female |
| Under 5 Years | 0 (0.0%) | 0 (0.0%) |
| 5 Years | 0 (0.0%) | 0 (0.0%) |
| 6 to 11 Years | 0 (0.0%) | 0 (0.0%) |
| 12 to 14 Years | 0 (0.0%) | 0 (0.0%) |
| 15 Years | 0 (0.0%) | 0 (0.0%) |
| 16 and 17 Years | 0 (0.0%) | 0 (0.0%) |
| 18 to 24 Years | 0 (0.0%) | 0 (0.0%) |
| 25 to 34 Years | 0 (0.0%) | 0 (0.0%) |
| 35 to 44 Years | 0 (0.0%) | 0 (0.0%) |
| 45 to 54 Years | 0 (0.0%) | 0 (0.0%) |
| 55 to 64 Years | 0 (0.0%) | 0 (0.0%) |
| 65 to 74 Years | 0 (0.0%) | 0 (0.0%) |
| 75 Years and over | 0 (0.0%) | 0 (0.0%) |
| Total | 0 (0.0%) | 0 (0.0%) |
Income Above Poverty by Sex and Age in Lakeside
According to the poverty statistics in Lakeside, males aged 25 to 34 years and females aged under 5 years are the age groups that are most secure financially, with 100.0% of males and 100.0% of females in these age groups living above the poverty line.
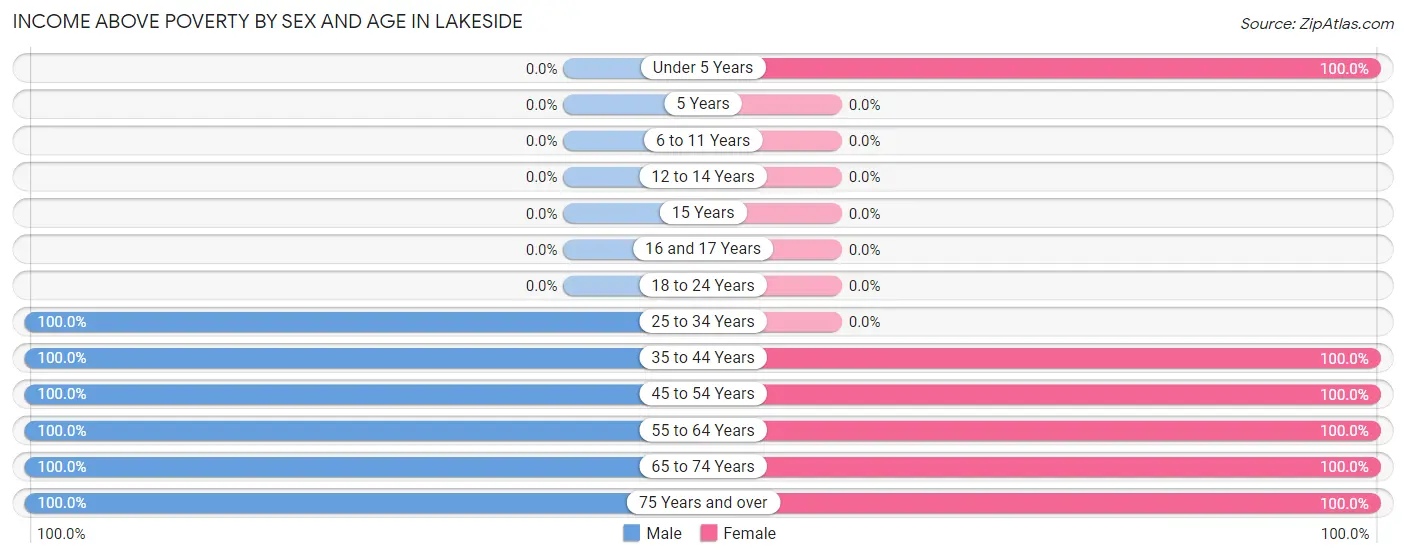
| Age Bracket | Male | Female |
| Under 5 Years | 0 (0.0%) | 16 (100.0%) |
| 5 Years | 0 (0.0%) | 0 (0.0%) |
| 6 to 11 Years | 0 (0.0%) | 0 (0.0%) |
| 12 to 14 Years | 0 (0.0%) | 0 (0.0%) |
| 15 Years | 0 (0.0%) | 0 (0.0%) |
| 16 and 17 Years | 0 (0.0%) | 0 (0.0%) |
| 18 to 24 Years | 0 (0.0%) | 0 (0.0%) |
| 25 to 34 Years | 27 (100.0%) | 0 (0.0%) |
| 35 to 44 Years | 35 (100.0%) | 8 (100.0%) |
| 45 to 54 Years | 7 (100.0%) | 33 (100.0%) |
| 55 to 64 Years | 38 (100.0%) | 64 (100.0%) |
| 65 to 74 Years | 115 (100.0%) | 104 (100.0%) |
| 75 Years and over | 62 (100.0%) | 45 (100.0%) |
| Total | 284 (100.0%) | 270 (100.0%) |
Income Below Poverty Among Married-Couple Families in Lakeside
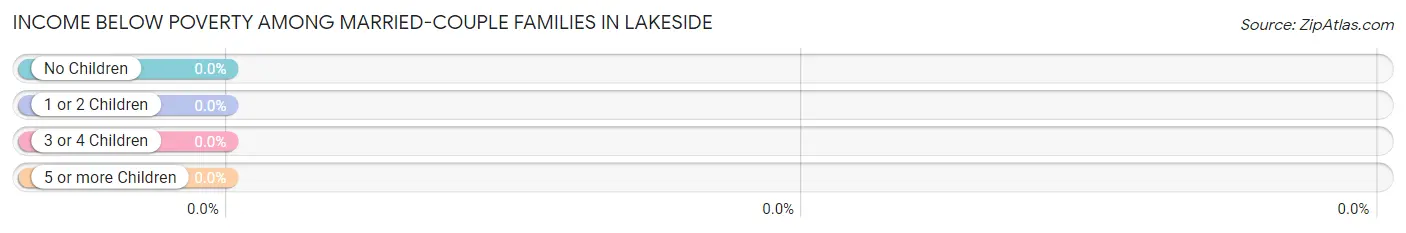
| Children | Above Poverty | Below Poverty |
| No Children | 171 (100.0%) | 0 (0.0%) |
| 1 or 2 Children | 8 (100.0%) | 0 (0.0%) |
| 3 or 4 Children | 0 (0.0%) | 0 (0.0%) |
| 5 or more Children | 0 (0.0%) | 0 (0.0%) |
| Total | 179 (100.0%) | 0 (0.0%) |
Income Below Poverty Among Single-Parent Households in Lakeside
| Children | Single Father | Single Mother |
| No Children | 0 (0.0%) | 0 (0.0%) |
| 1 or 2 Children | 0 (0.0%) | 0 (0.0%) |
| 3 or 4 Children | 0 (0.0%) | 0 (0.0%) |
| 5 or more Children | 0 (0.0%) | 0 (0.0%) |
| Total | 0 (0.0%) | 0 (0.0%) |
Income Below Poverty Among Married-Couple vs Single-Parent Households in Lakeside
| Children | Married-Couple Families | Single-Parent Households |
| No Children | 0 (0.0%) | 0 (0.0%) |
| 1 or 2 Children | 0 (0.0%) | 0 (0.0%) |
| 3 or 4 Children | 0 (0.0%) | 0 (0.0%) |
| 5 or more Children | 0 (0.0%) | 0 (0.0%) |
| Total | 0 (0.0%) | 0 (0.0%) |
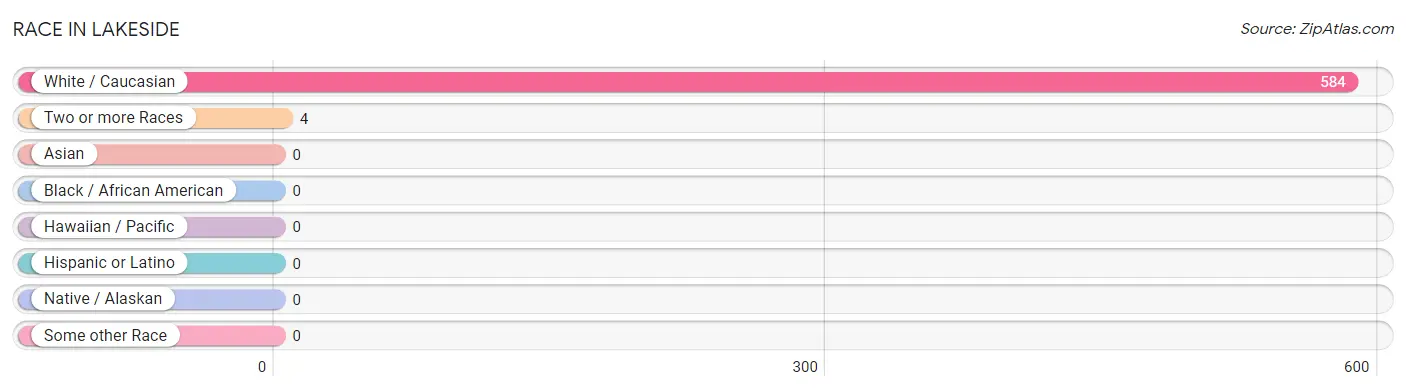
Race in Lakeside
The most populous races in Lakeside are White / Caucasian (584 | 99.3%), and Two or more Races (4 | 0.7%).
| Race | # Population | % Population |
| Asian | 0 | 0.0% |
| Black / African American | 0 | 0.0% |
| Hawaiian / Pacific | 0 | 0.0% |
| Hispanic or Latino | 0 | 0.0% |
| Native / Alaskan | 0 | 0.0% |
| White / Caucasian | 584 | 99.3% |
| Two or more Races | 4 | 0.7% |
| Some other Race | 0 | 0.0% |
| Total | 588 | 100.0% |
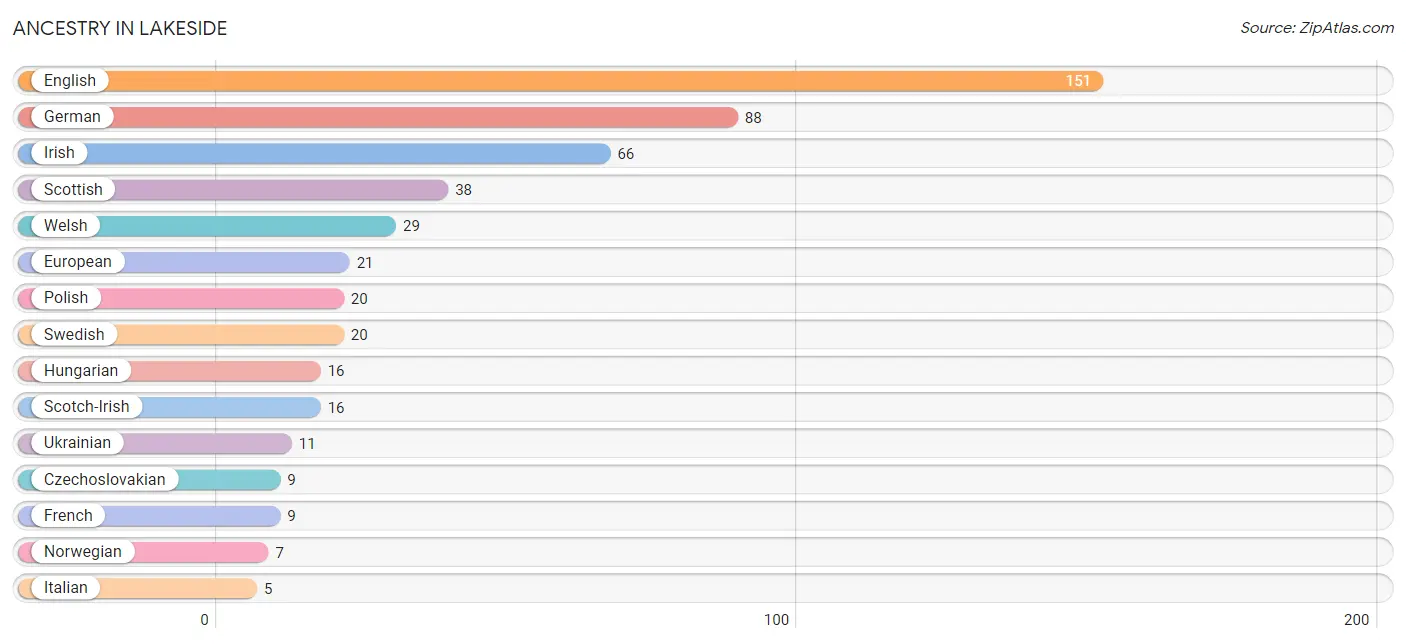
Ancestry in Lakeside
The most populous ancestries reported in Lakeside are English (151 | 25.7%), German (88 | 15.0%), Irish (66 | 11.2%), Scottish (38 | 6.5%), and Welsh (29 | 4.9%), together accounting for 63.3% of all Lakeside residents.
| Ancestry | # Population | % Population |
| Austrian | 1 | 0.2% |
| Czechoslovakian | 9 | 1.5% |
| English | 151 | 25.7% |
| European | 21 | 3.6% |
| French | 9 | 1.5% |
| German | 88 | 15.0% |
| Hungarian | 16 | 2.7% |
| Irish | 66 | 11.2% |
| Italian | 5 | 0.9% |
| Norwegian | 7 | 1.2% |
| Polish | 20 | 3.4% |
| Scotch-Irish | 16 | 2.7% |
| Scottish | 38 | 6.5% |
| Slovak | 4 | 0.7% |
| Swedish | 20 | 3.4% |
| Ukrainian | 11 | 1.9% |
| Welsh | 29 | 4.9% | View All 17 Rows |
Immigrants in Lakeside

| Immigration Origin | # Population | % Population | View All 0 Rows |
Sex and Age in Lakeside
Sex and Age in Lakeside
The most populous age groups in Lakeside are 70 to 74 Years (76 | 25.5%) for men and 70 to 74 Years (63 | 21.7%) for women.
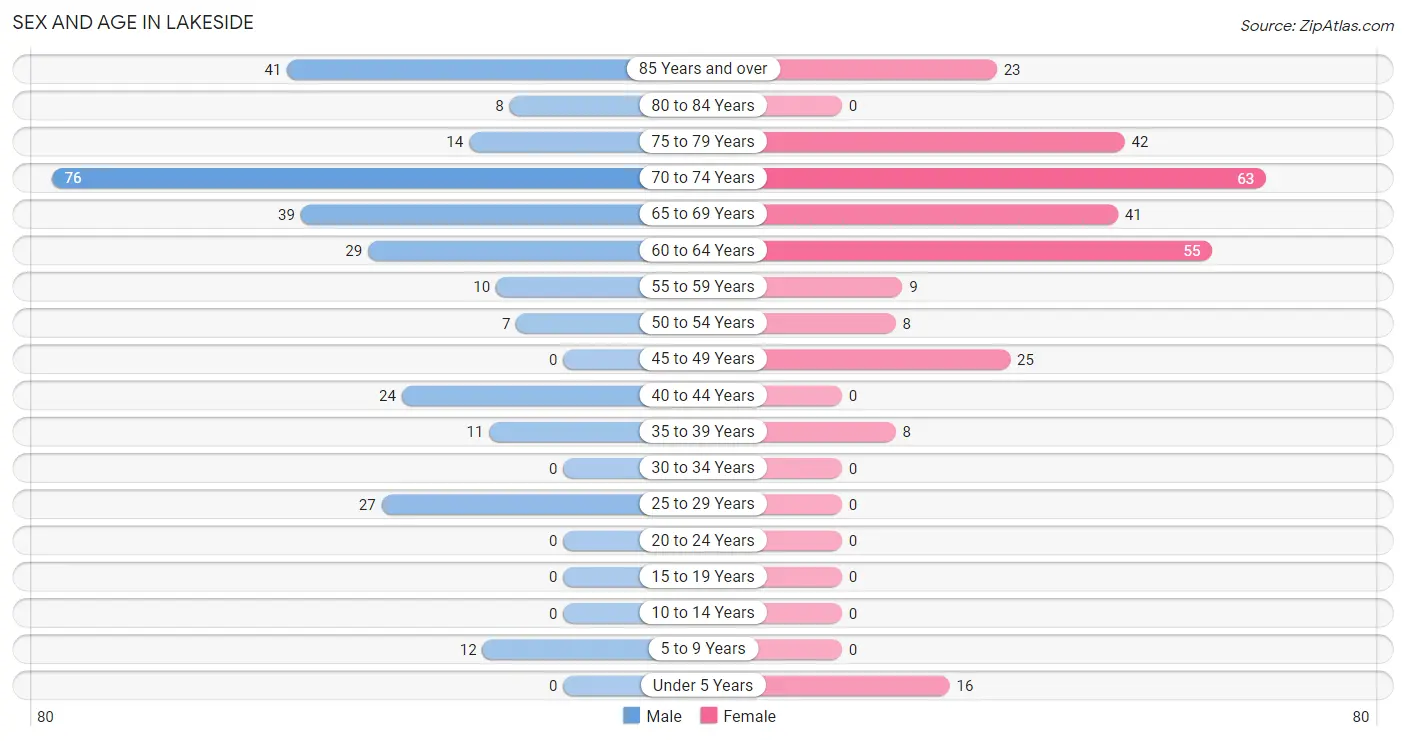
| Age Bracket | Male | Female |
| Under 5 Years | 0 (0.0%) | 16 (5.5%) |
| 5 to 9 Years | 12 (4.0%) | 0 (0.0%) |
| 10 to 14 Years | 0 (0.0%) | 0 (0.0%) |
| 15 to 19 Years | 0 (0.0%) | 0 (0.0%) |
| 20 to 24 Years | 0 (0.0%) | 0 (0.0%) |
| 25 to 29 Years | 27 (9.1%) | 0 (0.0%) |
| 30 to 34 Years | 0 (0.0%) | 0 (0.0%) |
| 35 to 39 Years | 11 (3.7%) | 8 (2.8%) |
| 40 to 44 Years | 24 (8.1%) | 0 (0.0%) |
| 45 to 49 Years | 0 (0.0%) | 25 (8.6%) |
| 50 to 54 Years | 7 (2.4%) | 8 (2.8%) |
| 55 to 59 Years | 10 (3.4%) | 9 (3.1%) |
| 60 to 64 Years | 29 (9.7%) | 55 (19.0%) |
| 65 to 69 Years | 39 (13.1%) | 41 (14.1%) |
| 70 to 74 Years | 76 (25.5%) | 63 (21.7%) |
| 75 to 79 Years | 14 (4.7%) | 42 (14.5%) |
| 80 to 84 Years | 8 (2.7%) | 0 (0.0%) |
| 85 Years and over | 41 (13.8%) | 23 (7.9%) |
| Total | 298 (100.0%) | 290 (100.0%) |
Families and Households in Lakeside
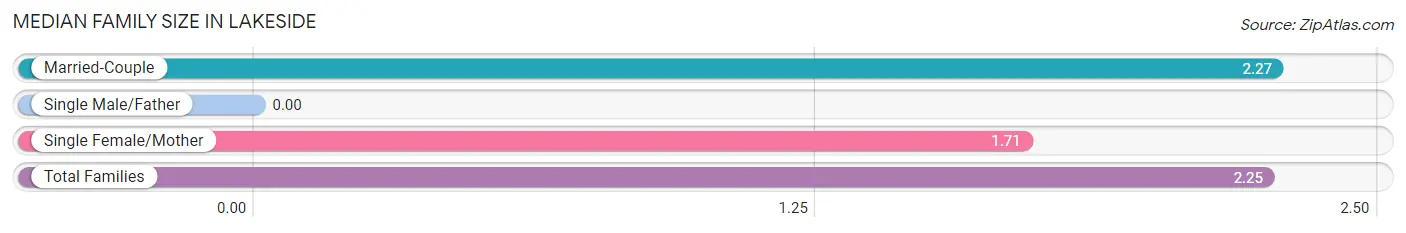
Median Family Size in Lakeside
| Family Type | # Families | Family Size |
| Married-Couple | 179 (96.2%) | 2.27 |
| Single Male/Father | 0 (0.0%) | - |
| Single Female/Mother | 7 (3.8%) | 1.71 |
| Total Families | 186 (100.0%) | 2.25 |
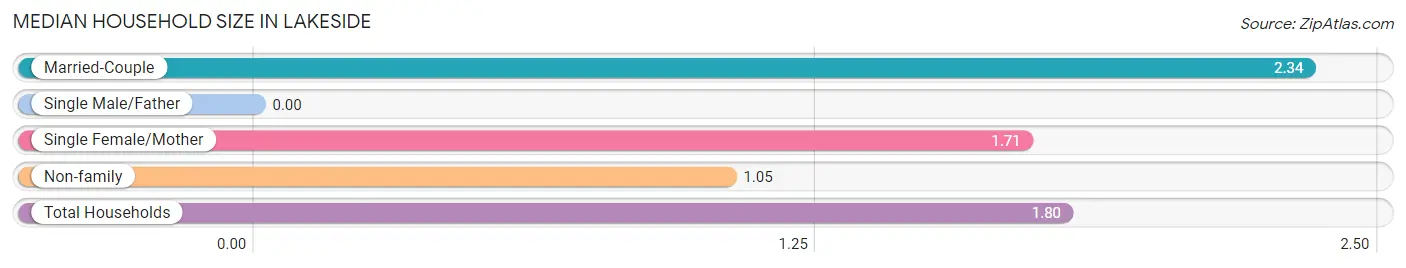
Median Household Size in Lakeside
| Household Type | # Households | Household Size |
| Married-Couple | 179 (57.0%) | 2.34 |
| Single Male/Father | 0 (0.0%) | - |
| Single Female/Mother | 7 (2.2%) | 1.71 |
| Non-family | 128 (40.8%) | 1.05 |
| Total Households | 314 (100.0%) | 1.80 |
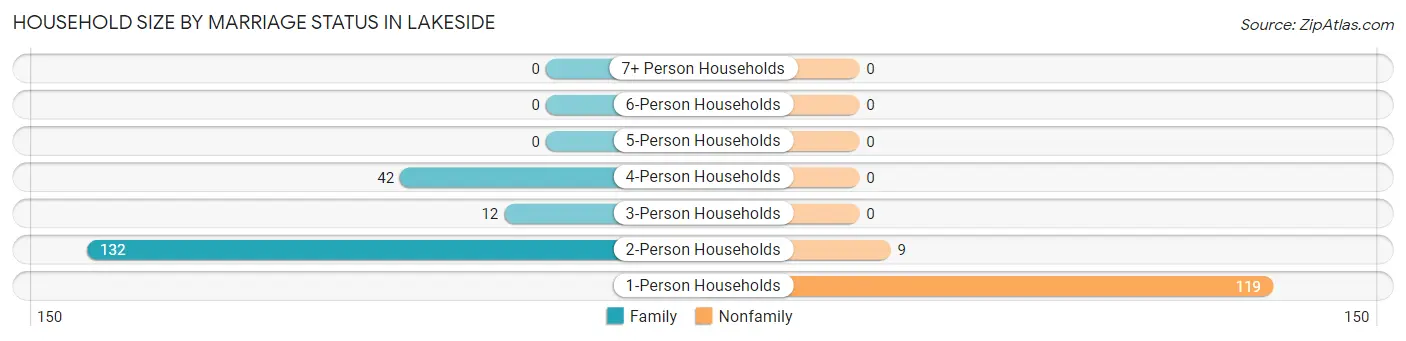
Household Size by Marriage Status in Lakeside
Out of a total of 314 households in Lakeside, 186 (59.2%) are family households, while 128 (40.8%) are nonfamily households. The most numerous type of family households are 2-person households, comprising 132, and the most common type of nonfamily households are 1-person households, comprising 119.
| Household Size | Family Households | Nonfamily Households |
| 1-Person Households | - | 119 (37.9%) |
| 2-Person Households | 132 (42.0%) | 9 (2.9%) |
| 3-Person Households | 12 (3.8%) | 0 (0.0%) |
| 4-Person Households | 42 (13.4%) | 0 (0.0%) |
| 5-Person Households | 0 (0.0%) | 0 (0.0%) |
| 6-Person Households | 0 (0.0%) | 0 (0.0%) |
| 7+ Person Households | 0 (0.0%) | 0 (0.0%) |
| Total | 186 (59.2%) | 128 (40.8%) |
Female Fertility in Lakeside
Fertility by Age in Lakeside
| Age Bracket | Women with Births | Births / 1,000 Women |
| 15 to 19 years | 0 (0.0%) | 0.0 |
| 20 to 34 years | 0 (0.0%) | 0.0 |
| 35 to 50 years | 0 (0.0%) | 0.0 |
| Total | 0 (0.0%) | 0.0 |
Fertility by Age by Marriage Status in Lakeside
| Age Bracket | Married | Unmarried |
| 15 to 19 years | 0 (0.0%) | 0 (0.0%) |
| 20 to 34 years | 0 (0.0%) | 0 (0.0%) |
| 35 to 50 years | 0 (0.0%) | 0 (0.0%) |
| Total | 0 (0.0%) | 0 (0.0%) |
Fertility by Education in Lakeside
| Educational Attainment | Women with Births | Births / 1,000 Women |
| Less than High School | 0 (0.0%) | 0.0 |
| High School Diploma | 0 (0.0%) | 0.0 |
| College or Associate's Degree | 0 (0.0%) | 0.0 |
| Bachelor's Degree | 0 (0.0%) | 0.0 |
| Graduate Degree | 0 (0.0%) | 0.0 |
| Total | 0 (0.0%) | 0.0 |
Fertility by Education by Marriage Status in Lakeside
| Educational Attainment | Married | Unmarried |
| Less than High School | 0 (0.0%) | 0 (0.0%) |
| High School Diploma | 0 (0.0%) | 0 (0.0%) |
| College or Associate's Degree | 0 (0.0%) | 0 (0.0%) |
| Bachelor's Degree | 0 (0.0%) | 0 (0.0%) |
| Graduate Degree | 0 (0.0%) | 0 (0.0%) |
| Total | 0 (0.0%) | 0 (0.0%) |
Employment Characteristics in Lakeside
Employment by Class of Employer in Lakeside
Among the 133 employed individuals in Lakeside, private company employees (112 | 84.2%), self-employed (not incorporated) (11 | 8.3%), and not-for-profit organizations (10 | 7.5%) make up the most common classes of employment.
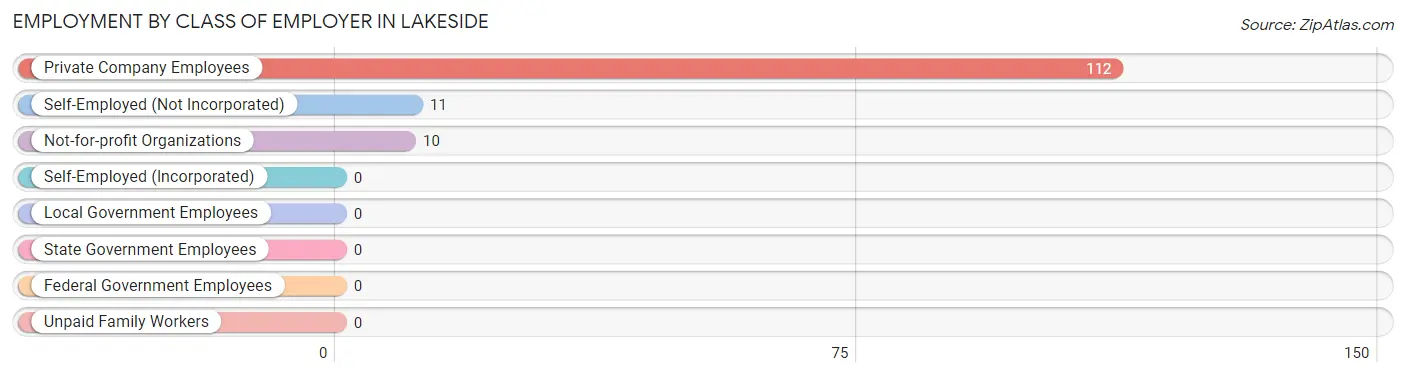
| Employer Class | # Employees | % Employees |
| Private Company Employees | 112 | 84.2% |
| Self-Employed (Incorporated) | 0 | 0.0% |
| Self-Employed (Not Incorporated) | 11 | 8.3% |
| Not-for-profit Organizations | 10 | 7.5% |
| Local Government Employees | 0 | 0.0% |
| State Government Employees | 0 | 0.0% |
| Federal Government Employees | 0 | 0.0% |
| Unpaid Family Workers | 0 | 0.0% |
| Total | 133 | 100.0% |
Employment Status by Age in Lakeside
According to the labor force statistics for Lakeside, out of the total population over 16 years of age (560), 25.0% or 140 individuals are in the labor force, with 5.0% or 7 of them unemployed. The age group with the highest labor force participation rate is 45 to 54 years, with 100.0% or 40 individuals in the labor force. Within the labor force, the 25 to 29 years age range has the highest percentage of unemployed individuals, with 43.8% or 7 of them being unemployed.
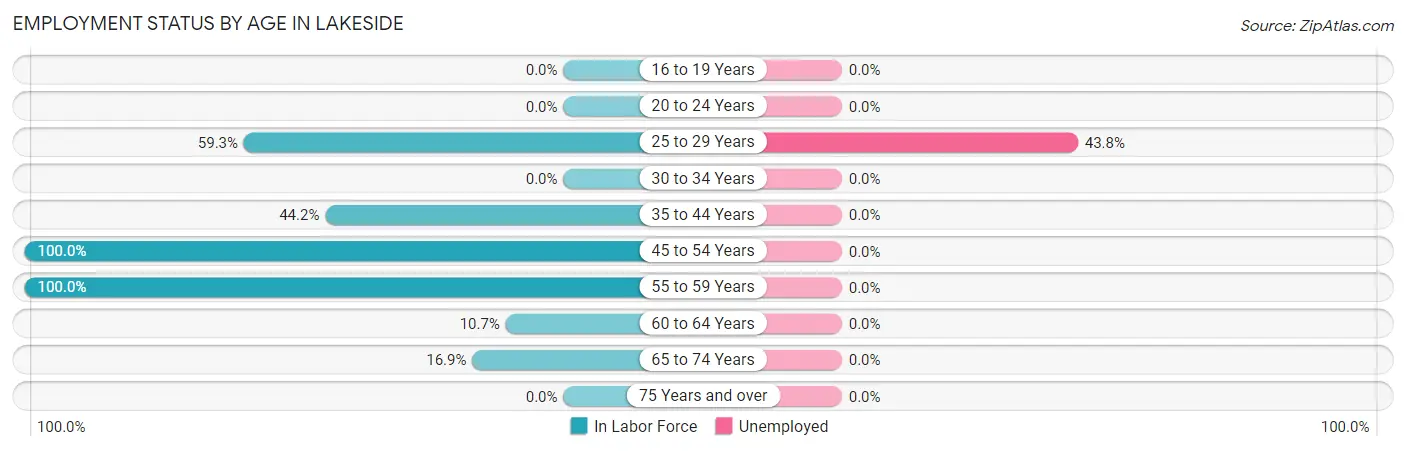
| Age Bracket | In Labor Force | Unemployed |
| 16 to 19 Years | 0 (0.0%) | 0 (0.0%) |
| 20 to 24 Years | 0 (0.0%) | 0 (0.0%) |
| 25 to 29 Years | 16 (59.3%) | 7 (43.8%) |
| 30 to 34 Years | 0 (0.0%) | 0 (0.0%) |
| 35 to 44 Years | 19 (44.2%) | 0 (0.0%) |
| 45 to 54 Years | 40 (100.0%) | 0 (0.0%) |
| 55 to 59 Years | 19 (100.0%) | 0 (0.0%) |
| 60 to 64 Years | 9 (10.7%) | 0 (0.0%) |
| 65 to 74 Years | 37 (16.9%) | 0 (0.0%) |
| 75 Years and over | 0 (0.0%) | 0 (0.0%) |
| Total | 140 (25.0%) | 7 (5.0%) |
Employment Status by Educational Attainment in Lakeside
According to labor force statistics for Lakeside, 48.4% of individuals (103) out of the total population between 25 and 64 years of age (213) are in the labor force, with 6.8% or 7 of them being unemployed. The group with the highest labor force participation rate are those with the educational attainment of college / associate degree, with 100.0% or 9 individuals in the labor force. Within the labor force, individuals with high school diploma education have the highest percentage of unemployment, with 17.1% or 7 of them being unemployed.
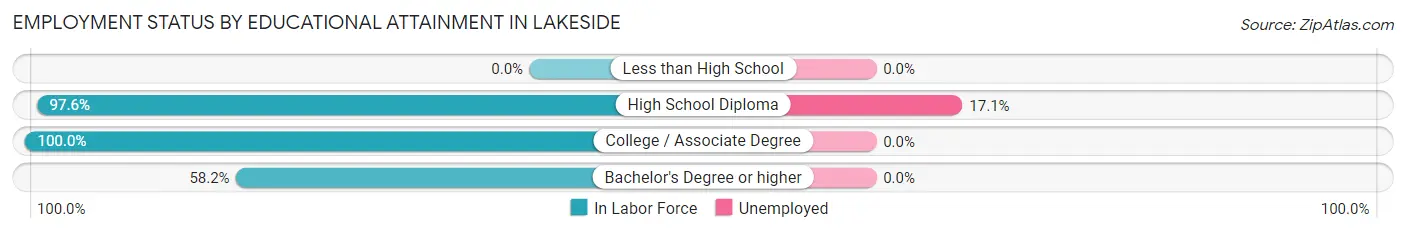
| Educational Attainment | In Labor Force | Unemployed |
| Less than High School | 0 (0.0%) | 0 (0.0%) |
| High School Diploma | 41 (97.6%) | 7 (17.1%) |
| College / Associate Degree | 9 (100.0%) | 0 (0.0%) |
| Bachelor's Degree or higher | 53 (58.2%) | 0 (0.0%) |
| Total | 103 (48.4%) | 14 (6.8%) |
Employment Occupations by Sex in Lakeside
Management, Business, Science and Arts Occupations
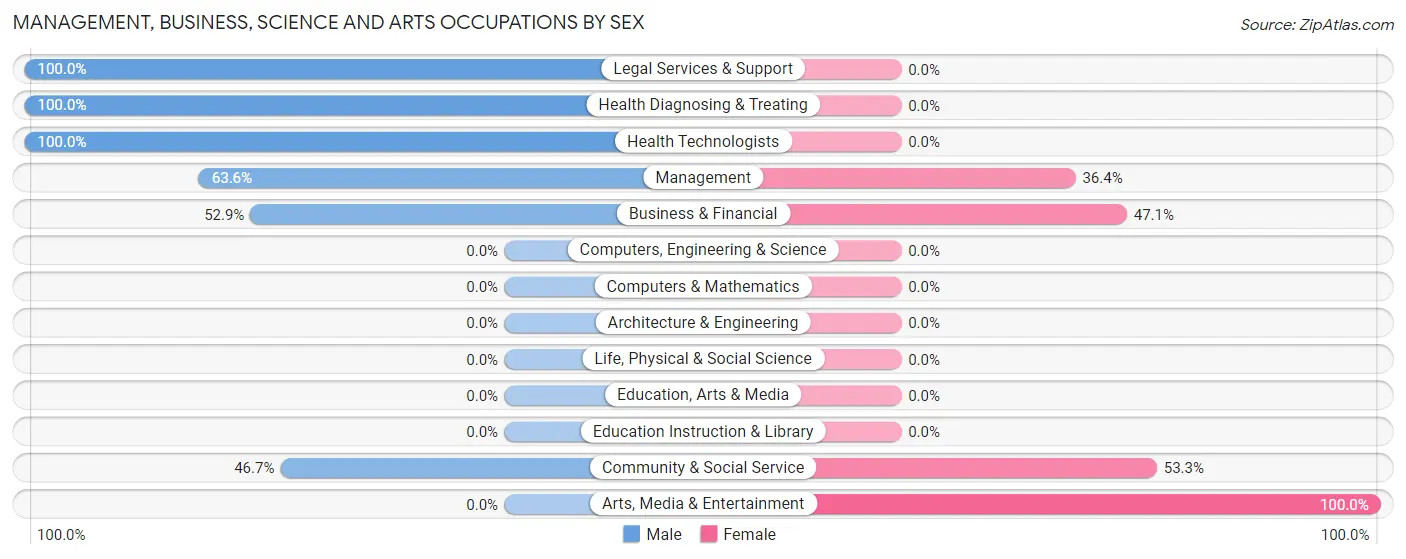
The most common Management, Business, Science and Arts occupations in Lakeside are Management (22 | 16.5%), Business & Financial (17 | 12.8%), Community & Social Service (15 | 11.3%), Health Diagnosing & Treating (10 | 7.5%), and Health Technologists (10 | 7.5%).
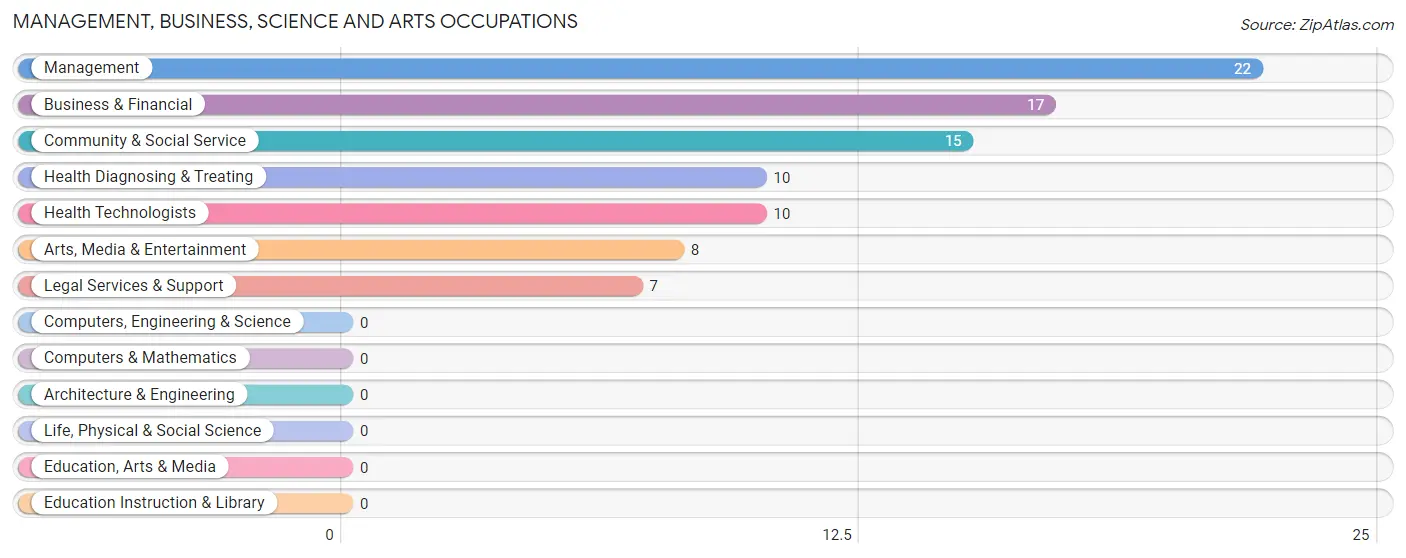
Management, Business, Science and Arts Occupations by Sex
Within the Management, Business, Science and Arts occupations in Lakeside, the most male-oriented occupations are Legal Services & Support (100.0%), Health Diagnosing & Treating (100.0%), and Health Technologists (100.0%), while the most female-oriented occupations are Arts, Media & Entertainment (100.0%), Community & Social Service (53.3%), and Business & Financial (47.1%).
| Occupation | Male | Female |
| Management | 14 (63.6%) | 8 (36.4%) |
| Business & Financial | 9 (52.9%) | 8 (47.1%) |
| Computers, Engineering & Science | 0 (0.0%) | 0 (0.0%) |
| Computers & Mathematics | 0 (0.0%) | 0 (0.0%) |
| Architecture & Engineering | 0 (0.0%) | 0 (0.0%) |
| Life, Physical & Social Science | 0 (0.0%) | 0 (0.0%) |
| Community & Social Service | 7 (46.7%) | 8 (53.3%) |
| Education, Arts & Media | 0 (0.0%) | 0 (0.0%) |
| Legal Services & Support | 7 (100.0%) | 0 (0.0%) |
| Education Instruction & Library | 0 (0.0%) | 0 (0.0%) |
| Arts, Media & Entertainment | 0 (0.0%) | 8 (100.0%) |
| Health Diagnosing & Treating | 10 (100.0%) | 0 (0.0%) |
| Health Technologists | 10 (100.0%) | 0 (0.0%) |
| Total (Category) | 40 (62.5%) | 24 (37.5%) |
| Total (Overall) | 60 (45.1%) | 73 (54.9%) |
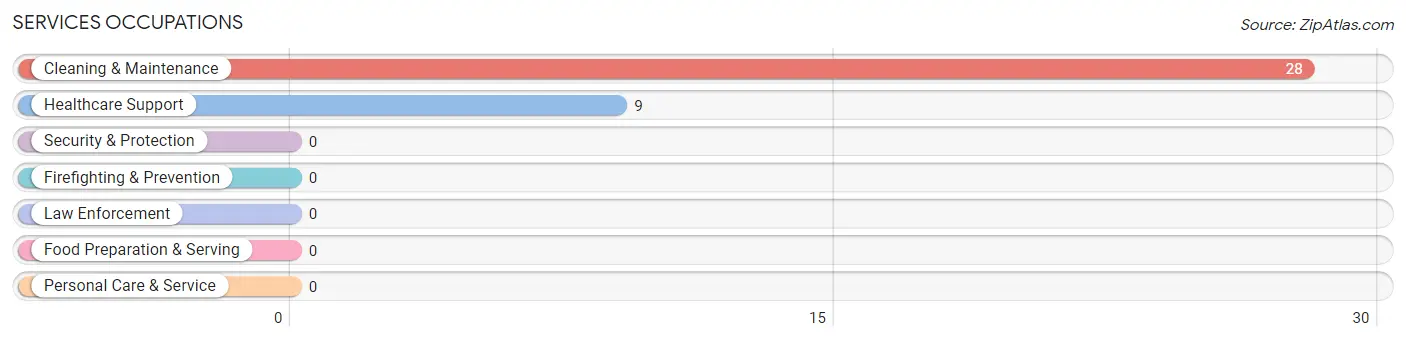
Services Occupations
The most common Services occupations in Lakeside are Cleaning & Maintenance (28 | 21.0%), and Healthcare Support (9 | 6.8%).
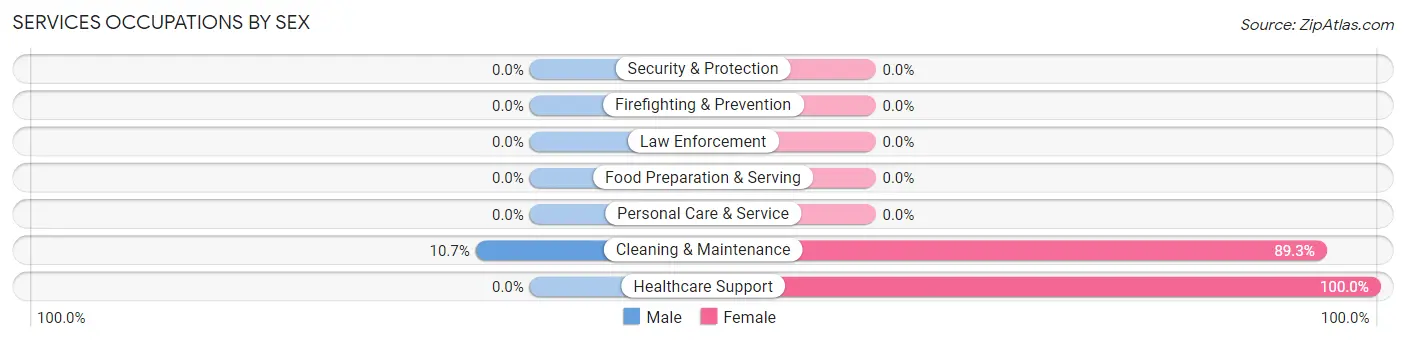
Services Occupations by Sex
| Occupation | Male | Female |
| Healthcare Support | 0 (0.0%) | 9 (100.0%) |
| Security & Protection | 0 (0.0%) | 0 (0.0%) |
| Firefighting & Prevention | 0 (0.0%) | 0 (0.0%) |
| Law Enforcement | 0 (0.0%) | 0 (0.0%) |
| Food Preparation & Serving | 0 (0.0%) | 0 (0.0%) |
| Cleaning & Maintenance | 3 (10.7%) | 25 (89.3%) |
| Personal Care & Service | 0 (0.0%) | 0 (0.0%) |
| Total (Category) | 3 (8.1%) | 34 (91.9%) |
| Total (Overall) | 60 (45.1%) | 73 (54.9%) |
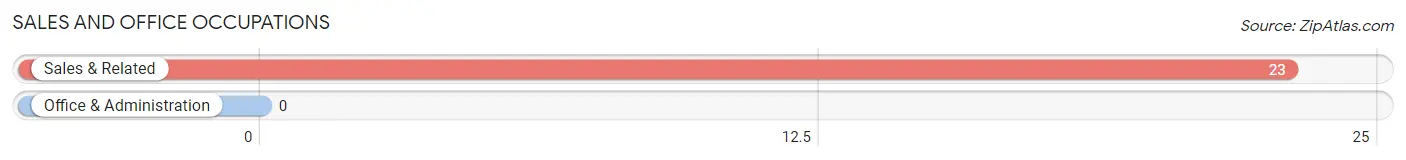
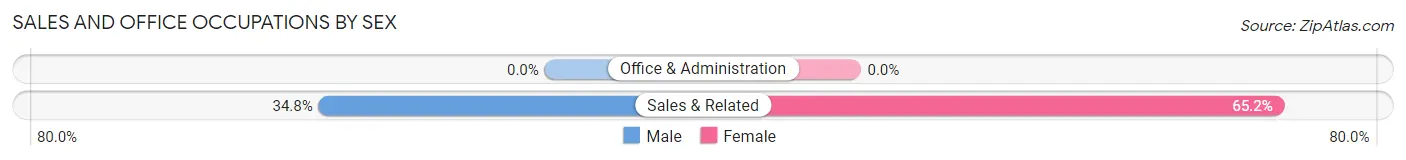
Sales and Office Occupations
The most common Sales and Office occupations in Lakeside are , and Sales & Related (23 | 17.3%).
Sales and Office Occupations by Sex
| Occupation | Male | Female |
| Sales & Related | 8 (34.8%) | 15 (65.2%) |
| Office & Administration | 0 (0.0%) | 0 (0.0%) |
| Total (Category) | 8 (34.8%) | 15 (65.2%) |
| Total (Overall) | 60 (45.1%) | 73 (54.9%) |
Natural Resources, Construction and Maintenance Occupations
Natural Resources, Construction and Maintenance Occupations by Sex
| Occupation | Male | Female |
| Farming, Fishing & Forestry | 0 (0.0%) | 0 (0.0%) |
| Construction & Extraction | 0 (0.0%) | 0 (0.0%) |
| Installation, Maintenance & Repair | 0 (0.0%) | 0 (0.0%) |
| Total (Category) | 0 (0.0%) | 0 (0.0%) |
| Total (Overall) | 60 (45.1%) | 73 (54.9%) |
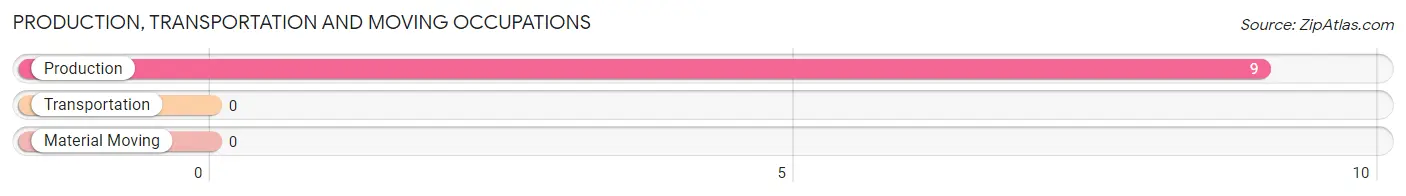
Production, Transportation and Moving Occupations
The most common Production, Transportation and Moving occupations in Lakeside are , and Production (9 | 6.8%).
Production, Transportation and Moving Occupations by Sex
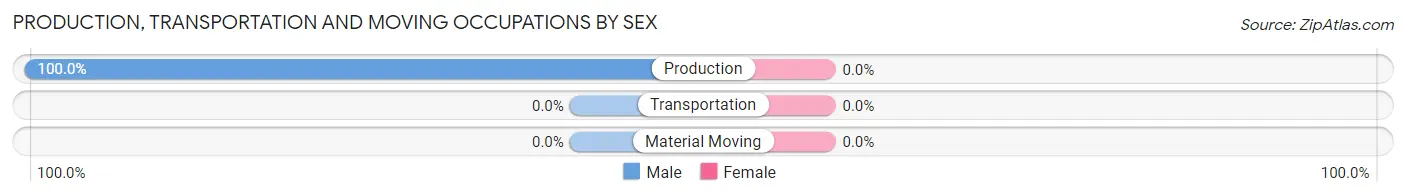
| Occupation | Male | Female |
| Production | 9 (100.0%) | 0 (0.0%) |
| Transportation | 0 (0.0%) | 0 (0.0%) |
| Material Moving | 0 (0.0%) | 0 (0.0%) |
| Total (Category) | 9 (100.0%) | 0 (0.0%) |
| Total (Overall) | 60 (45.1%) | 73 (54.9%) |
Employment Industries by Sex in Lakeside
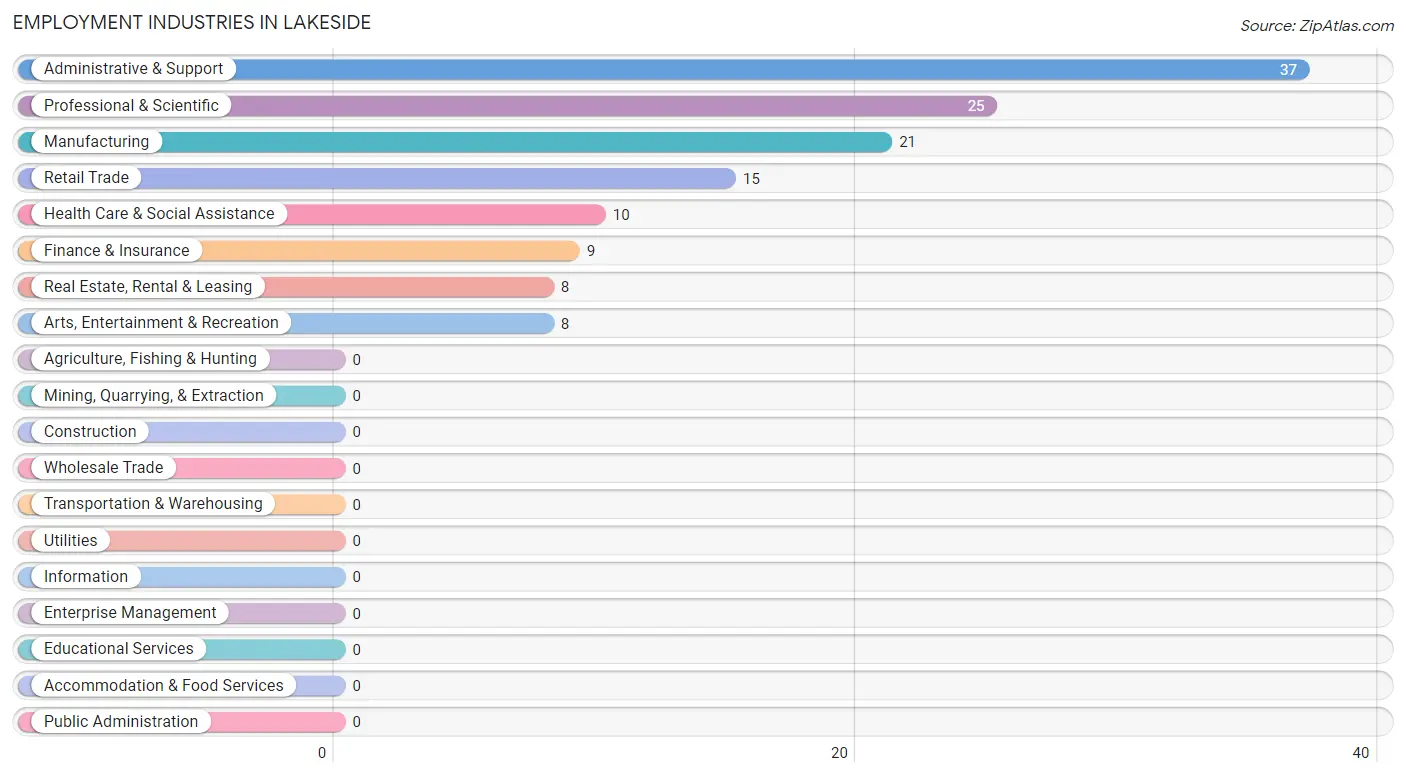
Employment Industries in Lakeside
The major employment industries in Lakeside include Administrative & Support (37 | 27.8%), Professional & Scientific (25 | 18.8%), Manufacturing (21 | 15.8%), Retail Trade (15 | 11.3%), and Health Care & Social Assistance (10 | 7.5%).
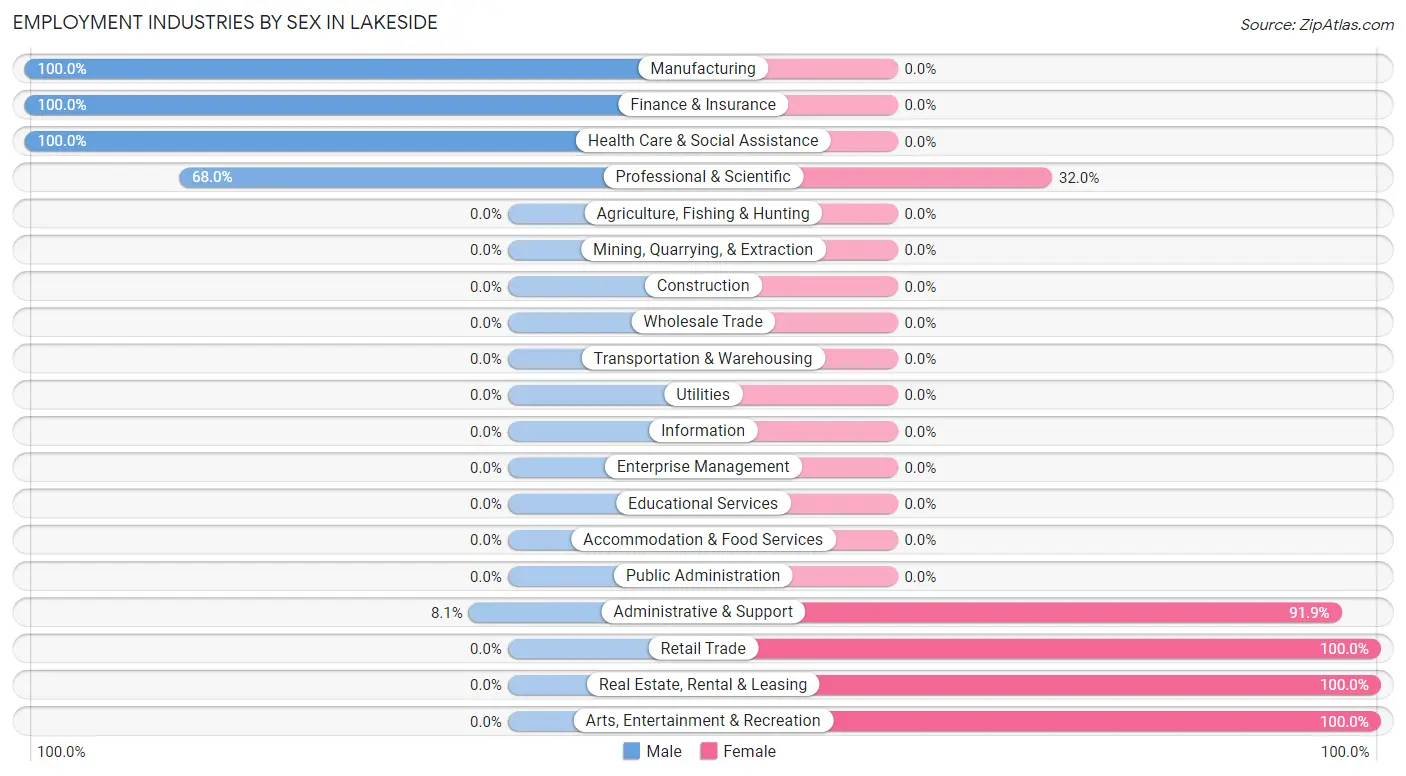
Employment Industries by Sex in Lakeside
The Lakeside industries that see more men than women are Manufacturing (100.0%), Finance & Insurance (100.0%), and Health Care & Social Assistance (100.0%), whereas the industries that tend to have a higher number of women are Retail Trade (100.0%), Real Estate, Rental & Leasing (100.0%), and Arts, Entertainment & Recreation (100.0%).
| Industry | Male | Female |
| Agriculture, Fishing & Hunting | 0 (0.0%) | 0 (0.0%) |
| Mining, Quarrying, & Extraction | 0 (0.0%) | 0 (0.0%) |
| Construction | 0 (0.0%) | 0 (0.0%) |
| Manufacturing | 21 (100.0%) | 0 (0.0%) |
| Wholesale Trade | 0 (0.0%) | 0 (0.0%) |
| Retail Trade | 0 (0.0%) | 15 (100.0%) |
| Transportation & Warehousing | 0 (0.0%) | 0 (0.0%) |
| Utilities | 0 (0.0%) | 0 (0.0%) |
| Information | 0 (0.0%) | 0 (0.0%) |
| Finance & Insurance | 9 (100.0%) | 0 (0.0%) |
| Real Estate, Rental & Leasing | 0 (0.0%) | 8 (100.0%) |
| Professional & Scientific | 17 (68.0%) | 8 (32.0%) |
| Enterprise Management | 0 (0.0%) | 0 (0.0%) |
| Administrative & Support | 3 (8.1%) | 34 (91.9%) |
| Educational Services | 0 (0.0%) | 0 (0.0%) |
| Health Care & Social Assistance | 10 (100.0%) | 0 (0.0%) |
| Arts, Entertainment & Recreation | 0 (0.0%) | 8 (100.0%) |
| Accommodation & Food Services | 0 (0.0%) | 0 (0.0%) |
| Public Administration | 0 (0.0%) | 0 (0.0%) |
| Total | 60 (45.1%) | 73 (54.9%) |
Education in Lakeside
School Enrollment in Lakeside
The most common levels of schooling among the 18 students in Lakeside are college / undergraduate (10 | 55.6%), and nursery / preschool (8 | 44.4%).
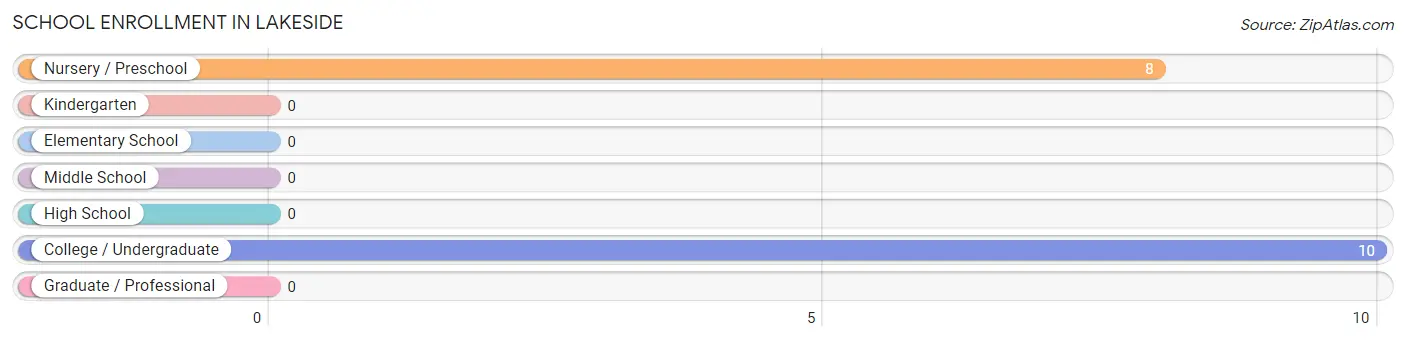
| School Level | # Students | % Students |
| Nursery / Preschool | 8 | 44.4% |
| Kindergarten | 0 | 0.0% |
| Elementary School | 0 | 0.0% |
| Middle School | 0 | 0.0% |
| High School | 0 | 0.0% |
| College / Undergraduate | 10 | 55.6% |
| Graduate / Professional | 0 | 0.0% |
| Total | 18 | 100.0% |
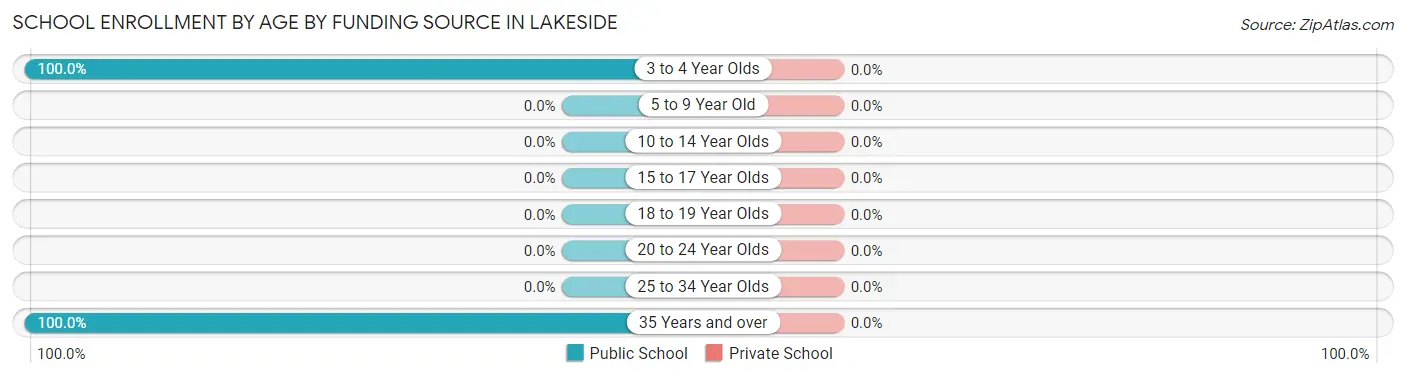
School Enrollment by Age by Funding Source in Lakeside
| Age Bracket | Public School | Private School |
| 3 to 4 Year Olds | 8 (100.0%) | 0 (0.0%) |
| 5 to 9 Year Old | 0 (0.0%) | 0 (0.0%) |
| 10 to 14 Year Olds | 0 (0.0%) | 0 (0.0%) |
| 15 to 17 Year Olds | 0 (0.0%) | 0 (0.0%) |
| 18 to 19 Year Olds | 0 (0.0%) | 0 (0.0%) |
| 20 to 24 Year Olds | 0 (0.0%) | 0 (0.0%) |
| 25 to 34 Year Olds | 0 (0.0%) | 0 (0.0%) |
| 35 Years and over | 10 (100.0%) | 0 (0.0%) |
| Total | 18 (100.0%) | 0 (0.0%) |
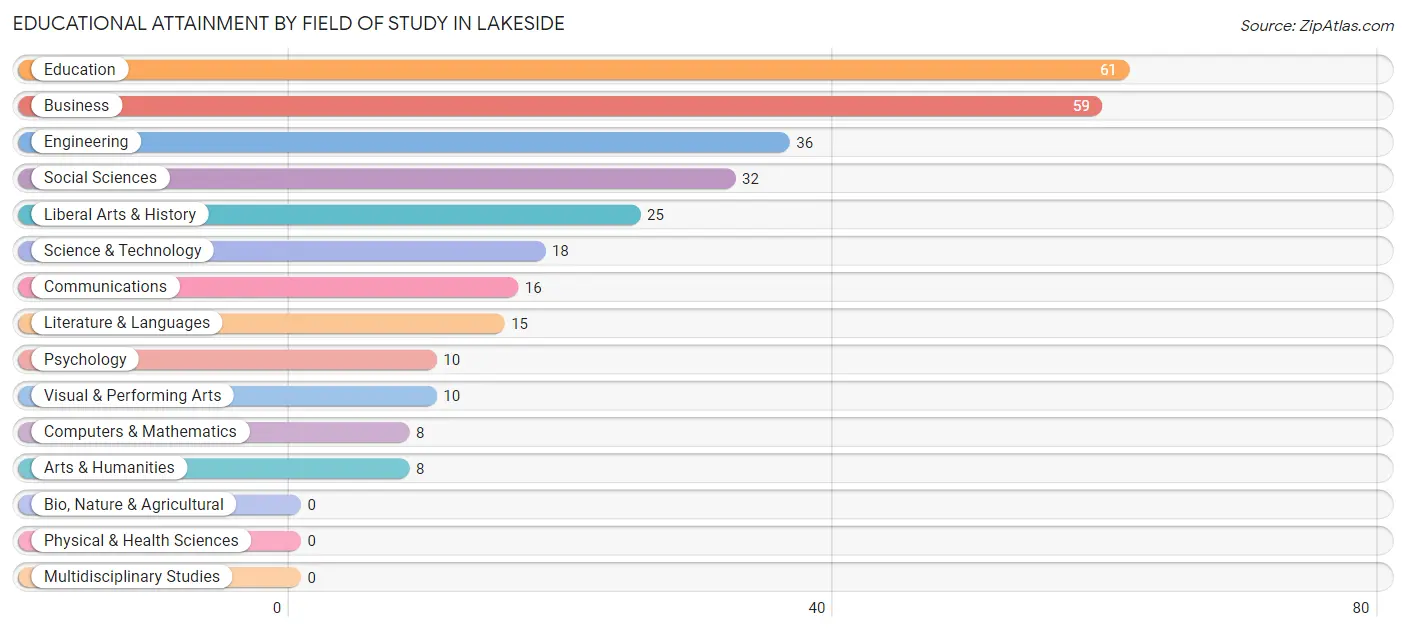
Educational Attainment by Field of Study in Lakeside
Education (61 | 20.5%), business (59 | 19.8%), engineering (36 | 12.1%), social sciences (32 | 10.7%), and liberal arts & history (25 | 8.4%) are the most common fields of study among 298 individuals in Lakeside who have obtained a bachelor's degree or higher.
| Field of Study | # Graduates | % Graduates |
| Computers & Mathematics | 8 | 2.7% |
| Bio, Nature & Agricultural | 0 | 0.0% |
| Physical & Health Sciences | 0 | 0.0% |
| Psychology | 10 | 3.4% |
| Social Sciences | 32 | 10.7% |
| Engineering | 36 | 12.1% |
| Multidisciplinary Studies | 0 | 0.0% |
| Science & Technology | 18 | 6.0% |
| Business | 59 | 19.8% |
| Education | 61 | 20.5% |
| Literature & Languages | 15 | 5.0% |
| Liberal Arts & History | 25 | 8.4% |
| Visual & Performing Arts | 10 | 3.4% |
| Communications | 16 | 5.4% |
| Arts & Humanities | 8 | 2.7% |
| Total | 298 | 100.0% |
Transportation & Commute in Lakeside
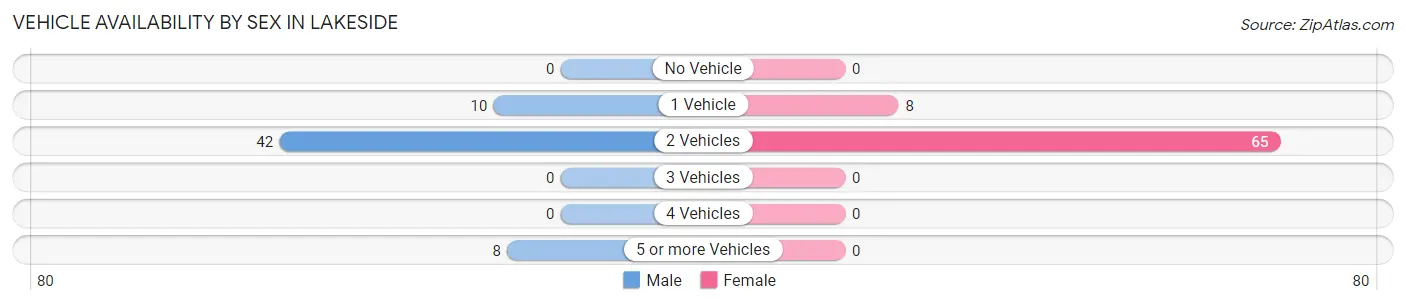
Vehicle Availability by Sex in Lakeside
The most prevalent vehicle ownership categories in Lakeside are males with 2 vehicles (42, accounting for 70.0%) and females with 2 vehicles (65, making up 57.5%).
| Vehicles Available | Male | Female |
| No Vehicle | 0 (0.0%) | 0 (0.0%) |
| 1 Vehicle | 10 (16.7%) | 8 (11.0%) |
| 2 Vehicles | 42 (70.0%) | 65 (89.0%) |
| 3 Vehicles | 0 (0.0%) | 0 (0.0%) |
| 4 Vehicles | 0 (0.0%) | 0 (0.0%) |
| 5 or more Vehicles | 8 (13.3%) | 0 (0.0%) |
| Total | 60 (100.0%) | 73 (100.0%) |
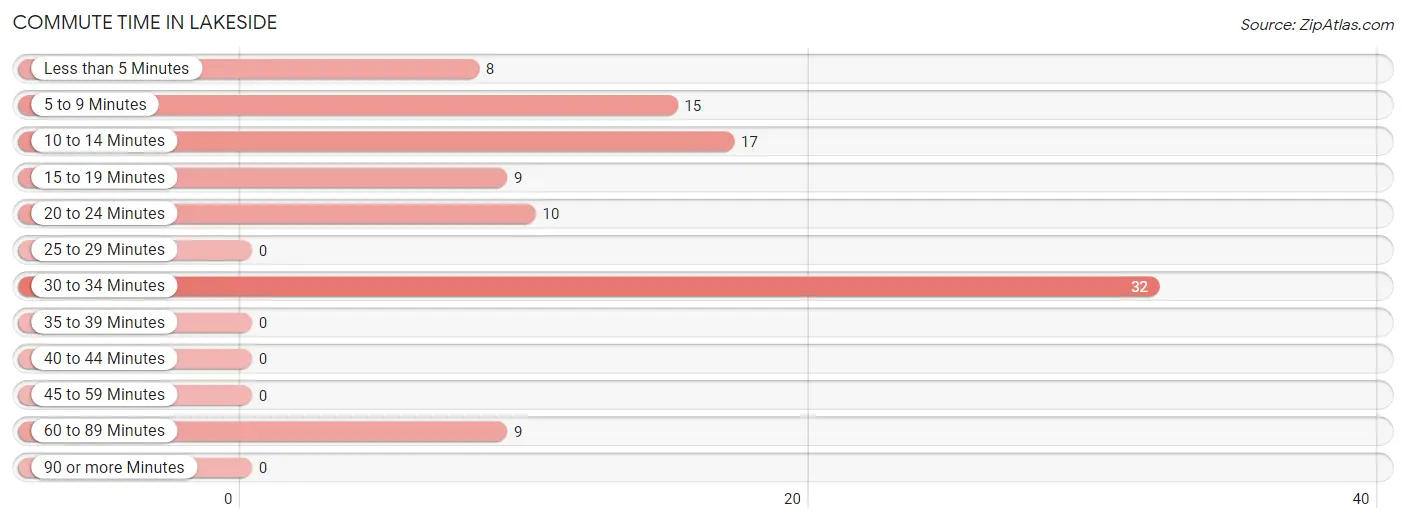
Commute Time in Lakeside
The most frequently occuring commute durations in Lakeside are 30 to 34 minutes (32 commuters, 32.0%), 10 to 14 minutes (17 commuters, 17.0%), and 5 to 9 minutes (15 commuters, 15.0%).
| Commute Time | # Commuters | % Commuters |
| Less than 5 Minutes | 8 | 8.0% |
| 5 to 9 Minutes | 15 | 15.0% |
| 10 to 14 Minutes | 17 | 17.0% |
| 15 to 19 Minutes | 9 | 9.0% |
| 20 to 24 Minutes | 10 | 10.0% |
| 25 to 29 Minutes | 0 | 0.0% |
| 30 to 34 Minutes | 32 | 32.0% |
| 35 to 39 Minutes | 0 | 0.0% |
| 40 to 44 Minutes | 0 | 0.0% |
| 45 to 59 Minutes | 0 | 0.0% |
| 60 to 89 Minutes | 9 | 9.0% |
| 90 or more Minutes | 0 | 0.0% |
Commute Time by Sex in Lakeside
The most common commute times in Lakeside are 20 to 24 minutes (10 commuters, 19.2%) for males and 30 to 34 minutes (25 commuters, 52.1%) for females.
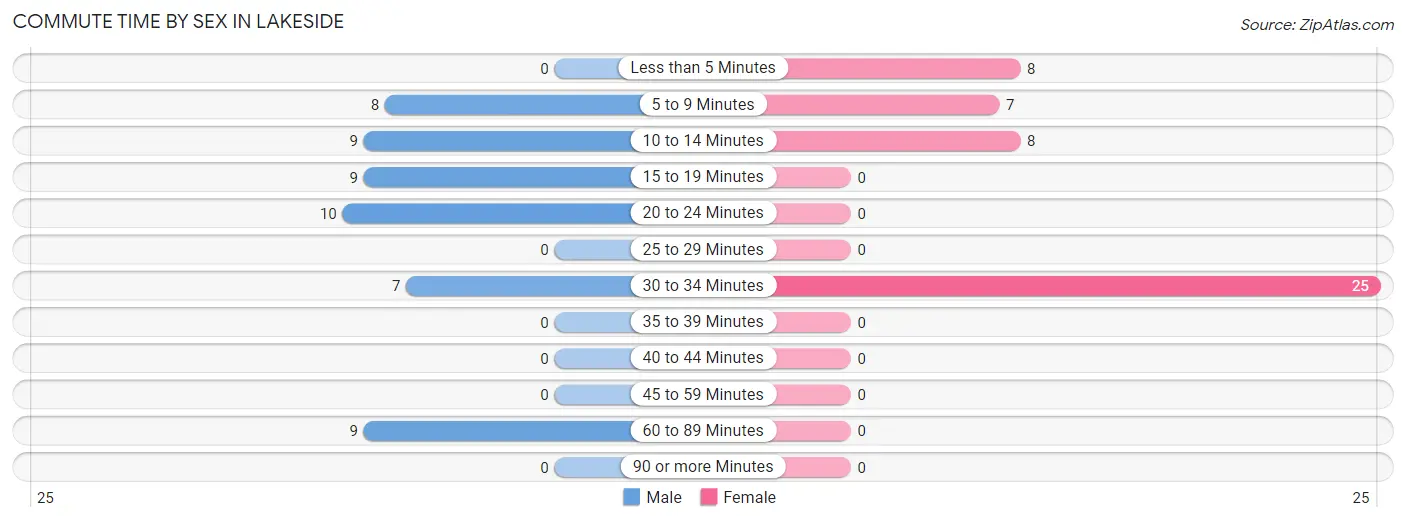
| Commute Time | Male | Female |
| Less than 5 Minutes | 0 (0.0%) | 8 (16.7%) |
| 5 to 9 Minutes | 8 (15.4%) | 7 (14.6%) |
| 10 to 14 Minutes | 9 (17.3%) | 8 (16.7%) |
| 15 to 19 Minutes | 9 (17.3%) | 0 (0.0%) |
| 20 to 24 Minutes | 10 (19.2%) | 0 (0.0%) |
| 25 to 29 Minutes | 0 (0.0%) | 0 (0.0%) |
| 30 to 34 Minutes | 7 (13.5%) | 25 (52.1%) |
| 35 to 39 Minutes | 0 (0.0%) | 0 (0.0%) |
| 40 to 44 Minutes | 0 (0.0%) | 0 (0.0%) |
| 45 to 59 Minutes | 0 (0.0%) | 0 (0.0%) |
| 60 to 89 Minutes | 9 (17.3%) | 0 (0.0%) |
| 90 or more Minutes | 0 (0.0%) | 0 (0.0%) |
Time of Departure to Work by Sex in Lakeside
The most frequent times of departure to work in Lakeside are 7:00 AM to 7:29 AM (30, 57.7%) for males and 7:00 AM to 7:29 AM (25, 52.1%) for females.
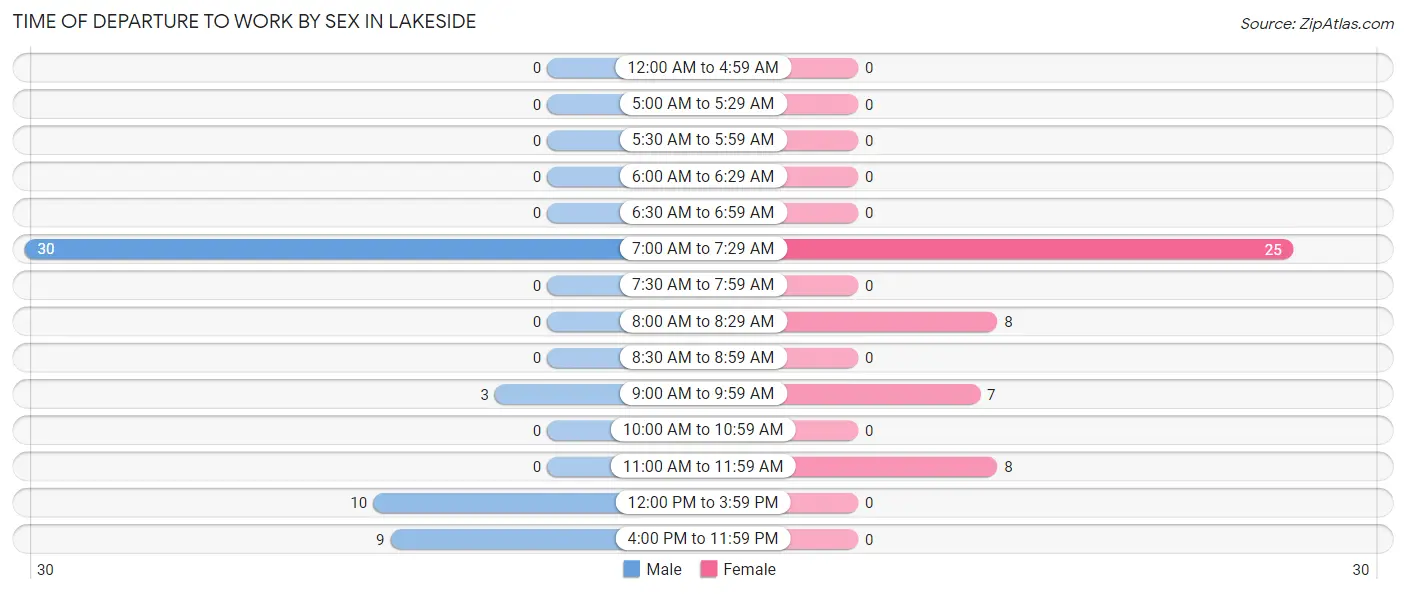
| Time of Departure | Male | Female |
| 12:00 AM to 4:59 AM | 0 (0.0%) | 0 (0.0%) |
| 5:00 AM to 5:29 AM | 0 (0.0%) | 0 (0.0%) |
| 5:30 AM to 5:59 AM | 0 (0.0%) | 0 (0.0%) |
| 6:00 AM to 6:29 AM | 0 (0.0%) | 0 (0.0%) |
| 6:30 AM to 6:59 AM | 0 (0.0%) | 0 (0.0%) |
| 7:00 AM to 7:29 AM | 30 (57.7%) | 25 (52.1%) |
| 7:30 AM to 7:59 AM | 0 (0.0%) | 0 (0.0%) |
| 8:00 AM to 8:29 AM | 0 (0.0%) | 8 (16.7%) |
| 8:30 AM to 8:59 AM | 0 (0.0%) | 0 (0.0%) |
| 9:00 AM to 9:59 AM | 3 (5.8%) | 7 (14.6%) |
| 10:00 AM to 10:59 AM | 0 (0.0%) | 0 (0.0%) |
| 11:00 AM to 11:59 AM | 0 (0.0%) | 8 (16.7%) |
| 12:00 PM to 3:59 PM | 10 (19.2%) | 0 (0.0%) |
| 4:00 PM to 11:59 PM | 9 (17.3%) | 0 (0.0%) |
| Total | 52 (100.0%) | 48 (100.0%) |
Housing Occupancy in Lakeside
Occupancy by Ownership in Lakeside
Of the total 314 dwellings in Lakeside, owner-occupied units account for 269 (85.7%), while renter-occupied units make up 45 (14.3%).
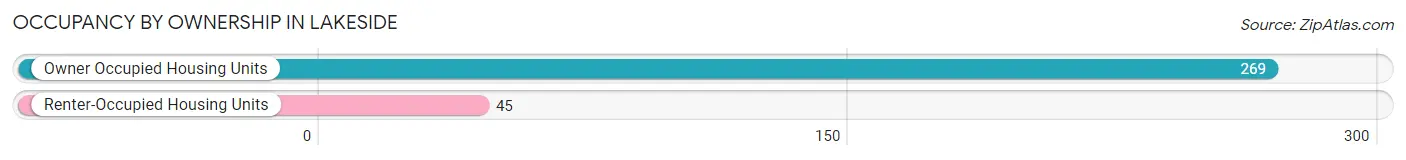
| Occupancy | # Housing Units | % Housing Units |
| Owner Occupied Housing Units | 269 | 85.7% |
| Renter-Occupied Housing Units | 45 | 14.3% |
| Total Occupied Housing Units | 314 | 100.0% |
Occupancy by Household Size in Lakeside
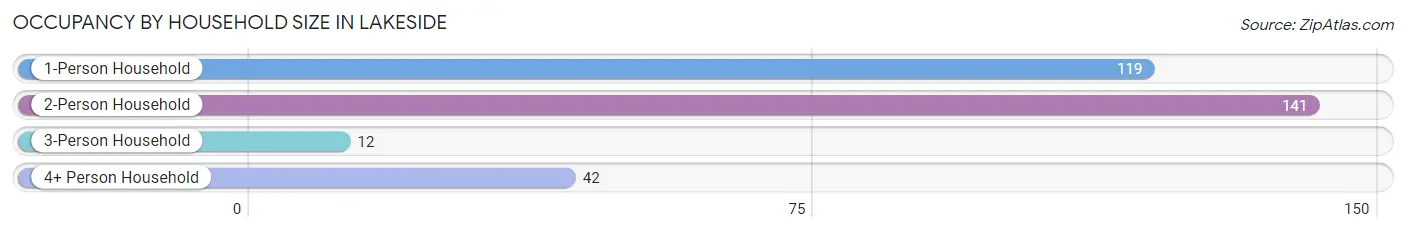
| Household Size | # Housing Units | % Housing Units |
| 1-Person Household | 119 | 37.9% |
| 2-Person Household | 141 | 44.9% |
| 3-Person Household | 12 | 3.8% |
| 4+ Person Household | 42 | 13.4% |
| Total Housing Units | 314 | 100.0% |
Occupancy by Ownership by Household Size in Lakeside
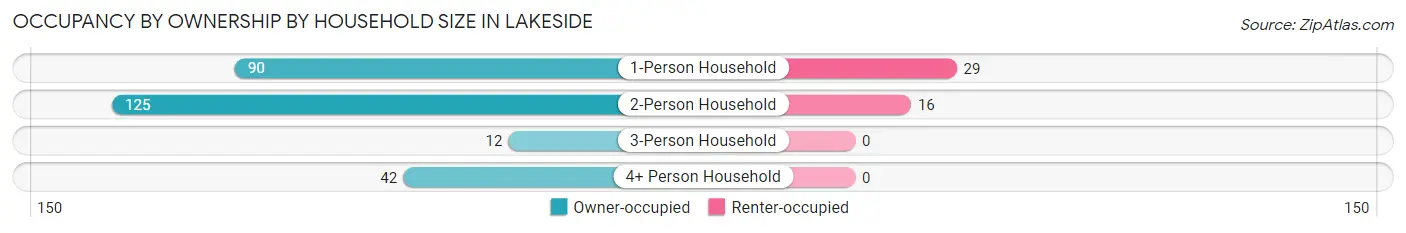
| Household Size | Owner-occupied | Renter-occupied |
| 1-Person Household | 90 (75.6%) | 29 (24.4%) |
| 2-Person Household | 125 (88.6%) | 16 (11.4%) |
| 3-Person Household | 12 (100.0%) | 0 (0.0%) |
| 4+ Person Household | 42 (100.0%) | 0 (0.0%) |
| Total Housing Units | 269 (85.7%) | 45 (14.3%) |
Occupancy by Educational Attainment in Lakeside
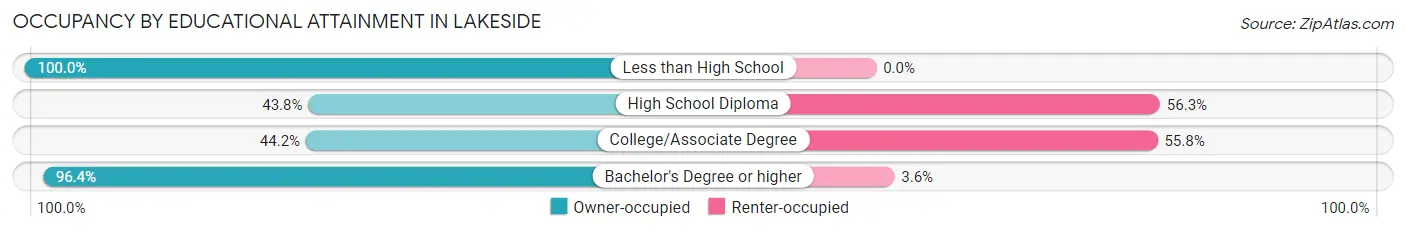
| Household Size | Owner-occupied | Renter-occupied |
| Less than High School | 52 (100.0%) | 0 (0.0%) |
| High School Diploma | 7 (43.8%) | 9 (56.2%) |
| College/Associate Degree | 23 (44.2%) | 29 (55.8%) |
| Bachelor's Degree or higher | 187 (96.4%) | 7 (3.6%) |
Occupancy by Age of Householder in Lakeside
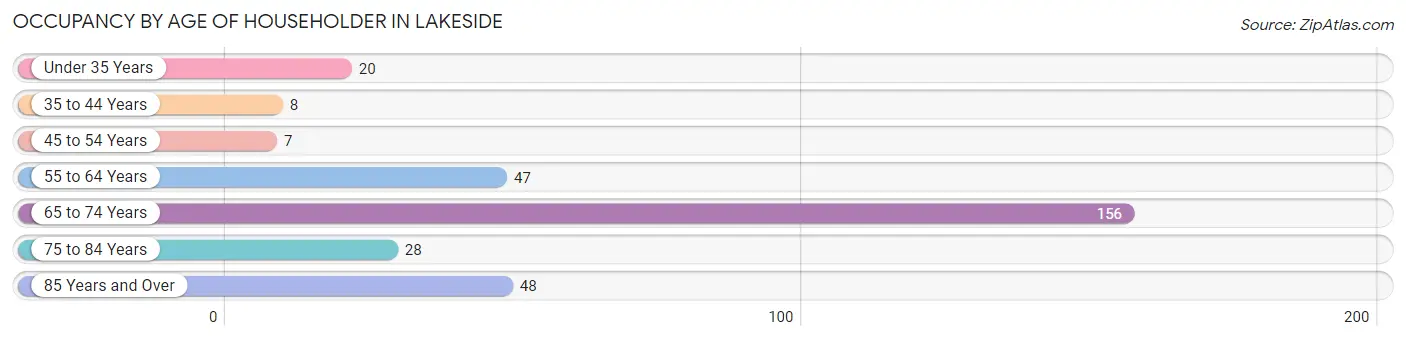
| Age Bracket | # Households | % Households |
| Under 35 Years | 20 | 6.4% |
| 35 to 44 Years | 8 | 2.5% |
| 45 to 54 Years | 7 | 2.2% |
| 55 to 64 Years | 47 | 15.0% |
| 65 to 74 Years | 156 | 49.7% |
| 75 to 84 Years | 28 | 8.9% |
| 85 Years and Over | 48 | 15.3% |
| Total | 314 | 100.0% |
Housing Finances in Lakeside
Median Income by Occupancy in Lakeside
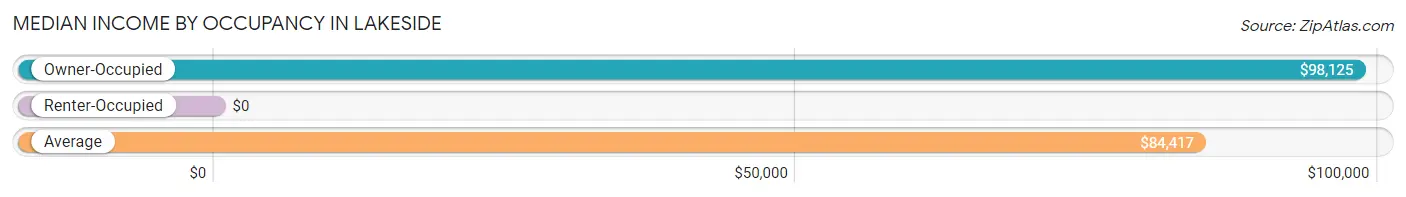
| Occupancy Type | # Households | Median Income |
| Owner-Occupied | 269 (85.7%) | $98,125 |
| Renter-Occupied | 45 (14.3%) | $0 |
| Average | 314 (100.0%) | $84,417 |
Occupancy by Householder Income Bracket in Lakeside
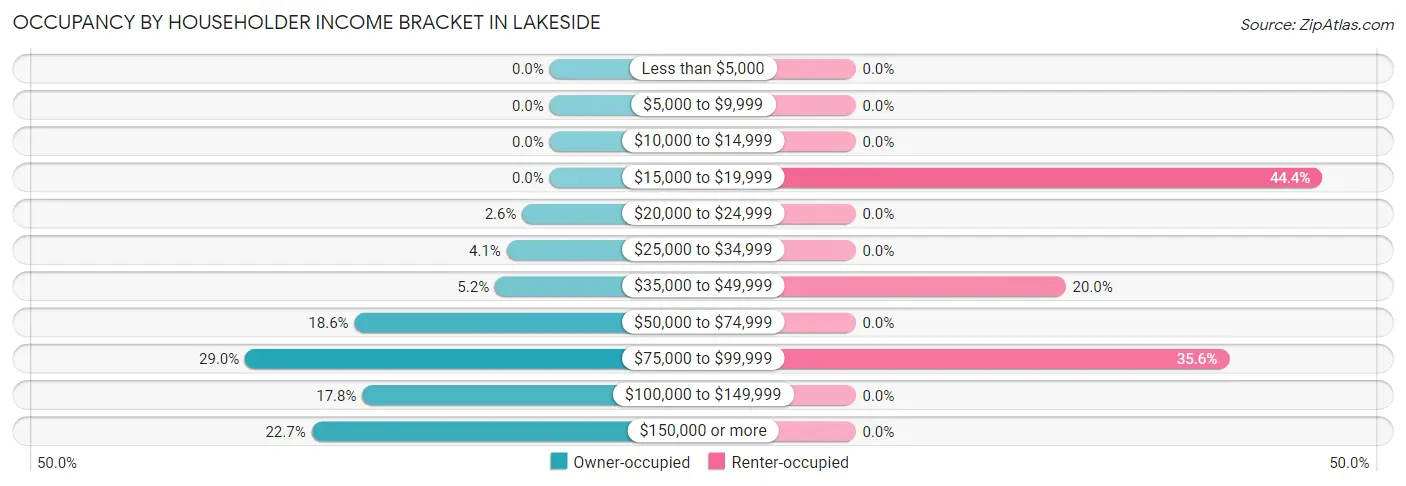
| Income Bracket | Owner-occupied | Renter-occupied |
| Less than $5,000 | 0 (0.0%) | 0 (0.0%) |
| $5,000 to $9,999 | 0 (0.0%) | 0 (0.0%) |
| $10,000 to $14,999 | 0 (0.0%) | 0 (0.0%) |
| $15,000 to $19,999 | 0 (0.0%) | 20 (44.4%) |
| $20,000 to $24,999 | 7 (2.6%) | 0 (0.0%) |
| $25,000 to $34,999 | 11 (4.1%) | 0 (0.0%) |
| $35,000 to $49,999 | 14 (5.2%) | 9 (20.0%) |
| $50,000 to $74,999 | 50 (18.6%) | 0 (0.0%) |
| $75,000 to $99,999 | 78 (29.0%) | 16 (35.6%) |
| $100,000 to $149,999 | 48 (17.8%) | 0 (0.0%) |
| $150,000 or more | 61 (22.7%) | 0 (0.0%) |
| Total | 269 (100.0%) | 45 (100.0%) |
Monthly Housing Cost Tiers in Lakeside
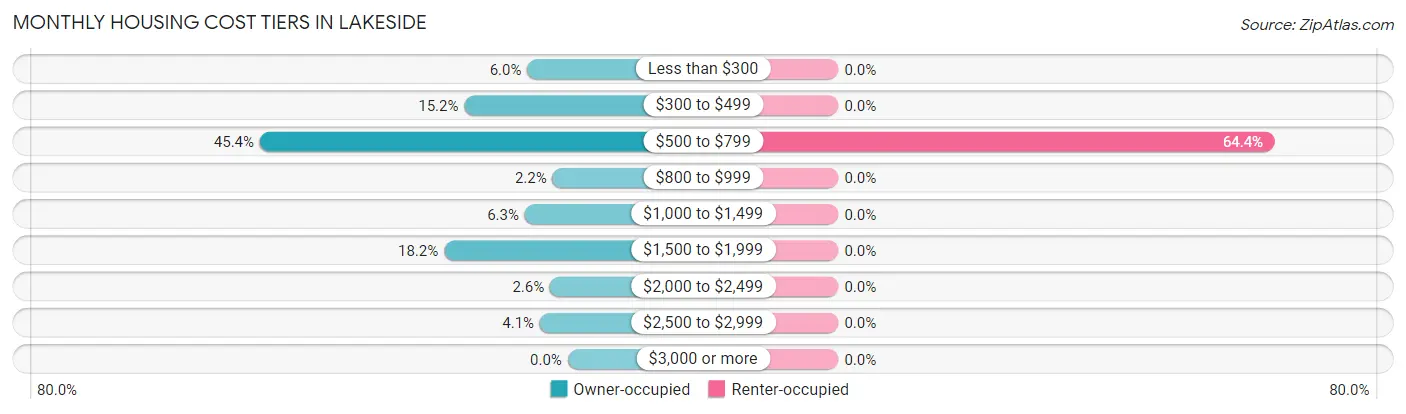
| Monthly Cost | Owner-occupied | Renter-occupied |
| Less than $300 | 16 (5.9%) | 0 (0.0%) |
| $300 to $499 | 41 (15.2%) | 0 (0.0%) |
| $500 to $799 | 122 (45.4%) | 29 (64.4%) |
| $800 to $999 | 6 (2.2%) | 0 (0.0%) |
| $1,000 to $1,499 | 17 (6.3%) | 0 (0.0%) |
| $1,500 to $1,999 | 49 (18.2%) | 0 (0.0%) |
| $2,000 to $2,499 | 7 (2.6%) | 0 (0.0%) |
| $2,500 to $2,999 | 11 (4.1%) | 0 (0.0%) |
| $3,000 or more | 0 (0.0%) | 0 (0.0%) |
| Total | 269 (100.0%) | 45 (100.0%) |
Physical Housing Characteristics in Lakeside
Housing Structures in Lakeside
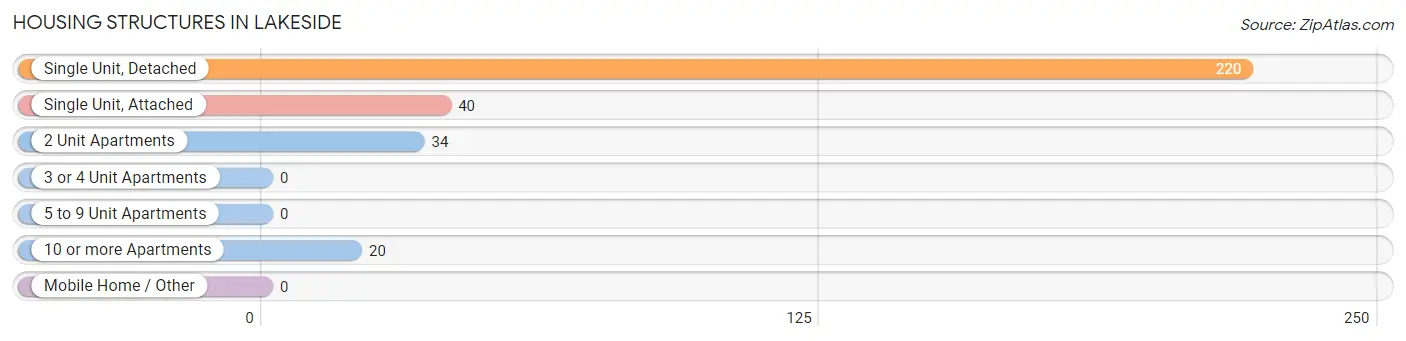
| Structure Type | # Housing Units | % Housing Units |
| Single Unit, Detached | 220 | 70.1% |
| Single Unit, Attached | 40 | 12.7% |
| 2 Unit Apartments | 34 | 10.8% |
| 3 or 4 Unit Apartments | 0 | 0.0% |
| 5 to 9 Unit Apartments | 0 | 0.0% |
| 10 or more Apartments | 20 | 6.4% |
| Mobile Home / Other | 0 | 0.0% |
| Total | 314 | 100.0% |
Housing Structures by Occupancy in Lakeside
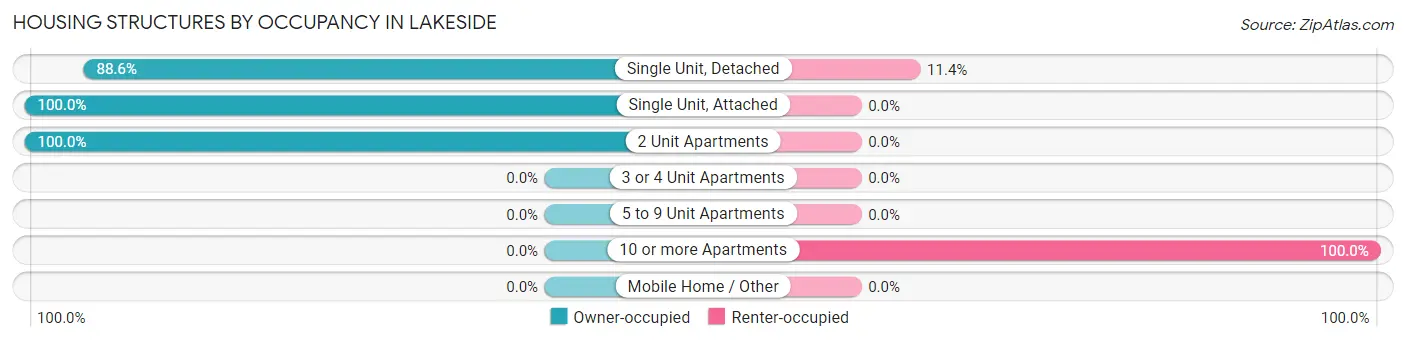
| Structure Type | Owner-occupied | Renter-occupied |
| Single Unit, Detached | 195 (88.6%) | 25 (11.4%) |
| Single Unit, Attached | 40 (100.0%) | 0 (0.0%) |
| 2 Unit Apartments | 34 (100.0%) | 0 (0.0%) |
| 3 or 4 Unit Apartments | 0 (0.0%) | 0 (0.0%) |
| 5 to 9 Unit Apartments | 0 (0.0%) | 0 (0.0%) |
| 10 or more Apartments | 0 (0.0%) | 20 (100.0%) |
| Mobile Home / Other | 0 (0.0%) | 0 (0.0%) |
| Total | 269 (85.7%) | 45 (14.3%) |
Housing Structures by Number of Rooms in Lakeside
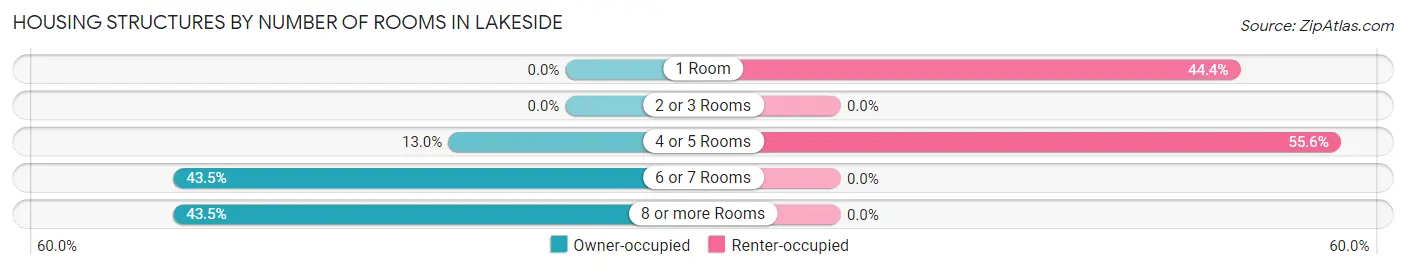
| Number of Rooms | Owner-occupied | Renter-occupied |
| 1 Room | 0 (0.0%) | 20 (44.4%) |
| 2 or 3 Rooms | 0 (0.0%) | 0 (0.0%) |
| 4 or 5 Rooms | 35 (13.0%) | 25 (55.6%) |
| 6 or 7 Rooms | 117 (43.5%) | 0 (0.0%) |
| 8 or more Rooms | 117 (43.5%) | 0 (0.0%) |
| Total | 269 (100.0%) | 45 (100.0%) |
Housing Structure by Heating Type in Lakeside
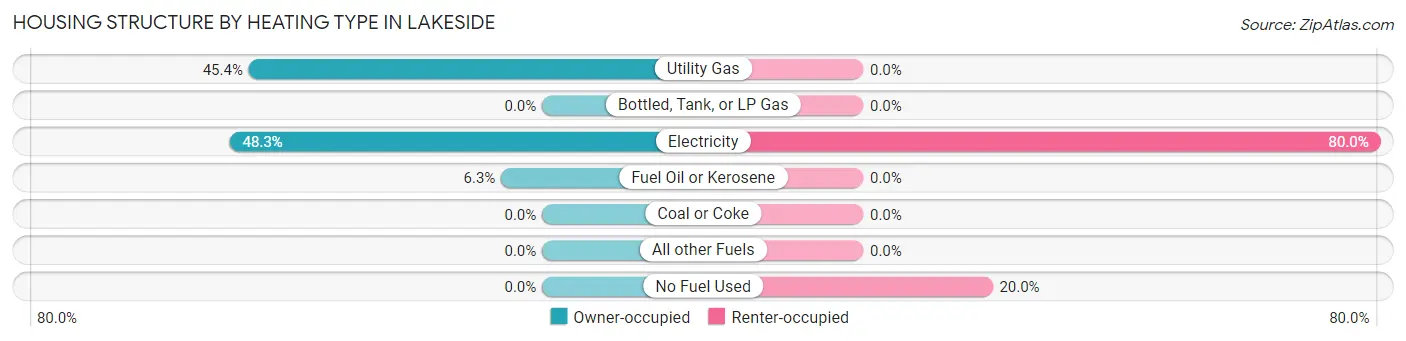
| Heating Type | Owner-occupied | Renter-occupied |
| Utility Gas | 122 (45.4%) | 0 (0.0%) |
| Bottled, Tank, or LP Gas | 0 (0.0%) | 0 (0.0%) |
| Electricity | 130 (48.3%) | 36 (80.0%) |
| Fuel Oil or Kerosene | 17 (6.3%) | 0 (0.0%) |
| Coal or Coke | 0 (0.0%) | 0 (0.0%) |
| All other Fuels | 0 (0.0%) | 0 (0.0%) |
| No Fuel Used | 0 (0.0%) | 9 (20.0%) |
| Total | 269 (100.0%) | 45 (100.0%) |
Household Vehicle Usage in Lakeside
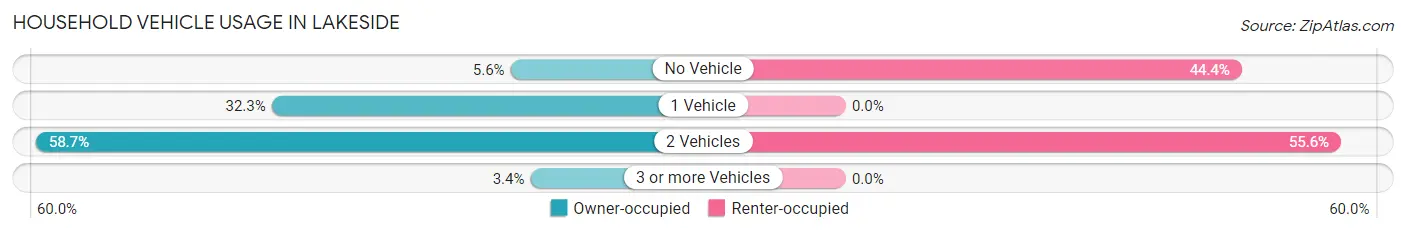
| Vehicles per Household | Owner-occupied | Renter-occupied |
| No Vehicle | 15 (5.6%) | 20 (44.4%) |
| 1 Vehicle | 87 (32.3%) | 0 (0.0%) |
| 2 Vehicles | 158 (58.7%) | 25 (55.6%) |
| 3 or more Vehicles | 9 (3.4%) | 0 (0.0%) |
| Total | 269 (100.0%) | 45 (100.0%) |
Real Estate & Mortgages in Lakeside
Real Estate and Mortgage Overview in Lakeside
| Characteristic | Without Mortgage | With Mortgage |
| Housing Units | 177 | 92 |
| Median Property Value | $319,800 | $0 |
| Median Household Income | $83,625 | $13 |
| Monthly Housing Costs | $566 | $0 |
| Real Estate Taxes | $3,427 | $0 |
Property Value by Mortgage Status in Lakeside
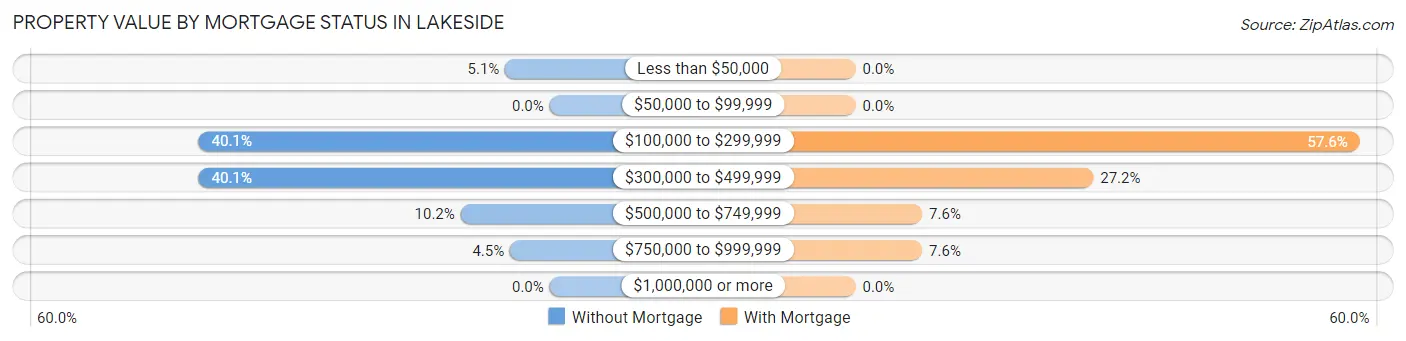
| Property Value | Without Mortgage | With Mortgage |
| Less than $50,000 | 9 (5.1%) | 0 (0.0%) |
| $50,000 to $99,999 | 0 (0.0%) | 0 (0.0%) |
| $100,000 to $299,999 | 71 (40.1%) | 53 (57.6%) |
| $300,000 to $499,999 | 71 (40.1%) | 25 (27.2%) |
| $500,000 to $749,999 | 18 (10.2%) | 7 (7.6%) |
| $750,000 to $999,999 | 8 (4.5%) | 7 (7.6%) |
| $1,000,000 or more | 0 (0.0%) | 0 (0.0%) |
| Total | 177 (100.0%) | 92 (100.0%) |
Household Income by Mortgage Status in Lakeside
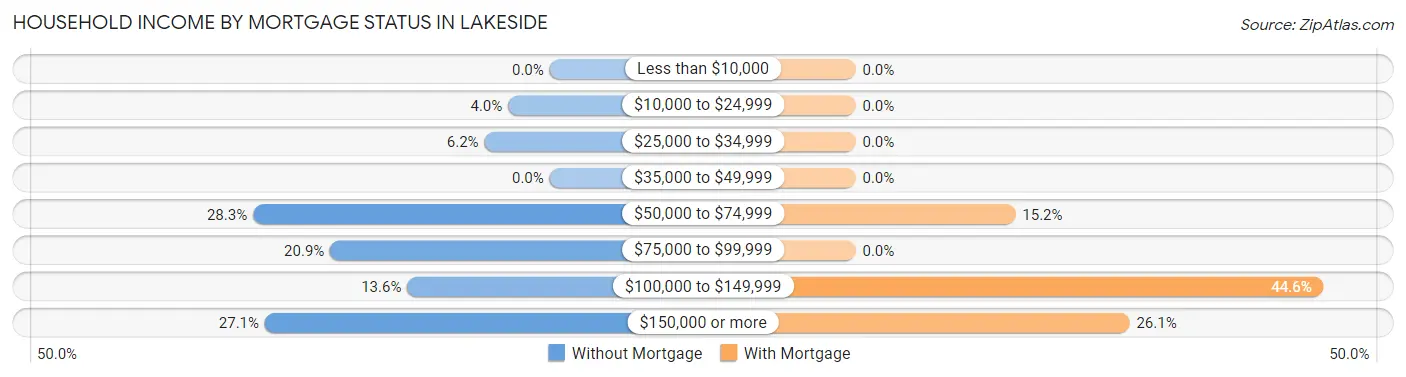
| Household Income | Without Mortgage | With Mortgage |
| Less than $10,000 | 0 (0.0%) | 0 (0.0%) |
| $10,000 to $24,999 | 7 (4.0%) | 0 (0.0%) |
| $25,000 to $34,999 | 11 (6.2%) | 0 (0.0%) |
| $35,000 to $49,999 | 0 (0.0%) | 0 (0.0%) |
| $50,000 to $74,999 | 50 (28.2%) | 14 (15.2%) |
| $75,000 to $99,999 | 37 (20.9%) | 0 (0.0%) |
| $100,000 to $149,999 | 24 (13.6%) | 41 (44.6%) |
| $150,000 or more | 48 (27.1%) | 24 (26.1%) |
| Total | 177 (100.0%) | 92 (100.0%) |
Property Value to Household Income Ratio in Lakeside
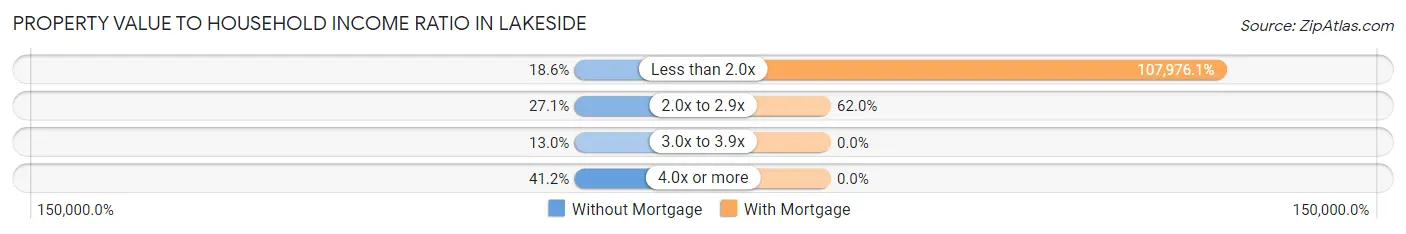
| Value-to-Income Ratio | Without Mortgage | With Mortgage |
| Less than 2.0x | 33 (18.6%) | 99,338 (107,976.1%) |
| 2.0x to 2.9x | 48 (27.1%) | 57 (62.0%) |
| 3.0x to 3.9x | 23 (13.0%) | 0 (0.0%) |
| 4.0x or more | 73 (41.2%) | 0 (0.0%) |
| Total | 177 (100.0%) | 92 (100.0%) |
Real Estate Taxes by Mortgage Status in Lakeside
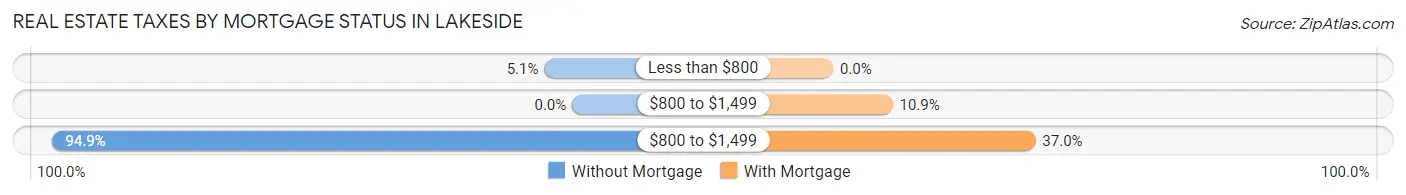
| Property Taxes | Without Mortgage | With Mortgage |
| Less than $800 | 9 (5.1%) | 0 (0.0%) |
| $800 to $1,499 | 0 (0.0%) | 10 (10.9%) |
| $800 to $1,499 | 168 (94.9%) | 34 (37.0%) |
| Total | 177 (100.0%) | 92 (100.0%) |
Health & Disability in Lakeside
Health Insurance Coverage by Age in Lakeside
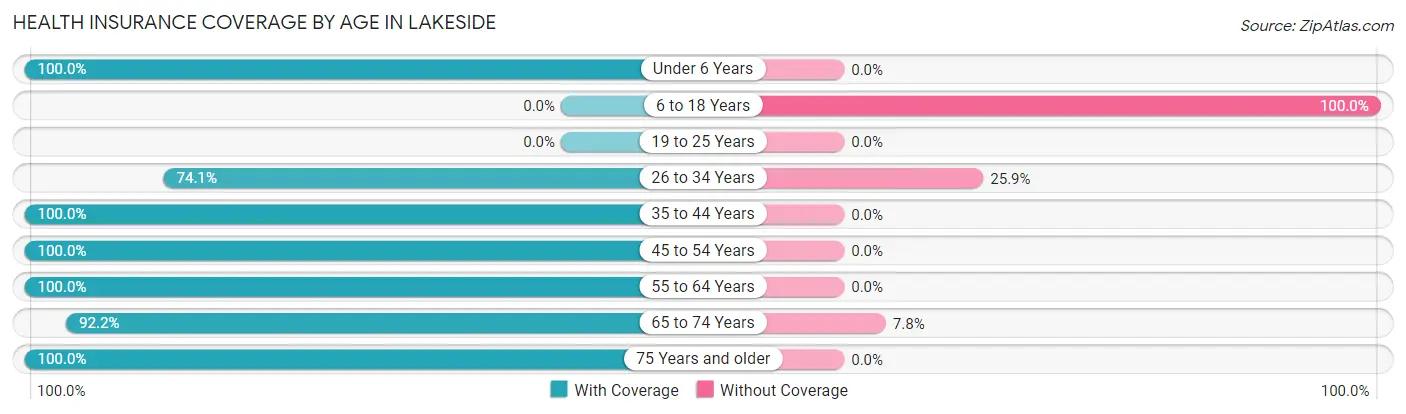
| Age Bracket | With Coverage | Without Coverage |
| Under 6 Years | 16 (100.0%) | 0 (0.0%) |
| 6 to 18 Years | 0 (0.0%) | 12 (100.0%) |
| 19 to 25 Years | 0 (0.0%) | 0 (0.0%) |
| 26 to 34 Years | 20 (74.1%) | 7 (25.9%) |
| 35 to 44 Years | 43 (100.0%) | 0 (0.0%) |
| 45 to 54 Years | 40 (100.0%) | 0 (0.0%) |
| 55 to 64 Years | 102 (100.0%) | 0 (0.0%) |
| 65 to 74 Years | 202 (92.2%) | 17 (7.8%) |
| 75 Years and older | 107 (100.0%) | 0 (0.0%) |
| Total | 530 (93.6%) | 36 (6.4%) |
Health Insurance Coverage by Citizenship Status in Lakeside
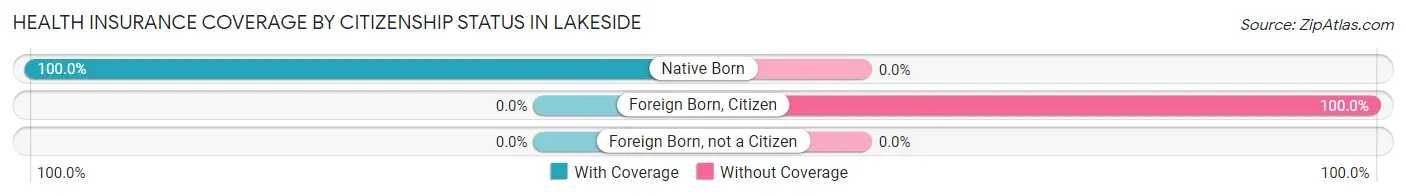
| Citizenship Status | With Coverage | Without Coverage |
| Native Born | 16 (100.0%) | 0 (0.0%) |
| Foreign Born, Citizen | 0 (0.0%) | 12 (100.0%) |
| Foreign Born, not a Citizen | 0 (0.0%) | 0 (0.0%) |
Health Insurance Coverage by Household Income in Lakeside
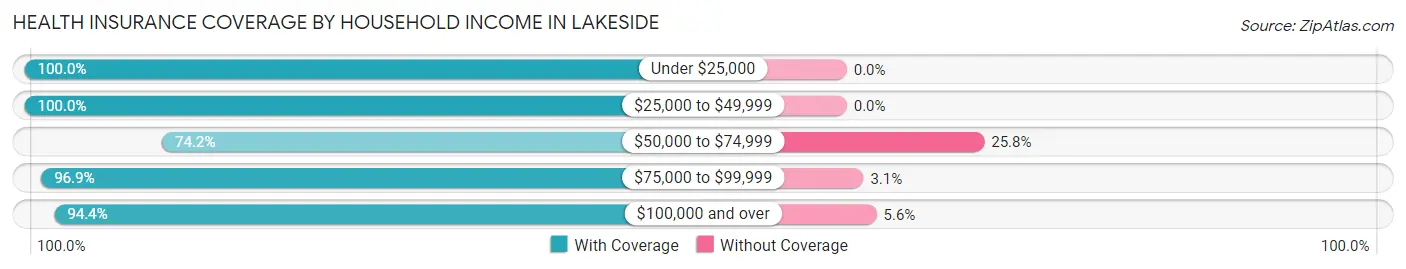
| Household Income | With Coverage | Without Coverage |
| Under $25,000 | 27 (100.0%) | 0 (0.0%) |
| $25,000 to $49,999 | 34 (100.0%) | 0 (0.0%) |
| $50,000 to $74,999 | 49 (74.2%) | 17 (25.8%) |
| $75,000 to $99,999 | 217 (96.9%) | 7 (3.1%) |
| $100,000 and over | 203 (94.4%) | 12 (5.6%) |
Public vs Private Health Insurance Coverage by Age in Lakeside
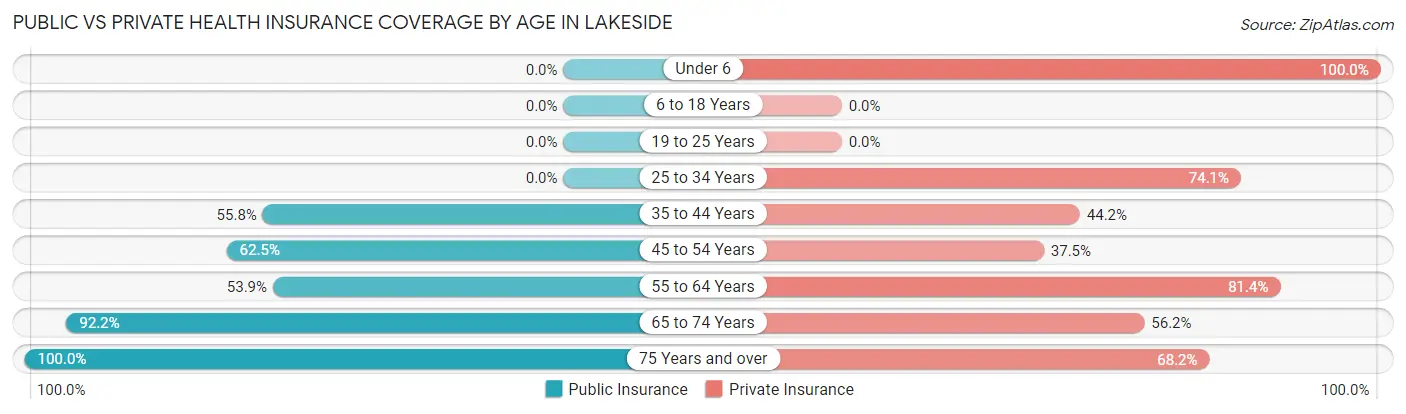
| Age Bracket | Public Insurance | Private Insurance |
| Under 6 | 0 (0.0%) | 16 (100.0%) |
| 6 to 18 Years | 0 (0.0%) | 0 (0.0%) |
| 19 to 25 Years | 0 (0.0%) | 0 (0.0%) |
| 25 to 34 Years | 0 (0.0%) | 20 (74.1%) |
| 35 to 44 Years | 24 (55.8%) | 19 (44.2%) |
| 45 to 54 Years | 25 (62.5%) | 15 (37.5%) |
| 55 to 64 Years | 55 (53.9%) | 83 (81.4%) |
| 65 to 74 Years | 202 (92.2%) | 123 (56.2%) |
| 75 Years and over | 107 (100.0%) | 73 (68.2%) |
| Total | 413 (73.0%) | 349 (61.7%) |
Disability Status by Sex by Age in Lakeside
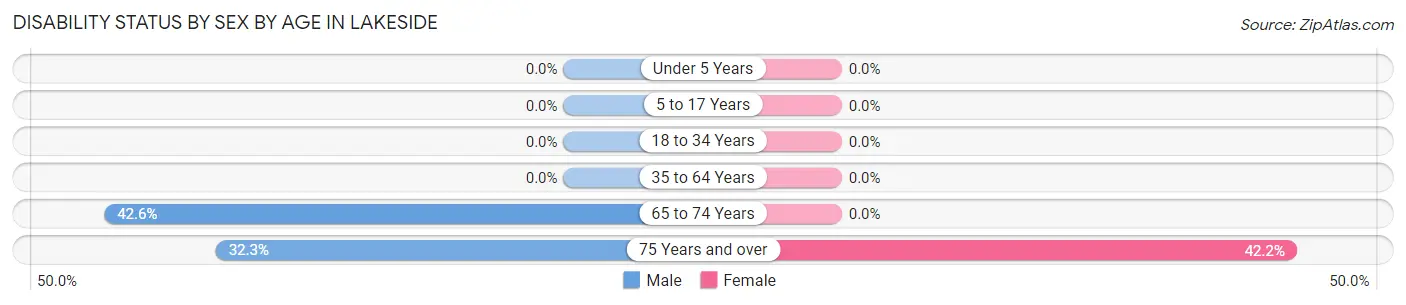
| Age Bracket | Male | Female |
| Under 5 Years | 0 (0.0%) | 0 (0.0%) |
| 5 to 17 Years | 0 (0.0%) | 0 (0.0%) |
| 18 to 34 Years | 0 (0.0%) | 0 (0.0%) |
| 35 to 64 Years | 0 (0.0%) | 0 (0.0%) |
| 65 to 74 Years | 49 (42.6%) | 0 (0.0%) |
| 75 Years and over | 20 (32.3%) | 19 (42.2%) |
Disability Class by Sex by Age in Lakeside
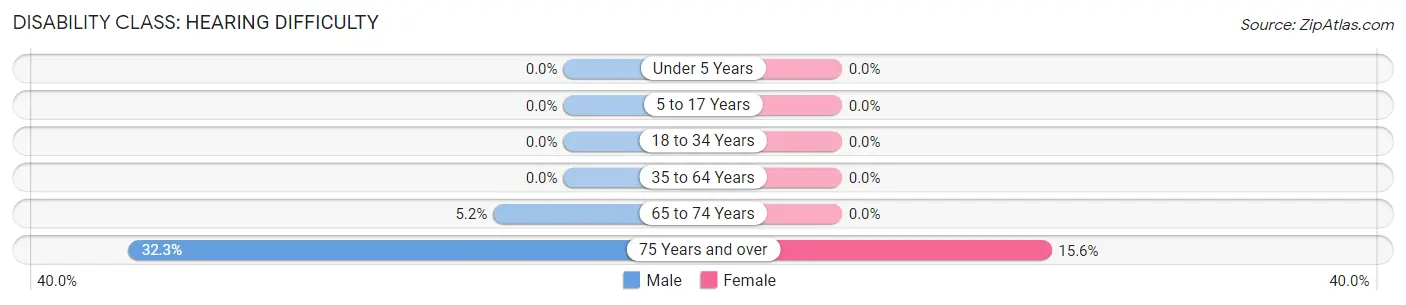
Disability Class: Hearing Difficulty
| Age Bracket | Male | Female |
| Under 5 Years | 0 (0.0%) | 0 (0.0%) |
| 5 to 17 Years | 0 (0.0%) | 0 (0.0%) |
| 18 to 34 Years | 0 (0.0%) | 0 (0.0%) |
| 35 to 64 Years | 0 (0.0%) | 0 (0.0%) |
| 65 to 74 Years | 6 (5.2%) | 0 (0.0%) |
| 75 Years and over | 20 (32.3%) | 7 (15.6%) |
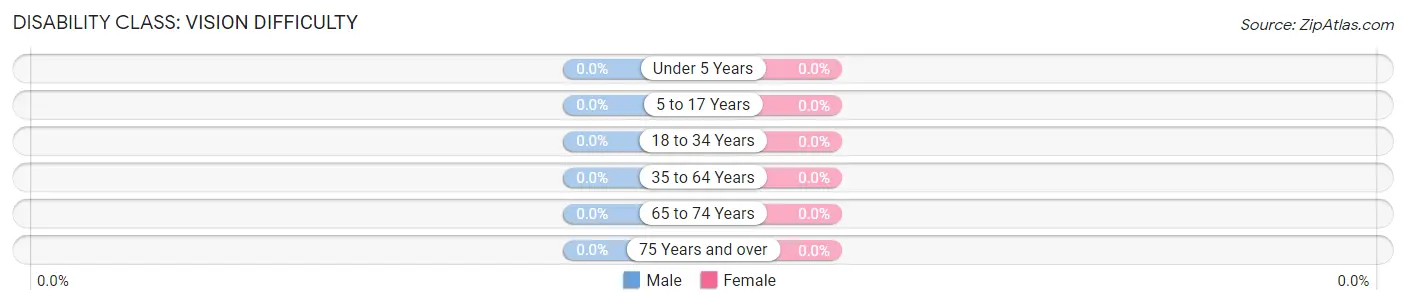
Disability Class: Vision Difficulty
| Age Bracket | Male | Female |
| Under 5 Years | 0 (0.0%) | 0 (0.0%) |
| 5 to 17 Years | 0 (0.0%) | 0 (0.0%) |
| 18 to 34 Years | 0 (0.0%) | 0 (0.0%) |
| 35 to 64 Years | 0 (0.0%) | 0 (0.0%) |
| 65 to 74 Years | 0 (0.0%) | 0 (0.0%) |
| 75 Years and over | 0 (0.0%) | 0 (0.0%) |
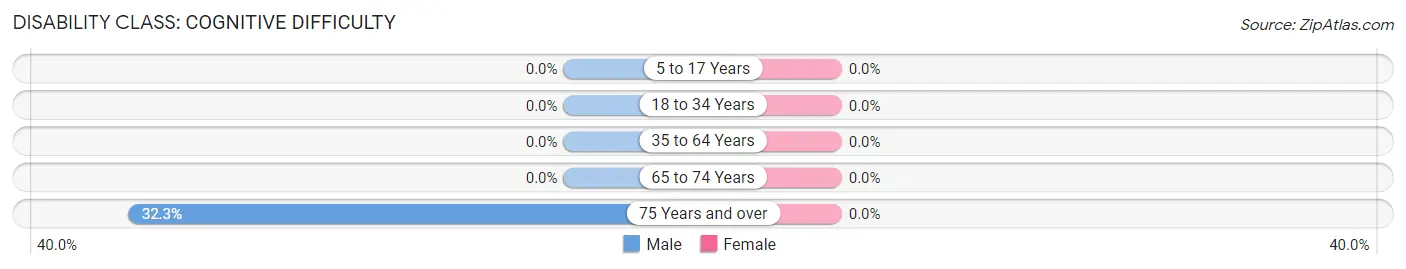
Disability Class: Cognitive Difficulty
| Age Bracket | Male | Female |
| 5 to 17 Years | 0 (0.0%) | 0 (0.0%) |
| 18 to 34 Years | 0 (0.0%) | 0 (0.0%) |
| 35 to 64 Years | 0 (0.0%) | 0 (0.0%) |
| 65 to 74 Years | 0 (0.0%) | 0 (0.0%) |
| 75 Years and over | 20 (32.3%) | 0 (0.0%) |
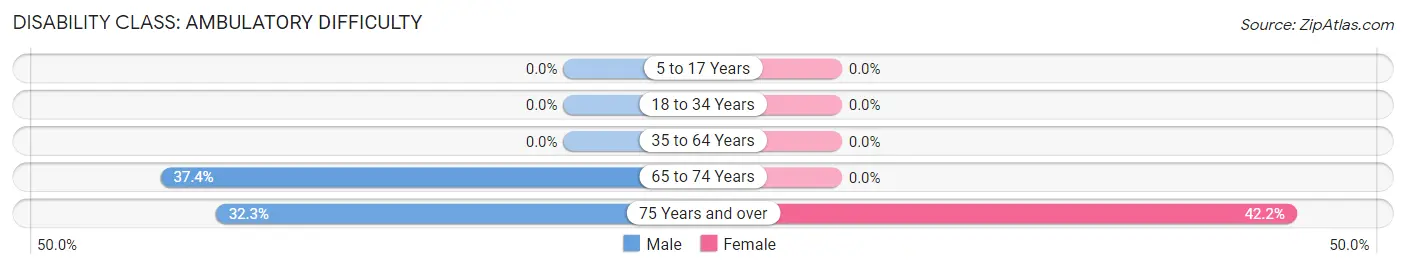
Disability Class: Ambulatory Difficulty
| Age Bracket | Male | Female |
| 5 to 17 Years | 0 (0.0%) | 0 (0.0%) |
| 18 to 34 Years | 0 (0.0%) | 0 (0.0%) |
| 35 to 64 Years | 0 (0.0%) | 0 (0.0%) |
| 65 to 74 Years | 43 (37.4%) | 0 (0.0%) |
| 75 Years and over | 20 (32.3%) | 19 (42.2%) |
Disability Class: Self-Care Difficulty
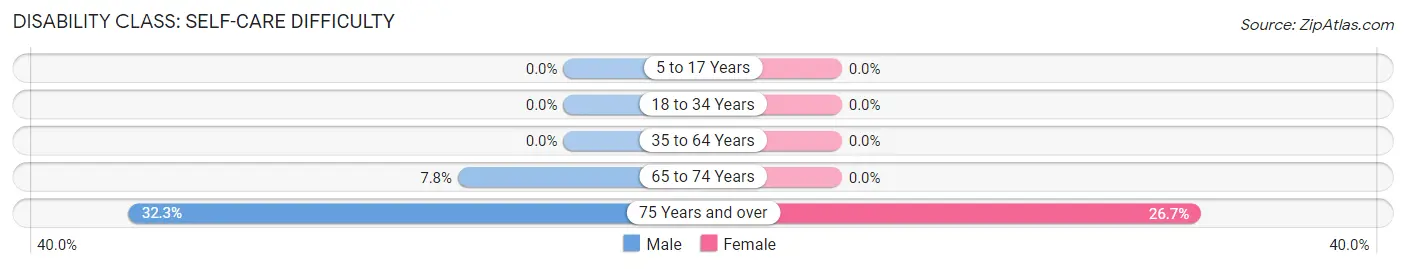
| Age Bracket | Male | Female |
| 5 to 17 Years | 0 (0.0%) | 0 (0.0%) |
| 18 to 34 Years | 0 (0.0%) | 0 (0.0%) |
| 35 to 64 Years | 0 (0.0%) | 0 (0.0%) |
| 65 to 74 Years | 9 (7.8%) | 0 (0.0%) |
| 75 Years and over | 20 (32.3%) | 12 (26.7%) |
Technology Access in Lakeside
Computing Device Access in Lakeside
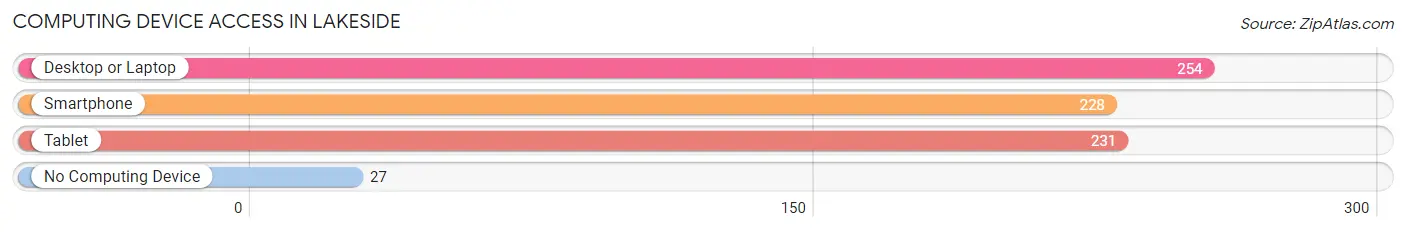
| Device Type | # Households | % Households |
| Desktop or Laptop | 254 | 80.9% |
| Smartphone | 228 | 72.6% |
| Tablet | 231 | 73.6% |
| No Computing Device | 27 | 8.6% |
| Total | 314 | 100.0% |
Internet Access in Lakeside
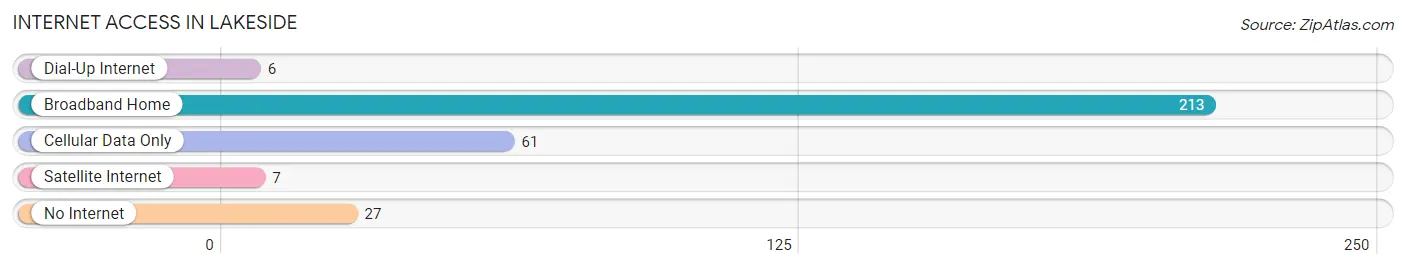
| Internet Type | # Households | % Households |
| Dial-Up Internet | 6 | 1.9% |
| Broadband Home | 213 | 67.8% |
| Cellular Data Only | 61 | 19.4% |
| Satellite Internet | 7 | 2.2% |
| No Internet | 27 | 8.6% |
| Total | 314 | 100.0% |
Lakeside Summary
Lakeside, Ohio is a small village located in Ottawa County, Ohio. It is situated on the shores of Lake Erie, and is part of the Marblehead Peninsula. The village has a population of approximately 1,000 people, and is a popular tourist destination due to its proximity to the lake.
History
Lakeside was founded in 1873 by a group of settlers from the nearby town of Marblehead. The settlers were looking for a place to build a summer resort, and chose the area due to its beautiful views of Lake Erie. The village was originally named “Lakeside Park”, and was incorporated in 1876.
The village quickly grew in popularity as a summer resort, and by the early 1900s, it had become a popular destination for wealthy families from Cleveland and other nearby cities. The village was home to several large hotels, and was known for its beautiful gardens and parks.
In the 1920s, the village began to attract a more diverse group of visitors, including African Americans, who were drawn to the area for its natural beauty and recreational opportunities. The village was also home to a number of summer camps, which attracted children from all over the country.
In the 1950s, the village began to decline in popularity as a summer resort, and many of the hotels and other businesses closed. However, the village remained a popular destination for tourists, and in the 1970s, it was designated as a National Historic Landmark.
Geography
Lakeside is located on the Marblehead Peninsula, which is a narrow strip of land that juts out into Lake Erie. The village is situated on the eastern shore of the lake, and is surrounded by the towns of Marblehead, Port Clinton, and Catawba Island.
The village is located in a temperate climate, and has an average temperature of around 50 degrees Fahrenheit. The area receives an average of 40 inches of precipitation each year, and is known for its mild winters and hot summers.
Economy
Lakeside’s economy is largely based on tourism, and the village is home to a number of hotels, restaurants, and other businesses that cater to visitors. The village is also home to a number of marinas, which attract boaters from all over the region.
In addition to tourism, the village is also home to a number of small businesses, including a grocery store, a hardware store, and a few other retail outlets. The village is also home to a number of art galleries, which attract visitors from all over the region.
Demographics
As of the 2010 census, the population of Lakeside was 1,000 people. The village is predominantly white, with approximately 95% of the population identifying as such. The remaining 5% of the population is made up of African Americans, Asians, and other ethnicities.
The median household income in Lakeside is $45,000, and the median home value is $150,000. The village has a low unemployment rate, and the majority of the population is employed in the tourism and service industries.
Conclusion
Lakeside, Ohio is a small village located on the shores of Lake Erie. The village has a long history as a summer resort, and is now a popular tourist destination due to its natural beauty and recreational opportunities. The village has a predominantly white population, and is home to a number of small businesses and art galleries. The village has a low unemployment rate, and the majority of the population is employed in the tourism and service industries.
Common Questions
What is Per Capita Income in Lakeside?
Per Capita income in Lakeside is $78,443.
What is the Median Family Income in Lakeside?
Median Family Income in Lakeside is $98,676.
What is the Median Household income in Lakeside?
Median Household Income in Lakeside is $84,417.
What is Income or Wage Gap in Lakeside?
Income or Wage Gap in Lakeside is 52.0%.
Women in Lakeside earn 48.0 cents for every dollar earned by a man.
What is Inequality or Gini Index in Lakeside?
Inequality or Gini Index in Lakeside is 0.54.
What is the Total Population of Lakeside?
Total Population of Lakeside is 588.
What is the Total Male Population of Lakeside?
Total Male Population of Lakeside is 298.
What is the Total Female Population of Lakeside?
Total Female Population of Lakeside is 290.
What is the Ratio of Males per 100 Females in Lakeside?
There are 102.76 Males per 100 Females in Lakeside.
What is the Ratio of Females per 100 Males in Lakeside?
There are 97.32 Females per 100 Males in Lakeside.
What is the Median Population Age in Lakeside?
Median Population Age in Lakeside is 69.4 Years.
What is the Average Family Size in Lakeside
Average Family Size in Lakeside is 2.2 People.
What is the Average Household Size in Lakeside
Average Household Size in Lakeside is 1.8 People.
How Large is the Labor Force in Lakeside?
There are 140 People in the Labor Forcein in Lakeside.
What is the Percentage of People in the Labor Force in Lakeside?
25.0% of People are in the Labor Force in Lakeside.
What is the Unemployment Rate in Lakeside?
Unemployment Rate in Lakeside is 5.0%.