Waterville, OH Map & Demographics
Waterville Map
Waterville Overview
$48,157
PER CAPITA INCOME
$109,322
AVG FAMILY INCOME
$101,473
AVG HOUSEHOLD INCOME
41.2%
WAGE / INCOME GAP [ % ]
58.8¢/ $1
WAGE / INCOME GAP [ $ ]
0.38
INEQUALITY / GINI INDEX
5,980
TOTAL POPULATION
3,028
MALE POPULATION
2,952
FEMALE POPULATION
102.57
MALES / 100 FEMALES
97.49
FEMALES / 100 MALES
40.9
MEDIAN AGE
3.2
AVG FAMILY SIZE
2.5
AVG HOUSEHOLD SIZE
2,964
LABOR FORCE [ PEOPLE ]
63.7%
PERCENT IN LABOR FORCE
4.5%
UNEMPLOYMENT RATE
Waterville Zip Codes
Income in Waterville
Income Overview in Waterville
Per Capita Income in Waterville is $48,157, while median incomes of families and households are $109,322 and $101,473 respectively.
| Characteristic | Number | Measure |
| Per Capita Income | 5,980 | $48,157 |
| Median Family Income | 1,512 | $109,322 |
| Mean Family Income | 1,512 | $128,306 |
| Median Household Income | 2,363 | $101,473 |
| Mean Household Income | 2,363 | $118,111 |
| Income Deficit | 1,512 | $0 |
| Wage / Income Gap (%) | 5,980 | 41.17% |
| Wage / Income Gap ($) | 5,980 | 58.83¢ per $1 |
| Gini / Inequality Index | 5,980 | 0.38 |
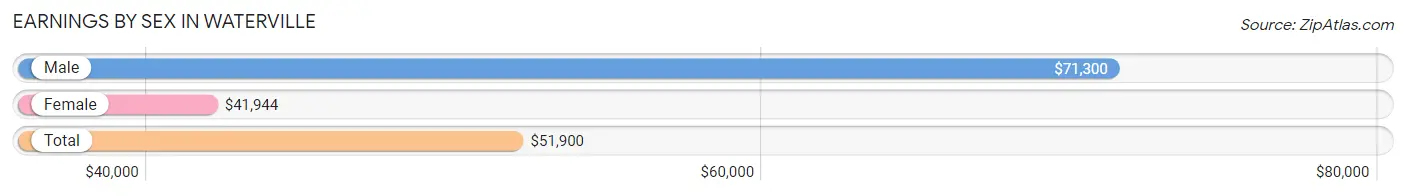
Earnings by Sex in Waterville
Average Earnings in Waterville are $51,900, $71,300 for men and $41,944 for women, a difference of 41.2%.
| Sex | Number | Average Earnings |
| Male | 1,632 (52.5%) | $71,300 |
| Female | 1,478 (47.5%) | $41,944 |
| Total | 3,110 (100.0%) | $51,900 |
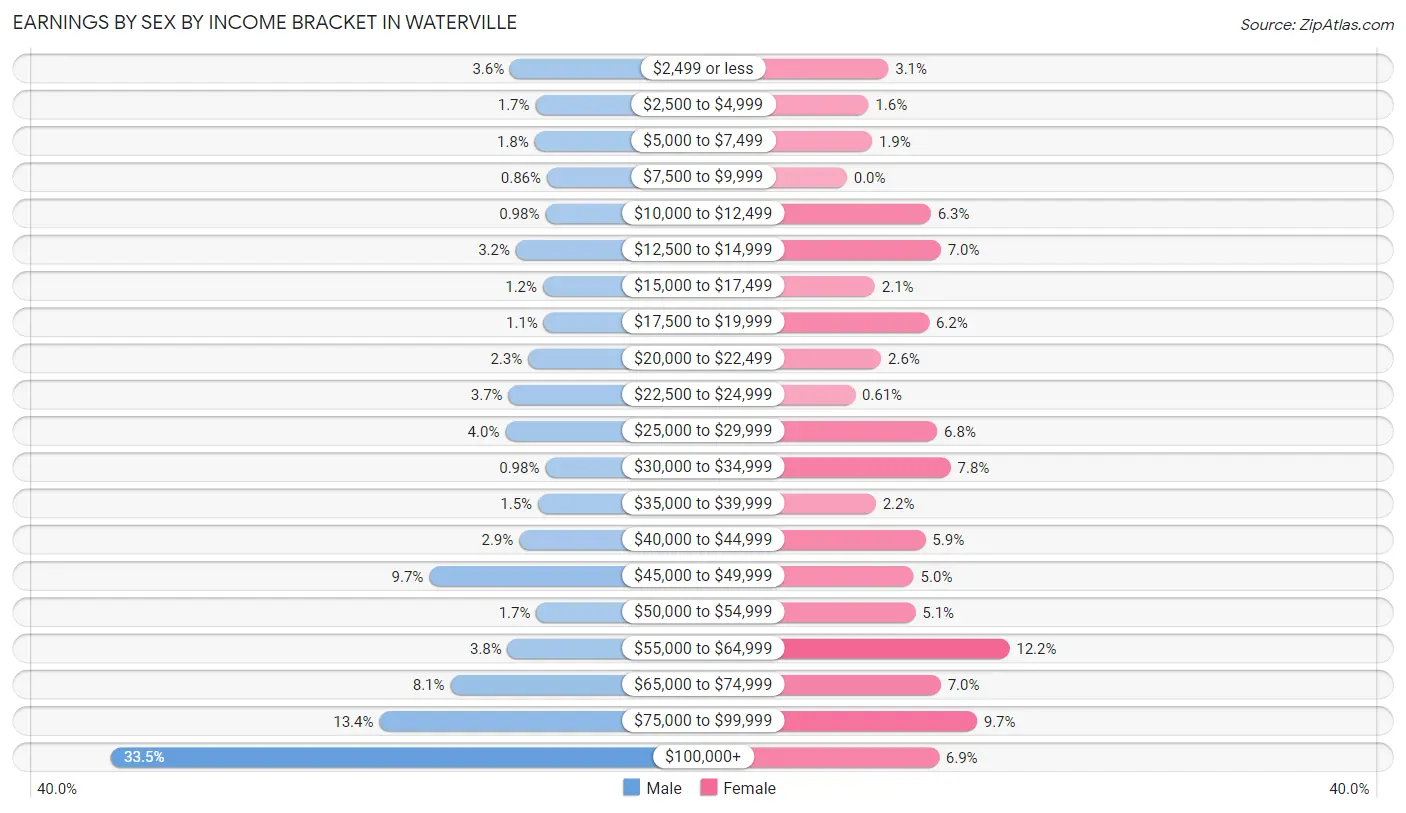
Earnings by Sex by Income Bracket in Waterville
The most common earnings brackets in Waterville are $100,000+ for men (547 | 33.5%) and $55,000 to $64,999 for women (180 | 12.2%).
| Income | Male | Female |
| $2,499 or less | 59 (3.6%) | 46 (3.1%) |
| $2,500 to $4,999 | 28 (1.7%) | 24 (1.6%) |
| $5,000 to $7,499 | 29 (1.8%) | 28 (1.9%) |
| $7,500 to $9,999 | 14 (0.9%) | 0 (0.0%) |
| $10,000 to $12,499 | 16 (1.0%) | 93 (6.3%) |
| $12,500 to $14,999 | 52 (3.2%) | 104 (7.0%) |
| $15,000 to $17,499 | 19 (1.2%) | 31 (2.1%) |
| $17,500 to $19,999 | 18 (1.1%) | 91 (6.2%) |
| $20,000 to $22,499 | 37 (2.3%) | 38 (2.6%) |
| $22,500 to $24,999 | 61 (3.7%) | 9 (0.6%) |
| $25,000 to $29,999 | 65 (4.0%) | 100 (6.8%) |
| $30,000 to $34,999 | 16 (1.0%) | 115 (7.8%) |
| $35,000 to $39,999 | 25 (1.5%) | 32 (2.2%) |
| $40,000 to $44,999 | 48 (2.9%) | 87 (5.9%) |
| $45,000 to $49,999 | 158 (9.7%) | 74 (5.0%) |
| $50,000 to $54,999 | 27 (1.7%) | 76 (5.1%) |
| $55,000 to $64,999 | 62 (3.8%) | 180 (12.2%) |
| $65,000 to $74,999 | 132 (8.1%) | 104 (7.0%) |
| $75,000 to $99,999 | 219 (13.4%) | 144 (9.7%) |
| $100,000+ | 547 (33.5%) | 102 (6.9%) |
| Total | 1,632 (100.0%) | 1,478 (100.0%) |
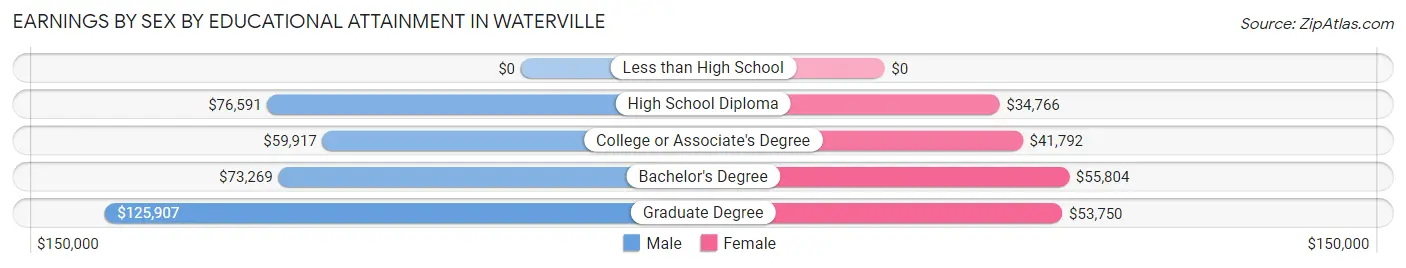
Earnings by Sex by Educational Attainment in Waterville
Average earnings in Waterville are $77,594 for men and $47,783 for women, a difference of 38.4%. Men with an educational attainment of graduate degree enjoy the highest average annual earnings of $125,907, while those with college or associate's degree education earn the least with $59,917. Women with an educational attainment of bachelor's degree earn the most with the average annual earnings of $55,804, while those with high school diploma education have the smallest earnings of $34,766.
| Educational Attainment | Male Income | Female Income |
| Less than High School | - | - |
| High School Diploma | $76,591 | $34,766 |
| College or Associate's Degree | $59,917 | $41,792 |
| Bachelor's Degree | $73,269 | $55,804 |
| Graduate Degree | $125,907 | $53,750 |
| Total | $77,594 | $47,783 |
Family Income in Waterville
Family Income Brackets in Waterville
According to the Waterville family income data, there are 488 families falling into the $100,000 to $149,999 income range, which is the most common income bracket and makes up 32.3% of all families.
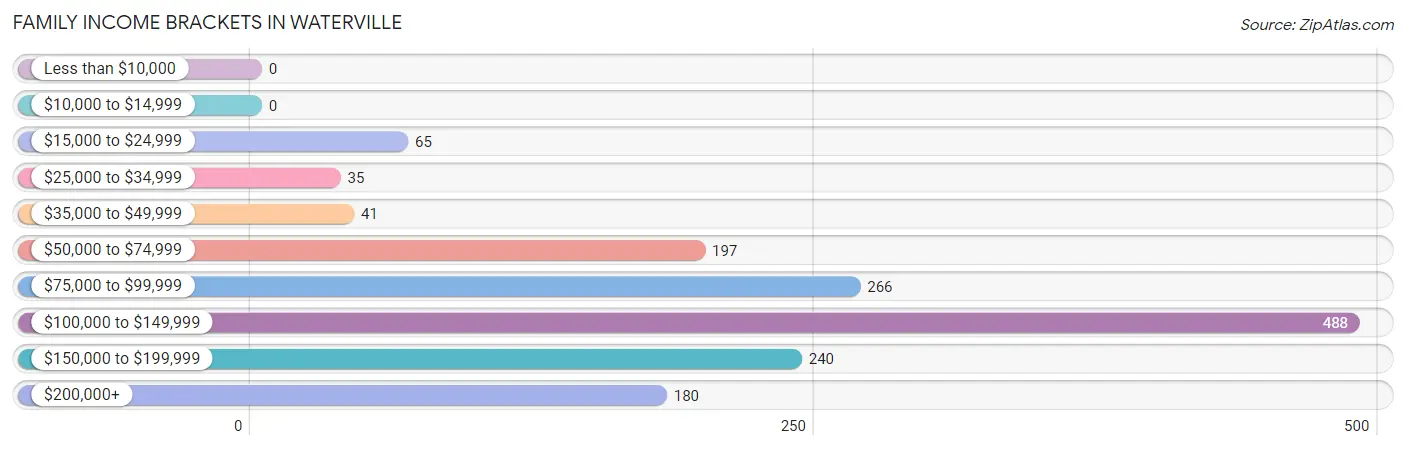
| Income Bracket | # Families | % Families |
| Less than $10,000 | 0 | 0.0% |
| $10,000 to $14,999 | 0 | 0.0% |
| $15,000 to $24,999 | 65 | 4.3% |
| $25,000 to $34,999 | 35 | 2.3% |
| $35,000 to $49,999 | 41 | 2.7% |
| $50,000 to $74,999 | 197 | 13.0% |
| $75,000 to $99,999 | 266 | 17.6% |
| $100,000 to $149,999 | 488 | 32.3% |
| $150,000 to $199,999 | 240 | 15.9% |
| $200,000+ | 180 | 11.9% |
Family Income by Famaliy Size in Waterville
4-person families (290 | 19.2%) account for the highest median family income in Waterville with $142,045 per family, while 2-person families (667 | 44.1%) have the highest median income of $42,210 per family member.
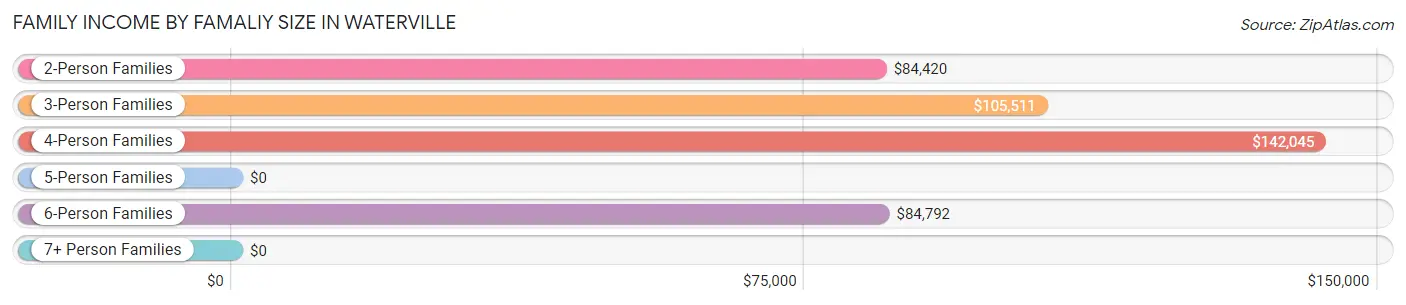
| Income Bracket | # Families | Median Income |
| 2-Person Families | 667 (44.1%) | $84,420 |
| 3-Person Families | 385 (25.5%) | $105,511 |
| 4-Person Families | 290 (19.2%) | $142,045 |
| 5-Person Families | 112 (7.4%) | $0 |
| 6-Person Families | 58 (3.8%) | $84,792 |
| 7+ Person Families | 0 (0.0%) | $0 |
| Total | 1,512 (100.0%) | $109,322 |
Family Income by Number of Earners in Waterville
The median family income in Waterville is $109,322, with families comprising 3+ earners (206) having the highest median family income of $181,923, while families with no earners (174) have the lowest median family income of $55,119, accounting for 13.6% and 11.5% of families, respectively.
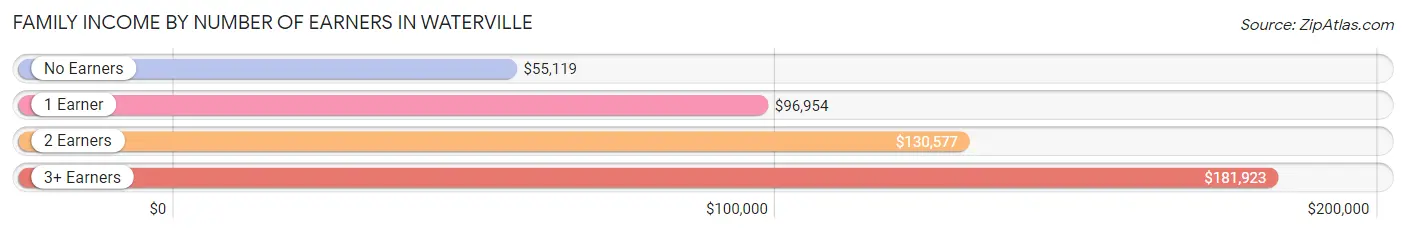
| Number of Earners | # Families | Median Income |
| No Earners | 174 (11.5%) | $55,119 |
| 1 Earner | 576 (38.1%) | $96,954 |
| 2 Earners | 556 (36.8%) | $130,577 |
| 3+ Earners | 206 (13.6%) | $181,923 |
| Total | 1,512 (100.0%) | $109,322 |
Household Income in Waterville
Household Income Brackets in Waterville
With 636 households falling in the category, the $100,000 to $149,999 income range is the most frequent in Waterville, accounting for 26.9% of all households. In contrast, only 17 households (0.7%) fall into the $10,000 to $14,999 income bracket, making it the least populous group.
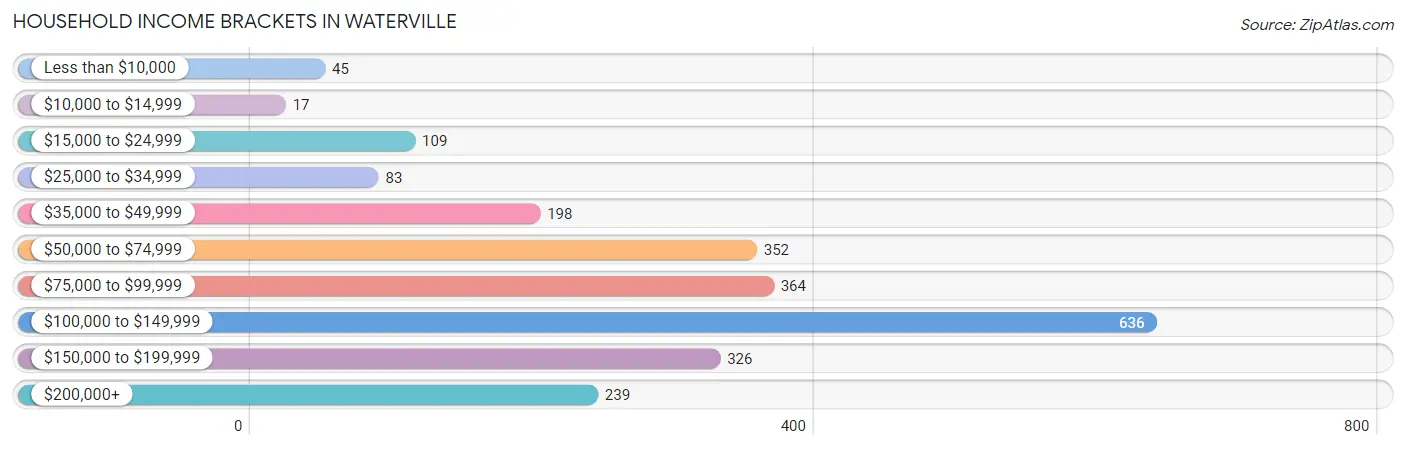
| Income Bracket | # Households | % Households |
| Less than $10,000 | 45 | 1.9% |
| $10,000 to $14,999 | 17 | 0.7% |
| $15,000 to $24,999 | 109 | 4.6% |
| $25,000 to $34,999 | 83 | 3.5% |
| $35,000 to $49,999 | 198 | 8.4% |
| $50,000 to $74,999 | 352 | 14.9% |
| $75,000 to $99,999 | 364 | 15.4% |
| $100,000 to $149,999 | 636 | 26.9% |
| $150,000 to $199,999 | 326 | 13.8% |
| $200,000+ | 239 | 10.1% |
Household Income by Householder Age in Waterville
The median household income in Waterville is $101,473, with the highest median household income of $126,238 found in the 25 to 44 years age bracket for the primary householder. A total of 719 households (30.4%) fall into this category. Meanwhile, the 15 to 24 years age bracket for the primary householder has the lowest median household income of $0, with 9 households (0.4%) in this group.
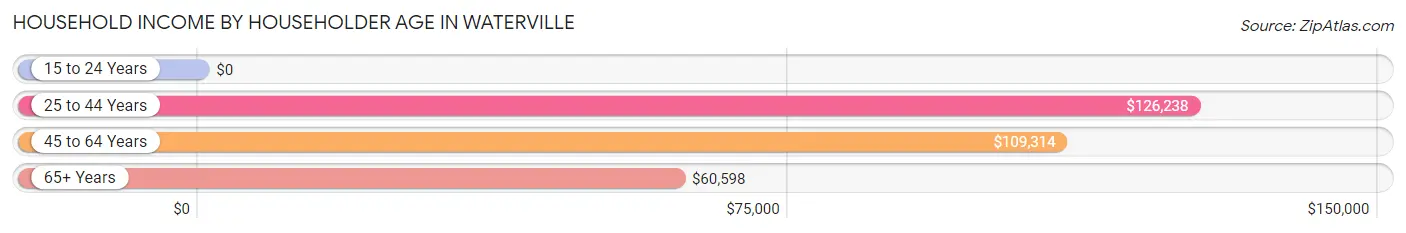
| Income Bracket | # Households | Median Income |
| 15 to 24 Years | 9 (0.4%) | $0 |
| 25 to 44 Years | 719 (30.4%) | $126,238 |
| 45 to 64 Years | 864 (36.6%) | $109,314 |
| 65+ Years | 771 (32.6%) | $60,598 |
| Total | 2,363 (100.0%) | $101,473 |
Poverty in Waterville
Income Below Poverty by Sex and Age in Waterville
With 4.0% poverty level for males and 6.1% for females among the residents of Waterville, 15 year old males and 18 to 24 year old females are the most vulnerable to poverty, with 44 males (32.4%) and 51 females (30.9%) in their respective age groups living below the poverty level.
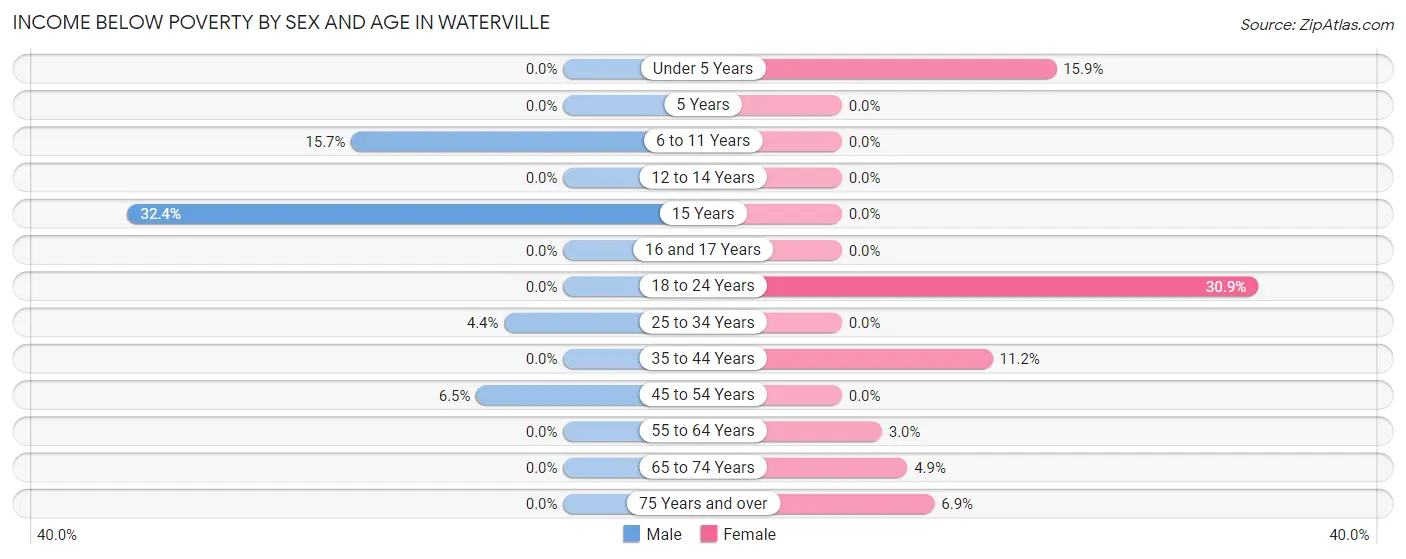
| Age Bracket | Male | Female |
| Under 5 Years | 0 (0.0%) | 32 (15.9%) |
| 5 Years | 0 (0.0%) | 0 (0.0%) |
| 6 to 11 Years | 34 (15.7%) | 0 (0.0%) |
| 12 to 14 Years | 0 (0.0%) | 0 (0.0%) |
| 15 Years | 44 (32.4%) | 0 (0.0%) |
| 16 and 17 Years | 0 (0.0%) | 0 (0.0%) |
| 18 to 24 Years | 0 (0.0%) | 51 (30.9%) |
| 25 to 34 Years | 16 (4.4%) | 0 (0.0%) |
| 35 to 44 Years | 0 (0.0%) | 41 (11.2%) |
| 45 to 54 Years | 23 (6.5%) | 0 (0.0%) |
| 55 to 64 Years | 0 (0.0%) | 16 (3.0%) |
| 65 to 74 Years | 0 (0.0%) | 17 (4.9%) |
| 75 Years and over | 0 (0.0%) | 20 (6.9%) |
| Total | 117 (4.0%) | 177 (6.1%) |
Income Above Poverty by Sex and Age in Waterville
According to the poverty statistics in Waterville, males aged under 5 years and females aged 5 years are the age groups that are most secure financially, with 100.0% of males and 100.0% of females in these age groups living above the poverty line.
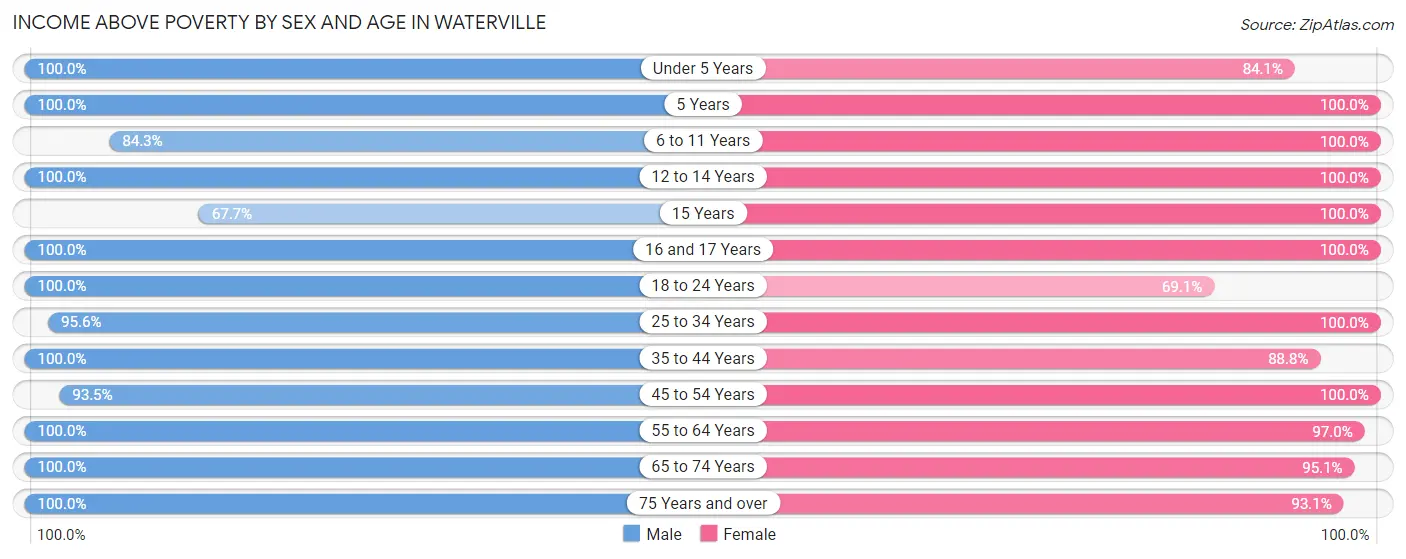
| Age Bracket | Male | Female |
| Under 5 Years | 149 (100.0%) | 169 (84.1%) |
| 5 Years | 22 (100.0%) | 81 (100.0%) |
| 6 to 11 Years | 182 (84.3%) | 150 (100.0%) |
| 12 to 14 Years | 214 (100.0%) | 141 (100.0%) |
| 15 Years | 92 (67.6%) | 17 (100.0%) |
| 16 and 17 Years | 182 (100.0%) | 26 (100.0%) |
| 18 to 24 Years | 87 (100.0%) | 114 (69.1%) |
| 25 to 34 Years | 349 (95.6%) | 309 (100.0%) |
| 35 to 44 Years | 390 (100.0%) | 325 (88.8%) |
| 45 to 54 Years | 333 (93.5%) | 249 (100.0%) |
| 55 to 64 Years | 356 (100.0%) | 522 (97.0%) |
| 65 to 74 Years | 290 (100.0%) | 333 (95.1%) |
| 75 Years and over | 202 (100.0%) | 271 (93.1%) |
| Total | 2,848 (96.1%) | 2,707 (93.9%) |
Income Below Poverty Among Married-Couple Families in Waterville
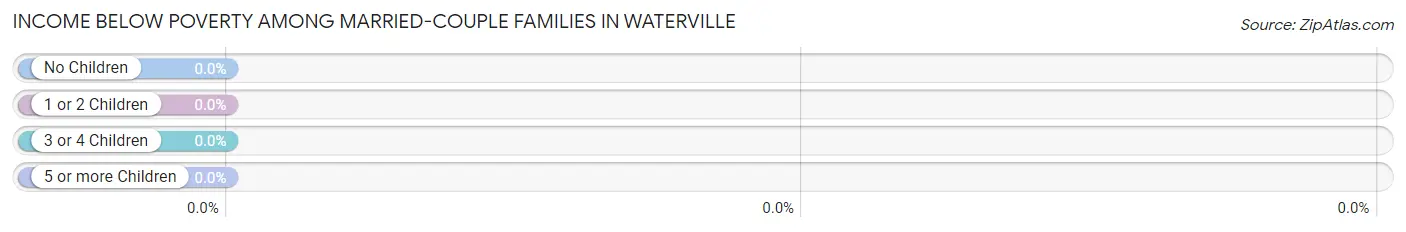
| Children | Above Poverty | Below Poverty |
| No Children | 676 (100.0%) | 0 (0.0%) |
| 1 or 2 Children | 373 (100.0%) | 0 (0.0%) |
| 3 or 4 Children | 156 (100.0%) | 0 (0.0%) |
| 5 or more Children | 0 (0.0%) | 0 (0.0%) |
| Total | 1,205 (100.0%) | 0 (0.0%) |
Income Below Poverty Among Single-Parent Households in Waterville
According to the poverty data in Waterville, 14.7% or 16 single-father households and 20.7% or 41 single-mother households are living below the poverty line. Among single-father households, those with 1 or 2 children have the highest poverty rate, with 16 households (100.0%) experiencing poverty. Likewise, among single-mother households, those with 1 or 2 children have the highest poverty rate, with 41 households (57.8%) falling below the poverty line.
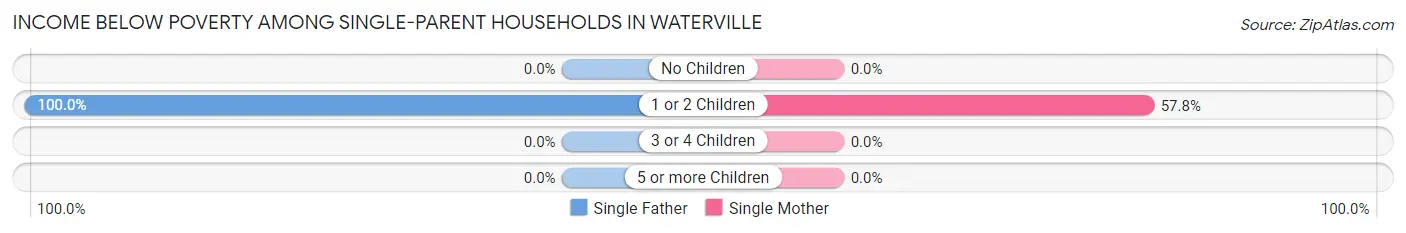
| Children | Single Father | Single Mother |
| No Children | 0 (0.0%) | 0 (0.0%) |
| 1 or 2 Children | 16 (100.0%) | 41 (57.8%) |
| 3 or 4 Children | 0 (0.0%) | 0 (0.0%) |
| 5 or more Children | 0 (0.0%) | 0 (0.0%) |
| Total | 16 (14.7%) | 41 (20.7%) |
Income Below Poverty Among Married-Couple vs Single-Parent Households in Waterville
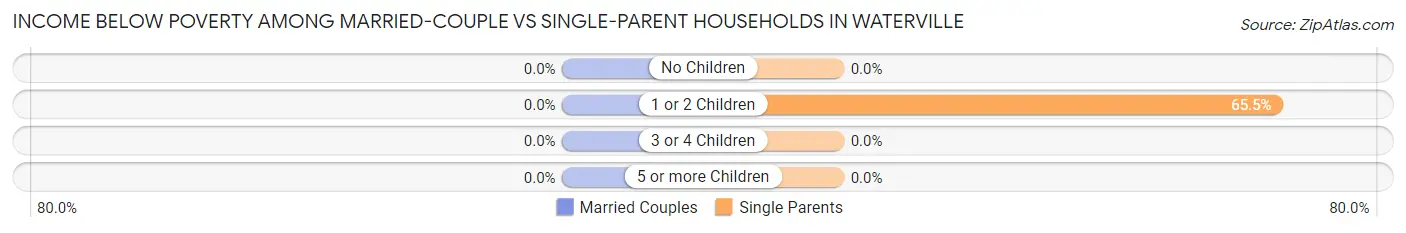
| Children | Married-Couple Families | Single-Parent Households |
| No Children | 0 (0.0%) | 0 (0.0%) |
| 1 or 2 Children | 0 (0.0%) | 57 (65.5%) |
| 3 or 4 Children | 0 (0.0%) | 0 (0.0%) |
| 5 or more Children | 0 (0.0%) | 0 (0.0%) |
| Total | 0 (0.0%) | 57 (18.6%) |
Race in Waterville
The most populous races in Waterville are White / Caucasian (5,174 | 86.5%), Two or more Races (589 | 9.9%), and Hispanic or Latino (451 | 7.5%).
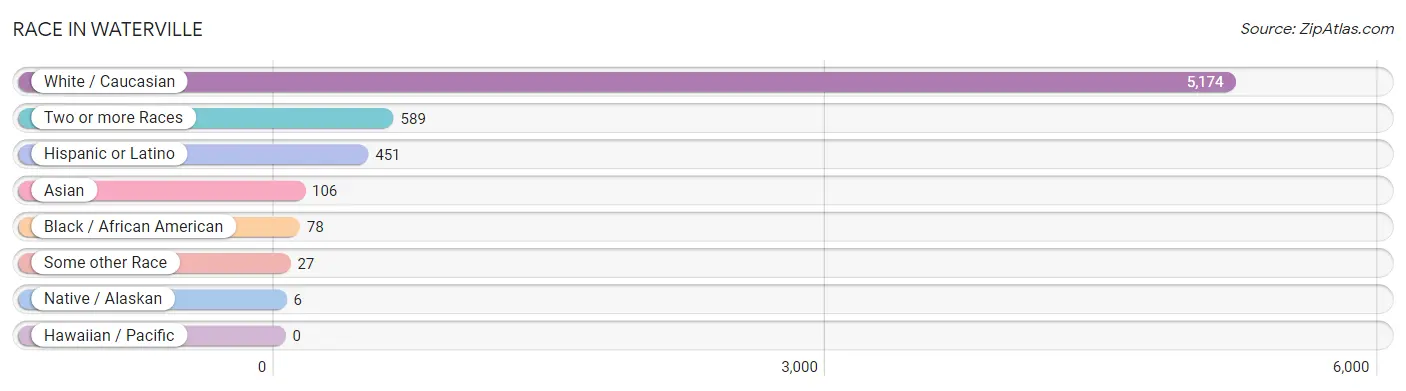
| Race | # Population | % Population |
| Asian | 106 | 1.8% |
| Black / African American | 78 | 1.3% |
| Hawaiian / Pacific | 0 | 0.0% |
| Hispanic or Latino | 451 | 7.5% |
| Native / Alaskan | 6 | 0.1% |
| White / Caucasian | 5,174 | 86.5% |
| Two or more Races | 589 | 9.9% |
| Some other Race | 27 | 0.4% |
| Total | 5,980 | 100.0% |
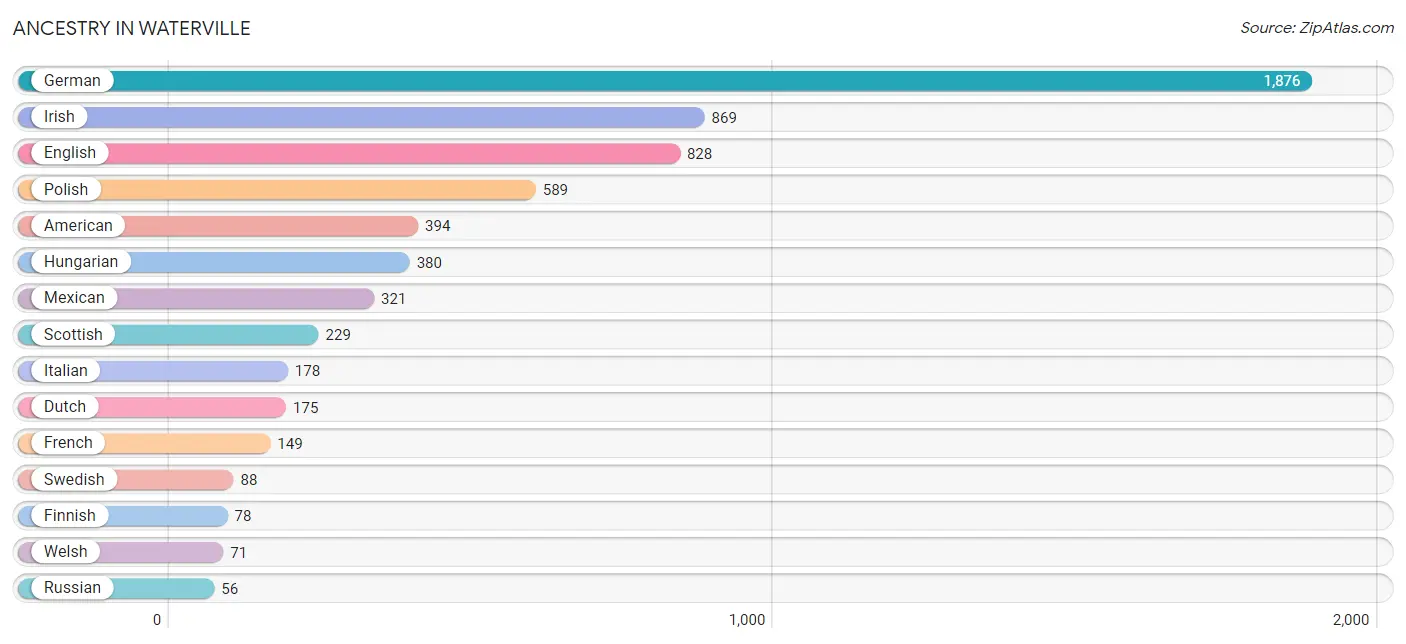
Ancestry in Waterville
The most populous ancestries reported in Waterville are German (1,876 | 31.4%), Irish (869 | 14.5%), English (828 | 13.9%), Polish (589 | 9.9%), and American (394 | 6.6%), together accounting for 76.2% of all Waterville residents.
| Ancestry | # Population | % Population |
| American | 394 | 6.6% |
| Arab | 27 | 0.4% |
| Bhutanese | 9 | 0.2% |
| British | 4 | 0.1% |
| Burmese | 34 | 0.6% |
| Cherokee | 3 | 0.1% |
| Colombian | 14 | 0.2% |
| Cuban | 40 | 0.7% |
| Czechoslovakian | 17 | 0.3% |
| Danish | 19 | 0.3% |
| Delaware | 7 | 0.1% |
| Dutch | 175 | 2.9% |
| Eastern European | 9 | 0.2% |
| English | 828 | 13.9% |
| Ethiopian | 43 | 0.7% |
| European | 33 | 0.5% |
| Finnish | 78 | 1.3% |
| French | 149 | 2.5% |
| German | 1,876 | 31.4% |
| Greek | 21 | 0.4% |
| Hungarian | 380 | 6.4% |
| Indian (Asian) | 15 | 0.3% |
| Irish | 869 | 14.5% |
| Italian | 178 | 3.0% |
| Korean | 42 | 0.7% |
| Lebanese | 27 | 0.4% |
| Lithuanian | 8 | 0.1% |
| Menominee | 3 | 0.1% |
| Mexican | 321 | 5.4% |
| Pennsylvania German | 11 | 0.2% |
| Peruvian | 7 | 0.1% |
| Polish | 589 | 9.9% |
| Potawatomi | 4 | 0.1% |
| Russian | 56 | 0.9% |
| Scotch-Irish | 22 | 0.4% |
| Scottish | 229 | 3.8% |
| Slovak | 45 | 0.7% |
| South American | 21 | 0.4% |
| Subsaharan African | 43 | 0.7% |
| Swedish | 88 | 1.5% |
| Ukrainian | 10 | 0.2% |
| Welsh | 71 | 1.2% | View All 42 Rows |
Immigrants in Waterville
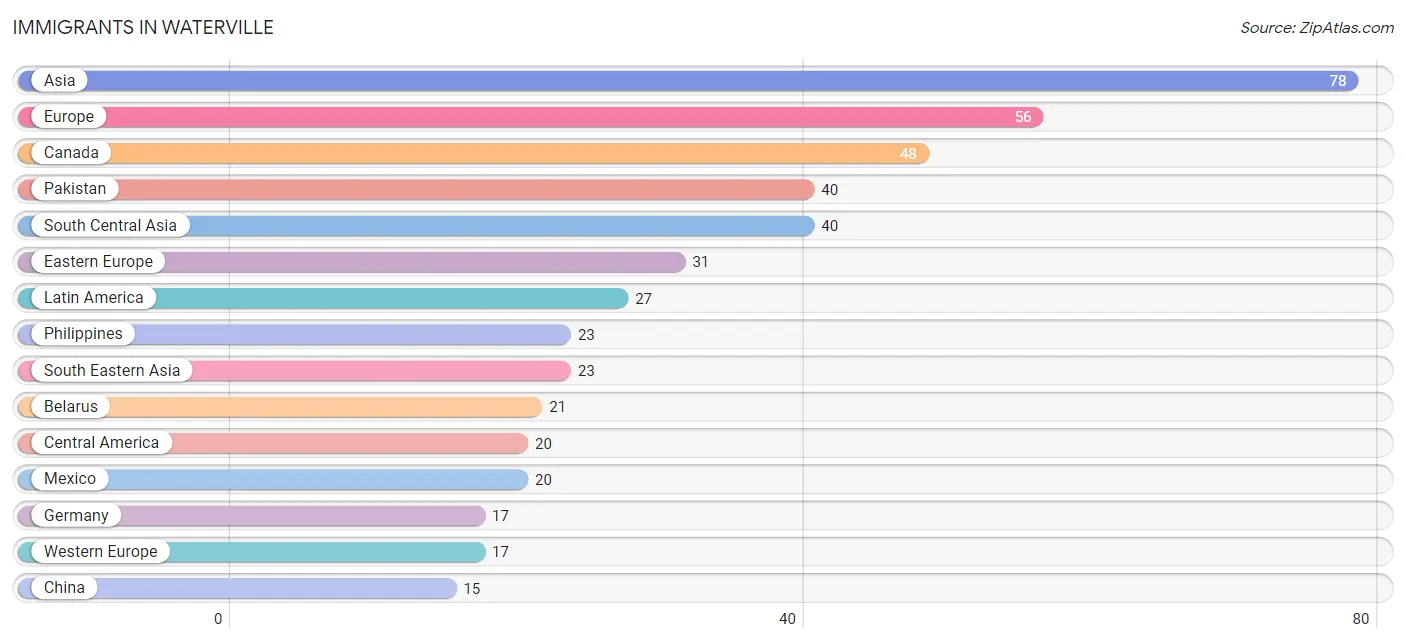
The most numerous immigrant groups reported in Waterville came from Asia (78 | 1.3%), Europe (56 | 0.9%), Canada (48 | 0.8%), Pakistan (40 | 0.7%), and South Central Asia (40 | 0.7%), together accounting for 4.4% of all Waterville residents.
| Immigration Origin | # Population | % Population |
| Asia | 78 | 1.3% |
| Belarus | 21 | 0.4% |
| Canada | 48 | 0.8% |
| Central America | 20 | 0.3% |
| China | 15 | 0.3% |
| Eastern Asia | 15 | 0.3% |
| Eastern Europe | 31 | 0.5% |
| Europe | 56 | 0.9% |
| Germany | 17 | 0.3% |
| Ireland | 8 | 0.1% |
| Latin America | 27 | 0.4% |
| Mexico | 20 | 0.3% |
| Northern Europe | 8 | 0.1% |
| Pakistan | 40 | 0.7% |
| Peru | 7 | 0.1% |
| Philippines | 23 | 0.4% |
| South America | 7 | 0.1% |
| South Central Asia | 40 | 0.7% |
| South Eastern Asia | 23 | 0.4% |
| Western Europe | 17 | 0.3% | View All 20 Rows |
Sex and Age in Waterville
Sex and Age in Waterville
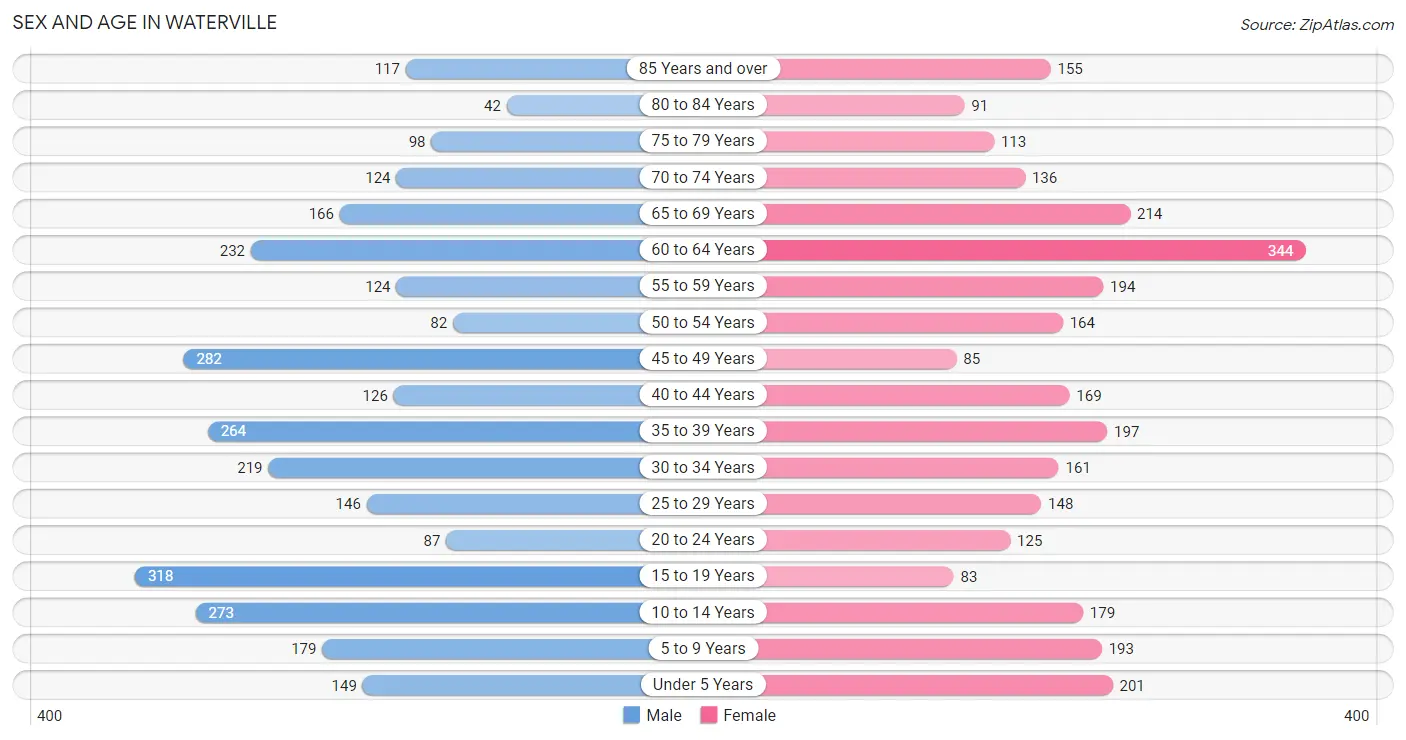
The most populous age groups in Waterville are 15 to 19 Years (318 | 10.5%) for men and 60 to 64 Years (344 | 11.7%) for women.
| Age Bracket | Male | Female |
| Under 5 Years | 149 (4.9%) | 201 (6.8%) |
| 5 to 9 Years | 179 (5.9%) | 193 (6.5%) |
| 10 to 14 Years | 273 (9.0%) | 179 (6.1%) |
| 15 to 19 Years | 318 (10.5%) | 83 (2.8%) |
| 20 to 24 Years | 87 (2.9%) | 125 (4.2%) |
| 25 to 29 Years | 146 (4.8%) | 148 (5.0%) |
| 30 to 34 Years | 219 (7.2%) | 161 (5.4%) |
| 35 to 39 Years | 264 (8.7%) | 197 (6.7%) |
| 40 to 44 Years | 126 (4.2%) | 169 (5.7%) |
| 45 to 49 Years | 282 (9.3%) | 85 (2.9%) |
| 50 to 54 Years | 82 (2.7%) | 164 (5.6%) |
| 55 to 59 Years | 124 (4.1%) | 194 (6.6%) |
| 60 to 64 Years | 232 (7.7%) | 344 (11.7%) |
| 65 to 69 Years | 166 (5.5%) | 214 (7.2%) |
| 70 to 74 Years | 124 (4.1%) | 136 (4.6%) |
| 75 to 79 Years | 98 (3.2%) | 113 (3.8%) |
| 80 to 84 Years | 42 (1.4%) | 91 (3.1%) |
| 85 Years and over | 117 (3.9%) | 155 (5.2%) |
| Total | 3,028 (100.0%) | 2,952 (100.0%) |
Families and Households in Waterville
Median Family Size in Waterville
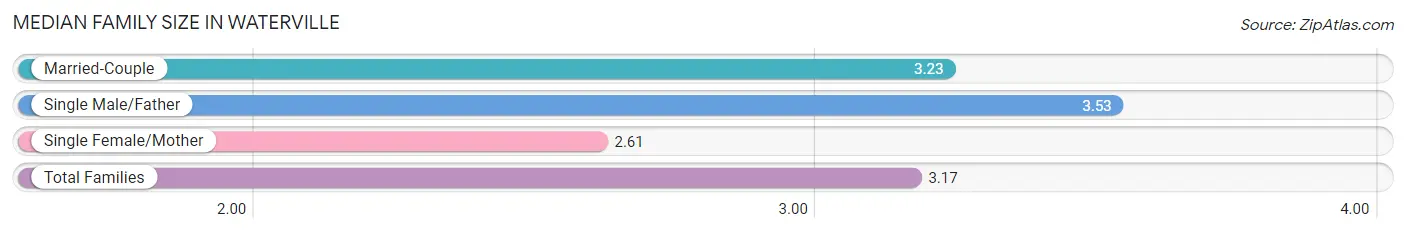
The median family size in Waterville is 3.17 persons per family, with single male/father families (109 | 7.2%) accounting for the largest median family size of 3.53 persons per family. On the other hand, single female/mother families (198 | 13.1%) represent the smallest median family size with 2.61 persons per family.
| Family Type | # Families | Family Size |
| Married-Couple | 1,205 (79.7%) | 3.23 |
| Single Male/Father | 109 (7.2%) | 3.53 |
| Single Female/Mother | 198 (13.1%) | 2.61 |
| Total Families | 1,512 (100.0%) | 3.17 |
Median Household Size in Waterville
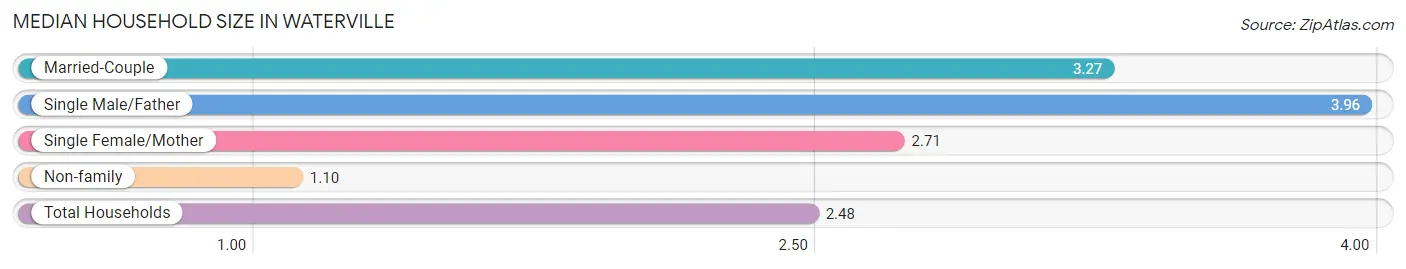
The median household size in Waterville is 2.48 persons per household, with single male/father households (109 | 4.6%) accounting for the largest median household size of 3.96 persons per household. non-family households (851 | 36.0%) represent the smallest median household size with 1.10 persons per household.
| Household Type | # Households | Household Size |
| Married-Couple | 1,205 (51.0%) | 3.27 |
| Single Male/Father | 109 (4.6%) | 3.96 |
| Single Female/Mother | 198 (8.4%) | 2.71 |
| Non-family | 851 (36.0%) | 1.10 |
| Total Households | 2,363 (100.0%) | 2.48 |
Household Size by Marriage Status in Waterville
Out of a total of 2,363 households in Waterville, 1,512 (64.0%) are family households, while 851 (36.0%) are nonfamily households. The most numerous type of family households are 2-person households, comprising 667, and the most common type of nonfamily households are 1-person households, comprising 762.
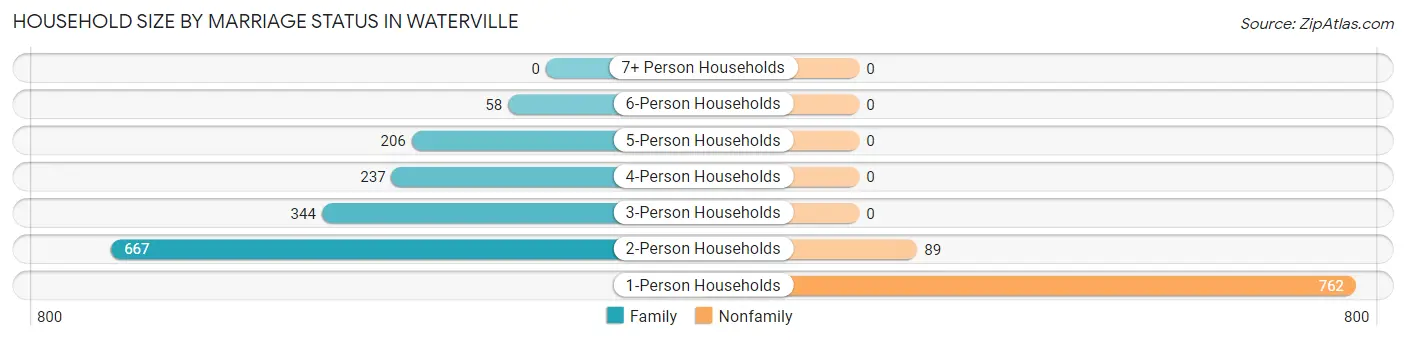
| Household Size | Family Households | Nonfamily Households |
| 1-Person Households | - | 762 (32.3%) |
| 2-Person Households | 667 (28.2%) | 89 (3.8%) |
| 3-Person Households | 344 (14.6%) | 0 (0.0%) |
| 4-Person Households | 237 (10.0%) | 0 (0.0%) |
| 5-Person Households | 206 (8.7%) | 0 (0.0%) |
| 6-Person Households | 58 (2.5%) | 0 (0.0%) |
| 7+ Person Households | 0 (0.0%) | 0 (0.0%) |
| Total | 1,512 (64.0%) | 851 (36.0%) |
Female Fertility in Waterville
Fertility by Age in Waterville
Average fertility rate in Waterville is 60.0 births per 1,000 women. Women in the age bracket of 35 to 50 years have the highest fertility rate with 98.0 births per 1,000 women. Women in the age bracket of 35 to 50 years acount for 78.0% of all women with births.
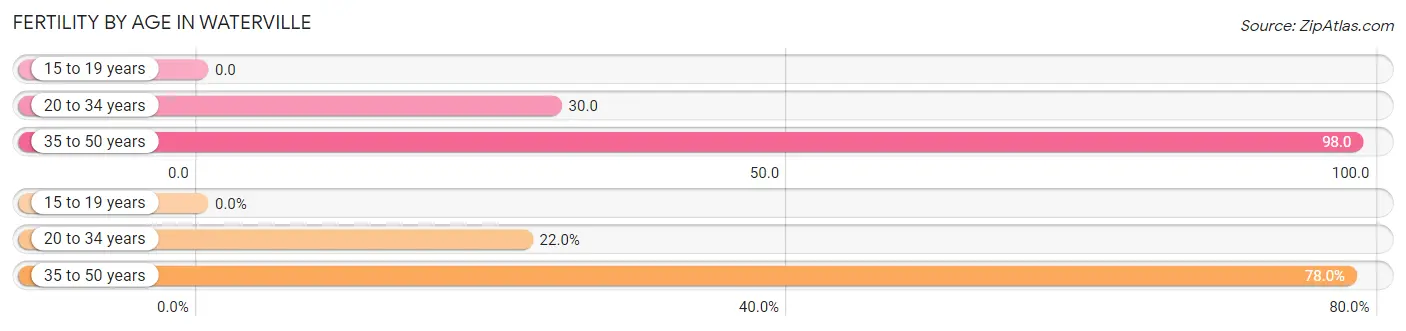
| Age Bracket | Women with Births | Births / 1,000 Women |
| 15 to 19 years | 0 (0.0%) | 0.0 |
| 20 to 34 years | 13 (22.0%) | 30.0 |
| 35 to 50 years | 46 (78.0%) | 98.0 |
| Total | 59 (100.0%) | 60.0 |
Fertility by Age by Marriage Status in Waterville
39.0% of women with births (59) in Waterville are married. The highest percentage of unmarried women with births falls into 35 to 50 years age bracket with 78.3% of them unmarried at the time of birth, while the lowest percentage of unmarried women with births belong to 20 to 34 years age bracket with 0.0% of them unmarried.
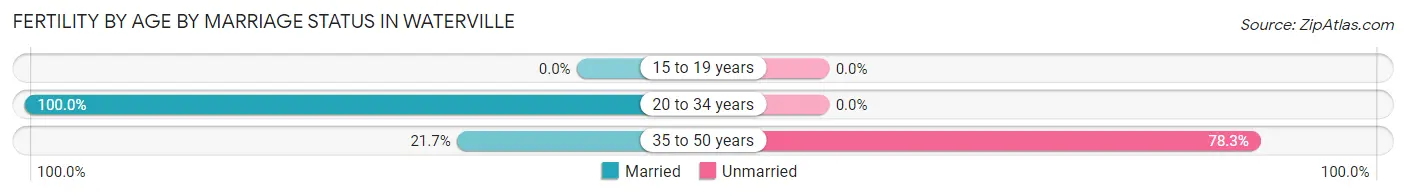
| Age Bracket | Married | Unmarried |
| 15 to 19 years | 0 (0.0%) | 0 (0.0%) |
| 20 to 34 years | 13 (100.0%) | 0 (0.0%) |
| 35 to 50 years | 10 (21.7%) | 36 (78.3%) |
| Total | 23 (39.0%) | 36 (61.0%) |
Fertility by Education in Waterville
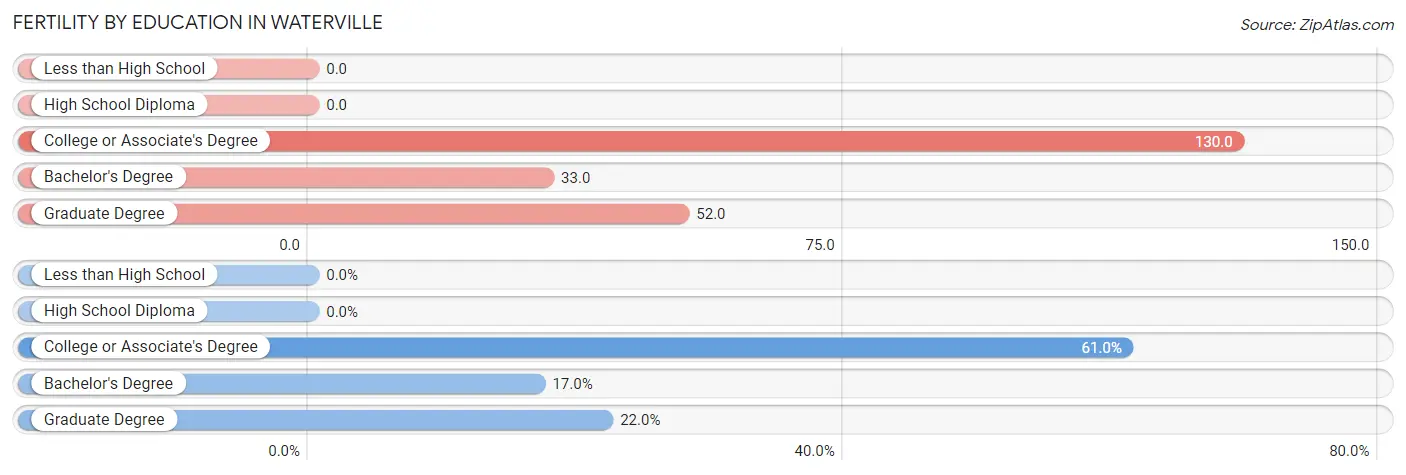
| Educational Attainment | Women with Births | Births / 1,000 Women |
| Less than High School | 0 (0.0%) | 0.0 |
| High School Diploma | 0 (0.0%) | 0.0 |
| College or Associate's Degree | 36 (61.0%) | 130.0 |
| Bachelor's Degree | 10 (17.0%) | 33.0 |
| Graduate Degree | 13 (22.0%) | 52.0 |
| Total | 59 (100.0%) | 60.0 |
Fertility by Education by Marriage Status in Waterville
61.0% of women with births in Waterville are unmarried. Women with the educational attainment of bachelor's degree are most likely to be married with 100.0% of them married at childbirth, while women with the educational attainment of college or associate's degree are least likely to be married with 100.0% of them unmarried at childbirth.
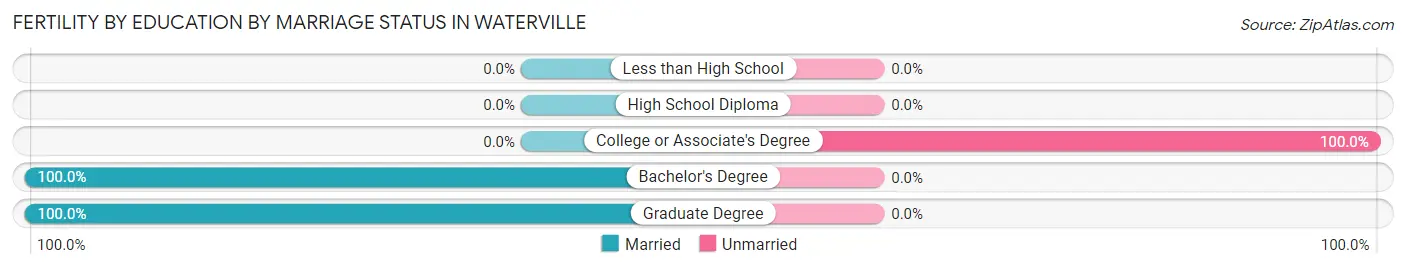
| Educational Attainment | Married | Unmarried |
| Less than High School | 0 (0.0%) | 0 (0.0%) |
| High School Diploma | 0 (0.0%) | 0 (0.0%) |
| College or Associate's Degree | 0 (0.0%) | 36 (100.0%) |
| Bachelor's Degree | 10 (100.0%) | 0 (0.0%) |
| Graduate Degree | 13 (100.0%) | 0 (0.0%) |
| Total | 23 (39.0%) | 36 (61.0%) |
Employment Characteristics in Waterville
Employment by Class of Employer in Waterville
Among the 2,727 employed individuals in Waterville, private company employees (1,833 | 67.2%), not-for-profit organizations (339 | 12.4%), and local government employees (198 | 7.3%) make up the most common classes of employment.
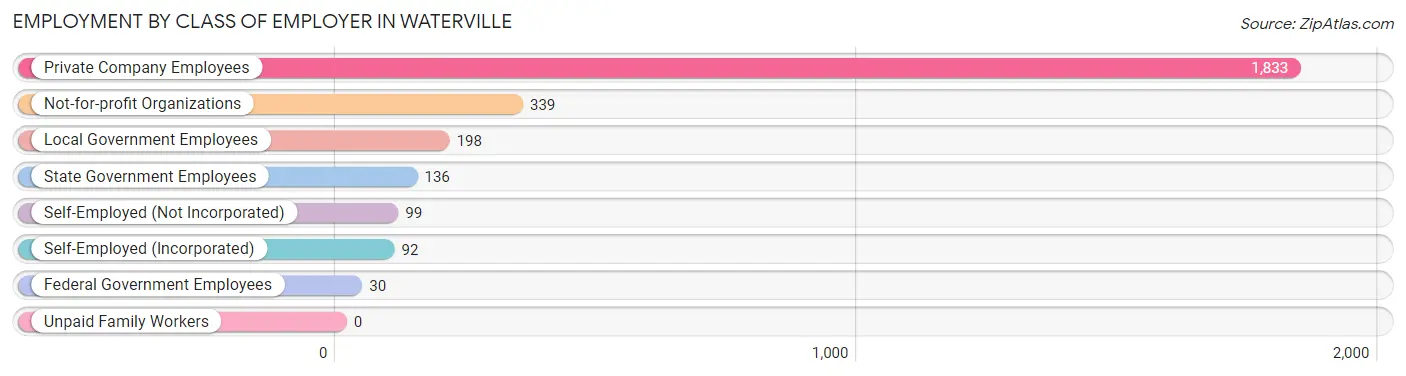
| Employer Class | # Employees | % Employees |
| Private Company Employees | 1,833 | 67.2% |
| Self-Employed (Incorporated) | 92 | 3.4% |
| Self-Employed (Not Incorporated) | 99 | 3.6% |
| Not-for-profit Organizations | 339 | 12.4% |
| Local Government Employees | 198 | 7.3% |
| State Government Employees | 136 | 5.0% |
| Federal Government Employees | 30 | 1.1% |
| Unpaid Family Workers | 0 | 0.0% |
| Total | 2,727 | 100.0% |
Employment Status by Age in Waterville
According to the labor force statistics for Waterville, out of the total population over 16 years of age (4,653), 63.7% or 2,964 individuals are in the labor force, with 4.5% or 133 of them unemployed. The age group with the highest labor force participation rate is 20 to 24 years, with 100.0% or 212 individuals in the labor force. Within the labor force, the 65 to 74 years age range has the highest percentage of unemployed individuals, with 38.9% or 117 of them being unemployed.
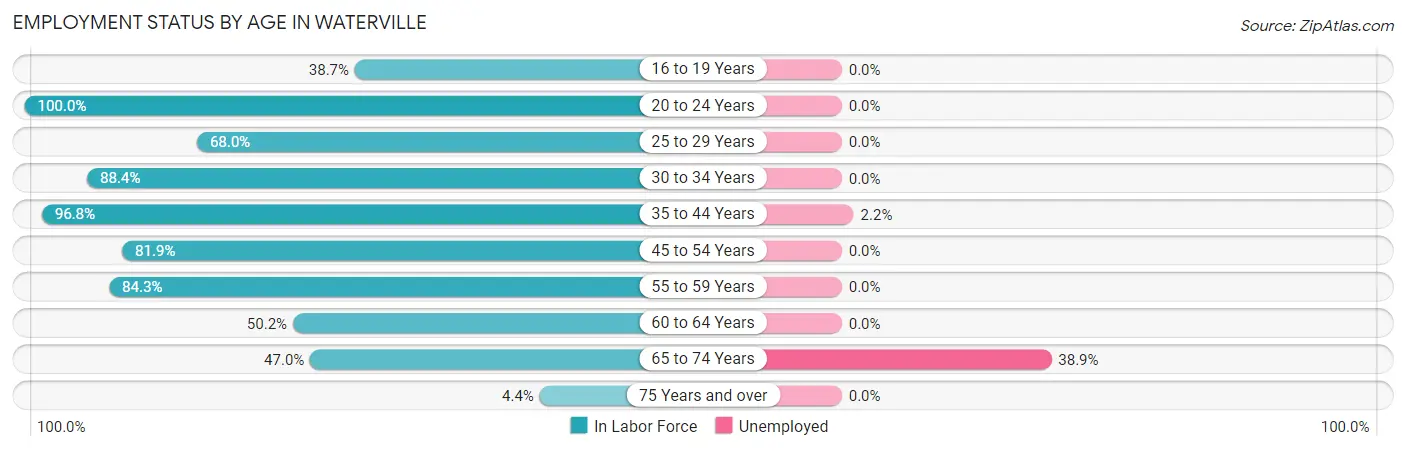
| Age Bracket | In Labor Force | Unemployed |
| 16 to 19 Years | 96 (38.7%) | 0 (0.0%) |
| 20 to 24 Years | 212 (100.0%) | 0 (0.0%) |
| 25 to 29 Years | 200 (68.0%) | 0 (0.0%) |
| 30 to 34 Years | 336 (88.4%) | 0 (0.0%) |
| 35 to 44 Years | 732 (96.8%) | 16 (2.2%) |
| 45 to 54 Years | 502 (81.9%) | 0 (0.0%) |
| 55 to 59 Years | 268 (84.3%) | 0 (0.0%) |
| 60 to 64 Years | 289 (50.2%) | 0 (0.0%) |
| 65 to 74 Years | 301 (47.0%) | 117 (38.9%) |
| 75 Years and over | 27 (4.4%) | 0 (0.0%) |
| Total | 2,964 (63.7%) | 133 (4.5%) |
Employment Status by Educational Attainment in Waterville
According to labor force statistics for Waterville, 79.2% of individuals (2,326) out of the total population between 25 and 64 years of age (2,937) are in the labor force, with 0.7% or 16 of them being unemployed. The group with the highest labor force participation rate are those with the educational attainment of bachelor's degree or higher, with 86.1% or 1,367 individuals in the labor force. Within the labor force, individuals with high school diploma education have the highest percentage of unemployment, with 5.5% or 16 of them being unemployed.
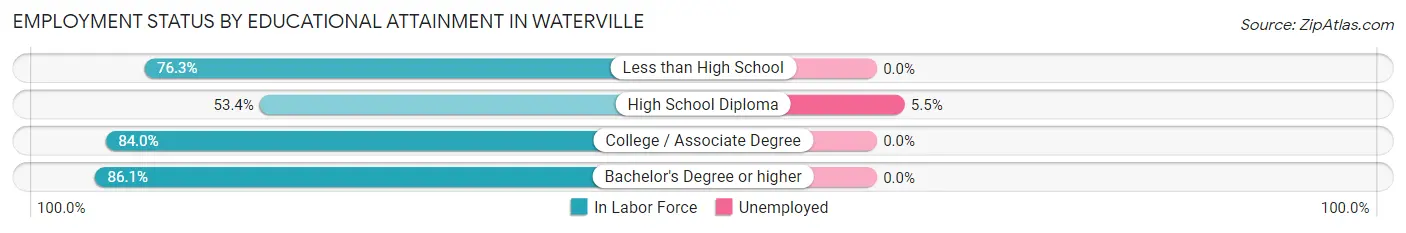
| Educational Attainment | In Labor Force | Unemployed |
| Less than High School | 61 (76.3%) | 0 (0.0%) |
| High School Diploma | 291 (53.4%) | 30 (5.5%) |
| College / Associate Degree | 608 (84.0%) | 0 (0.0%) |
| Bachelor's Degree or higher | 1,367 (86.1%) | 0 (0.0%) |
| Total | 2,326 (79.2%) | 21 (0.7%) |
Employment Occupations by Sex in Waterville
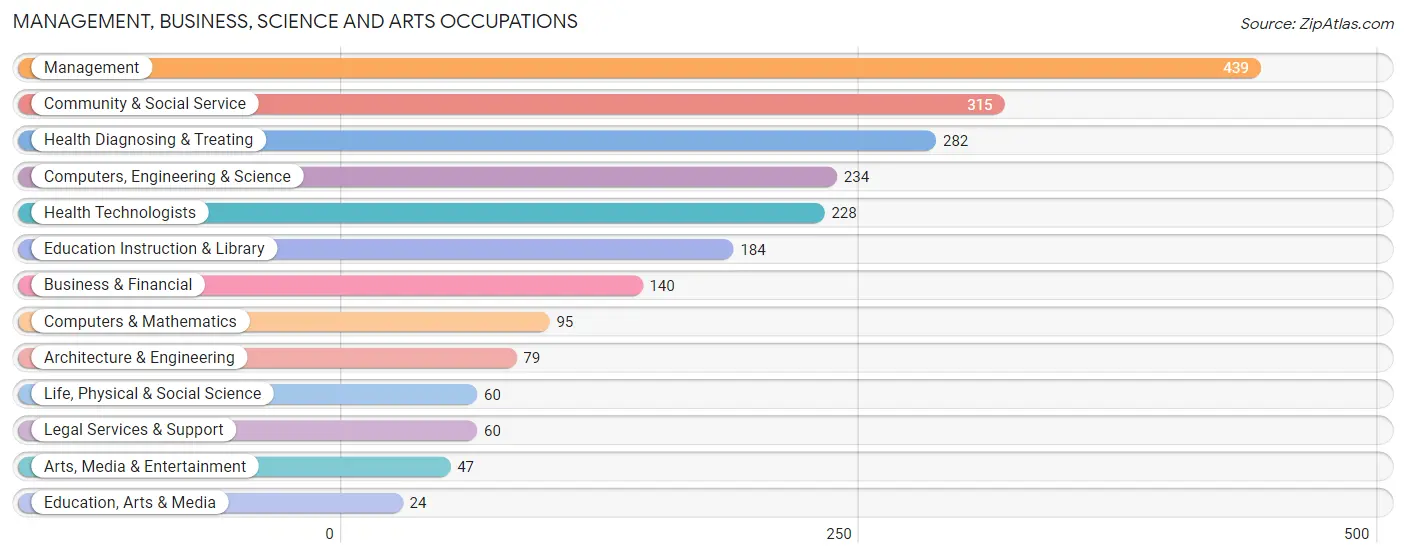
Management, Business, Science and Arts Occupations
The most common Management, Business, Science and Arts occupations in Waterville are Management (439 | 15.6%), Community & Social Service (315 | 11.2%), Health Diagnosing & Treating (282 | 10.0%), Computers, Engineering & Science (234 | 8.3%), and Health Technologists (228 | 8.1%).
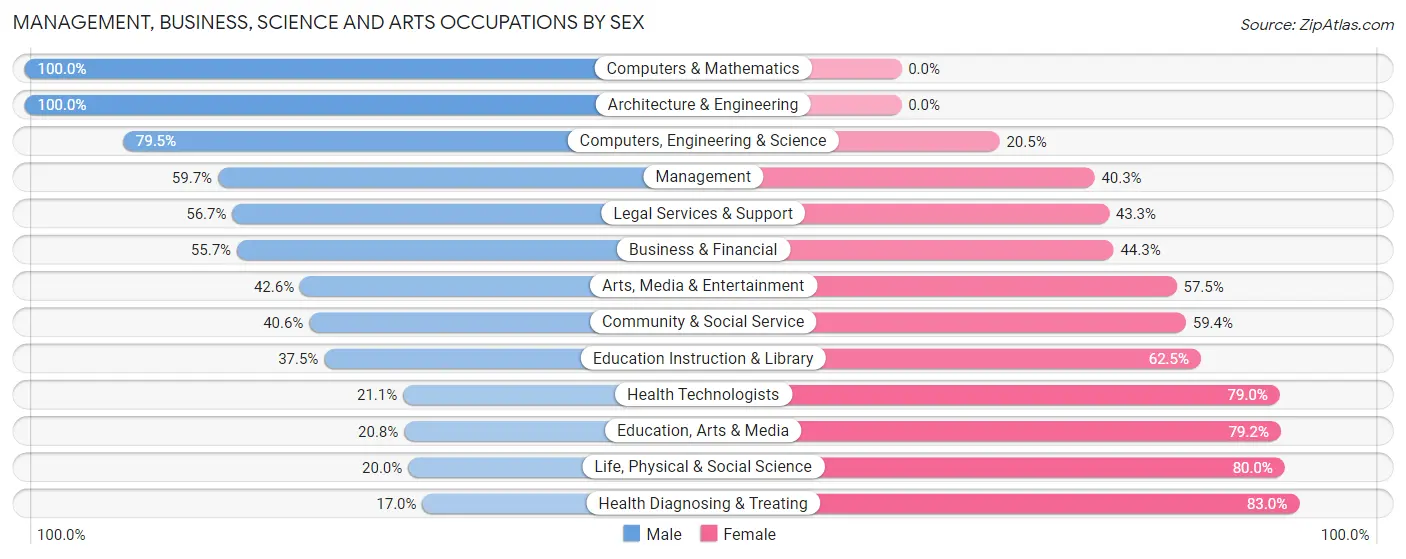
Management, Business, Science and Arts Occupations by Sex
Within the Management, Business, Science and Arts occupations in Waterville, the most male-oriented occupations are Computers & Mathematics (100.0%), Architecture & Engineering (100.0%), and Computers, Engineering & Science (79.5%), while the most female-oriented occupations are Health Diagnosing & Treating (83.0%), Life, Physical & Social Science (80.0%), and Education, Arts & Media (79.2%).
| Occupation | Male | Female |
| Management | 262 (59.7%) | 177 (40.3%) |
| Business & Financial | 78 (55.7%) | 62 (44.3%) |
| Computers, Engineering & Science | 186 (79.5%) | 48 (20.5%) |
| Computers & Mathematics | 95 (100.0%) | 0 (0.0%) |
| Architecture & Engineering | 79 (100.0%) | 0 (0.0%) |
| Life, Physical & Social Science | 12 (20.0%) | 48 (80.0%) |
| Community & Social Service | 128 (40.6%) | 187 (59.4%) |
| Education, Arts & Media | 5 (20.8%) | 19 (79.2%) |
| Legal Services & Support | 34 (56.7%) | 26 (43.3%) |
| Education Instruction & Library | 69 (37.5%) | 115 (62.5%) |
| Arts, Media & Entertainment | 20 (42.5%) | 27 (57.5%) |
| Health Diagnosing & Treating | 48 (17.0%) | 234 (83.0%) |
| Health Technologists | 48 (21.0%) | 180 (78.9%) |
| Total (Category) | 702 (49.8%) | 708 (50.2%) |
| Total (Overall) | 1,518 (53.9%) | 1,297 (46.1%) |
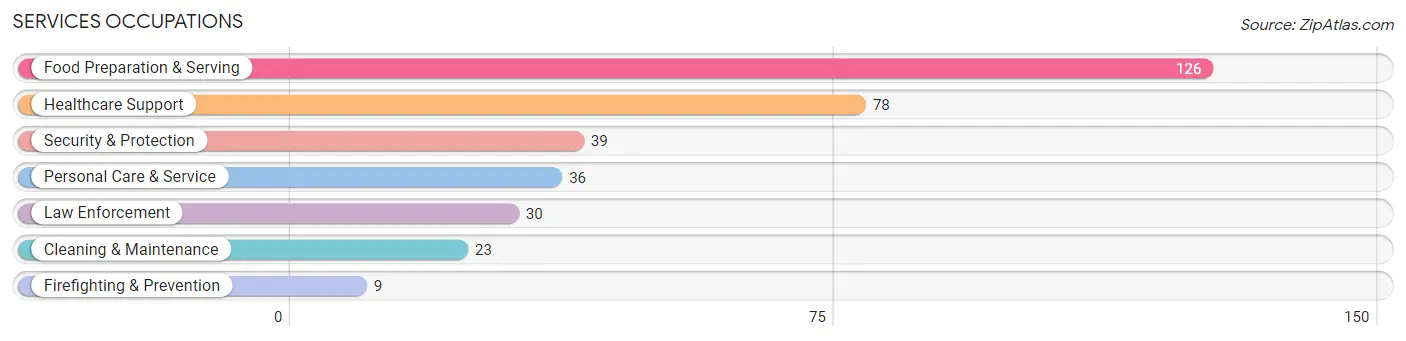
Services Occupations
The most common Services occupations in Waterville are Food Preparation & Serving (126 | 4.5%), Healthcare Support (78 | 2.8%), Security & Protection (39 | 1.4%), Personal Care & Service (36 | 1.3%), and Law Enforcement (30 | 1.1%).
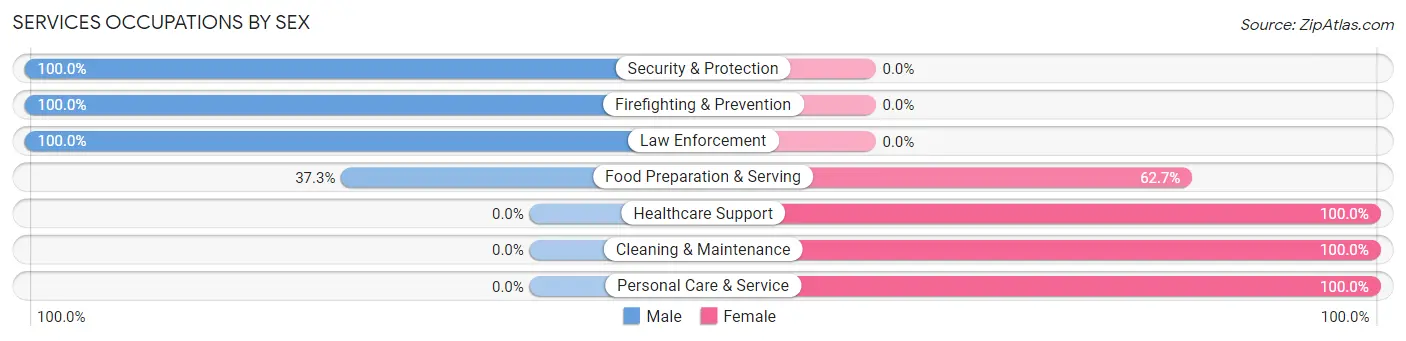
Services Occupations by Sex
Within the Services occupations in Waterville, the most male-oriented occupations are Security & Protection (100.0%), Firefighting & Prevention (100.0%), and Law Enforcement (100.0%), while the most female-oriented occupations are Healthcare Support (100.0%), Cleaning & Maintenance (100.0%), and Personal Care & Service (100.0%).
| Occupation | Male | Female |
| Healthcare Support | 0 (0.0%) | 78 (100.0%) |
| Security & Protection | 39 (100.0%) | 0 (0.0%) |
| Firefighting & Prevention | 9 (100.0%) | 0 (0.0%) |
| Law Enforcement | 30 (100.0%) | 0 (0.0%) |
| Food Preparation & Serving | 47 (37.3%) | 79 (62.7%) |
| Cleaning & Maintenance | 0 (0.0%) | 23 (100.0%) |
| Personal Care & Service | 0 (0.0%) | 36 (100.0%) |
| Total (Category) | 86 (28.5%) | 216 (71.5%) |
| Total (Overall) | 1,518 (53.9%) | 1,297 (46.1%) |
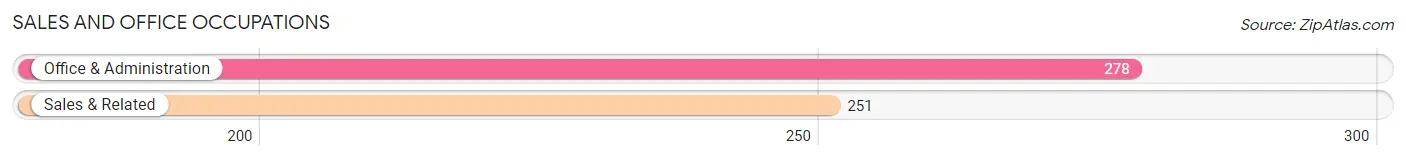
Sales and Office Occupations
The most common Sales and Office occupations in Waterville are Office & Administration (278 | 9.9%), and Sales & Related (251 | 8.9%).
Sales and Office Occupations by Sex
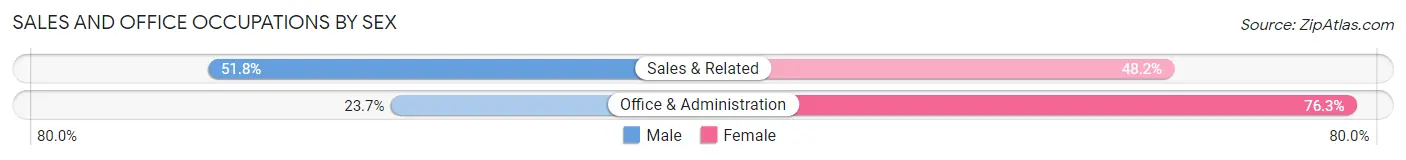
| Occupation | Male | Female |
| Sales & Related | 130 (51.8%) | 121 (48.2%) |
| Office & Administration | 66 (23.7%) | 212 (76.3%) |
| Total (Category) | 196 (37.0%) | 333 (62.9%) |
| Total (Overall) | 1,518 (53.9%) | 1,297 (46.1%) |
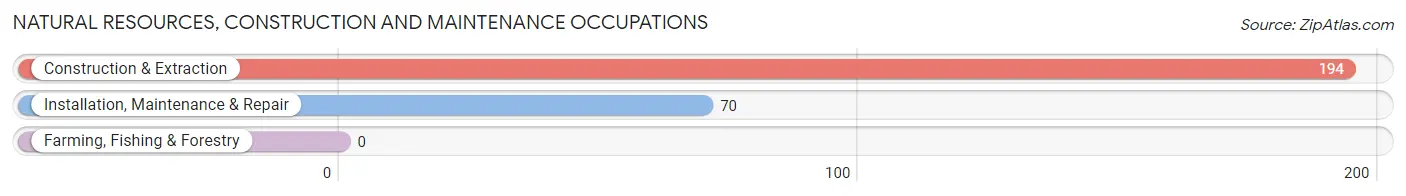
Natural Resources, Construction and Maintenance Occupations
The most common Natural Resources, Construction and Maintenance occupations in Waterville are Construction & Extraction (194 | 6.9%), and Installation, Maintenance & Repair (70 | 2.5%).
Natural Resources, Construction and Maintenance Occupations by Sex
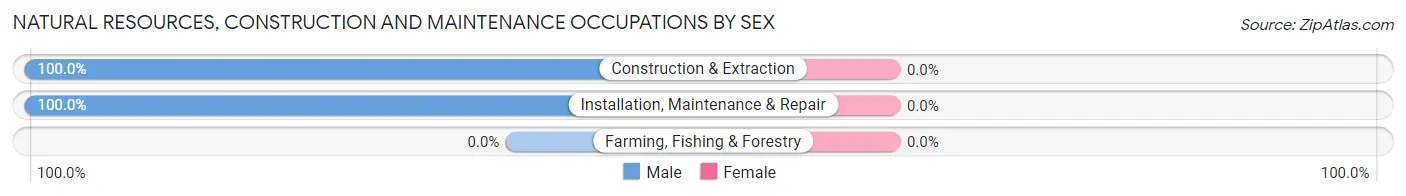
| Occupation | Male | Female |
| Farming, Fishing & Forestry | 0 (0.0%) | 0 (0.0%) |
| Construction & Extraction | 194 (100.0%) | 0 (0.0%) |
| Installation, Maintenance & Repair | 70 (100.0%) | 0 (0.0%) |
| Total (Category) | 264 (100.0%) | 0 (0.0%) |
| Total (Overall) | 1,518 (53.9%) | 1,297 (46.1%) |
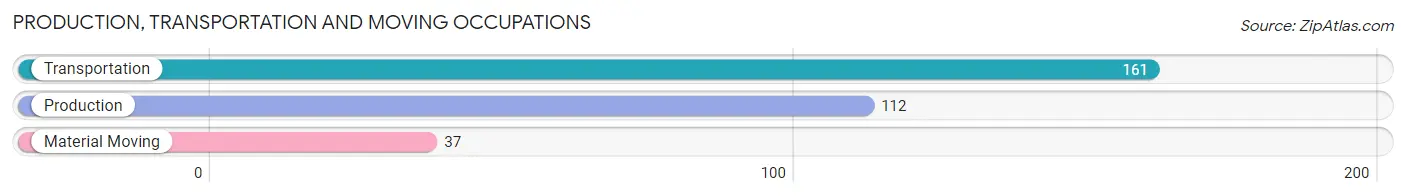
Production, Transportation and Moving Occupations
The most common Production, Transportation and Moving occupations in Waterville are Transportation (161 | 5.7%), Production (112 | 4.0%), and Material Moving (37 | 1.3%).
Production, Transportation and Moving Occupations by Sex
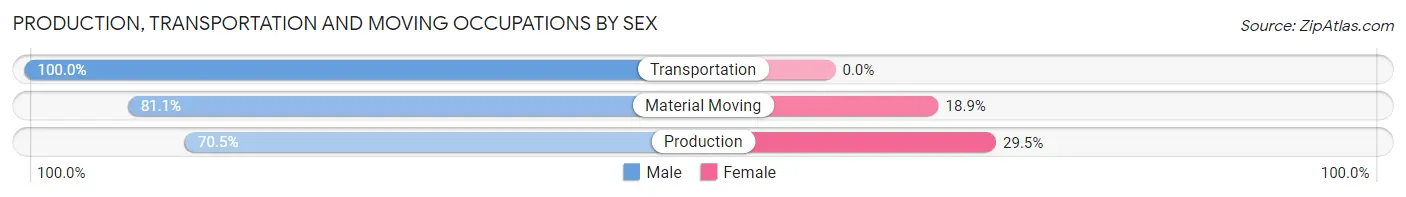
| Occupation | Male | Female |
| Production | 79 (70.5%) | 33 (29.5%) |
| Transportation | 161 (100.0%) | 0 (0.0%) |
| Material Moving | 30 (81.1%) | 7 (18.9%) |
| Total (Category) | 270 (87.1%) | 40 (12.9%) |
| Total (Overall) | 1,518 (53.9%) | 1,297 (46.1%) |
Employment Industries by Sex in Waterville
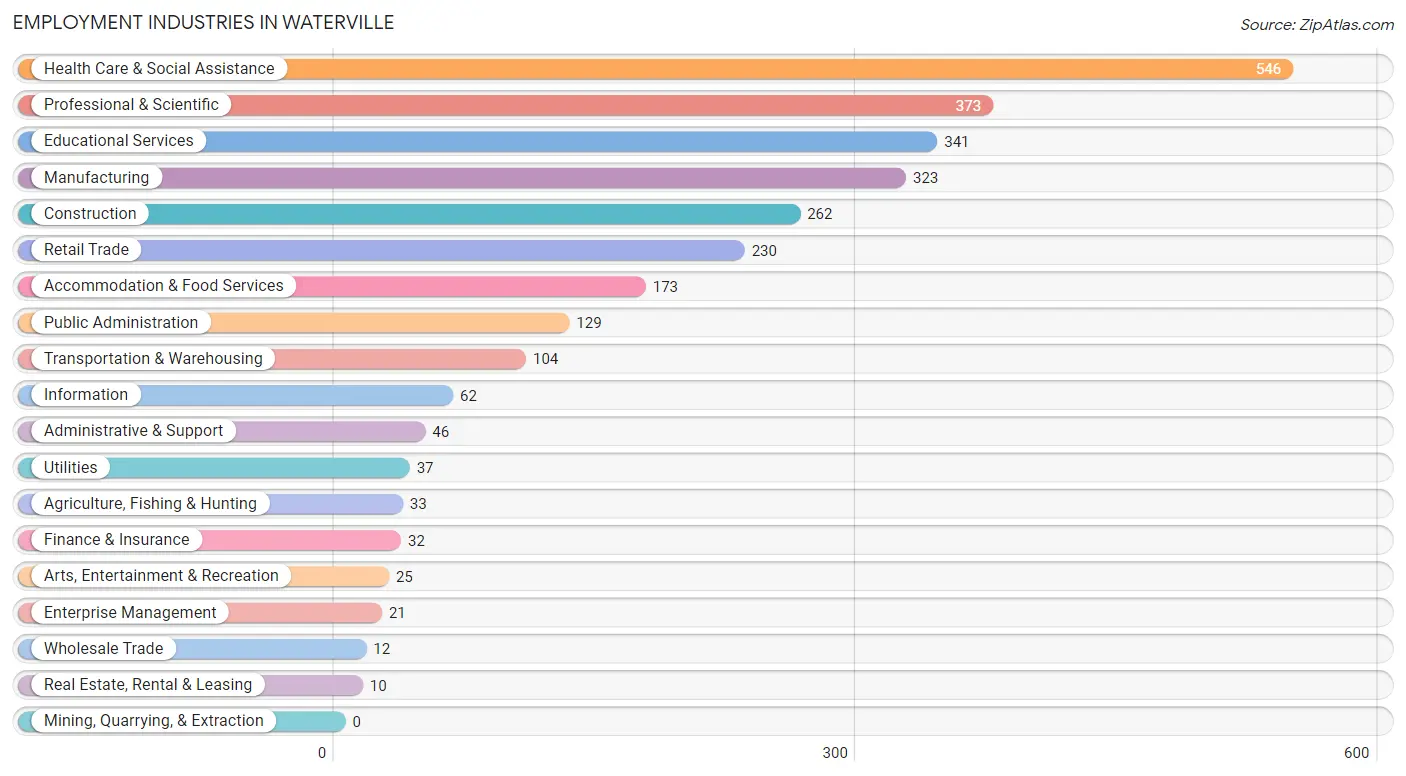
Employment Industries in Waterville
The major employment industries in Waterville include Health Care & Social Assistance (546 | 19.4%), Professional & Scientific (373 | 13.3%), Educational Services (341 | 12.1%), Manufacturing (323 | 11.5%), and Construction (262 | 9.3%).
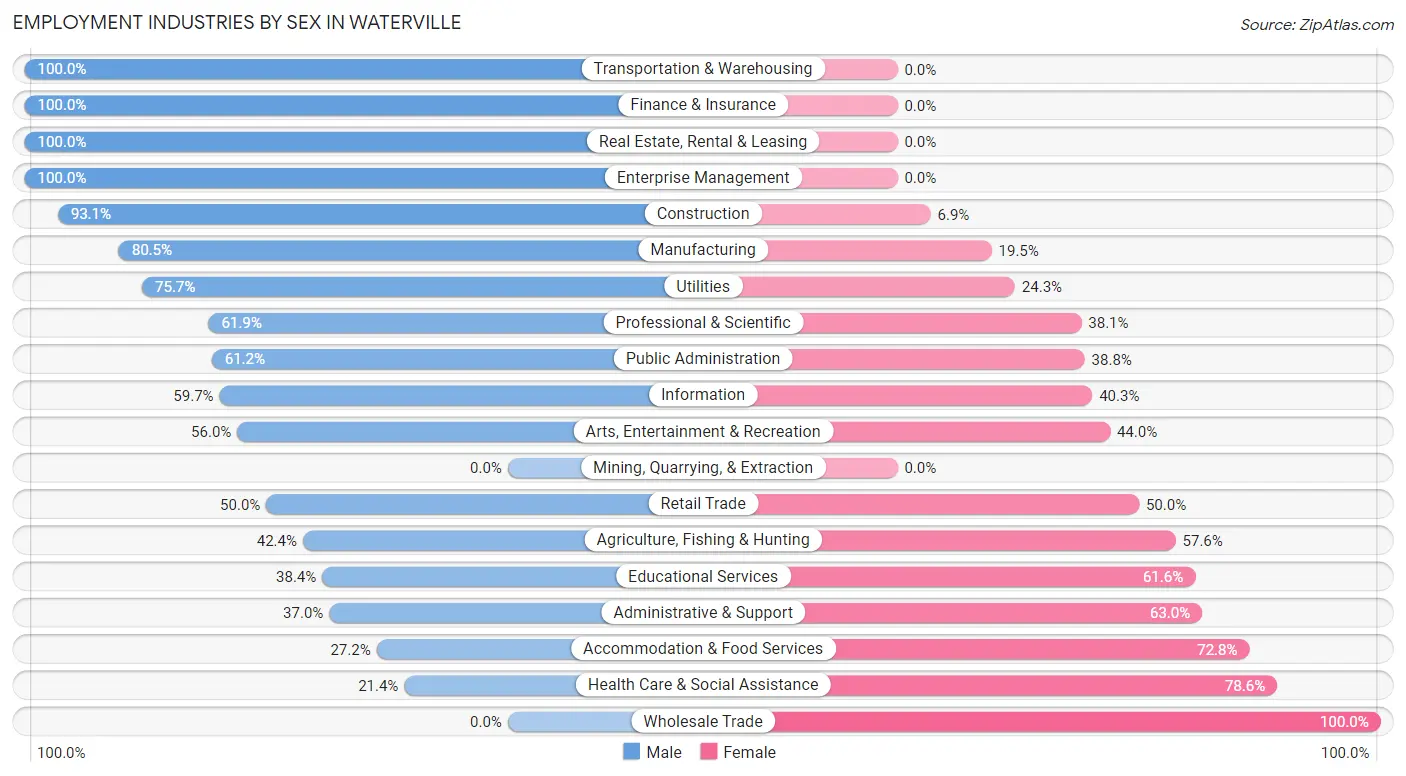
Employment Industries by Sex in Waterville
The Waterville industries that see more men than women are Transportation & Warehousing (100.0%), Finance & Insurance (100.0%), and Real Estate, Rental & Leasing (100.0%), whereas the industries that tend to have a higher number of women are Wholesale Trade (100.0%), Health Care & Social Assistance (78.6%), and Accommodation & Food Services (72.8%).
| Industry | Male | Female |
| Agriculture, Fishing & Hunting | 14 (42.4%) | 19 (57.6%) |
| Mining, Quarrying, & Extraction | 0 (0.0%) | 0 (0.0%) |
| Construction | 244 (93.1%) | 18 (6.9%) |
| Manufacturing | 260 (80.5%) | 63 (19.5%) |
| Wholesale Trade | 0 (0.0%) | 12 (100.0%) |
| Retail Trade | 115 (50.0%) | 115 (50.0%) |
| Transportation & Warehousing | 104 (100.0%) | 0 (0.0%) |
| Utilities | 28 (75.7%) | 9 (24.3%) |
| Information | 37 (59.7%) | 25 (40.3%) |
| Finance & Insurance | 32 (100.0%) | 0 (0.0%) |
| Real Estate, Rental & Leasing | 10 (100.0%) | 0 (0.0%) |
| Professional & Scientific | 231 (61.9%) | 142 (38.1%) |
| Enterprise Management | 21 (100.0%) | 0 (0.0%) |
| Administrative & Support | 17 (37.0%) | 29 (63.0%) |
| Educational Services | 131 (38.4%) | 210 (61.6%) |
| Health Care & Social Assistance | 117 (21.4%) | 429 (78.6%) |
| Arts, Entertainment & Recreation | 14 (56.0%) | 11 (44.0%) |
| Accommodation & Food Services | 47 (27.2%) | 126 (72.8%) |
| Public Administration | 79 (61.2%) | 50 (38.8%) |
| Total | 1,518 (53.9%) | 1,297 (46.1%) |
Education in Waterville
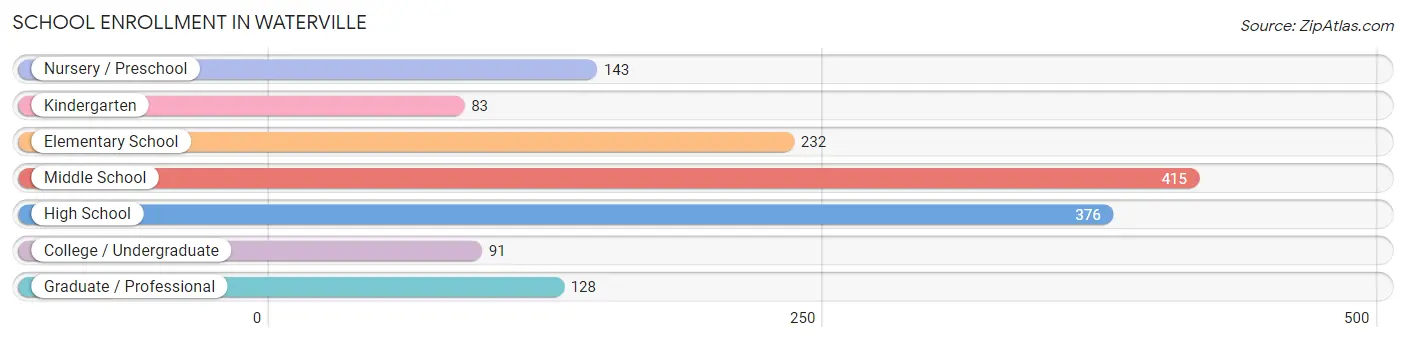
School Enrollment in Waterville
The most common levels of schooling among the 1,468 students in Waterville are middle school (415 | 28.3%), high school (376 | 25.6%), and elementary school (232 | 15.8%).
| School Level | # Students | % Students |
| Nursery / Preschool | 143 | 9.7% |
| Kindergarten | 83 | 5.7% |
| Elementary School | 232 | 15.8% |
| Middle School | 415 | 28.3% |
| High School | 376 | 25.6% |
| College / Undergraduate | 91 | 6.2% |
| Graduate / Professional | 128 | 8.7% |
| Total | 1,468 | 100.0% |
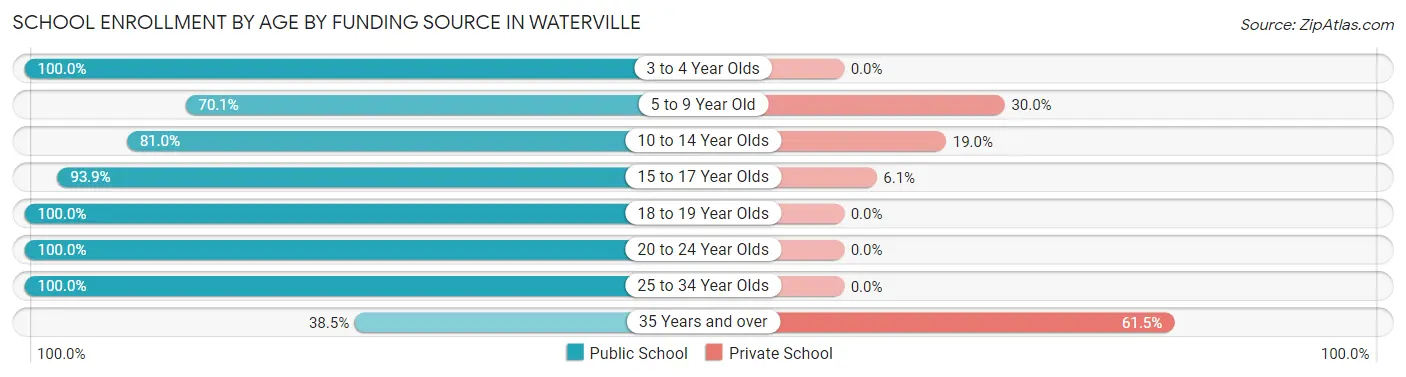
School Enrollment by Age by Funding Source in Waterville
Out of a total of 1,468 students who are enrolled in schools in Waterville, 225 (15.3%) attend a private institution, while the remaining 1,243 (84.7%) are enrolled in public schools. The age group of 35 years and over has the highest likelihood of being enrolled in private schools, with 8 (61.5% in the age bracket) enrolled. Conversely, the age group of 3 to 4 year olds has the lowest likelihood of being enrolled in a private school, with 57 (100.0% in the age bracket) attending a public institution.
| Age Bracket | Public School | Private School |
| 3 to 4 Year Olds | 57 (100.0%) | 0 (0.0%) |
| 5 to 9 Year Old | 255 (70.1%) | 109 (29.9%) |
| 10 to 14 Year Olds | 366 (81.0%) | 86 (19.0%) |
| 15 to 17 Year Olds | 339 (93.9%) | 22 (6.1%) |
| 18 to 19 Year Olds | 32 (100.0%) | 0 (0.0%) |
| 20 to 24 Year Olds | 14 (100.0%) | 0 (0.0%) |
| 25 to 34 Year Olds | 175 (100.0%) | 0 (0.0%) |
| 35 Years and over | 5 (38.5%) | 8 (61.5%) |
| Total | 1,243 (84.7%) | 225 (15.3%) |
Educational Attainment by Field of Study in Waterville
Science & technology (359 | 17.0%), education (261 | 12.4%), business (236 | 11.2%), arts & humanities (233 | 11.0%), and communications (205 | 9.7%) are the most common fields of study among 2,112 individuals in Waterville who have obtained a bachelor's degree or higher.
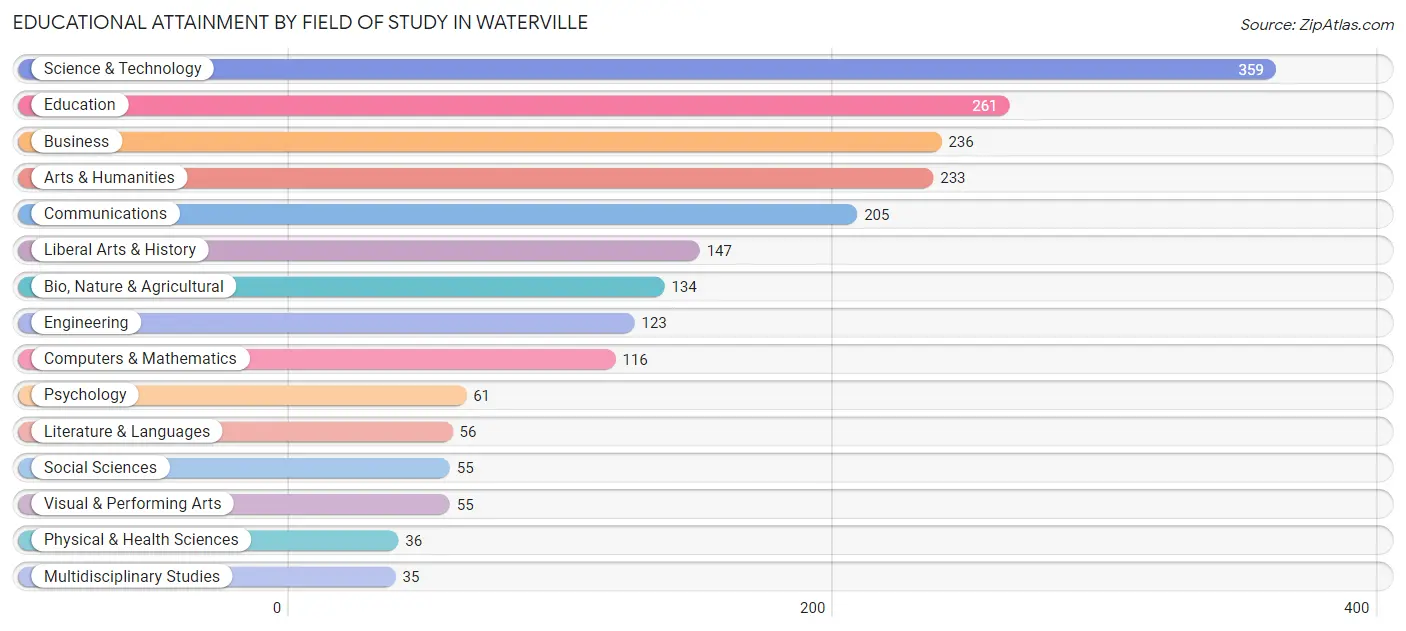
| Field of Study | # Graduates | % Graduates |
| Computers & Mathematics | 116 | 5.5% |
| Bio, Nature & Agricultural | 134 | 6.3% |
| Physical & Health Sciences | 36 | 1.7% |
| Psychology | 61 | 2.9% |
| Social Sciences | 55 | 2.6% |
| Engineering | 123 | 5.8% |
| Multidisciplinary Studies | 35 | 1.7% |
| Science & Technology | 359 | 17.0% |
| Business | 236 | 11.2% |
| Education | 261 | 12.4% |
| Literature & Languages | 56 | 2.6% |
| Liberal Arts & History | 147 | 7.0% |
| Visual & Performing Arts | 55 | 2.6% |
| Communications | 205 | 9.7% |
| Arts & Humanities | 233 | 11.0% |
| Total | 2,112 | 100.0% |
Transportation & Commute in Waterville
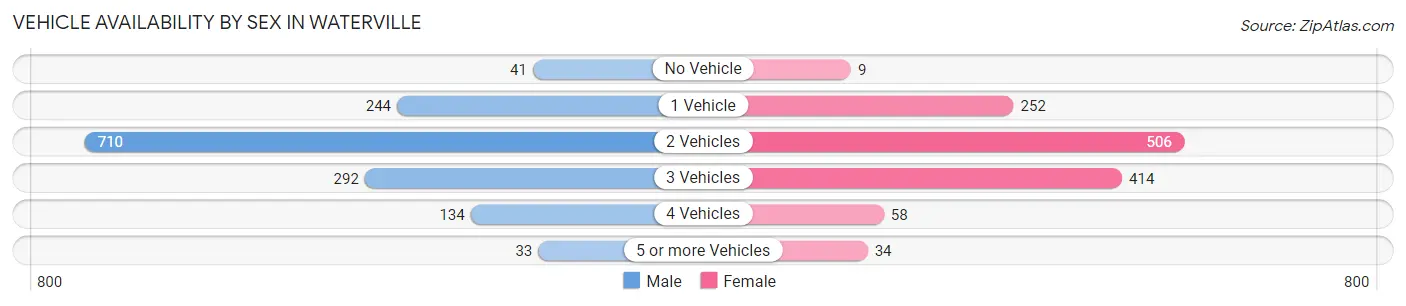
Vehicle Availability by Sex in Waterville
The most prevalent vehicle ownership categories in Waterville are males with 2 vehicles (710, accounting for 48.8%) and females with 2 vehicles (506, making up 55.8%).
| Vehicles Available | Male | Female |
| No Vehicle | 41 (2.8%) | 9 (0.7%) |
| 1 Vehicle | 244 (16.8%) | 252 (19.8%) |
| 2 Vehicles | 710 (48.8%) | 506 (39.8%) |
| 3 Vehicles | 292 (20.1%) | 414 (32.5%) |
| 4 Vehicles | 134 (9.2%) | 58 (4.6%) |
| 5 or more Vehicles | 33 (2.3%) | 34 (2.7%) |
| Total | 1,454 (100.0%) | 1,273 (100.0%) |
Commute Time in Waterville
The most frequently occuring commute durations in Waterville are 20 to 24 minutes (574 commuters, 22.8%), 15 to 19 minutes (493 commuters, 19.6%), and 30 to 34 minutes (287 commuters, 11.4%).
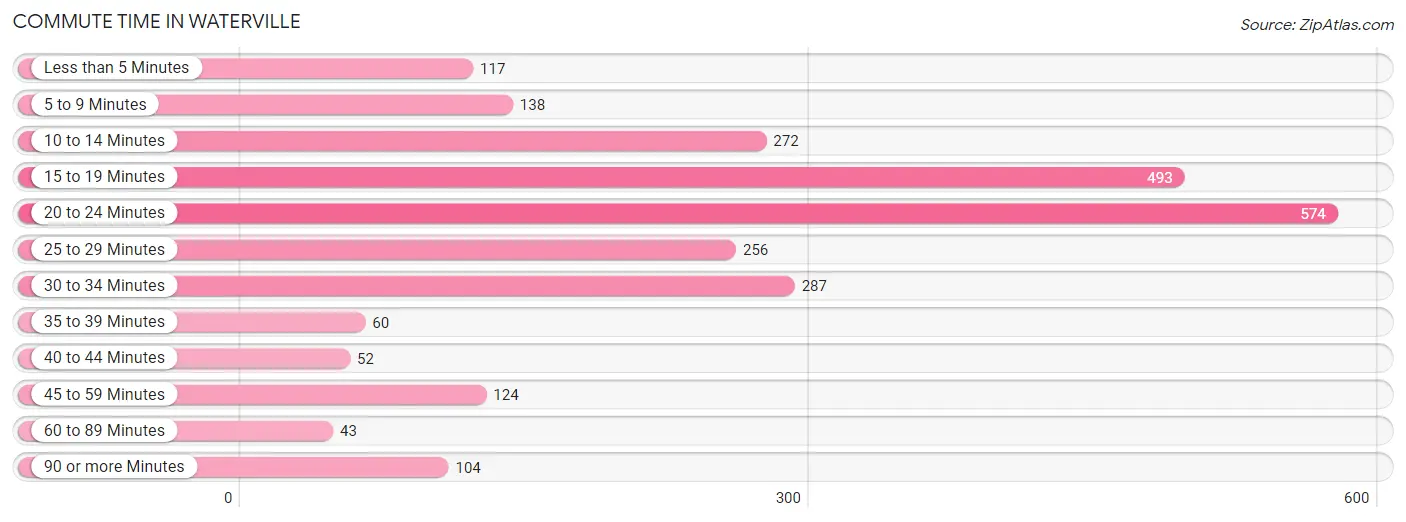
| Commute Time | # Commuters | % Commuters |
| Less than 5 Minutes | 117 | 4.6% |
| 5 to 9 Minutes | 138 | 5.5% |
| 10 to 14 Minutes | 272 | 10.8% |
| 15 to 19 Minutes | 493 | 19.6% |
| 20 to 24 Minutes | 574 | 22.8% |
| 25 to 29 Minutes | 256 | 10.2% |
| 30 to 34 Minutes | 287 | 11.4% |
| 35 to 39 Minutes | 60 | 2.4% |
| 40 to 44 Minutes | 52 | 2.1% |
| 45 to 59 Minutes | 124 | 4.9% |
| 60 to 89 Minutes | 43 | 1.7% |
| 90 or more Minutes | 104 | 4.1% |
Commute Time by Sex in Waterville
The most common commute times in Waterville are 10 to 14 minutes (242 commuters, 17.5%) for males and 20 to 24 minutes (332 commuters, 29.1%) for females.
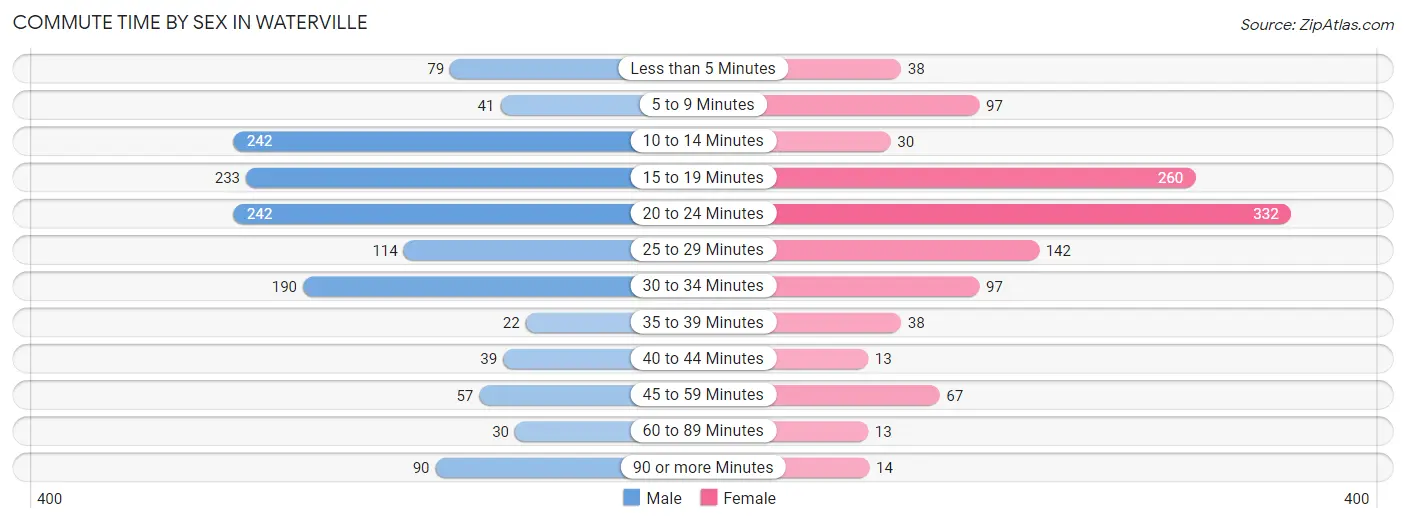
| Commute Time | Male | Female |
| Less than 5 Minutes | 79 (5.7%) | 38 (3.3%) |
| 5 to 9 Minutes | 41 (3.0%) | 97 (8.5%) |
| 10 to 14 Minutes | 242 (17.5%) | 30 (2.6%) |
| 15 to 19 Minutes | 233 (16.9%) | 260 (22.8%) |
| 20 to 24 Minutes | 242 (17.5%) | 332 (29.1%) |
| 25 to 29 Minutes | 114 (8.3%) | 142 (12.4%) |
| 30 to 34 Minutes | 190 (13.8%) | 97 (8.5%) |
| 35 to 39 Minutes | 22 (1.6%) | 38 (3.3%) |
| 40 to 44 Minutes | 39 (2.8%) | 13 (1.1%) |
| 45 to 59 Minutes | 57 (4.1%) | 67 (5.9%) |
| 60 to 89 Minutes | 30 (2.2%) | 13 (1.1%) |
| 90 or more Minutes | 90 (6.5%) | 14 (1.2%) |
Time of Departure to Work by Sex in Waterville
The most frequent times of departure to work in Waterville are 7:30 AM to 7:59 AM (262, 19.0%) for males and 7:00 AM to 7:29 AM (201, 17.6%) for females.
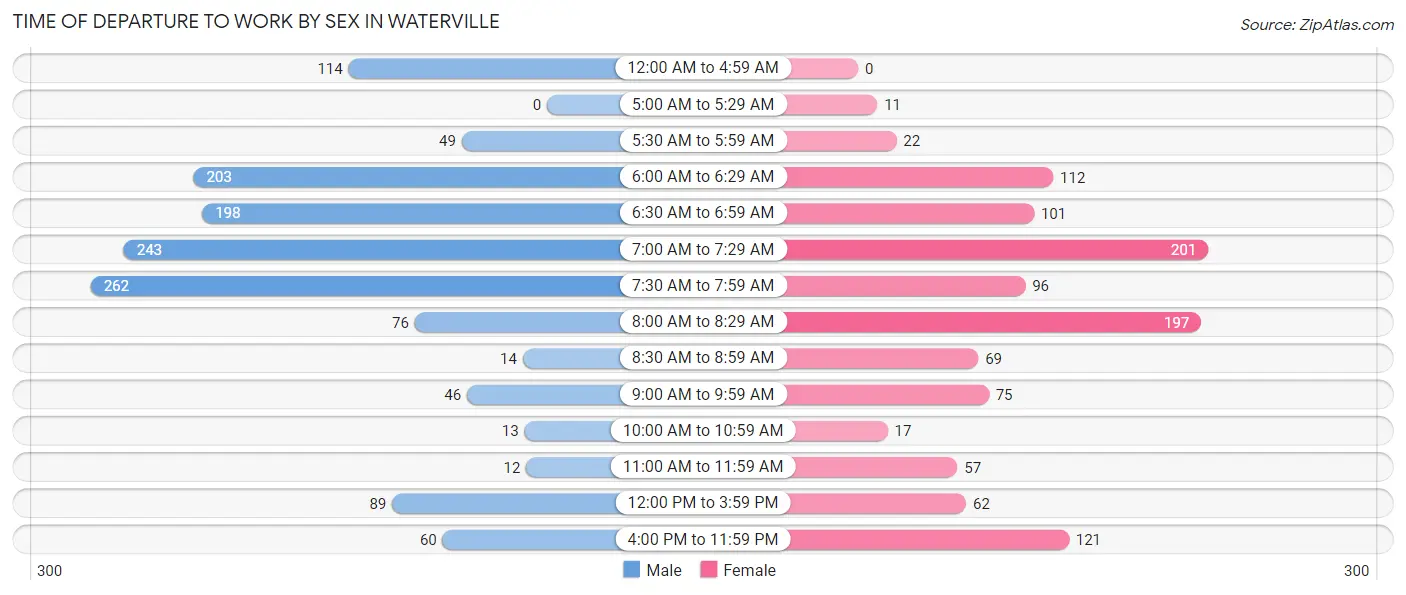
| Time of Departure | Male | Female |
| 12:00 AM to 4:59 AM | 114 (8.3%) | 0 (0.0%) |
| 5:00 AM to 5:29 AM | 0 (0.0%) | 11 (1.0%) |
| 5:30 AM to 5:59 AM | 49 (3.5%) | 22 (1.9%) |
| 6:00 AM to 6:29 AM | 203 (14.7%) | 112 (9.8%) |
| 6:30 AM to 6:59 AM | 198 (14.4%) | 101 (8.8%) |
| 7:00 AM to 7:29 AM | 243 (17.6%) | 201 (17.6%) |
| 7:30 AM to 7:59 AM | 262 (19.0%) | 96 (8.4%) |
| 8:00 AM to 8:29 AM | 76 (5.5%) | 197 (17.3%) |
| 8:30 AM to 8:59 AM | 14 (1.0%) | 69 (6.0%) |
| 9:00 AM to 9:59 AM | 46 (3.3%) | 75 (6.6%) |
| 10:00 AM to 10:59 AM | 13 (0.9%) | 17 (1.5%) |
| 11:00 AM to 11:59 AM | 12 (0.9%) | 57 (5.0%) |
| 12:00 PM to 3:59 PM | 89 (6.5%) | 62 (5.4%) |
| 4:00 PM to 11:59 PM | 60 (4.3%) | 121 (10.6%) |
| Total | 1,379 (100.0%) | 1,141 (100.0%) |
Housing Occupancy in Waterville
Occupancy by Ownership in Waterville
Of the total 2,363 dwellings in Waterville, owner-occupied units account for 1,917 (81.1%), while renter-occupied units make up 446 (18.9%).
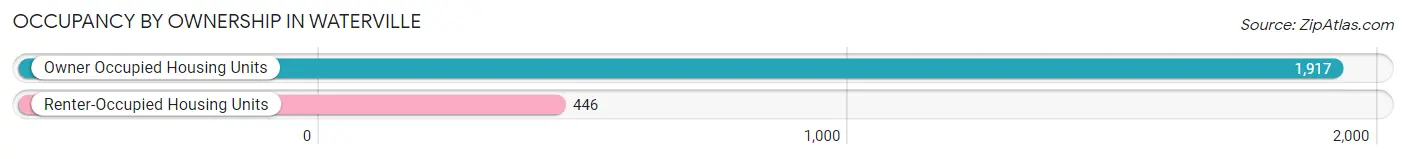
| Occupancy | # Housing Units | % Housing Units |
| Owner Occupied Housing Units | 1,917 | 81.1% |
| Renter-Occupied Housing Units | 446 | 18.9% |
| Total Occupied Housing Units | 2,363 | 100.0% |
Occupancy by Household Size in Waterville
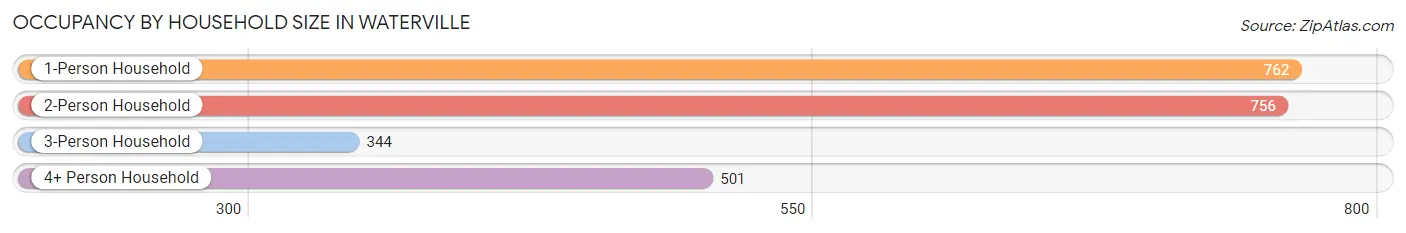
| Household Size | # Housing Units | % Housing Units |
| 1-Person Household | 762 | 32.3% |
| 2-Person Household | 756 | 32.0% |
| 3-Person Household | 344 | 14.6% |
| 4+ Person Household | 501 | 21.2% |
| Total Housing Units | 2,363 | 100.0% |
Occupancy by Ownership by Household Size in Waterville
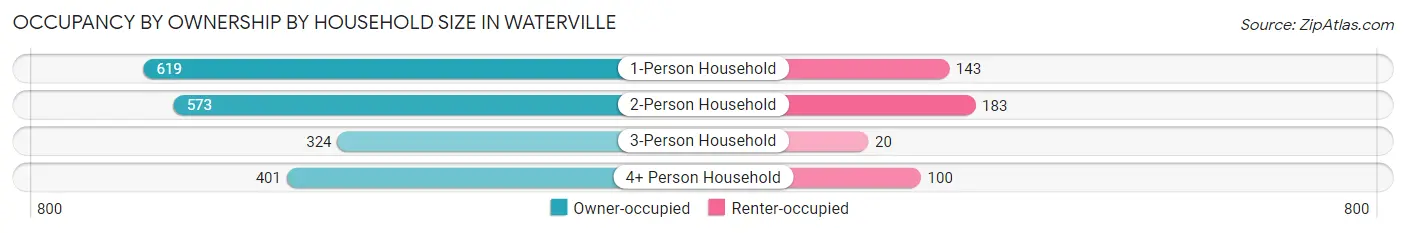
| Household Size | Owner-occupied | Renter-occupied |
| 1-Person Household | 619 (81.2%) | 143 (18.8%) |
| 2-Person Household | 573 (75.8%) | 183 (24.2%) |
| 3-Person Household | 324 (94.2%) | 20 (5.8%) |
| 4+ Person Household | 401 (80.0%) | 100 (20.0%) |
| Total Housing Units | 1,917 (81.1%) | 446 (18.9%) |
Occupancy by Educational Attainment in Waterville
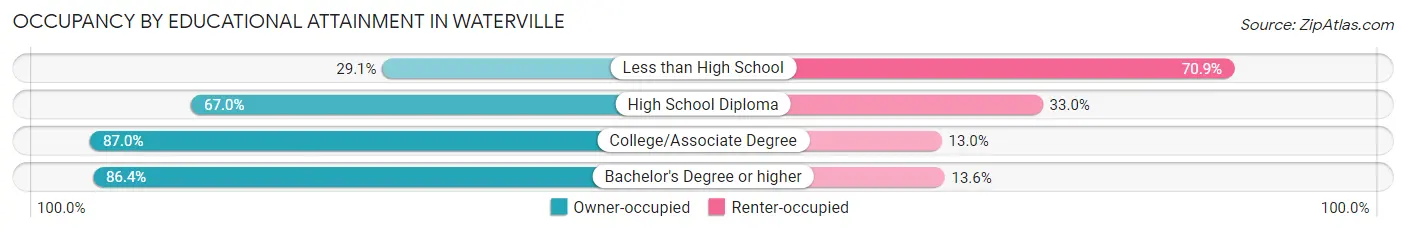
| Household Size | Owner-occupied | Renter-occupied |
| Less than High School | 25 (29.1%) | 61 (70.9%) |
| High School Diploma | 276 (67.0%) | 136 (33.0%) |
| College/Associate Degree | 577 (87.0%) | 86 (13.0%) |
| Bachelor's Degree or higher | 1,039 (86.4%) | 163 (13.6%) |
Occupancy by Age of Householder in Waterville
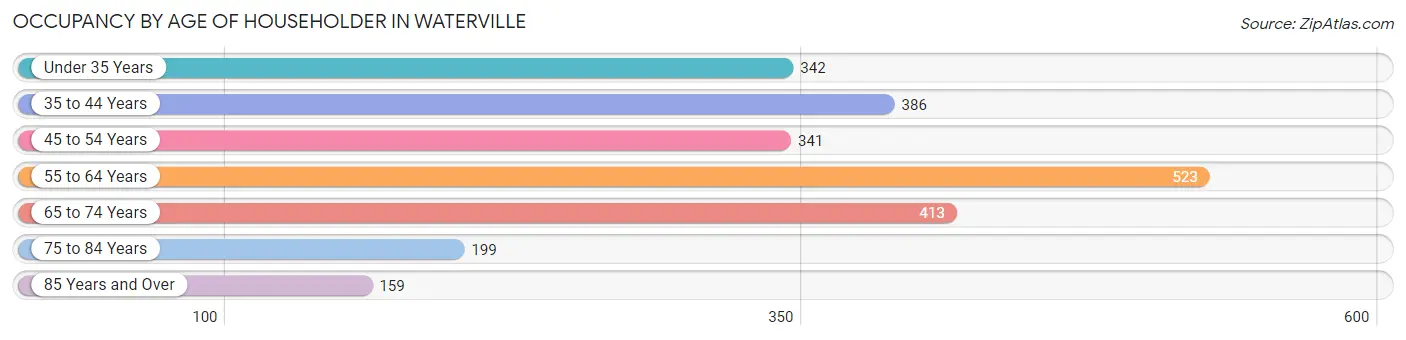
| Age Bracket | # Households | % Households |
| Under 35 Years | 342 | 14.5% |
| 35 to 44 Years | 386 | 16.3% |
| 45 to 54 Years | 341 | 14.4% |
| 55 to 64 Years | 523 | 22.1% |
| 65 to 74 Years | 413 | 17.5% |
| 75 to 84 Years | 199 | 8.4% |
| 85 Years and Over | 159 | 6.7% |
| Total | 2,363 | 100.0% |
Housing Finances in Waterville
Median Income by Occupancy in Waterville
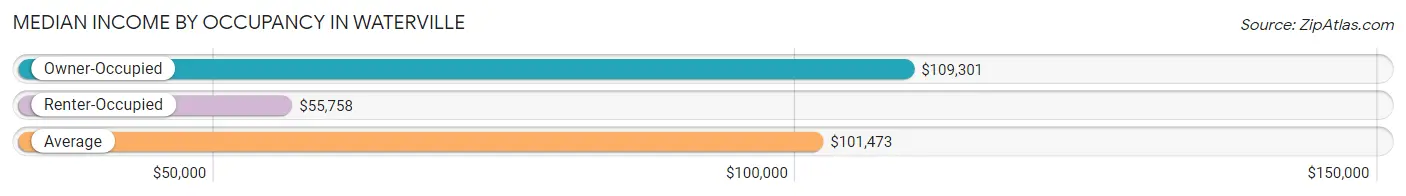
| Occupancy Type | # Households | Median Income |
| Owner-Occupied | 1,917 (81.1%) | $109,301 |
| Renter-Occupied | 446 (18.9%) | $55,758 |
| Average | 2,363 (100.0%) | $101,473 |
Occupancy by Householder Income Bracket in Waterville
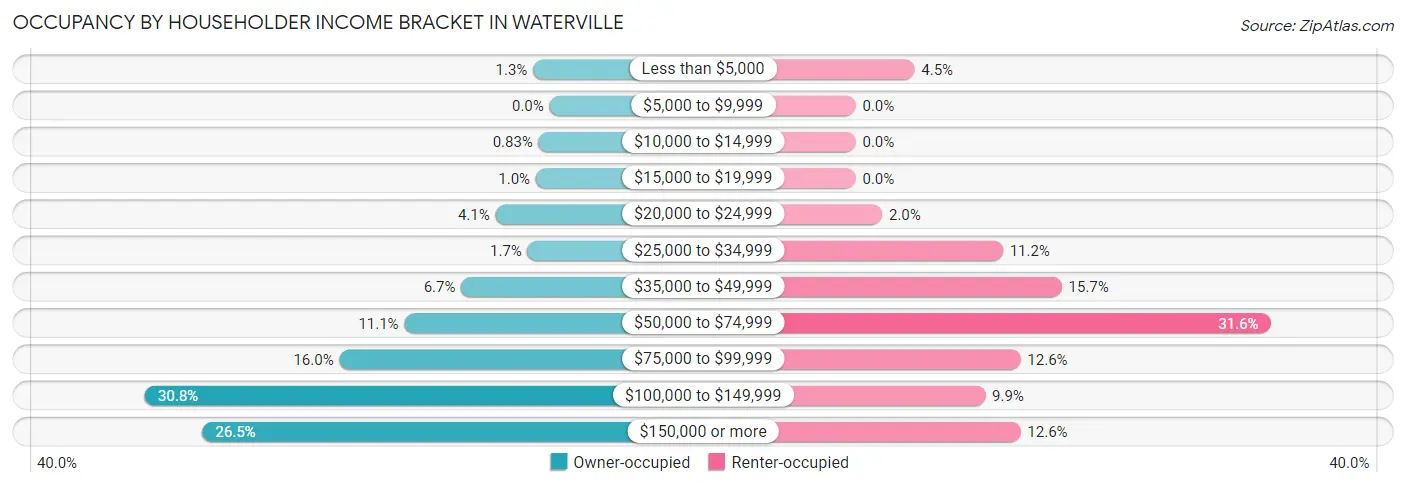
| Income Bracket | Owner-occupied | Renter-occupied |
| Less than $5,000 | 24 (1.3%) | 20 (4.5%) |
| $5,000 to $9,999 | 0 (0.0%) | 0 (0.0%) |
| $10,000 to $14,999 | 16 (0.8%) | 0 (0.0%) |
| $15,000 to $19,999 | 20 (1.0%) | 0 (0.0%) |
| $20,000 to $24,999 | 79 (4.1%) | 9 (2.0%) |
| $25,000 to $34,999 | 32 (1.7%) | 50 (11.2%) |
| $35,000 to $49,999 | 129 (6.7%) | 70 (15.7%) |
| $50,000 to $74,999 | 212 (11.1%) | 141 (31.6%) |
| $75,000 to $99,999 | 307 (16.0%) | 56 (12.6%) |
| $100,000 to $149,999 | 591 (30.8%) | 44 (9.9%) |
| $150,000 or more | 507 (26.5%) | 56 (12.6%) |
| Total | 1,917 (100.0%) | 446 (100.0%) |
Monthly Housing Cost Tiers in Waterville
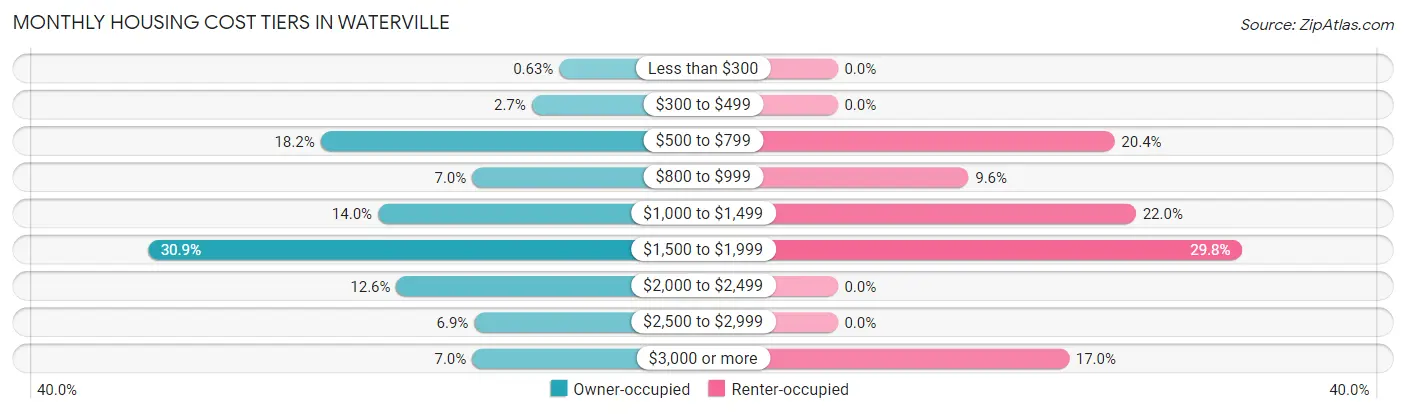
| Monthly Cost | Owner-occupied | Renter-occupied |
| Less than $300 | 12 (0.6%) | 0 (0.0%) |
| $300 to $499 | 51 (2.7%) | 0 (0.0%) |
| $500 to $799 | 349 (18.2%) | 91 (20.4%) |
| $800 to $999 | 135 (7.0%) | 43 (9.6%) |
| $1,000 to $1,499 | 268 (14.0%) | 98 (22.0%) |
| $1,500 to $1,999 | 593 (30.9%) | 133 (29.8%) |
| $2,000 to $2,499 | 242 (12.6%) | 0 (0.0%) |
| $2,500 to $2,999 | 132 (6.9%) | 0 (0.0%) |
| $3,000 or more | 135 (7.0%) | 76 (17.0%) |
| Total | 1,917 (100.0%) | 446 (100.0%) |
Physical Housing Characteristics in Waterville
Housing Structures in Waterville
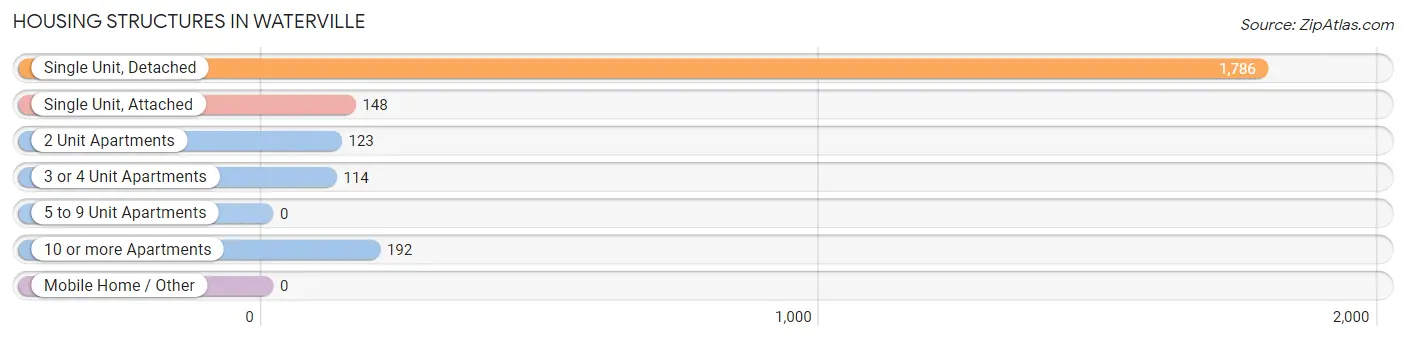
| Structure Type | # Housing Units | % Housing Units |
| Single Unit, Detached | 1,786 | 75.6% |
| Single Unit, Attached | 148 | 6.3% |
| 2 Unit Apartments | 123 | 5.2% |
| 3 or 4 Unit Apartments | 114 | 4.8% |
| 5 to 9 Unit Apartments | 0 | 0.0% |
| 10 or more Apartments | 192 | 8.1% |
| Mobile Home / Other | 0 | 0.0% |
| Total | 2,363 | 100.0% |
Housing Structures by Occupancy in Waterville
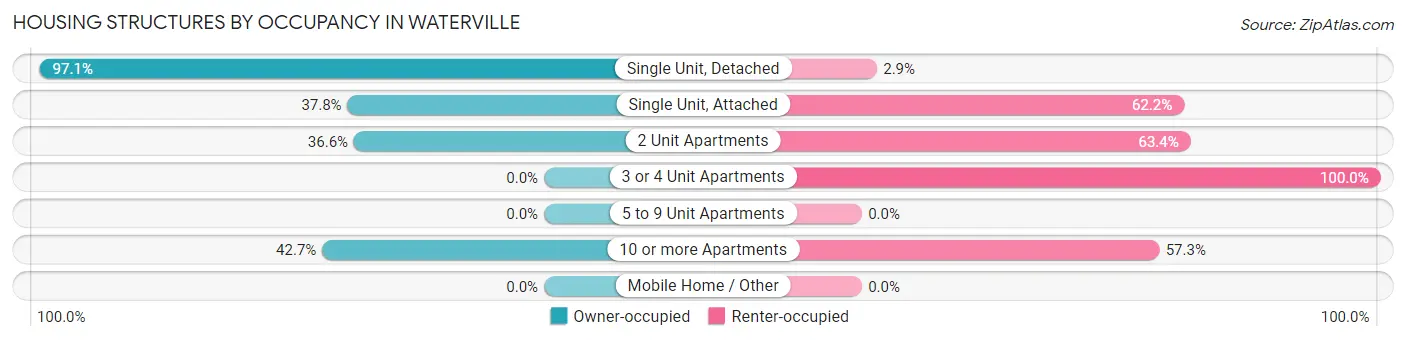
| Structure Type | Owner-occupied | Renter-occupied |
| Single Unit, Detached | 1,734 (97.1%) | 52 (2.9%) |
| Single Unit, Attached | 56 (37.8%) | 92 (62.2%) |
| 2 Unit Apartments | 45 (36.6%) | 78 (63.4%) |
| 3 or 4 Unit Apartments | 0 (0.0%) | 114 (100.0%) |
| 5 to 9 Unit Apartments | 0 (0.0%) | 0 (0.0%) |
| 10 or more Apartments | 82 (42.7%) | 110 (57.3%) |
| Mobile Home / Other | 0 (0.0%) | 0 (0.0%) |
| Total | 1,917 (81.1%) | 446 (18.9%) |
Housing Structures by Number of Rooms in Waterville
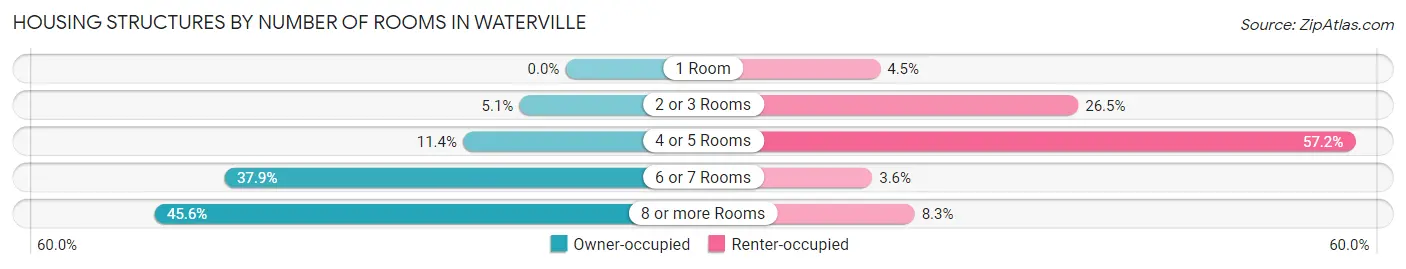
| Number of Rooms | Owner-occupied | Renter-occupied |
| 1 Room | 0 (0.0%) | 20 (4.5%) |
| 2 or 3 Rooms | 98 (5.1%) | 118 (26.5%) |
| 4 or 5 Rooms | 218 (11.4%) | 255 (57.2%) |
| 6 or 7 Rooms | 726 (37.9%) | 16 (3.6%) |
| 8 or more Rooms | 875 (45.6%) | 37 (8.3%) |
| Total | 1,917 (100.0%) | 446 (100.0%) |
Housing Structure by Heating Type in Waterville
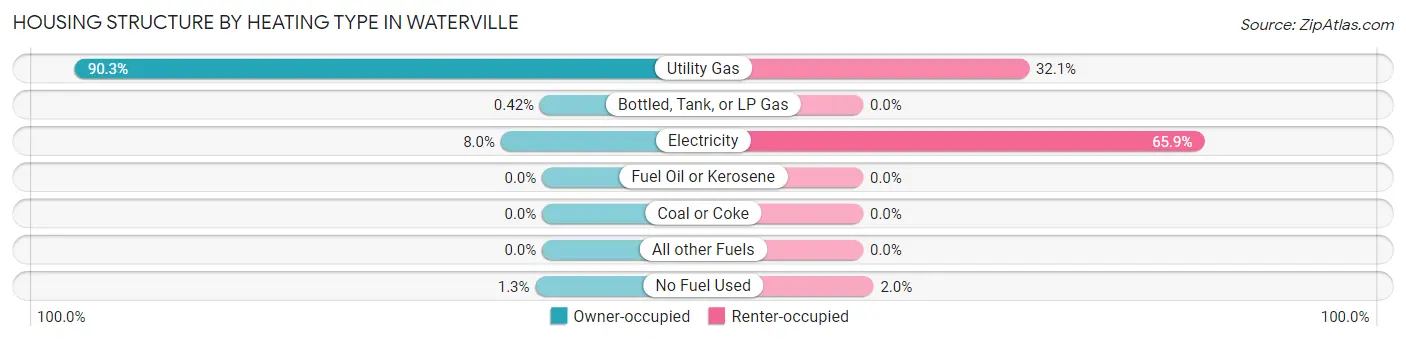
| Heating Type | Owner-occupied | Renter-occupied |
| Utility Gas | 1,731 (90.3%) | 143 (32.1%) |
| Bottled, Tank, or LP Gas | 8 (0.4%) | 0 (0.0%) |
| Electricity | 153 (8.0%) | 294 (65.9%) |
| Fuel Oil or Kerosene | 0 (0.0%) | 0 (0.0%) |
| Coal or Coke | 0 (0.0%) | 0 (0.0%) |
| All other Fuels | 0 (0.0%) | 0 (0.0%) |
| No Fuel Used | 25 (1.3%) | 9 (2.0%) |
| Total | 1,917 (100.0%) | 446 (100.0%) |
Household Vehicle Usage in Waterville
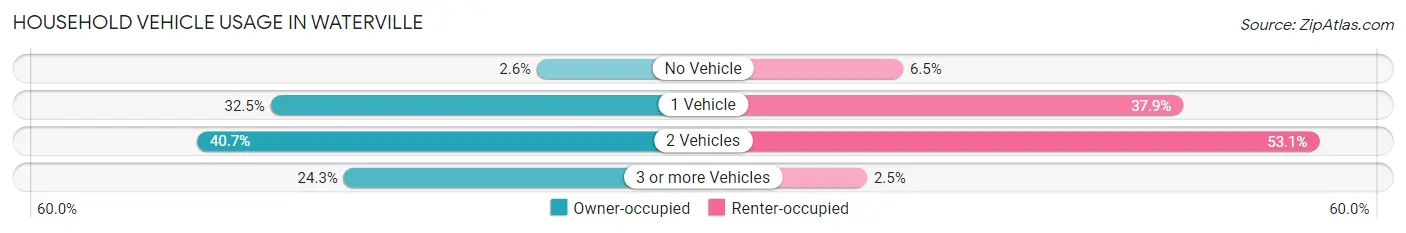
| Vehicles per Household | Owner-occupied | Renter-occupied |
| No Vehicle | 50 (2.6%) | 29 (6.5%) |
| 1 Vehicle | 622 (32.5%) | 169 (37.9%) |
| 2 Vehicles | 780 (40.7%) | 237 (53.1%) |
| 3 or more Vehicles | 465 (24.3%) | 11 (2.5%) |
| Total | 1,917 (100.0%) | 446 (100.0%) |
Real Estate & Mortgages in Waterville
Real Estate and Mortgage Overview in Waterville
| Characteristic | Without Mortgage | With Mortgage |
| Housing Units | 497 | 1,420 |
| Median Property Value | $240,300 | $264,900 |
| Median Household Income | $74,612 | $410 |
| Monthly Housing Costs | $641 | $135 |
| Real Estate Taxes | $3,835 | $0 |
Property Value by Mortgage Status in Waterville
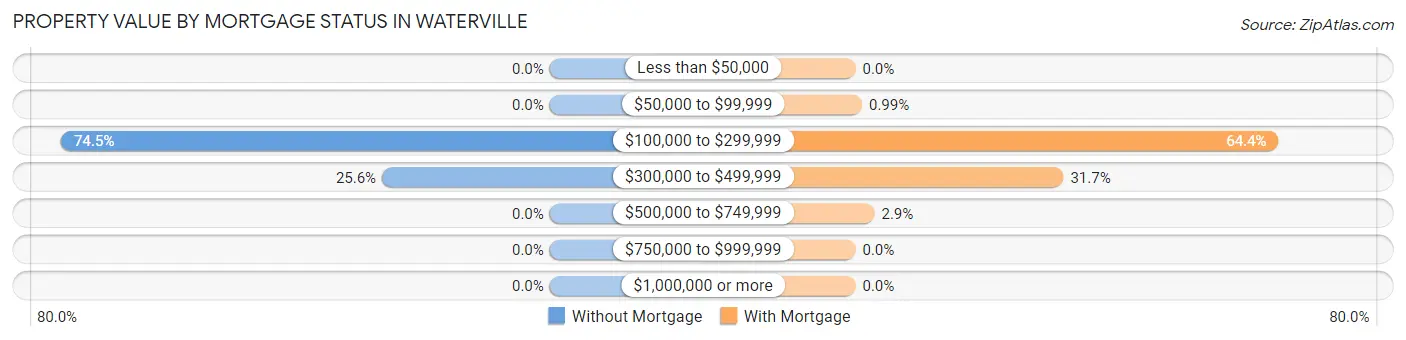
| Property Value | Without Mortgage | With Mortgage |
| Less than $50,000 | 0 (0.0%) | 0 (0.0%) |
| $50,000 to $99,999 | 0 (0.0%) | 14 (1.0%) |
| $100,000 to $299,999 | 370 (74.5%) | 915 (64.4%) |
| $300,000 to $499,999 | 127 (25.6%) | 450 (31.7%) |
| $500,000 to $749,999 | 0 (0.0%) | 41 (2.9%) |
| $750,000 to $999,999 | 0 (0.0%) | 0 (0.0%) |
| $1,000,000 or more | 0 (0.0%) | 0 (0.0%) |
| Total | 497 (100.0%) | 1,420 (100.0%) |
Household Income by Mortgage Status in Waterville
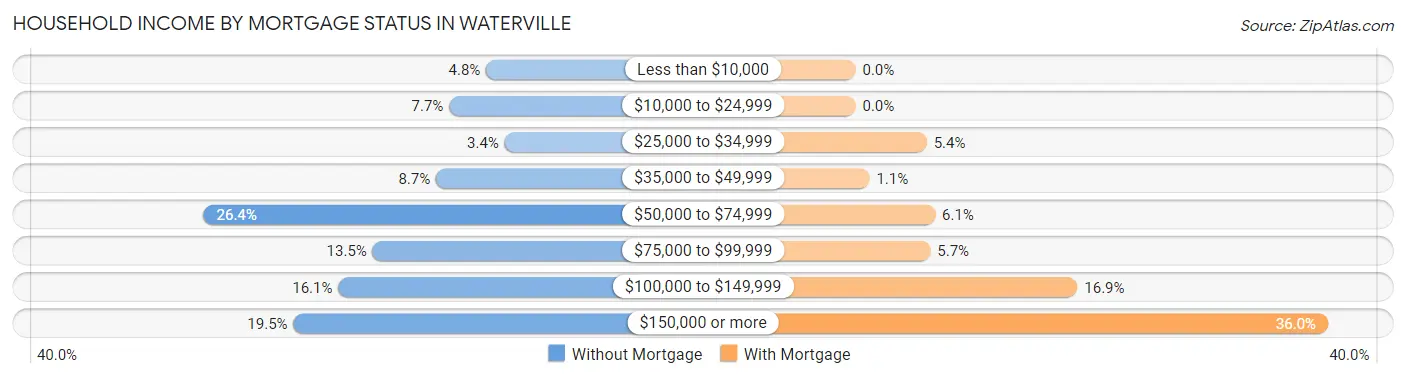
| Household Income | Without Mortgage | With Mortgage |
| Less than $10,000 | 24 (4.8%) | 0 (0.0%) |
| $10,000 to $24,999 | 38 (7.6%) | 0 (0.0%) |
| $25,000 to $34,999 | 17 (3.4%) | 77 (5.4%) |
| $35,000 to $49,999 | 43 (8.6%) | 15 (1.1%) |
| $50,000 to $74,999 | 131 (26.4%) | 86 (6.1%) |
| $75,000 to $99,999 | 67 (13.5%) | 81 (5.7%) |
| $100,000 to $149,999 | 80 (16.1%) | 240 (16.9%) |
| $150,000 or more | 97 (19.5%) | 511 (36.0%) |
| Total | 497 (100.0%) | 1,420 (100.0%) |
Property Value to Household Income Ratio in Waterville
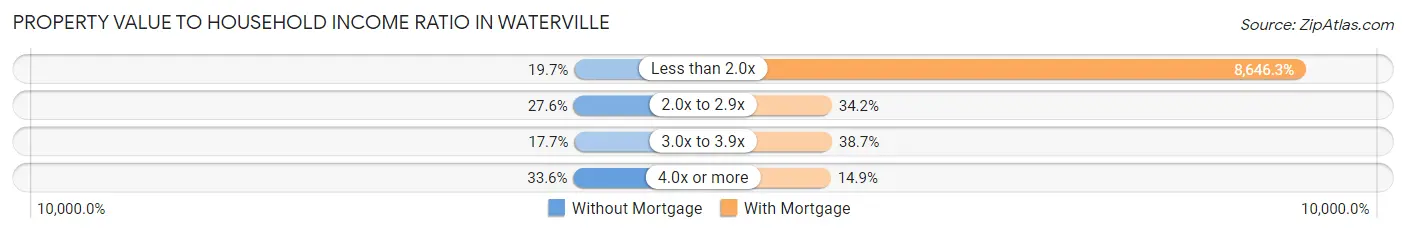
| Value-to-Income Ratio | Without Mortgage | With Mortgage |
| Less than 2.0x | 98 (19.7%) | 122,778 (8,646.3%) |
| 2.0x to 2.9x | 137 (27.6%) | 485 (34.2%) |
| 3.0x to 3.9x | 88 (17.7%) | 550 (38.7%) |
| 4.0x or more | 167 (33.6%) | 211 (14.9%) |
| Total | 497 (100.0%) | 1,420 (100.0%) |
Real Estate Taxes by Mortgage Status in Waterville
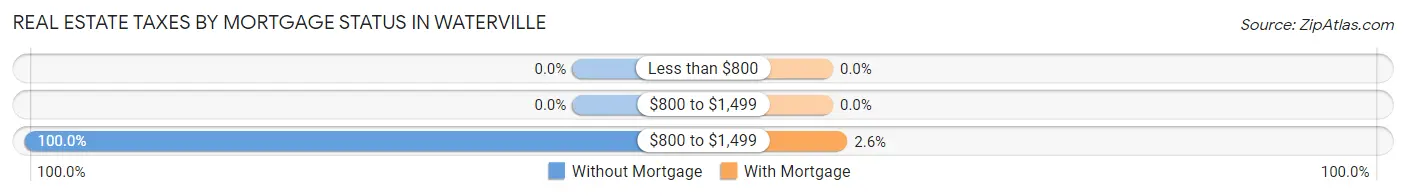
| Property Taxes | Without Mortgage | With Mortgage |
| Less than $800 | 0 (0.0%) | 0 (0.0%) |
| $800 to $1,499 | 0 (0.0%) | 0 (0.0%) |
| $800 to $1,499 | 497 (100.0%) | 37 (2.6%) |
| Total | 497 (100.0%) | 1,420 (100.0%) |
Health & Disability in Waterville
Health Insurance Coverage by Age in Waterville
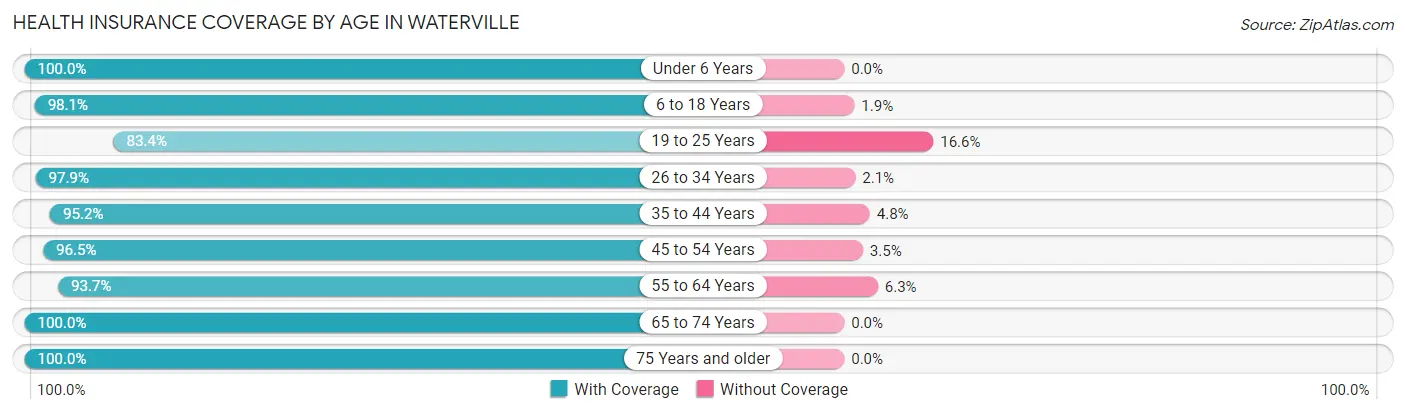
| Age Bracket | With Coverage | Without Coverage |
| Under 6 Years | 453 (100.0%) | 0 (0.0%) |
| 6 to 18 Years | 1,093 (98.1%) | 21 (1.9%) |
| 19 to 25 Years | 206 (83.4%) | 41 (16.6%) |
| 26 to 34 Years | 619 (97.9%) | 13 (2.1%) |
| 35 to 44 Years | 720 (95.2%) | 36 (4.8%) |
| 45 to 54 Years | 584 (96.5%) | 21 (3.5%) |
| 55 to 64 Years | 838 (93.7%) | 56 (6.3%) |
| 65 to 74 Years | 640 (100.0%) | 0 (0.0%) |
| 75 Years and older | 493 (100.0%) | 0 (0.0%) |
| Total | 5,646 (96.8%) | 188 (3.2%) |
Health Insurance Coverage by Citizenship Status in Waterville
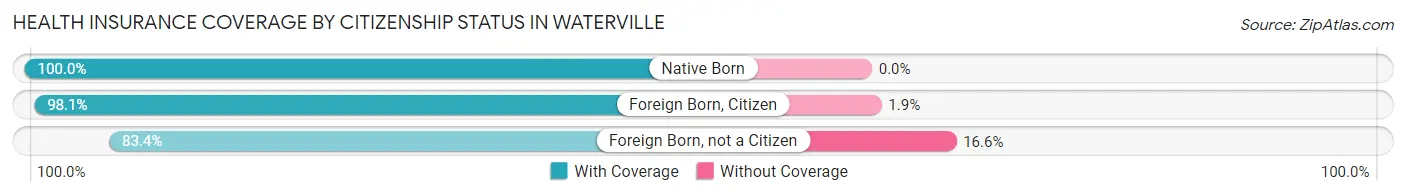
| Citizenship Status | With Coverage | Without Coverage |
| Native Born | 453 (100.0%) | 0 (0.0%) |
| Foreign Born, Citizen | 1,093 (98.1%) | 21 (1.9%) |
| Foreign Born, not a Citizen | 206 (83.4%) | 41 (16.6%) |
Health Insurance Coverage by Household Income in Waterville
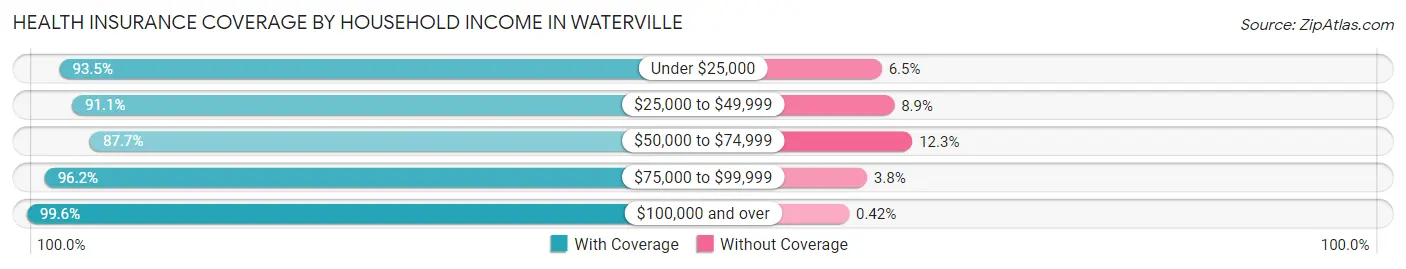
| Household Income | With Coverage | Without Coverage |
| Under $25,000 | 200 (93.5%) | 14 (6.5%) |
| $25,000 to $49,999 | 451 (91.1%) | 44 (8.9%) |
| $50,000 to $74,999 | 587 (87.7%) | 82 (12.3%) |
| $75,000 to $99,999 | 842 (96.2%) | 33 (3.8%) |
| $100,000 and over | 3,566 (99.6%) | 15 (0.4%) |
Public vs Private Health Insurance Coverage by Age in Waterville
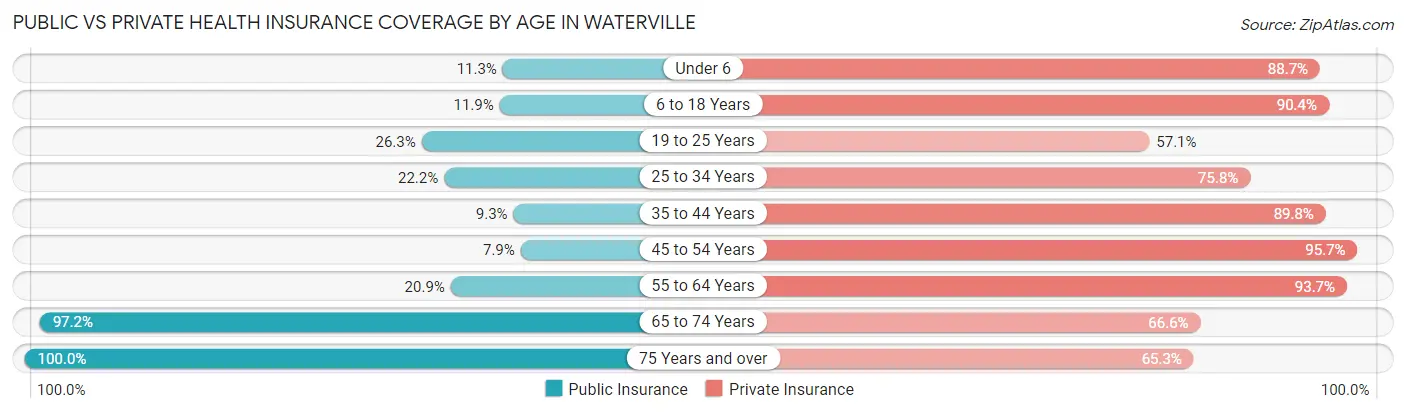
| Age Bracket | Public Insurance | Private Insurance |
| Under 6 | 51 (11.3%) | 402 (88.7%) |
| 6 to 18 Years | 132 (11.8%) | 1,007 (90.4%) |
| 19 to 25 Years | 65 (26.3%) | 141 (57.1%) |
| 25 to 34 Years | 140 (22.2%) | 479 (75.8%) |
| 35 to 44 Years | 70 (9.3%) | 679 (89.8%) |
| 45 to 54 Years | 48 (7.9%) | 579 (95.7%) |
| 55 to 64 Years | 187 (20.9%) | 838 (93.7%) |
| 65 to 74 Years | 622 (97.2%) | 426 (66.6%) |
| 75 Years and over | 493 (100.0%) | 322 (65.3%) |
| Total | 1,808 (31.0%) | 4,873 (83.5%) |
Disability Status by Sex by Age in Waterville
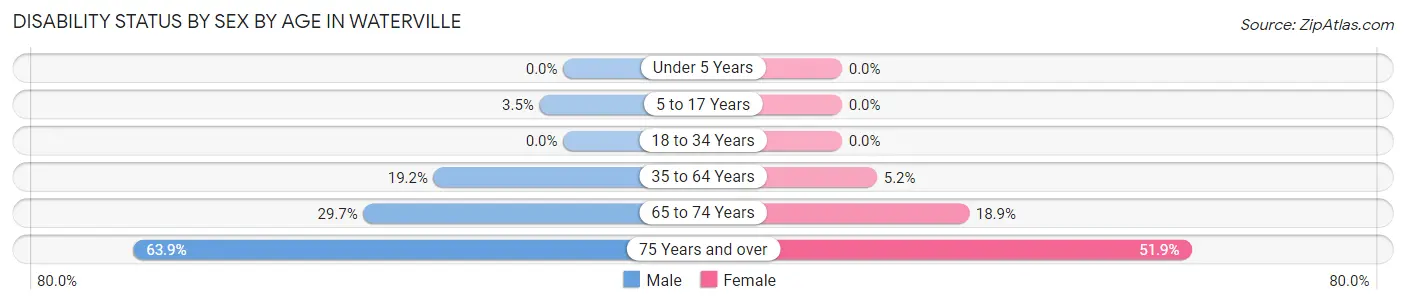
| Age Bracket | Male | Female |
| Under 5 Years | 0 (0.0%) | 0 (0.0%) |
| 5 to 17 Years | 27 (3.5%) | 0 (0.0%) |
| 18 to 34 Years | 0 (0.0%) | 0 (0.0%) |
| 35 to 64 Years | 212 (19.2%) | 60 (5.2%) |
| 65 to 74 Years | 86 (29.7%) | 66 (18.9%) |
| 75 Years and over | 129 (63.9%) | 151 (51.9%) |
Disability Class by Sex by Age in Waterville
Disability Class: Hearing Difficulty
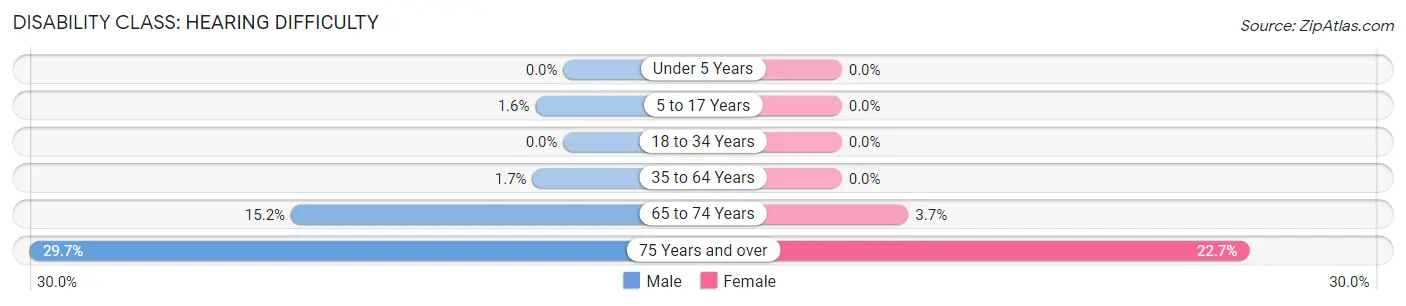
| Age Bracket | Male | Female |
| Under 5 Years | 0 (0.0%) | 0 (0.0%) |
| 5 to 17 Years | 12 (1.6%) | 0 (0.0%) |
| 18 to 34 Years | 0 (0.0%) | 0 (0.0%) |
| 35 to 64 Years | 19 (1.7%) | 0 (0.0%) |
| 65 to 74 Years | 44 (15.2%) | 13 (3.7%) |
| 75 Years and over | 60 (29.7%) | 66 (22.7%) |
Disability Class: Vision Difficulty
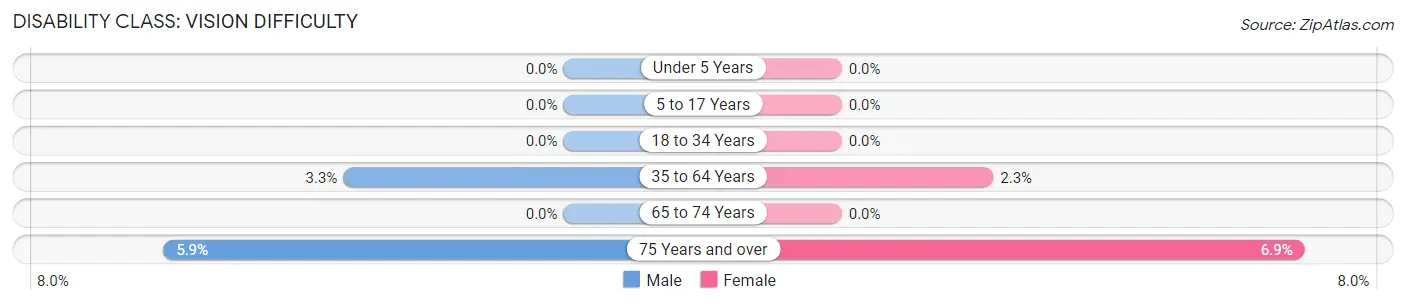
| Age Bracket | Male | Female |
| Under 5 Years | 0 (0.0%) | 0 (0.0%) |
| 5 to 17 Years | 0 (0.0%) | 0 (0.0%) |
| 18 to 34 Years | 0 (0.0%) | 0 (0.0%) |
| 35 to 64 Years | 36 (3.3%) | 26 (2.2%) |
| 65 to 74 Years | 0 (0.0%) | 0 (0.0%) |
| 75 Years and over | 12 (5.9%) | 20 (6.9%) |
Disability Class: Cognitive Difficulty
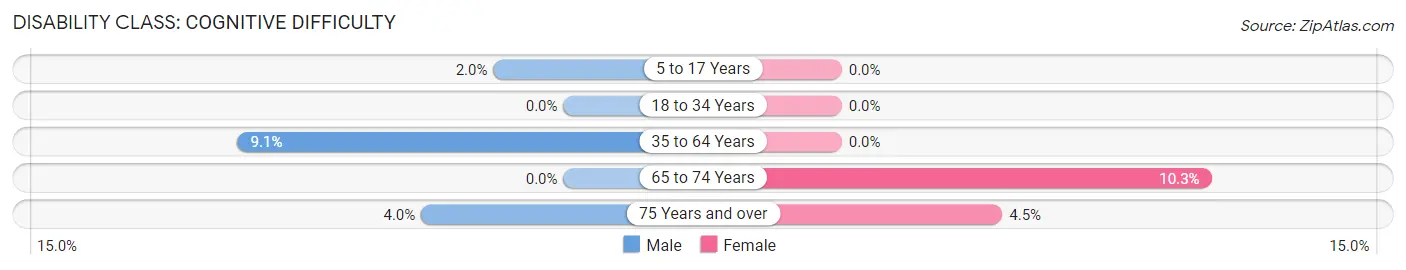
| Age Bracket | Male | Female |
| 5 to 17 Years | 15 (1.9%) | 0 (0.0%) |
| 18 to 34 Years | 0 (0.0%) | 0 (0.0%) |
| 35 to 64 Years | 100 (9.1%) | 0 (0.0%) |
| 65 to 74 Years | 0 (0.0%) | 36 (10.3%) |
| 75 Years and over | 8 (4.0%) | 13 (4.5%) |
Disability Class: Ambulatory Difficulty
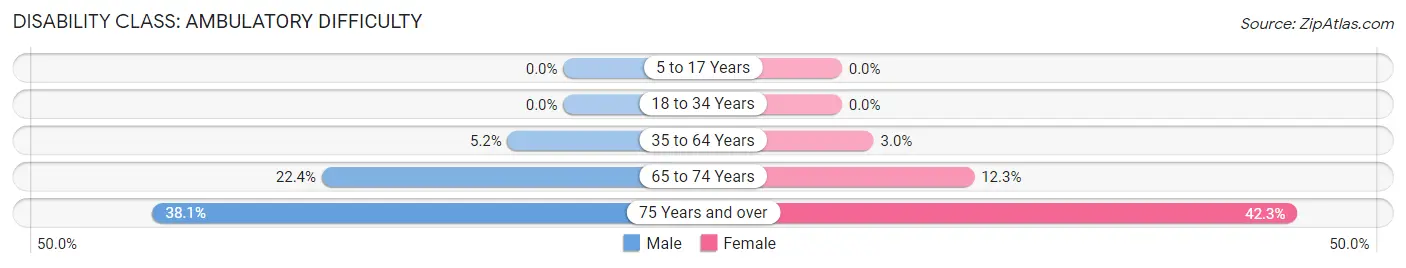
| Age Bracket | Male | Female |
| 5 to 17 Years | 0 (0.0%) | 0 (0.0%) |
| 18 to 34 Years | 0 (0.0%) | 0 (0.0%) |
| 35 to 64 Years | 57 (5.2%) | 34 (2.9%) |
| 65 to 74 Years | 65 (22.4%) | 43 (12.3%) |
| 75 Years and over | 77 (38.1%) | 123 (42.3%) |
Disability Class: Self-Care Difficulty
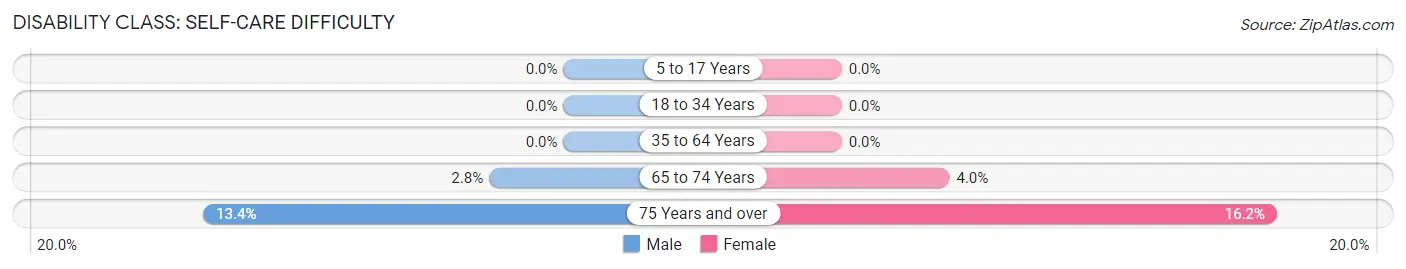
| Age Bracket | Male | Female |
| 5 to 17 Years | 0 (0.0%) | 0 (0.0%) |
| 18 to 34 Years | 0 (0.0%) | 0 (0.0%) |
| 35 to 64 Years | 0 (0.0%) | 0 (0.0%) |
| 65 to 74 Years | 8 (2.8%) | 14 (4.0%) |
| 75 Years and over | 27 (13.4%) | 47 (16.2%) |
Technology Access in Waterville
Computing Device Access in Waterville
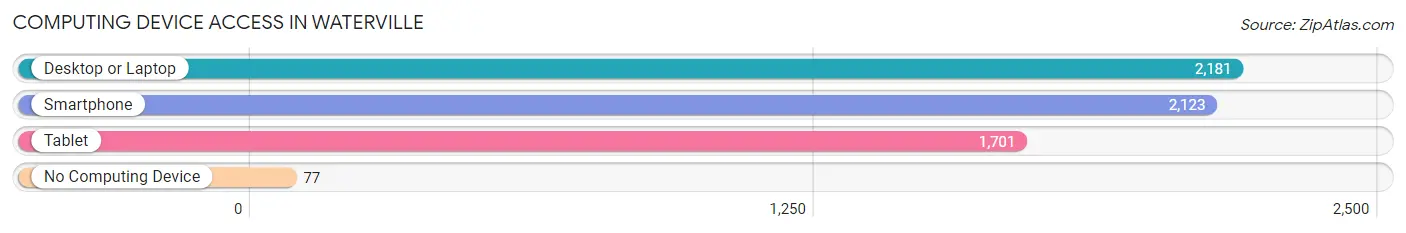
| Device Type | # Households | % Households |
| Desktop or Laptop | 2,181 | 92.3% |
| Smartphone | 2,123 | 89.8% |
| Tablet | 1,701 | 72.0% |
| No Computing Device | 77 | 3.3% |
| Total | 2,363 | 100.0% |
Internet Access in Waterville
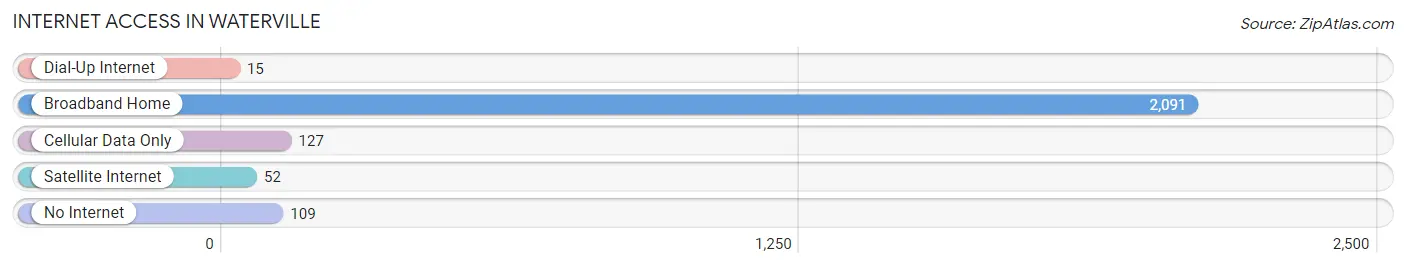
| Internet Type | # Households | % Households |
| Dial-Up Internet | 15 | 0.6% |
| Broadband Home | 2,091 | 88.5% |
| Cellular Data Only | 127 | 5.4% |
| Satellite Internet | 52 | 2.2% |
| No Internet | 109 | 4.6% |
| Total | 2,363 | 100.0% |
Waterville Summary
Waterville is a small city located in Lucas County, Ohio, United States. It is situated on the Maumee River, approximately 20 miles southwest of Toledo. The city has a population of 5,523 as of the 2010 census.
History
Waterville was founded in 1835 by a group of settlers from New England. The town was named after Waterville, Maine, the hometown of one of the settlers. The first post office was established in 1837.
In 1845, the first bridge across the Maumee River was built in Waterville. This bridge was replaced in 1871 by a steel bridge, which was in turn replaced by a concrete bridge in 1915.
The first school in Waterville was established in 1837 The first church was built in 1845
In 1854 Waterville was incorporated as a village The first mayor was elected in 1855
In 1867, Waterville was connected to the Toledo and Ohio Central Railroad. This allowed for the growth of the city's economy.
In 1871 Waterville was incorporated as a city
Geography
Waterville is located at 41°30'N, 83°37'W (41.50, -83.62). According to the United States Census Bureau, the city has a total area of 4.2 square miles (10.8 km2), of which 4.1 square miles (10.6 km2) is land and 0.1 square miles (0.2 km2) is water.
Economy
Waterville's economy is largely based on manufacturing and retail. The city is home to several factories, including a paper mill, a steel mill, and a plastics plant. Waterville is also home to several retail stores, including a Walmart Supercenter, a Lowe's Home Improvement store, and a variety of restaurants.
Demographics
As of the 2010 census, Waterville had a population of 5,523. The racial makeup of the city was 94.2% White, 1.7% African American, 0.3% Native American, 0.7% Asian, 0.1% Pacific Islander, 1.2% from other races, and 1.9% from two or more races. Hispanic or Latino of any race were 3.2% of the population.
The median income for a household in Waterville was $45,938, and the median income for a family was $54,938. The per capita income for the city was $21,945. About 8.2% of families and 10.2% of the population were below the poverty line, including 14.2% of those under age 18 and 6.2% of those age 65 or over.
Common Questions
What is Per Capita Income in Waterville?
Per Capita income in Waterville is $48,157.
What is the Median Family Income in Waterville?
Median Family Income in Waterville is $109,322.
What is the Median Household income in Waterville?
Median Household Income in Waterville is $101,473.
What is Income or Wage Gap in Waterville?
Income or Wage Gap in Waterville is 41.2%.
Women in Waterville earn 58.8 cents for every dollar earned by a man.
What is Inequality or Gini Index in Waterville?
Inequality or Gini Index in Waterville is 0.38.
What is the Total Population of Waterville?
Total Population of Waterville is 5,980.
What is the Total Male Population of Waterville?
Total Male Population of Waterville is 3,028.
What is the Total Female Population of Waterville?
Total Female Population of Waterville is 2,952.
What is the Ratio of Males per 100 Females in Waterville?
There are 102.57 Males per 100 Females in Waterville.
What is the Ratio of Females per 100 Males in Waterville?
There are 97.49 Females per 100 Males in Waterville.
What is the Median Population Age in Waterville?
Median Population Age in Waterville is 40.9 Years.
What is the Average Family Size in Waterville
Average Family Size in Waterville is 3.2 People.
What is the Average Household Size in Waterville
Average Household Size in Waterville is 2.5 People.
How Large is the Labor Force in Waterville?
There are 2,964 People in the Labor Forcein in Waterville.
What is the Percentage of People in the Labor Force in Waterville?
63.7% of People are in the Labor Force in Waterville.
What is the Unemployment Rate in Waterville?
Unemployment Rate in Waterville is 4.5%.