Covedale, OH Map & Demographics
Covedale Map
Covedale Overview
$48,465
PER CAPITA INCOME
$115,179
AVG FAMILY INCOME
$90,665
AVG HOUSEHOLD INCOME
18.0%
WAGE / INCOME GAP [ % ]
82.0¢/ $1
WAGE / INCOME GAP [ $ ]
0.44
INEQUALITY / GINI INDEX
6,426
TOTAL POPULATION
3,252
MALE POPULATION
3,174
FEMALE POPULATION
102.46
MALES / 100 FEMALES
97.60
FEMALES / 100 MALES
40.9
MEDIAN AGE
3.0
AVG FAMILY SIZE
2.5
AVG HOUSEHOLD SIZE
3,070
LABOR FORCE [ PEOPLE ]
64.9%
PERCENT IN LABOR FORCE
0.6%
UNEMPLOYMENT RATE
Income in Covedale
Income Overview in Covedale
Per Capita Income in Covedale is $48,465, while median incomes of families and households are $115,179 and $90,665 respectively.
| Characteristic | Number | Measure |
| Per Capita Income | 6,426 | $48,465 |
| Median Family Income | 1,829 | $115,179 |
| Mean Family Income | 1,829 | $145,163 |
| Median Household Income | 2,539 | $90,665 |
| Mean Household Income | 2,539 | $123,354 |
| Income Deficit | 1,829 | $0 |
| Wage / Income Gap (%) | 6,426 | 18.04% |
| Wage / Income Gap ($) | 6,426 | 81.96¢ per $1 |
| Gini / Inequality Index | 6,426 | 0.44 |
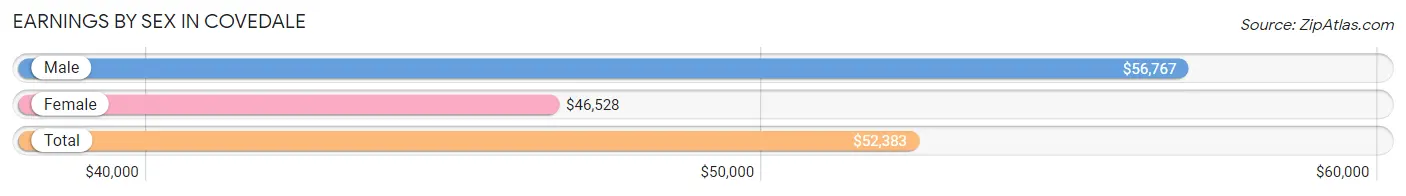
Earnings by Sex in Covedale
Average Earnings in Covedale are $52,383, $56,767 for men and $46,528 for women, a difference of 18.0%.
| Sex | Number | Average Earnings |
| Male | 1,780 (54.1%) | $56,767 |
| Female | 1,507 (45.9%) | $46,528 |
| Total | 3,287 (100.0%) | $52,383 |
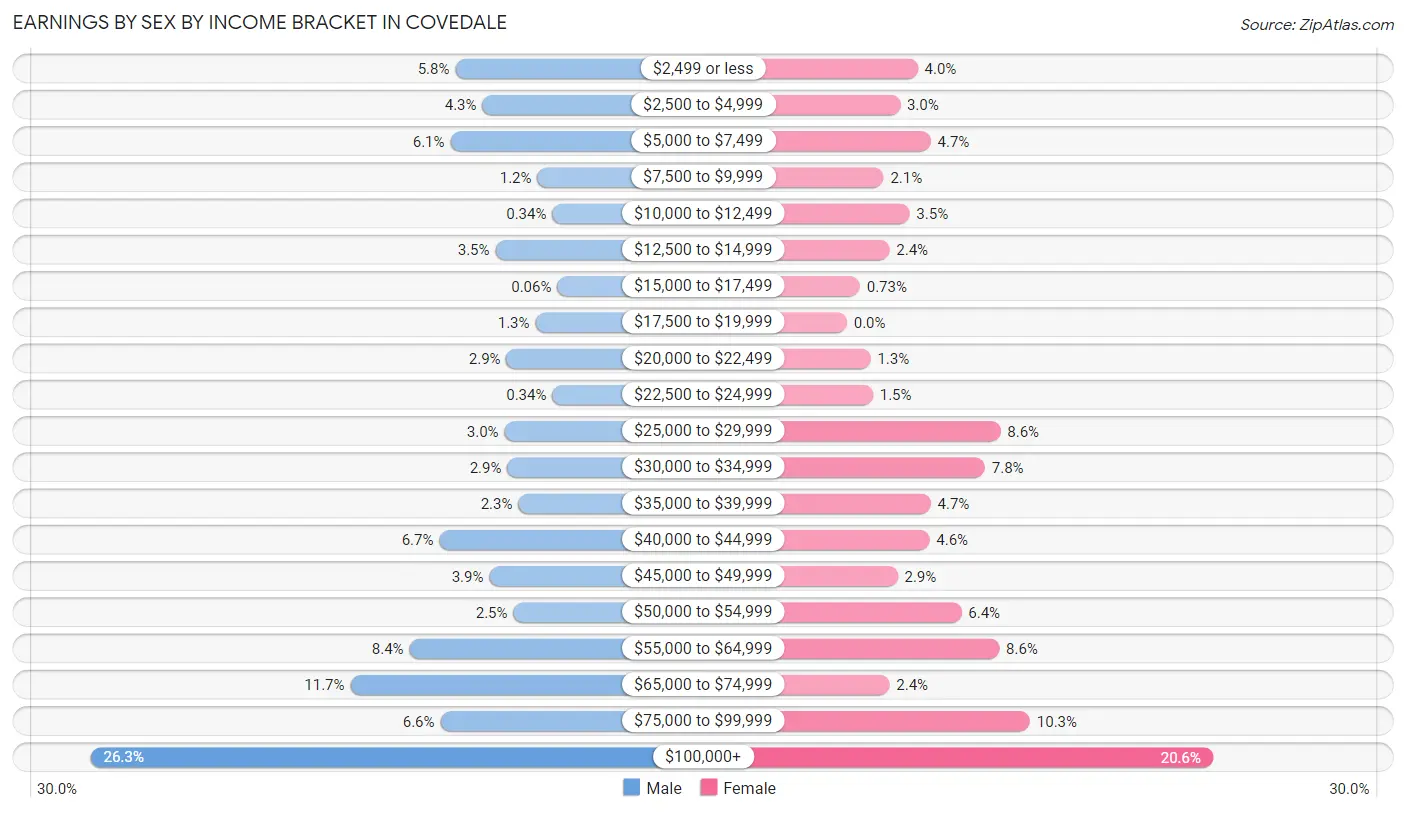
Earnings by Sex by Income Bracket in Covedale
The most common earnings brackets in Covedale are $100,000+ for men (468 | 26.3%) and $100,000+ for women (310 | 20.6%).
| Income | Male | Female |
| $2,499 or less | 103 (5.8%) | 60 (4.0%) |
| $2,500 to $4,999 | 76 (4.3%) | 45 (3.0%) |
| $5,000 to $7,499 | 108 (6.1%) | 71 (4.7%) |
| $7,500 to $9,999 | 21 (1.2%) | 31 (2.1%) |
| $10,000 to $12,499 | 6 (0.3%) | 53 (3.5%) |
| $12,500 to $14,999 | 63 (3.5%) | 36 (2.4%) |
| $15,000 to $17,499 | 1 (0.1%) | 11 (0.7%) |
| $17,500 to $19,999 | 23 (1.3%) | 0 (0.0%) |
| $20,000 to $22,499 | 52 (2.9%) | 20 (1.3%) |
| $22,500 to $24,999 | 6 (0.3%) | 22 (1.5%) |
| $25,000 to $29,999 | 54 (3.0%) | 130 (8.6%) |
| $30,000 to $34,999 | 51 (2.9%) | 117 (7.8%) |
| $35,000 to $39,999 | 40 (2.2%) | 71 (4.7%) |
| $40,000 to $44,999 | 119 (6.7%) | 70 (4.6%) |
| $45,000 to $49,999 | 69 (3.9%) | 43 (2.9%) |
| $50,000 to $54,999 | 45 (2.5%) | 97 (6.4%) |
| $55,000 to $64,999 | 149 (8.4%) | 129 (8.6%) |
| $65,000 to $74,999 | 208 (11.7%) | 36 (2.4%) |
| $75,000 to $99,999 | 118 (6.6%) | 155 (10.3%) |
| $100,000+ | 468 (26.3%) | 310 (20.6%) |
| Total | 1,780 (100.0%) | 1,507 (100.0%) |
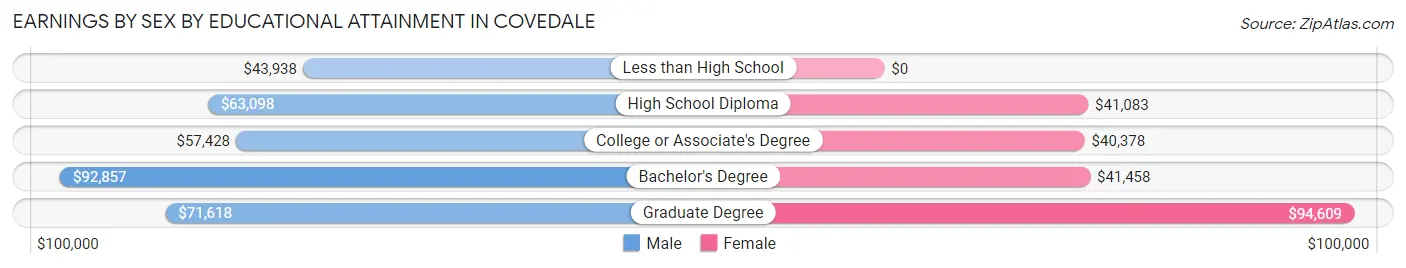
Earnings by Sex by Educational Attainment in Covedale
Average earnings in Covedale are $68,045 for men and $51,472 for women, a difference of 24.4%. Men with an educational attainment of bachelor's degree enjoy the highest average annual earnings of $92,857, while those with less than high school education earn the least with $43,938. Women with an educational attainment of graduate degree earn the most with the average annual earnings of $94,609, while those with college or associate's degree education have the smallest earnings of $40,378.
| Educational Attainment | Male Income | Female Income |
| Less than High School | $43,938 | $0 |
| High School Diploma | $63,098 | $41,083 |
| College or Associate's Degree | $57,428 | $40,378 |
| Bachelor's Degree | $92,857 | $41,458 |
| Graduate Degree | $71,618 | $94,609 |
| Total | $68,045 | $51,472 |
Family Income in Covedale
Family Income Brackets in Covedale
According to the Covedale family income data, there are 419 families falling into the $100,000 to $149,999 income range, which is the most common income bracket and makes up 22.9% of all families.
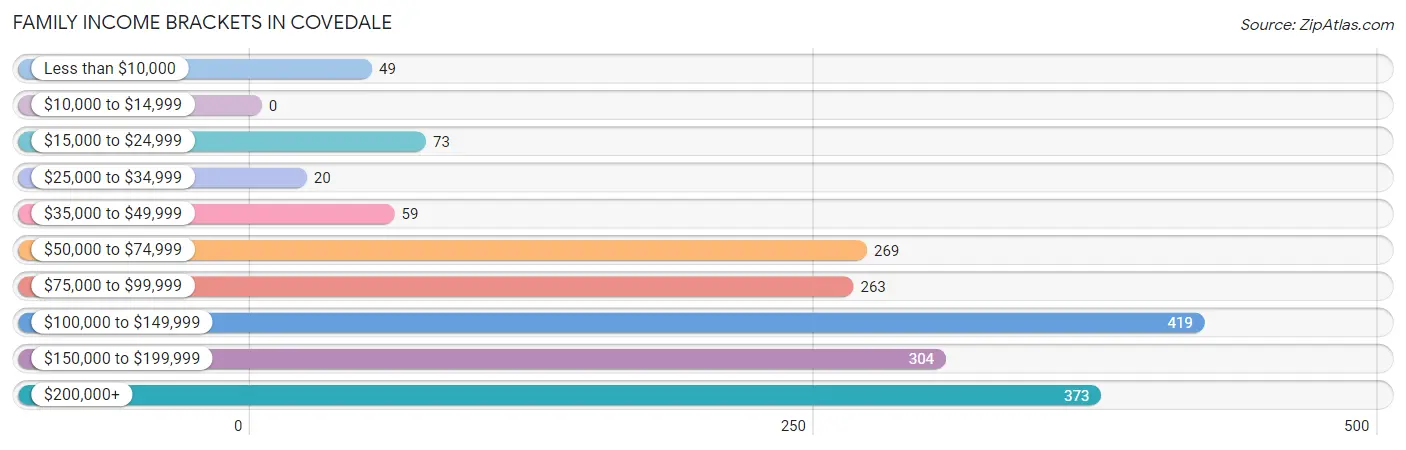
| Income Bracket | # Families | % Families |
| Less than $10,000 | 49 | 2.7% |
| $10,000 to $14,999 | 0 | 0.0% |
| $15,000 to $24,999 | 73 | 4.0% |
| $25,000 to $34,999 | 20 | 1.1% |
| $35,000 to $49,999 | 59 | 3.2% |
| $50,000 to $74,999 | 269 | 14.7% |
| $75,000 to $99,999 | 263 | 14.4% |
| $100,000 to $149,999 | 419 | 22.9% |
| $150,000 to $199,999 | 304 | 16.6% |
| $200,000+ | 373 | 20.4% |
Family Income by Famaliy Size in Covedale
3-person families (443 | 24.2%) account for the highest median family income in Covedale with $172,962 per family, while 3-person families (443 | 24.2%) have the highest median income of $57,654 per family member.
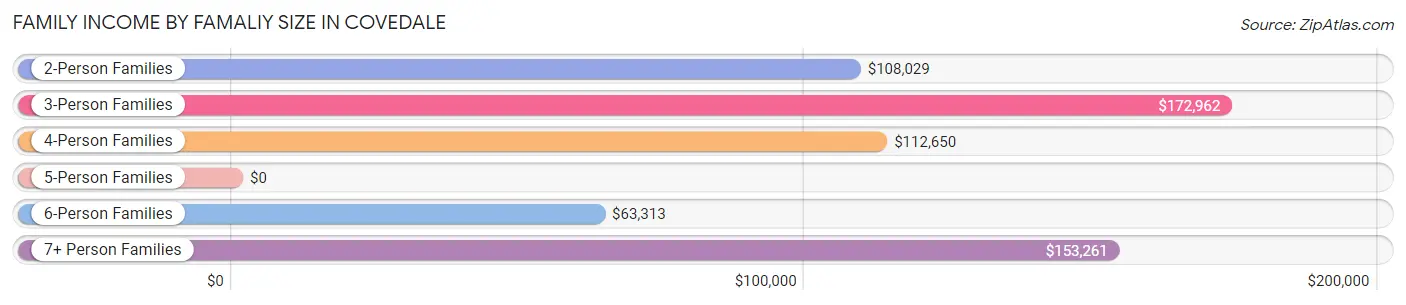
| Income Bracket | # Families | Median Income |
| 2-Person Families | 953 (52.1%) | $108,029 |
| 3-Person Families | 443 (24.2%) | $172,962 |
| 4-Person Families | 223 (12.2%) | $112,650 |
| 5-Person Families | 94 (5.1%) | $0 |
| 6-Person Families | 74 (4.1%) | $63,313 |
| 7+ Person Families | 42 (2.3%) | $153,261 |
| Total | 1,829 (100.0%) | $115,179 |
Family Income by Number of Earners in Covedale
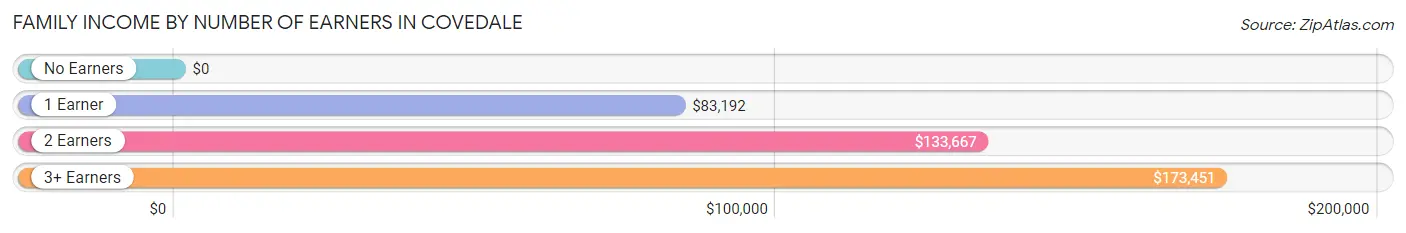
| Number of Earners | # Families | Median Income |
| No Earners | 280 (15.3%) | $0 |
| 1 Earner | 558 (30.5%) | $83,192 |
| 2 Earners | 764 (41.8%) | $133,667 |
| 3+ Earners | 227 (12.4%) | $173,451 |
| Total | 1,829 (100.0%) | $115,179 |
Household Income in Covedale
Household Income Brackets in Covedale
With 452 households falling in the category, the $100,000 to $149,999 income range is the most frequent in Covedale, accounting for 17.8% of all households. In contrast, only 66 households (2.6%) fall into the $10,000 to $14,999 income bracket, making it the least populous group.
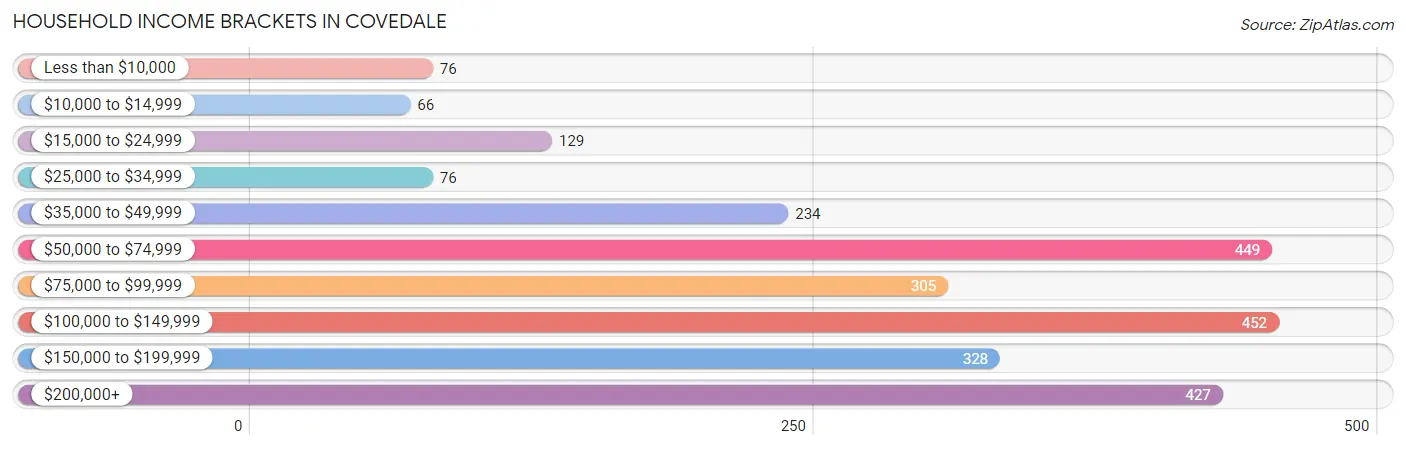
| Income Bracket | # Households | % Households |
| Less than $10,000 | 76 | 3.0% |
| $10,000 to $14,999 | 66 | 2.6% |
| $15,000 to $24,999 | 129 | 5.1% |
| $25,000 to $34,999 | 76 | 3.0% |
| $35,000 to $49,999 | 234 | 9.2% |
| $50,000 to $74,999 | 449 | 17.7% |
| $75,000 to $99,999 | 305 | 12.0% |
| $100,000 to $149,999 | 452 | 17.8% |
| $150,000 to $199,999 | 328 | 12.9% |
| $200,000+ | 427 | 16.8% |
Household Income by Householder Age in Covedale
The median household income in Covedale is $90,665, with the highest median household income of $125,550 found in the 45 to 64 years age bracket for the primary householder. A total of 923 households (36.3%) fall into this category. Meanwhile, the 15 to 24 years age bracket for the primary householder has the lowest median household income of $0, with 15 households (0.6%) in this group.
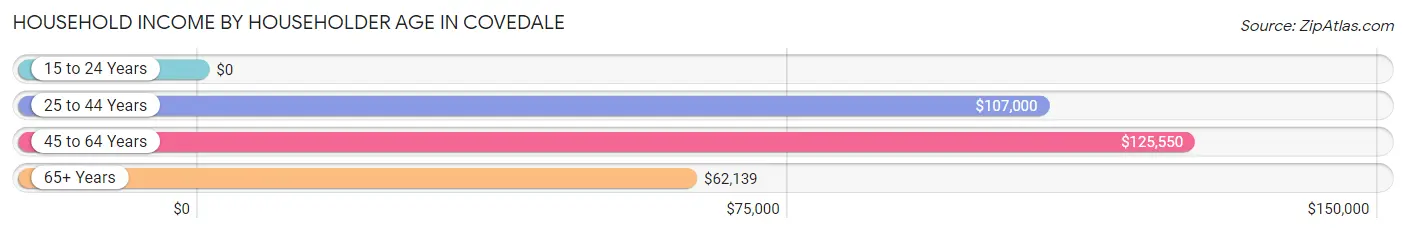
| Income Bracket | # Households | Median Income |
| 15 to 24 Years | 15 (0.6%) | $0 |
| 25 to 44 Years | 664 (26.2%) | $107,000 |
| 45 to 64 Years | 923 (36.3%) | $125,550 |
| 65+ Years | 937 (36.9%) | $62,139 |
| Total | 2,539 (100.0%) | $90,665 |
Poverty in Covedale
Income Below Poverty by Sex and Age in Covedale
With 3.4% poverty level for males and 9.0% for females among the residents of Covedale, under 5 year old males and 6 to 11 year old females are the most vulnerable to poverty, with 42 males (24.6%) and 77 females (40.5%) in their respective age groups living below the poverty level.
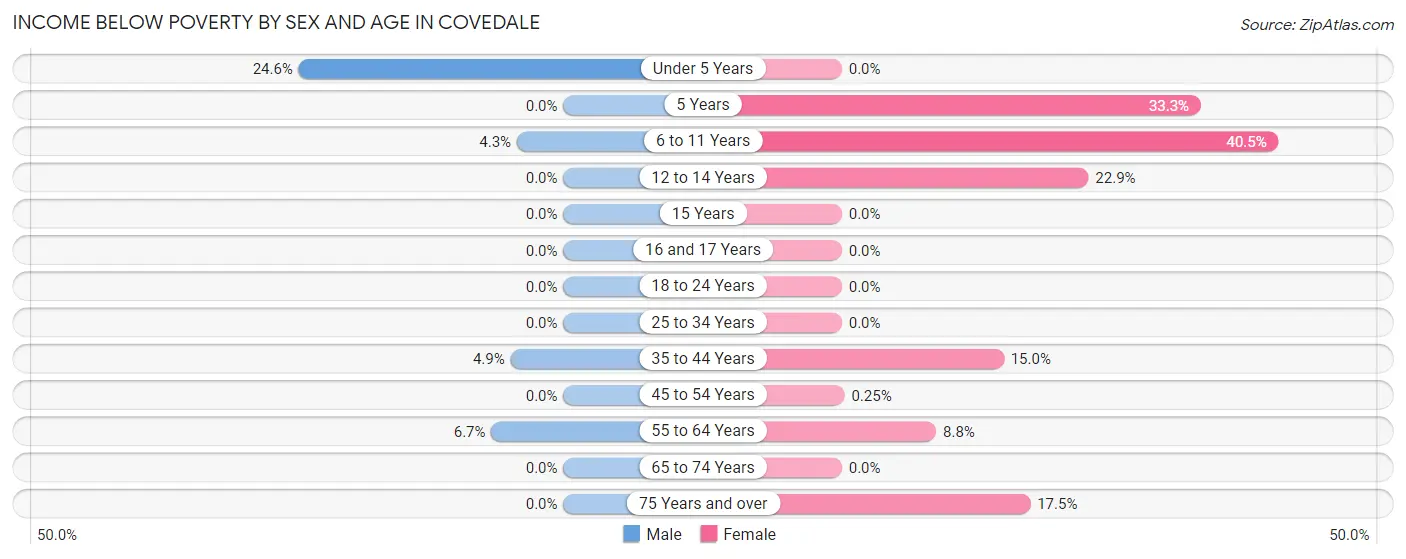
| Age Bracket | Male | Female |
| Under 5 Years | 42 (24.6%) | 0 (0.0%) |
| 5 Years | 0 (0.0%) | 15 (33.3%) |
| 6 to 11 Years | 18 (4.3%) | 77 (40.5%) |
| 12 to 14 Years | 0 (0.0%) | 46 (22.9%) |
| 15 Years | 0 (0.0%) | 0 (0.0%) |
| 16 and 17 Years | 0 (0.0%) | 0 (0.0%) |
| 18 to 24 Years | 0 (0.0%) | 0 (0.0%) |
| 25 to 34 Years | 0 (0.0%) | 0 (0.0%) |
| 35 to 44 Years | 17 (4.9%) | 58 (15.0%) |
| 45 to 54 Years | 0 (0.0%) | 1 (0.3%) |
| 55 to 64 Years | 27 (6.7%) | 35 (8.7%) |
| 65 to 74 Years | 0 (0.0%) | 0 (0.0%) |
| 75 Years and over | 0 (0.0%) | 53 (17.5%) |
| Total | 104 (3.4%) | 285 (9.0%) |
Income Above Poverty by Sex and Age in Covedale
According to the poverty statistics in Covedale, males aged 5 years and females aged under 5 years are the age groups that are most secure financially, with 100.0% of males and 100.0% of females in these age groups living above the poverty line.
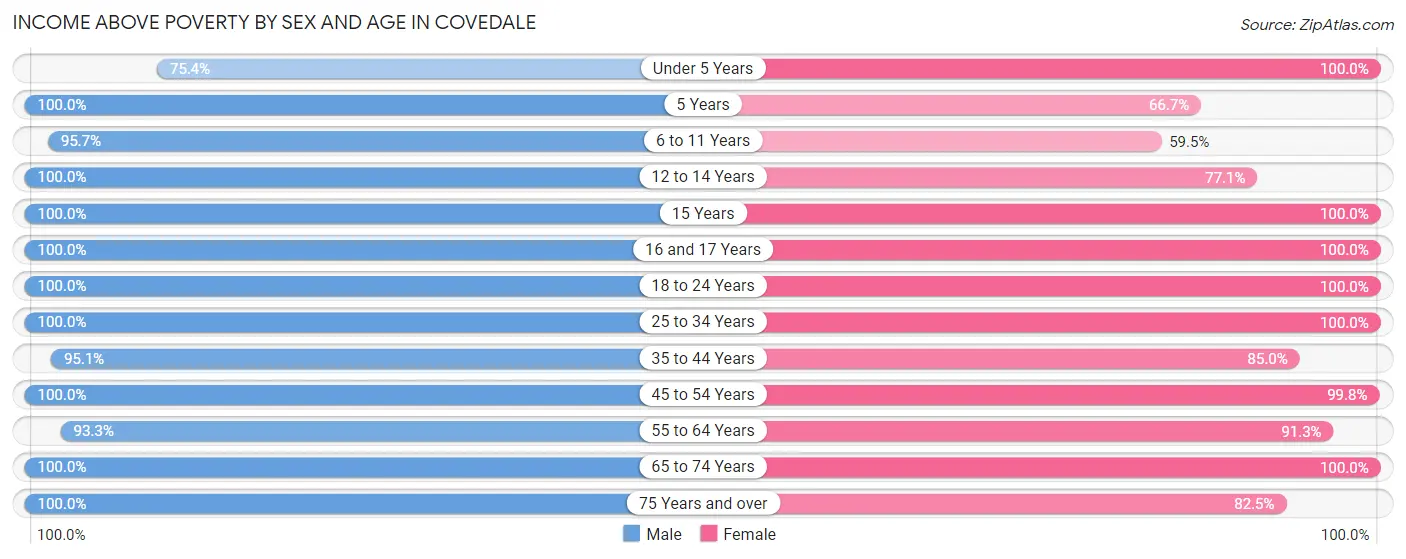
| Age Bracket | Male | Female |
| Under 5 Years | 129 (75.4%) | 120 (100.0%) |
| 5 Years | 40 (100.0%) | 30 (66.7%) |
| 6 to 11 Years | 400 (95.7%) | 113 (59.5%) |
| 12 to 14 Years | 151 (100.0%) | 155 (77.1%) |
| 15 Years | 21 (100.0%) | 181 (100.0%) |
| 16 and 17 Years | 143 (100.0%) | 39 (100.0%) |
| 18 to 24 Years | 192 (100.0%) | 110 (100.0%) |
| 25 to 34 Years | 228 (100.0%) | 314 (100.0%) |
| 35 to 44 Years | 330 (95.1%) | 328 (85.0%) |
| 45 to 54 Years | 401 (100.0%) | 395 (99.8%) |
| 55 to 64 Years | 377 (93.3%) | 365 (91.2%) |
| 65 to 74 Years | 394 (100.0%) | 489 (100.0%) |
| 75 Years and over | 184 (100.0%) | 250 (82.5%) |
| Total | 2,990 (96.6%) | 2,889 (91.0%) |
Income Below Poverty Among Married-Couple Families in Covedale
The poverty statistics for married-couple families in Covedale show that 1.2% or 17 of the total 1,440 families live below the poverty line. Families with 3 or 4 children have the highest poverty rate of 11.8%, comprising of 17 families. On the other hand, families with no children have the lowest poverty rate of 0.0%, which includes 0 families.
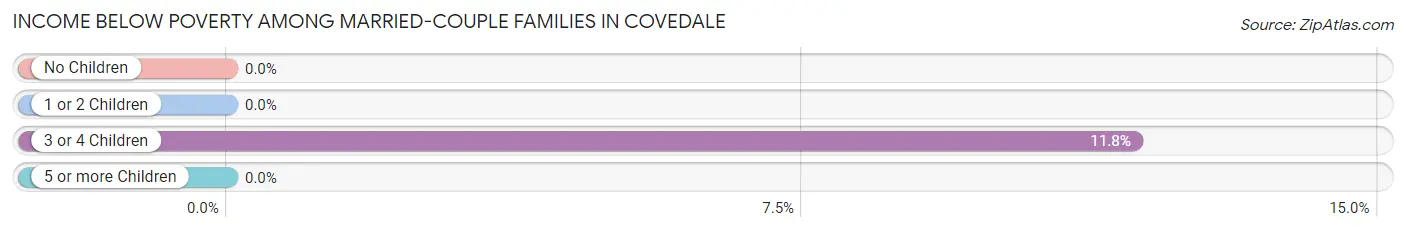
| Children | Above Poverty | Below Poverty |
| No Children | 851 (100.0%) | 0 (0.0%) |
| 1 or 2 Children | 431 (100.0%) | 0 (0.0%) |
| 3 or 4 Children | 127 (88.2%) | 17 (11.8%) |
| 5 or more Children | 14 (100.0%) | 0 (0.0%) |
| Total | 1,423 (98.8%) | 17 (1.2%) |
Income Below Poverty Among Single-Parent Households in Covedale
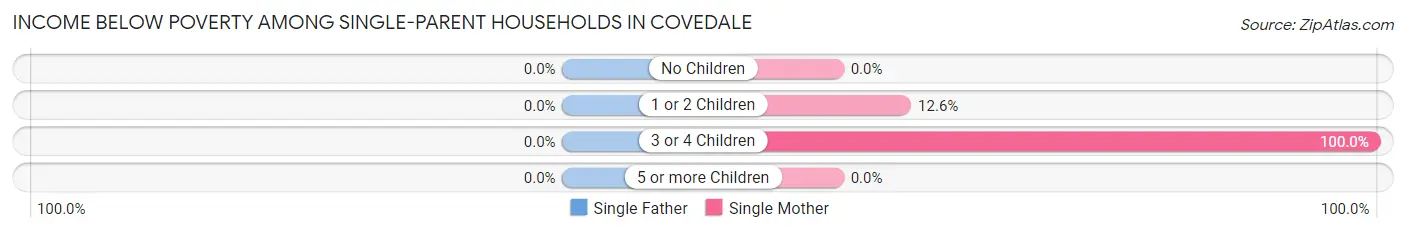
| Children | Single Father | Single Mother |
| No Children | 0 (0.0%) | 0 (0.0%) |
| 1 or 2 Children | 0 (0.0%) | 22 (12.6%) |
| 3 or 4 Children | 0 (0.0%) | 27 (100.0%) |
| 5 or more Children | 0 (0.0%) | 0 (0.0%) |
| Total | 0 (0.0%) | 49 (14.6%) |
Income Below Poverty Among Married-Couple vs Single-Parent Households in Covedale
The poverty data for Covedale shows that 17 of the married-couple family households (1.2%) and 49 of the single-parent households (12.6%) are living below the poverty level. Within the married-couple family households, those with 3 or 4 children have the highest poverty rate, with 17 households (11.8%) falling below the poverty line. Among the single-parent households, those with 3 or 4 children have the highest poverty rate, with 27 household (67.5%) living below poverty.
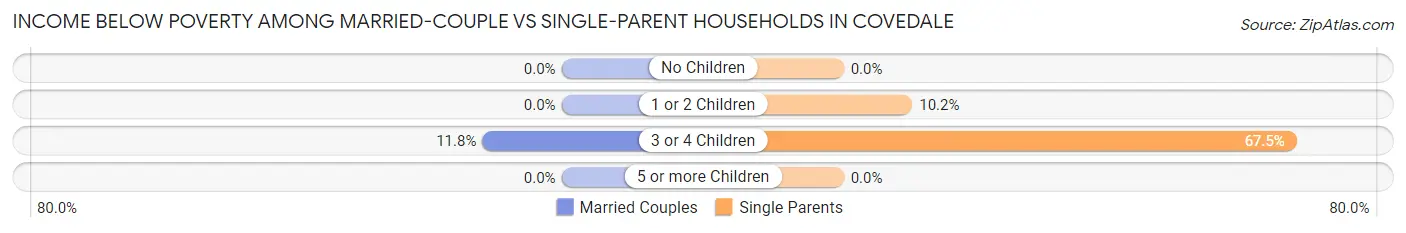
| Children | Married-Couple Families | Single-Parent Households |
| No Children | 0 (0.0%) | 0 (0.0%) |
| 1 or 2 Children | 0 (0.0%) | 22 (10.2%) |
| 3 or 4 Children | 17 (11.8%) | 27 (67.5%) |
| 5 or more Children | 0 (0.0%) | 0 (0.0%) |
| Total | 17 (1.2%) | 49 (12.6%) |
Race in Covedale
The most populous races in Covedale are White / Caucasian (5,782 | 90.0%), Black / African American (471 | 7.3%), and Hispanic or Latino (115 | 1.8%).
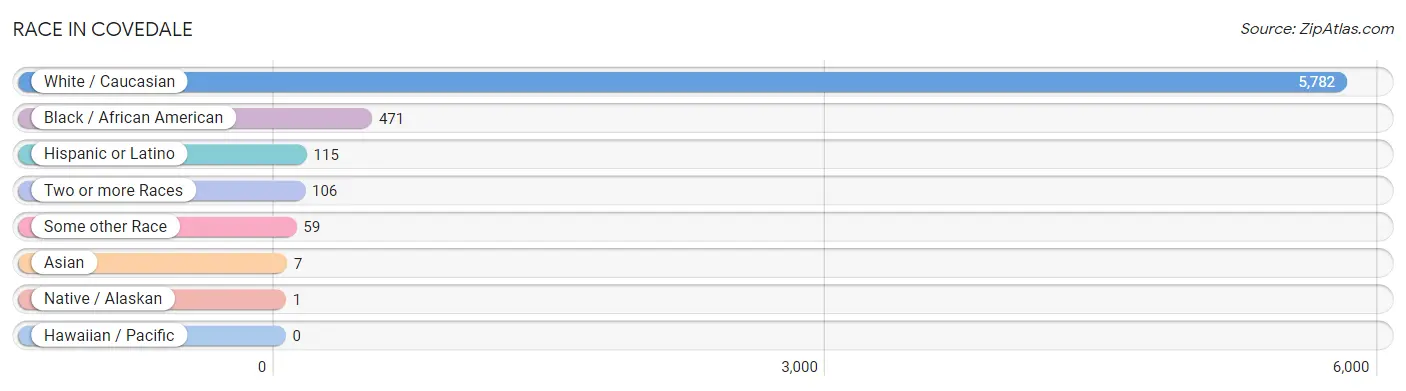
| Race | # Population | % Population |
| Asian | 7 | 0.1% |
| Black / African American | 471 | 7.3% |
| Hawaiian / Pacific | 0 | 0.0% |
| Hispanic or Latino | 115 | 1.8% |
| Native / Alaskan | 1 | 0.0% |
| White / Caucasian | 5,782 | 90.0% |
| Two or more Races | 106 | 1.7% |
| Some other Race | 59 | 0.9% |
| Total | 6,426 | 100.0% |
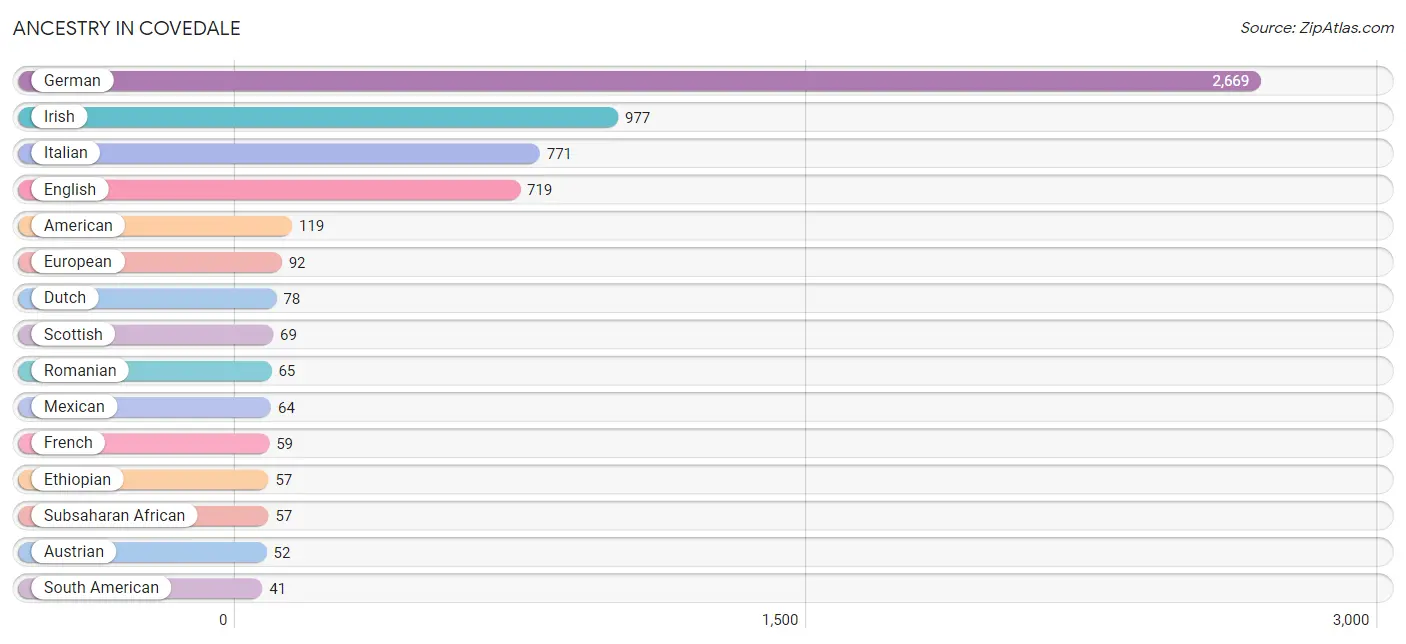
Ancestry in Covedale
The most populous ancestries reported in Covedale are German (2,669 | 41.5%), Irish (977 | 15.2%), Italian (771 | 12.0%), English (719 | 11.2%), and American (119 | 1.8%), together accounting for 81.8% of all Covedale residents.
| Ancestry | # Population | % Population |
| American | 119 | 1.8% |
| Arab | 16 | 0.3% |
| Austrian | 52 | 0.8% |
| British | 9 | 0.1% |
| Canadian | 22 | 0.3% |
| Central American | 1 | 0.0% |
| Central American Indian | 1 | 0.0% |
| Cherokee | 2 | 0.0% |
| Croatian | 15 | 0.2% |
| Dutch | 78 | 1.2% |
| English | 719 | 11.2% |
| Ethiopian | 57 | 0.9% |
| European | 92 | 1.4% |
| French | 59 | 0.9% |
| German | 2,669 | 41.5% |
| Guatemalan | 1 | 0.0% |
| Hungarian | 17 | 0.3% |
| Irish | 977 | 15.2% |
| Italian | 771 | 12.0% |
| Korean | 7 | 0.1% |
| Lebanese | 16 | 0.3% |
| Mexican | 64 | 1.0% |
| Northern European | 38 | 0.6% |
| Polish | 24 | 0.4% |
| Portuguese | 38 | 0.6% |
| Romanian | 65 | 1.0% |
| Russian | 8 | 0.1% |
| Scotch-Irish | 14 | 0.2% |
| Scottish | 69 | 1.1% |
| Serbian | 6 | 0.1% |
| South American | 41 | 0.6% |
| Subsaharan African | 57 | 0.9% |
| Swiss | 5 | 0.1% |
| Thai | 5 | 0.1% |
| Venezuelan | 41 | 0.6% |
| Welsh | 35 | 0.5% |
| Yugoslavian | 22 | 0.3% | View All 37 Rows |
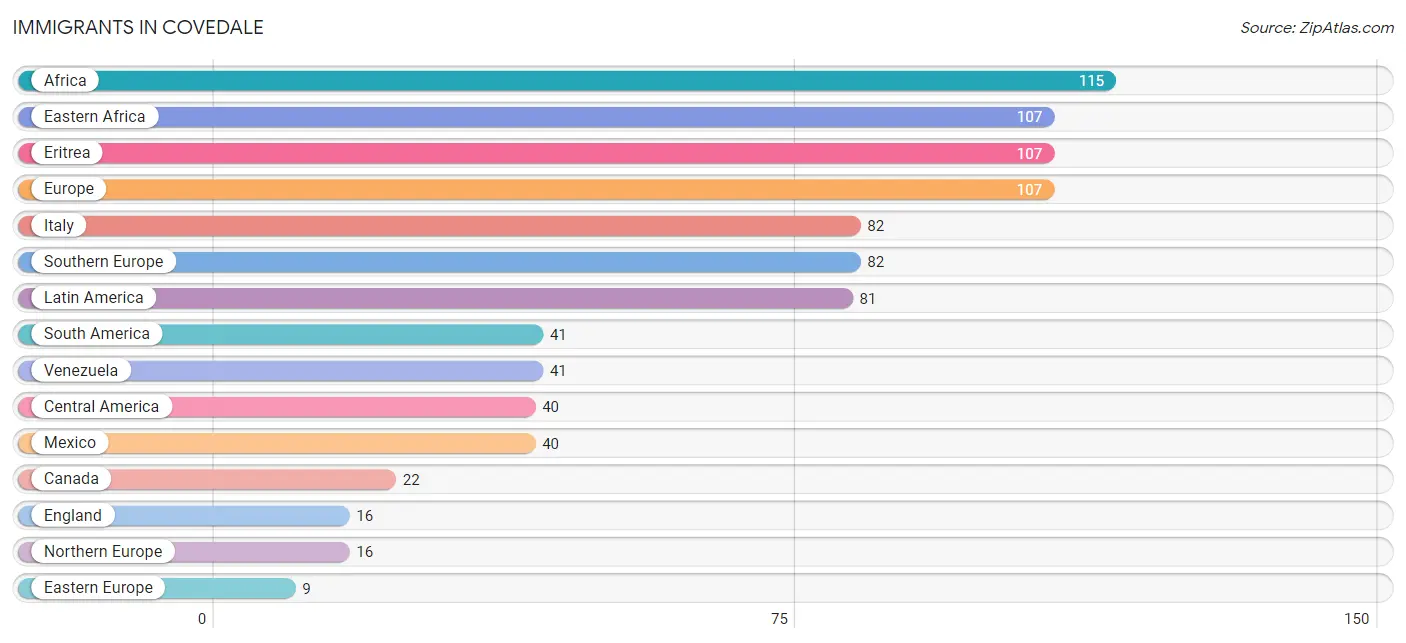
Immigrants in Covedale
The most numerous immigrant groups reported in Covedale came from Africa (115 | 1.8%), Eastern Africa (107 | 1.7%), Eritrea (107 | 1.7%), Europe (107 | 1.7%), and Italy (82 | 1.3%), together accounting for 8.1% of all Covedale residents.
| Immigration Origin | # Population | % Population |
| Africa | 115 | 1.8% |
| Asia | 7 | 0.1% |
| Canada | 22 | 0.3% |
| Central America | 40 | 0.6% |
| Eastern Africa | 107 | 1.7% |
| Eastern Europe | 9 | 0.1% |
| England | 16 | 0.3% |
| Eritrea | 107 | 1.7% |
| Europe | 107 | 1.7% |
| Hungary | 5 | 0.1% |
| Italy | 82 | 1.3% |
| Latin America | 81 | 1.3% |
| Mexico | 40 | 0.6% |
| Northern Europe | 16 | 0.3% |
| Philippines | 7 | 0.1% |
| South Africa | 8 | 0.1% |
| South America | 41 | 0.6% |
| South Eastern Asia | 7 | 0.1% |
| Southern Europe | 82 | 1.3% |
| Venezuela | 41 | 0.6% | View All 20 Rows |
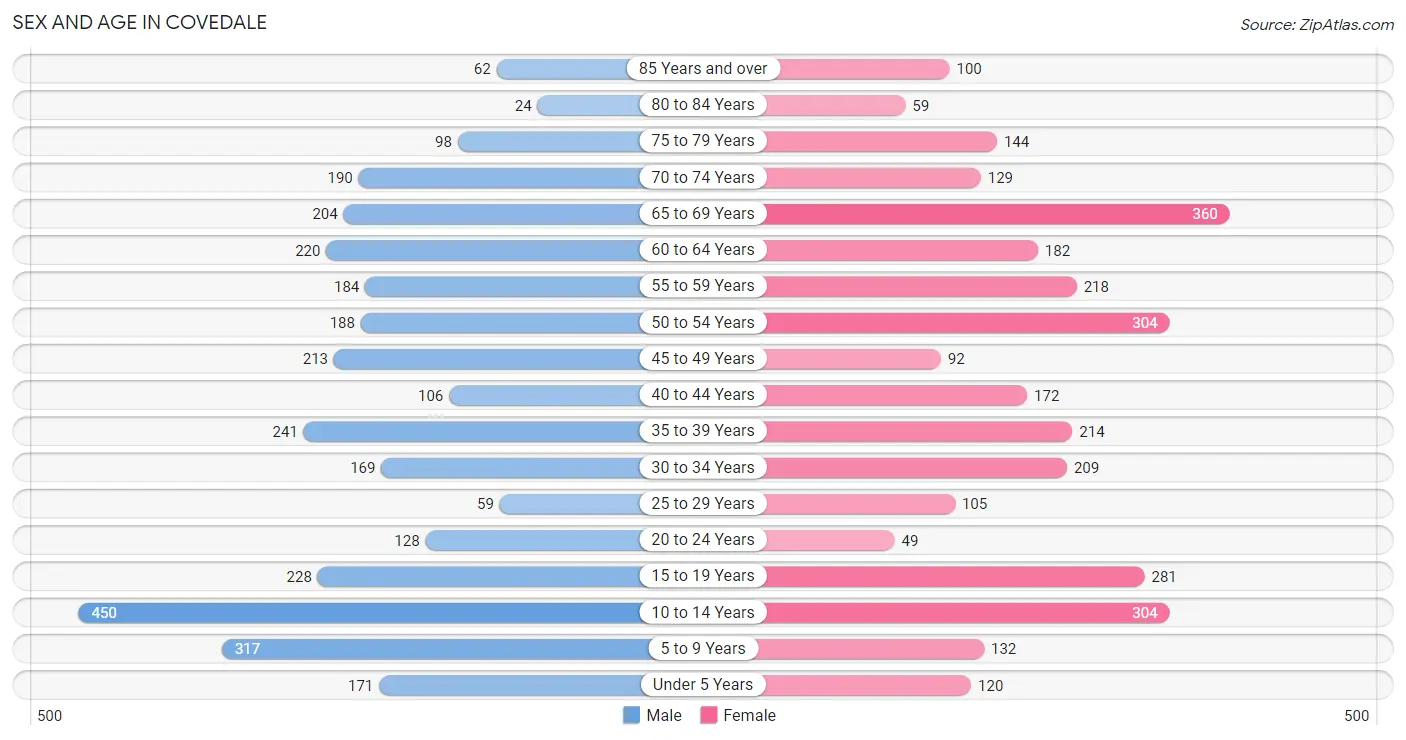
Sex and Age in Covedale
Sex and Age in Covedale
The most populous age groups in Covedale are 10 to 14 Years (450 | 13.8%) for men and 65 to 69 Years (360 | 11.3%) for women.
| Age Bracket | Male | Female |
| Under 5 Years | 171 (5.3%) | 120 (3.8%) |
| 5 to 9 Years | 317 (9.8%) | 132 (4.2%) |
| 10 to 14 Years | 450 (13.8%) | 304 (9.6%) |
| 15 to 19 Years | 228 (7.0%) | 281 (8.8%) |
| 20 to 24 Years | 128 (3.9%) | 49 (1.5%) |
| 25 to 29 Years | 59 (1.8%) | 105 (3.3%) |
| 30 to 34 Years | 169 (5.2%) | 209 (6.6%) |
| 35 to 39 Years | 241 (7.4%) | 214 (6.7%) |
| 40 to 44 Years | 106 (3.3%) | 172 (5.4%) |
| 45 to 49 Years | 213 (6.6%) | 92 (2.9%) |
| 50 to 54 Years | 188 (5.8%) | 304 (9.6%) |
| 55 to 59 Years | 184 (5.7%) | 218 (6.9%) |
| 60 to 64 Years | 220 (6.8%) | 182 (5.7%) |
| 65 to 69 Years | 204 (6.3%) | 360 (11.3%) |
| 70 to 74 Years | 190 (5.8%) | 129 (4.1%) |
| 75 to 79 Years | 98 (3.0%) | 144 (4.5%) |
| 80 to 84 Years | 24 (0.7%) | 59 (1.9%) |
| 85 Years and over | 62 (1.9%) | 100 (3.2%) |
| Total | 3,252 (100.0%) | 3,174 (100.0%) |
Families and Households in Covedale
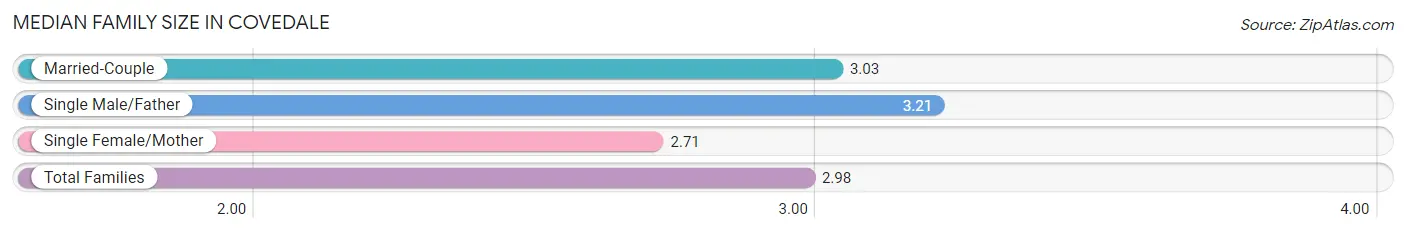
Median Family Size in Covedale
The median family size in Covedale is 2.98 persons per family, with single male/father families (53 | 2.9%) accounting for the largest median family size of 3.21 persons per family. On the other hand, single female/mother families (336 | 18.4%) represent the smallest median family size with 2.71 persons per family.
| Family Type | # Families | Family Size |
| Married-Couple | 1,440 (78.7%) | 3.03 |
| Single Male/Father | 53 (2.9%) | 3.21 |
| Single Female/Mother | 336 (18.4%) | 2.71 |
| Total Families | 1,829 (100.0%) | 2.98 |
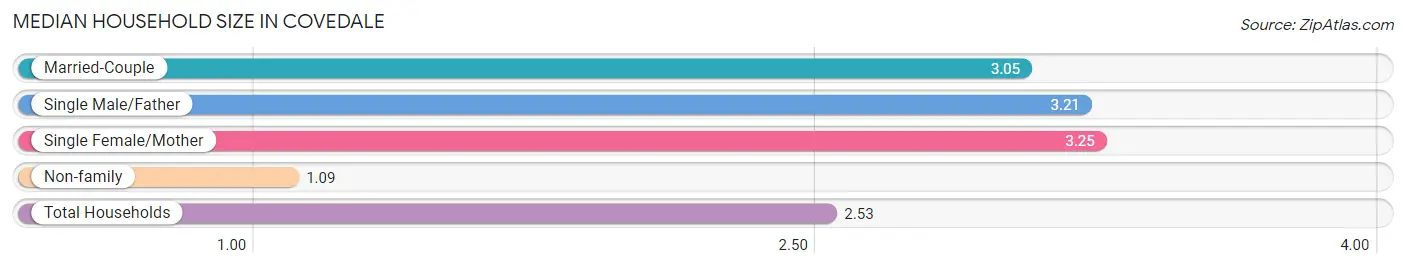
Median Household Size in Covedale
The median household size in Covedale is 2.53 persons per household, with single female/mother households (336 | 13.2%) accounting for the largest median household size of 3.25 persons per household. non-family households (710 | 28.0%) represent the smallest median household size with 1.09 persons per household.
| Household Type | # Households | Household Size |
| Married-Couple | 1,440 (56.7%) | 3.05 |
| Single Male/Father | 53 (2.1%) | 3.21 |
| Single Female/Mother | 336 (13.2%) | 3.25 |
| Non-family | 710 (28.0%) | 1.09 |
| Total Households | 2,539 (100.0%) | 2.53 |
Household Size by Marriage Status in Covedale
Out of a total of 2,539 households in Covedale, 1,829 (72.0%) are family households, while 710 (28.0%) are nonfamily households. The most numerous type of family households are 2-person households, comprising 899, and the most common type of nonfamily households are 1-person households, comprising 647.
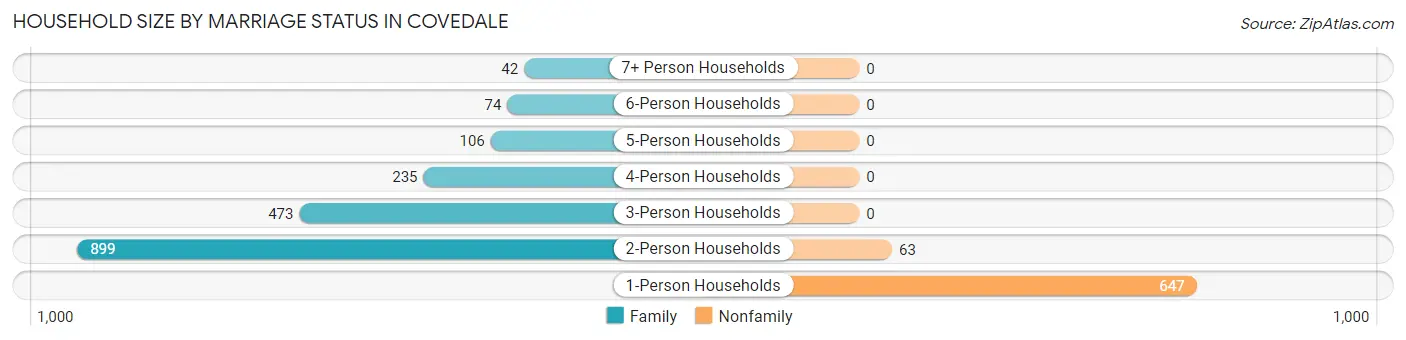
| Household Size | Family Households | Nonfamily Households |
| 1-Person Households | - | 647 (25.5%) |
| 2-Person Households | 899 (35.4%) | 63 (2.5%) |
| 3-Person Households | 473 (18.6%) | 0 (0.0%) |
| 4-Person Households | 235 (9.3%) | 0 (0.0%) |
| 5-Person Households | 106 (4.2%) | 0 (0.0%) |
| 6-Person Households | 74 (2.9%) | 0 (0.0%) |
| 7+ Person Households | 42 (1.7%) | 0 (0.0%) |
| Total | 1,829 (72.0%) | 710 (28.0%) |
Female Fertility in Covedale
Fertility by Age in Covedale
Average fertility rate in Covedale is 16.0 births per 1,000 women. Women in the age bracket of 20 to 34 years have the highest fertility rate with 50.0 births per 1,000 women. Women in the age bracket of 20 to 34 years acount for 100.0% of all women with births.
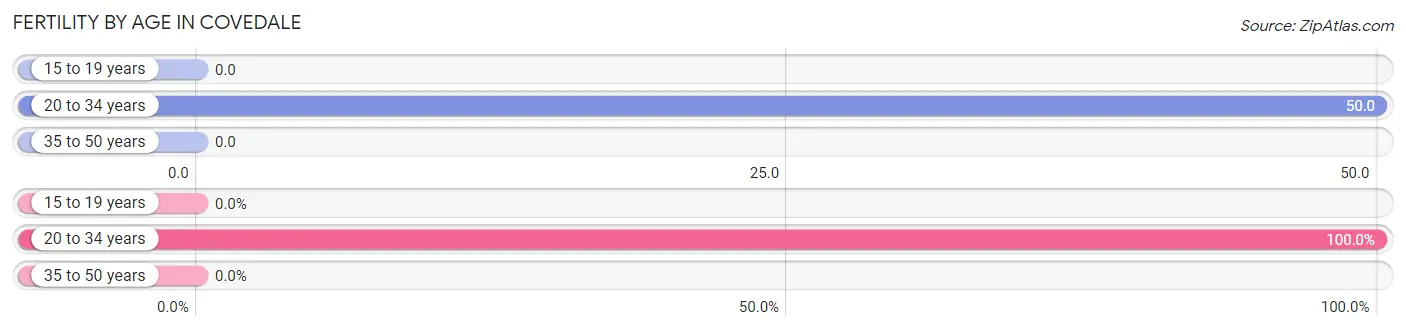
| Age Bracket | Women with Births | Births / 1,000 Women |
| 15 to 19 years | 0 (0.0%) | 0.0 |
| 20 to 34 years | 18 (100.0%) | 50.0 |
| 35 to 50 years | 0 (0.0%) | 0.0 |
| Total | 18 (100.0%) | 16.0 |
Fertility by Age by Marriage Status in Covedale
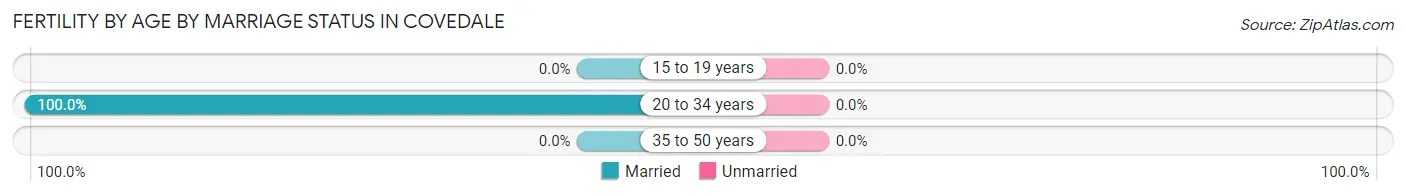
| Age Bracket | Married | Unmarried |
| 15 to 19 years | 0 (0.0%) | 0 (0.0%) |
| 20 to 34 years | 18 (100.0%) | 0 (0.0%) |
| 35 to 50 years | 0 (0.0%) | 0 (0.0%) |
| Total | 18 (100.0%) | 0 (0.0%) |
Fertility by Education in Covedale
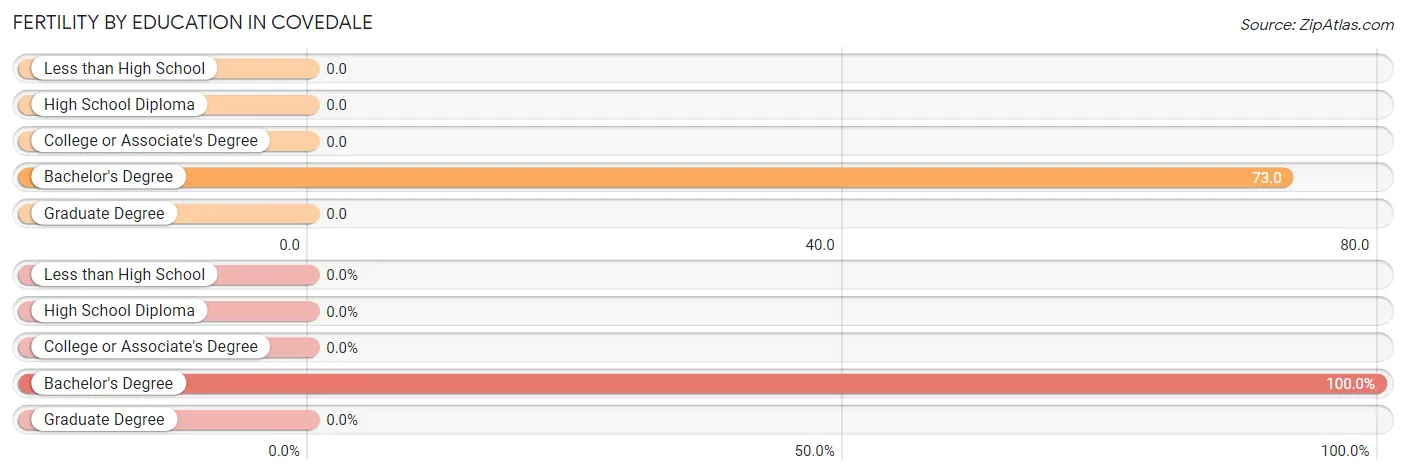
| Educational Attainment | Women with Births | Births / 1,000 Women |
| Less than High School | 0 (0.0%) | 0.0 |
| High School Diploma | 0 (0.0%) | 0.0 |
| College or Associate's Degree | 0 (0.0%) | 0.0 |
| Bachelor's Degree | 18 (100.0%) | 73.0 |
| Graduate Degree | 0 (0.0%) | 0.0 |
| Total | 18 (100.0%) | 16.0 |
Fertility by Education by Marriage Status in Covedale
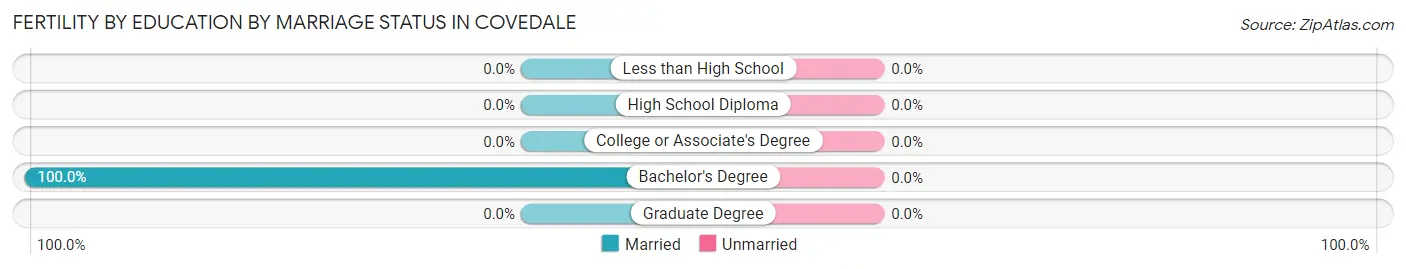
| Educational Attainment | Married | Unmarried |
| Less than High School | 0 (0.0%) | 0 (0.0%) |
| High School Diploma | 0 (0.0%) | 0 (0.0%) |
| College or Associate's Degree | 0 (0.0%) | 0 (0.0%) |
| Bachelor's Degree | 18 (100.0%) | 0 (0.0%) |
| Graduate Degree | 0 (0.0%) | 0 (0.0%) |
| Total | 18 (100.0%) | 0 (0.0%) |
Employment Characteristics in Covedale
Employment by Class of Employer in Covedale
Among the 3,010 employed individuals in Covedale, private company employees (2,056 | 68.3%), not-for-profit organizations (313 | 10.4%), and local government employees (212 | 7.0%) make up the most common classes of employment.
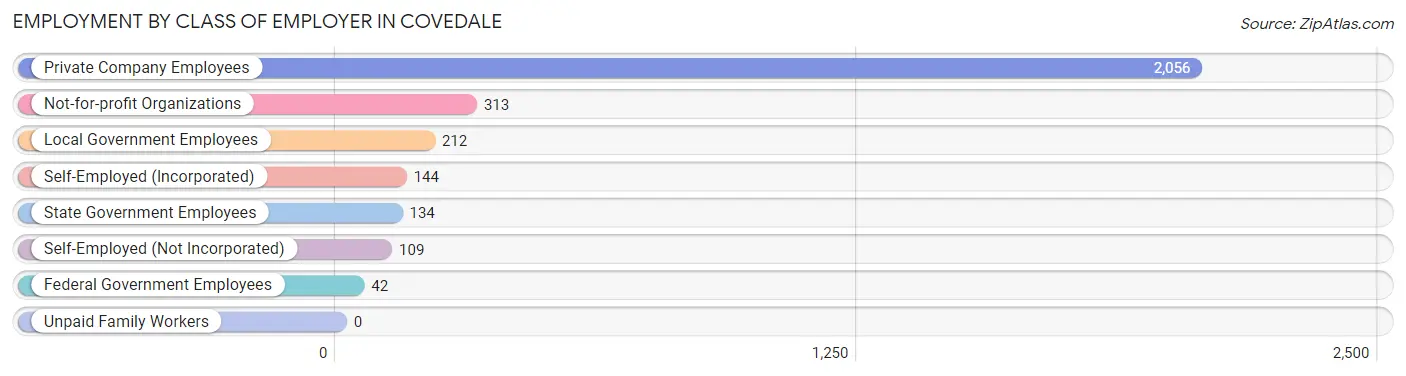
| Employer Class | # Employees | % Employees |
| Private Company Employees | 2,056 | 68.3% |
| Self-Employed (Incorporated) | 144 | 4.8% |
| Self-Employed (Not Incorporated) | 109 | 3.6% |
| Not-for-profit Organizations | 313 | 10.4% |
| Local Government Employees | 212 | 7.0% |
| State Government Employees | 134 | 4.4% |
| Federal Government Employees | 42 | 1.4% |
| Unpaid Family Workers | 0 | 0.0% |
| Total | 3,010 | 100.0% |
Employment Status by Age in Covedale
According to the labor force statistics for Covedale, out of the total population over 16 years of age (4,730), 64.9% or 3,070 individuals are in the labor force, with 0.6% or 18 of them unemployed. The age group with the highest labor force participation rate is 25 to 29 years, with 100.0% or 164 individuals in the labor force. Within the labor force, the 35 to 44 years age range has the highest percentage of unemployed individuals, with 2.0% or 12 of them being unemployed.
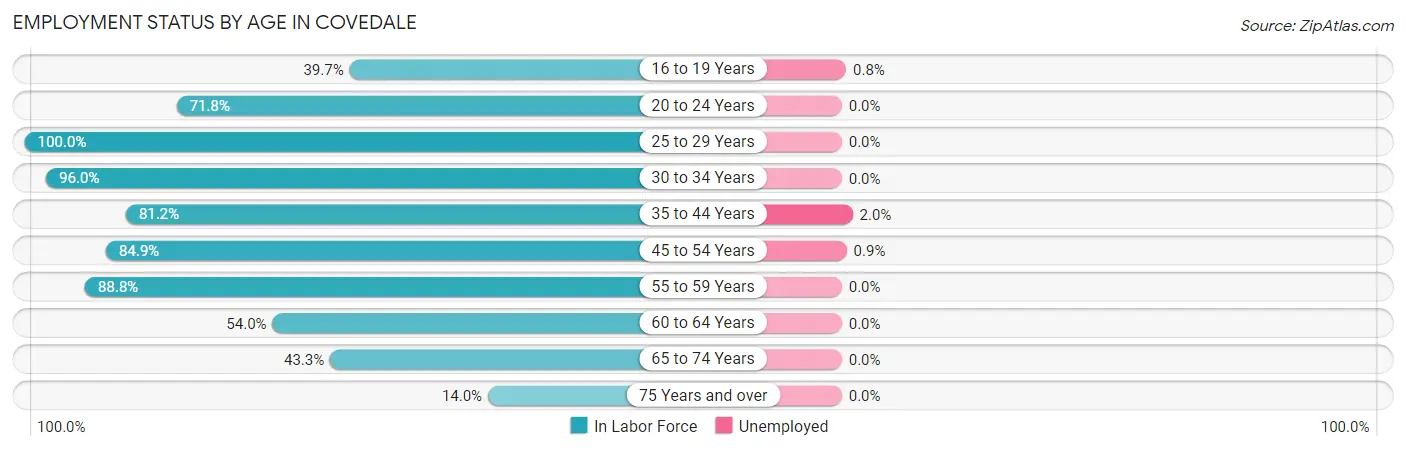
| Age Bracket | In Labor Force | Unemployed |
| 16 to 19 Years | 122 (39.7%) | 1 (0.8%) |
| 20 to 24 Years | 127 (71.8%) | 0 (0.0%) |
| 25 to 29 Years | 164 (100.0%) | 0 (0.0%) |
| 30 to 34 Years | 363 (96.0%) | 0 (0.0%) |
| 35 to 44 Years | 595 (81.2%) | 12 (2.0%) |
| 45 to 54 Years | 677 (84.9%) | 6 (0.9%) |
| 55 to 59 Years | 357 (88.8%) | 0 (0.0%) |
| 60 to 64 Years | 217 (54.0%) | 0 (0.0%) |
| 65 to 74 Years | 382 (43.3%) | 0 (0.0%) |
| 75 Years and over | 68 (14.0%) | 0 (0.0%) |
| Total | 3,070 (64.9%) | 18 (0.6%) |
Employment Status by Educational Attainment in Covedale
According to labor force statistics for Covedale, 82.5% of individuals (2,373) out of the total population between 25 and 64 years of age (2,876) are in the labor force, with 0.8% or 19 of them being unemployed. The group with the highest labor force participation rate are those with the educational attainment of bachelor's degree or higher, with 90.9% or 1,139 individuals in the labor force. Within the labor force, individuals with college / associate degree education have the highest percentage of unemployment, with 2.1% or 13 of them being unemployed.
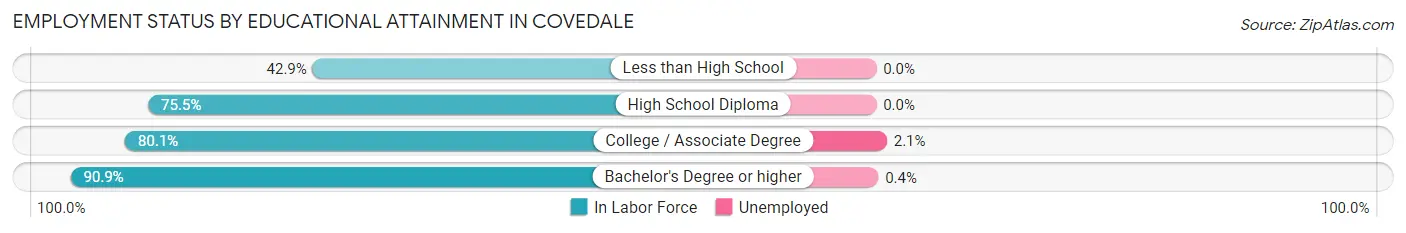
| Educational Attainment | In Labor Force | Unemployed |
| Less than High School | 36 (42.9%) | 0 (0.0%) |
| High School Diploma | 564 (75.5%) | 0 (0.0%) |
| College / Associate Degree | 634 (80.1%) | 17 (2.1%) |
| Bachelor's Degree or higher | 1,139 (90.9%) | 5 (0.4%) |
| Total | 2,373 (82.5%) | 23 (0.8%) |
Employment Occupations by Sex in Covedale
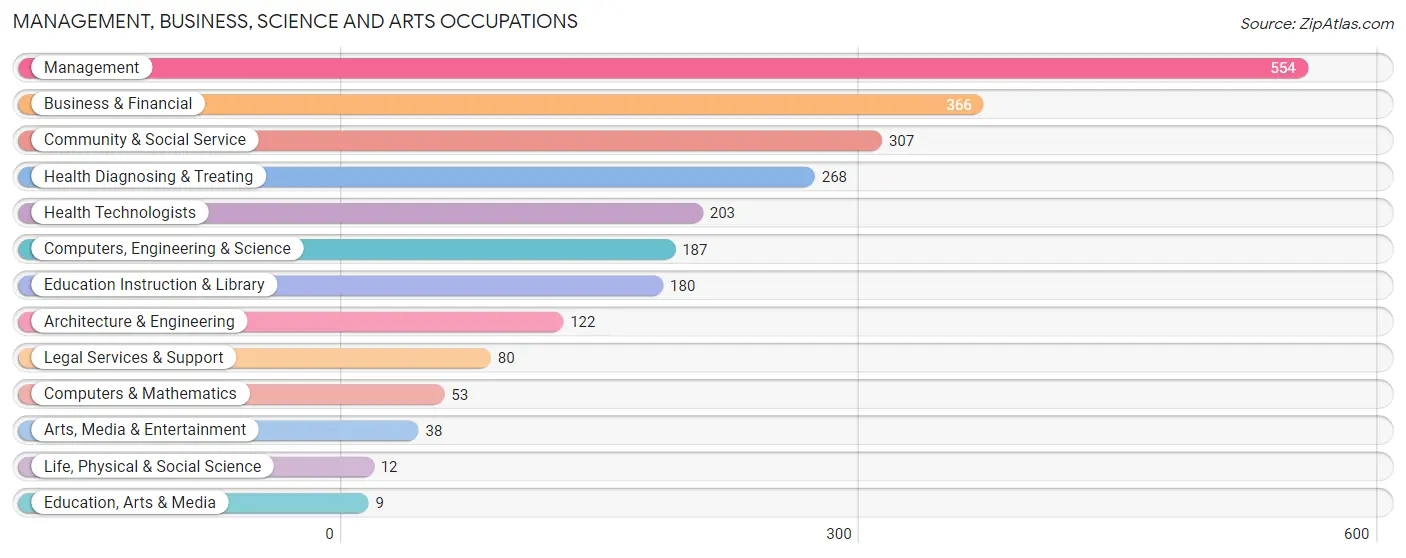
Management, Business, Science and Arts Occupations
The most common Management, Business, Science and Arts occupations in Covedale are Management (554 | 18.1%), Business & Financial (366 | 12.0%), Community & Social Service (307 | 10.1%), Health Diagnosing & Treating (268 | 8.8%), and Health Technologists (203 | 6.7%).
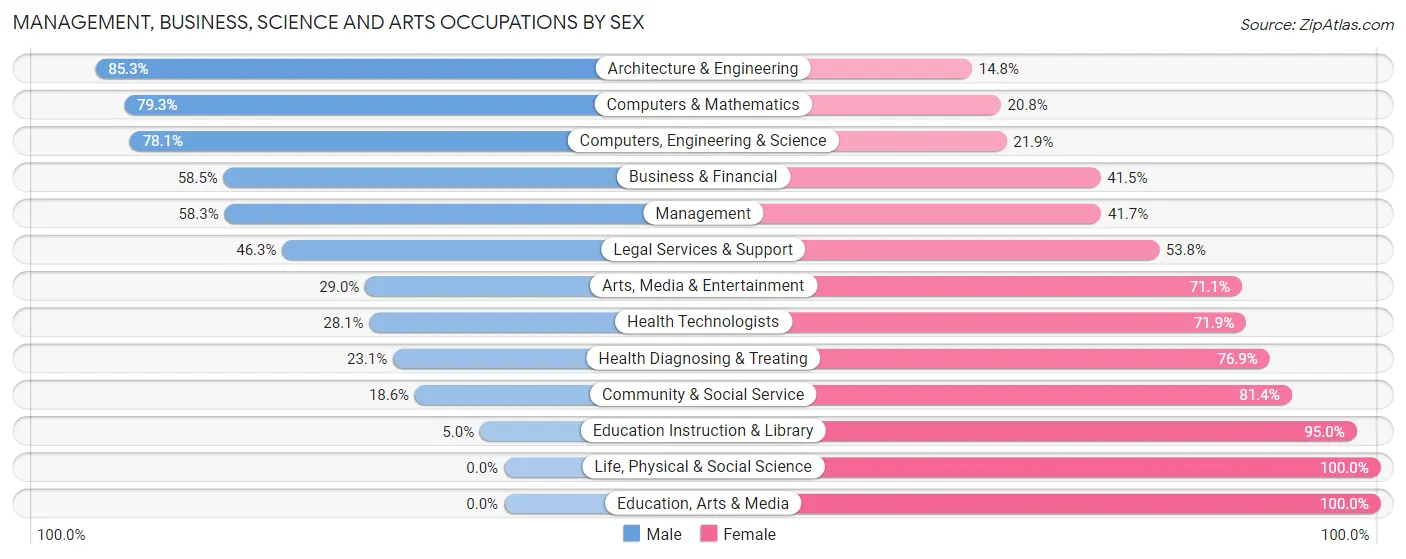
Management, Business, Science and Arts Occupations by Sex
Within the Management, Business, Science and Arts occupations in Covedale, the most male-oriented occupations are Architecture & Engineering (85.3%), Computers & Mathematics (79.2%), and Computers, Engineering & Science (78.1%), while the most female-oriented occupations are Life, Physical & Social Science (100.0%), Education, Arts & Media (100.0%), and Education Instruction & Library (95.0%).
| Occupation | Male | Female |
| Management | 323 (58.3%) | 231 (41.7%) |
| Business & Financial | 214 (58.5%) | 152 (41.5%) |
| Computers, Engineering & Science | 146 (78.1%) | 41 (21.9%) |
| Computers & Mathematics | 42 (79.2%) | 11 (20.7%) |
| Architecture & Engineering | 104 (85.3%) | 18 (14.7%) |
| Life, Physical & Social Science | 0 (0.0%) | 12 (100.0%) |
| Community & Social Service | 57 (18.6%) | 250 (81.4%) |
| Education, Arts & Media | 0 (0.0%) | 9 (100.0%) |
| Legal Services & Support | 37 (46.3%) | 43 (53.7%) |
| Education Instruction & Library | 9 (5.0%) | 171 (95.0%) |
| Arts, Media & Entertainment | 11 (28.9%) | 27 (71.1%) |
| Health Diagnosing & Treating | 62 (23.1%) | 206 (76.9%) |
| Health Technologists | 57 (28.1%) | 146 (71.9%) |
| Total (Category) | 802 (47.7%) | 880 (52.3%) |
| Total (Overall) | 1,592 (52.1%) | 1,461 (47.8%) |
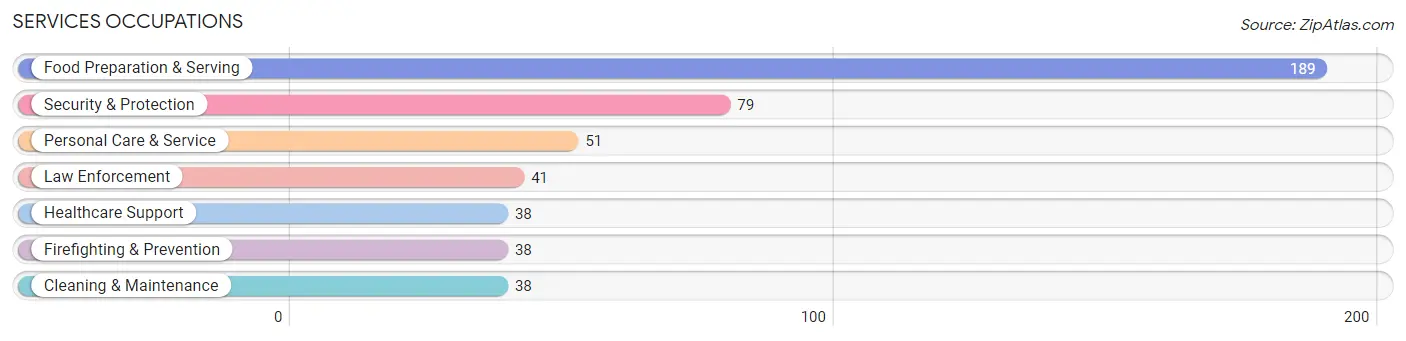
Services Occupations
The most common Services occupations in Covedale are Food Preparation & Serving (189 | 6.2%), Security & Protection (79 | 2.6%), Personal Care & Service (51 | 1.7%), Law Enforcement (41 | 1.3%), and Healthcare Support (38 | 1.2%).
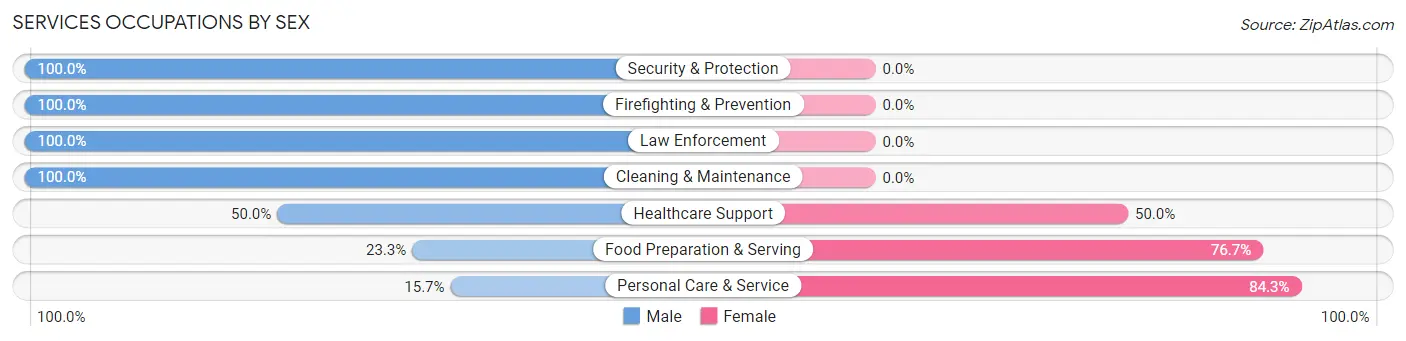
Services Occupations by Sex
Within the Services occupations in Covedale, the most male-oriented occupations are Security & Protection (100.0%), Firefighting & Prevention (100.0%), and Law Enforcement (100.0%), while the most female-oriented occupations are Personal Care & Service (84.3%), Food Preparation & Serving (76.7%), and Healthcare Support (50.0%).
| Occupation | Male | Female |
| Healthcare Support | 19 (50.0%) | 19 (50.0%) |
| Security & Protection | 79 (100.0%) | 0 (0.0%) |
| Firefighting & Prevention | 38 (100.0%) | 0 (0.0%) |
| Law Enforcement | 41 (100.0%) | 0 (0.0%) |
| Food Preparation & Serving | 44 (23.3%) | 145 (76.7%) |
| Cleaning & Maintenance | 38 (100.0%) | 0 (0.0%) |
| Personal Care & Service | 8 (15.7%) | 43 (84.3%) |
| Total (Category) | 188 (47.6%) | 207 (52.4%) |
| Total (Overall) | 1,592 (52.1%) | 1,461 (47.8%) |
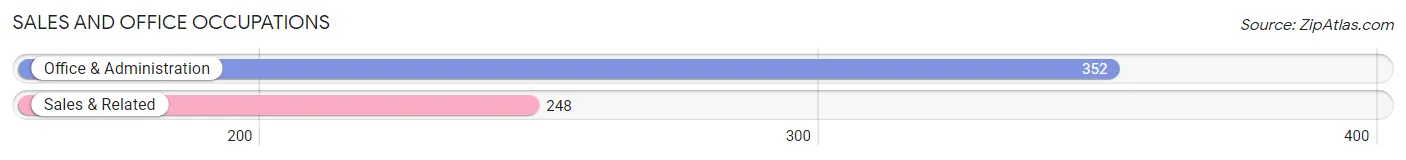
Sales and Office Occupations
The most common Sales and Office occupations in Covedale are Office & Administration (352 | 11.5%), and Sales & Related (248 | 8.1%).
Sales and Office Occupations by Sex
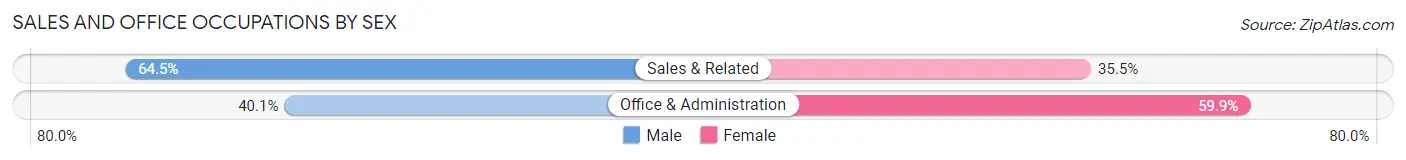
| Occupation | Male | Female |
| Sales & Related | 160 (64.5%) | 88 (35.5%) |
| Office & Administration | 141 (40.1%) | 211 (59.9%) |
| Total (Category) | 301 (50.2%) | 299 (49.8%) |
| Total (Overall) | 1,592 (52.1%) | 1,461 (47.8%) |
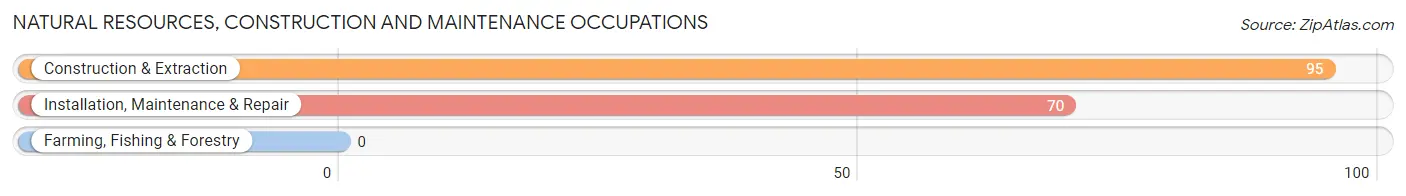
Natural Resources, Construction and Maintenance Occupations
The most common Natural Resources, Construction and Maintenance occupations in Covedale are Construction & Extraction (95 | 3.1%), and Installation, Maintenance & Repair (70 | 2.3%).
Natural Resources, Construction and Maintenance Occupations by Sex
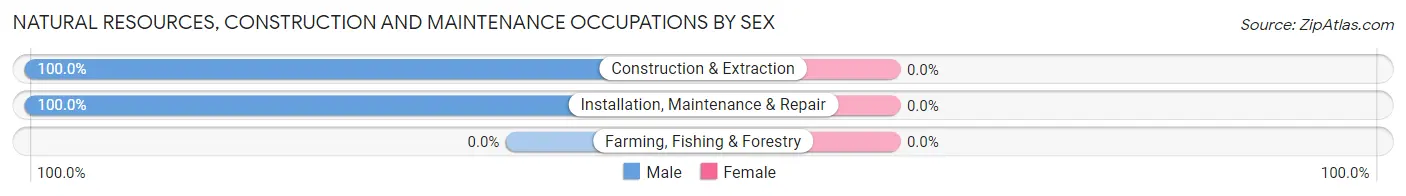
| Occupation | Male | Female |
| Farming, Fishing & Forestry | 0 (0.0%) | 0 (0.0%) |
| Construction & Extraction | 95 (100.0%) | 0 (0.0%) |
| Installation, Maintenance & Repair | 70 (100.0%) | 0 (0.0%) |
| Total (Category) | 165 (100.0%) | 0 (0.0%) |
| Total (Overall) | 1,592 (52.1%) | 1,461 (47.8%) |
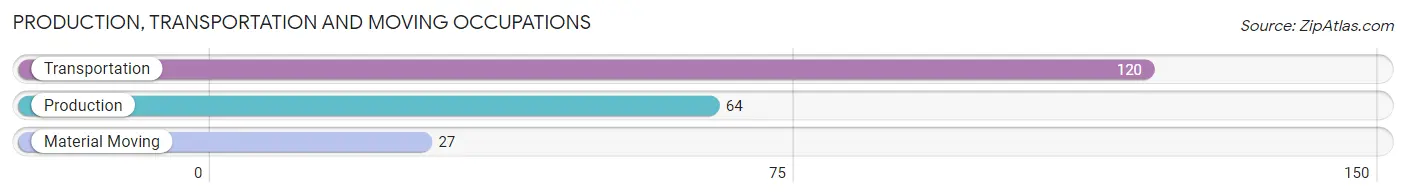
Production, Transportation and Moving Occupations
The most common Production, Transportation and Moving occupations in Covedale are Transportation (120 | 3.9%), Production (64 | 2.1%), and Material Moving (27 | 0.9%).
Production, Transportation and Moving Occupations by Sex
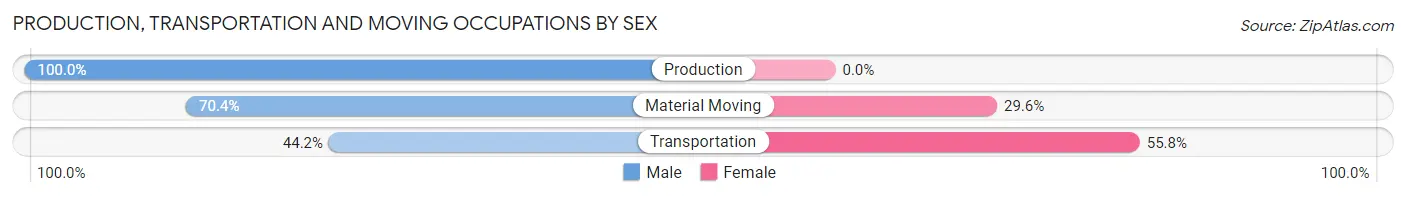
| Occupation | Male | Female |
| Production | 64 (100.0%) | 0 (0.0%) |
| Transportation | 53 (44.2%) | 67 (55.8%) |
| Material Moving | 19 (70.4%) | 8 (29.6%) |
| Total (Category) | 136 (64.4%) | 75 (35.5%) |
| Total (Overall) | 1,592 (52.1%) | 1,461 (47.8%) |
Employment Industries by Sex in Covedale
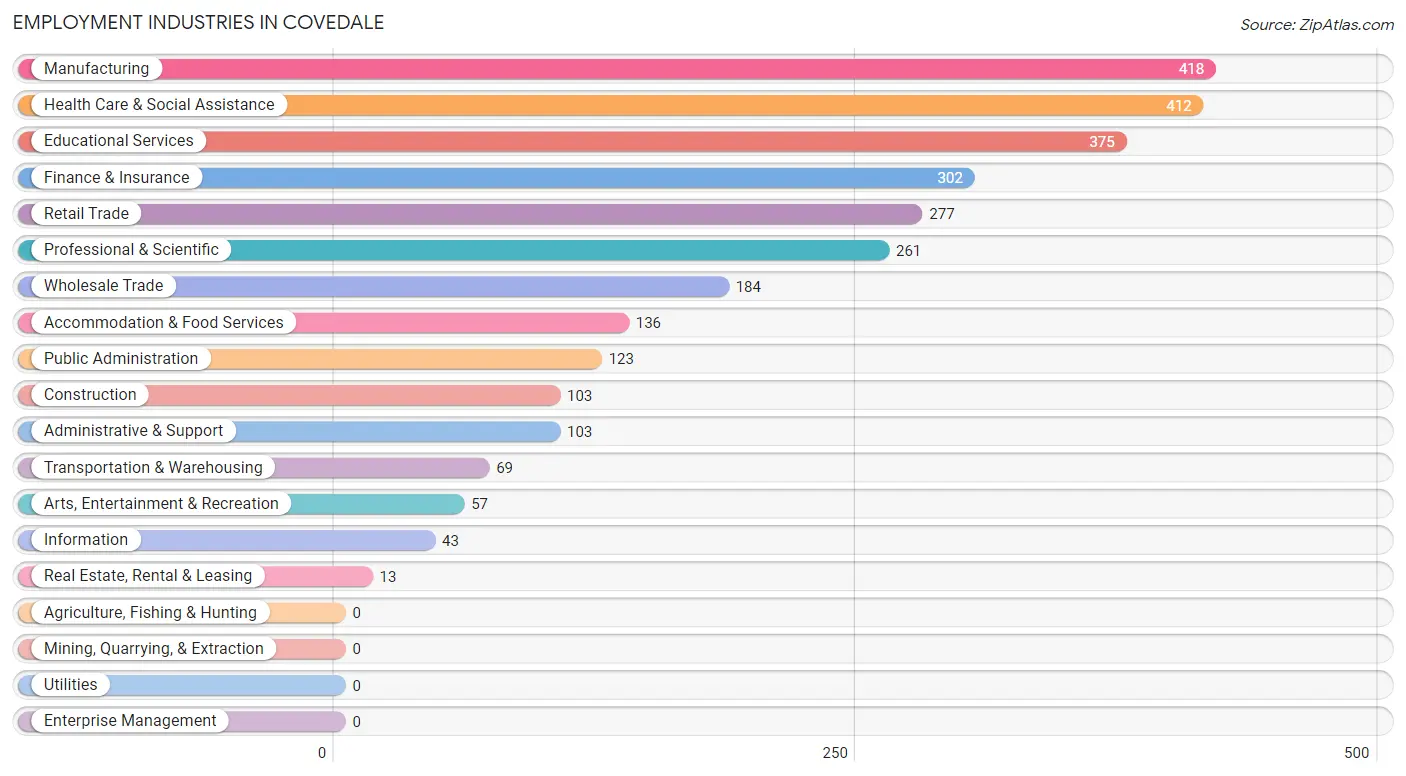
Employment Industries in Covedale
The major employment industries in Covedale include Manufacturing (418 | 13.7%), Health Care & Social Assistance (412 | 13.5%), Educational Services (375 | 12.3%), Finance & Insurance (302 | 9.9%), and Retail Trade (277 | 9.1%).
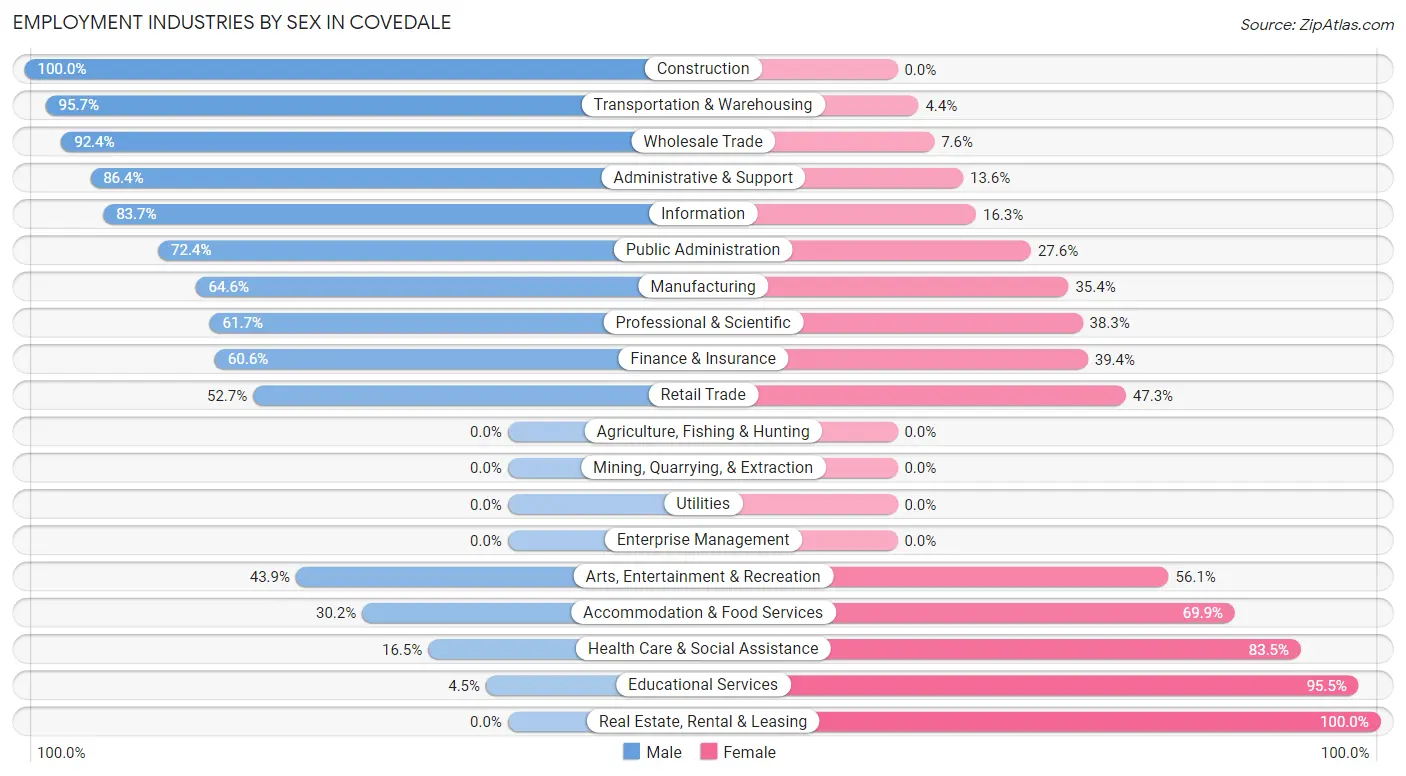
Employment Industries by Sex in Covedale
The Covedale industries that see more men than women are Construction (100.0%), Transportation & Warehousing (95.7%), and Wholesale Trade (92.4%), whereas the industries that tend to have a higher number of women are Real Estate, Rental & Leasing (100.0%), Educational Services (95.5%), and Health Care & Social Assistance (83.5%).
| Industry | Male | Female |
| Agriculture, Fishing & Hunting | 0 (0.0%) | 0 (0.0%) |
| Mining, Quarrying, & Extraction | 0 (0.0%) | 0 (0.0%) |
| Construction | 103 (100.0%) | 0 (0.0%) |
| Manufacturing | 270 (64.6%) | 148 (35.4%) |
| Wholesale Trade | 170 (92.4%) | 14 (7.6%) |
| Retail Trade | 146 (52.7%) | 131 (47.3%) |
| Transportation & Warehousing | 66 (95.7%) | 3 (4.3%) |
| Utilities | 0 (0.0%) | 0 (0.0%) |
| Information | 36 (83.7%) | 7 (16.3%) |
| Finance & Insurance | 183 (60.6%) | 119 (39.4%) |
| Real Estate, Rental & Leasing | 0 (0.0%) | 13 (100.0%) |
| Professional & Scientific | 161 (61.7%) | 100 (38.3%) |
| Enterprise Management | 0 (0.0%) | 0 (0.0%) |
| Administrative & Support | 89 (86.4%) | 14 (13.6%) |
| Educational Services | 17 (4.5%) | 358 (95.5%) |
| Health Care & Social Assistance | 68 (16.5%) | 344 (83.5%) |
| Arts, Entertainment & Recreation | 25 (43.9%) | 32 (56.1%) |
| Accommodation & Food Services | 41 (30.1%) | 95 (69.9%) |
| Public Administration | 89 (72.4%) | 34 (27.6%) |
| Total | 1,592 (52.1%) | 1,461 (47.8%) |
Education in Covedale
School Enrollment in Covedale
The most common levels of schooling among the 1,852 students in Covedale are middle school (585 | 31.6%), high school (514 | 27.8%), and elementary school (378 | 20.4%).
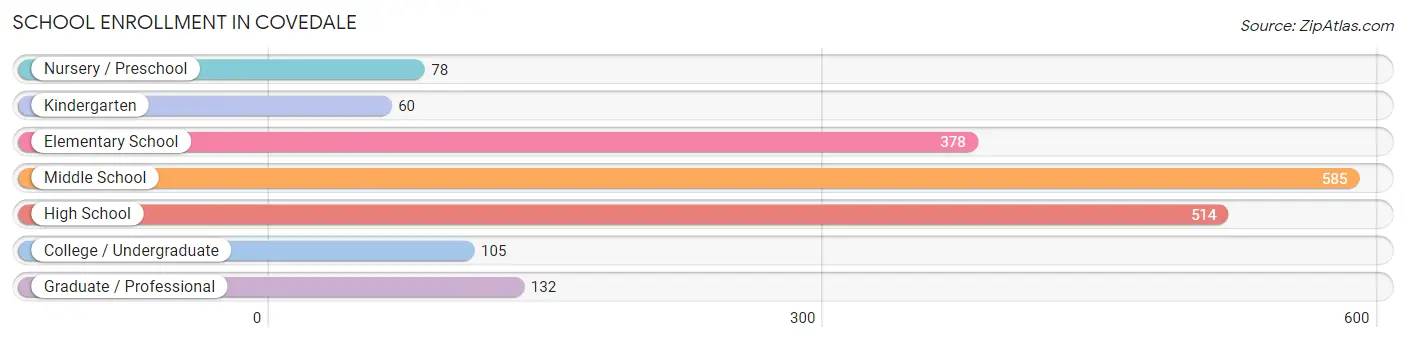
| School Level | # Students | % Students |
| Nursery / Preschool | 78 | 4.2% |
| Kindergarten | 60 | 3.2% |
| Elementary School | 378 | 20.4% |
| Middle School | 585 | 31.6% |
| High School | 514 | 27.8% |
| College / Undergraduate | 105 | 5.7% |
| Graduate / Professional | 132 | 7.1% |
| Total | 1,852 | 100.0% |
School Enrollment by Age by Funding Source in Covedale
Out of a total of 1,852 students who are enrolled in schools in Covedale, 428 (23.1%) attend a private institution, while the remaining 1,424 (76.9%) are enrolled in public schools. The age group of 3 to 4 year olds has the highest likelihood of being enrolled in private schools, with 47 (73.4% in the age bracket) enrolled. Conversely, the age group of 5 to 9 year old has the lowest likelihood of being enrolled in a private school, with 316 (81.4% in the age bracket) attending a public institution.
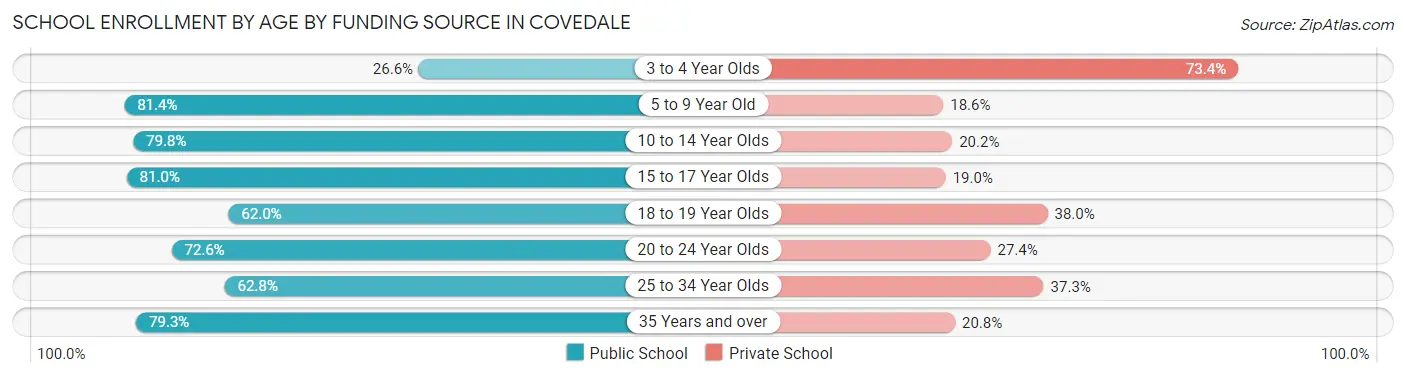
| Age Bracket | Public School | Private School |
| 3 to 4 Year Olds | 17 (26.6%) | 47 (73.4%) |
| 5 to 9 Year Old | 316 (81.4%) | 72 (18.6%) |
| 10 to 14 Year Olds | 580 (79.8%) | 147 (20.2%) |
| 15 to 17 Year Olds | 311 (81.0%) | 73 (19.0%) |
| 18 to 19 Year Olds | 49 (62.0%) | 30 (38.0%) |
| 20 to 24 Year Olds | 77 (72.6%) | 29 (27.4%) |
| 25 to 34 Year Olds | 32 (62.7%) | 19 (37.2%) |
| 35 Years and over | 42 (79.2%) | 11 (20.7%) |
| Total | 1,424 (76.9%) | 428 (23.1%) |
Educational Attainment by Field of Study in Covedale
Business (419 | 19.5%), science & technology (378 | 17.6%), education (373 | 17.4%), social sciences (176 | 8.2%), and bio, nature & agricultural (175 | 8.2%) are the most common fields of study among 2,146 individuals in Covedale who have obtained a bachelor's degree or higher.
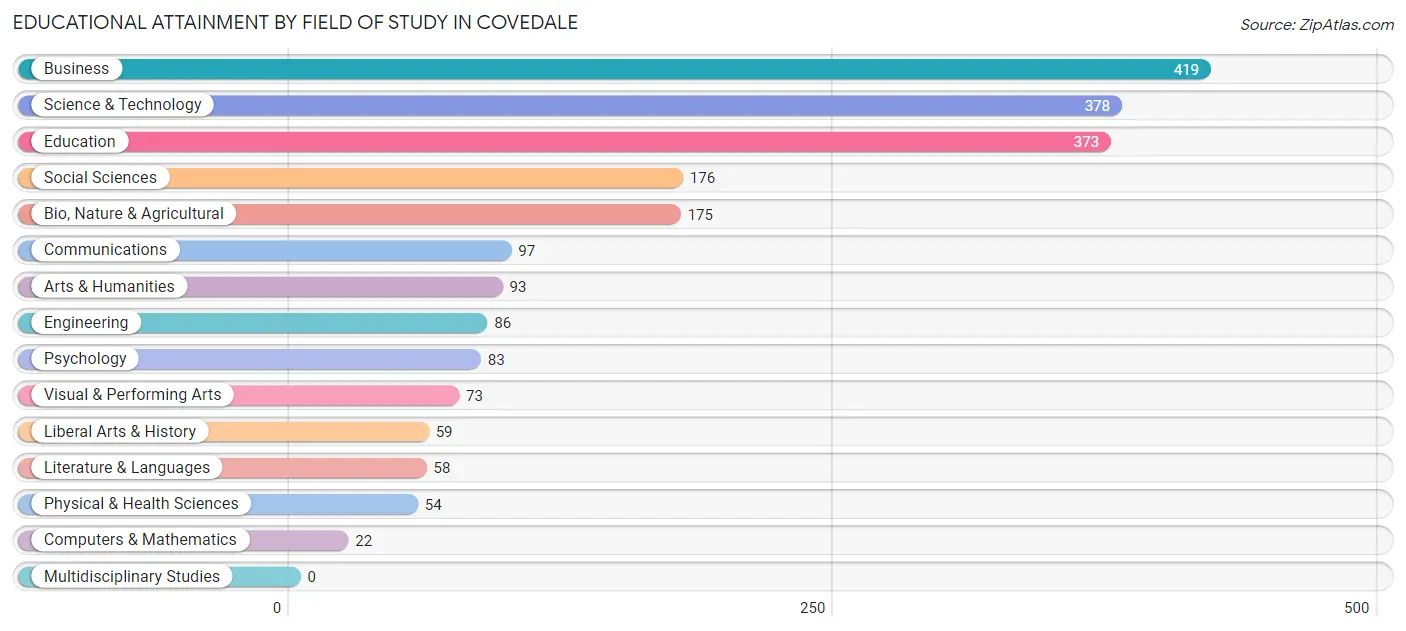
| Field of Study | # Graduates | % Graduates |
| Computers & Mathematics | 22 | 1.0% |
| Bio, Nature & Agricultural | 175 | 8.2% |
| Physical & Health Sciences | 54 | 2.5% |
| Psychology | 83 | 3.9% |
| Social Sciences | 176 | 8.2% |
| Engineering | 86 | 4.0% |
| Multidisciplinary Studies | 0 | 0.0% |
| Science & Technology | 378 | 17.6% |
| Business | 419 | 19.5% |
| Education | 373 | 17.4% |
| Literature & Languages | 58 | 2.7% |
| Liberal Arts & History | 59 | 2.8% |
| Visual & Performing Arts | 73 | 3.4% |
| Communications | 97 | 4.5% |
| Arts & Humanities | 93 | 4.3% |
| Total | 2,146 | 100.0% |
Transportation & Commute in Covedale
Vehicle Availability by Sex in Covedale
The most prevalent vehicle ownership categories in Covedale are males with 2 vehicles (916, accounting for 57.9%) and females with 2 vehicles (663, making up 64.1%).
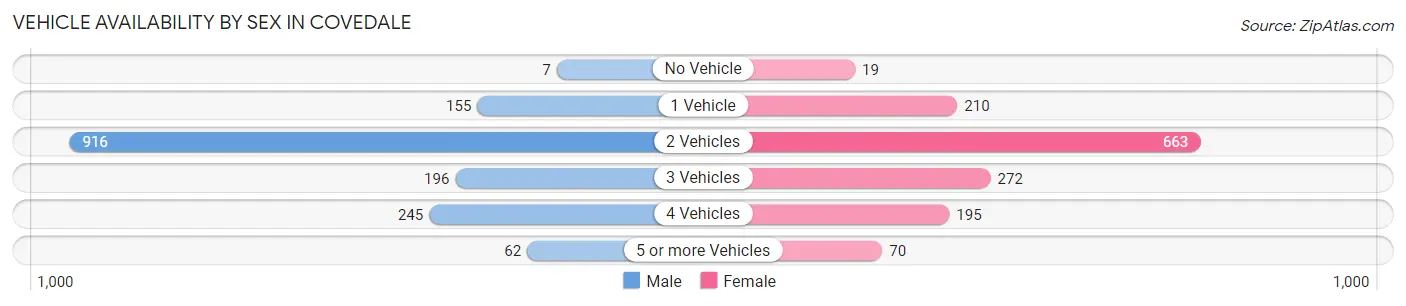
| Vehicles Available | Male | Female |
| No Vehicle | 7 (0.4%) | 19 (1.3%) |
| 1 Vehicle | 155 (9.8%) | 210 (14.7%) |
| 2 Vehicles | 916 (57.9%) | 663 (46.4%) |
| 3 Vehicles | 196 (12.4%) | 272 (19.0%) |
| 4 Vehicles | 245 (15.5%) | 195 (13.7%) |
| 5 or more Vehicles | 62 (3.9%) | 70 (4.9%) |
| Total | 1,581 (100.0%) | 1,429 (100.0%) |
Commute Time in Covedale
The most frequently occuring commute durations in Covedale are 30 to 34 minutes (528 commuters, 20.7%), 20 to 24 minutes (452 commuters, 17.7%), and 15 to 19 minutes (380 commuters, 14.9%).
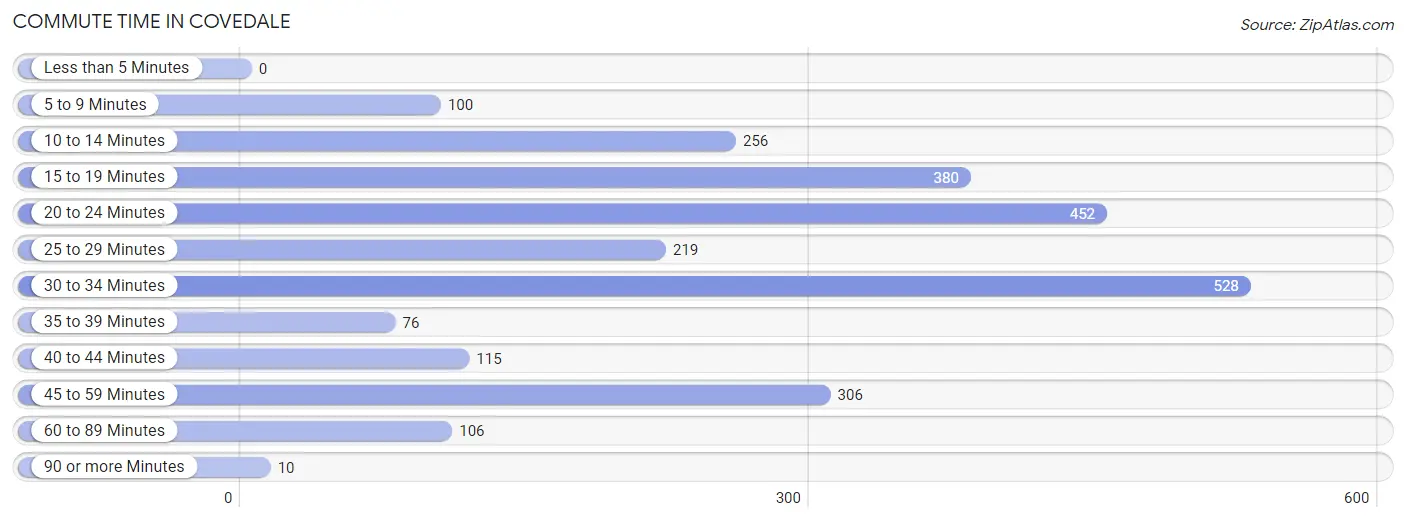
| Commute Time | # Commuters | % Commuters |
| Less than 5 Minutes | 0 | 0.0% |
| 5 to 9 Minutes | 100 | 3.9% |
| 10 to 14 Minutes | 256 | 10.1% |
| 15 to 19 Minutes | 380 | 14.9% |
| 20 to 24 Minutes | 452 | 17.7% |
| 25 to 29 Minutes | 219 | 8.6% |
| 30 to 34 Minutes | 528 | 20.7% |
| 35 to 39 Minutes | 76 | 3.0% |
| 40 to 44 Minutes | 115 | 4.5% |
| 45 to 59 Minutes | 306 | 12.0% |
| 60 to 89 Minutes | 106 | 4.2% |
| 90 or more Minutes | 10 | 0.4% |
Commute Time by Sex in Covedale
The most common commute times in Covedale are 30 to 34 minutes (290 commuters, 20.7%) for males and 30 to 34 minutes (238 commuters, 20.7%) for females.
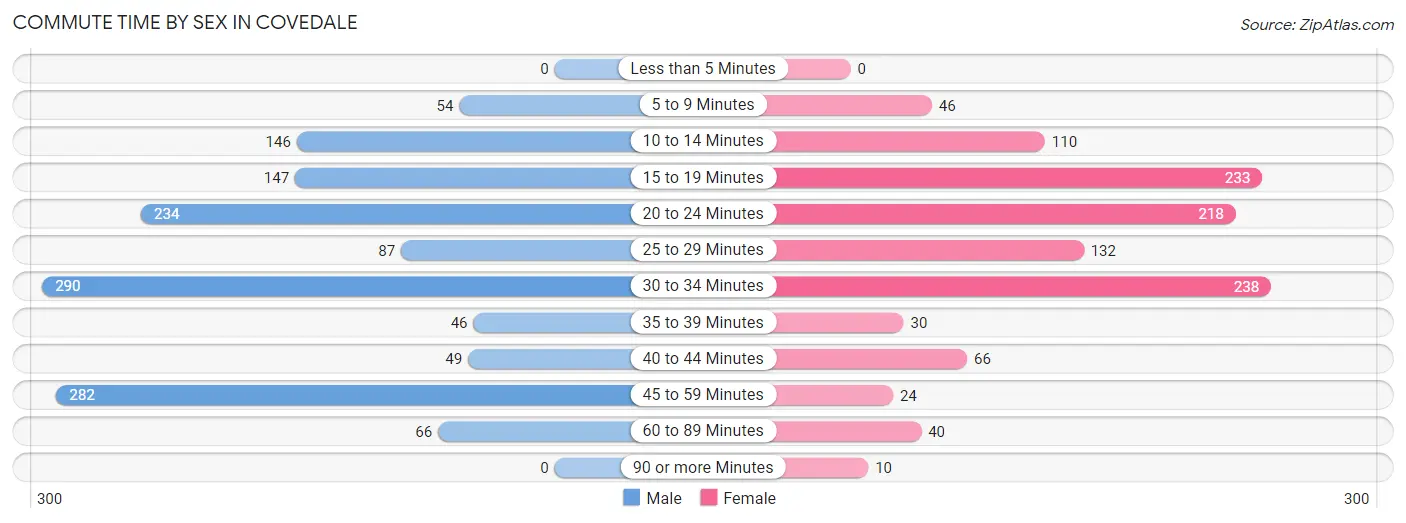
| Commute Time | Male | Female |
| Less than 5 Minutes | 0 (0.0%) | 0 (0.0%) |
| 5 to 9 Minutes | 54 (3.8%) | 46 (4.0%) |
| 10 to 14 Minutes | 146 (10.4%) | 110 (9.6%) |
| 15 to 19 Minutes | 147 (10.5%) | 233 (20.3%) |
| 20 to 24 Minutes | 234 (16.7%) | 218 (19.0%) |
| 25 to 29 Minutes | 87 (6.2%) | 132 (11.5%) |
| 30 to 34 Minutes | 290 (20.7%) | 238 (20.7%) |
| 35 to 39 Minutes | 46 (3.3%) | 30 (2.6%) |
| 40 to 44 Minutes | 49 (3.5%) | 66 (5.8%) |
| 45 to 59 Minutes | 282 (20.1%) | 24 (2.1%) |
| 60 to 89 Minutes | 66 (4.7%) | 40 (3.5%) |
| 90 or more Minutes | 0 (0.0%) | 10 (0.9%) |
Time of Departure to Work by Sex in Covedale
The most frequent times of departure to work in Covedale are 8:00 AM to 8:29 AM (233, 16.6%) for males and 7:00 AM to 7:29 AM (286, 24.9%) for females.
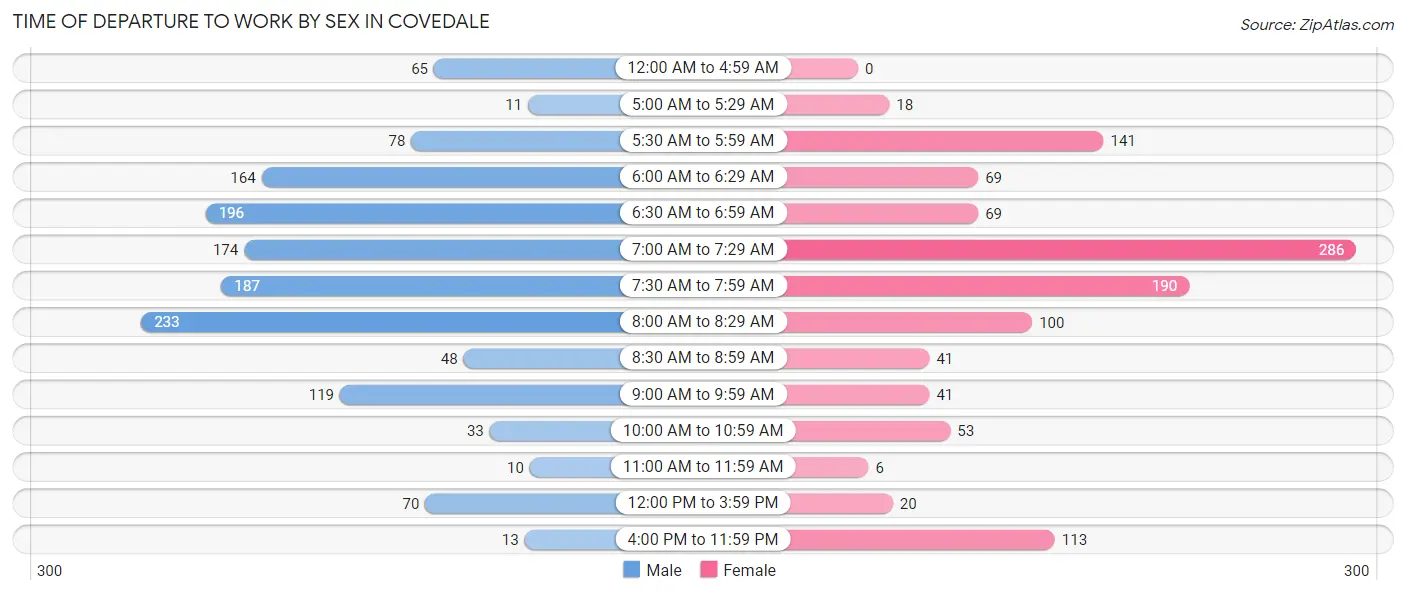
| Time of Departure | Male | Female |
| 12:00 AM to 4:59 AM | 65 (4.6%) | 0 (0.0%) |
| 5:00 AM to 5:29 AM | 11 (0.8%) | 18 (1.6%) |
| 5:30 AM to 5:59 AM | 78 (5.6%) | 141 (12.3%) |
| 6:00 AM to 6:29 AM | 164 (11.7%) | 69 (6.0%) |
| 6:30 AM to 6:59 AM | 196 (14.0%) | 69 (6.0%) |
| 7:00 AM to 7:29 AM | 174 (12.4%) | 286 (24.9%) |
| 7:30 AM to 7:59 AM | 187 (13.4%) | 190 (16.6%) |
| 8:00 AM to 8:29 AM | 233 (16.6%) | 100 (8.7%) |
| 8:30 AM to 8:59 AM | 48 (3.4%) | 41 (3.6%) |
| 9:00 AM to 9:59 AM | 119 (8.5%) | 41 (3.6%) |
| 10:00 AM to 10:59 AM | 33 (2.4%) | 53 (4.6%) |
| 11:00 AM to 11:59 AM | 10 (0.7%) | 6 (0.5%) |
| 12:00 PM to 3:59 PM | 70 (5.0%) | 20 (1.7%) |
| 4:00 PM to 11:59 PM | 13 (0.9%) | 113 (9.9%) |
| Total | 1,401 (100.0%) | 1,147 (100.0%) |
Housing Occupancy in Covedale
Occupancy by Ownership in Covedale
Of the total 2,539 dwellings in Covedale, owner-occupied units account for 2,302 (90.7%), while renter-occupied units make up 237 (9.3%).
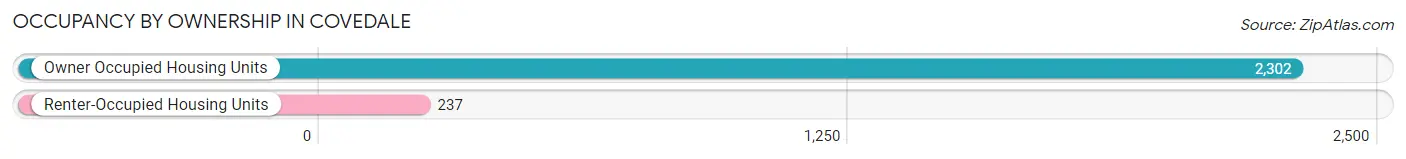
| Occupancy | # Housing Units | % Housing Units |
| Owner Occupied Housing Units | 2,302 | 90.7% |
| Renter-Occupied Housing Units | 237 | 9.3% |
| Total Occupied Housing Units | 2,539 | 100.0% |
Occupancy by Household Size in Covedale
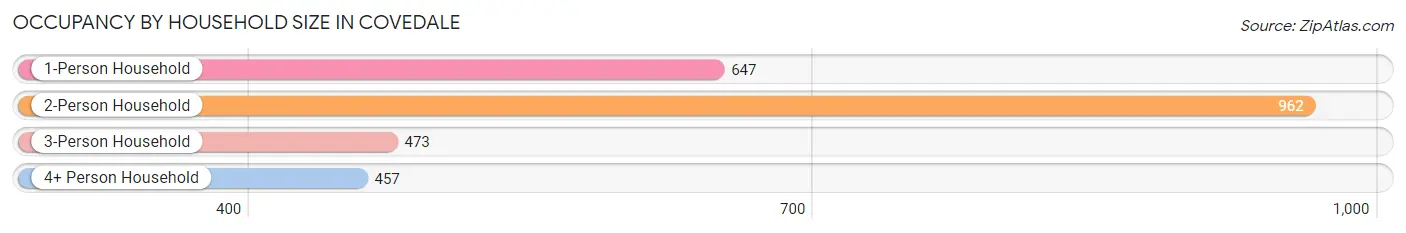
| Household Size | # Housing Units | % Housing Units |
| 1-Person Household | 647 | 25.5% |
| 2-Person Household | 962 | 37.9% |
| 3-Person Household | 473 | 18.6% |
| 4+ Person Household | 457 | 18.0% |
| Total Housing Units | 2,539 | 100.0% |
Occupancy by Ownership by Household Size in Covedale
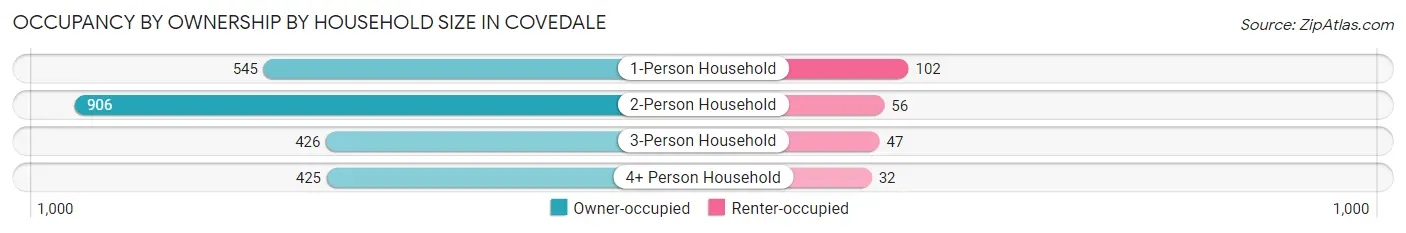
| Household Size | Owner-occupied | Renter-occupied |
| 1-Person Household | 545 (84.2%) | 102 (15.8%) |
| 2-Person Household | 906 (94.2%) | 56 (5.8%) |
| 3-Person Household | 426 (90.1%) | 47 (9.9%) |
| 4+ Person Household | 425 (93.0%) | 32 (7.0%) |
| Total Housing Units | 2,302 (90.7%) | 237 (9.3%) |
Occupancy by Educational Attainment in Covedale
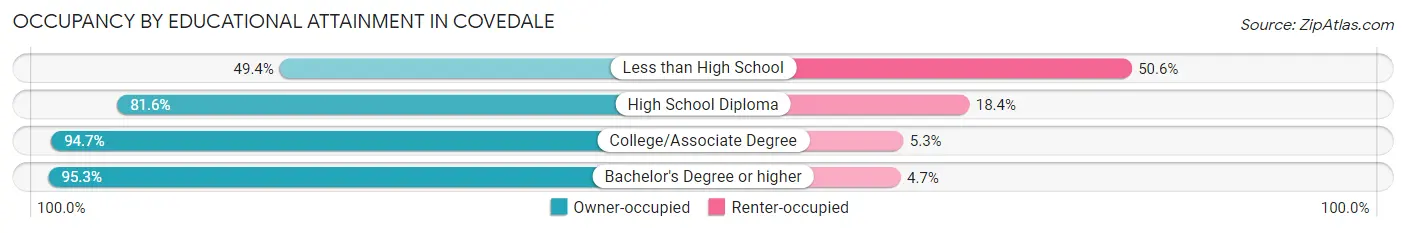
| Household Size | Owner-occupied | Renter-occupied |
| Less than High School | 44 (49.4%) | 45 (50.6%) |
| High School Diploma | 431 (81.6%) | 97 (18.4%) |
| College/Associate Degree | 681 (94.7%) | 38 (5.3%) |
| Bachelor's Degree or higher | 1,146 (95.3%) | 57 (4.7%) |
Occupancy by Age of Householder in Covedale
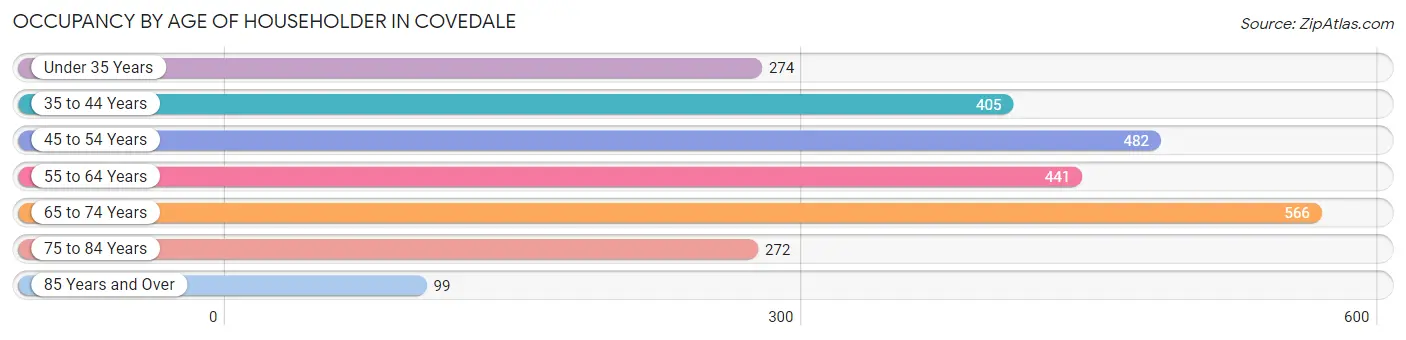
| Age Bracket | # Households | % Households |
| Under 35 Years | 274 | 10.8% |
| 35 to 44 Years | 405 | 16.0% |
| 45 to 54 Years | 482 | 19.0% |
| 55 to 64 Years | 441 | 17.4% |
| 65 to 74 Years | 566 | 22.3% |
| 75 to 84 Years | 272 | 10.7% |
| 85 Years and Over | 99 | 3.9% |
| Total | 2,539 | 100.0% |
Housing Finances in Covedale
Median Income by Occupancy in Covedale
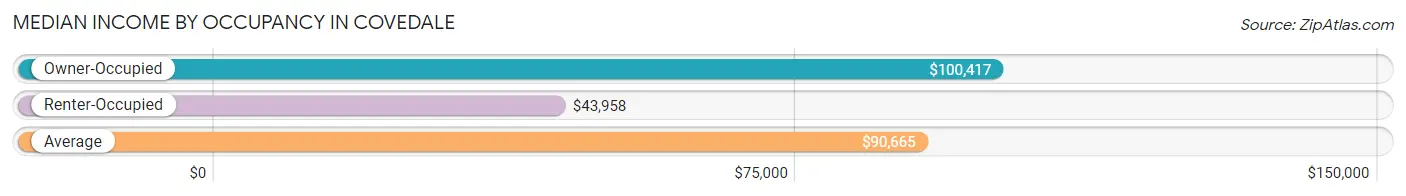
| Occupancy Type | # Households | Median Income |
| Owner-Occupied | 2,302 (90.7%) | $100,417 |
| Renter-Occupied | 237 (9.3%) | $43,958 |
| Average | 2,539 (100.0%) | $90,665 |
Occupancy by Householder Income Bracket in Covedale
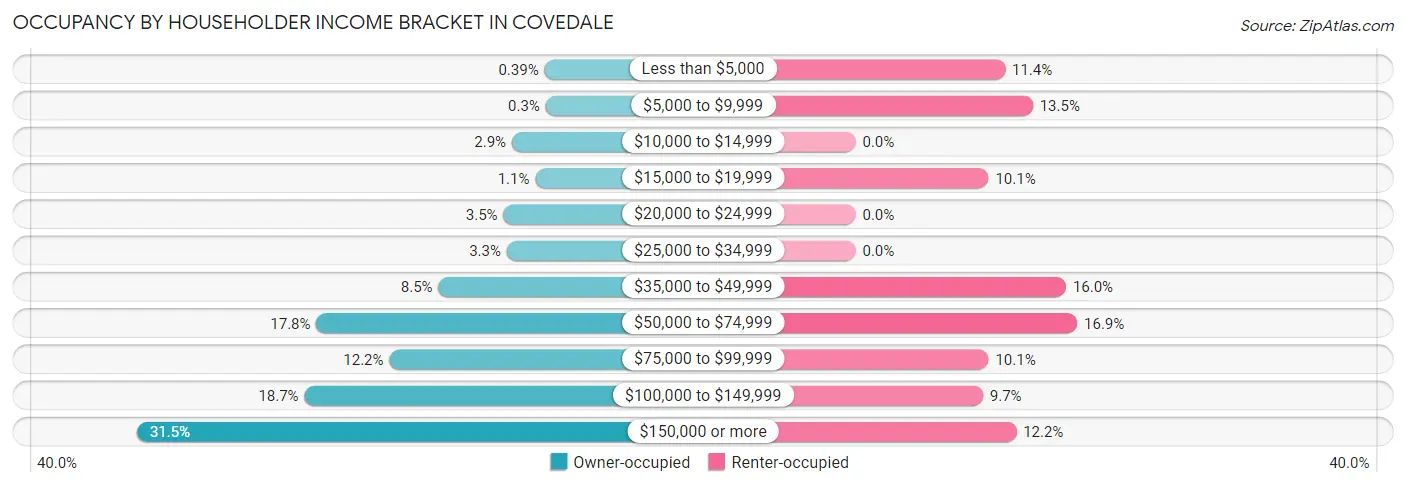
| Income Bracket | Owner-occupied | Renter-occupied |
| Less than $5,000 | 9 (0.4%) | 27 (11.4%) |
| $5,000 to $9,999 | 7 (0.3%) | 32 (13.5%) |
| $10,000 to $14,999 | 66 (2.9%) | 0 (0.0%) |
| $15,000 to $19,999 | 25 (1.1%) | 24 (10.1%) |
| $20,000 to $24,999 | 81 (3.5%) | 0 (0.0%) |
| $25,000 to $34,999 | 75 (3.3%) | 0 (0.0%) |
| $35,000 to $49,999 | 195 (8.5%) | 38 (16.0%) |
| $50,000 to $74,999 | 409 (17.8%) | 40 (16.9%) |
| $75,000 to $99,999 | 281 (12.2%) | 24 (10.1%) |
| $100,000 to $149,999 | 430 (18.7%) | 23 (9.7%) |
| $150,000 or more | 724 (31.5%) | 29 (12.2%) |
| Total | 2,302 (100.0%) | 237 (100.0%) |
Monthly Housing Cost Tiers in Covedale
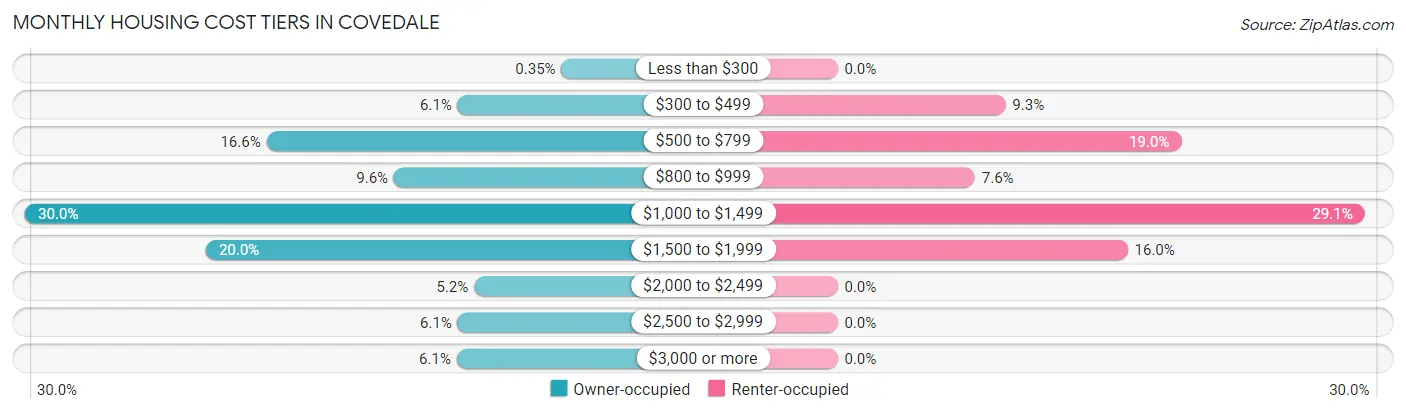
| Monthly Cost | Owner-occupied | Renter-occupied |
| Less than $300 | 8 (0.4%) | 0 (0.0%) |
| $300 to $499 | 140 (6.1%) | 22 (9.3%) |
| $500 to $799 | 383 (16.6%) | 45 (19.0%) |
| $800 to $999 | 221 (9.6%) | 18 (7.6%) |
| $1,000 to $1,499 | 690 (30.0%) | 69 (29.1%) |
| $1,500 to $1,999 | 460 (20.0%) | 38 (16.0%) |
| $2,000 to $2,499 | 119 (5.2%) | 0 (0.0%) |
| $2,500 to $2,999 | 140 (6.1%) | 0 (0.0%) |
| $3,000 or more | 141 (6.1%) | 0 (0.0%) |
| Total | 2,302 (100.0%) | 237 (100.0%) |
Physical Housing Characteristics in Covedale
Housing Structures in Covedale
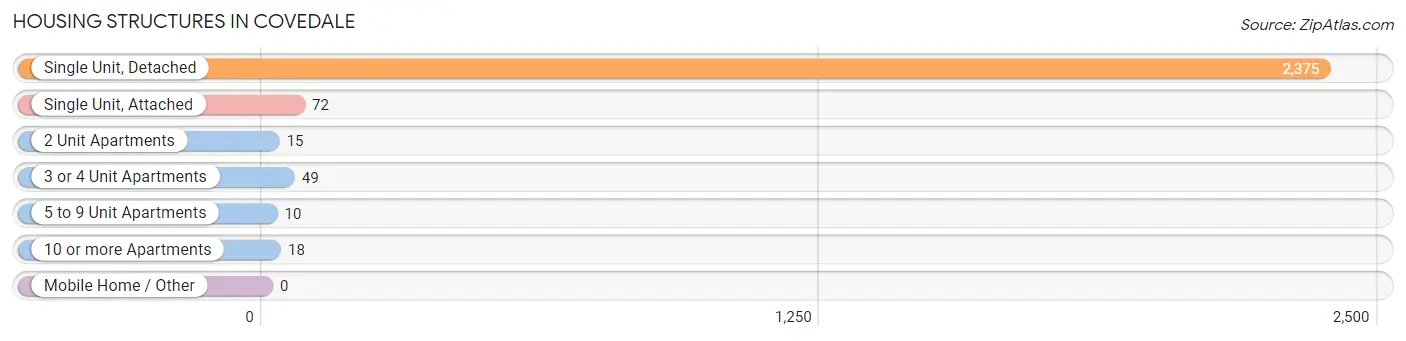
| Structure Type | # Housing Units | % Housing Units |
| Single Unit, Detached | 2,375 | 93.5% |
| Single Unit, Attached | 72 | 2.8% |
| 2 Unit Apartments | 15 | 0.6% |
| 3 or 4 Unit Apartments | 49 | 1.9% |
| 5 to 9 Unit Apartments | 10 | 0.4% |
| 10 or more Apartments | 18 | 0.7% |
| Mobile Home / Other | 0 | 0.0% |
| Total | 2,539 | 100.0% |
Housing Structures by Occupancy in Covedale
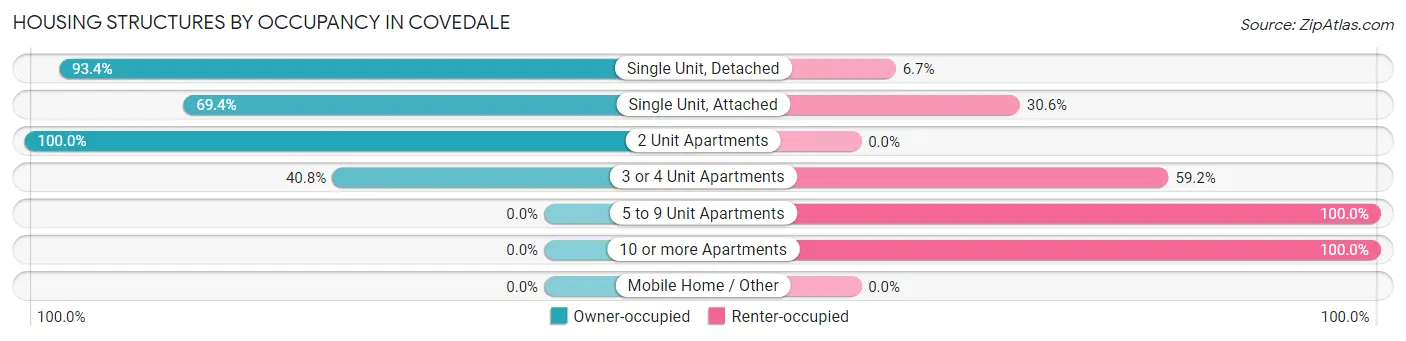
| Structure Type | Owner-occupied | Renter-occupied |
| Single Unit, Detached | 2,217 (93.3%) | 158 (6.7%) |
| Single Unit, Attached | 50 (69.4%) | 22 (30.6%) |
| 2 Unit Apartments | 15 (100.0%) | 0 (0.0%) |
| 3 or 4 Unit Apartments | 20 (40.8%) | 29 (59.2%) |
| 5 to 9 Unit Apartments | 0 (0.0%) | 10 (100.0%) |
| 10 or more Apartments | 0 (0.0%) | 18 (100.0%) |
| Mobile Home / Other | 0 (0.0%) | 0 (0.0%) |
| Total | 2,302 (90.7%) | 237 (9.3%) |
Housing Structures by Number of Rooms in Covedale
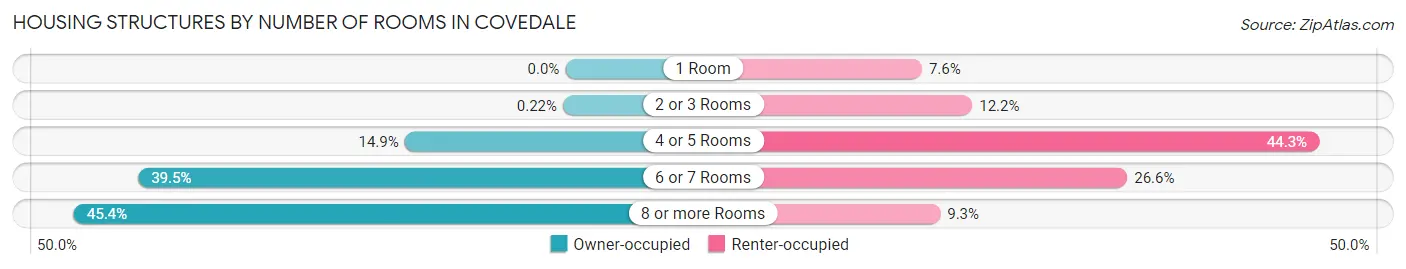
| Number of Rooms | Owner-occupied | Renter-occupied |
| 1 Room | 0 (0.0%) | 18 (7.6%) |
| 2 or 3 Rooms | 5 (0.2%) | 29 (12.2%) |
| 4 or 5 Rooms | 342 (14.9%) | 105 (44.3%) |
| 6 or 7 Rooms | 909 (39.5%) | 63 (26.6%) |
| 8 or more Rooms | 1,046 (45.4%) | 22 (9.3%) |
| Total | 2,302 (100.0%) | 237 (100.0%) |
Housing Structure by Heating Type in Covedale
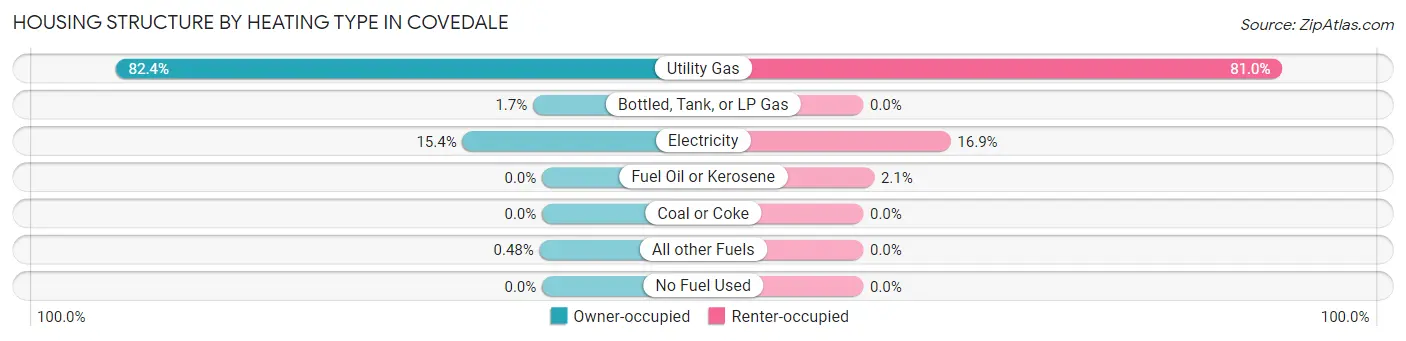
| Heating Type | Owner-occupied | Renter-occupied |
| Utility Gas | 1,897 (82.4%) | 192 (81.0%) |
| Bottled, Tank, or LP Gas | 40 (1.7%) | 0 (0.0%) |
| Electricity | 354 (15.4%) | 40 (16.9%) |
| Fuel Oil or Kerosene | 0 (0.0%) | 5 (2.1%) |
| Coal or Coke | 0 (0.0%) | 0 (0.0%) |
| All other Fuels | 11 (0.5%) | 0 (0.0%) |
| No Fuel Used | 0 (0.0%) | 0 (0.0%) |
| Total | 2,302 (100.0%) | 237 (100.0%) |
Household Vehicle Usage in Covedale
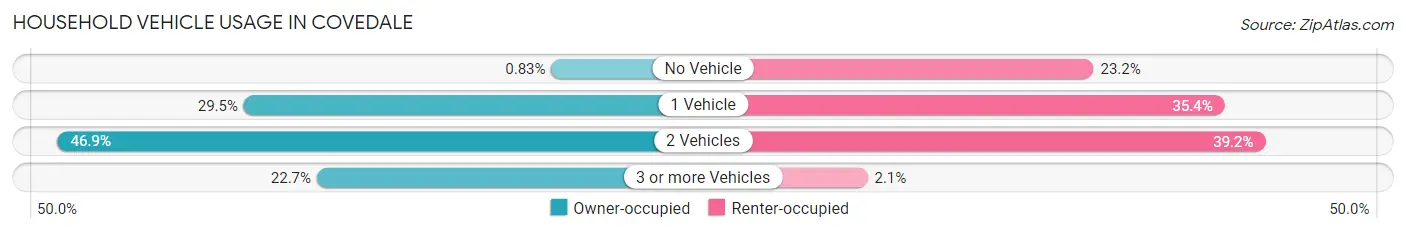
| Vehicles per Household | Owner-occupied | Renter-occupied |
| No Vehicle | 19 (0.8%) | 55 (23.2%) |
| 1 Vehicle | 680 (29.5%) | 84 (35.4%) |
| 2 Vehicles | 1,080 (46.9%) | 93 (39.2%) |
| 3 or more Vehicles | 523 (22.7%) | 5 (2.1%) |
| Total | 2,302 (100.0%) | 237 (100.0%) |
Real Estate & Mortgages in Covedale
Real Estate and Mortgage Overview in Covedale
| Characteristic | Without Mortgage | With Mortgage |
| Housing Units | 760 | 1,542 |
| Median Property Value | $194,600 | $185,900 |
| Median Household Income | $74,429 | $536 |
| Monthly Housing Costs | $676 | $123 |
| Real Estate Taxes | $3,436 | $40 |
Property Value by Mortgage Status in Covedale
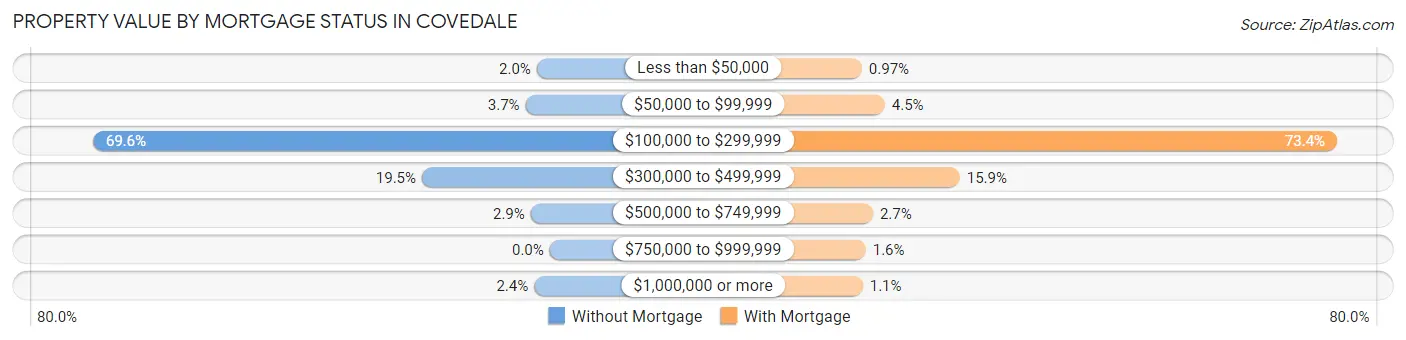
| Property Value | Without Mortgage | With Mortgage |
| Less than $50,000 | 15 (2.0%) | 15 (1.0%) |
| $50,000 to $99,999 | 28 (3.7%) | 69 (4.5%) |
| $100,000 to $299,999 | 529 (69.6%) | 1,131 (73.4%) |
| $300,000 to $499,999 | 148 (19.5%) | 245 (15.9%) |
| $500,000 to $749,999 | 22 (2.9%) | 41 (2.7%) |
| $750,000 to $999,999 | 0 (0.0%) | 24 (1.6%) |
| $1,000,000 or more | 18 (2.4%) | 17 (1.1%) |
| Total | 760 (100.0%) | 1,542 (100.0%) |
Household Income by Mortgage Status in Covedale
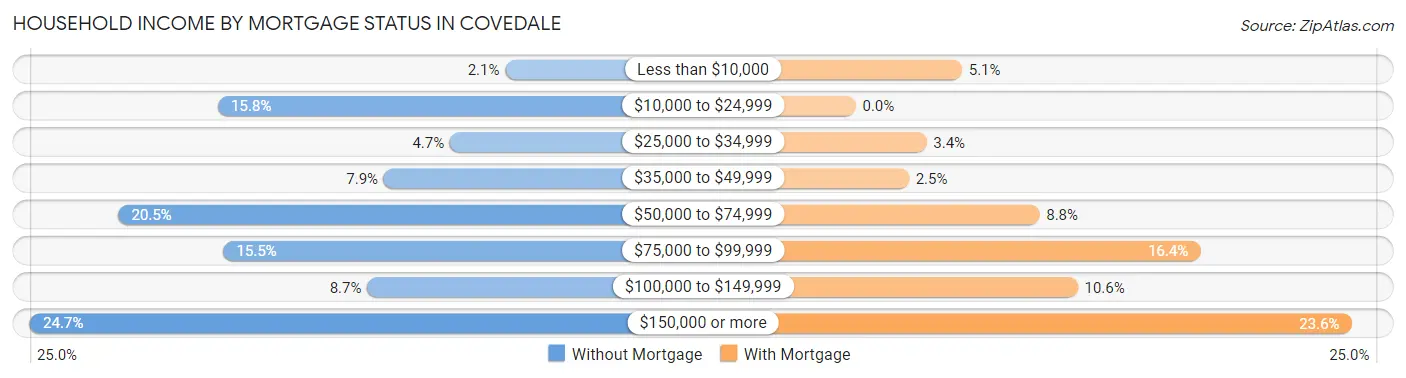
| Household Income | Without Mortgage | With Mortgage |
| Less than $10,000 | 16 (2.1%) | 78 (5.1%) |
| $10,000 to $24,999 | 120 (15.8%) | 0 (0.0%) |
| $25,000 to $34,999 | 36 (4.7%) | 52 (3.4%) |
| $35,000 to $49,999 | 60 (7.9%) | 39 (2.5%) |
| $50,000 to $74,999 | 156 (20.5%) | 135 (8.7%) |
| $75,000 to $99,999 | 118 (15.5%) | 253 (16.4%) |
| $100,000 to $149,999 | 66 (8.7%) | 163 (10.6%) |
| $150,000 or more | 188 (24.7%) | 364 (23.6%) |
| Total | 760 (100.0%) | 1,542 (100.0%) |
Property Value to Household Income Ratio in Covedale
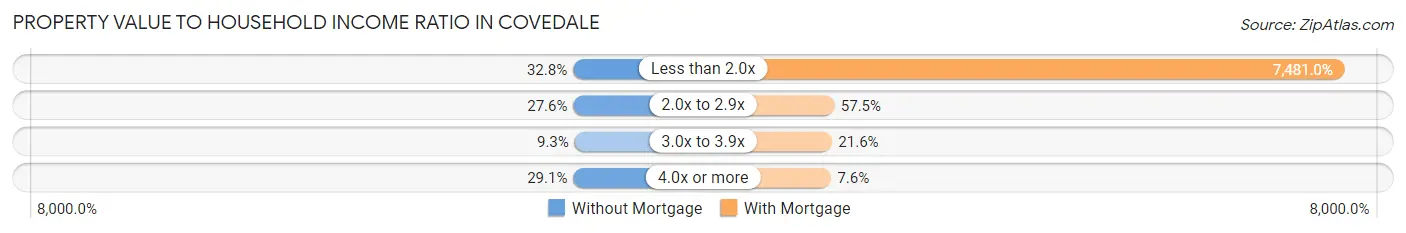
| Value-to-Income Ratio | Without Mortgage | With Mortgage |
| Less than 2.0x | 249 (32.8%) | 115,357 (7,481.0%) |
| 2.0x to 2.9x | 210 (27.6%) | 886 (57.5%) |
| 3.0x to 3.9x | 71 (9.3%) | 333 (21.6%) |
| 4.0x or more | 221 (29.1%) | 117 (7.6%) |
| Total | 760 (100.0%) | 1,542 (100.0%) |
Real Estate Taxes by Mortgage Status in Covedale
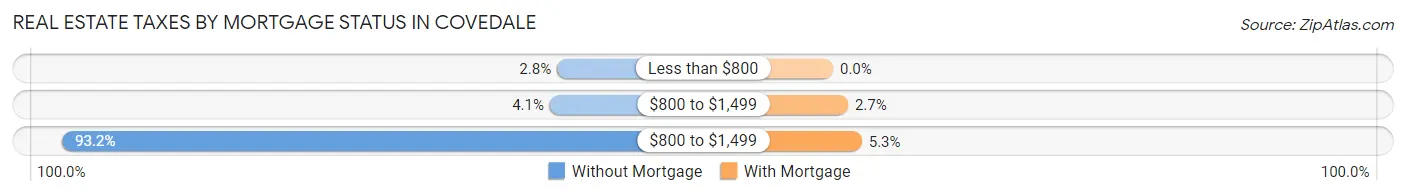
| Property Taxes | Without Mortgage | With Mortgage |
| Less than $800 | 21 (2.8%) | 0 (0.0%) |
| $800 to $1,499 | 31 (4.1%) | 42 (2.7%) |
| $800 to $1,499 | 708 (93.2%) | 81 (5.2%) |
| Total | 760 (100.0%) | 1,542 (100.0%) |
Health & Disability in Covedale
Health Insurance Coverage by Age in Covedale
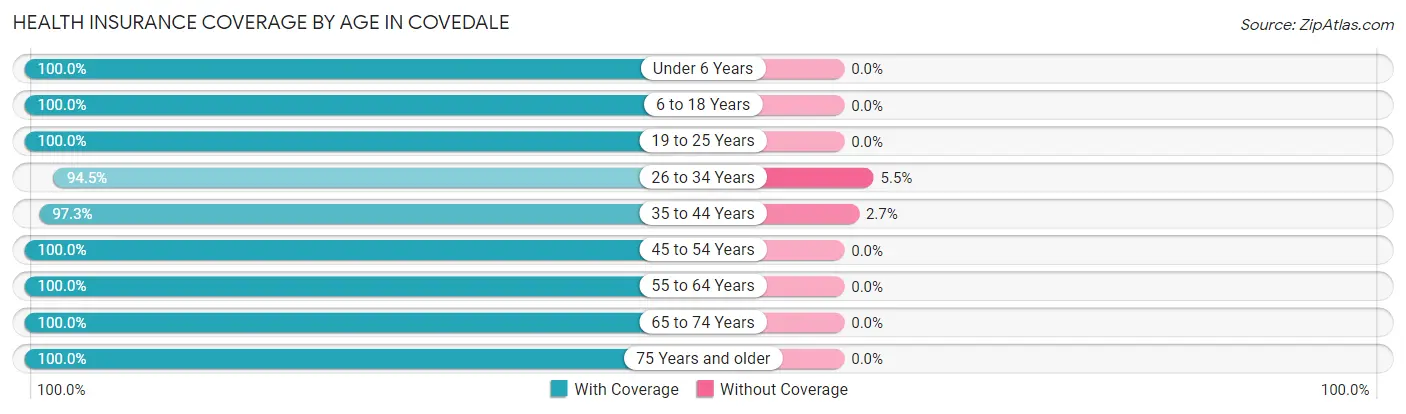
| Age Bracket | With Coverage | Without Coverage |
| Under 6 Years | 376 (100.0%) | 0 (0.0%) |
| 6 to 18 Years | 1,559 (100.0%) | 0 (0.0%) |
| 19 to 25 Years | 293 (100.0%) | 0 (0.0%) |
| 26 to 34 Years | 467 (94.5%) | 27 (5.5%) |
| 35 to 44 Years | 713 (97.3%) | 20 (2.7%) |
| 45 to 54 Years | 797 (100.0%) | 0 (0.0%) |
| 55 to 64 Years | 804 (100.0%) | 0 (0.0%) |
| 65 to 74 Years | 883 (100.0%) | 0 (0.0%) |
| 75 Years and older | 487 (100.0%) | 0 (0.0%) |
| Total | 6,379 (99.3%) | 47 (0.7%) |
Health Insurance Coverage by Citizenship Status in Covedale
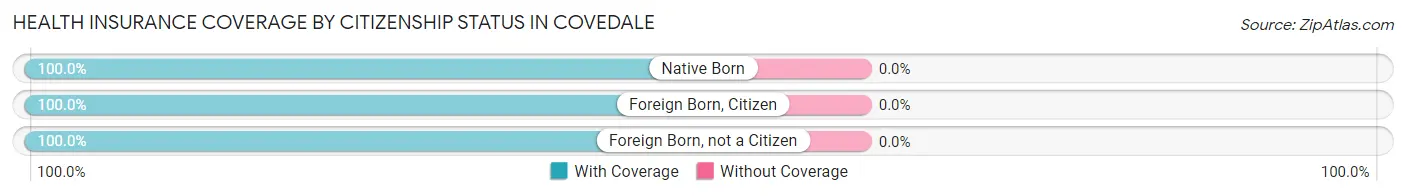
| Citizenship Status | With Coverage | Without Coverage |
| Native Born | 376 (100.0%) | 0 (0.0%) |
| Foreign Born, Citizen | 1,559 (100.0%) | 0 (0.0%) |
| Foreign Born, not a Citizen | 293 (100.0%) | 0 (0.0%) |
Health Insurance Coverage by Household Income in Covedale
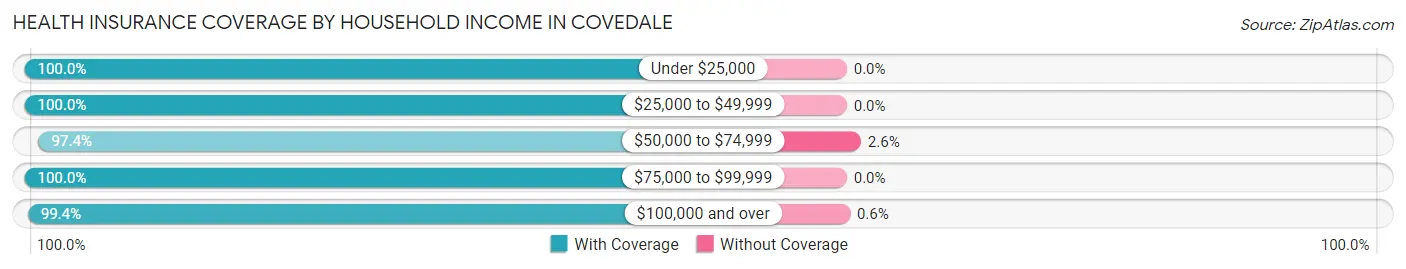
| Household Income | With Coverage | Without Coverage |
| Under $25,000 | 719 (100.0%) | 0 (0.0%) |
| $25,000 to $49,999 | 539 (100.0%) | 0 (0.0%) |
| $50,000 to $74,999 | 997 (97.4%) | 27 (2.6%) |
| $75,000 to $99,999 | 821 (100.0%) | 0 (0.0%) |
| $100,000 and over | 3,295 (99.4%) | 20 (0.6%) |
Public vs Private Health Insurance Coverage by Age in Covedale
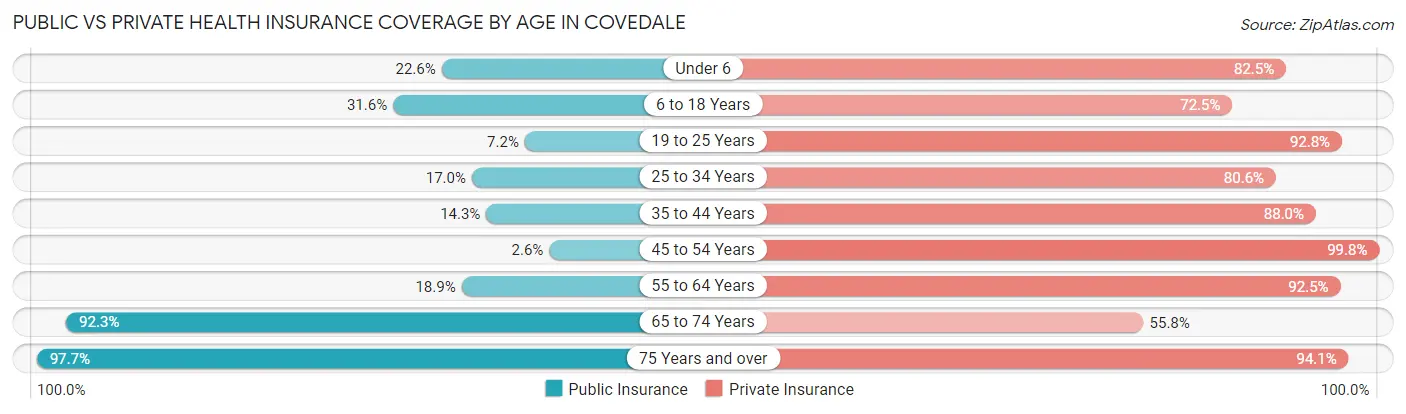
| Age Bracket | Public Insurance | Private Insurance |
| Under 6 | 85 (22.6%) | 310 (82.5%) |
| 6 to 18 Years | 493 (31.6%) | 1,130 (72.5%) |
| 19 to 25 Years | 21 (7.2%) | 272 (92.8%) |
| 25 to 34 Years | 84 (17.0%) | 398 (80.6%) |
| 35 to 44 Years | 105 (14.3%) | 645 (88.0%) |
| 45 to 54 Years | 21 (2.6%) | 795 (99.8%) |
| 55 to 64 Years | 152 (18.9%) | 744 (92.5%) |
| 65 to 74 Years | 815 (92.3%) | 493 (55.8%) |
| 75 Years and over | 476 (97.7%) | 458 (94.1%) |
| Total | 2,252 (35.0%) | 5,245 (81.6%) |
Disability Status by Sex by Age in Covedale
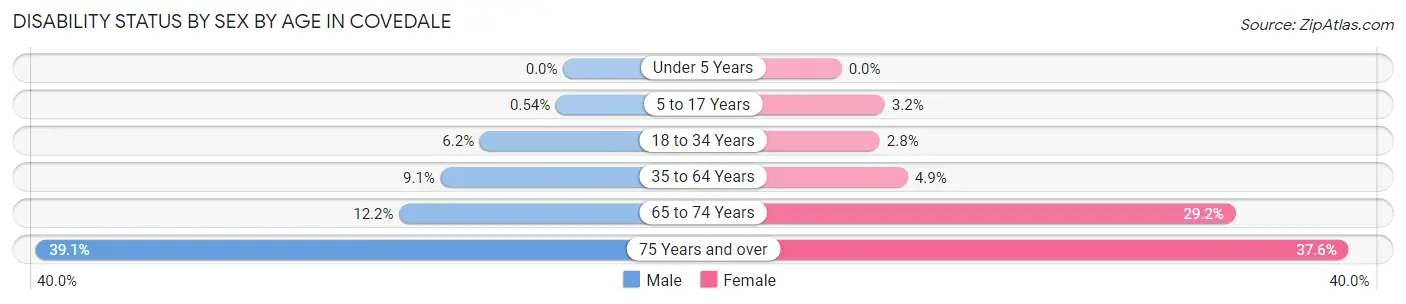
| Age Bracket | Male | Female |
| Under 5 Years | 0 (0.0%) | 0 (0.0%) |
| 5 to 17 Years | 5 (0.5%) | 21 (3.2%) |
| 18 to 34 Years | 26 (6.2%) | 12 (2.8%) |
| 35 to 64 Years | 105 (9.1%) | 58 (4.9%) |
| 65 to 74 Years | 48 (12.2%) | 143 (29.2%) |
| 75 Years and over | 72 (39.1%) | 114 (37.6%) |
Disability Class by Sex by Age in Covedale
Disability Class: Hearing Difficulty
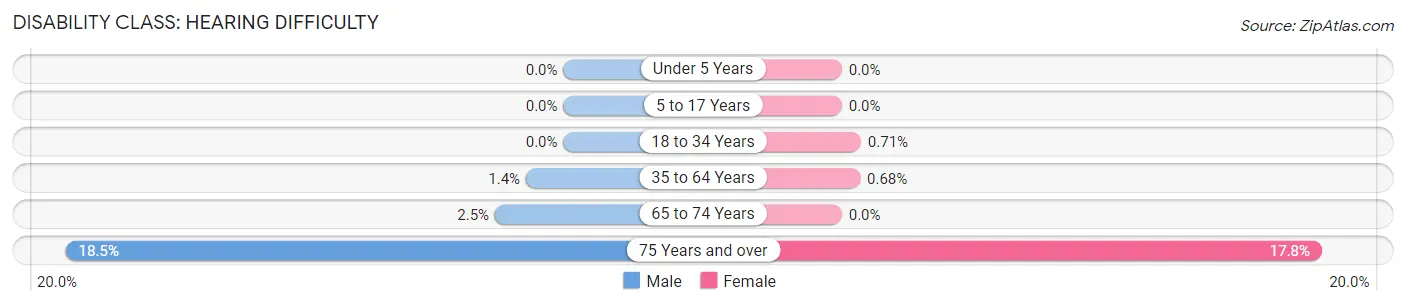
| Age Bracket | Male | Female |
| Under 5 Years | 0 (0.0%) | 0 (0.0%) |
| 5 to 17 Years | 0 (0.0%) | 0 (0.0%) |
| 18 to 34 Years | 0 (0.0%) | 3 (0.7%) |
| 35 to 64 Years | 16 (1.4%) | 8 (0.7%) |
| 65 to 74 Years | 10 (2.5%) | 0 (0.0%) |
| 75 Years and over | 34 (18.5%) | 54 (17.8%) |
Disability Class: Vision Difficulty
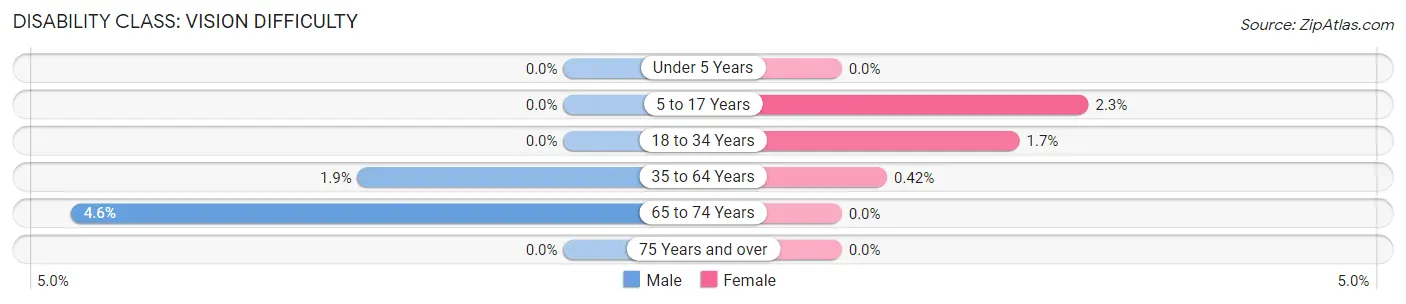
| Age Bracket | Male | Female |
| Under 5 Years | 0 (0.0%) | 0 (0.0%) |
| 5 to 17 Years | 0 (0.0%) | 15 (2.3%) |
| 18 to 34 Years | 0 (0.0%) | 7 (1.7%) |
| 35 to 64 Years | 22 (1.9%) | 5 (0.4%) |
| 65 to 74 Years | 18 (4.6%) | 0 (0.0%) |
| 75 Years and over | 0 (0.0%) | 0 (0.0%) |
Disability Class: Cognitive Difficulty
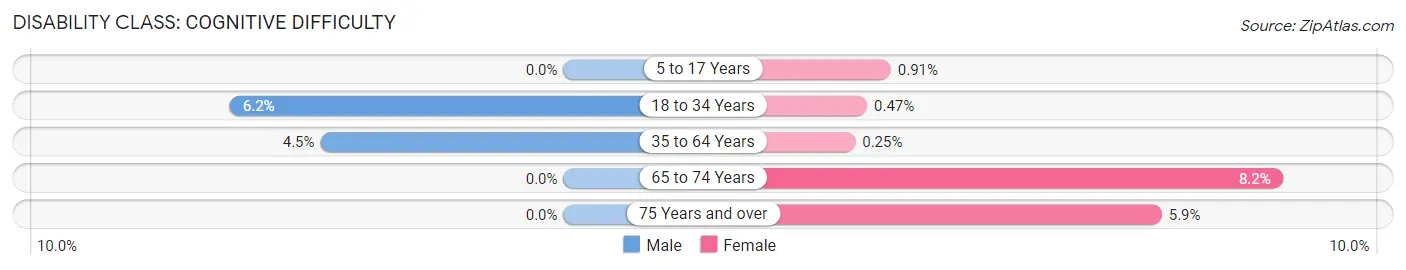
| Age Bracket | Male | Female |
| 5 to 17 Years | 0 (0.0%) | 6 (0.9%) |
| 18 to 34 Years | 26 (6.2%) | 2 (0.5%) |
| 35 to 64 Years | 52 (4.5%) | 3 (0.3%) |
| 65 to 74 Years | 0 (0.0%) | 40 (8.2%) |
| 75 Years and over | 0 (0.0%) | 18 (5.9%) |
Disability Class: Ambulatory Difficulty
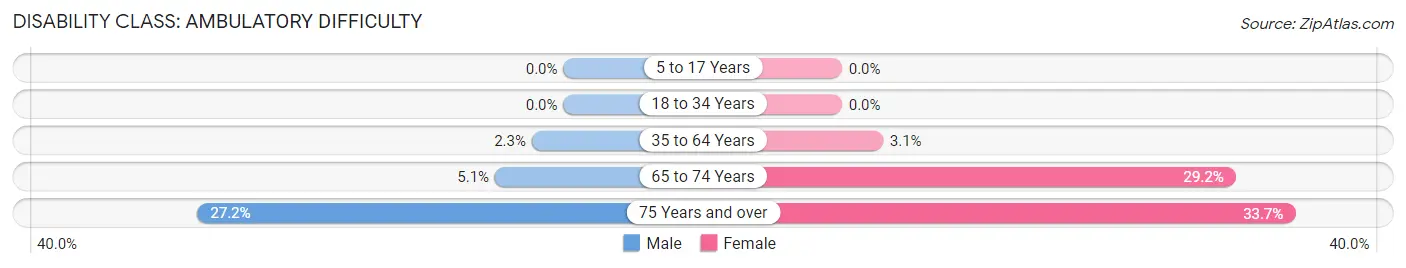
| Age Bracket | Male | Female |
| 5 to 17 Years | 0 (0.0%) | 0 (0.0%) |
| 18 to 34 Years | 0 (0.0%) | 0 (0.0%) |
| 35 to 64 Years | 27 (2.3%) | 36 (3.0%) |
| 65 to 74 Years | 20 (5.1%) | 143 (29.2%) |
| 75 Years and over | 50 (27.2%) | 102 (33.7%) |
Disability Class: Self-Care Difficulty
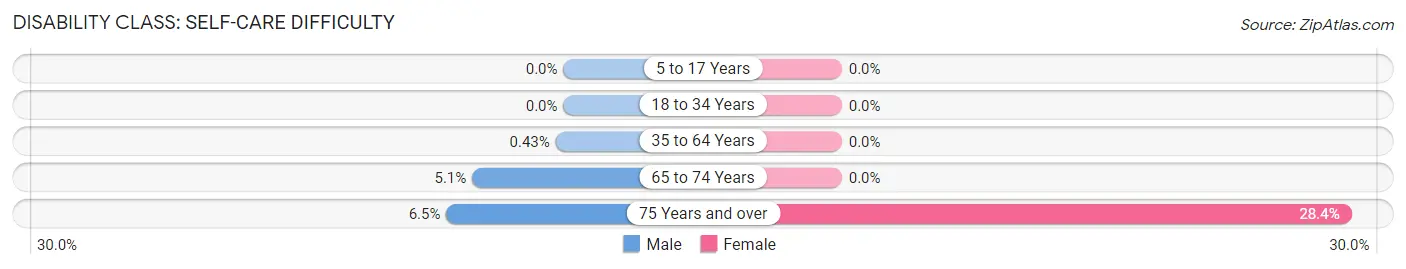
| Age Bracket | Male | Female |
| 5 to 17 Years | 0 (0.0%) | 0 (0.0%) |
| 18 to 34 Years | 0 (0.0%) | 0 (0.0%) |
| 35 to 64 Years | 5 (0.4%) | 0 (0.0%) |
| 65 to 74 Years | 20 (5.1%) | 0 (0.0%) |
| 75 Years and over | 12 (6.5%) | 86 (28.4%) |
Technology Access in Covedale
Computing Device Access in Covedale
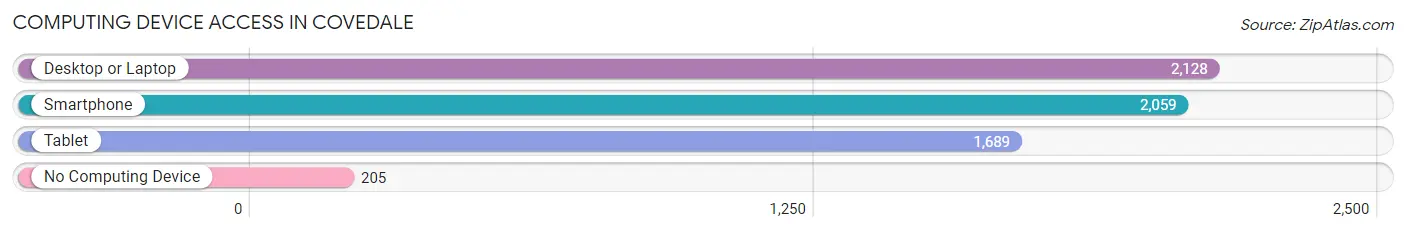
| Device Type | # Households | % Households |
| Desktop or Laptop | 2,128 | 83.8% |
| Smartphone | 2,059 | 81.1% |
| Tablet | 1,689 | 66.5% |
| No Computing Device | 205 | 8.1% |
| Total | 2,539 | 100.0% |
Internet Access in Covedale
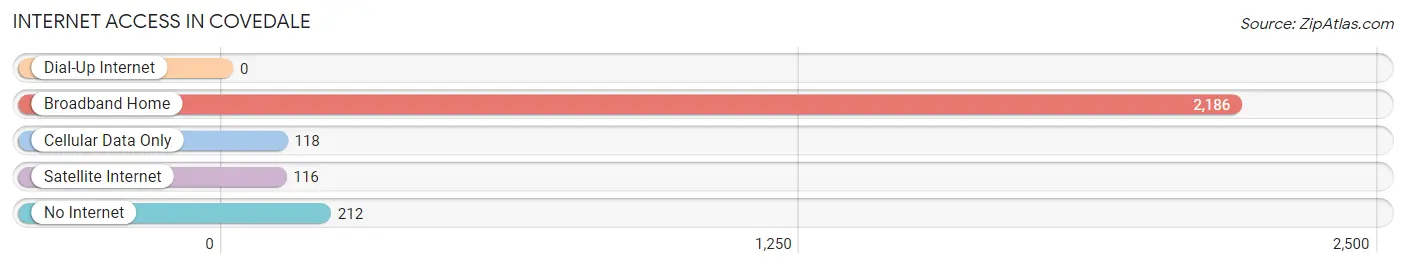
| Internet Type | # Households | % Households |
| Dial-Up Internet | 0 | 0.0% |
| Broadband Home | 2,186 | 86.1% |
| Cellular Data Only | 118 | 4.6% |
| Satellite Internet | 116 | 4.6% |
| No Internet | 212 | 8.4% |
| Total | 2,539 | 100.0% |
Covedale Summary
Covedale is a neighborhood located in the western part of Cincinnati, Ohio. It is bordered by the neighborhoods of Westwood, Price Hill, and Delhi Township. The population of Covedale was 8,845 in the 2010 census.
History
Covedale was originally part of the Symmes Purchase, a large tract of land purchased by John Cleves Symmes in 1788. The area was first settled in the early 1800s by German immigrants, who named the area Covedale after the many coves in the area. The area was annexed by the City of Cincinnati in 1910.
Geography
Covedale is located in the western part of Cincinnati, Ohio. It is bordered by the neighborhoods of Westwood, Price Hill, and Delhi Township. The neighborhood is located on a plateau, with an elevation of 890 feet above sea level. The area is characterized by rolling hills and valleys, with the highest point being the intersection of Glenway Avenue and Werk Road.
Economy
Covedale is primarily a residential neighborhood, with most of the residents employed in the nearby city of Cincinnati. The neighborhood is home to several small businesses, including restaurants, convenience stores, and auto repair shops. The neighborhood is also home to several churches, including St. Lawrence Church, St. William Church, and St. Aloysius Church.
Demographics
As of the 2010 census, the population of Covedale was 8,845. The racial makeup of the neighborhood was 79.3% White, 15.2% African American, 0.3% Native American, 1.2% Asian, 0.1% Pacific Islander, and 3.9% from other races. The median household income was $41,945, and the median family income was $50,945.
Conclusion
Covedale is a neighborhood located in the western part of Cincinnati, Ohio. It is bordered by the neighborhoods of Westwood, Price Hill, and Delhi Township. The population of Covedale was 8,845 in the 2010 census. The area was originally part of the Symmes Purchase, and was first settled in the early 1800s by German immigrants. The economy of Covedale is primarily residential, with most of the residents employed in the nearby city of Cincinnati. The racial makeup of the neighborhood was 79.3% White, 15.2% African American, 0.3% Native American, 1.2% Asian, 0.1% Pacific Islander, and 3.9% from other races. The median household income was $41,945, and the median family income was $50,945.
Common Questions
What is Per Capita Income in Covedale?
Per Capita income in Covedale is $48,465.
What is the Median Family Income in Covedale?
Median Family Income in Covedale is $115,179.
What is the Median Household income in Covedale?
Median Household Income in Covedale is $90,665.
What is Income or Wage Gap in Covedale?
Income or Wage Gap in Covedale is 18.0%.
Women in Covedale earn 82.0 cents for every dollar earned by a man.
What is Inequality or Gini Index in Covedale?
Inequality or Gini Index in Covedale is 0.44.
What is the Total Population of Covedale?
Total Population of Covedale is 6,426.
What is the Total Male Population of Covedale?
Total Male Population of Covedale is 3,252.
What is the Total Female Population of Covedale?
Total Female Population of Covedale is 3,174.
What is the Ratio of Males per 100 Females in Covedale?
There are 102.46 Males per 100 Females in Covedale.
What is the Ratio of Females per 100 Males in Covedale?
There are 97.60 Females per 100 Males in Covedale.
What is the Median Population Age in Covedale?
Median Population Age in Covedale is 40.9 Years.
What is the Average Family Size in Covedale
Average Family Size in Covedale is 3.0 People.
What is the Average Household Size in Covedale
Average Household Size in Covedale is 2.5 People.
How Large is the Labor Force in Covedale?
There are 3,070 People in the Labor Forcein in Covedale.
What is the Percentage of People in the Labor Force in Covedale?
64.9% of People are in the Labor Force in Covedale.
What is the Unemployment Rate in Covedale?
Unemployment Rate in Covedale is 0.6%.