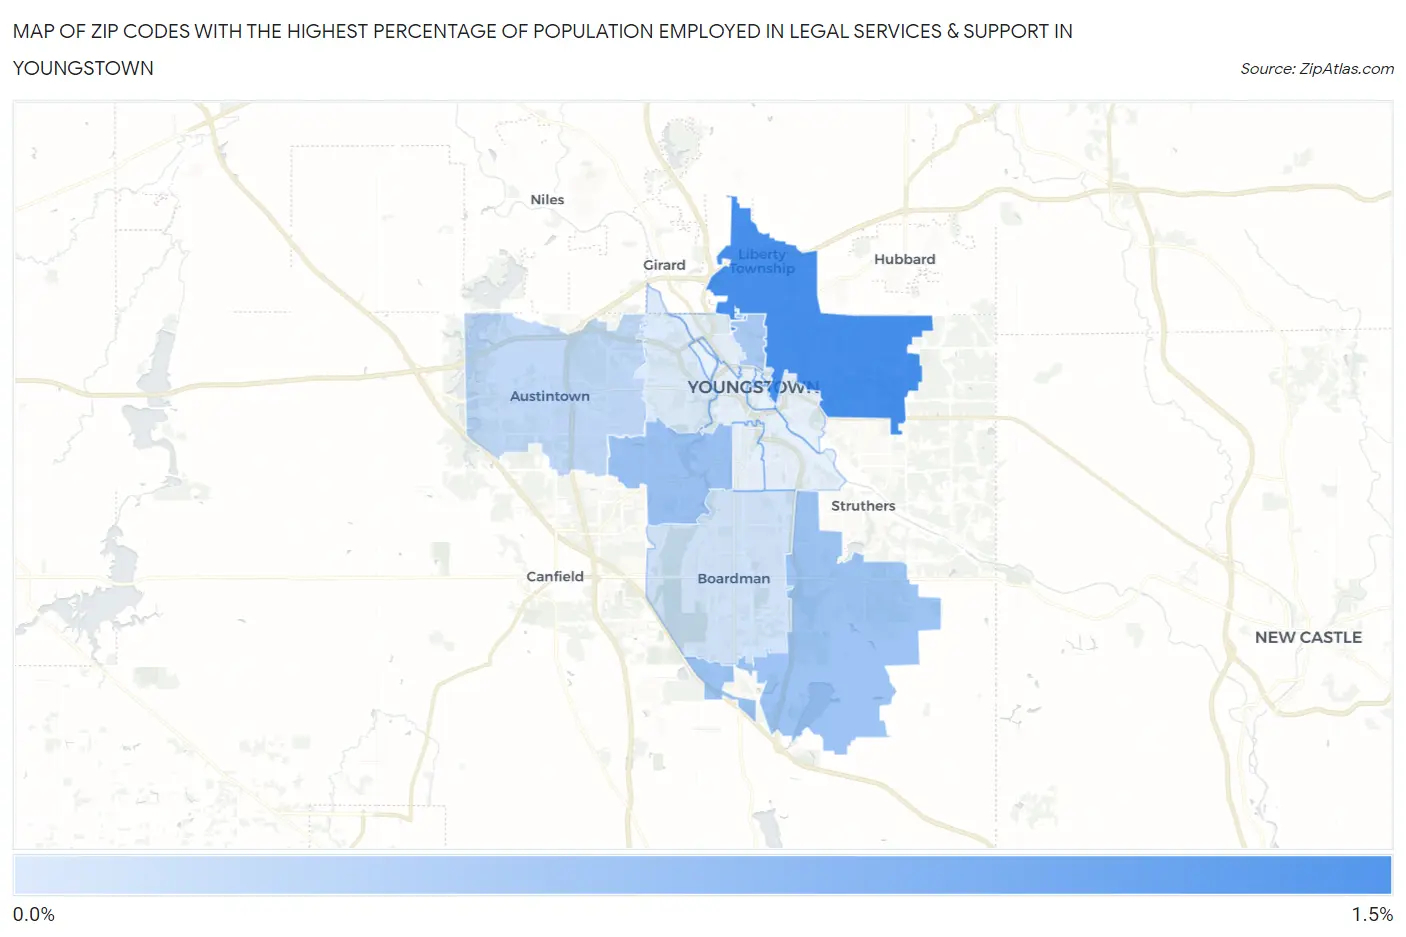
Zip Codes with the Highest Percentage of Population Employed in Legal Services & Support in Youngstown, OH
RELATED REPORTS & OPTIONS
Legal Services & Support
Youngstown
Compare Zip Codes
Map of Zip Codes with the Highest Percentage of Population Employed in Legal Services & Support in Youngstown
0.15%
1.2%

Zip Codes with the Highest Percentage of Population Employed in Legal Services & Support in Youngstown, OH
| Zip Code | % Employed | vs State | vs National | |
| 1. | 44505 | 1.2% | 0.92%(+0.249)#191 | 1.2%(-0.010)#6,690 |
| 2. | 44511 | 0.60% | 0.92%(-0.323)#372 | 1.2%(-0.582)#11,436 |
| 3. | 44514 | 0.57% | 0.92%(-0.352)#382 | 1.2%(-0.611)#11,784 |
| 4. | 44504 | 0.49% | 0.92%(-0.435)#424 | 1.2%(-0.694)#12,752 |
| 5. | 44515 | 0.34% | 0.92%(-0.582)#500 | 1.2%(-0.841)#14,552 |
| 6. | 44512 | 0.23% | 0.92%(-0.690)#562 | 1.2%(-0.949)#15,815 |
| 7. | 44509 | 0.15% | 0.92%(-0.776)#606 | 1.2%(-1.03)#16,696 |
1
Common Questions
What are the Top 10 Zip Codes with the Highest Percentage of Population Employed in Legal Services & Support in Youngstown, OH?
Top 10 Zip Codes with the Highest Percentage of Population Employed in Legal Services & Support in Youngstown, OH are:
What zip code has the Highest Percentage of Population Employed in Legal Services & Support in Youngstown, OH?
44505 has the Highest Percentage of Population Employed in Legal Services & Support in Youngstown, OH with 1.2%.
What is the Percentage of Population Employed in Legal Services & Support in Youngstown, OH?
Percentage of Population Employed in Legal Services & Support in Youngstown is 0.13%.
What is the Percentage of Population Employed in Legal Services & Support in Ohio?
Percentage of Population Employed in Legal Services & Support in Ohio is 0.92%.
What is the Percentage of Population Employed in Legal Services & Support in the United States?
Percentage of Population Employed in Legal Services & Support in the United States is 1.2%.