Fairfax, OH Map & Demographics
Fairfax Map
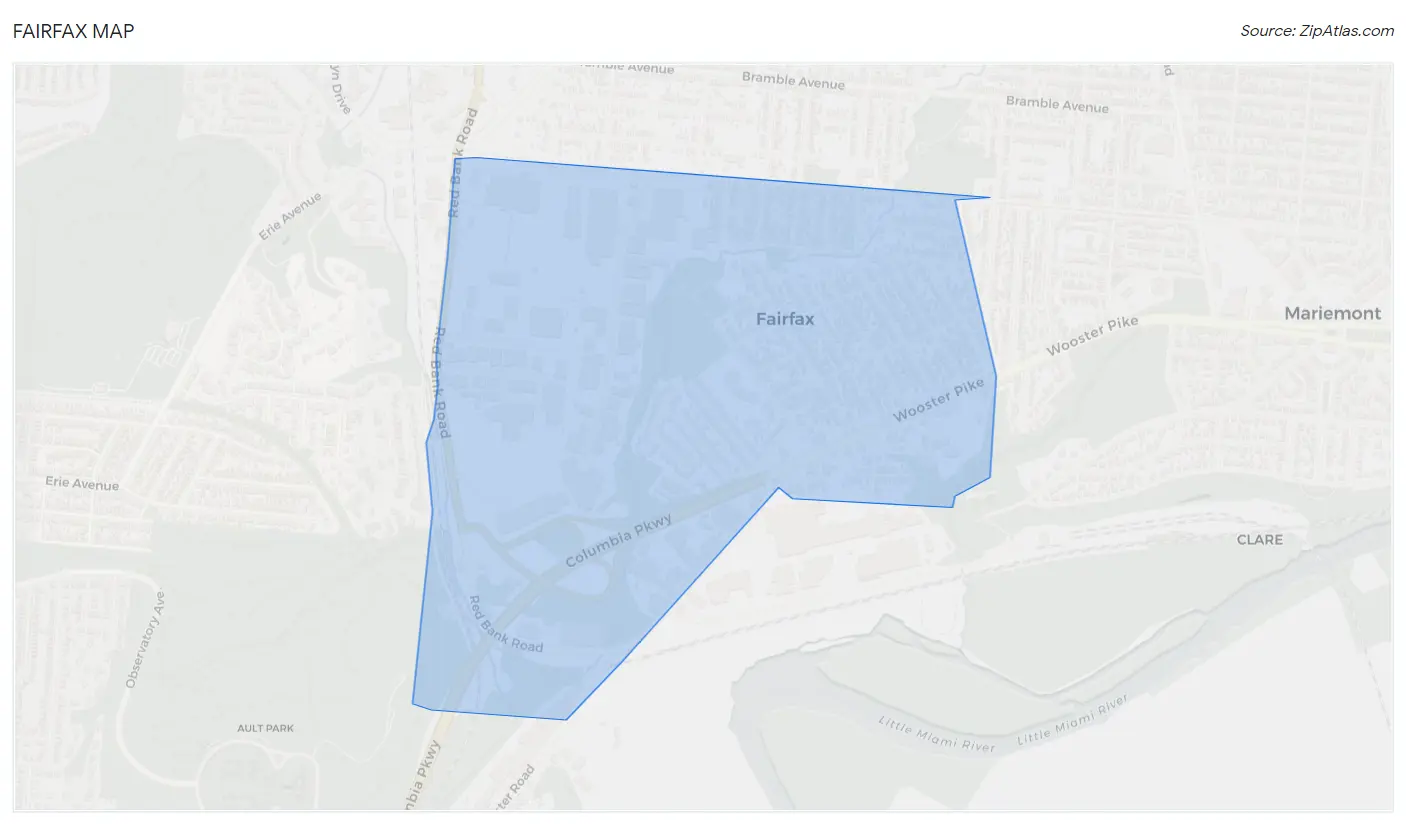
Fairfax Overview
$40,075
PER CAPITA INCOME
$93,281
AVG FAMILY INCOME
$70,750
AVG HOUSEHOLD INCOME
5.9%
WAGE / INCOME GAP [ % ]
94.1¢/ $1
WAGE / INCOME GAP [ $ ]
0.40
INEQUALITY / GINI INDEX
1,661
TOTAL POPULATION
797
MALE POPULATION
864
FEMALE POPULATION
92.25
MALES / 100 FEMALES
108.41
FEMALES / 100 MALES
36.9
MEDIAN AGE
2.9
AVG FAMILY SIZE
2.3
AVG HOUSEHOLD SIZE
995
LABOR FORCE [ PEOPLE ]
76.8%
PERCENT IN LABOR FORCE
3.9%
UNEMPLOYMENT RATE
Income in Fairfax
Income Overview in Fairfax
Per Capita Income in Fairfax is $40,075, while median incomes of families and households are $93,281 and $70,750 respectively.
| Characteristic | Number | Measure |
| Per Capita Income | 1,661 | $40,075 |
| Median Family Income | 439 | $93,281 |
| Mean Family Income | 439 | $110,886 |
| Median Household Income | 733 | $70,750 |
| Mean Household Income | 733 | $91,519 |
| Income Deficit | 439 | $0 |
| Wage / Income Gap (%) | 1,661 | 5.93% |
| Wage / Income Gap ($) | 1,661 | 94.07¢ per $1 |
| Gini / Inequality Index | 1,661 | 0.40 |
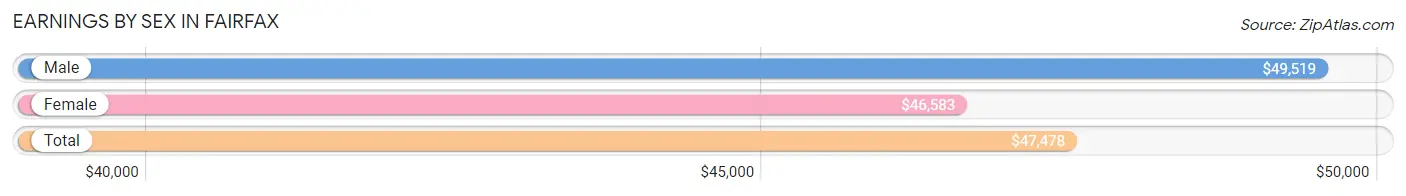
Earnings by Sex in Fairfax
Average Earnings in Fairfax are $47,478, $49,519 for men and $46,583 for women, a difference of 5.9%.
| Sex | Number | Average Earnings |
| Male | 475 (47.5%) | $49,519 |
| Female | 524 (52.4%) | $46,583 |
| Total | 999 (100.0%) | $47,478 |
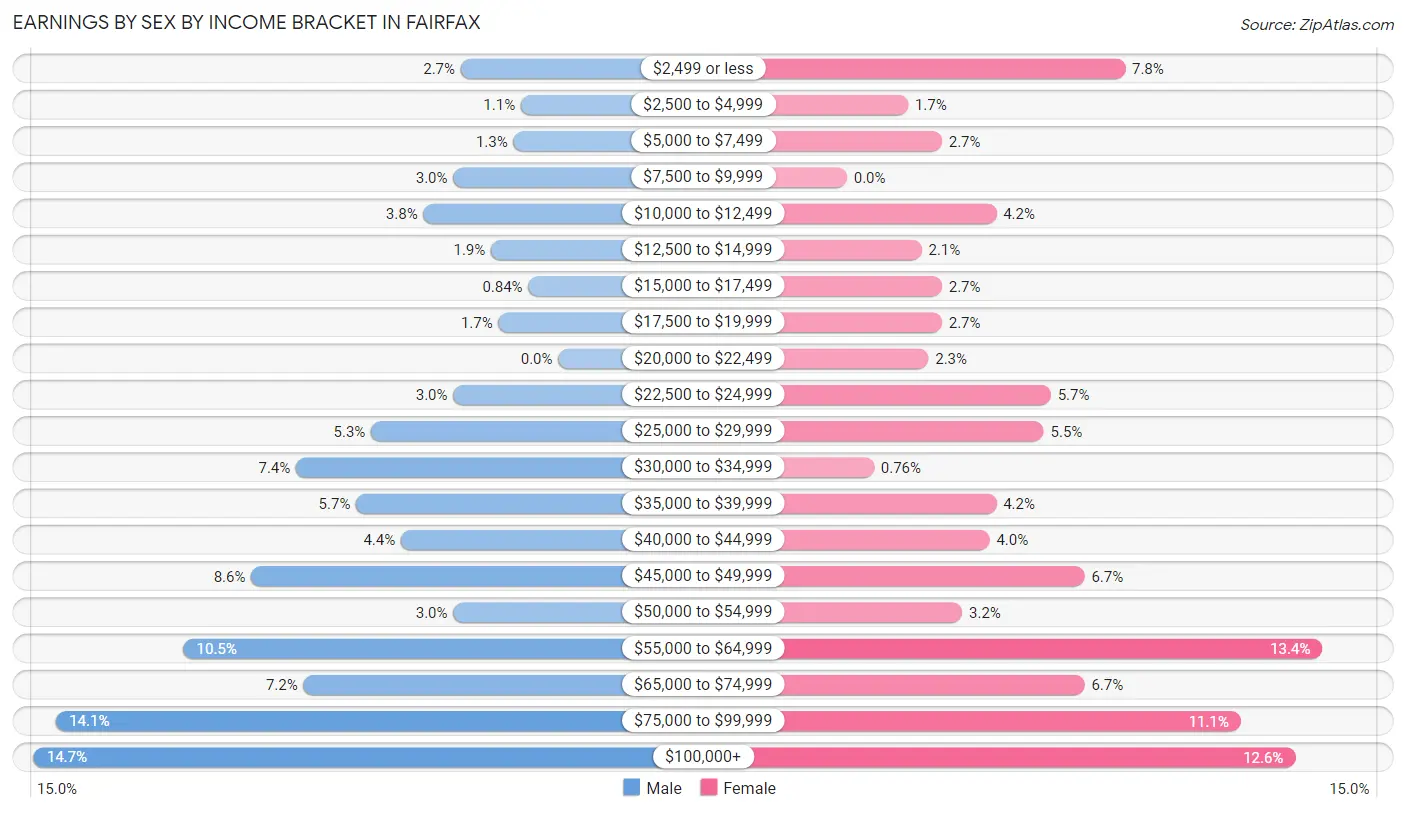
Earnings by Sex by Income Bracket in Fairfax
The most common earnings brackets in Fairfax are $100,000+ for men (70 | 14.7%) and $55,000 to $64,999 for women (70 | 13.4%).
| Income | Male | Female |
| $2,499 or less | 13 (2.7%) | 41 (7.8%) |
| $2,500 to $4,999 | 5 (1.1%) | 9 (1.7%) |
| $5,000 to $7,499 | 6 (1.3%) | 14 (2.7%) |
| $7,500 to $9,999 | 14 (2.9%) | 0 (0.0%) |
| $10,000 to $12,499 | 18 (3.8%) | 22 (4.2%) |
| $12,500 to $14,999 | 9 (1.9%) | 11 (2.1%) |
| $15,000 to $17,499 | 4 (0.8%) | 14 (2.7%) |
| $17,500 to $19,999 | 8 (1.7%) | 14 (2.7%) |
| $20,000 to $22,499 | 0 (0.0%) | 12 (2.3%) |
| $22,500 to $24,999 | 14 (2.9%) | 30 (5.7%) |
| $25,000 to $29,999 | 25 (5.3%) | 29 (5.5%) |
| $30,000 to $34,999 | 35 (7.4%) | 4 (0.8%) |
| $35,000 to $39,999 | 27 (5.7%) | 22 (4.2%) |
| $40,000 to $44,999 | 21 (4.4%) | 21 (4.0%) |
| $45,000 to $49,999 | 41 (8.6%) | 35 (6.7%) |
| $50,000 to $54,999 | 14 (2.9%) | 17 (3.2%) |
| $55,000 to $64,999 | 50 (10.5%) | 70 (13.4%) |
| $65,000 to $74,999 | 34 (7.2%) | 35 (6.7%) |
| $75,000 to $99,999 | 67 (14.1%) | 58 (11.1%) |
| $100,000+ | 70 (14.7%) | 66 (12.6%) |
| Total | 475 (100.0%) | 524 (100.0%) |
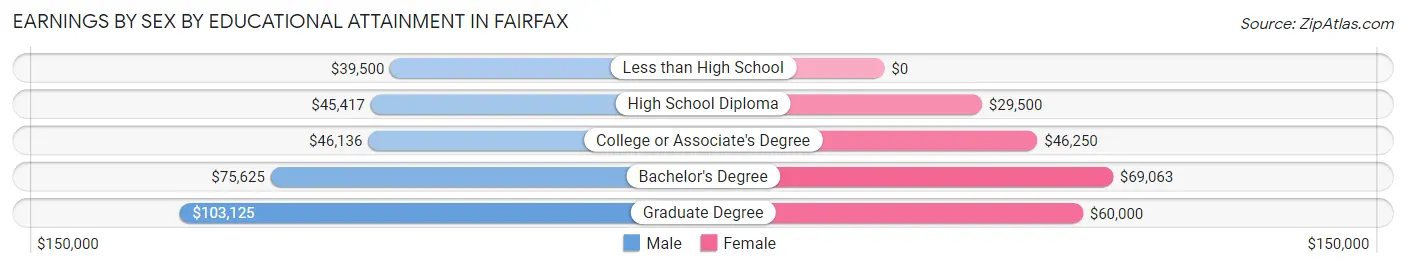
Earnings by Sex by Educational Attainment in Fairfax
Average earnings in Fairfax are $57,031 for men and $55,804 for women, a difference of 2.1%. Men with an educational attainment of graduate degree enjoy the highest average annual earnings of $103,125, while those with less than high school education earn the least with $39,500. Women with an educational attainment of bachelor's degree earn the most with the average annual earnings of $69,063, while those with high school diploma education have the smallest earnings of $29,500.
| Educational Attainment | Male Income | Female Income |
| Less than High School | $39,500 | $0 |
| High School Diploma | $45,417 | $29,500 |
| College or Associate's Degree | $46,136 | $46,250 |
| Bachelor's Degree | $75,625 | $69,063 |
| Graduate Degree | $103,125 | $60,000 |
| Total | $57,031 | $55,804 |
Family Income in Fairfax
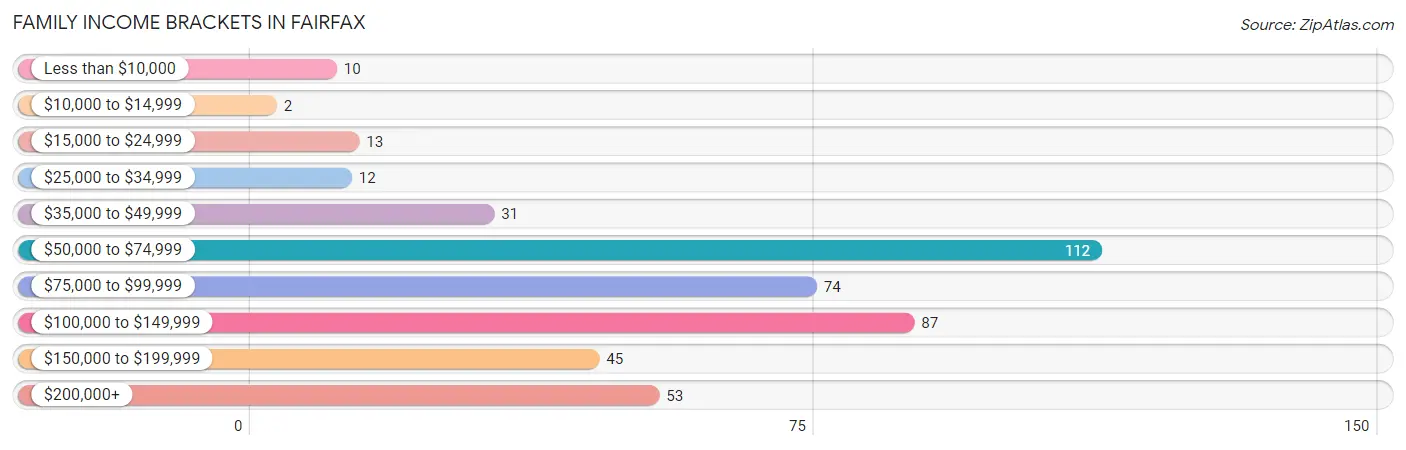
Family Income Brackets in Fairfax
According to the Fairfax family income data, there are 112 families falling into the $50,000 to $74,999 income range, which is the most common income bracket and makes up 25.5% of all families. Conversely, the $10,000 to $14,999 income bracket is the least frequent group with only 2 families (0.5%) belonging to this category.
| Income Bracket | # Families | % Families |
| Less than $10,000 | 10 | 2.3% |
| $10,000 to $14,999 | 2 | 0.5% |
| $15,000 to $24,999 | 13 | 3.0% |
| $25,000 to $34,999 | 12 | 2.7% |
| $35,000 to $49,999 | 31 | 7.1% |
| $50,000 to $74,999 | 112 | 25.5% |
| $75,000 to $99,999 | 74 | 16.9% |
| $100,000 to $149,999 | 87 | 19.8% |
| $150,000 to $199,999 | 45 | 10.3% |
| $200,000+ | 53 | 12.1% |
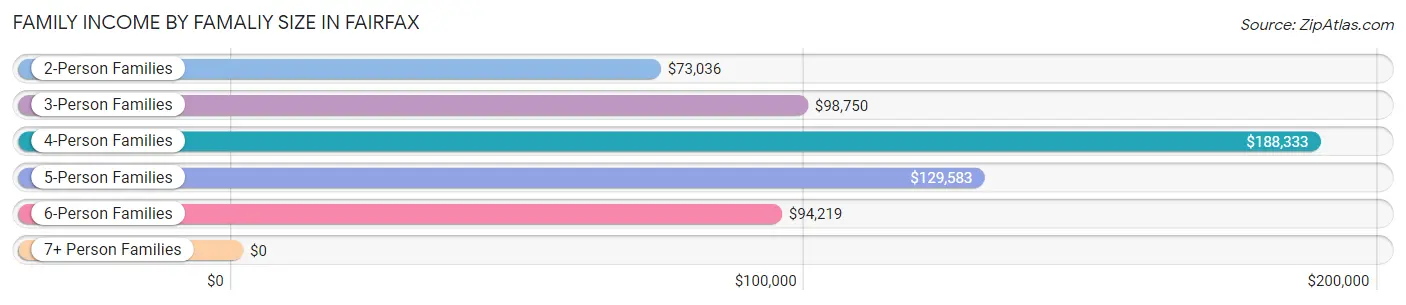
Family Income by Famaliy Size in Fairfax
4-person families (62 | 14.1%) account for the highest median family income in Fairfax with $188,333 per family, while 4-person families (62 | 14.1%) have the highest median income of $47,083 per family member.
| Income Bracket | # Families | Median Income |
| 2-Person Families | 232 (52.8%) | $73,036 |
| 3-Person Families | 103 (23.5%) | $98,750 |
| 4-Person Families | 62 (14.1%) | $188,333 |
| 5-Person Families | 11 (2.5%) | $129,583 |
| 6-Person Families | 31 (7.1%) | $94,219 |
| 7+ Person Families | 0 (0.0%) | $0 |
| Total | 439 (100.0%) | $93,281 |
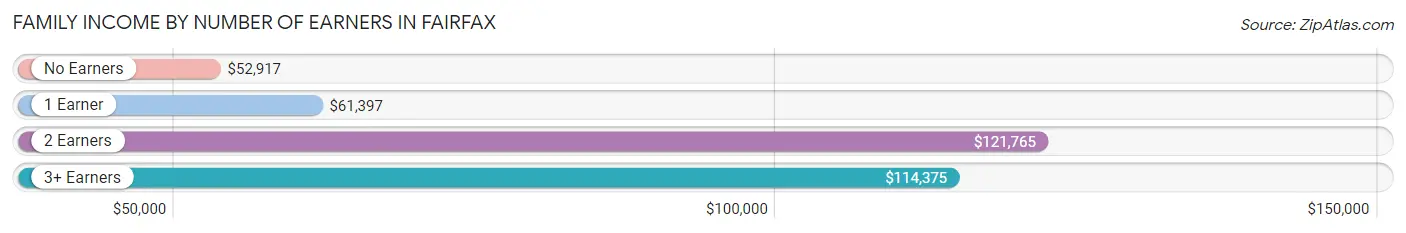
Family Income by Number of Earners in Fairfax
The median family income in Fairfax is $93,281, with families comprising 2 earners (180) having the highest median family income of $121,765, while families with no earners (31) have the lowest median family income of $52,917, accounting for 41.0% and 7.1% of families, respectively.
| Number of Earners | # Families | Median Income |
| No Earners | 31 (7.1%) | $52,917 |
| 1 Earner | 160 (36.4%) | $61,397 |
| 2 Earners | 180 (41.0%) | $121,765 |
| 3+ Earners | 68 (15.5%) | $114,375 |
| Total | 439 (100.0%) | $93,281 |
Household Income in Fairfax
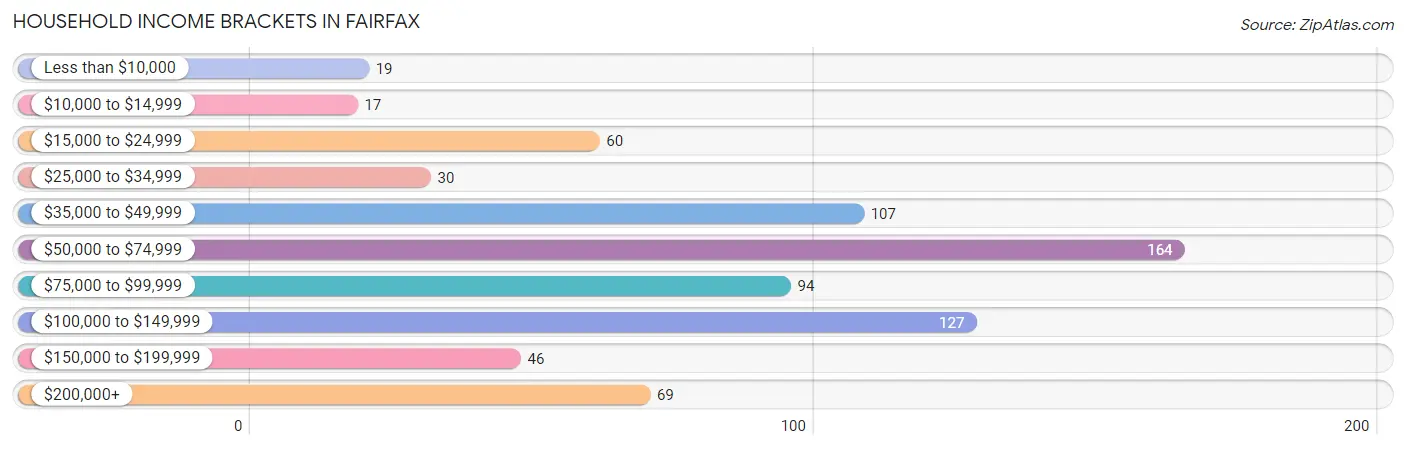
Household Income Brackets in Fairfax
With 164 households falling in the category, the $50,000 to $74,999 income range is the most frequent in Fairfax, accounting for 22.4% of all households. In contrast, only 17 households (2.3%) fall into the $10,000 to $14,999 income bracket, making it the least populous group.
| Income Bracket | # Households | % Households |
| Less than $10,000 | 19 | 2.6% |
| $10,000 to $14,999 | 17 | 2.3% |
| $15,000 to $24,999 | 60 | 8.2% |
| $25,000 to $34,999 | 30 | 4.1% |
| $35,000 to $49,999 | 107 | 14.6% |
| $50,000 to $74,999 | 164 | 22.4% |
| $75,000 to $99,999 | 94 | 12.8% |
| $100,000 to $149,999 | 127 | 17.3% |
| $150,000 to $199,999 | 46 | 6.3% |
| $200,000+ | 69 | 9.4% |
Household Income by Householder Age in Fairfax
The median household income in Fairfax is $70,750, with the highest median household income of $107,344 found in the 25 to 44 years age bracket for the primary householder. A total of 279 households (38.1%) fall into this category. Meanwhile, the 65+ years age bracket for the primary householder has the lowest median household income of $39,821, with 151 households (20.6%) in this group.
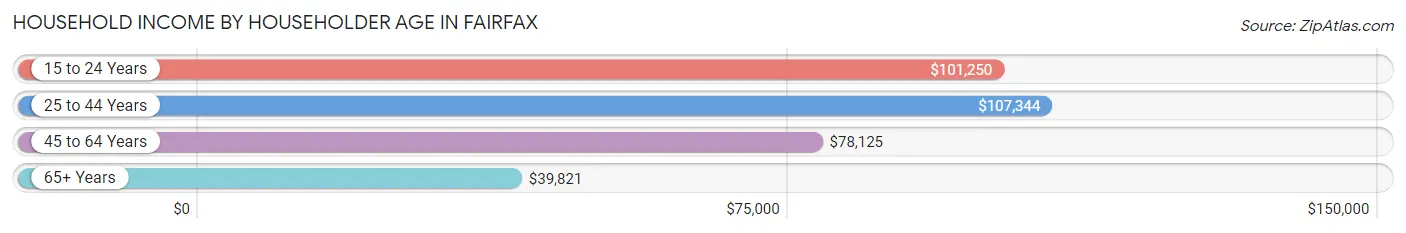
| Income Bracket | # Households | Median Income |
| 15 to 24 Years | 17 (2.3%) | $101,250 |
| 25 to 44 Years | 279 (38.1%) | $107,344 |
| 45 to 64 Years | 286 (39.0%) | $78,125 |
| 65+ Years | 151 (20.6%) | $39,821 |
| Total | 733 (100.0%) | $70,750 |
Poverty in Fairfax
Income Below Poverty by Sex and Age in Fairfax
With 5.3% poverty level for males and 5.8% for females among the residents of Fairfax, 16 and 17 year old males and 12 to 14 year old females are the most vulnerable to poverty, with 7 males (38.9%) and 7 females (30.4%) in their respective age groups living below the poverty level.
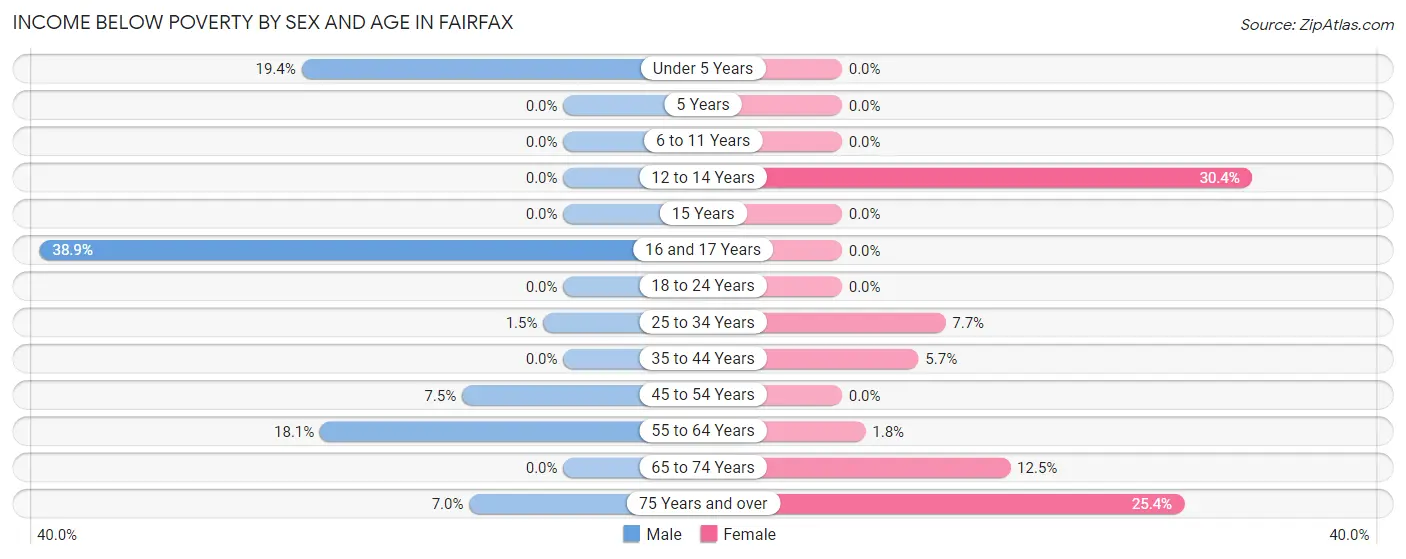
| Age Bracket | Male | Female |
| Under 5 Years | 7 (19.4%) | 0 (0.0%) |
| 5 Years | 0 (0.0%) | 0 (0.0%) |
| 6 to 11 Years | 0 (0.0%) | 0 (0.0%) |
| 12 to 14 Years | 0 (0.0%) | 7 (30.4%) |
| 15 Years | 0 (0.0%) | 0 (0.0%) |
| 16 and 17 Years | 7 (38.9%) | 0 (0.0%) |
| 18 to 24 Years | 0 (0.0%) | 0 (0.0%) |
| 25 to 34 Years | 2 (1.5%) | 11 (7.7%) |
| 35 to 44 Years | 0 (0.0%) | 7 (5.7%) |
| 45 to 54 Years | 10 (7.5%) | 0 (0.0%) |
| 55 to 64 Years | 13 (18.1%) | 2 (1.8%) |
| 65 to 74 Years | 0 (0.0%) | 7 (12.5%) |
| 75 Years and over | 3 (7.0%) | 16 (25.4%) |
| Total | 42 (5.3%) | 50 (5.8%) |
Income Above Poverty by Sex and Age in Fairfax
According to the poverty statistics in Fairfax, males aged 5 years and females aged under 5 years are the age groups that are most secure financially, with 100.0% of males and 100.0% of females in these age groups living above the poverty line.
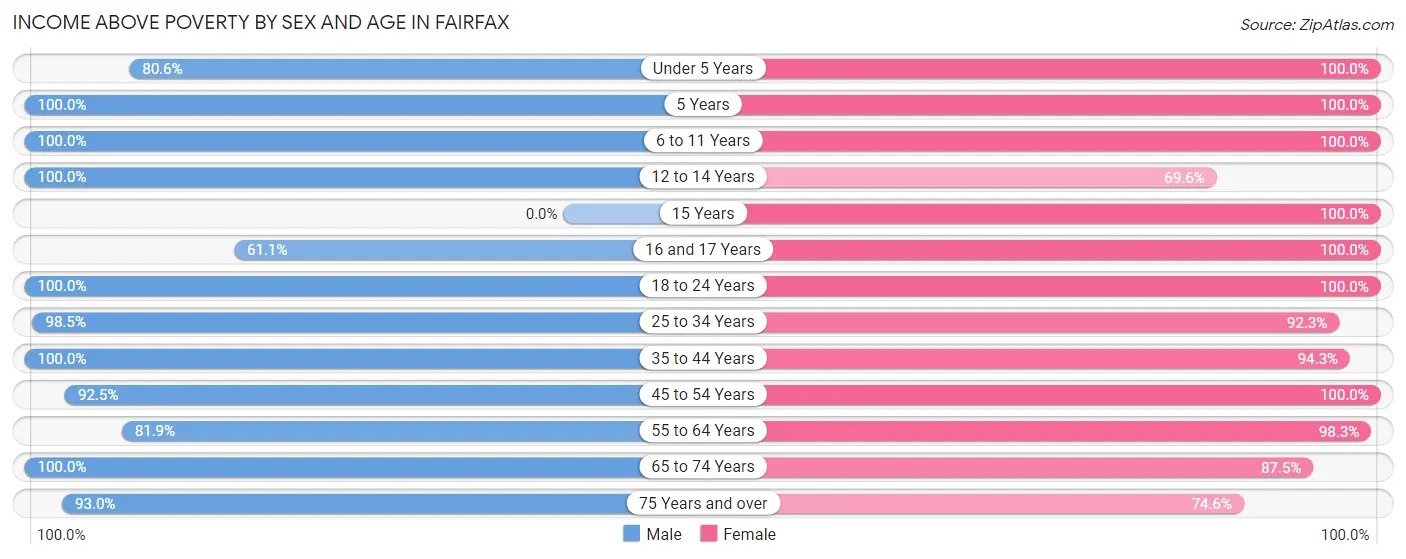
| Age Bracket | Male | Female |
| Under 5 Years | 29 (80.6%) | 20 (100.0%) |
| 5 Years | 22 (100.0%) | 12 (100.0%) |
| 6 to 11 Years | 42 (100.0%) | 75 (100.0%) |
| 12 to 14 Years | 97 (100.0%) | 16 (69.6%) |
| 15 Years | 0 (0.0%) | 38 (100.0%) |
| 16 and 17 Years | 11 (61.1%) | 10 (100.0%) |
| 18 to 24 Years | 59 (100.0%) | 69 (100.0%) |
| 25 to 34 Years | 132 (98.5%) | 132 (92.3%) |
| 35 to 44 Years | 100 (100.0%) | 116 (94.3%) |
| 45 to 54 Years | 123 (92.5%) | 118 (100.0%) |
| 55 to 64 Years | 59 (81.9%) | 112 (98.3%) |
| 65 to 74 Years | 41 (100.0%) | 49 (87.5%) |
| 75 Years and over | 40 (93.0%) | 47 (74.6%) |
| Total | 755 (94.7%) | 814 (94.2%) |
Income Below Poverty Among Married-Couple Families in Fairfax
The poverty statistics for married-couple families in Fairfax show that 1.1% or 3 of the total 281 families live below the poverty line. Families with no children have the highest poverty rate of 1.8%, comprising of 3 families. On the other hand, families with 1 or 2 children have the lowest poverty rate of 0.0%, which includes 0 families.
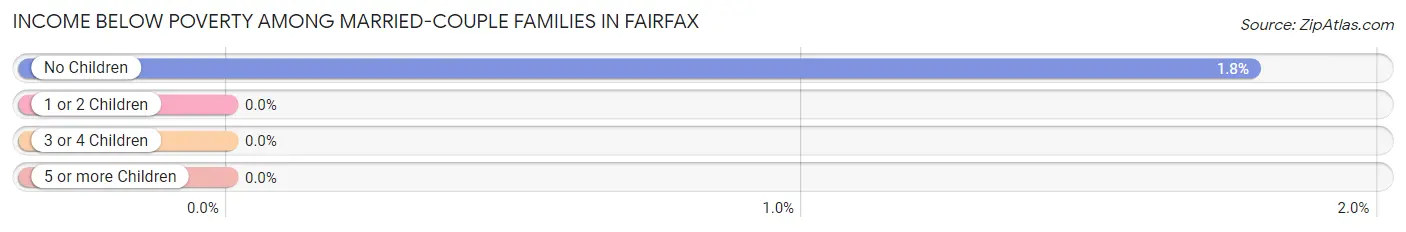
| Children | Above Poverty | Below Poverty |
| No Children | 166 (98.2%) | 3 (1.8%) |
| 1 or 2 Children | 83 (100.0%) | 0 (0.0%) |
| 3 or 4 Children | 29 (100.0%) | 0 (0.0%) |
| 5 or more Children | 0 (0.0%) | 0 (0.0%) |
| Total | 278 (98.9%) | 3 (1.1%) |
Income Below Poverty Among Single-Parent Households in Fairfax
According to the poverty data in Fairfax, 12.5% or 2 single-father households and 4.9% or 7 single-mother households are living below the poverty line. Among single-father households, those with no children have the highest poverty rate, with 2 households (25.0%) experiencing poverty. Likewise, among single-mother households, those with 3 or 4 children have the highest poverty rate, with 7 households (100.0%) falling below the poverty line.
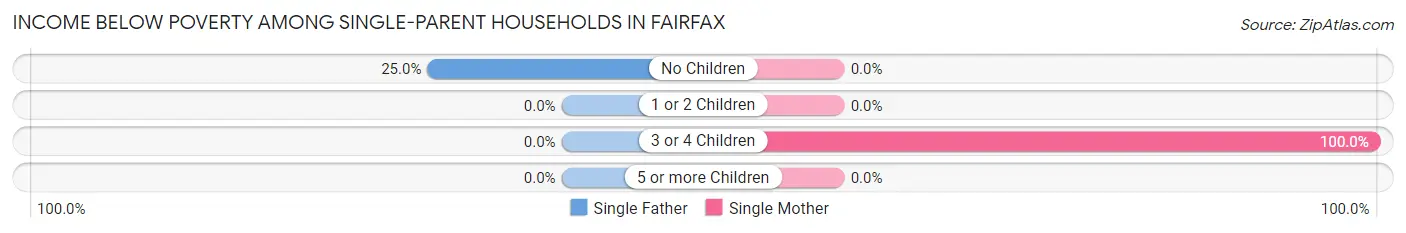
| Children | Single Father | Single Mother |
| No Children | 2 (25.0%) | 0 (0.0%) |
| 1 or 2 Children | 0 (0.0%) | 0 (0.0%) |
| 3 or 4 Children | 0 (0.0%) | 7 (100.0%) |
| 5 or more Children | 0 (0.0%) | 0 (0.0%) |
| Total | 2 (12.5%) | 7 (4.9%) |
Income Below Poverty Among Married-Couple vs Single-Parent Households in Fairfax
The poverty data for Fairfax shows that 3 of the married-couple family households (1.1%) and 9 of the single-parent households (5.7%) are living below the poverty level. Within the married-couple family households, those with no children have the highest poverty rate, with 3 households (1.8%) falling below the poverty line. Among the single-parent households, those with 3 or 4 children have the highest poverty rate, with 7 household (100.0%) living below poverty.
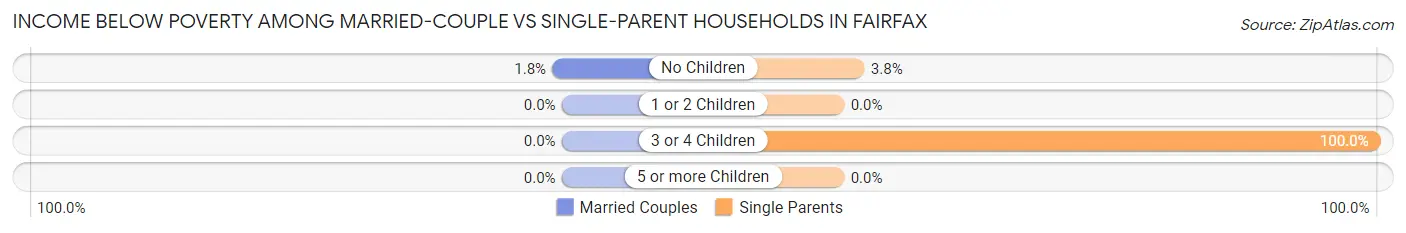
| Children | Married-Couple Families | Single-Parent Households |
| No Children | 3 (1.8%) | 2 (3.8%) |
| 1 or 2 Children | 0 (0.0%) | 0 (0.0%) |
| 3 or 4 Children | 0 (0.0%) | 7 (100.0%) |
| 5 or more Children | 0 (0.0%) | 0 (0.0%) |
| Total | 3 (1.1%) | 9 (5.7%) |
Race in Fairfax
The most populous races in Fairfax are White / Caucasian (1,537 | 92.5%), Hispanic or Latino (79 | 4.8%), and Black / African American (66 | 4.0%).
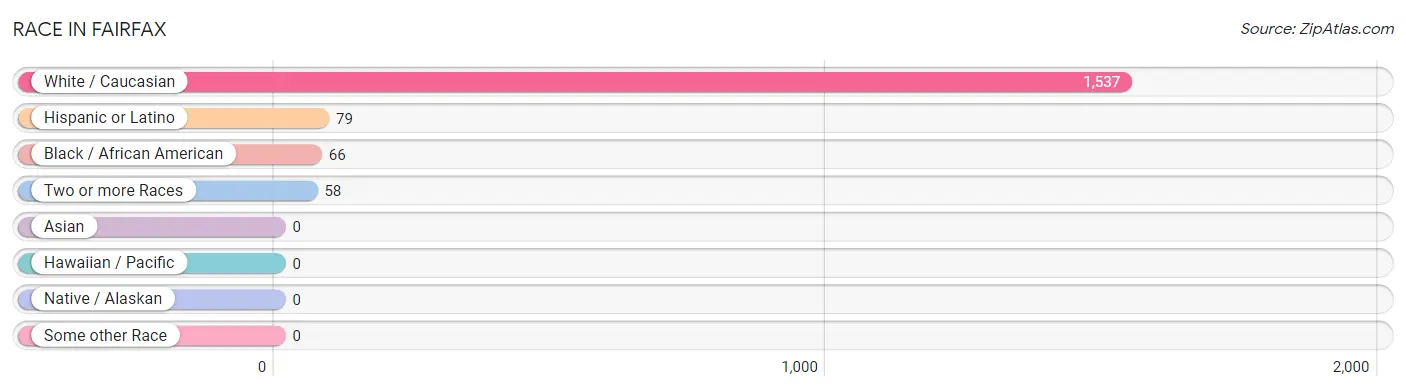
| Race | # Population | % Population |
| Asian | 0 | 0.0% |
| Black / African American | 66 | 4.0% |
| Hawaiian / Pacific | 0 | 0.0% |
| Hispanic or Latino | 79 | 4.8% |
| Native / Alaskan | 0 | 0.0% |
| White / Caucasian | 1,537 | 92.5% |
| Two or more Races | 58 | 3.5% |
| Some other Race | 0 | 0.0% |
| Total | 1,661 | 100.0% |
Ancestry in Fairfax
The most populous ancestries reported in Fairfax are German (581 | 35.0%), Irish (328 | 19.8%), English (155 | 9.3%), American (68 | 4.1%), and Italian (68 | 4.1%), together accounting for 72.2% of all Fairfax residents.
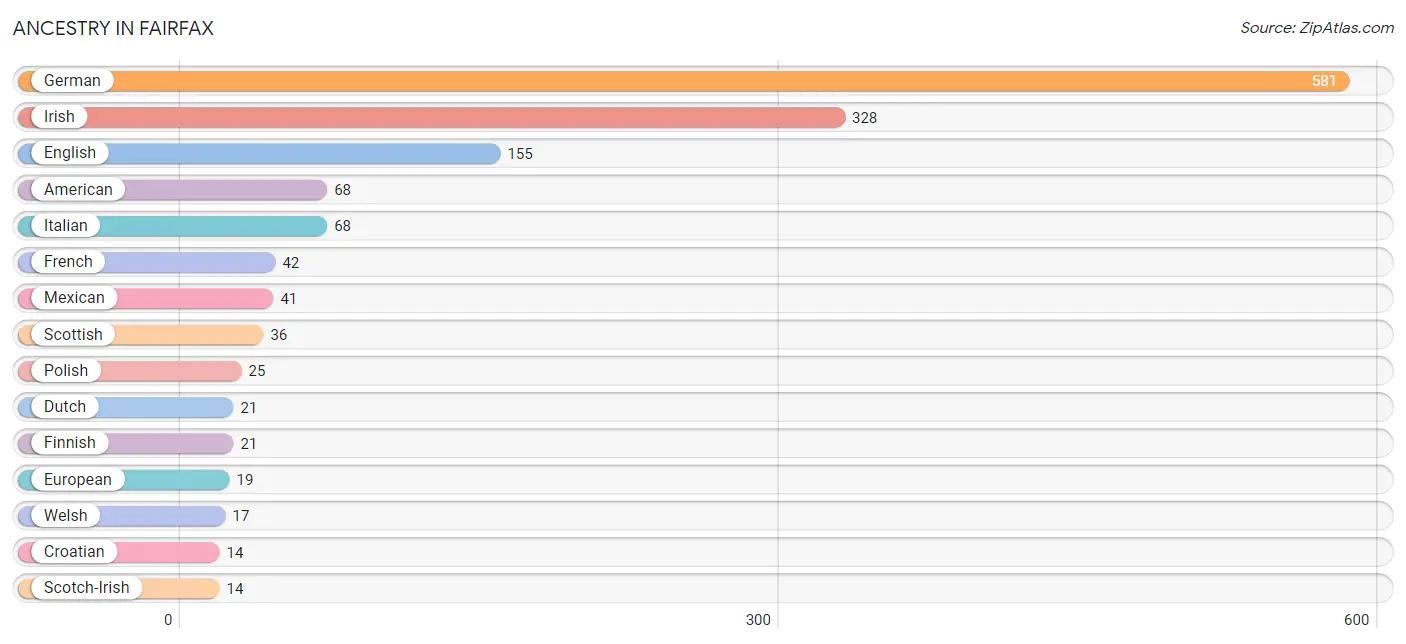
| Ancestry | # Population | % Population |
| African | 5 | 0.3% |
| American | 68 | 4.1% |
| Apache | 1 | 0.1% |
| Arab | 3 | 0.2% |
| Armenian | 3 | 0.2% |
| Australian | 5 | 0.3% |
| Austrian | 3 | 0.2% |
| Blackfeet | 1 | 0.1% |
| British | 3 | 0.2% |
| Canadian | 11 | 0.7% |
| Central American | 6 | 0.4% |
| Central American Indian | 6 | 0.4% |
| Costa Rican | 6 | 0.4% |
| Croatian | 14 | 0.8% |
| Cuban | 2 | 0.1% |
| Dutch | 21 | 1.3% |
| Eastern European | 3 | 0.2% |
| English | 155 | 9.3% |
| Ethiopian | 4 | 0.2% |
| European | 19 | 1.1% |
| Finnish | 21 | 1.3% |
| French | 42 | 2.5% |
| French Canadian | 2 | 0.1% |
| German | 581 | 35.0% |
| Greek | 6 | 0.4% |
| Hungarian | 5 | 0.3% |
| Irish | 328 | 19.8% |
| Italian | 68 | 4.1% |
| Lebanese | 3 | 0.2% |
| Mexican | 41 | 2.5% |
| Northern European | 8 | 0.5% |
| Polish | 25 | 1.5% |
| Puerto Rican | 11 | 0.7% |
| Scotch-Irish | 14 | 0.8% |
| Scottish | 36 | 2.2% |
| Serbian | 14 | 0.8% |
| Spaniard | 8 | 0.5% |
| Spanish American | 11 | 0.7% |
| Subsaharan African | 9 | 0.5% |
| Swedish | 3 | 0.2% |
| Swiss | 3 | 0.2% |
| Thai | 5 | 0.3% |
| Trinidadian and Tobagonian | 4 | 0.2% |
| Ukrainian | 2 | 0.1% |
| Welsh | 17 | 1.0% | View All 45 Rows |
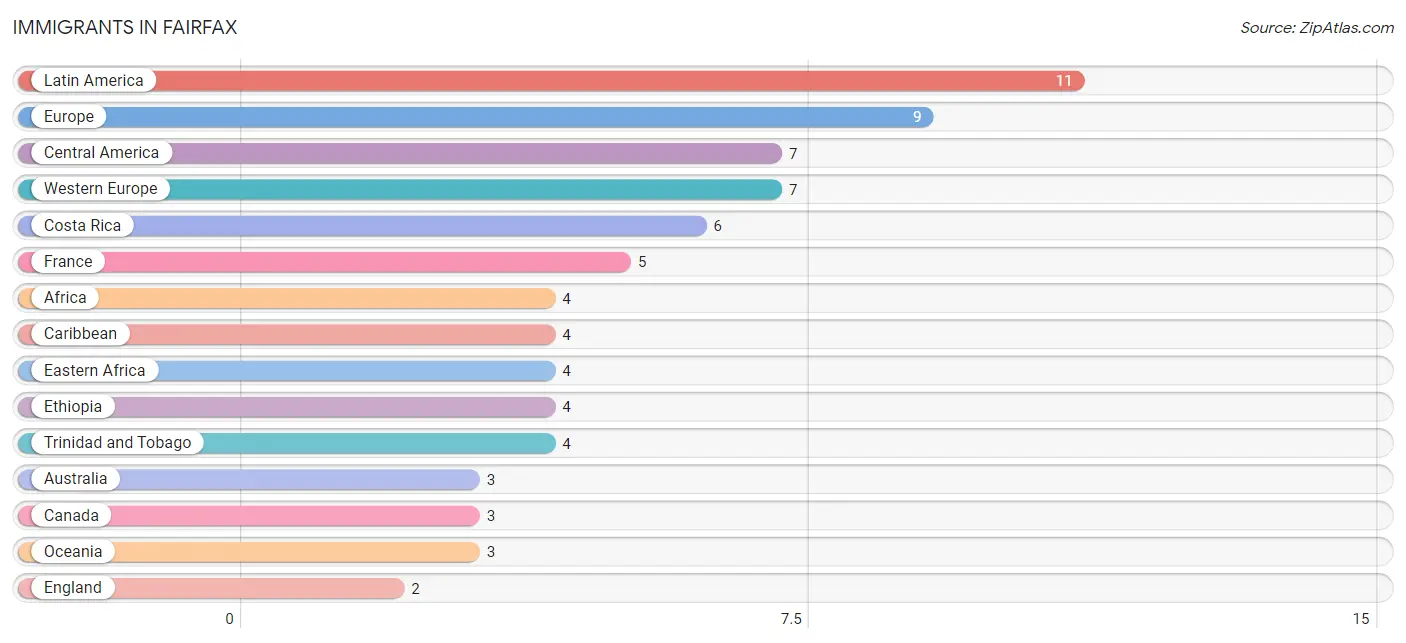
Immigrants in Fairfax
The most numerous immigrant groups reported in Fairfax came from Latin America (11 | 0.7%), Europe (9 | 0.5%), Central America (7 | 0.4%), Western Europe (7 | 0.4%), and Costa Rica (6 | 0.4%), together accounting for 2.4% of all Fairfax residents.
| Immigration Origin | # Population | % Population |
| Africa | 4 | 0.2% |
| Australia | 3 | 0.2% |
| Canada | 3 | 0.2% |
| Caribbean | 4 | 0.2% |
| Central America | 7 | 0.4% |
| Costa Rica | 6 | 0.4% |
| Eastern Africa | 4 | 0.2% |
| England | 2 | 0.1% |
| Ethiopia | 4 | 0.2% |
| Europe | 9 | 0.5% |
| France | 5 | 0.3% |
| Germany | 2 | 0.1% |
| Latin America | 11 | 0.7% |
| Mexico | 1 | 0.1% |
| Northern Europe | 2 | 0.1% |
| Oceania | 3 | 0.2% |
| Trinidad and Tobago | 4 | 0.2% |
| Western Europe | 7 | 0.4% | View All 18 Rows |
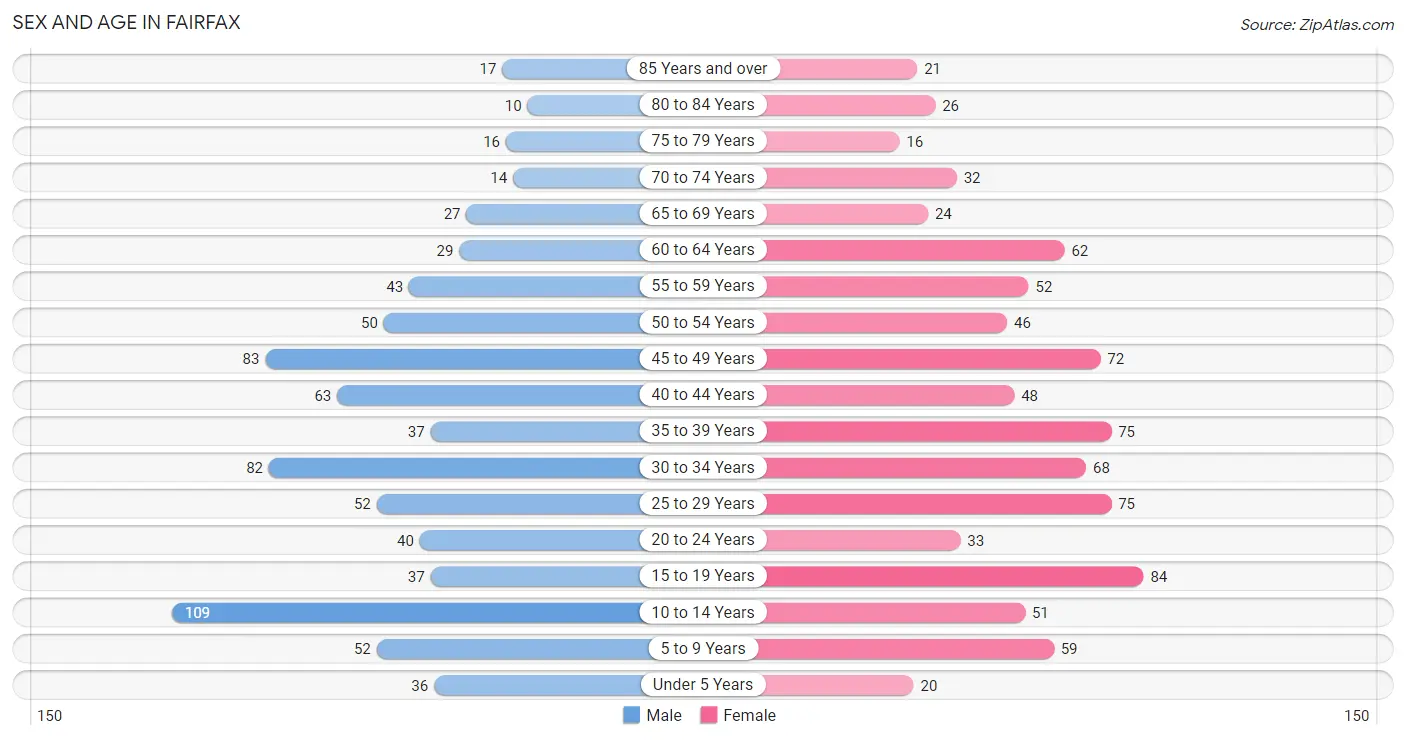
Sex and Age in Fairfax
Sex and Age in Fairfax
The most populous age groups in Fairfax are 10 to 14 Years (109 | 13.7%) for men and 15 to 19 Years (84 | 9.7%) for women.
| Age Bracket | Male | Female |
| Under 5 Years | 36 (4.5%) | 20 (2.3%) |
| 5 to 9 Years | 52 (6.5%) | 59 (6.8%) |
| 10 to 14 Years | 109 (13.7%) | 51 (5.9%) |
| 15 to 19 Years | 37 (4.6%) | 84 (9.7%) |
| 20 to 24 Years | 40 (5.0%) | 33 (3.8%) |
| 25 to 29 Years | 52 (6.5%) | 75 (8.7%) |
| 30 to 34 Years | 82 (10.3%) | 68 (7.9%) |
| 35 to 39 Years | 37 (4.6%) | 75 (8.7%) |
| 40 to 44 Years | 63 (7.9%) | 48 (5.6%) |
| 45 to 49 Years | 83 (10.4%) | 72 (8.3%) |
| 50 to 54 Years | 50 (6.3%) | 46 (5.3%) |
| 55 to 59 Years | 43 (5.4%) | 52 (6.0%) |
| 60 to 64 Years | 29 (3.6%) | 62 (7.2%) |
| 65 to 69 Years | 27 (3.4%) | 24 (2.8%) |
| 70 to 74 Years | 14 (1.8%) | 32 (3.7%) |
| 75 to 79 Years | 16 (2.0%) | 16 (1.8%) |
| 80 to 84 Years | 10 (1.3%) | 26 (3.0%) |
| 85 Years and over | 17 (2.1%) | 21 (2.4%) |
| Total | 797 (100.0%) | 864 (100.0%) |
Families and Households in Fairfax
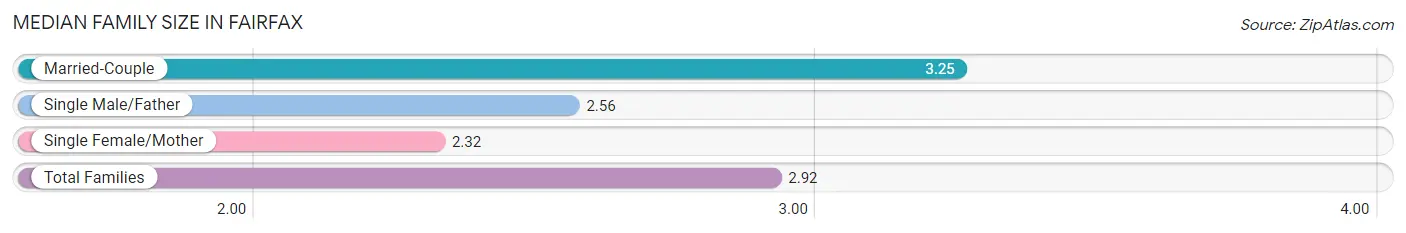
Median Family Size in Fairfax
The median family size in Fairfax is 2.92 persons per family, with married-couple families (281 | 64.0%) accounting for the largest median family size of 3.25 persons per family. On the other hand, single female/mother families (142 | 32.4%) represent the smallest median family size with 2.32 persons per family.
| Family Type | # Families | Family Size |
| Married-Couple | 281 (64.0%) | 3.25 |
| Single Male/Father | 16 (3.6%) | 2.56 |
| Single Female/Mother | 142 (32.4%) | 2.32 |
| Total Families | 439 (100.0%) | 2.92 |
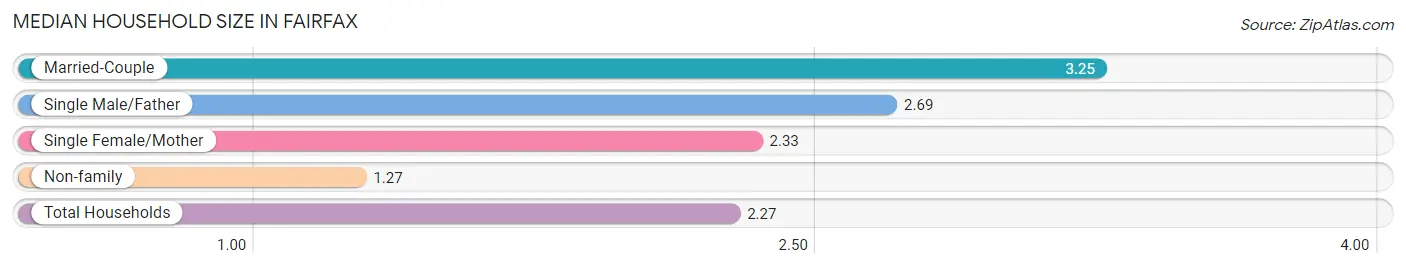
Median Household Size in Fairfax
The median household size in Fairfax is 2.27 persons per household, with married-couple households (281 | 38.3%) accounting for the largest median household size of 3.25 persons per household. non-family households (294 | 40.1%) represent the smallest median household size with 1.27 persons per household.
| Household Type | # Households | Household Size |
| Married-Couple | 281 (38.3%) | 3.25 |
| Single Male/Father | 16 (2.2%) | 2.69 |
| Single Female/Mother | 142 (19.4%) | 2.33 |
| Non-family | 294 (40.1%) | 1.27 |
| Total Households | 733 (100.0%) | 2.27 |
Household Size by Marriage Status in Fairfax
Out of a total of 733 households in Fairfax, 439 (59.9%) are family households, while 294 (40.1%) are nonfamily households. The most numerous type of family households are 2-person households, comprising 230, and the most common type of nonfamily households are 1-person households, comprising 232.
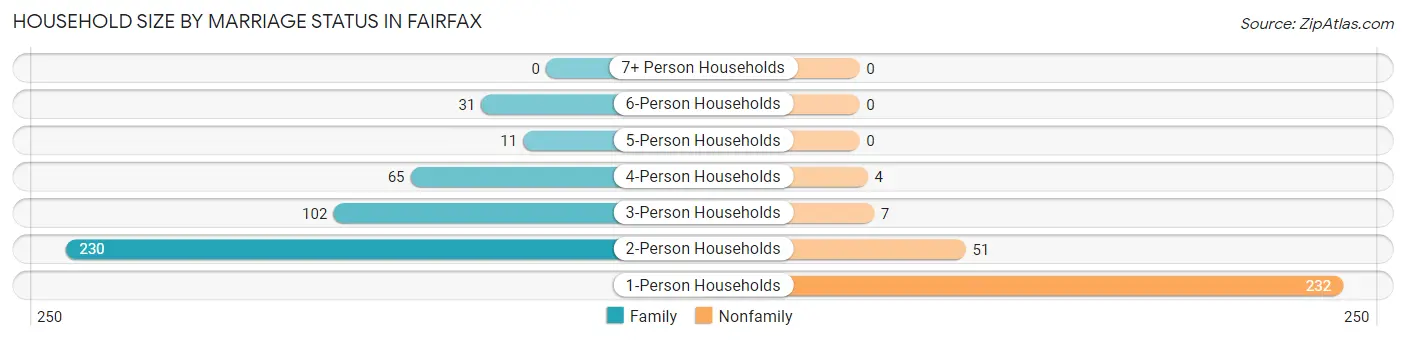
| Household Size | Family Households | Nonfamily Households |
| 1-Person Households | - | 232 (31.7%) |
| 2-Person Households | 230 (31.4%) | 51 (7.0%) |
| 3-Person Households | 102 (13.9%) | 7 (0.9%) |
| 4-Person Households | 65 (8.9%) | 4 (0.5%) |
| 5-Person Households | 11 (1.5%) | 0 (0.0%) |
| 6-Person Households | 31 (4.2%) | 0 (0.0%) |
| 7+ Person Households | 0 (0.0%) | 0 (0.0%) |
| Total | 439 (59.9%) | 294 (40.1%) |
Female Fertility in Fairfax
Fertility by Age in Fairfax
Average fertility rate in Fairfax is 18.0 births per 1,000 women. Women in the age bracket of 35 to 50 years have the highest fertility rate with 26.0 births per 1,000 women. Women in the age bracket of 35 to 50 years acount for 62.5% of all women with births.
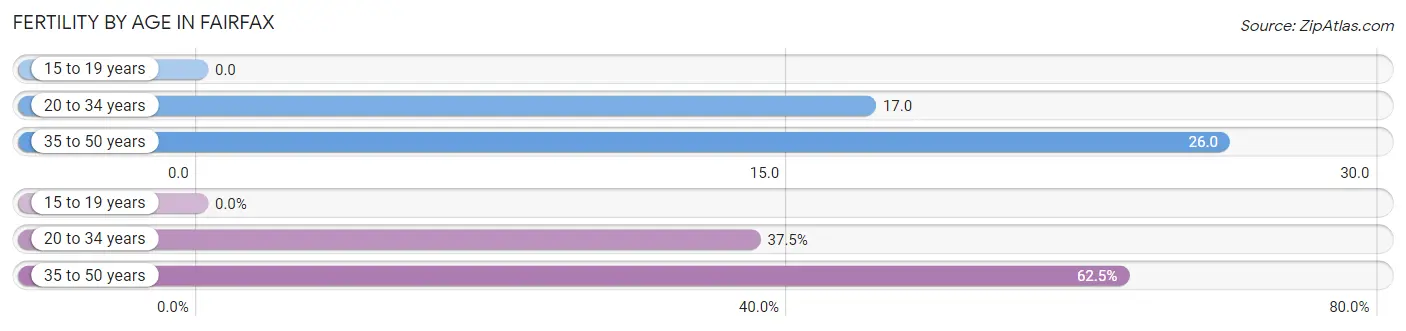
| Age Bracket | Women with Births | Births / 1,000 Women |
| 15 to 19 years | 0 (0.0%) | 0.0 |
| 20 to 34 years | 3 (37.5%) | 17.0 |
| 35 to 50 years | 5 (62.5%) | 26.0 |
| Total | 8 (100.0%) | 18.0 |
Fertility by Age by Marriage Status in Fairfax
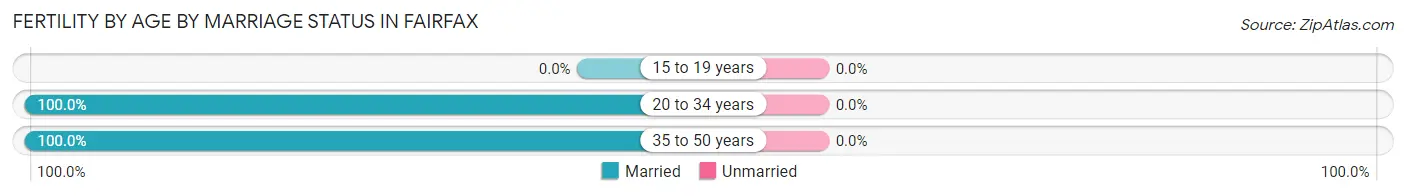
| Age Bracket | Married | Unmarried |
| 15 to 19 years | 0 (0.0%) | 0 (0.0%) |
| 20 to 34 years | 3 (100.0%) | 0 (0.0%) |
| 35 to 50 years | 5 (100.0%) | 0 (0.0%) |
| Total | 8 (100.0%) | 0 (0.0%) |
Fertility by Education in Fairfax
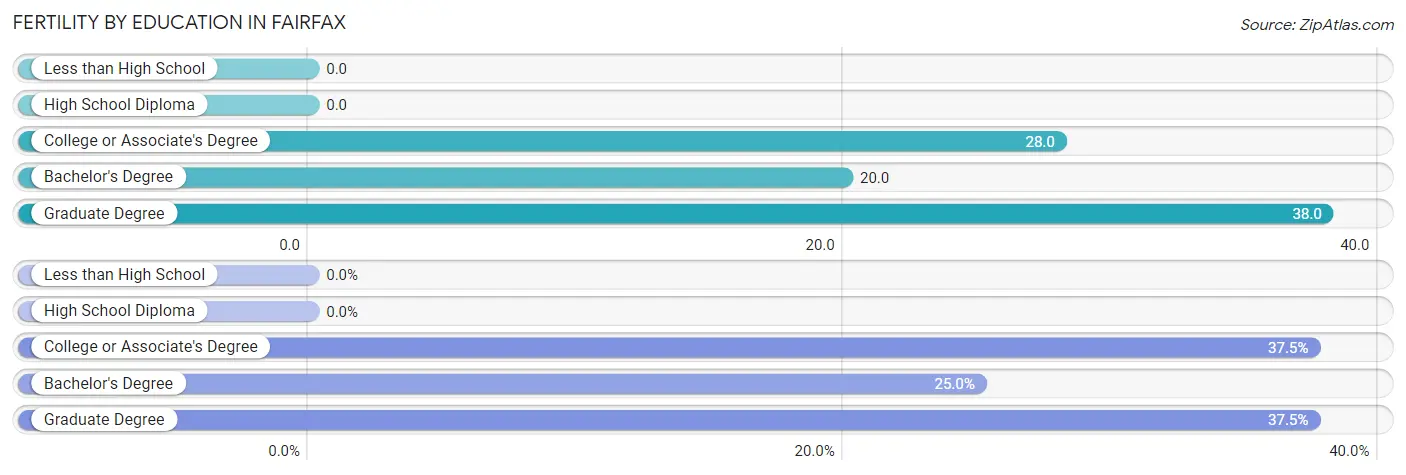
| Educational Attainment | Women with Births | Births / 1,000 Women |
| Less than High School | 0 (0.0%) | 0.0 |
| High School Diploma | 0 (0.0%) | 0.0 |
| College or Associate's Degree | 3 (37.5%) | 28.0 |
| Bachelor's Degree | 2 (25.0%) | 20.0 |
| Graduate Degree | 3 (37.5%) | 38.0 |
| Total | 8 (100.0%) | 18.0 |
Fertility by Education by Marriage Status in Fairfax
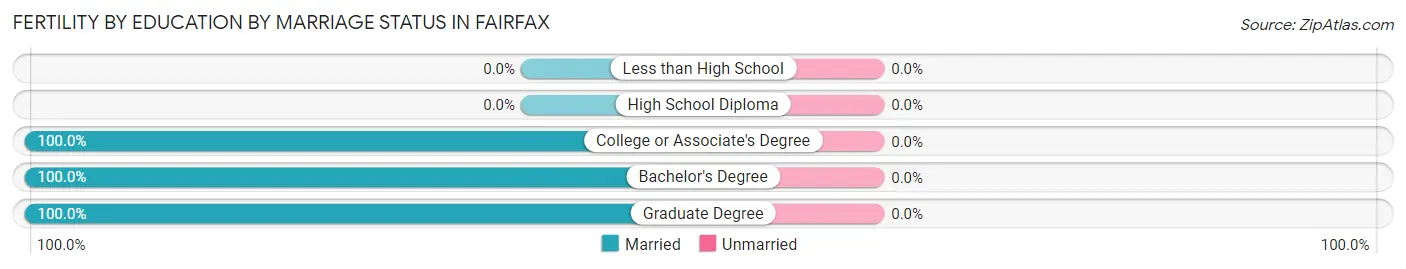
| Educational Attainment | Married | Unmarried |
| Less than High School | 0 (0.0%) | 0 (0.0%) |
| High School Diploma | 0 (0.0%) | 0 (0.0%) |
| College or Associate's Degree | 3 (100.0%) | 0 (0.0%) |
| Bachelor's Degree | 2 (100.0%) | 0 (0.0%) |
| Graduate Degree | 3 (100.0%) | 0 (0.0%) |
| Total | 8 (100.0%) | 0 (0.0%) |
Employment Characteristics in Fairfax
Employment by Class of Employer in Fairfax
Among the 946 employed individuals in Fairfax, private company employees (689 | 72.8%), not-for-profit organizations (73 | 7.7%), and local government employees (68 | 7.2%) make up the most common classes of employment.
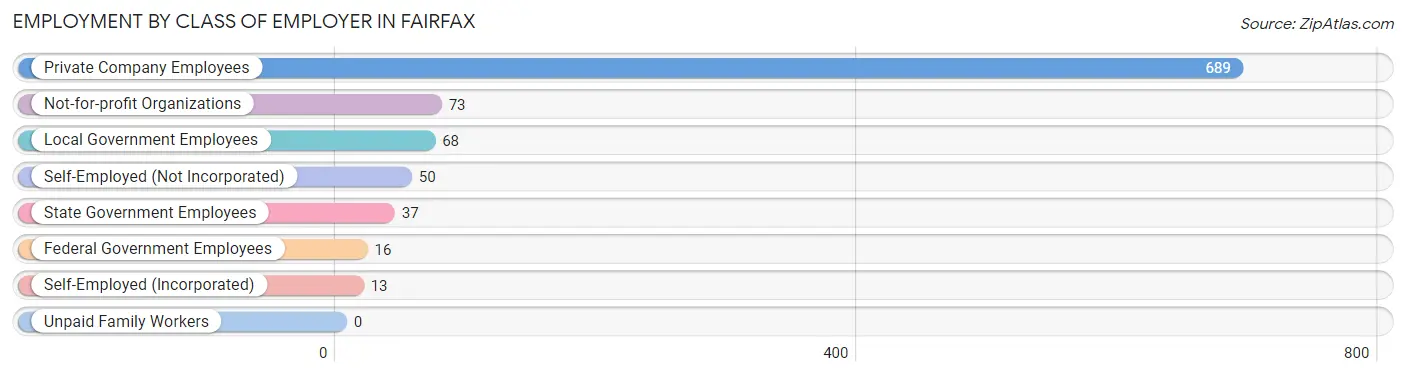
| Employer Class | # Employees | % Employees |
| Private Company Employees | 689 | 72.8% |
| Self-Employed (Incorporated) | 13 | 1.4% |
| Self-Employed (Not Incorporated) | 50 | 5.3% |
| Not-for-profit Organizations | 73 | 7.7% |
| Local Government Employees | 68 | 7.2% |
| State Government Employees | 37 | 3.9% |
| Federal Government Employees | 16 | 1.7% |
| Unpaid Family Workers | 0 | 0.0% |
| Total | 946 | 100.0% |
Employment Status by Age in Fairfax
According to the labor force statistics for Fairfax, out of the total population over 16 years of age (1,296), 76.8% or 995 individuals are in the labor force, with 3.9% or 39 of them unemployed. The age group with the highest labor force participation rate is 30 to 34 years, with 97.3% or 146 individuals in the labor force. Within the labor force, the 65 to 74 years age range has the highest percentage of unemployed individuals, with 13.8% or 4 of them being unemployed.
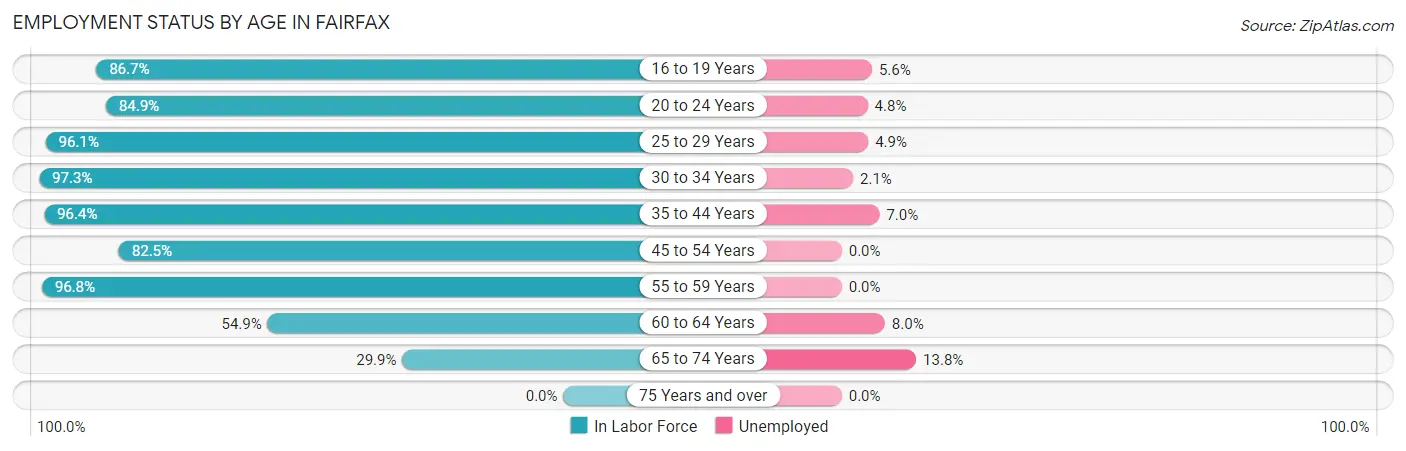
| Age Bracket | In Labor Force | Unemployed |
| 16 to 19 Years | 72 (86.7%) | 4 (5.6%) |
| 20 to 24 Years | 62 (84.9%) | 3 (4.8%) |
| 25 to 29 Years | 122 (96.1%) | 6 (4.9%) |
| 30 to 34 Years | 146 (97.3%) | 3 (2.1%) |
| 35 to 44 Years | 215 (96.4%) | 15 (7.0%) |
| 45 to 54 Years | 207 (82.5%) | 0 (0.0%) |
| 55 to 59 Years | 92 (96.8%) | 0 (0.0%) |
| 60 to 64 Years | 50 (54.9%) | 4 (8.0%) |
| 65 to 74 Years | 29 (29.9%) | 4 (13.8%) |
| 75 Years and over | 0 (0.0%) | 0 (0.0%) |
| Total | 995 (76.8%) | 39 (3.9%) |
Employment Status by Educational Attainment in Fairfax
According to labor force statistics for Fairfax, 88.8% of individuals (832) out of the total population between 25 and 64 years of age (937) are in the labor force, with 3.4% or 28 of them being unemployed. The group with the highest labor force participation rate are those with the educational attainment of bachelor's degree or higher, with 94.7% or 449 individuals in the labor force. Within the labor force, individuals with less than high school education have the highest percentage of unemployment, with 24.1% or 7 of them being unemployed.
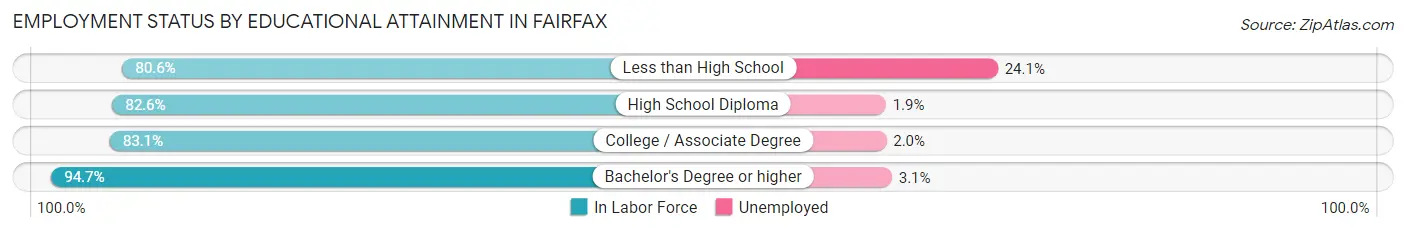
| Educational Attainment | In Labor Force | Unemployed |
| Less than High School | 29 (80.6%) | 9 (24.1%) |
| High School Diploma | 157 (82.6%) | 4 (1.9%) |
| College / Associate Degree | 197 (83.1%) | 5 (2.0%) |
| Bachelor's Degree or higher | 449 (94.7%) | 15 (3.1%) |
| Total | 832 (88.8%) | 32 (3.4%) |
Employment Occupations by Sex in Fairfax
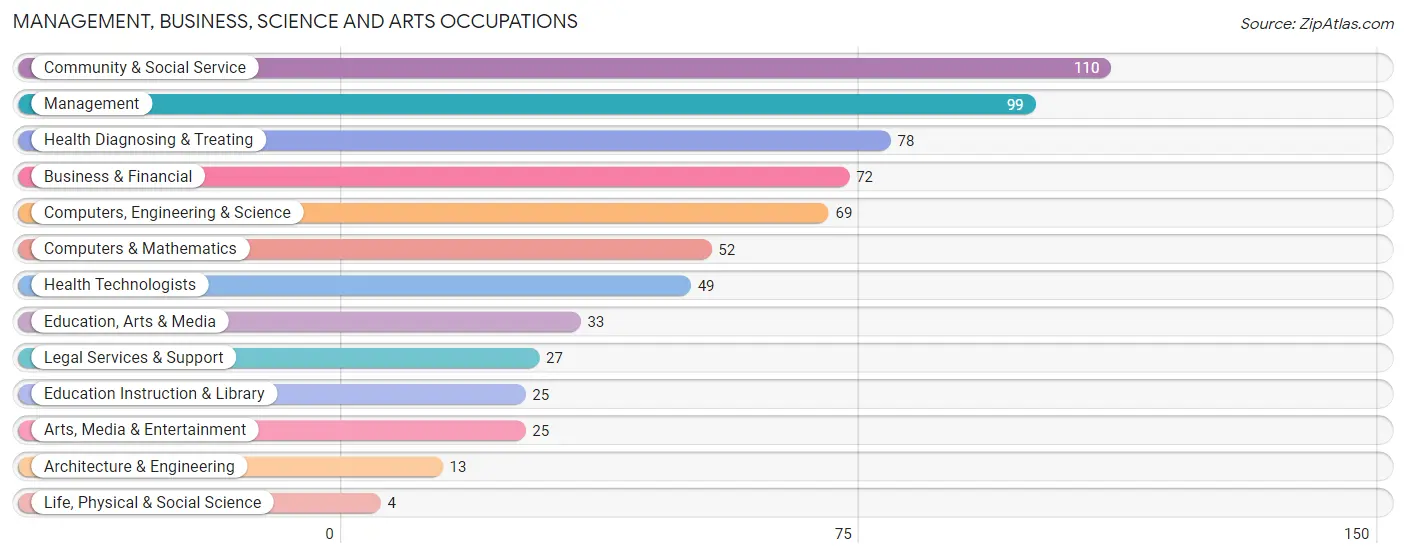
Management, Business, Science and Arts Occupations
The most common Management, Business, Science and Arts occupations in Fairfax are Community & Social Service (110 | 11.5%), Management (99 | 10.4%), Health Diagnosing & Treating (78 | 8.2%), Business & Financial (72 | 7.5%), and Computers, Engineering & Science (69 | 7.2%).
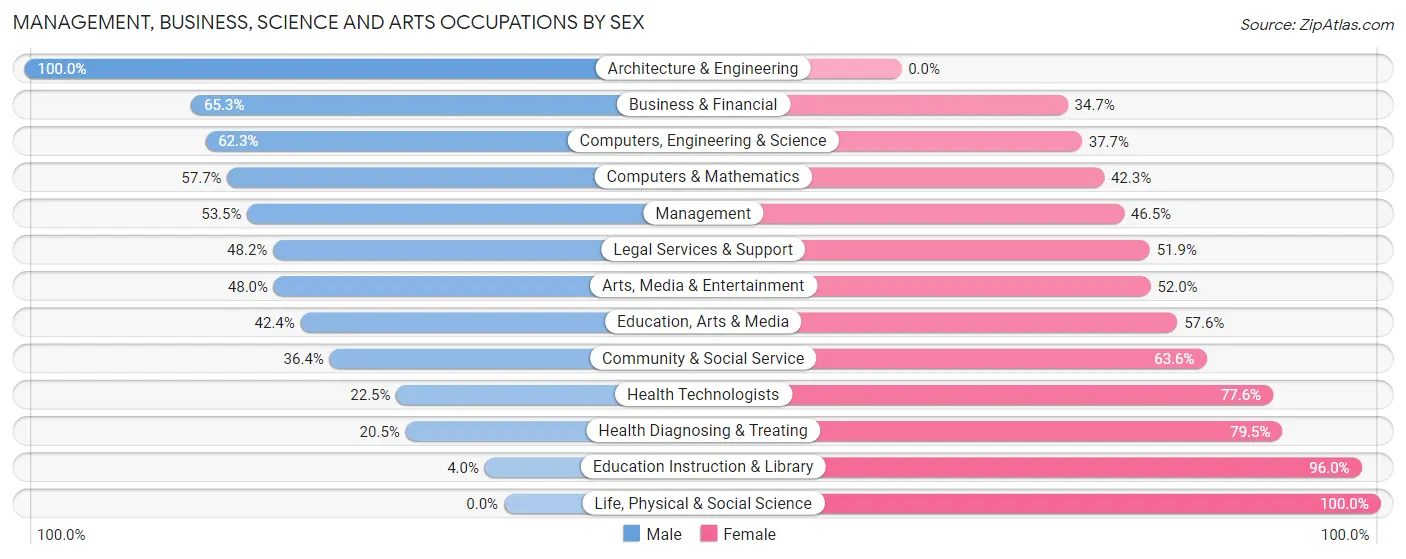
Management, Business, Science and Arts Occupations by Sex
Within the Management, Business, Science and Arts occupations in Fairfax, the most male-oriented occupations are Architecture & Engineering (100.0%), Business & Financial (65.3%), and Computers, Engineering & Science (62.3%), while the most female-oriented occupations are Life, Physical & Social Science (100.0%), Education Instruction & Library (96.0%), and Health Diagnosing & Treating (79.5%).
| Occupation | Male | Female |
| Management | 53 (53.5%) | 46 (46.5%) |
| Business & Financial | 47 (65.3%) | 25 (34.7%) |
| Computers, Engineering & Science | 43 (62.3%) | 26 (37.7%) |
| Computers & Mathematics | 30 (57.7%) | 22 (42.3%) |
| Architecture & Engineering | 13 (100.0%) | 0 (0.0%) |
| Life, Physical & Social Science | 0 (0.0%) | 4 (100.0%) |
| Community & Social Service | 40 (36.4%) | 70 (63.6%) |
| Education, Arts & Media | 14 (42.4%) | 19 (57.6%) |
| Legal Services & Support | 13 (48.1%) | 14 (51.8%) |
| Education Instruction & Library | 1 (4.0%) | 24 (96.0%) |
| Arts, Media & Entertainment | 12 (48.0%) | 13 (52.0%) |
| Health Diagnosing & Treating | 16 (20.5%) | 62 (79.5%) |
| Health Technologists | 11 (22.5%) | 38 (77.5%) |
| Total (Category) | 199 (46.5%) | 229 (53.5%) |
| Total (Overall) | 453 (47.4%) | 503 (52.6%) |
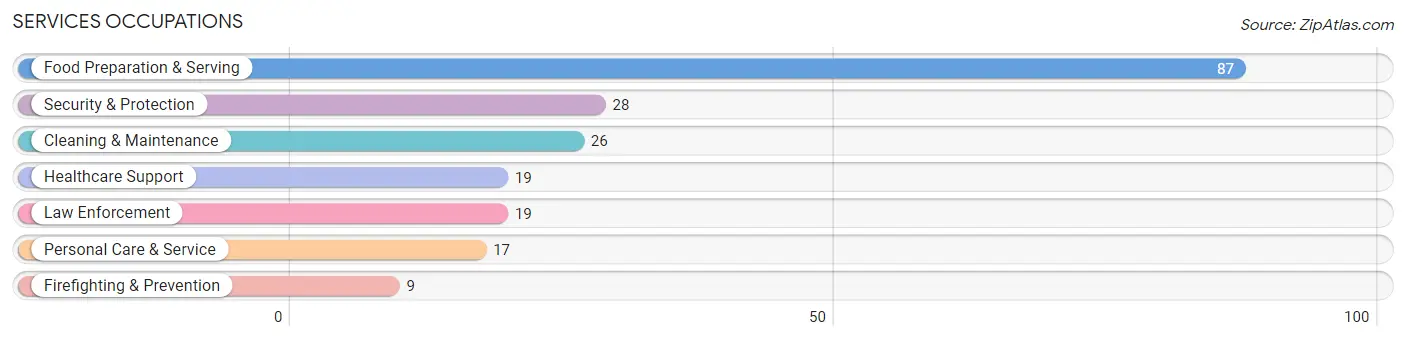
Services Occupations
The most common Services occupations in Fairfax are Food Preparation & Serving (87 | 9.1%), Security & Protection (28 | 2.9%), Cleaning & Maintenance (26 | 2.7%), Healthcare Support (19 | 2.0%), and Law Enforcement (19 | 2.0%).
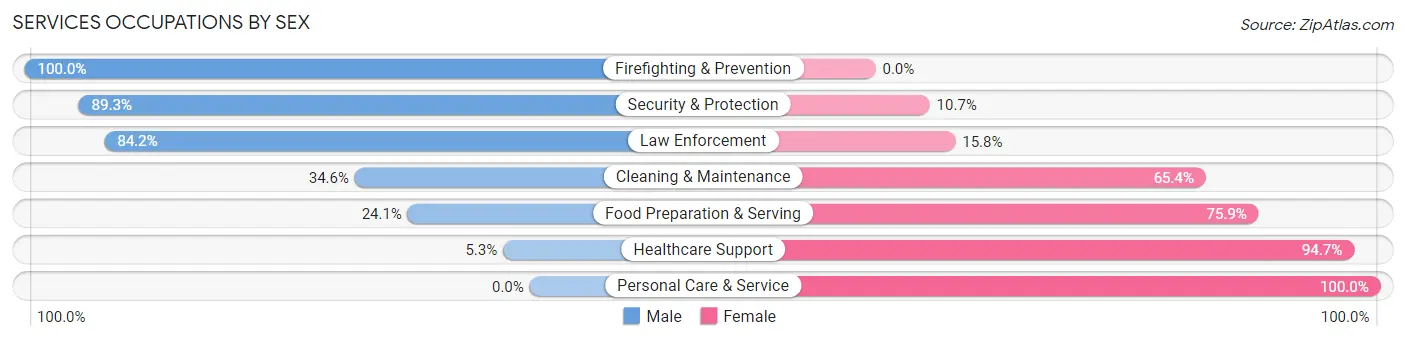
Services Occupations by Sex
Within the Services occupations in Fairfax, the most male-oriented occupations are Firefighting & Prevention (100.0%), Security & Protection (89.3%), and Law Enforcement (84.2%), while the most female-oriented occupations are Personal Care & Service (100.0%), Healthcare Support (94.7%), and Food Preparation & Serving (75.9%).
| Occupation | Male | Female |
| Healthcare Support | 1 (5.3%) | 18 (94.7%) |
| Security & Protection | 25 (89.3%) | 3 (10.7%) |
| Firefighting & Prevention | 9 (100.0%) | 0 (0.0%) |
| Law Enforcement | 16 (84.2%) | 3 (15.8%) |
| Food Preparation & Serving | 21 (24.1%) | 66 (75.9%) |
| Cleaning & Maintenance | 9 (34.6%) | 17 (65.4%) |
| Personal Care & Service | 0 (0.0%) | 17 (100.0%) |
| Total (Category) | 56 (31.6%) | 121 (68.4%) |
| Total (Overall) | 453 (47.4%) | 503 (52.6%) |
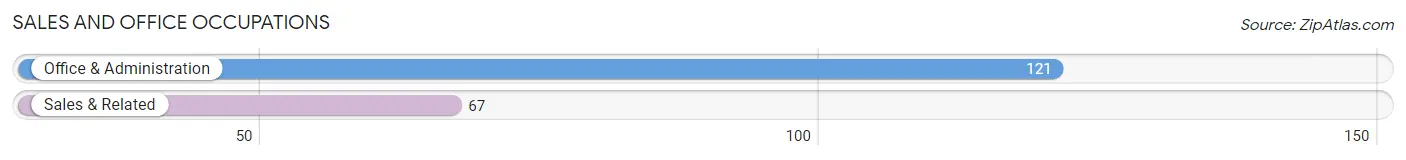
Sales and Office Occupations
The most common Sales and Office occupations in Fairfax are Office & Administration (121 | 12.7%), and Sales & Related (67 | 7.0%).
Sales and Office Occupations by Sex
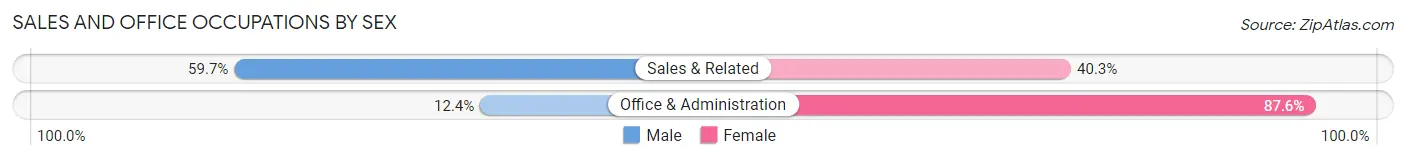
| Occupation | Male | Female |
| Sales & Related | 40 (59.7%) | 27 (40.3%) |
| Office & Administration | 15 (12.4%) | 106 (87.6%) |
| Total (Category) | 55 (29.3%) | 133 (70.7%) |
| Total (Overall) | 453 (47.4%) | 503 (52.6%) |
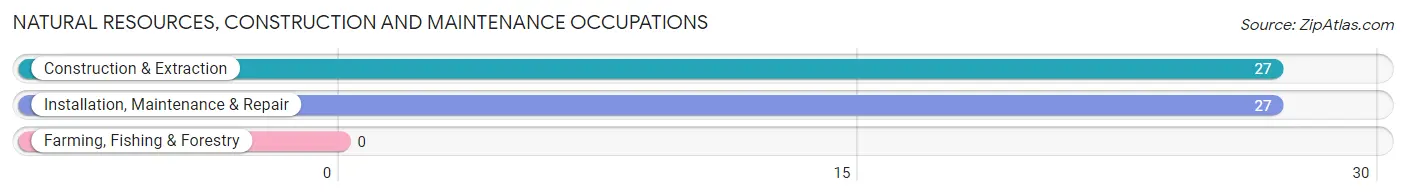
Natural Resources, Construction and Maintenance Occupations
The most common Natural Resources, Construction and Maintenance occupations in Fairfax are Construction & Extraction (27 | 2.8%), and Installation, Maintenance & Repair (27 | 2.8%).
Natural Resources, Construction and Maintenance Occupations by Sex
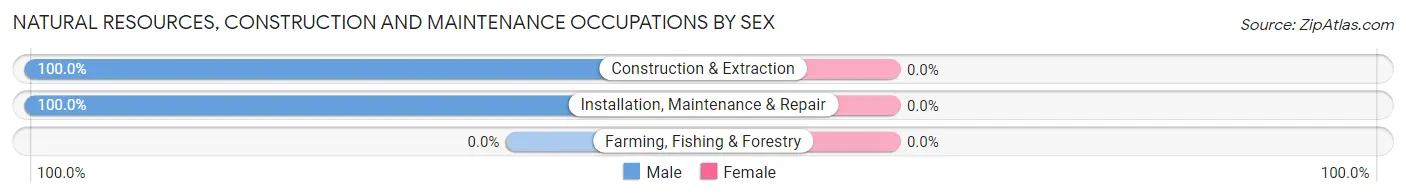
| Occupation | Male | Female |
| Farming, Fishing & Forestry | 0 (0.0%) | 0 (0.0%) |
| Construction & Extraction | 27 (100.0%) | 0 (0.0%) |
| Installation, Maintenance & Repair | 27 (100.0%) | 0 (0.0%) |
| Total (Category) | 54 (100.0%) | 0 (0.0%) |
| Total (Overall) | 453 (47.4%) | 503 (52.6%) |
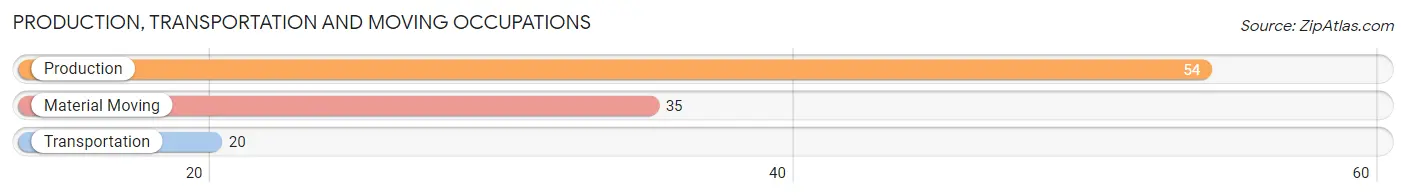
Production, Transportation and Moving Occupations
The most common Production, Transportation and Moving occupations in Fairfax are Production (54 | 5.7%), Material Moving (35 | 3.7%), and Transportation (20 | 2.1%).
Production, Transportation and Moving Occupations by Sex
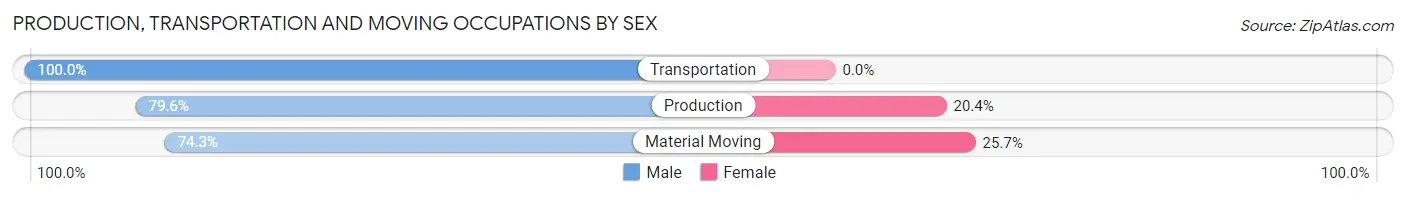
| Occupation | Male | Female |
| Production | 43 (79.6%) | 11 (20.4%) |
| Transportation | 20 (100.0%) | 0 (0.0%) |
| Material Moving | 26 (74.3%) | 9 (25.7%) |
| Total (Category) | 89 (81.7%) | 20 (18.3%) |
| Total (Overall) | 453 (47.4%) | 503 (52.6%) |
Employment Industries by Sex in Fairfax
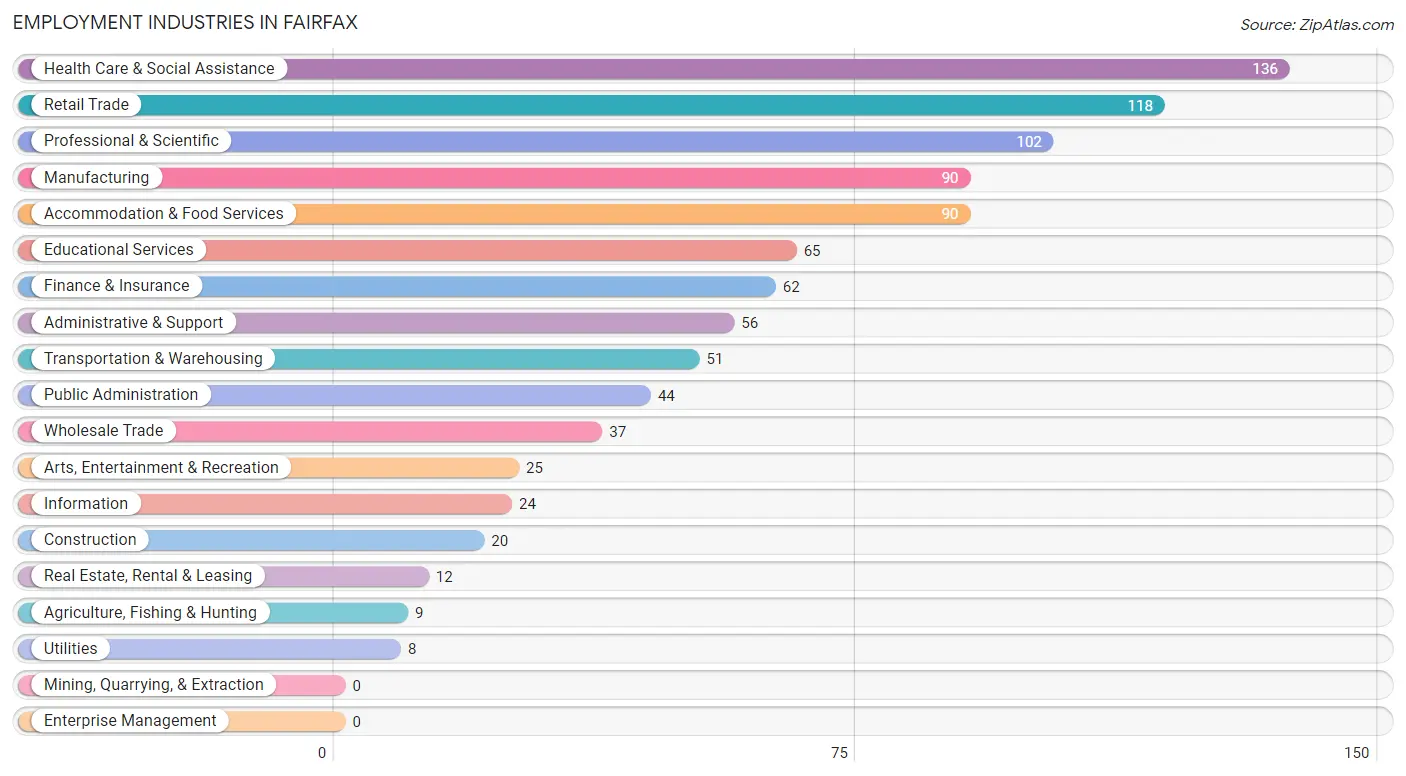
Employment Industries in Fairfax
The major employment industries in Fairfax include Health Care & Social Assistance (136 | 14.2%), Retail Trade (118 | 12.3%), Professional & Scientific (102 | 10.7%), Manufacturing (90 | 9.4%), and Accommodation & Food Services (90 | 9.4%).
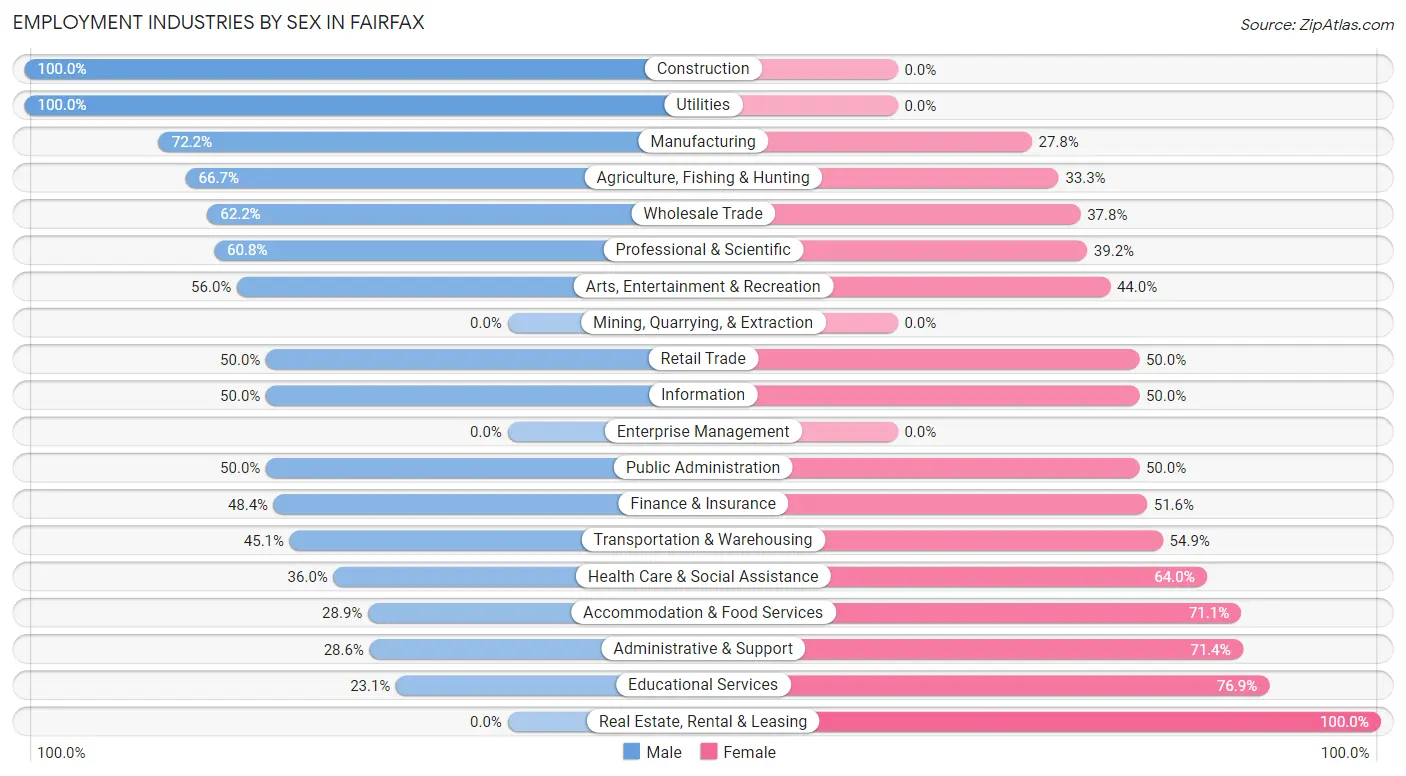
Employment Industries by Sex in Fairfax
The Fairfax industries that see more men than women are Construction (100.0%), Utilities (100.0%), and Manufacturing (72.2%), whereas the industries that tend to have a higher number of women are Real Estate, Rental & Leasing (100.0%), Educational Services (76.9%), and Administrative & Support (71.4%).
| Industry | Male | Female |
| Agriculture, Fishing & Hunting | 6 (66.7%) | 3 (33.3%) |
| Mining, Quarrying, & Extraction | 0 (0.0%) | 0 (0.0%) |
| Construction | 20 (100.0%) | 0 (0.0%) |
| Manufacturing | 65 (72.2%) | 25 (27.8%) |
| Wholesale Trade | 23 (62.2%) | 14 (37.8%) |
| Retail Trade | 59 (50.0%) | 59 (50.0%) |
| Transportation & Warehousing | 23 (45.1%) | 28 (54.9%) |
| Utilities | 8 (100.0%) | 0 (0.0%) |
| Information | 12 (50.0%) | 12 (50.0%) |
| Finance & Insurance | 30 (48.4%) | 32 (51.6%) |
| Real Estate, Rental & Leasing | 0 (0.0%) | 12 (100.0%) |
| Professional & Scientific | 62 (60.8%) | 40 (39.2%) |
| Enterprise Management | 0 (0.0%) | 0 (0.0%) |
| Administrative & Support | 16 (28.6%) | 40 (71.4%) |
| Educational Services | 15 (23.1%) | 50 (76.9%) |
| Health Care & Social Assistance | 49 (36.0%) | 87 (64.0%) |
| Arts, Entertainment & Recreation | 14 (56.0%) | 11 (44.0%) |
| Accommodation & Food Services | 26 (28.9%) | 64 (71.1%) |
| Public Administration | 22 (50.0%) | 22 (50.0%) |
| Total | 453 (47.4%) | 503 (52.6%) |
Education in Fairfax
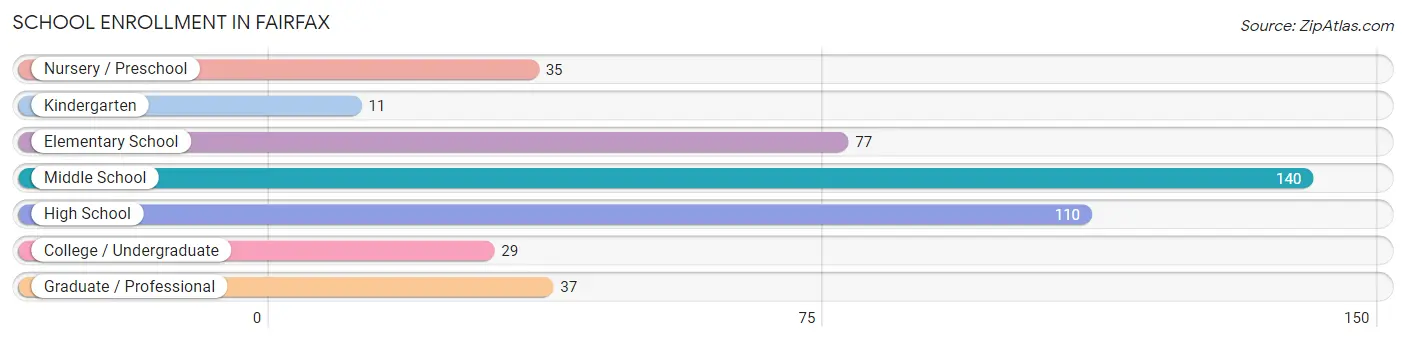
School Enrollment in Fairfax
The most common levels of schooling among the 439 students in Fairfax are middle school (140 | 31.9%), high school (110 | 25.1%), and elementary school (77 | 17.5%).
| School Level | # Students | % Students |
| Nursery / Preschool | 35 | 8.0% |
| Kindergarten | 11 | 2.5% |
| Elementary School | 77 | 17.5% |
| Middle School | 140 | 31.9% |
| High School | 110 | 25.1% |
| College / Undergraduate | 29 | 6.6% |
| Graduate / Professional | 37 | 8.4% |
| Total | 439 | 100.0% |
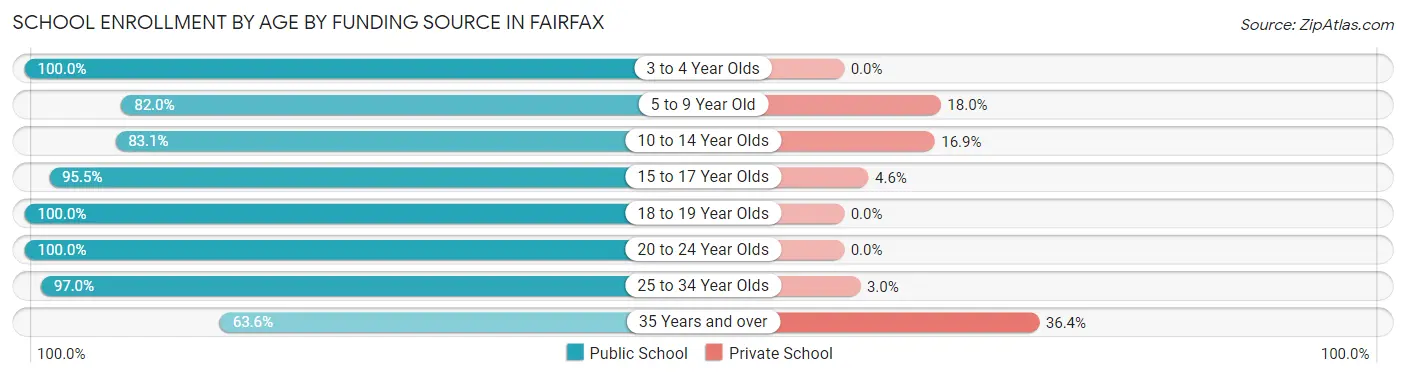
School Enrollment by Age by Funding Source in Fairfax
Out of a total of 439 students who are enrolled in schools in Fairfax, 59 (13.4%) attend a private institution, while the remaining 380 (86.6%) are enrolled in public schools. The age group of 35 years and over has the highest likelihood of being enrolled in private schools, with 8 (36.4% in the age bracket) enrolled. Conversely, the age group of 3 to 4 year olds has the lowest likelihood of being enrolled in a private school, with 3 (100.0% in the age bracket) attending a public institution.
| Age Bracket | Public School | Private School |
| 3 to 4 Year Olds | 3 (100.0%) | 0 (0.0%) |
| 5 to 9 Year Old | 91 (82.0%) | 20 (18.0%) |
| 10 to 14 Year Olds | 133 (83.1%) | 27 (16.9%) |
| 15 to 17 Year Olds | 63 (95.5%) | 3 (4.5%) |
| 18 to 19 Year Olds | 41 (100.0%) | 0 (0.0%) |
| 20 to 24 Year Olds | 3 (100.0%) | 0 (0.0%) |
| 25 to 34 Year Olds | 32 (97.0%) | 1 (3.0%) |
| 35 Years and over | 14 (63.6%) | 8 (36.4%) |
| Total | 380 (86.6%) | 59 (13.4%) |
Educational Attainment by Field of Study in Fairfax
Visual & performing arts (85 | 14.2%), business (61 | 10.2%), bio, nature & agricultural (50 | 8.4%), science & technology (45 | 7.5%), and arts & humanities (45 | 7.5%) are the most common fields of study among 599 individuals in Fairfax who have obtained a bachelor's degree or higher.
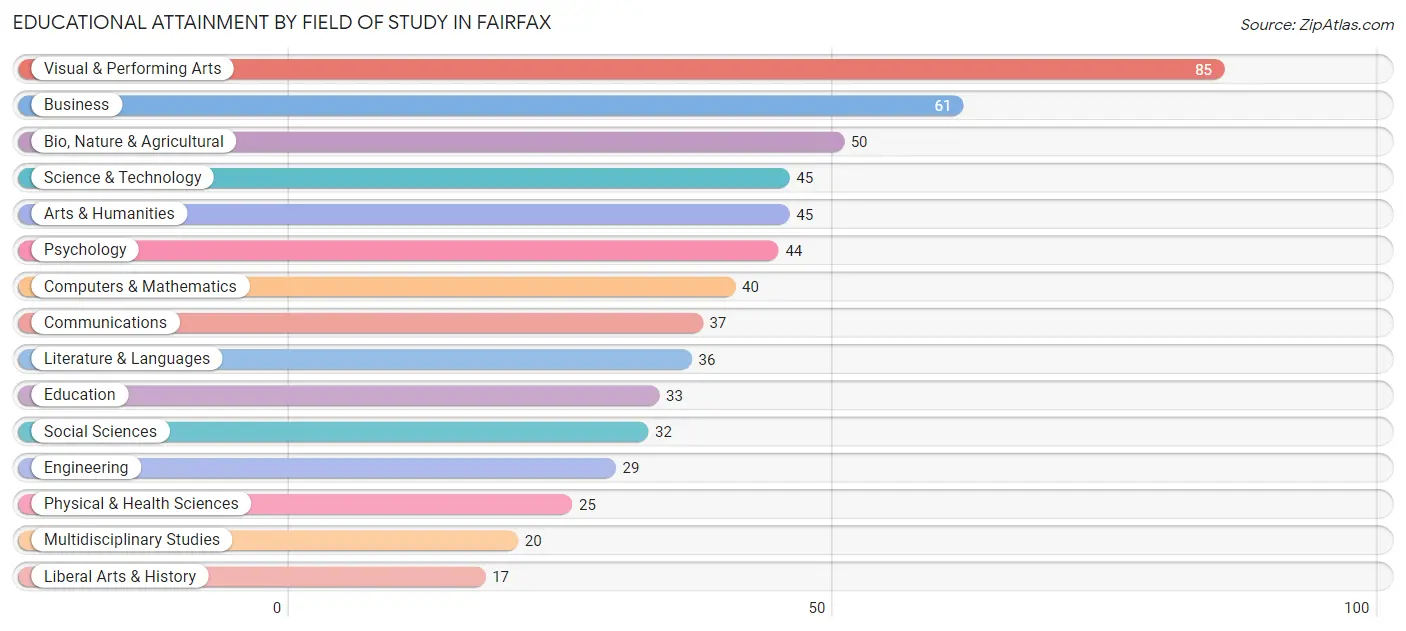
| Field of Study | # Graduates | % Graduates |
| Computers & Mathematics | 40 | 6.7% |
| Bio, Nature & Agricultural | 50 | 8.4% |
| Physical & Health Sciences | 25 | 4.2% |
| Psychology | 44 | 7.3% |
| Social Sciences | 32 | 5.3% |
| Engineering | 29 | 4.8% |
| Multidisciplinary Studies | 20 | 3.3% |
| Science & Technology | 45 | 7.5% |
| Business | 61 | 10.2% |
| Education | 33 | 5.5% |
| Literature & Languages | 36 | 6.0% |
| Liberal Arts & History | 17 | 2.8% |
| Visual & Performing Arts | 85 | 14.2% |
| Communications | 37 | 6.2% |
| Arts & Humanities | 45 | 7.5% |
| Total | 599 | 100.0% |
Transportation & Commute in Fairfax
Vehicle Availability by Sex in Fairfax
The most prevalent vehicle ownership categories in Fairfax are males with 2 vehicles (201, accounting for 44.4%) and females with 2 vehicles (186, making up 40.8%).
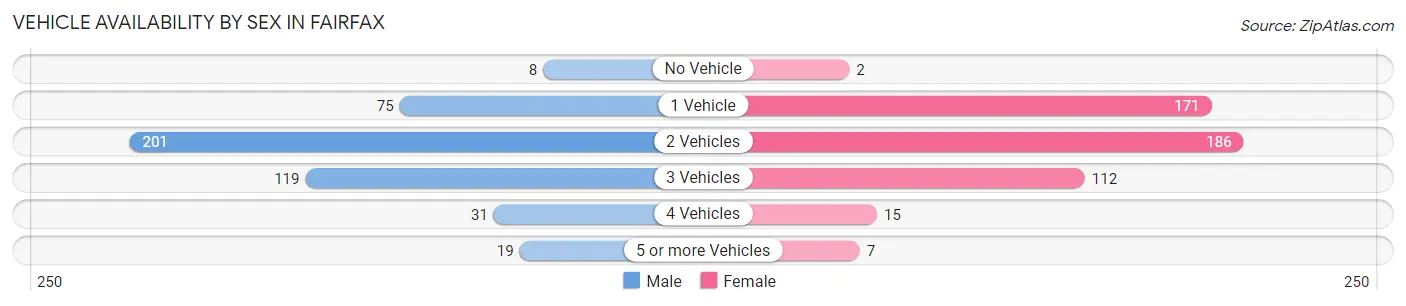
| Vehicles Available | Male | Female |
| No Vehicle | 8 (1.8%) | 2 (0.4%) |
| 1 Vehicle | 75 (16.6%) | 171 (34.7%) |
| 2 Vehicles | 201 (44.4%) | 186 (37.7%) |
| 3 Vehicles | 119 (26.3%) | 112 (22.7%) |
| 4 Vehicles | 31 (6.8%) | 15 (3.0%) |
| 5 or more Vehicles | 19 (4.2%) | 7 (1.4%) |
| Total | 453 (100.0%) | 493 (100.0%) |
Commute Time in Fairfax
The most frequently occuring commute durations in Fairfax are 20 to 24 minutes (195 commuters, 24.5%), 15 to 19 minutes (176 commuters, 22.1%), and 25 to 29 minutes (121 commuters, 15.2%).
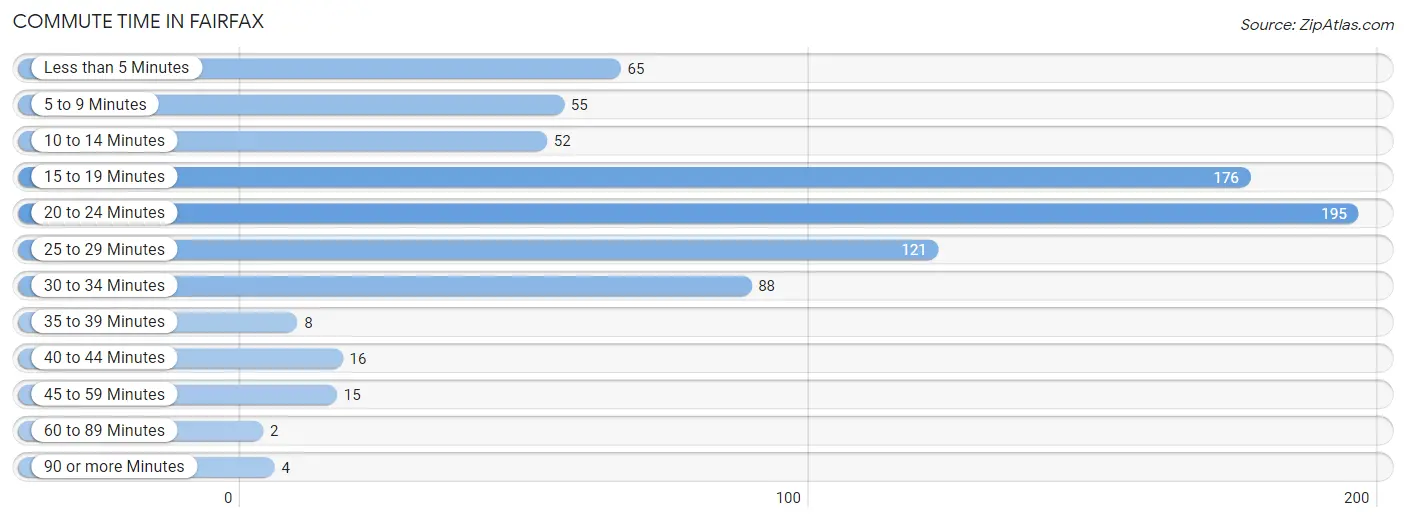
| Commute Time | # Commuters | % Commuters |
| Less than 5 Minutes | 65 | 8.2% |
| 5 to 9 Minutes | 55 | 6.9% |
| 10 to 14 Minutes | 52 | 6.5% |
| 15 to 19 Minutes | 176 | 22.1% |
| 20 to 24 Minutes | 195 | 24.5% |
| 25 to 29 Minutes | 121 | 15.2% |
| 30 to 34 Minutes | 88 | 11.0% |
| 35 to 39 Minutes | 8 | 1.0% |
| 40 to 44 Minutes | 16 | 2.0% |
| 45 to 59 Minutes | 15 | 1.9% |
| 60 to 89 Minutes | 2 | 0.3% |
| 90 or more Minutes | 4 | 0.5% |
Commute Time by Sex in Fairfax
The most common commute times in Fairfax are 15 to 19 minutes (86 commuters, 21.8%) for males and 20 to 24 minutes (122 commuters, 30.3%) for females.
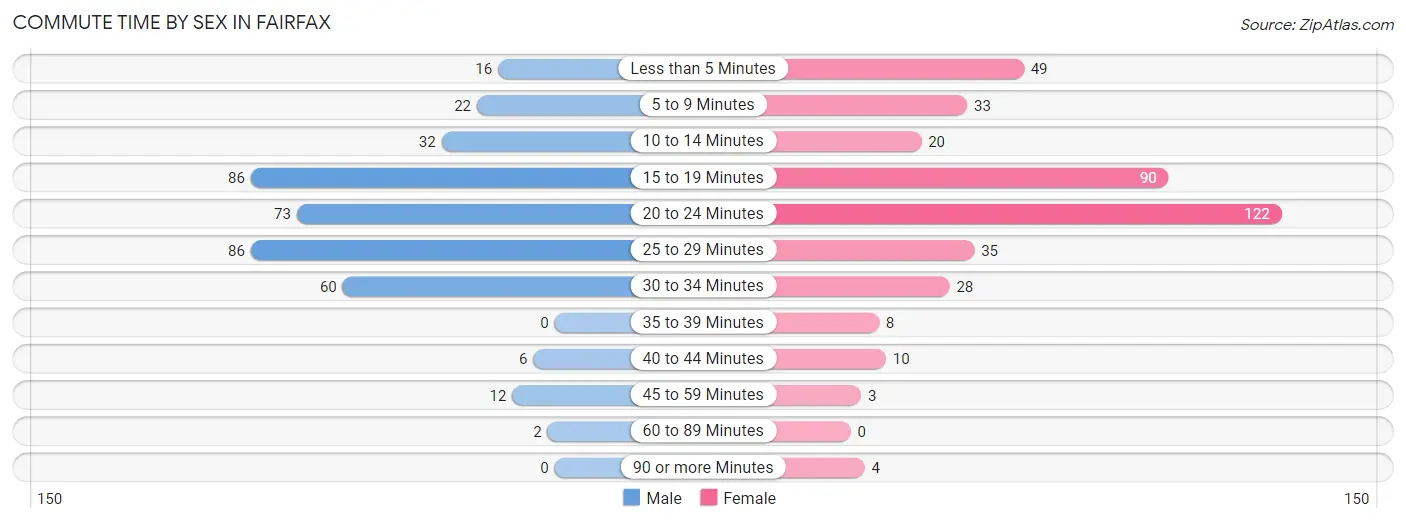
| Commute Time | Male | Female |
| Less than 5 Minutes | 16 (4.1%) | 49 (12.2%) |
| 5 to 9 Minutes | 22 (5.6%) | 33 (8.2%) |
| 10 to 14 Minutes | 32 (8.1%) | 20 (5.0%) |
| 15 to 19 Minutes | 86 (21.8%) | 90 (22.4%) |
| 20 to 24 Minutes | 73 (18.5%) | 122 (30.3%) |
| 25 to 29 Minutes | 86 (21.8%) | 35 (8.7%) |
| 30 to 34 Minutes | 60 (15.2%) | 28 (7.0%) |
| 35 to 39 Minutes | 0 (0.0%) | 8 (2.0%) |
| 40 to 44 Minutes | 6 (1.5%) | 10 (2.5%) |
| 45 to 59 Minutes | 12 (3.0%) | 3 (0.7%) |
| 60 to 89 Minutes | 2 (0.5%) | 0 (0.0%) |
| 90 or more Minutes | 0 (0.0%) | 4 (1.0%) |
Time of Departure to Work by Sex in Fairfax
The most frequent times of departure to work in Fairfax are 7:00 AM to 7:29 AM (61, 15.4%) for males and 7:30 AM to 7:59 AM (67, 16.7%) for females.
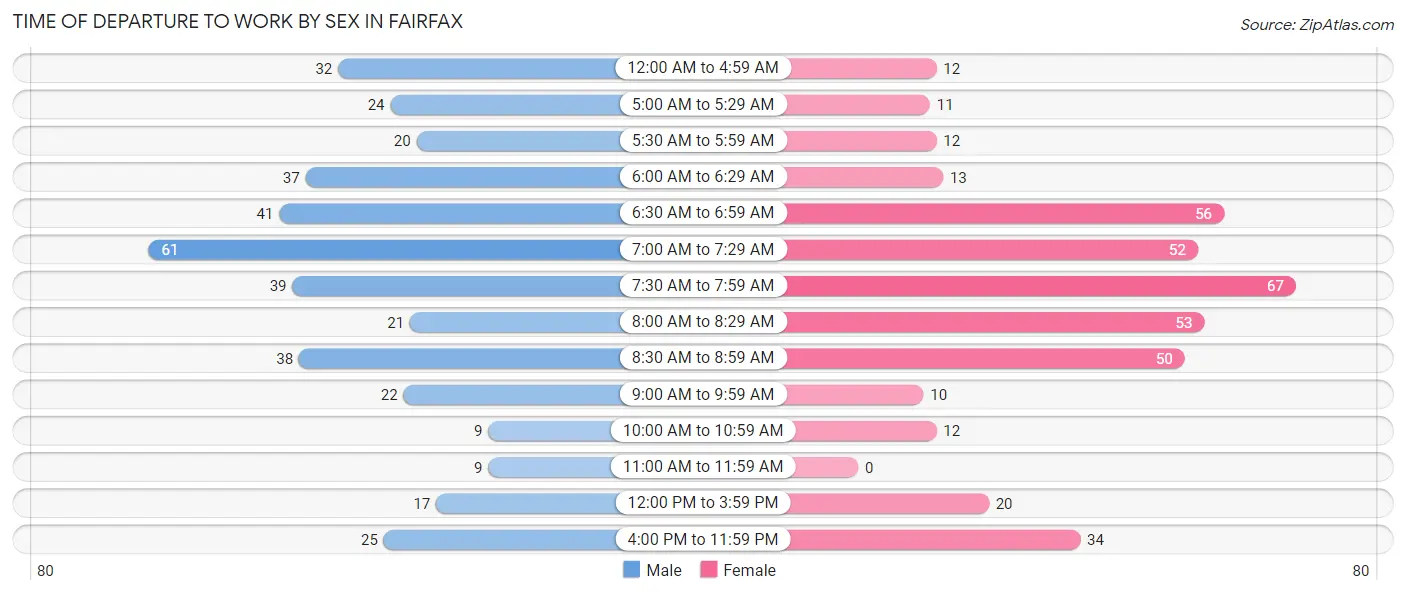
| Time of Departure | Male | Female |
| 12:00 AM to 4:59 AM | 32 (8.1%) | 12 (3.0%) |
| 5:00 AM to 5:29 AM | 24 (6.1%) | 11 (2.7%) |
| 5:30 AM to 5:59 AM | 20 (5.1%) | 12 (3.0%) |
| 6:00 AM to 6:29 AM | 37 (9.4%) | 13 (3.2%) |
| 6:30 AM to 6:59 AM | 41 (10.4%) | 56 (13.9%) |
| 7:00 AM to 7:29 AM | 61 (15.4%) | 52 (12.9%) |
| 7:30 AM to 7:59 AM | 39 (9.9%) | 67 (16.7%) |
| 8:00 AM to 8:29 AM | 21 (5.3%) | 53 (13.2%) |
| 8:30 AM to 8:59 AM | 38 (9.6%) | 50 (12.4%) |
| 9:00 AM to 9:59 AM | 22 (5.6%) | 10 (2.5%) |
| 10:00 AM to 10:59 AM | 9 (2.3%) | 12 (3.0%) |
| 11:00 AM to 11:59 AM | 9 (2.3%) | 0 (0.0%) |
| 12:00 PM to 3:59 PM | 17 (4.3%) | 20 (5.0%) |
| 4:00 PM to 11:59 PM | 25 (6.3%) | 34 (8.5%) |
| Total | 395 (100.0%) | 402 (100.0%) |
Housing Occupancy in Fairfax
Occupancy by Ownership in Fairfax
Of the total 733 dwellings in Fairfax, owner-occupied units account for 555 (75.7%), while renter-occupied units make up 178 (24.3%).
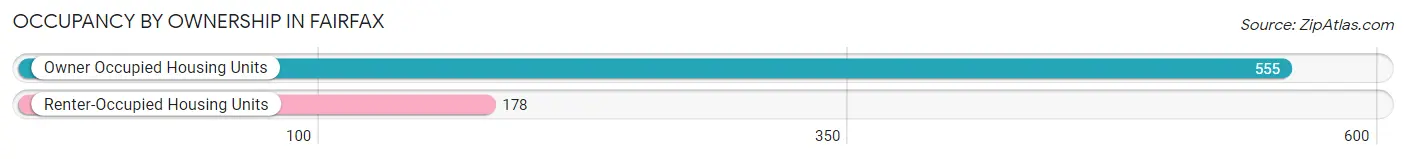
| Occupancy | # Housing Units | % Housing Units |
| Owner Occupied Housing Units | 555 | 75.7% |
| Renter-Occupied Housing Units | 178 | 24.3% |
| Total Occupied Housing Units | 733 | 100.0% |
Occupancy by Household Size in Fairfax
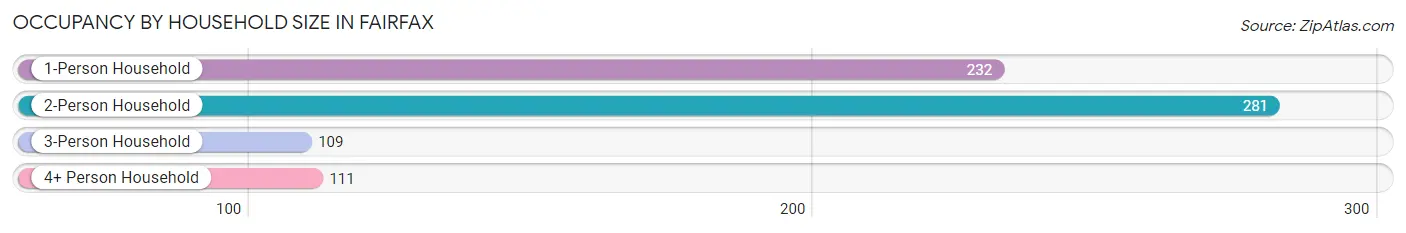
| Household Size | # Housing Units | % Housing Units |
| 1-Person Household | 232 | 31.7% |
| 2-Person Household | 281 | 38.3% |
| 3-Person Household | 109 | 14.9% |
| 4+ Person Household | 111 | 15.1% |
| Total Housing Units | 733 | 100.0% |
Occupancy by Ownership by Household Size in Fairfax
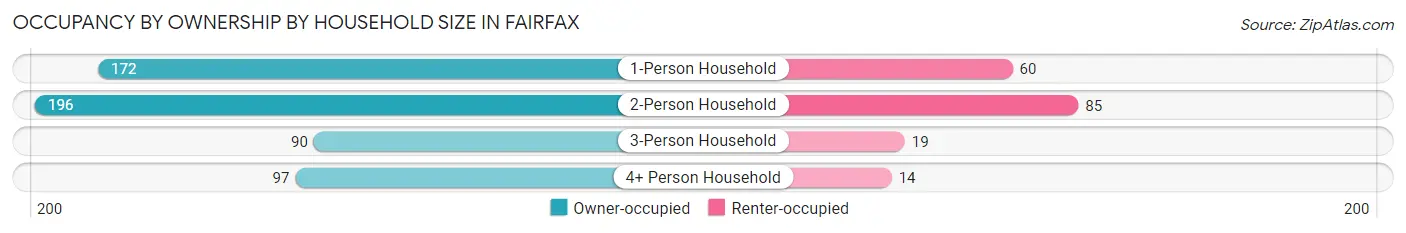
| Household Size | Owner-occupied | Renter-occupied |
| 1-Person Household | 172 (74.1%) | 60 (25.9%) |
| 2-Person Household | 196 (69.8%) | 85 (30.2%) |
| 3-Person Household | 90 (82.6%) | 19 (17.4%) |
| 4+ Person Household | 97 (87.4%) | 14 (12.6%) |
| Total Housing Units | 555 (75.7%) | 178 (24.3%) |
Occupancy by Educational Attainment in Fairfax
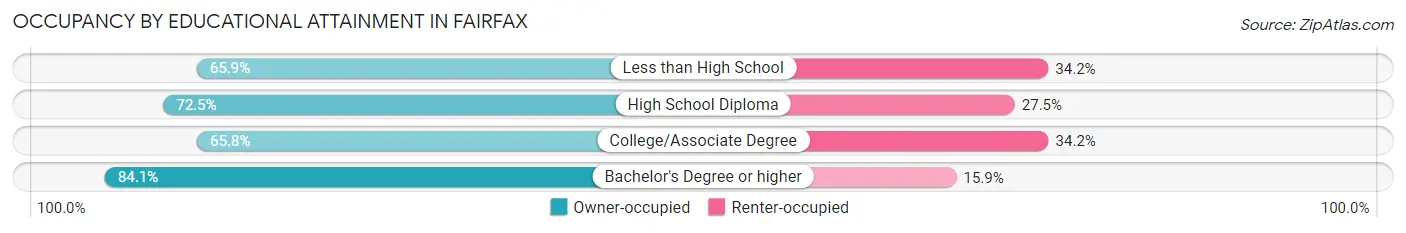
| Household Size | Owner-occupied | Renter-occupied |
| Less than High School | 27 (65.8%) | 14 (34.2%) |
| High School Diploma | 116 (72.5%) | 44 (27.5%) |
| College/Associate Degree | 127 (65.8%) | 66 (34.2%) |
| Bachelor's Degree or higher | 285 (84.1%) | 54 (15.9%) |
Occupancy by Age of Householder in Fairfax
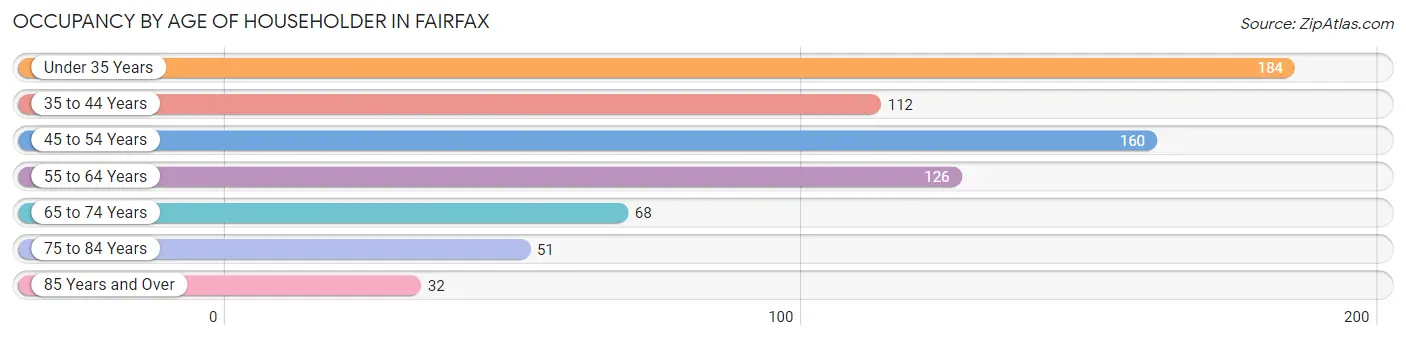
| Age Bracket | # Households | % Households |
| Under 35 Years | 184 | 25.1% |
| 35 to 44 Years | 112 | 15.3% |
| 45 to 54 Years | 160 | 21.8% |
| 55 to 64 Years | 126 | 17.2% |
| 65 to 74 Years | 68 | 9.3% |
| 75 to 84 Years | 51 | 7.0% |
| 85 Years and Over | 32 | 4.4% |
| Total | 733 | 100.0% |
Housing Finances in Fairfax
Median Income by Occupancy in Fairfax
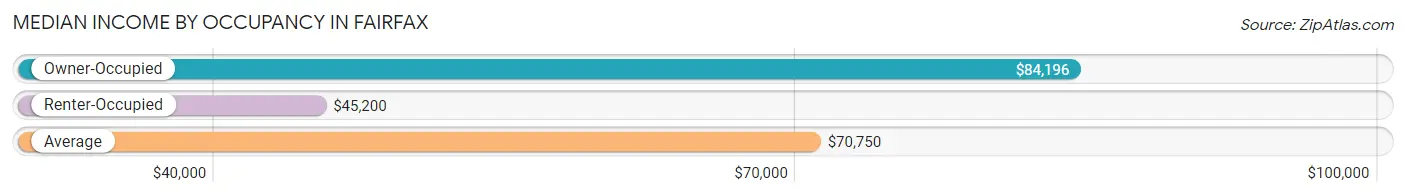
| Occupancy Type | # Households | Median Income |
| Owner-Occupied | 555 (75.7%) | $84,196 |
| Renter-Occupied | 178 (24.3%) | $45,200 |
| Average | 733 (100.0%) | $70,750 |
Occupancy by Householder Income Bracket in Fairfax
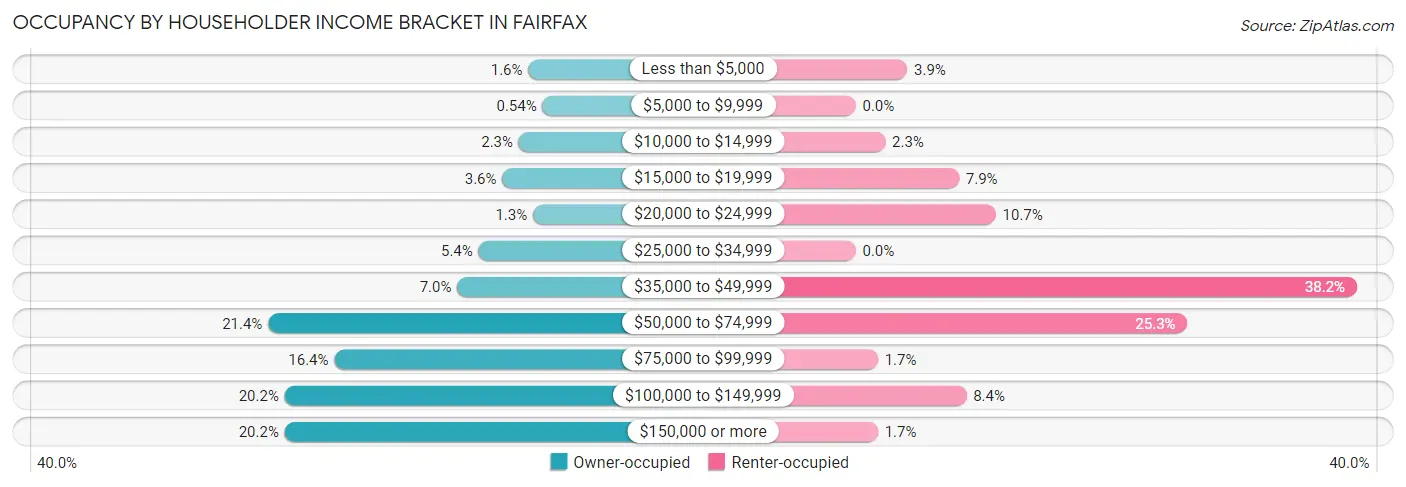
| Income Bracket | Owner-occupied | Renter-occupied |
| Less than $5,000 | 9 (1.6%) | 7 (3.9%) |
| $5,000 to $9,999 | 3 (0.5%) | 0 (0.0%) |
| $10,000 to $14,999 | 13 (2.3%) | 4 (2.2%) |
| $15,000 to $19,999 | 20 (3.6%) | 14 (7.9%) |
| $20,000 to $24,999 | 7 (1.3%) | 19 (10.7%) |
| $25,000 to $34,999 | 30 (5.4%) | 0 (0.0%) |
| $35,000 to $49,999 | 39 (7.0%) | 68 (38.2%) |
| $50,000 to $74,999 | 119 (21.4%) | 45 (25.3%) |
| $75,000 to $99,999 | 91 (16.4%) | 3 (1.7%) |
| $100,000 to $149,999 | 112 (20.2%) | 15 (8.4%) |
| $150,000 or more | 112 (20.2%) | 3 (1.7%) |
| Total | 555 (100.0%) | 178 (100.0%) |
Monthly Housing Cost Tiers in Fairfax
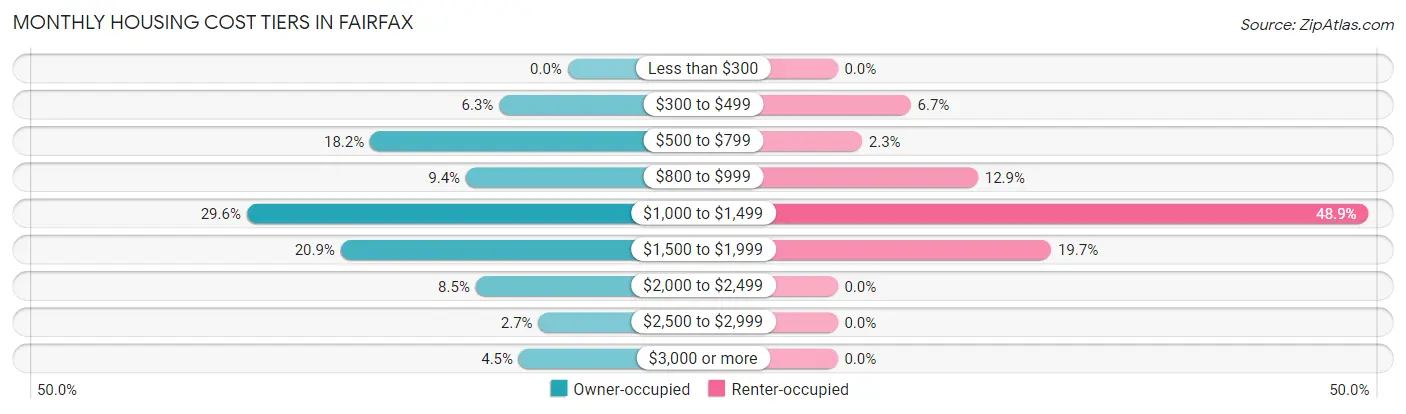
| Monthly Cost | Owner-occupied | Renter-occupied |
| Less than $300 | 0 (0.0%) | 0 (0.0%) |
| $300 to $499 | 35 (6.3%) | 12 (6.7%) |
| $500 to $799 | 101 (18.2%) | 4 (2.2%) |
| $800 to $999 | 52 (9.4%) | 23 (12.9%) |
| $1,000 to $1,499 | 164 (29.5%) | 87 (48.9%) |
| $1,500 to $1,999 | 116 (20.9%) | 35 (19.7%) |
| $2,000 to $2,499 | 47 (8.5%) | 0 (0.0%) |
| $2,500 to $2,999 | 15 (2.7%) | 0 (0.0%) |
| $3,000 or more | 25 (4.5%) | 0 (0.0%) |
| Total | 555 (100.0%) | 178 (100.0%) |
Physical Housing Characteristics in Fairfax
Housing Structures in Fairfax
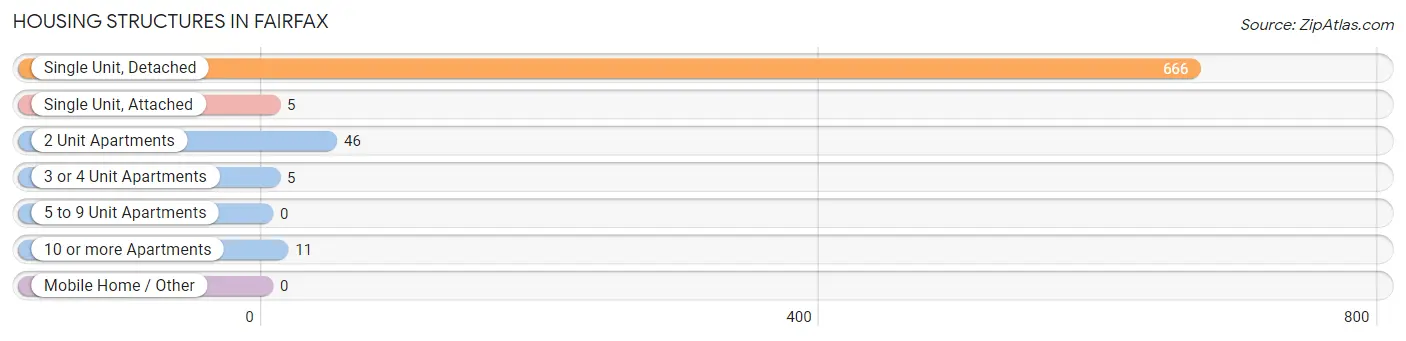
| Structure Type | # Housing Units | % Housing Units |
| Single Unit, Detached | 666 | 90.9% |
| Single Unit, Attached | 5 | 0.7% |
| 2 Unit Apartments | 46 | 6.3% |
| 3 or 4 Unit Apartments | 5 | 0.7% |
| 5 to 9 Unit Apartments | 0 | 0.0% |
| 10 or more Apartments | 11 | 1.5% |
| Mobile Home / Other | 0 | 0.0% |
| Total | 733 | 100.0% |
Housing Structures by Occupancy in Fairfax
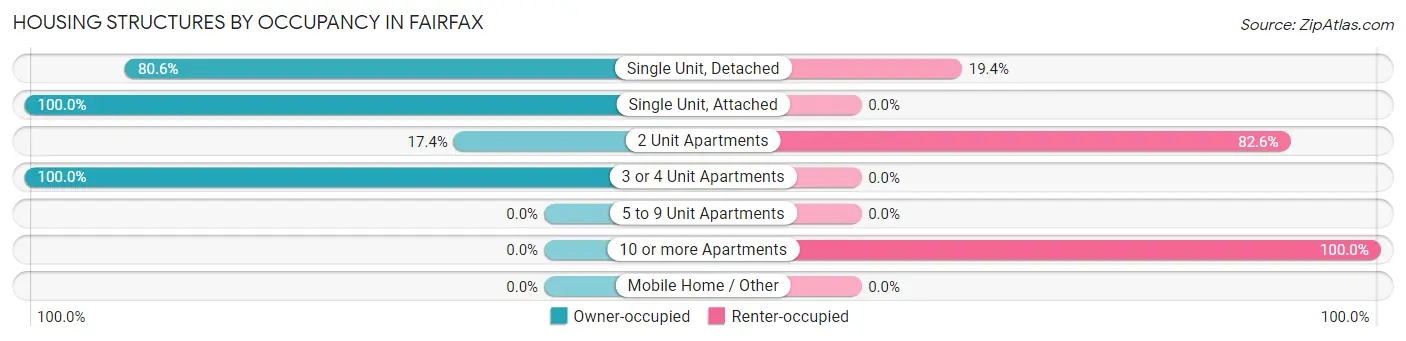
| Structure Type | Owner-occupied | Renter-occupied |
| Single Unit, Detached | 537 (80.6%) | 129 (19.4%) |
| Single Unit, Attached | 5 (100.0%) | 0 (0.0%) |
| 2 Unit Apartments | 8 (17.4%) | 38 (82.6%) |
| 3 or 4 Unit Apartments | 5 (100.0%) | 0 (0.0%) |
| 5 to 9 Unit Apartments | 0 (0.0%) | 0 (0.0%) |
| 10 or more Apartments | 0 (0.0%) | 11 (100.0%) |
| Mobile Home / Other | 0 (0.0%) | 0 (0.0%) |
| Total | 555 (75.7%) | 178 (24.3%) |
Housing Structures by Number of Rooms in Fairfax
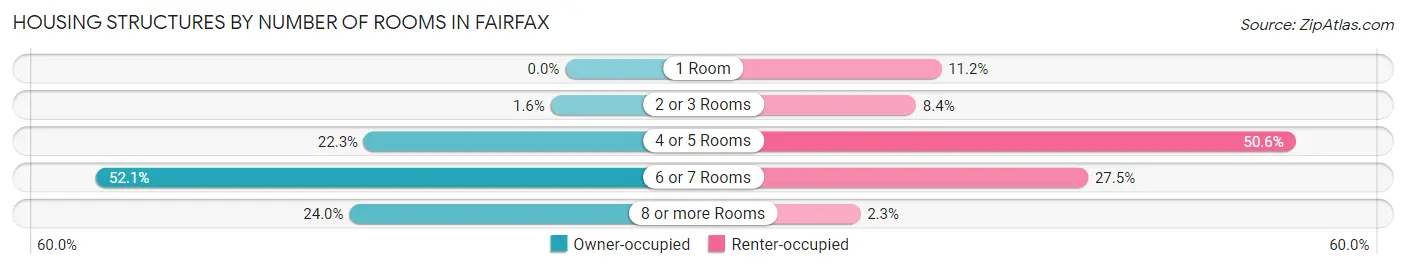
| Number of Rooms | Owner-occupied | Renter-occupied |
| 1 Room | 0 (0.0%) | 20 (11.2%) |
| 2 or 3 Rooms | 9 (1.6%) | 15 (8.4%) |
| 4 or 5 Rooms | 124 (22.3%) | 90 (50.6%) |
| 6 or 7 Rooms | 289 (52.1%) | 49 (27.5%) |
| 8 or more Rooms | 133 (24.0%) | 4 (2.2%) |
| Total | 555 (100.0%) | 178 (100.0%) |
Housing Structure by Heating Type in Fairfax
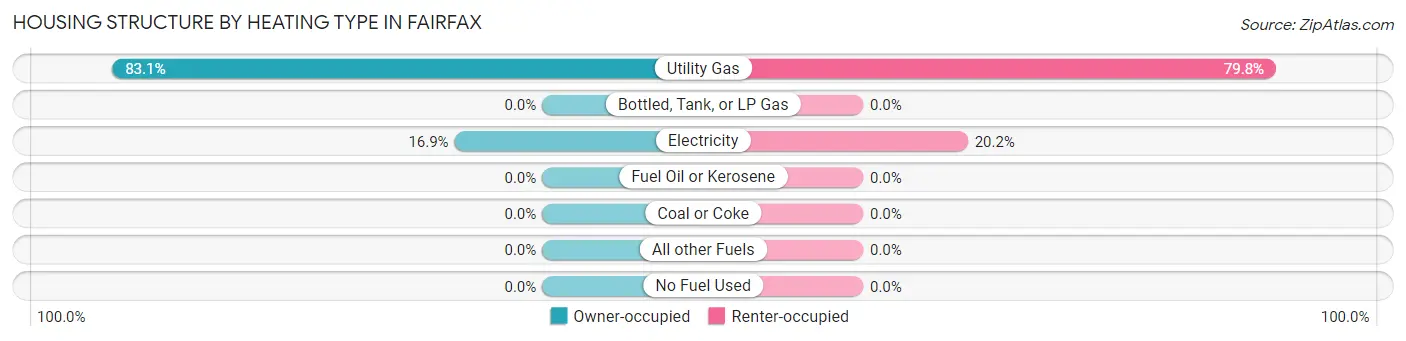
| Heating Type | Owner-occupied | Renter-occupied |
| Utility Gas | 461 (83.1%) | 142 (79.8%) |
| Bottled, Tank, or LP Gas | 0 (0.0%) | 0 (0.0%) |
| Electricity | 94 (16.9%) | 36 (20.2%) |
| Fuel Oil or Kerosene | 0 (0.0%) | 0 (0.0%) |
| Coal or Coke | 0 (0.0%) | 0 (0.0%) |
| All other Fuels | 0 (0.0%) | 0 (0.0%) |
| No Fuel Used | 0 (0.0%) | 0 (0.0%) |
| Total | 555 (100.0%) | 178 (100.0%) |
Household Vehicle Usage in Fairfax
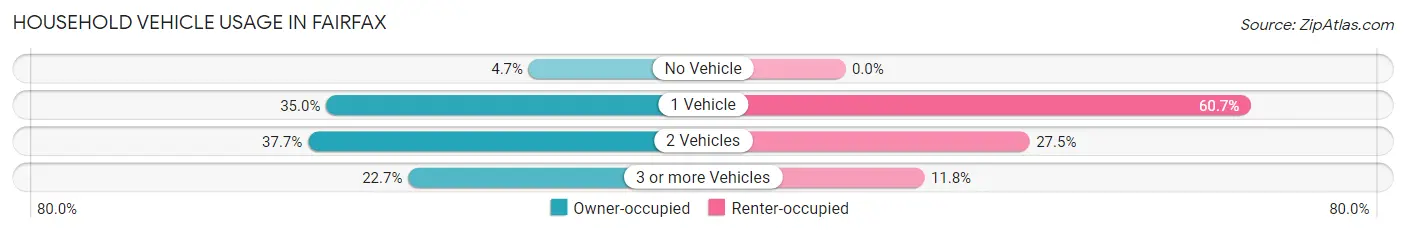
| Vehicles per Household | Owner-occupied | Renter-occupied |
| No Vehicle | 26 (4.7%) | 0 (0.0%) |
| 1 Vehicle | 194 (34.9%) | 108 (60.7%) |
| 2 Vehicles | 209 (37.7%) | 49 (27.5%) |
| 3 or more Vehicles | 126 (22.7%) | 21 (11.8%) |
| Total | 555 (100.0%) | 178 (100.0%) |
Real Estate & Mortgages in Fairfax
Real Estate and Mortgage Overview in Fairfax
| Characteristic | Without Mortgage | With Mortgage |
| Housing Units | 157 | 398 |
| Median Property Value | $170,100 | $216,300 |
| Median Household Income | $59,375 | $101 |
| Monthly Housing Costs | $648 | $25 |
| Real Estate Taxes | $3,820 | $11 |
Property Value by Mortgage Status in Fairfax
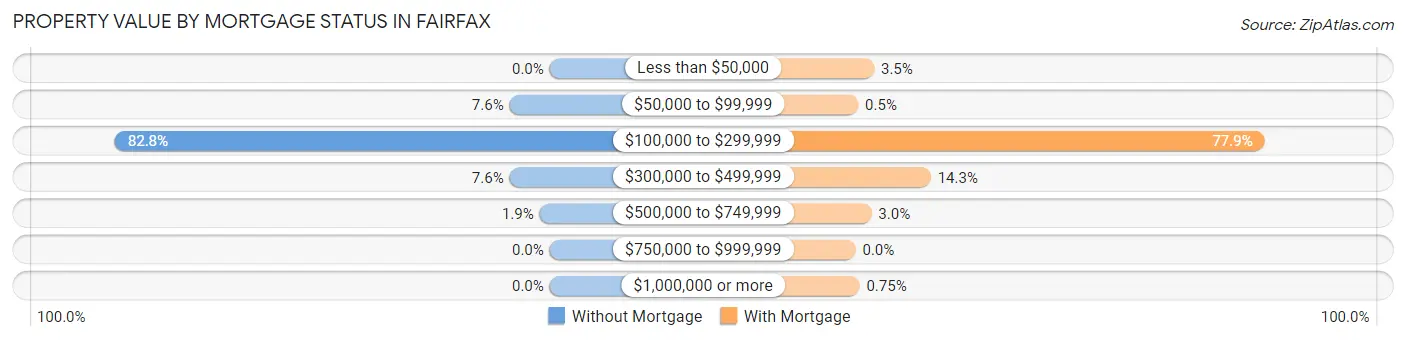
| Property Value | Without Mortgage | With Mortgage |
| Less than $50,000 | 0 (0.0%) | 14 (3.5%) |
| $50,000 to $99,999 | 12 (7.6%) | 2 (0.5%) |
| $100,000 to $299,999 | 130 (82.8%) | 310 (77.9%) |
| $300,000 to $499,999 | 12 (7.6%) | 57 (14.3%) |
| $500,000 to $749,999 | 3 (1.9%) | 12 (3.0%) |
| $750,000 to $999,999 | 0 (0.0%) | 0 (0.0%) |
| $1,000,000 or more | 0 (0.0%) | 3 (0.7%) |
| Total | 157 (100.0%) | 398 (100.0%) |
Household Income by Mortgage Status in Fairfax
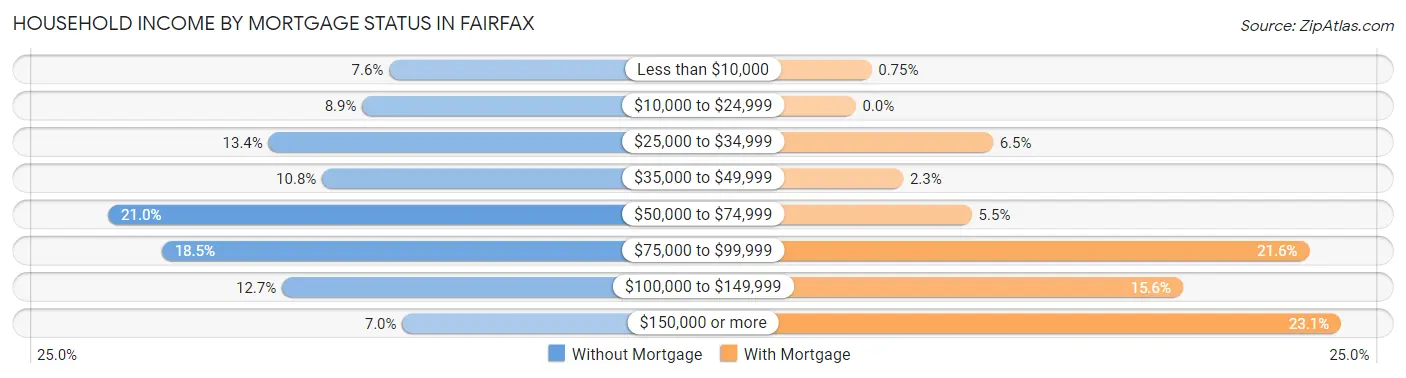
| Household Income | Without Mortgage | With Mortgage |
| Less than $10,000 | 12 (7.6%) | 3 (0.7%) |
| $10,000 to $24,999 | 14 (8.9%) | 0 (0.0%) |
| $25,000 to $34,999 | 21 (13.4%) | 26 (6.5%) |
| $35,000 to $49,999 | 17 (10.8%) | 9 (2.3%) |
| $50,000 to $74,999 | 33 (21.0%) | 22 (5.5%) |
| $75,000 to $99,999 | 29 (18.5%) | 86 (21.6%) |
| $100,000 to $149,999 | 20 (12.7%) | 62 (15.6%) |
| $150,000 or more | 11 (7.0%) | 92 (23.1%) |
| Total | 157 (100.0%) | 398 (100.0%) |
Property Value to Household Income Ratio in Fairfax
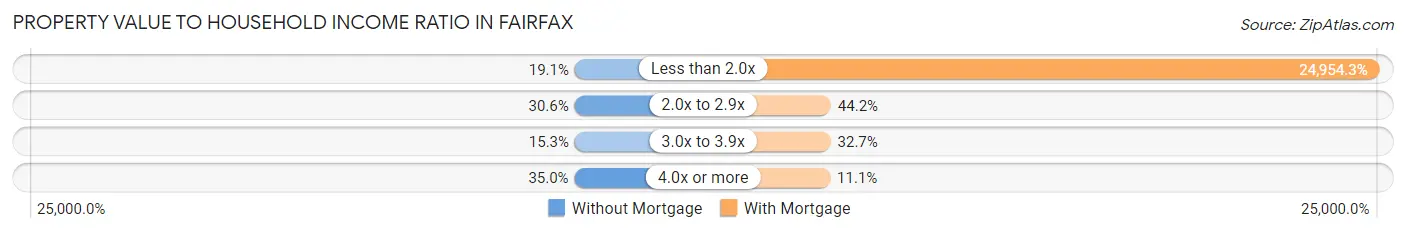
| Value-to-Income Ratio | Without Mortgage | With Mortgage |
| Less than 2.0x | 30 (19.1%) | 99,318 (24,954.3%) |
| 2.0x to 2.9x | 48 (30.6%) | 176 (44.2%) |
| 3.0x to 3.9x | 24 (15.3%) | 130 (32.7%) |
| 4.0x or more | 55 (35.0%) | 44 (11.1%) |
| Total | 157 (100.0%) | 398 (100.0%) |
Real Estate Taxes by Mortgage Status in Fairfax
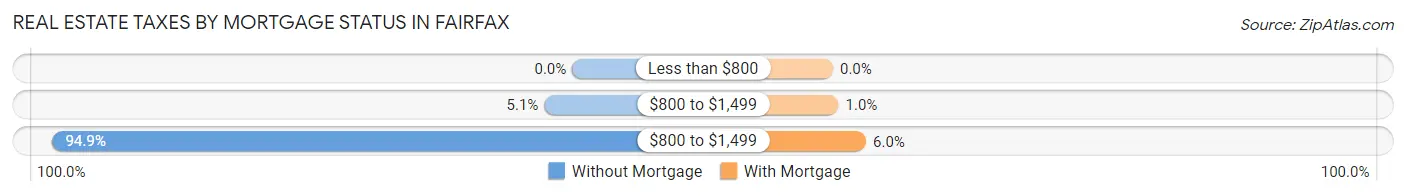
| Property Taxes | Without Mortgage | With Mortgage |
| Less than $800 | 0 (0.0%) | 0 (0.0%) |
| $800 to $1,499 | 8 (5.1%) | 4 (1.0%) |
| $800 to $1,499 | 149 (94.9%) | 24 (6.0%) |
| Total | 157 (100.0%) | 398 (100.0%) |
Health & Disability in Fairfax
Health Insurance Coverage by Age in Fairfax
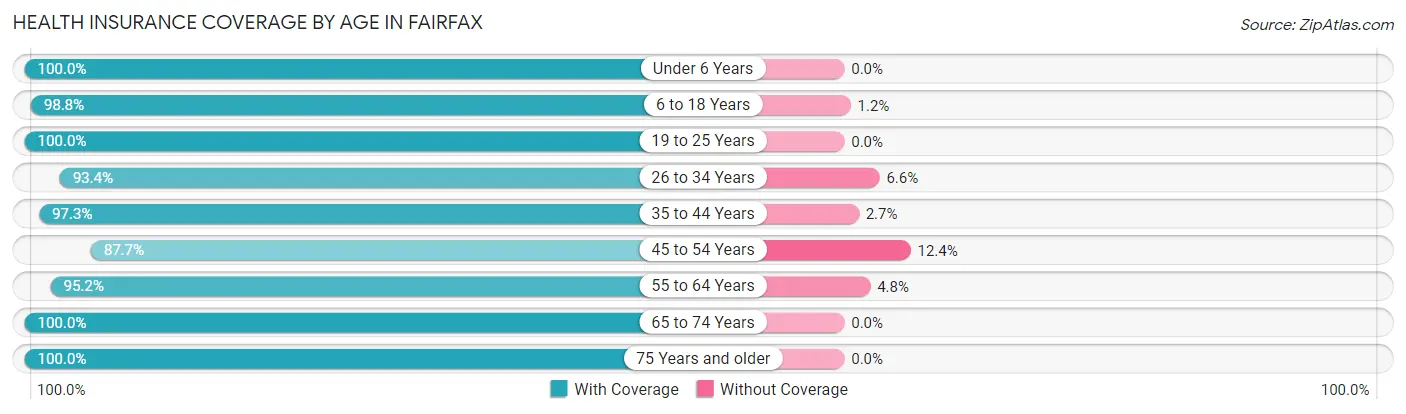
| Age Bracket | With Coverage | Without Coverage |
| Under 6 Years | 90 (100.0%) | 0 (0.0%) |
| 6 to 18 Years | 339 (98.8%) | 4 (1.2%) |
| 19 to 25 Years | 106 (100.0%) | 0 (0.0%) |
| 26 to 34 Years | 242 (93.4%) | 17 (6.6%) |
| 35 to 44 Years | 217 (97.3%) | 6 (2.7%) |
| 45 to 54 Years | 220 (87.6%) | 31 (12.3%) |
| 55 to 64 Years | 177 (95.2%) | 9 (4.8%) |
| 65 to 74 Years | 97 (100.0%) | 0 (0.0%) |
| 75 Years and older | 106 (100.0%) | 0 (0.0%) |
| Total | 1,594 (96.0%) | 67 (4.0%) |
Health Insurance Coverage by Citizenship Status in Fairfax
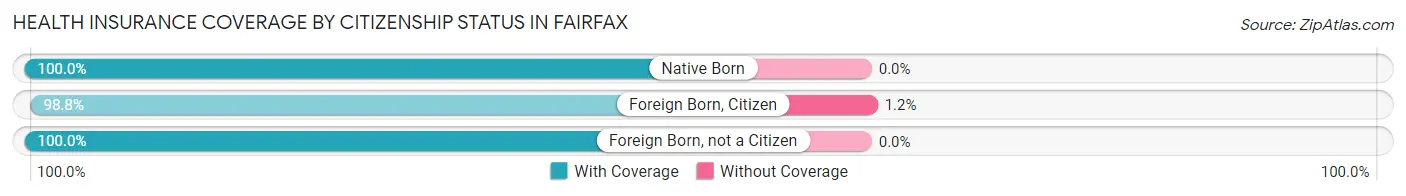
| Citizenship Status | With Coverage | Without Coverage |
| Native Born | 90 (100.0%) | 0 (0.0%) |
| Foreign Born, Citizen | 339 (98.8%) | 4 (1.2%) |
| Foreign Born, not a Citizen | 106 (100.0%) | 0 (0.0%) |
Health Insurance Coverage by Household Income in Fairfax
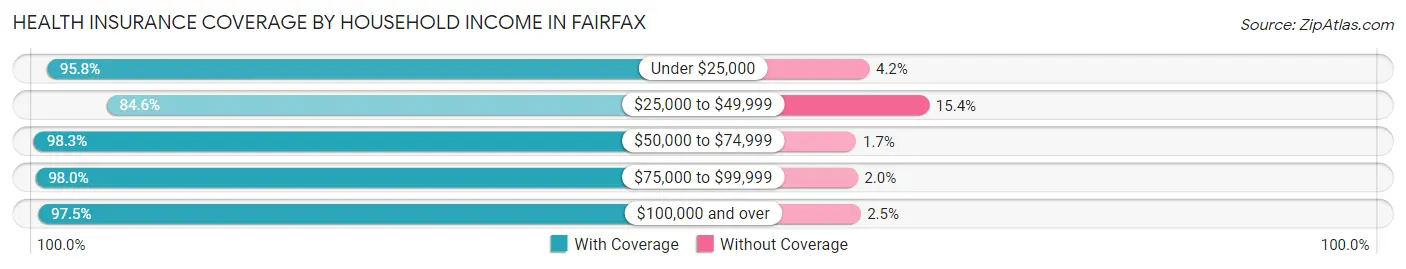
| Household Income | With Coverage | Without Coverage |
| Under $25,000 | 138 (95.8%) | 6 (4.2%) |
| $25,000 to $49,999 | 176 (84.6%) | 32 (15.4%) |
| $50,000 to $74,999 | 338 (98.3%) | 6 (1.7%) |
| $75,000 to $99,999 | 245 (98.0%) | 5 (2.0%) |
| $100,000 and over | 697 (97.5%) | 18 (2.5%) |
Public vs Private Health Insurance Coverage by Age in Fairfax
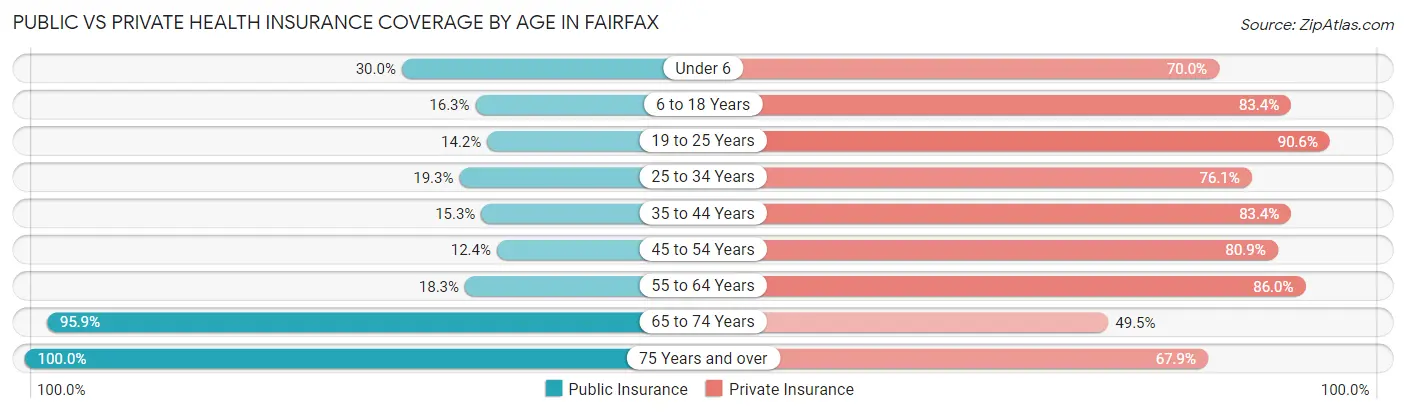
| Age Bracket | Public Insurance | Private Insurance |
| Under 6 | 27 (30.0%) | 63 (70.0%) |
| 6 to 18 Years | 56 (16.3%) | 286 (83.4%) |
| 19 to 25 Years | 15 (14.1%) | 96 (90.6%) |
| 25 to 34 Years | 50 (19.3%) | 197 (76.1%) |
| 35 to 44 Years | 34 (15.2%) | 186 (83.4%) |
| 45 to 54 Years | 31 (12.3%) | 203 (80.9%) |
| 55 to 64 Years | 34 (18.3%) | 160 (86.0%) |
| 65 to 74 Years | 93 (95.9%) | 48 (49.5%) |
| 75 Years and over | 106 (100.0%) | 72 (67.9%) |
| Total | 446 (26.9%) | 1,311 (78.9%) |
Disability Status by Sex by Age in Fairfax
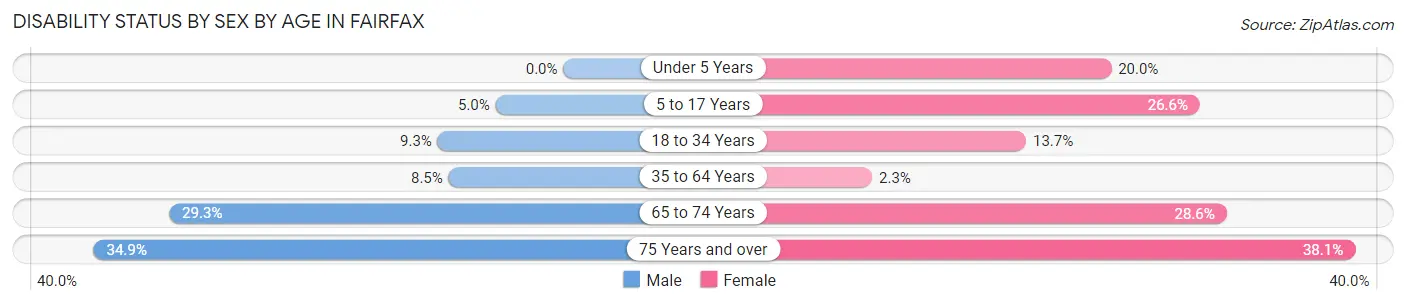
| Age Bracket | Male | Female |
| Under 5 Years | 0 (0.0%) | 4 (20.0%) |
| 5 to 17 Years | 9 (5.0%) | 42 (26.6%) |
| 18 to 34 Years | 18 (9.3%) | 29 (13.7%) |
| 35 to 64 Years | 26 (8.5%) | 8 (2.2%) |
| 65 to 74 Years | 12 (29.3%) | 16 (28.6%) |
| 75 Years and over | 15 (34.9%) | 24 (38.1%) |
Disability Class by Sex by Age in Fairfax
Disability Class: Hearing Difficulty
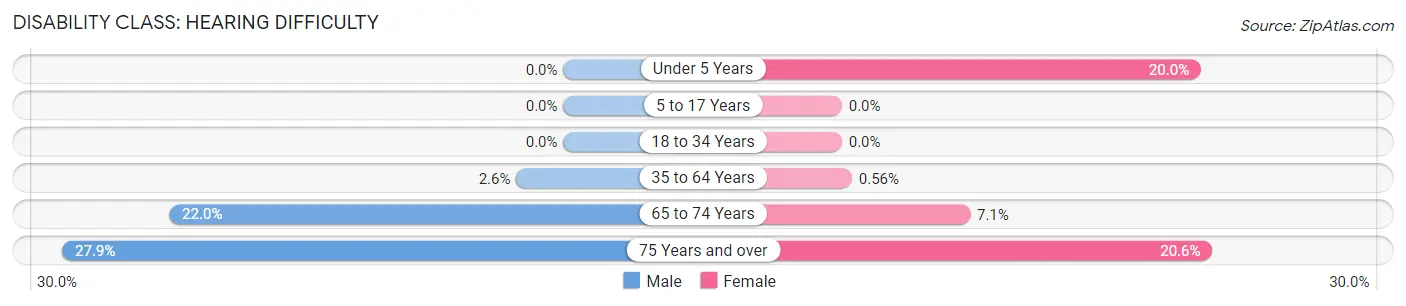
| Age Bracket | Male | Female |
| Under 5 Years | 0 (0.0%) | 4 (20.0%) |
| 5 to 17 Years | 0 (0.0%) | 0 (0.0%) |
| 18 to 34 Years | 0 (0.0%) | 0 (0.0%) |
| 35 to 64 Years | 8 (2.6%) | 2 (0.6%) |
| 65 to 74 Years | 9 (22.0%) | 4 (7.1%) |
| 75 Years and over | 12 (27.9%) | 13 (20.6%) |
Disability Class: Vision Difficulty
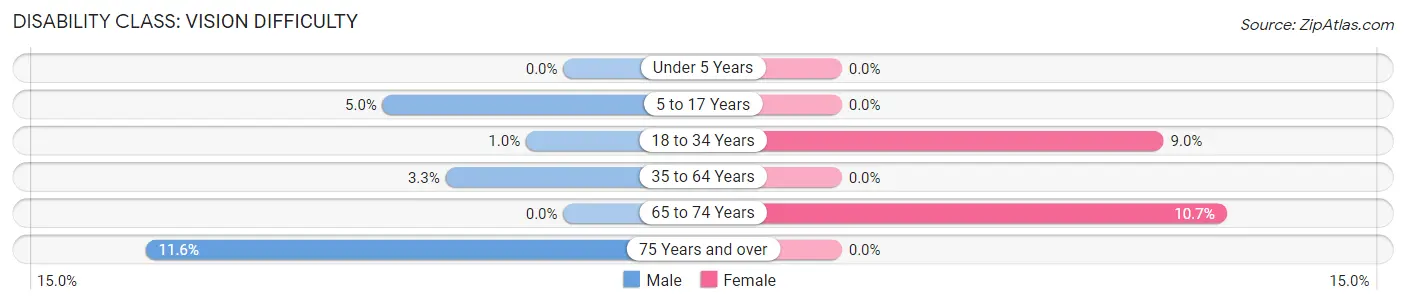
| Age Bracket | Male | Female |
| Under 5 Years | 0 (0.0%) | 0 (0.0%) |
| 5 to 17 Years | 9 (5.0%) | 0 (0.0%) |
| 18 to 34 Years | 2 (1.0%) | 19 (9.0%) |
| 35 to 64 Years | 10 (3.3%) | 0 (0.0%) |
| 65 to 74 Years | 0 (0.0%) | 6 (10.7%) |
| 75 Years and over | 5 (11.6%) | 0 (0.0%) |
Disability Class: Cognitive Difficulty
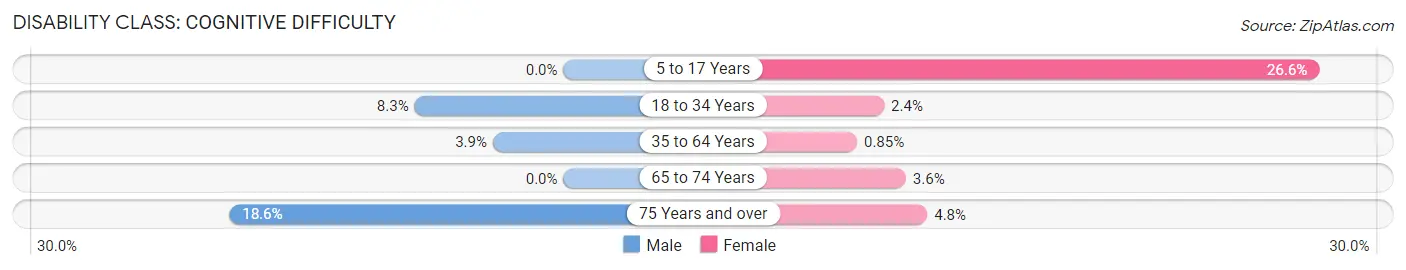
| Age Bracket | Male | Female |
| 5 to 17 Years | 0 (0.0%) | 42 (26.6%) |
| 18 to 34 Years | 16 (8.3%) | 5 (2.4%) |
| 35 to 64 Years | 12 (3.9%) | 3 (0.9%) |
| 65 to 74 Years | 0 (0.0%) | 2 (3.6%) |
| 75 Years and over | 8 (18.6%) | 3 (4.8%) |
Disability Class: Ambulatory Difficulty
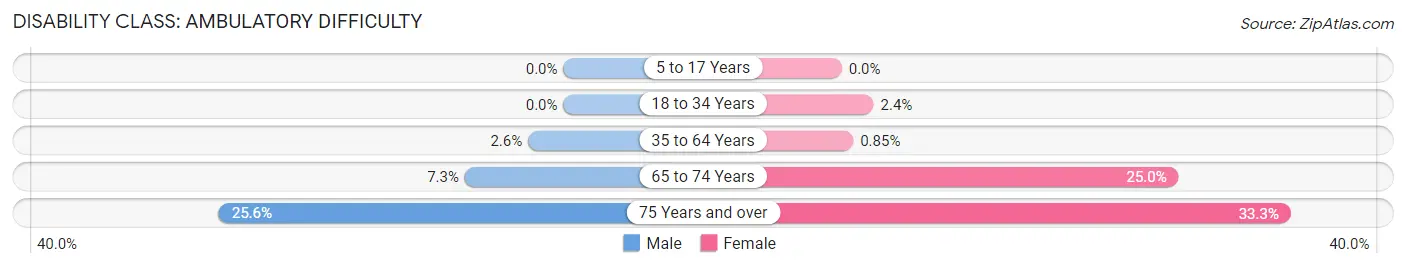
| Age Bracket | Male | Female |
| 5 to 17 Years | 0 (0.0%) | 0 (0.0%) |
| 18 to 34 Years | 0 (0.0%) | 5 (2.4%) |
| 35 to 64 Years | 8 (2.6%) | 3 (0.9%) |
| 65 to 74 Years | 3 (7.3%) | 14 (25.0%) |
| 75 Years and over | 11 (25.6%) | 21 (33.3%) |
Disability Class: Self-Care Difficulty
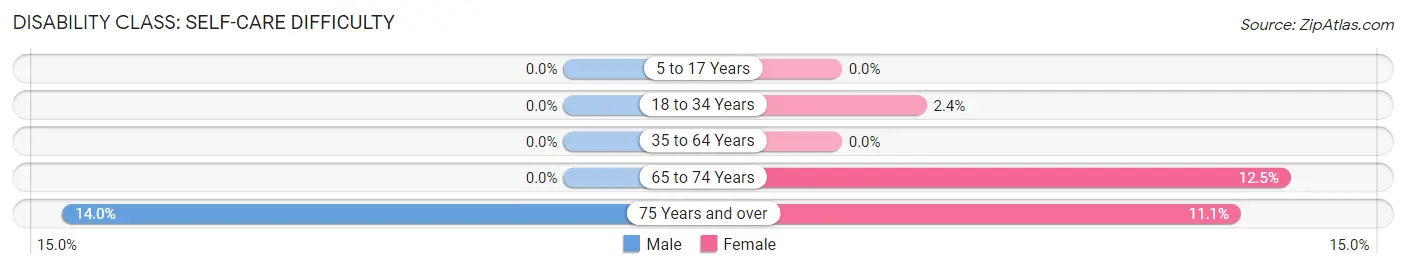
| Age Bracket | Male | Female |
| 5 to 17 Years | 0 (0.0%) | 0 (0.0%) |
| 18 to 34 Years | 0 (0.0%) | 5 (2.4%) |
| 35 to 64 Years | 0 (0.0%) | 0 (0.0%) |
| 65 to 74 Years | 0 (0.0%) | 7 (12.5%) |
| 75 Years and over | 6 (14.0%) | 7 (11.1%) |
Technology Access in Fairfax
Computing Device Access in Fairfax
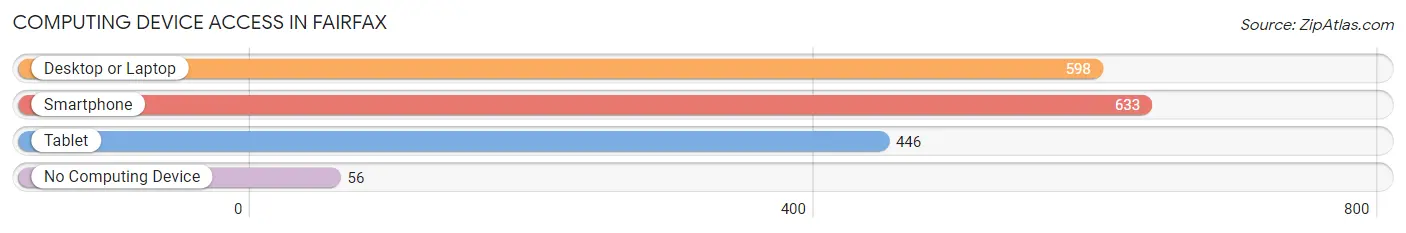
| Device Type | # Households | % Households |
| Desktop or Laptop | 598 | 81.6% |
| Smartphone | 633 | 86.4% |
| Tablet | 446 | 60.9% |
| No Computing Device | 56 | 7.6% |
| Total | 733 | 100.0% |
Internet Access in Fairfax
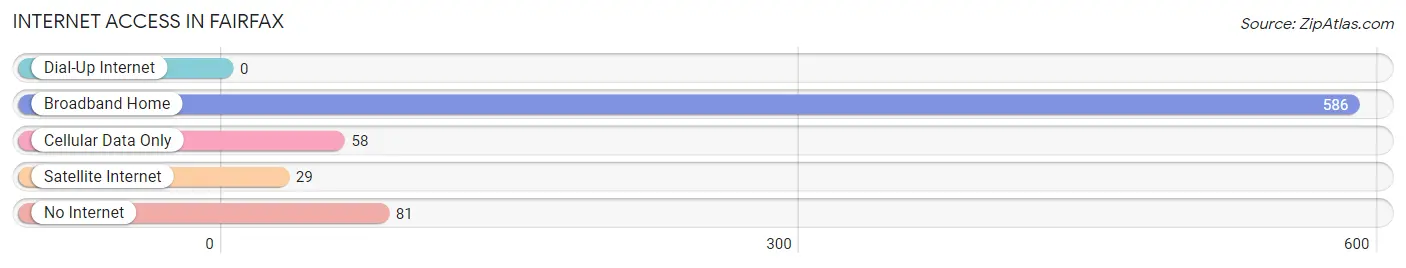
| Internet Type | # Households | % Households |
| Dial-Up Internet | 0 | 0.0% |
| Broadband Home | 586 | 79.9% |
| Cellular Data Only | 58 | 7.9% |
| Satellite Internet | 29 | 4.0% |
| No Internet | 81 | 11.1% |
| Total | 733 | 100.0% |
Fairfax Summary
Fairfax, Ohio is a small village located in the southeastern corner of Brown County, Ohio. It is situated along the Ohio River, approximately 20 miles east of Cincinnati. The village has a population of approximately 1,000 people and covers an area of 0.6 square miles.
History
The area that is now Fairfax was first settled in the early 1800s by a group of German immigrants. The village was originally known as “New Vienna” and was later renamed “Fairfax” in 1845. The name was chosen in honor of Thomas Fairfax, the 6th Lord Fairfax of Cameron.
The village was incorporated in 1848 and was home to a variety of businesses, including a sawmill, a gristmill, a tannery, and a distillery. The village also had a post office, a school, and a church.
In the late 1800s, Fairfax was a popular destination for tourists. The village was home to several resorts, including the Fairfax Hotel, which was built in 1891. The hotel was a popular destination for wealthy visitors from Cincinnati and other nearby cities.
Geography
Fairfax is located in the southeastern corner of Brown County, Ohio. It is situated along the Ohio River, approximately 20 miles east of Cincinnati. The village is surrounded by rolling hills and farmland. The climate is humid continental, with hot summers and cold winters.
Economy
The economy of Fairfax is largely based on agriculture. The village is home to several farms, which produce a variety of crops, including corn, soybeans, and wheat. The village also has a few small businesses, including a grocery store, a hardware store, and a restaurant.
Demographics
As of the 2010 census, the population of Fairfax was 1,000 people. The racial makeup of the village was 97.2% White, 0.7% African American, 0.3% Native American, 0.2% Asian, and 1.6% from other races. The median household income was $41,250, and the median family income was $50,000.
Conclusion
Fairfax, Ohio is a small village located in the southeastern corner of Brown County, Ohio. It is situated along the Ohio River, approximately 20 miles east of Cincinnati. The village has a population of approximately 1,000 people and covers an area of 0.6 square miles. The economy of Fairfax is largely based on agriculture, and the village is home to several farms, which produce a variety of crops. The racial makeup of the village is predominantly White, with a small percentage of African American, Native American, and Asian residents.
Common Questions
What is Per Capita Income in Fairfax?
Per Capita income in Fairfax is $40,075.
What is the Median Family Income in Fairfax?
Median Family Income in Fairfax is $93,281.
What is the Median Household income in Fairfax?
Median Household Income in Fairfax is $70,750.
What is Income or Wage Gap in Fairfax?
Income or Wage Gap in Fairfax is 5.9%.
Women in Fairfax earn 94.1 cents for every dollar earned by a man.
What is Inequality or Gini Index in Fairfax?
Inequality or Gini Index in Fairfax is 0.40.
What is the Total Population of Fairfax?
Total Population of Fairfax is 1,661.
What is the Total Male Population of Fairfax?
Total Male Population of Fairfax is 797.
What is the Total Female Population of Fairfax?
Total Female Population of Fairfax is 864.
What is the Ratio of Males per 100 Females in Fairfax?
There are 92.25 Males per 100 Females in Fairfax.
What is the Ratio of Females per 100 Males in Fairfax?
There are 108.41 Females per 100 Males in Fairfax.
What is the Median Population Age in Fairfax?
Median Population Age in Fairfax is 36.9 Years.
What is the Average Family Size in Fairfax
Average Family Size in Fairfax is 2.9 People.
What is the Average Household Size in Fairfax
Average Household Size in Fairfax is 2.3 People.
How Large is the Labor Force in Fairfax?
There are 995 People in the Labor Forcein in Fairfax.
What is the Percentage of People in the Labor Force in Fairfax?
76.8% of People are in the Labor Force in Fairfax.
What is the Unemployment Rate in Fairfax?
Unemployment Rate in Fairfax is 3.9%.