Crystal Lakes, OH Map & Demographics
Crystal Lakes Map
Crystal Lakes Overview
$26,152
PER CAPITA INCOME
$59,006
AVG FAMILY INCOME
$55,714
AVG HOUSEHOLD INCOME
68.0%
WAGE / INCOME GAP [ % ]
32.0¢/ $1
WAGE / INCOME GAP [ $ ]
0.47
INEQUALITY / GINI INDEX
1,605
TOTAL POPULATION
652
MALE POPULATION
953
FEMALE POPULATION
68.42
MALES / 100 FEMALES
146.17
FEMALES / 100 MALES
38.8
MEDIAN AGE
3.1
AVG FAMILY SIZE
2.8
AVG HOUSEHOLD SIZE
663
LABOR FORCE [ PEOPLE ]
54.8%
PERCENT IN LABOR FORCE
9.8%
UNEMPLOYMENT RATE
Income in Crystal Lakes
Income Overview in Crystal Lakes
Per Capita Income in Crystal Lakes is $26,152, while median incomes of families and households are $59,006 and $55,714 respectively.
| Characteristic | Number | Measure |
| Per Capita Income | 1,605 | $26,152 |
| Median Family Income | 445 | $59,006 |
| Mean Family Income | 445 | $67,071 |
| Median Household Income | 582 | $55,714 |
| Mean Household Income | 582 | $71,859 |
| Income Deficit | 445 | $0 |
| Wage / Income Gap (%) | 1,605 | 67.96% |
| Wage / Income Gap ($) | 1,605 | 32.04¢ per $1 |
| Gini / Inequality Index | 1,605 | 0.47 |
Earnings by Sex in Crystal Lakes
Average Earnings in Crystal Lakes are $27,557, $52,667 for men and $16,875 for women, a difference of 68.0%.
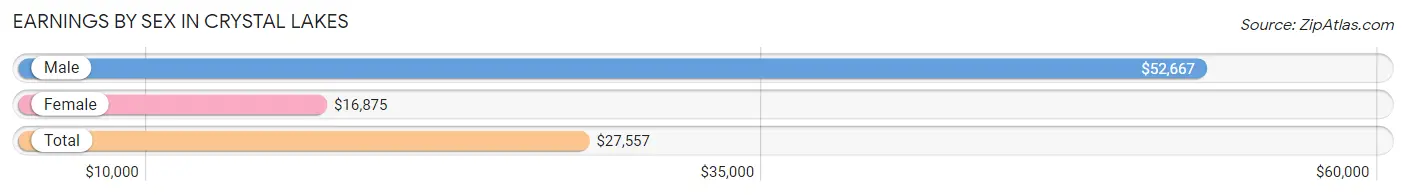
| Sex | Number | Average Earnings |
| Male | 370 (51.5%) | $52,667 |
| Female | 348 (48.5%) | $16,875 |
| Total | 718 (100.0%) | $27,557 |
Earnings by Sex by Income Bracket in Crystal Lakes
The most common earnings brackets in Crystal Lakes are $2,500 to $4,999 for men (57 | 15.4%) and $25,000 to $29,999 for women (63 | 18.1%).
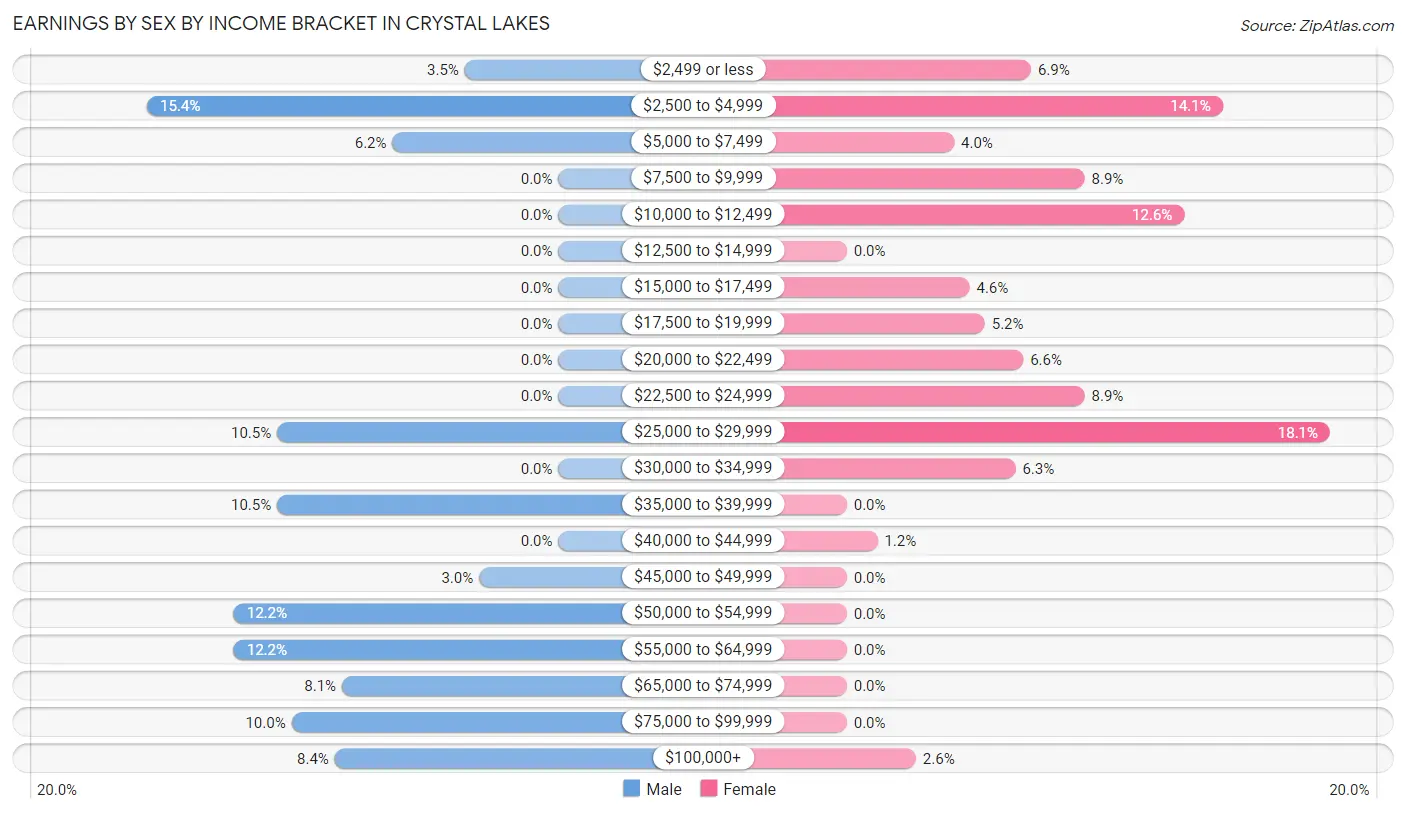
| Income | Male | Female |
| $2,499 or less | 13 (3.5%) | 24 (6.9%) |
| $2,500 to $4,999 | 57 (15.4%) | 49 (14.1%) |
| $5,000 to $7,499 | 23 (6.2%) | 14 (4.0%) |
| $7,500 to $9,999 | 0 (0.0%) | 31 (8.9%) |
| $10,000 to $12,499 | 0 (0.0%) | 44 (12.6%) |
| $12,500 to $14,999 | 0 (0.0%) | 0 (0.0%) |
| $15,000 to $17,499 | 0 (0.0%) | 16 (4.6%) |
| $17,500 to $19,999 | 0 (0.0%) | 18 (5.2%) |
| $20,000 to $22,499 | 0 (0.0%) | 23 (6.6%) |
| $22,500 to $24,999 | 0 (0.0%) | 31 (8.9%) |
| $25,000 to $29,999 | 39 (10.5%) | 63 (18.1%) |
| $30,000 to $34,999 | 0 (0.0%) | 22 (6.3%) |
| $35,000 to $39,999 | 39 (10.5%) | 0 (0.0%) |
| $40,000 to $44,999 | 0 (0.0%) | 4 (1.1%) |
| $45,000 to $49,999 | 11 (3.0%) | 0 (0.0%) |
| $50,000 to $54,999 | 45 (12.2%) | 0 (0.0%) |
| $55,000 to $64,999 | 45 (12.2%) | 0 (0.0%) |
| $65,000 to $74,999 | 30 (8.1%) | 0 (0.0%) |
| $75,000 to $99,999 | 37 (10.0%) | 0 (0.0%) |
| $100,000+ | 31 (8.4%) | 9 (2.6%) |
| Total | 370 (100.0%) | 348 (100.0%) |
Earnings by Sex by Educational Attainment in Crystal Lakes
Average earnings in Crystal Lakes are $54,083 for men and $23,992 for women, a difference of 55.6%. Men with an educational attainment of high school diploma enjoy the highest average annual earnings of $54,333, while those with high school diploma education earn the least with $54,333. Women with an educational attainment of less than high school earn the most with the average annual earnings of $27,577, while those with high school diploma education have the smallest earnings of $19,167.
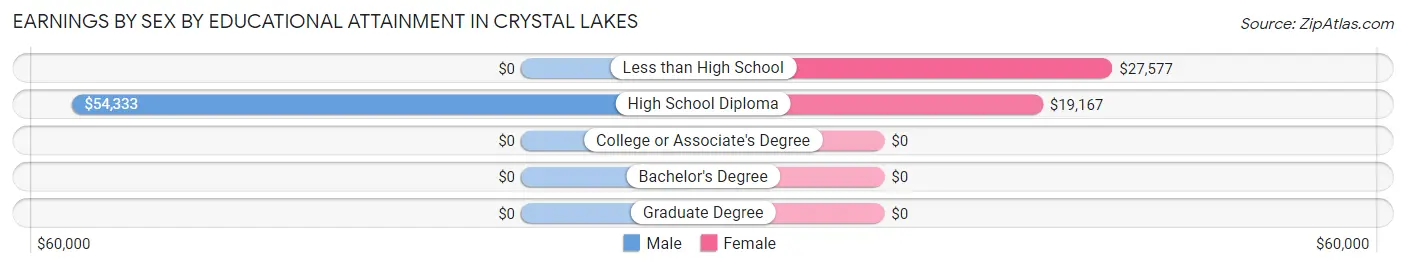
| Educational Attainment | Male Income | Female Income |
| Less than High School | - | - |
| High School Diploma | $54,333 | $19,167 |
| College or Associate's Degree | - | - |
| Bachelor's Degree | - | - |
| Graduate Degree | - | - |
| Total | $54,083 | $23,992 |
Family Income in Crystal Lakes
Family Income Brackets in Crystal Lakes
According to the Crystal Lakes family income data, there are 103 families falling into the $50,000 to $74,999 income range, which is the most common income bracket and makes up 23.2% of all families.
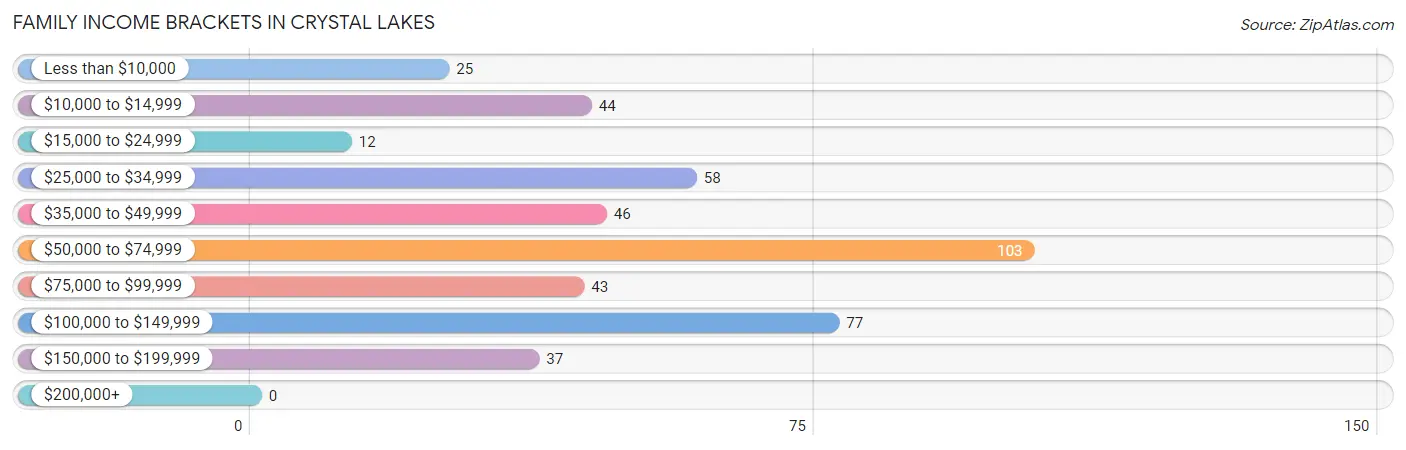
| Income Bracket | # Families | % Families |
| Less than $10,000 | 25 | 5.6% |
| $10,000 to $14,999 | 44 | 9.9% |
| $15,000 to $24,999 | 12 | 2.7% |
| $25,000 to $34,999 | 58 | 13.0% |
| $35,000 to $49,999 | 46 | 10.3% |
| $50,000 to $74,999 | 103 | 23.1% |
| $75,000 to $99,999 | 43 | 9.7% |
| $100,000 to $149,999 | 77 | 17.3% |
| $150,000 to $199,999 | 37 | 8.3% |
| $200,000+ | 0 | 0.0% |
Family Income by Famaliy Size in Crystal Lakes
3-person families (80 | 18.0%) account for the highest median family income in Crystal Lakes with $94,333 per family, while 3-person families (80 | 18.0%) have the highest median income of $31,444 per family member.
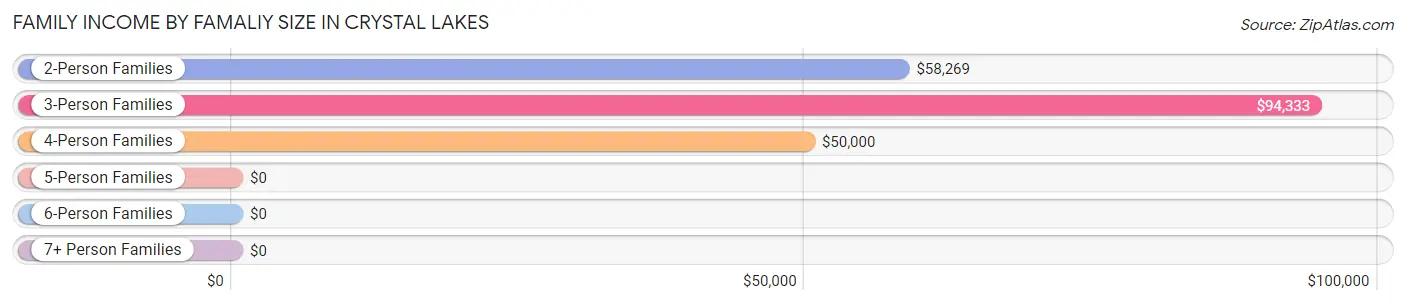
| Income Bracket | # Families | Median Income |
| 2-Person Families | 196 (44.0%) | $58,269 |
| 3-Person Families | 80 (18.0%) | $94,333 |
| 4-Person Families | 96 (21.6%) | $50,000 |
| 5-Person Families | 35 (7.9%) | $0 |
| 6-Person Families | 38 (8.5%) | $0 |
| 7+ Person Families | 0 (0.0%) | $0 |
| Total | 445 (100.0%) | $59,006 |
Family Income by Number of Earners in Crystal Lakes
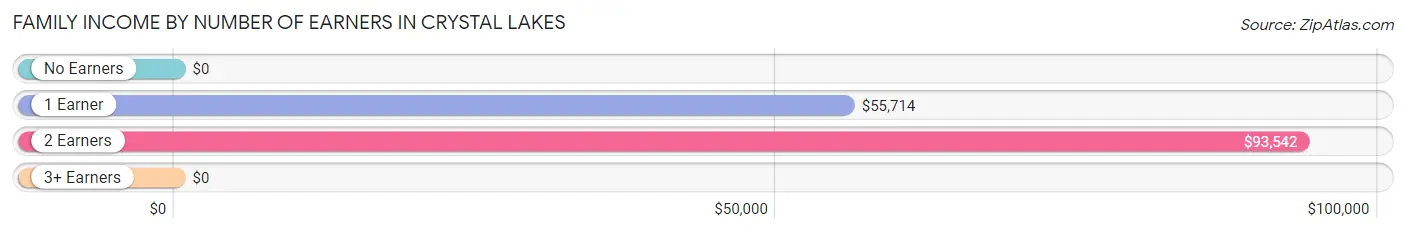
| Number of Earners | # Families | Median Income |
| No Earners | 75 (16.9%) | $0 |
| 1 Earner | 210 (47.2%) | $55,714 |
| 2 Earners | 107 (24.0%) | $93,542 |
| 3+ Earners | 53 (11.9%) | $0 |
| Total | 445 (100.0%) | $59,006 |
Household Income in Crystal Lakes
Household Income Brackets in Crystal Lakes
With 103 households falling in the category, the $25,000 to $34,999 income range is the most frequent in Crystal Lakes, accounting for 17.7% of all households. In contrast, only 12 households (2.1%) fall into the $200,000+ income bracket, making it the least populous group.
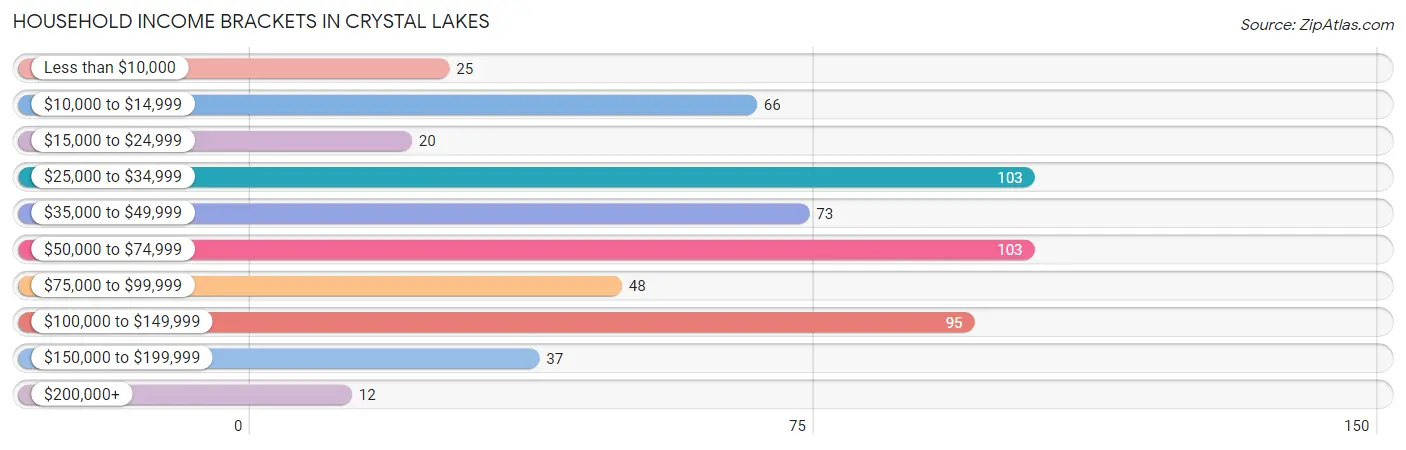
| Income Bracket | # Households | % Households |
| Less than $10,000 | 25 | 4.3% |
| $10,000 to $14,999 | 66 | 11.3% |
| $15,000 to $24,999 | 20 | 3.4% |
| $25,000 to $34,999 | 103 | 17.7% |
| $35,000 to $49,999 | 73 | 12.5% |
| $50,000 to $74,999 | 103 | 17.7% |
| $75,000 to $99,999 | 48 | 8.2% |
| $100,000 to $149,999 | 95 | 16.3% |
| $150,000 to $199,999 | 37 | 6.4% |
| $200,000+ | 12 | 2.1% |
Household Income by Householder Age in Crystal Lakes
The median household income in Crystal Lakes is $55,714, with the highest median household income of $93,083 found in the 25 to 44 years age bracket for the primary householder. A total of 134 households (23.0%) fall into this category. Meanwhile, the 15 to 24 years age bracket for the primary householder has the lowest median household income of $0, with 99 households (17.0%) in this group.
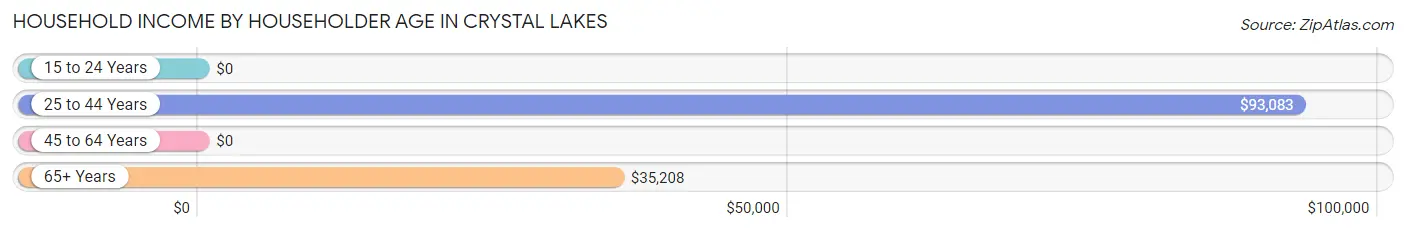
| Income Bracket | # Households | Median Income |
| 15 to 24 Years | 99 (17.0%) | $0 |
| 25 to 44 Years | 134 (23.0%) | $93,083 |
| 45 to 64 Years | 222 (38.1%) | $0 |
| 65+ Years | 127 (21.8%) | $35,208 |
| Total | 582 (100.0%) | $55,714 |
Poverty in Crystal Lakes
Income Below Poverty by Sex and Age in Crystal Lakes
With 12.1% poverty level for males and 34.6% for females among the residents of Crystal Lakes, 16 and 17 year old males and 12 to 14 year old females are the most vulnerable to poverty, with 23 males (54.8%) and 61 females (70.1%) in their respective age groups living below the poverty level.
| Age Bracket | Male | Female |
| Under 5 Years | 0 (0.0%) | 0 (0.0%) |
| 5 Years | 0 (0.0%) | 0 (0.0%) |
| 6 to 11 Years | 0 (0.0%) | 33 (21.8%) |
| 12 to 14 Years | 0 (0.0%) | 61 (70.1%) |
| 15 Years | 0 (0.0%) | 8 (17.4%) |
| 16 and 17 Years | 23 (54.8%) | 12 (41.4%) |
| 18 to 24 Years | 38 (34.9%) | 81 (58.7%) |
| 25 to 34 Years | 0 (0.0%) | 0 (0.0%) |
| 35 to 44 Years | 0 (0.0%) | 12 (9.5%) |
| 45 to 54 Years | 0 (0.0%) | 88 (55.0%) |
| 55 to 64 Years | 13 (38.2%) | 30 (37.5%) |
| 65 to 74 Years | 5 (4.4%) | 5 (5.0%) |
| 75 Years and over | 0 (0.0%) | 0 (0.0%) |
| Total | 79 (12.1%) | 330 (34.6%) |
Income Above Poverty by Sex and Age in Crystal Lakes
According to the poverty statistics in Crystal Lakes, males aged under 5 years and females aged under 5 years are the age groups that are most secure financially, with 100.0% of males and 100.0% of females in these age groups living above the poverty line.
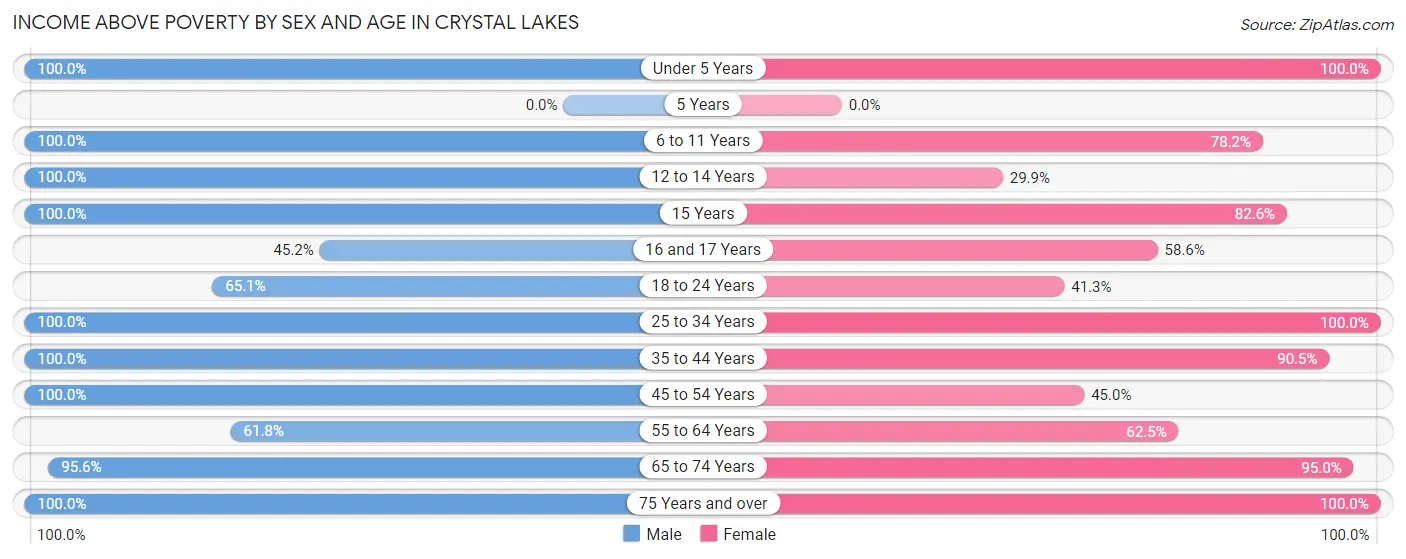
| Age Bracket | Male | Female |
| Under 5 Years | 41 (100.0%) | 8 (100.0%) |
| 5 Years | 0 (0.0%) | 0 (0.0%) |
| 6 to 11 Years | 17 (100.0%) | 118 (78.1%) |
| 12 to 14 Years | 17 (100.0%) | 26 (29.9%) |
| 15 Years | 29 (100.0%) | 38 (82.6%) |
| 16 and 17 Years | 19 (45.2%) | 17 (58.6%) |
| 18 to 24 Years | 71 (65.1%) | 57 (41.3%) |
| 25 to 34 Years | 29 (100.0%) | 8 (100.0%) |
| 35 to 44 Years | 101 (100.0%) | 114 (90.5%) |
| 45 to 54 Years | 107 (100.0%) | 72 (45.0%) |
| 55 to 64 Years | 21 (61.8%) | 50 (62.5%) |
| 65 to 74 Years | 108 (95.6%) | 95 (95.0%) |
| 75 Years and over | 13 (100.0%) | 20 (100.0%) |
| Total | 573 (87.9%) | 623 (65.4%) |
Income Below Poverty Among Married-Couple Families in Crystal Lakes
The poverty statistics for married-couple families in Crystal Lakes show that 4.7% or 13 of the total 276 families live below the poverty line. Families with no children have the highest poverty rate of 12.3%, comprising of 13 families. On the other hand, families with 1 or 2 children have the lowest poverty rate of 0.0%, which includes 0 families.
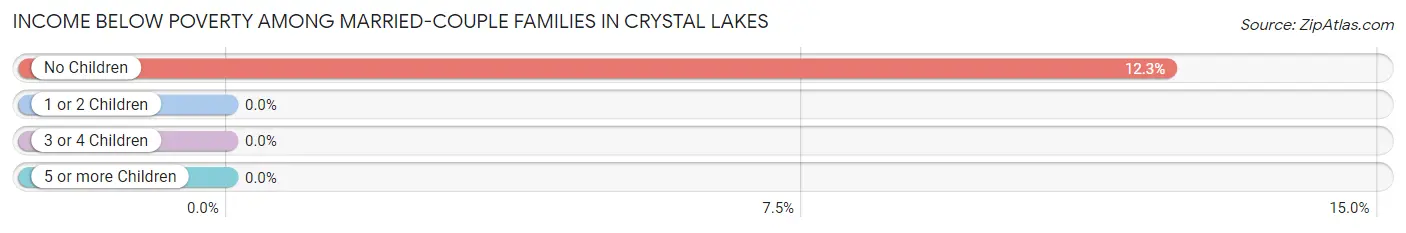
| Children | Above Poverty | Below Poverty |
| No Children | 93 (87.7%) | 13 (12.3%) |
| 1 or 2 Children | 144 (100.0%) | 0 (0.0%) |
| 3 or 4 Children | 26 (100.0%) | 0 (0.0%) |
| 5 or more Children | 0 (0.0%) | 0 (0.0%) |
| Total | 263 (95.3%) | 13 (4.7%) |
Income Below Poverty Among Single-Parent Households in Crystal Lakes
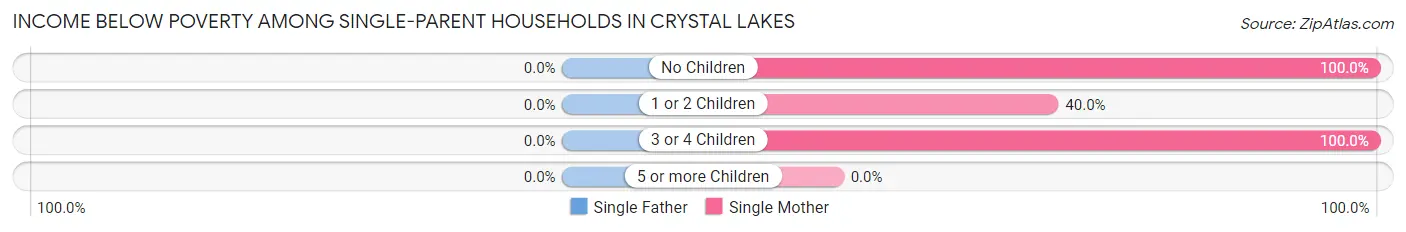
| Children | Single Father | Single Mother |
| No Children | 0 (0.0%) | 44 (100.0%) |
| 1 or 2 Children | 0 (0.0%) | 12 (40.0%) |
| 3 or 4 Children | 0 (0.0%) | 33 (100.0%) |
| 5 or more Children | 0 (0.0%) | 0 (0.0%) |
| Total | 0 (0.0%) | 89 (83.2%) |
Income Below Poverty Among Married-Couple vs Single-Parent Households in Crystal Lakes
The poverty data for Crystal Lakes shows that 13 of the married-couple family households (4.7%) and 89 of the single-parent households (52.7%) are living below the poverty level. Within the married-couple family households, those with no children have the highest poverty rate, with 13 households (12.3%) falling below the poverty line. Among the single-parent households, those with 3 or 4 children have the highest poverty rate, with 33 household (100.0%) living below poverty.
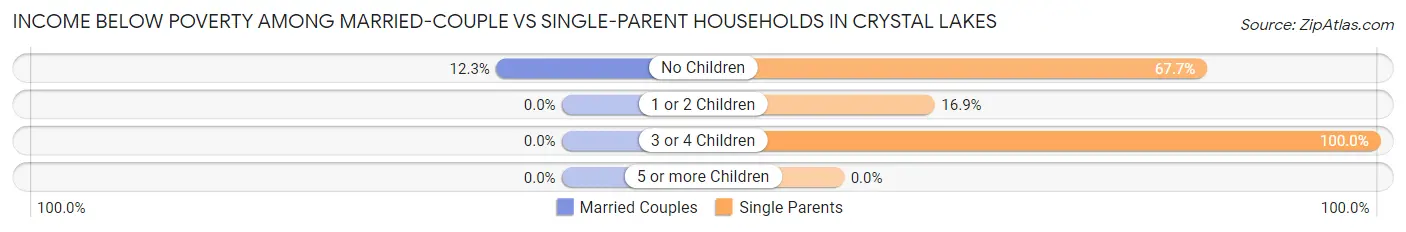
| Children | Married-Couple Families | Single-Parent Households |
| No Children | 13 (12.3%) | 44 (67.7%) |
| 1 or 2 Children | 0 (0.0%) | 12 (16.9%) |
| 3 or 4 Children | 0 (0.0%) | 33 (100.0%) |
| 5 or more Children | 0 (0.0%) | 0 (0.0%) |
| Total | 13 (4.7%) | 89 (52.7%) |
Race in Crystal Lakes
The most populous races in Crystal Lakes are White / Caucasian (1,376 | 85.7%), Hispanic or Latino (238 | 14.8%), and Some other Race (139 | 8.7%).
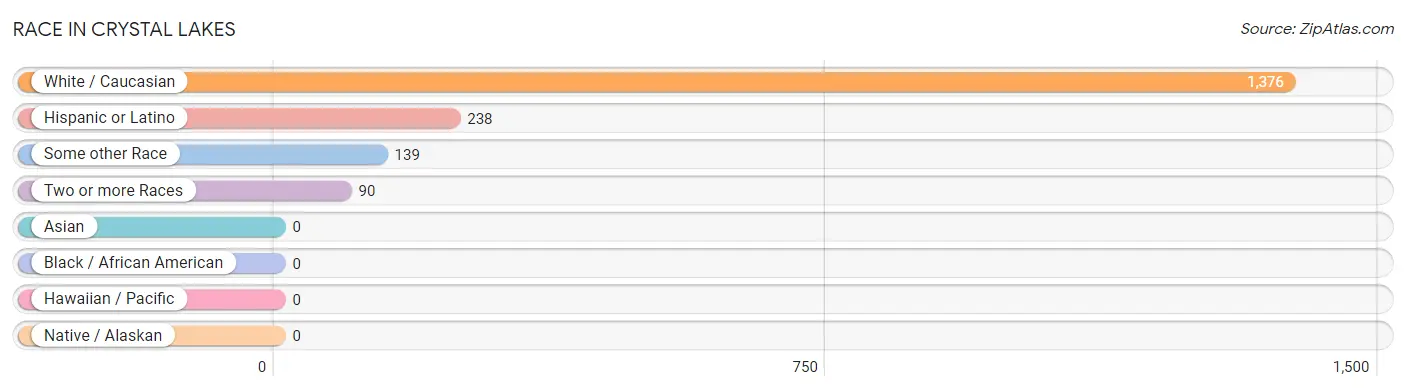
| Race | # Population | % Population |
| Asian | 0 | 0.0% |
| Black / African American | 0 | 0.0% |
| Hawaiian / Pacific | 0 | 0.0% |
| Hispanic or Latino | 238 | 14.8% |
| Native / Alaskan | 0 | 0.0% |
| White / Caucasian | 1,376 | 85.7% |
| Two or more Races | 90 | 5.6% |
| Some other Race | 139 | 8.7% |
| Total | 1,605 | 100.0% |
Ancestry in Crystal Lakes
The most populous ancestries reported in Crystal Lakes are German (250 | 15.6%), Mexican (221 | 13.8%), Irish (96 | 6.0%), English (60 | 3.7%), and French (60 | 3.7%), together accounting for 42.8% of all Crystal Lakes residents.
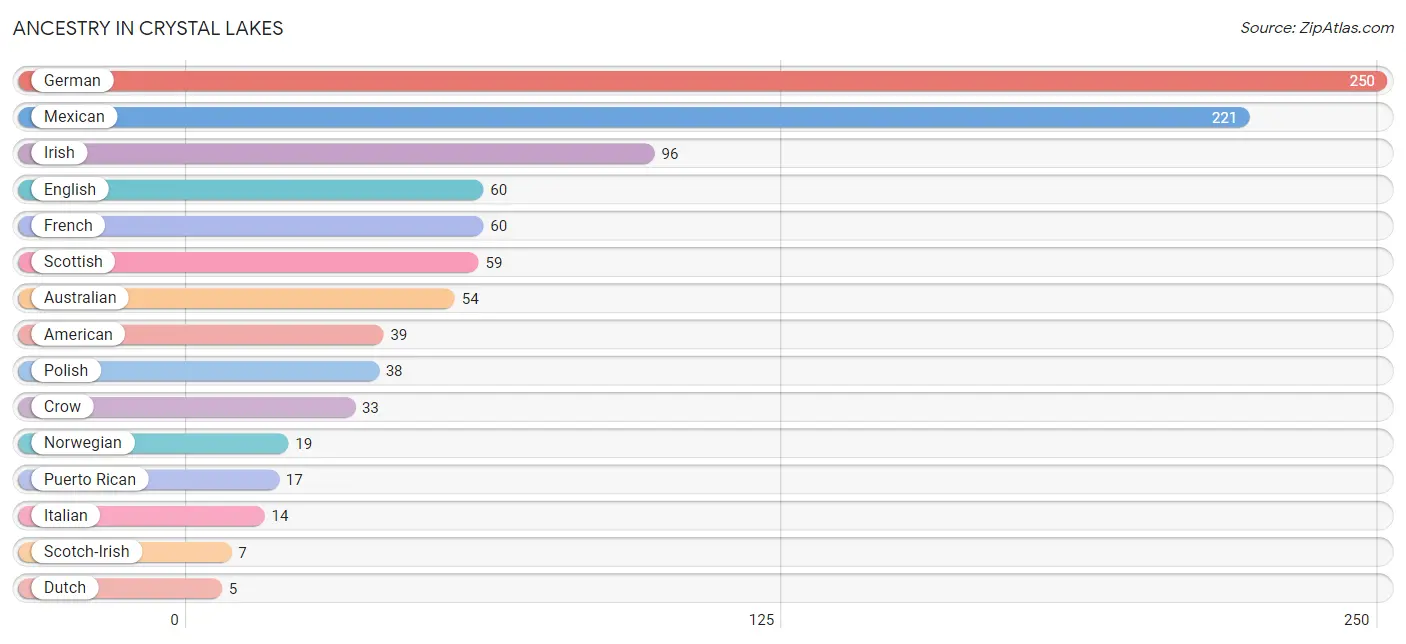
| Ancestry | # Population | % Population |
| American | 39 | 2.4% |
| Australian | 54 | 3.4% |
| Crow | 33 | 2.1% |
| Dutch | 5 | 0.3% |
| English | 60 | 3.7% |
| French | 60 | 3.7% |
| German | 250 | 15.6% |
| Irish | 96 | 6.0% |
| Italian | 14 | 0.9% |
| Mexican | 221 | 13.8% |
| Norwegian | 19 | 1.2% |
| Polish | 38 | 2.4% |
| Puerto Rican | 17 | 1.1% |
| Scotch-Irish | 7 | 0.4% |
| Scottish | 59 | 3.7% | View All 15 Rows |
Immigrants in Crystal Lakes
The most numerous immigrant groups reported in Crystal Lakes came from Chile (10 | 0.6%), Latin America (10 | 0.6%), and South America (10 | 0.6%), together accounting for 1.9% of all Crystal Lakes residents.
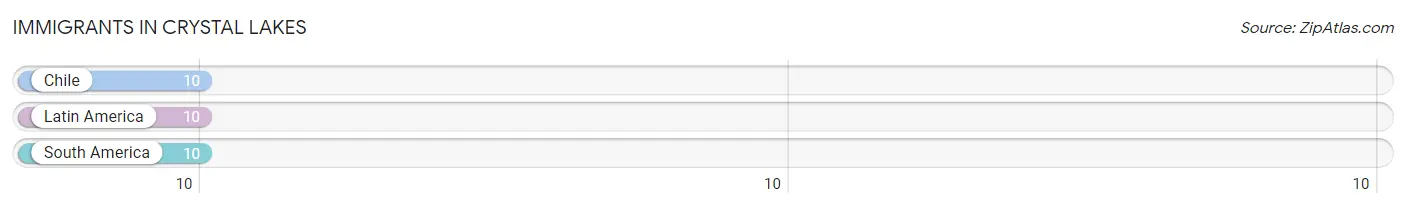
| Immigration Origin | # Population | % Population |
| Chile | 10 | 0.6% |
| Latin America | 10 | 0.6% |
| South America | 10 | 0.6% | View All 3 Rows |
Sex and Age in Crystal Lakes
Sex and Age in Crystal Lakes
The most populous age groups in Crystal Lakes are 20 to 24 Years (92 | 14.1%) for men and 10 to 14 Years (213 | 22.4%) for women.
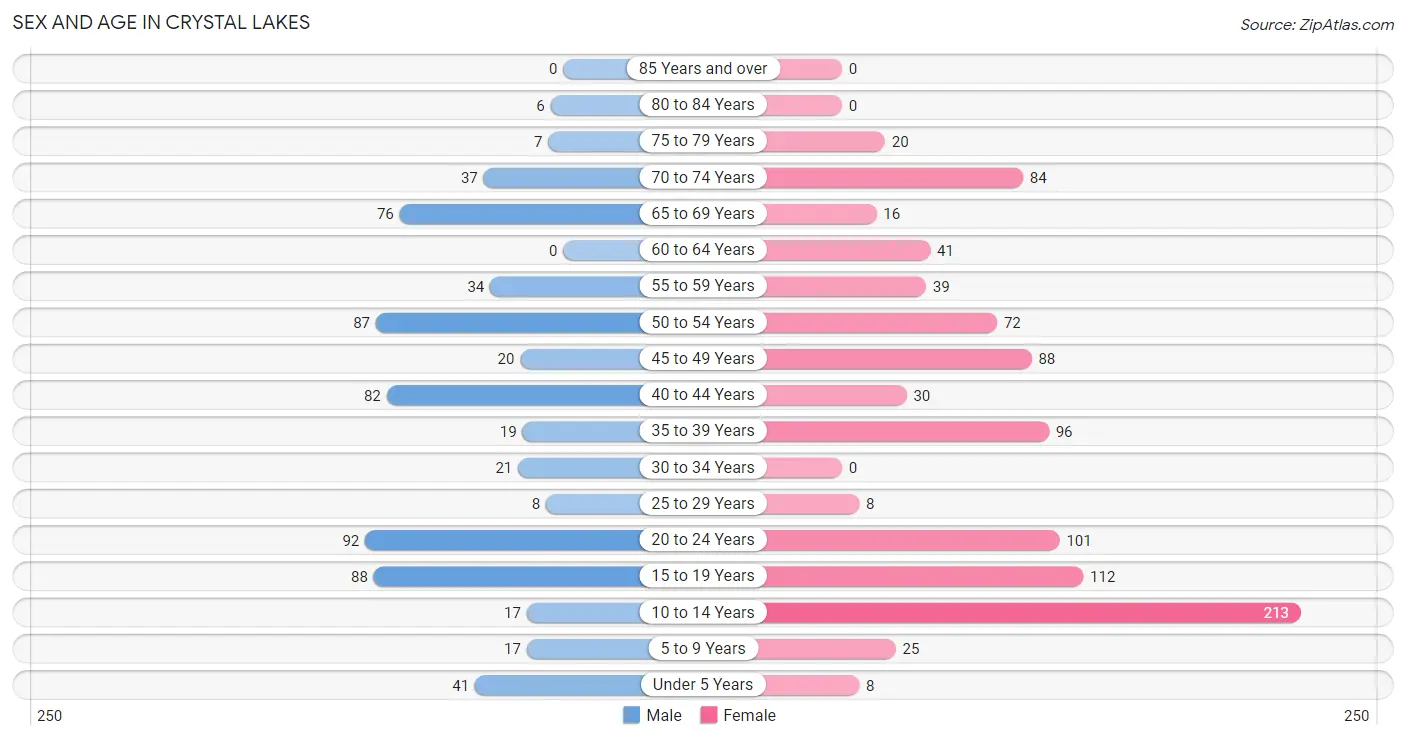
| Age Bracket | Male | Female |
| Under 5 Years | 41 (6.3%) | 8 (0.8%) |
| 5 to 9 Years | 17 (2.6%) | 25 (2.6%) |
| 10 to 14 Years | 17 (2.6%) | 213 (22.4%) |
| 15 to 19 Years | 88 (13.5%) | 112 (11.7%) |
| 20 to 24 Years | 92 (14.1%) | 101 (10.6%) |
| 25 to 29 Years | 8 (1.2%) | 8 (0.8%) |
| 30 to 34 Years | 21 (3.2%) | 0 (0.0%) |
| 35 to 39 Years | 19 (2.9%) | 96 (10.1%) |
| 40 to 44 Years | 82 (12.6%) | 30 (3.2%) |
| 45 to 49 Years | 20 (3.1%) | 88 (9.2%) |
| 50 to 54 Years | 87 (13.3%) | 72 (7.6%) |
| 55 to 59 Years | 34 (5.2%) | 39 (4.1%) |
| 60 to 64 Years | 0 (0.0%) | 41 (4.3%) |
| 65 to 69 Years | 76 (11.7%) | 16 (1.7%) |
| 70 to 74 Years | 37 (5.7%) | 84 (8.8%) |
| 75 to 79 Years | 7 (1.1%) | 20 (2.1%) |
| 80 to 84 Years | 6 (0.9%) | 0 (0.0%) |
| 85 Years and over | 0 (0.0%) | 0 (0.0%) |
| Total | 652 (100.0%) | 953 (100.0%) |
Families and Households in Crystal Lakes
Median Family Size in Crystal Lakes
The median family size in Crystal Lakes is 3.15 persons per family, with single female/mother families (107 | 24.0%) accounting for the largest median family size of 3.5 persons per family. On the other hand, single male/father families (62 | 13.9%) represent the smallest median family size with 1.89 persons per family.
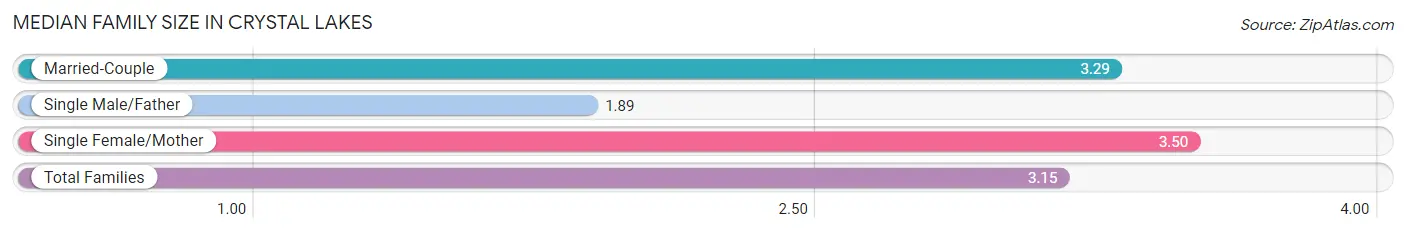
| Family Type | # Families | Family Size |
| Married-Couple | 276 (62.0%) | 3.29 |
| Single Male/Father | 62 (13.9%) | 1.89 |
| Single Female/Mother | 107 (24.0%) | 3.50 |
| Total Families | 445 (100.0%) | 3.15 |
Median Household Size in Crystal Lakes
The median household size in Crystal Lakes is 2.76 persons per household, with single female/mother households (107 | 18.4%) accounting for the largest median household size of 3.68 persons per household. non-family households (137 | 23.5%) represent the smallest median household size with 1.19 persons per household.
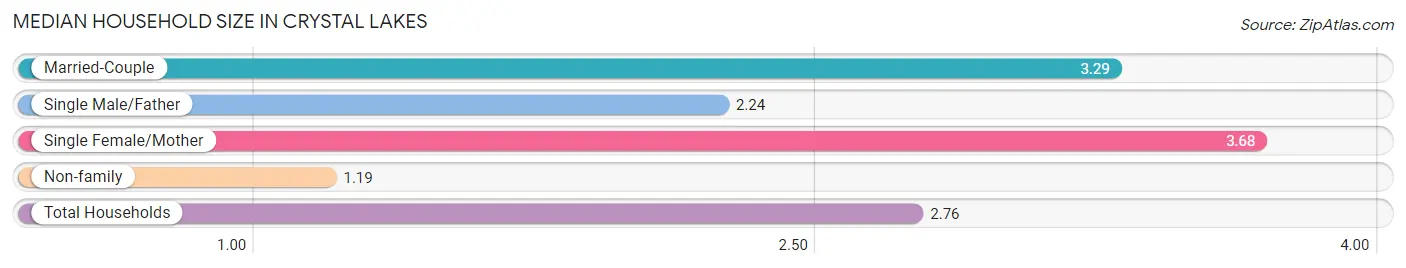
| Household Type | # Households | Household Size |
| Married-Couple | 276 (47.4%) | 3.29 |
| Single Male/Father | 62 (10.6%) | 2.24 |
| Single Female/Mother | 107 (18.4%) | 3.68 |
| Non-family | 137 (23.5%) | 1.19 |
| Total Households | 582 (100.0%) | 2.76 |
Household Size by Marriage Status in Crystal Lakes
Out of a total of 582 households in Crystal Lakes, 445 (76.5%) are family households, while 137 (23.5%) are nonfamily households. The most numerous type of family households are 2-person households, comprising 166, and the most common type of nonfamily households are 1-person households, comprising 115.
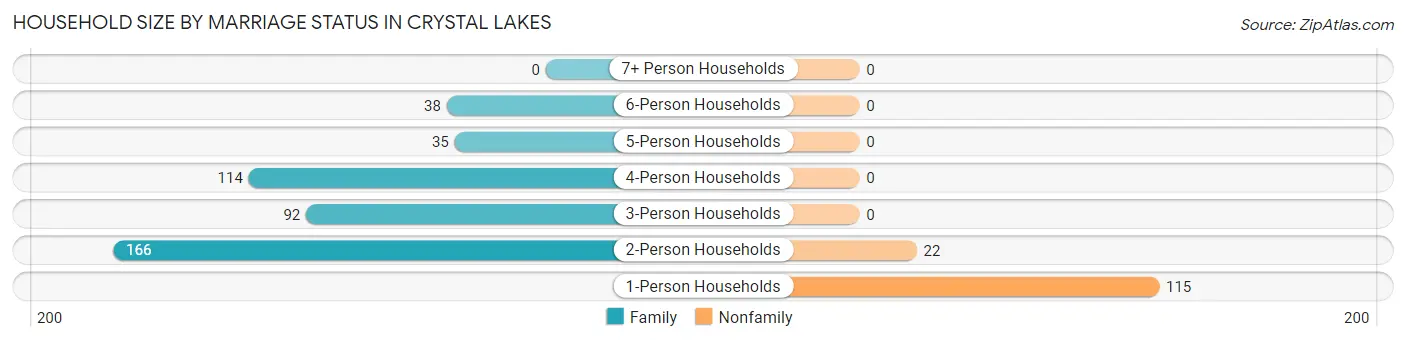
| Household Size | Family Households | Nonfamily Households |
| 1-Person Households | - | 115 (19.8%) |
| 2-Person Households | 166 (28.5%) | 22 (3.8%) |
| 3-Person Households | 92 (15.8%) | 0 (0.0%) |
| 4-Person Households | 114 (19.6%) | 0 (0.0%) |
| 5-Person Households | 35 (6.0%) | 0 (0.0%) |
| 6-Person Households | 38 (6.5%) | 0 (0.0%) |
| 7+ Person Households | 0 (0.0%) | 0 (0.0%) |
| Total | 445 (76.5%) | 137 (23.5%) |
Female Fertility in Crystal Lakes
Fertility by Age in Crystal Lakes
| Age Bracket | Women with Births | Births / 1,000 Women |
| 15 to 19 years | 0 (0.0%) | 0.0 |
| 20 to 34 years | 0 (0.0%) | 0.0 |
| 35 to 50 years | 0 (0.0%) | 0.0 |
| Total | 0 (0.0%) | 0.0 |
Fertility by Age by Marriage Status in Crystal Lakes
| Age Bracket | Married | Unmarried |
| 15 to 19 years | 0 (0.0%) | 0 (0.0%) |
| 20 to 34 years | 0 (0.0%) | 0 (0.0%) |
| 35 to 50 years | 0 (0.0%) | 0 (0.0%) |
| Total | 0 (0.0%) | 0 (0.0%) |
Fertility by Education in Crystal Lakes
| Educational Attainment | Women with Births | Births / 1,000 Women |
| Less than High School | 0 (0.0%) | 0.0 |
| High School Diploma | 0 (0.0%) | 0.0 |
| College or Associate's Degree | 0 (0.0%) | 0.0 |
| Bachelor's Degree | 0 (0.0%) | 0.0 |
| Graduate Degree | 0 (0.0%) | 0.0 |
| Total | 0 (0.0%) | 0.0 |
Fertility by Education by Marriage Status in Crystal Lakes
| Educational Attainment | Married | Unmarried |
| Less than High School | 0 (0.0%) | 0 (0.0%) |
| High School Diploma | 0 (0.0%) | 0 (0.0%) |
| College or Associate's Degree | 0 (0.0%) | 0 (0.0%) |
| Bachelor's Degree | 0 (0.0%) | 0 (0.0%) |
| Graduate Degree | 0 (0.0%) | 0 (0.0%) |
| Total | 0 (0.0%) | 0 (0.0%) |
Employment Characteristics in Crystal Lakes
Employment by Class of Employer in Crystal Lakes
Among the 597 employed individuals in Crystal Lakes, private company employees (527 | 88.3%), local government employees (39 | 6.5%), and self-employed (incorporated) (19 | 3.2%) make up the most common classes of employment.
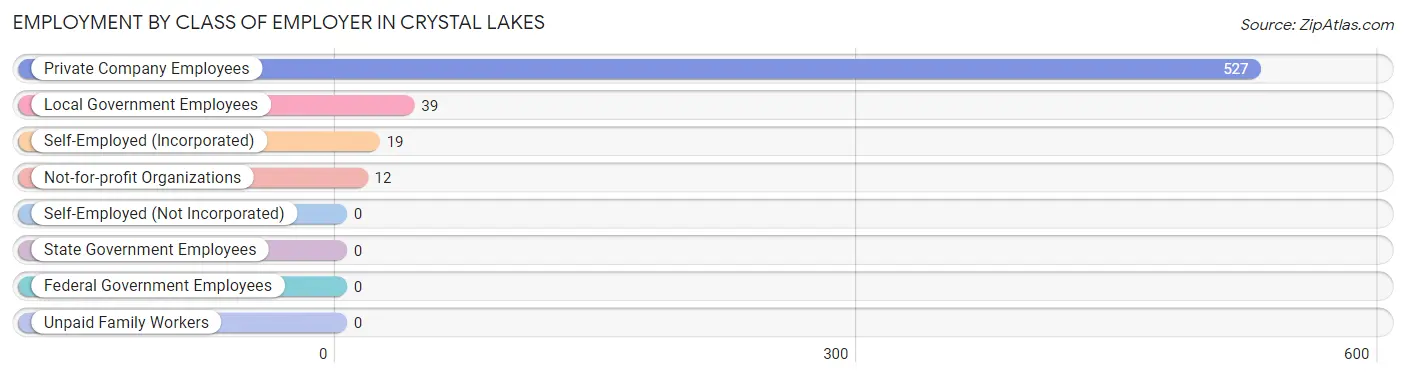
| Employer Class | # Employees | % Employees |
| Private Company Employees | 527 | 88.3% |
| Self-Employed (Incorporated) | 19 | 3.2% |
| Self-Employed (Not Incorporated) | 0 | 0.0% |
| Not-for-profit Organizations | 12 | 2.0% |
| Local Government Employees | 39 | 6.5% |
| State Government Employees | 0 | 0.0% |
| Federal Government Employees | 0 | 0.0% |
| Unpaid Family Workers | 0 | 0.0% |
| Total | 597 | 100.0% |
Employment Status by Age in Crystal Lakes
According to the labor force statistics for Crystal Lakes, out of the total population over 16 years of age (1,209), 54.8% or 663 individuals are in the labor force, with 9.8% or 65 of them unemployed. The age group with the highest labor force participation rate is 25 to 29 years, with 100.0% or 16 individuals in the labor force. Within the labor force, the 16 to 19 years age range has the highest percentage of unemployed individuals, with 67.2% or 39 of them being unemployed.
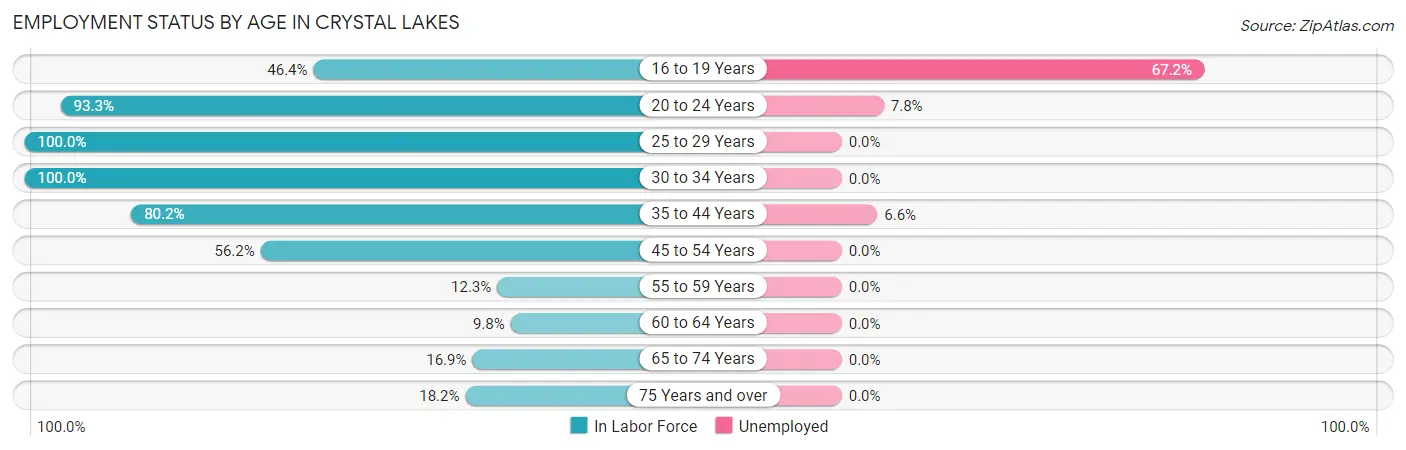
| Age Bracket | In Labor Force | Unemployed |
| 16 to 19 Years | 58 (46.4%) | 39 (67.2%) |
| 20 to 24 Years | 180 (93.3%) | 14 (7.8%) |
| 25 to 29 Years | 16 (100.0%) | 0 (0.0%) |
| 30 to 34 Years | 21 (100.0%) | 0 (0.0%) |
| 35 to 44 Years | 182 (80.2%) | 12 (6.6%) |
| 45 to 54 Years | 150 (56.2%) | 0 (0.0%) |
| 55 to 59 Years | 9 (12.3%) | 0 (0.0%) |
| 60 to 64 Years | 4 (9.8%) | 0 (0.0%) |
| 65 to 74 Years | 36 (16.9%) | 0 (0.0%) |
| 75 Years and over | 6 (18.2%) | 0 (0.0%) |
| Total | 663 (54.8%) | 65 (9.8%) |
Employment Status by Educational Attainment in Crystal Lakes
According to labor force statistics for Crystal Lakes, 59.2% of individuals (382) out of the total population between 25 and 64 years of age (645) are in the labor force, with 3.1% or 12 of them being unemployed. The group with the highest labor force participation rate are those with the educational attainment of high school diploma, with 75.5% or 200 individuals in the labor force. Within the labor force, individuals with college / associate degree education have the highest percentage of unemployment, with 16.0% or 12 of them being unemployed.
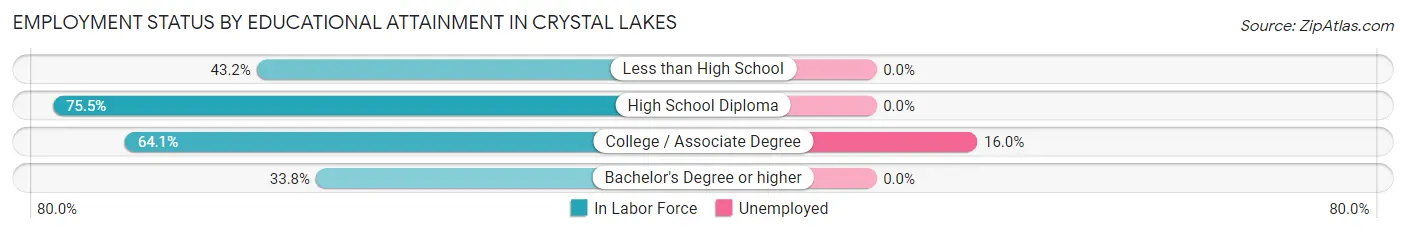
| Educational Attainment | In Labor Force | Unemployed |
| Less than High School | 83 (43.2%) | 0 (0.0%) |
| High School Diploma | 200 (75.5%) | 0 (0.0%) |
| College / Associate Degree | 75 (64.1%) | 19 (16.0%) |
| Bachelor's Degree or higher | 24 (33.8%) | 0 (0.0%) |
| Total | 382 (59.2%) | 20 (3.1%) |
Employment Occupations by Sex in Crystal Lakes
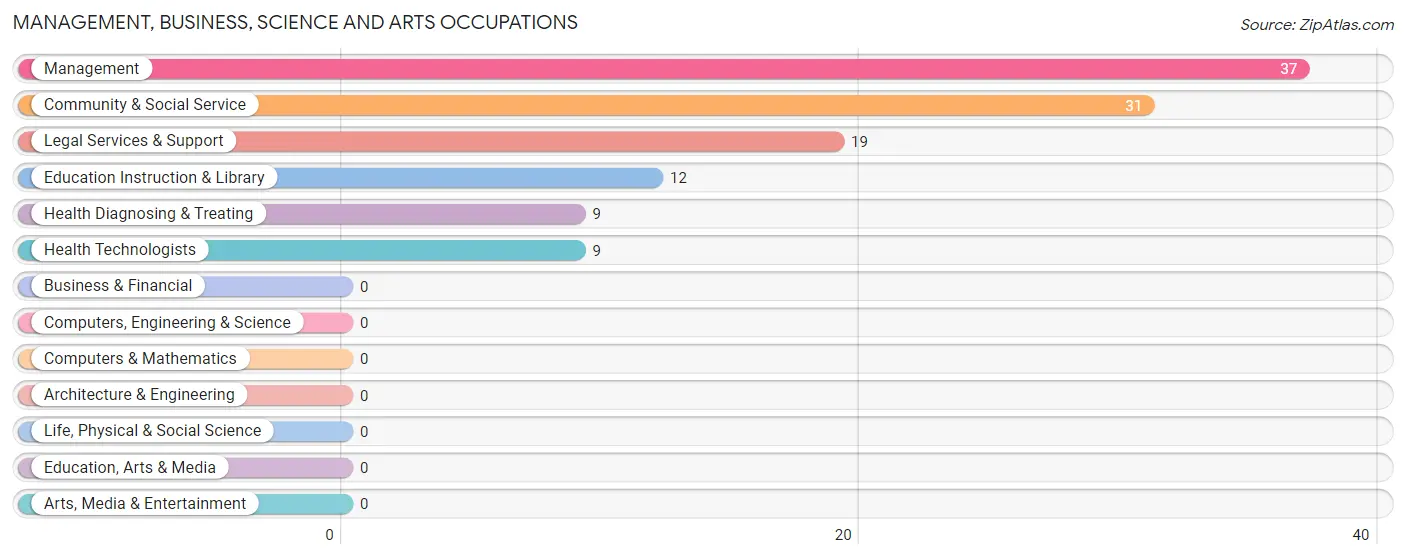
Management, Business, Science and Arts Occupations
The most common Management, Business, Science and Arts occupations in Crystal Lakes are Management (37 | 6.2%), Community & Social Service (31 | 5.2%), Legal Services & Support (19 | 3.2%), Education Instruction & Library (12 | 2.0%), and Health Diagnosing & Treating (9 | 1.5%).
Management, Business, Science and Arts Occupations by Sex
Within the Management, Business, Science and Arts occupations in Crystal Lakes, the most male-oriented occupations are Management (100.0%), Legal Services & Support (100.0%), and Community & Social Service (61.3%), while the most female-oriented occupations are Education Instruction & Library (100.0%), Health Diagnosing & Treating (100.0%), and Health Technologists (100.0%).
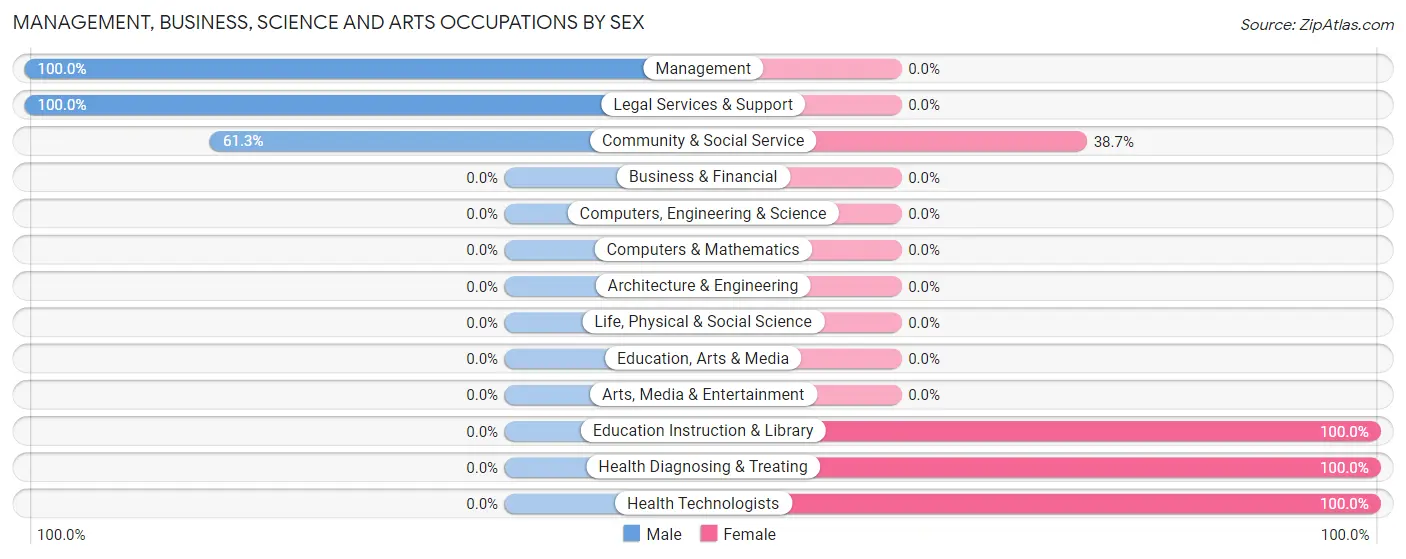
| Occupation | Male | Female |
| Management | 37 (100.0%) | 0 (0.0%) |
| Business & Financial | 0 (0.0%) | 0 (0.0%) |
| Computers, Engineering & Science | 0 (0.0%) | 0 (0.0%) |
| Computers & Mathematics | 0 (0.0%) | 0 (0.0%) |
| Architecture & Engineering | 0 (0.0%) | 0 (0.0%) |
| Life, Physical & Social Science | 0 (0.0%) | 0 (0.0%) |
| Community & Social Service | 19 (61.3%) | 12 (38.7%) |
| Education, Arts & Media | 0 (0.0%) | 0 (0.0%) |
| Legal Services & Support | 19 (100.0%) | 0 (0.0%) |
| Education Instruction & Library | 0 (0.0%) | 12 (100.0%) |
| Arts, Media & Entertainment | 0 (0.0%) | 0 (0.0%) |
| Health Diagnosing & Treating | 0 (0.0%) | 9 (100.0%) |
| Health Technologists | 0 (0.0%) | 9 (100.0%) |
| Total (Category) | 56 (72.7%) | 21 (27.3%) |
| Total (Overall) | 348 (58.3%) | 249 (41.7%) |
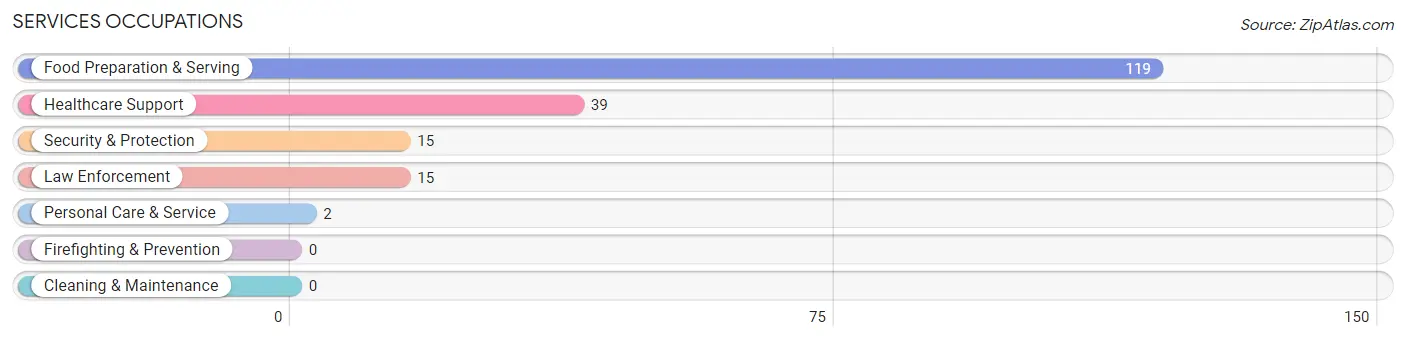
Services Occupations
The most common Services occupations in Crystal Lakes are Food Preparation & Serving (119 | 19.9%), Healthcare Support (39 | 6.5%), Security & Protection (15 | 2.5%), Law Enforcement (15 | 2.5%), and Personal Care & Service (2 | 0.3%).
Services Occupations by Sex
Within the Services occupations in Crystal Lakes, the most male-oriented occupations are Security & Protection (100.0%), Law Enforcement (100.0%), and Food Preparation & Serving (47.9%), while the most female-oriented occupations are Healthcare Support (100.0%), Personal Care & Service (100.0%), and Food Preparation & Serving (52.1%).
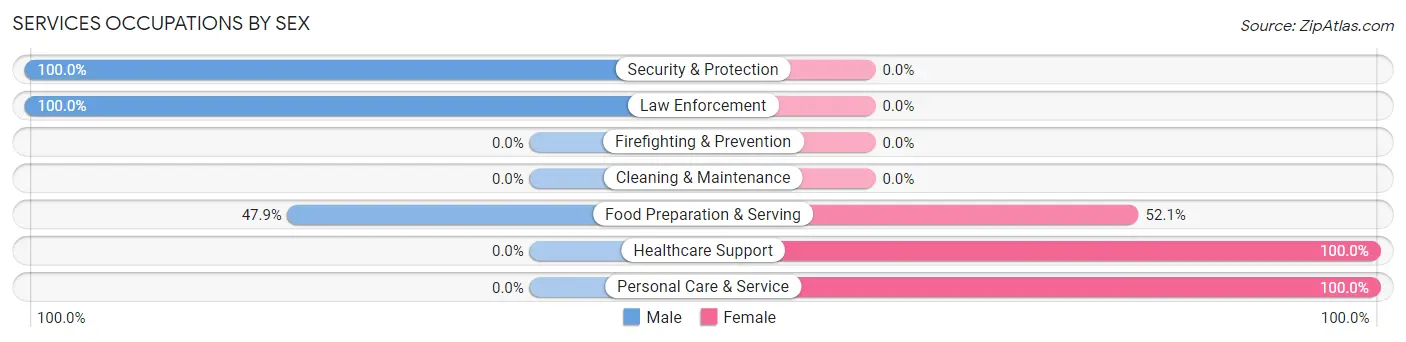
| Occupation | Male | Female |
| Healthcare Support | 0 (0.0%) | 39 (100.0%) |
| Security & Protection | 15 (100.0%) | 0 (0.0%) |
| Firefighting & Prevention | 0 (0.0%) | 0 (0.0%) |
| Law Enforcement | 15 (100.0%) | 0 (0.0%) |
| Food Preparation & Serving | 57 (47.9%) | 62 (52.1%) |
| Cleaning & Maintenance | 0 (0.0%) | 0 (0.0%) |
| Personal Care & Service | 0 (0.0%) | 2 (100.0%) |
| Total (Category) | 72 (41.1%) | 103 (58.9%) |
| Total (Overall) | 348 (58.3%) | 249 (41.7%) |
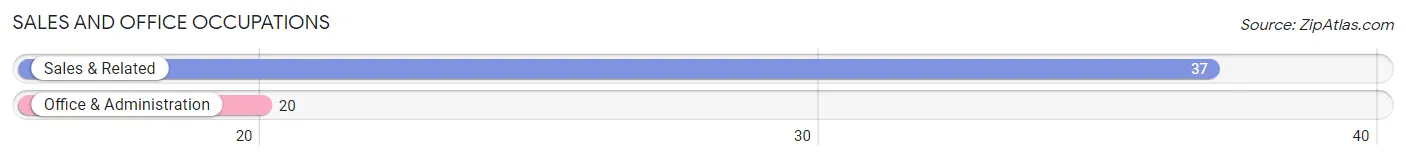
Sales and Office Occupations
The most common Sales and Office occupations in Crystal Lakes are Sales & Related (37 | 6.2%), and Office & Administration (20 | 3.4%).
Sales and Office Occupations by Sex
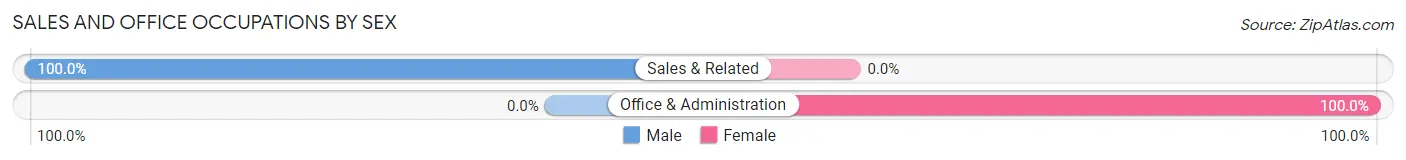
| Occupation | Male | Female |
| Sales & Related | 37 (100.0%) | 0 (0.0%) |
| Office & Administration | 0 (0.0%) | 20 (100.0%) |
| Total (Category) | 37 (64.9%) | 20 (35.1%) |
| Total (Overall) | 348 (58.3%) | 249 (41.7%) |
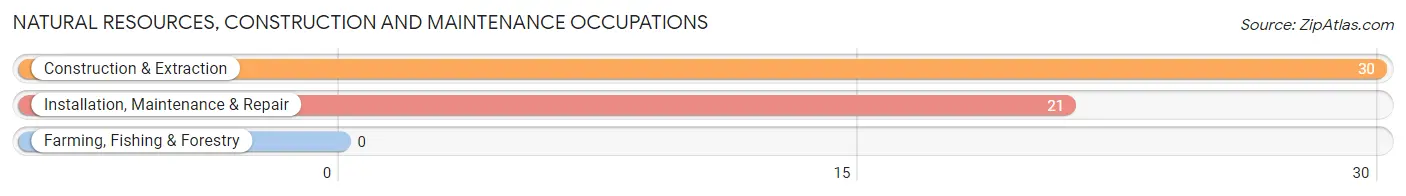
Natural Resources, Construction and Maintenance Occupations
The most common Natural Resources, Construction and Maintenance occupations in Crystal Lakes are Construction & Extraction (30 | 5.0%), and Installation, Maintenance & Repair (21 | 3.5%).
Natural Resources, Construction and Maintenance Occupations by Sex
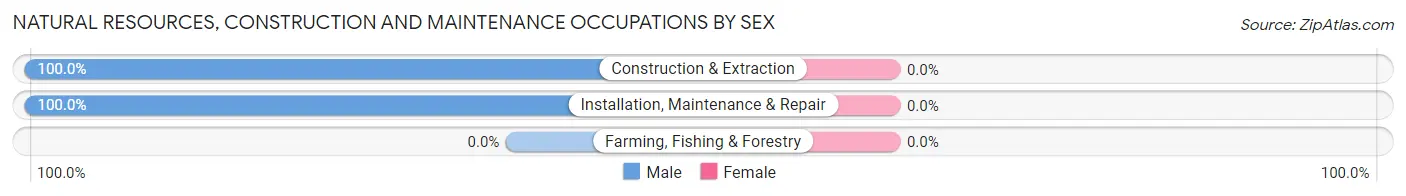
| Occupation | Male | Female |
| Farming, Fishing & Forestry | 0 (0.0%) | 0 (0.0%) |
| Construction & Extraction | 30 (100.0%) | 0 (0.0%) |
| Installation, Maintenance & Repair | 21 (100.0%) | 0 (0.0%) |
| Total (Category) | 51 (100.0%) | 0 (0.0%) |
| Total (Overall) | 348 (58.3%) | 249 (41.7%) |
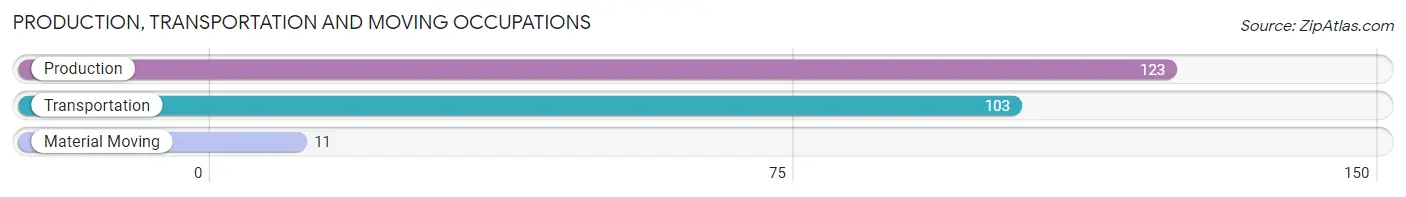
Production, Transportation and Moving Occupations
The most common Production, Transportation and Moving occupations in Crystal Lakes are Production (123 | 20.6%), Transportation (103 | 17.2%), and Material Moving (11 | 1.8%).
Production, Transportation and Moving Occupations by Sex
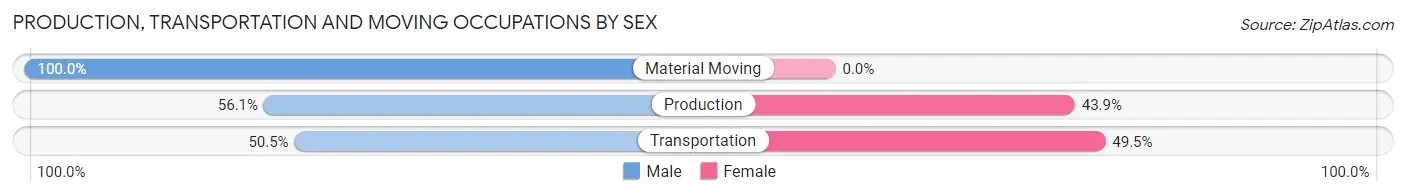
| Occupation | Male | Female |
| Production | 69 (56.1%) | 54 (43.9%) |
| Transportation | 52 (50.5%) | 51 (49.5%) |
| Material Moving | 11 (100.0%) | 0 (0.0%) |
| Total (Category) | 132 (55.7%) | 105 (44.3%) |
| Total (Overall) | 348 (58.3%) | 249 (41.7%) |
Employment Industries by Sex in Crystal Lakes
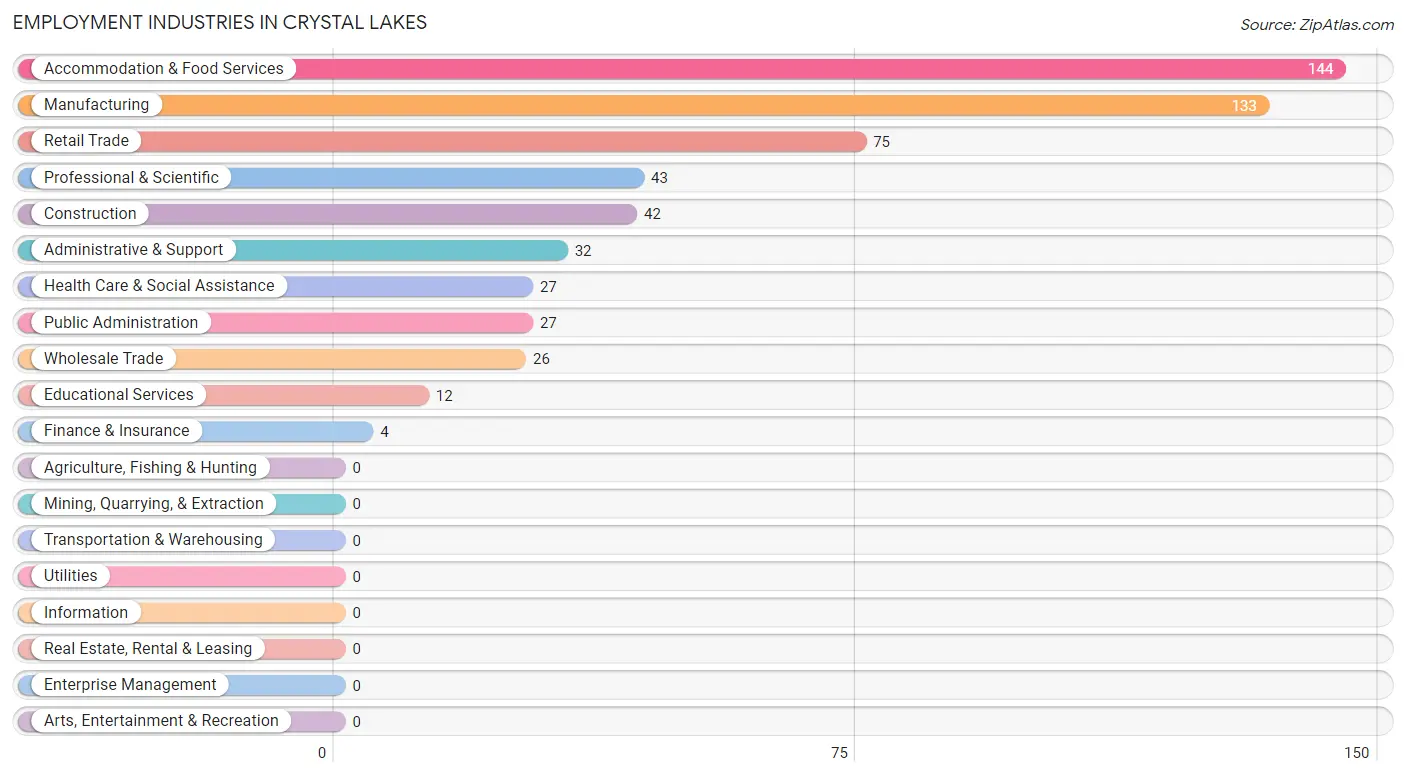
Employment Industries in Crystal Lakes
The major employment industries in Crystal Lakes include Accommodation & Food Services (144 | 24.1%), Manufacturing (133 | 22.3%), Retail Trade (75 | 12.6%), Professional & Scientific (43 | 7.2%), and Construction (42 | 7.0%).
Employment Industries by Sex in Crystal Lakes
The Crystal Lakes industries that see more men than women are Construction (100.0%), Wholesale Trade (100.0%), and Professional & Scientific (90.7%), whereas the industries that tend to have a higher number of women are Finance & Insurance (100.0%), Educational Services (100.0%), and Health Care & Social Assistance (100.0%).
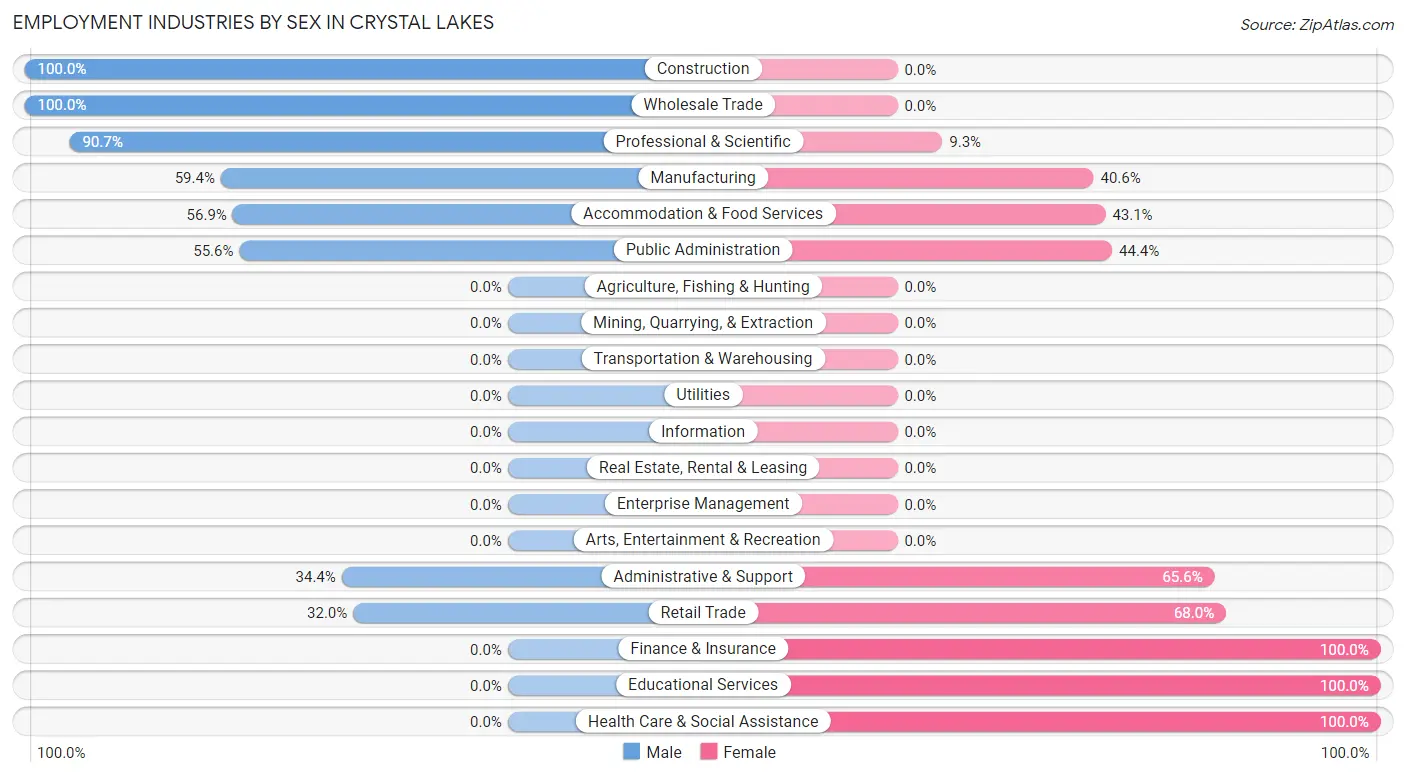
| Industry | Male | Female |
| Agriculture, Fishing & Hunting | 0 (0.0%) | 0 (0.0%) |
| Mining, Quarrying, & Extraction | 0 (0.0%) | 0 (0.0%) |
| Construction | 42 (100.0%) | 0 (0.0%) |
| Manufacturing | 79 (59.4%) | 54 (40.6%) |
| Wholesale Trade | 26 (100.0%) | 0 (0.0%) |
| Retail Trade | 24 (32.0%) | 51 (68.0%) |
| Transportation & Warehousing | 0 (0.0%) | 0 (0.0%) |
| Utilities | 0 (0.0%) | 0 (0.0%) |
| Information | 0 (0.0%) | 0 (0.0%) |
| Finance & Insurance | 0 (0.0%) | 4 (100.0%) |
| Real Estate, Rental & Leasing | 0 (0.0%) | 0 (0.0%) |
| Professional & Scientific | 39 (90.7%) | 4 (9.3%) |
| Enterprise Management | 0 (0.0%) | 0 (0.0%) |
| Administrative & Support | 11 (34.4%) | 21 (65.6%) |
| Educational Services | 0 (0.0%) | 12 (100.0%) |
| Health Care & Social Assistance | 0 (0.0%) | 27 (100.0%) |
| Arts, Entertainment & Recreation | 0 (0.0%) | 0 (0.0%) |
| Accommodation & Food Services | 82 (56.9%) | 62 (43.1%) |
| Public Administration | 15 (55.6%) | 12 (44.4%) |
| Total | 348 (58.3%) | 249 (41.7%) |
Education in Crystal Lakes
School Enrollment in Crystal Lakes
The most common levels of schooling among the 488 students in Crystal Lakes are middle school (209 | 42.8%), high school (159 | 32.6%), and college / undergraduate (51 | 10.4%).
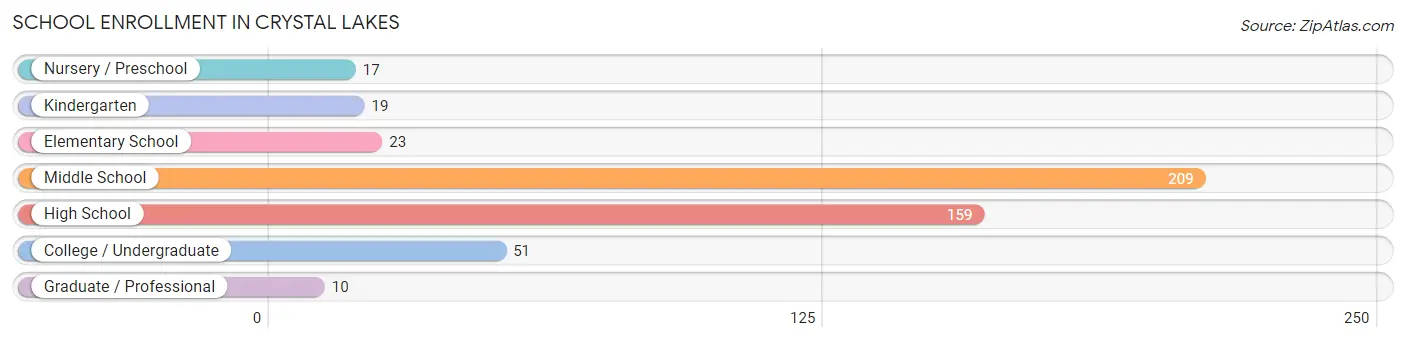
| School Level | # Students | % Students |
| Nursery / Preschool | 17 | 3.5% |
| Kindergarten | 19 | 3.9% |
| Elementary School | 23 | 4.7% |
| Middle School | 209 | 42.8% |
| High School | 159 | 32.6% |
| College / Undergraduate | 51 | 10.4% |
| Graduate / Professional | 10 | 2.1% |
| Total | 488 | 100.0% |
School Enrollment by Age by Funding Source in Crystal Lakes
Out of a total of 488 students who are enrolled in schools in Crystal Lakes, 88 (18.0%) attend a private institution, while the remaining 400 (82.0%) are enrolled in public schools. The age group of 35 years and over has the highest likelihood of being enrolled in private schools, with 10 (100.0% in the age bracket) enrolled. Conversely, the age group of 15 to 17 year olds has the lowest likelihood of being enrolled in a private school, with 123 (100.0% in the age bracket) attending a public institution.
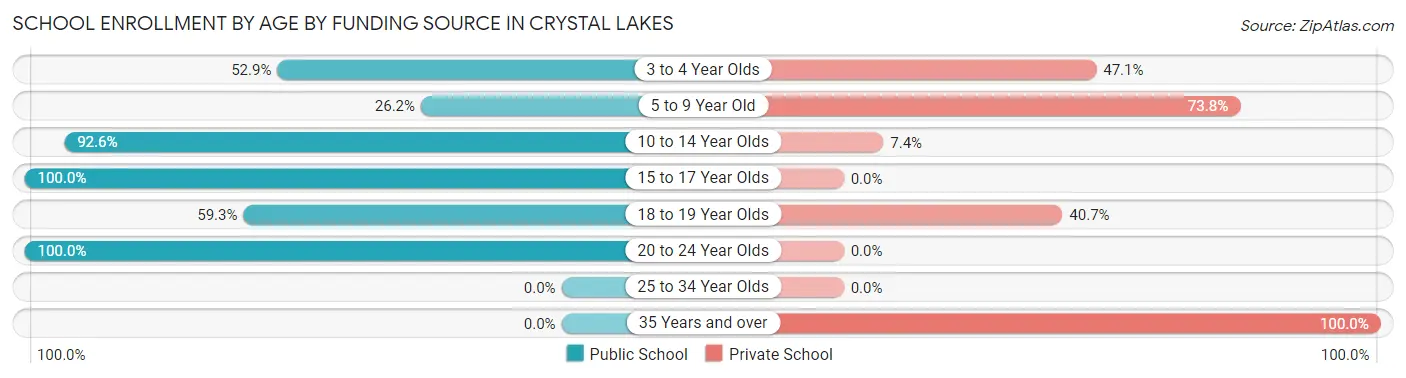
| Age Bracket | Public School | Private School |
| 3 to 4 Year Olds | 9 (52.9%) | 8 (47.1%) |
| 5 to 9 Year Old | 11 (26.2%) | 31 (73.8%) |
| 10 to 14 Year Olds | 213 (92.6%) | 17 (7.4%) |
| 15 to 17 Year Olds | 123 (100.0%) | 0 (0.0%) |
| 18 to 19 Year Olds | 32 (59.3%) | 22 (40.7%) |
| 20 to 24 Year Olds | 12 (100.0%) | 0 (0.0%) |
| 25 to 34 Year Olds | 0 (0.0%) | 0 (0.0%) |
| 35 Years and over | 0 (0.0%) | 10 (100.0%) |
| Total | 400 (82.0%) | 88 (18.0%) |
Educational Attainment by Field of Study in Crystal Lakes
Business (37 | 52.1%), liberal arts & history (15 | 21.1%), psychology (10 | 14.1%), and science & technology (9 | 12.7%) are the most common fields of study among 71 individuals in Crystal Lakes who have obtained a bachelor's degree or higher.
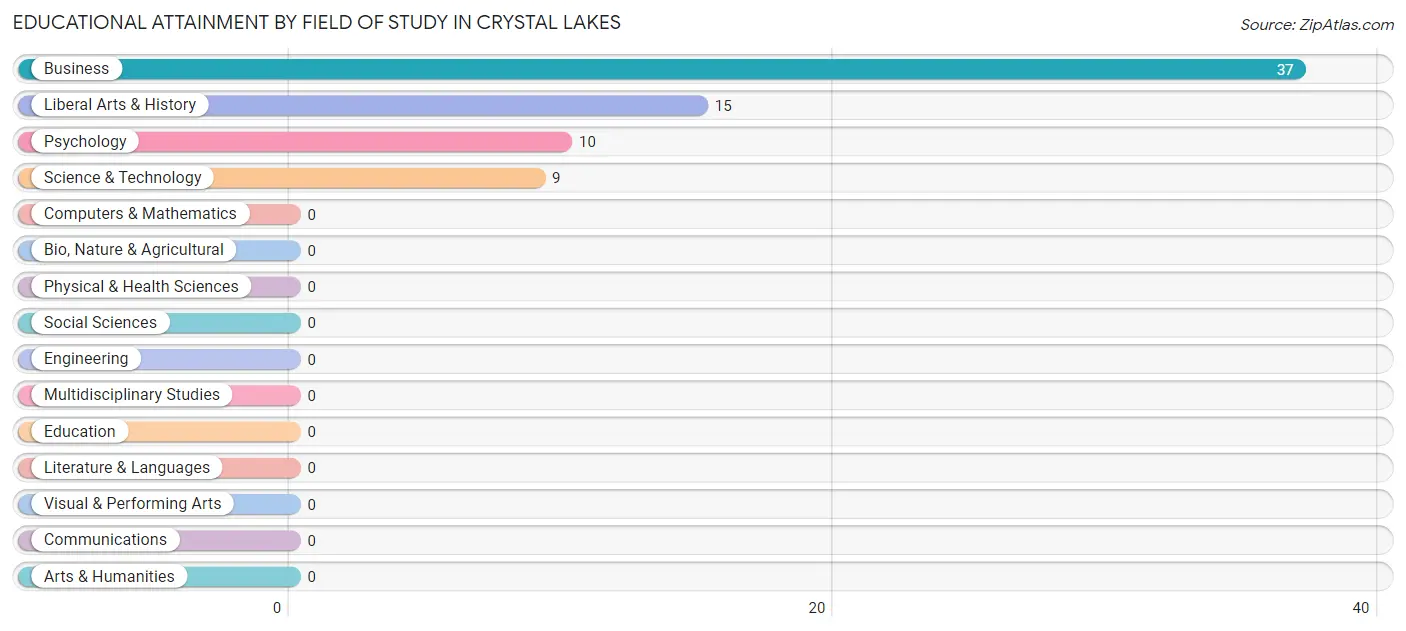
| Field of Study | # Graduates | % Graduates |
| Computers & Mathematics | 0 | 0.0% |
| Bio, Nature & Agricultural | 0 | 0.0% |
| Physical & Health Sciences | 0 | 0.0% |
| Psychology | 10 | 14.1% |
| Social Sciences | 0 | 0.0% |
| Engineering | 0 | 0.0% |
| Multidisciplinary Studies | 0 | 0.0% |
| Science & Technology | 9 | 12.7% |
| Business | 37 | 52.1% |
| Education | 0 | 0.0% |
| Literature & Languages | 0 | 0.0% |
| Liberal Arts & History | 15 | 21.1% |
| Visual & Performing Arts | 0 | 0.0% |
| Communications | 0 | 0.0% |
| Arts & Humanities | 0 | 0.0% |
| Total | 71 | 100.0% |
Transportation & Commute in Crystal Lakes
Vehicle Availability by Sex in Crystal Lakes
The most prevalent vehicle ownership categories in Crystal Lakes are males with 2 vehicles (127, accounting for 36.5%) and females with 2 vehicles (99, making up 51.0%).
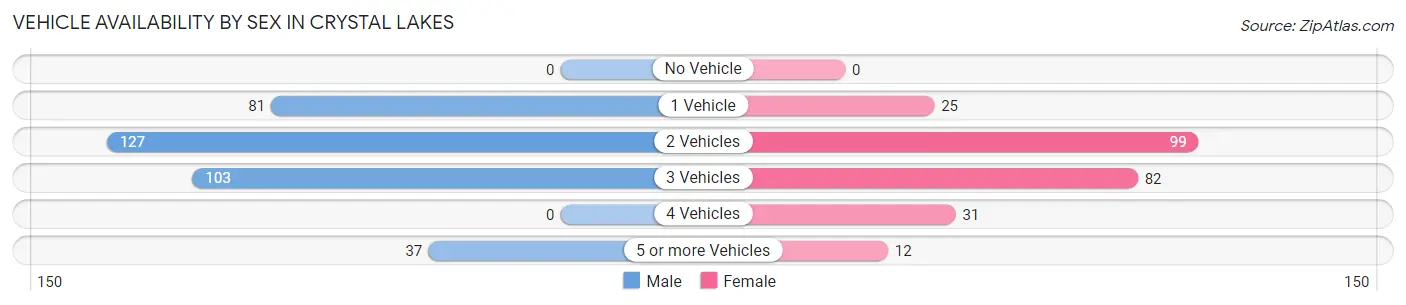
| Vehicles Available | Male | Female |
| No Vehicle | 0 (0.0%) | 0 (0.0%) |
| 1 Vehicle | 81 (23.3%) | 25 (10.0%) |
| 2 Vehicles | 127 (36.5%) | 99 (39.8%) |
| 3 Vehicles | 103 (29.6%) | 82 (32.9%) |
| 4 Vehicles | 0 (0.0%) | 31 (12.4%) |
| 5 or more Vehicles | 37 (10.6%) | 12 (4.8%) |
| Total | 348 (100.0%) | 249 (100.0%) |
Commute Time in Crystal Lakes
The most frequently occuring commute durations in Crystal Lakes are 30 to 34 minutes (123 commuters, 20.6%), 20 to 24 minutes (105 commuters, 17.6%), and 5 to 9 minutes (97 commuters, 16.3%).
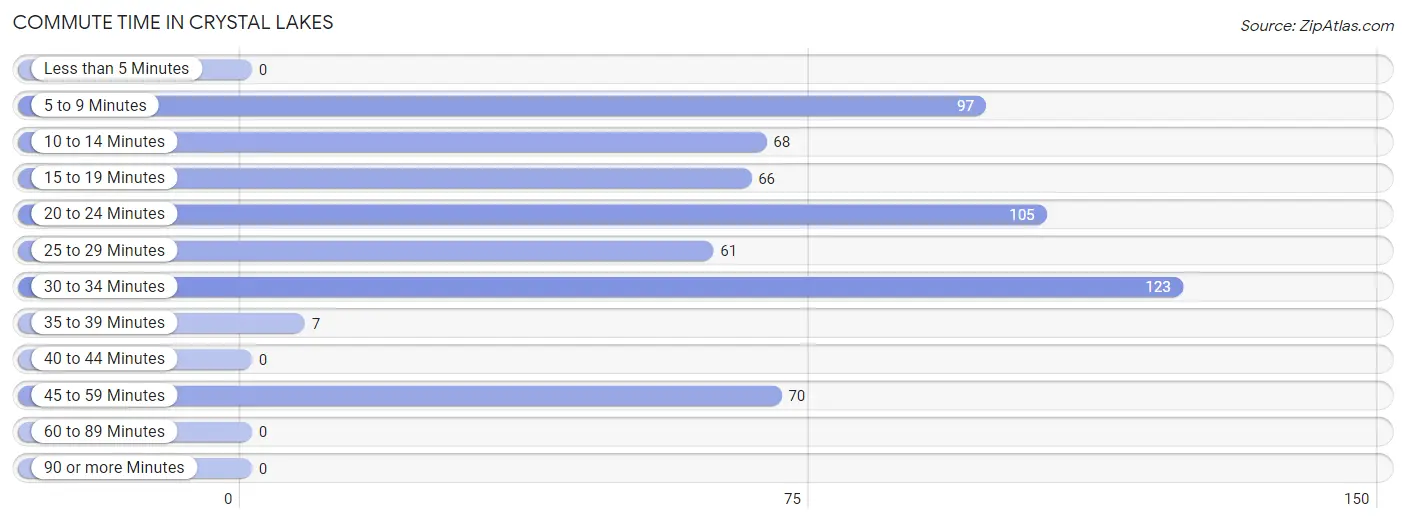
| Commute Time | # Commuters | % Commuters |
| Less than 5 Minutes | 0 | 0.0% |
| 5 to 9 Minutes | 97 | 16.3% |
| 10 to 14 Minutes | 68 | 11.4% |
| 15 to 19 Minutes | 66 | 11.1% |
| 20 to 24 Minutes | 105 | 17.6% |
| 25 to 29 Minutes | 61 | 10.2% |
| 30 to 34 Minutes | 123 | 20.6% |
| 35 to 39 Minutes | 7 | 1.2% |
| 40 to 44 Minutes | 0 | 0.0% |
| 45 to 59 Minutes | 70 | 11.7% |
| 60 to 89 Minutes | 0 | 0.0% |
| 90 or more Minutes | 0 | 0.0% |
Commute Time by Sex in Crystal Lakes
The most common commute times in Crystal Lakes are 45 to 59 minutes (70 commuters, 20.1%) for males and 30 to 34 minutes (100 commuters, 40.2%) for females.
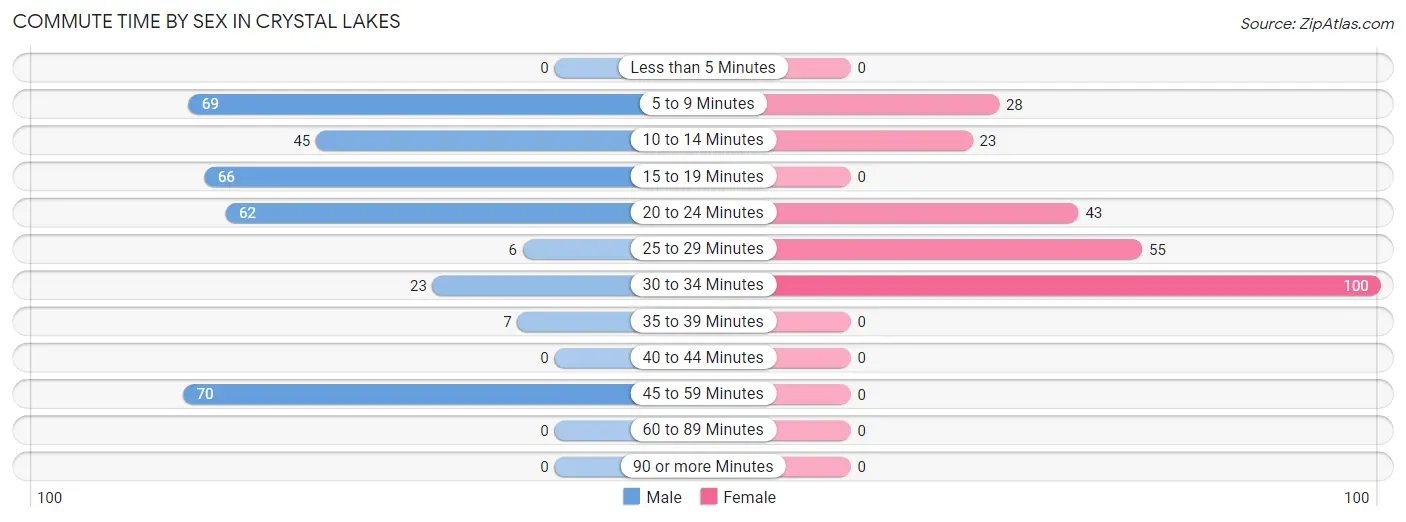
| Commute Time | Male | Female |
| Less than 5 Minutes | 0 (0.0%) | 0 (0.0%) |
| 5 to 9 Minutes | 69 (19.8%) | 28 (11.2%) |
| 10 to 14 Minutes | 45 (12.9%) | 23 (9.2%) |
| 15 to 19 Minutes | 66 (19.0%) | 0 (0.0%) |
| 20 to 24 Minutes | 62 (17.8%) | 43 (17.3%) |
| 25 to 29 Minutes | 6 (1.7%) | 55 (22.1%) |
| 30 to 34 Minutes | 23 (6.6%) | 100 (40.2%) |
| 35 to 39 Minutes | 7 (2.0%) | 0 (0.0%) |
| 40 to 44 Minutes | 0 (0.0%) | 0 (0.0%) |
| 45 to 59 Minutes | 70 (20.1%) | 0 (0.0%) |
| 60 to 89 Minutes | 0 (0.0%) | 0 (0.0%) |
| 90 or more Minutes | 0 (0.0%) | 0 (0.0%) |
Time of Departure to Work by Sex in Crystal Lakes
The most frequent times of departure to work in Crystal Lakes are 6:30 AM to 6:59 AM (70, 20.1%) for males and 12:00 PM to 3:59 PM (65, 26.1%) for females.
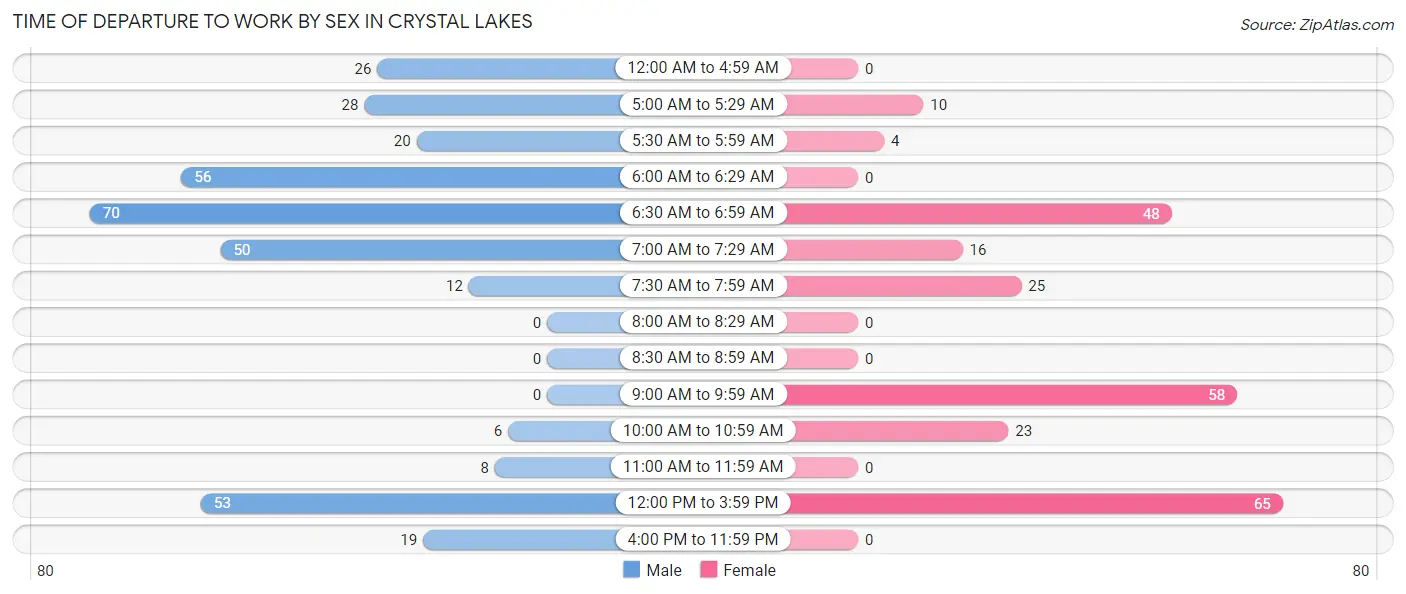
| Time of Departure | Male | Female |
| 12:00 AM to 4:59 AM | 26 (7.5%) | 0 (0.0%) |
| 5:00 AM to 5:29 AM | 28 (8.1%) | 10 (4.0%) |
| 5:30 AM to 5:59 AM | 20 (5.8%) | 4 (1.6%) |
| 6:00 AM to 6:29 AM | 56 (16.1%) | 0 (0.0%) |
| 6:30 AM to 6:59 AM | 70 (20.1%) | 48 (19.3%) |
| 7:00 AM to 7:29 AM | 50 (14.4%) | 16 (6.4%) |
| 7:30 AM to 7:59 AM | 12 (3.5%) | 25 (10.0%) |
| 8:00 AM to 8:29 AM | 0 (0.0%) | 0 (0.0%) |
| 8:30 AM to 8:59 AM | 0 (0.0%) | 0 (0.0%) |
| 9:00 AM to 9:59 AM | 0 (0.0%) | 58 (23.3%) |
| 10:00 AM to 10:59 AM | 6 (1.7%) | 23 (9.2%) |
| 11:00 AM to 11:59 AM | 8 (2.3%) | 0 (0.0%) |
| 12:00 PM to 3:59 PM | 53 (15.2%) | 65 (26.1%) |
| 4:00 PM to 11:59 PM | 19 (5.5%) | 0 (0.0%) |
| Total | 348 (100.0%) | 249 (100.0%) |
Housing Occupancy in Crystal Lakes
Occupancy by Ownership in Crystal Lakes
Of the total 582 dwellings in Crystal Lakes, owner-occupied units account for 394 (67.7%), while renter-occupied units make up 188 (32.3%).
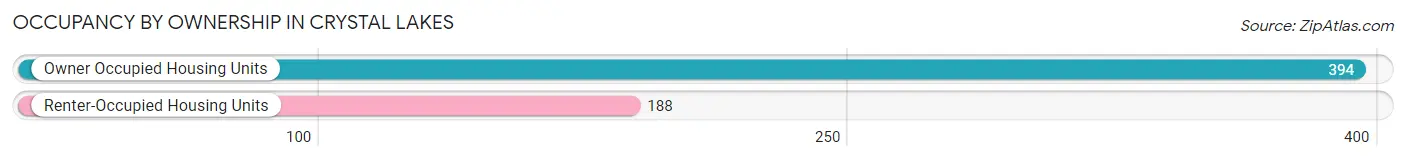
| Occupancy | # Housing Units | % Housing Units |
| Owner Occupied Housing Units | 394 | 67.7% |
| Renter-Occupied Housing Units | 188 | 32.3% |
| Total Occupied Housing Units | 582 | 100.0% |
Occupancy by Household Size in Crystal Lakes
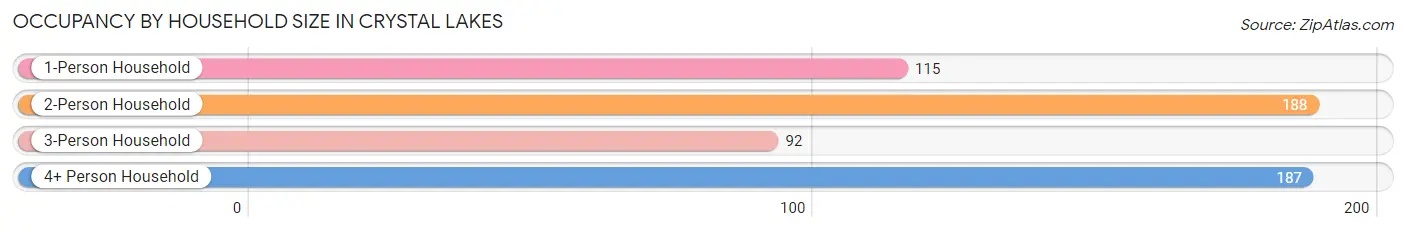
| Household Size | # Housing Units | % Housing Units |
| 1-Person Household | 115 | 19.8% |
| 2-Person Household | 188 | 32.3% |
| 3-Person Household | 92 | 15.8% |
| 4+ Person Household | 187 | 32.1% |
| Total Housing Units | 582 | 100.0% |
Occupancy by Ownership by Household Size in Crystal Lakes
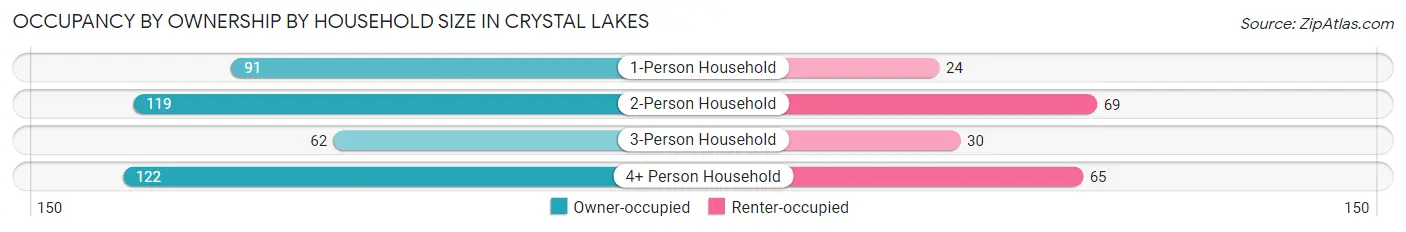
| Household Size | Owner-occupied | Renter-occupied |
| 1-Person Household | 91 (79.1%) | 24 (20.9%) |
| 2-Person Household | 119 (63.3%) | 69 (36.7%) |
| 3-Person Household | 62 (67.4%) | 30 (32.6%) |
| 4+ Person Household | 122 (65.2%) | 65 (34.8%) |
| Total Housing Units | 394 (67.7%) | 188 (32.3%) |
Occupancy by Educational Attainment in Crystal Lakes
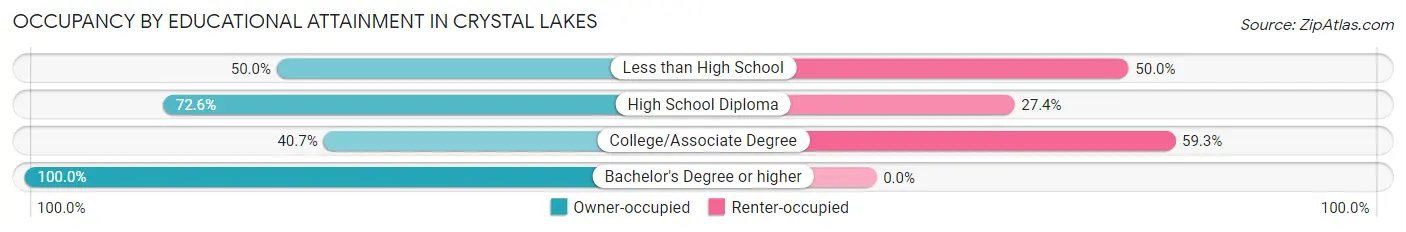
| Household Size | Owner-occupied | Renter-occupied |
| Less than High School | 40 (50.0%) | 40 (50.0%) |
| High School Diploma | 265 (72.6%) | 100 (27.4%) |
| College/Associate Degree | 33 (40.7%) | 48 (59.3%) |
| Bachelor's Degree or higher | 56 (100.0%) | 0 (0.0%) |
Occupancy by Age of Householder in Crystal Lakes
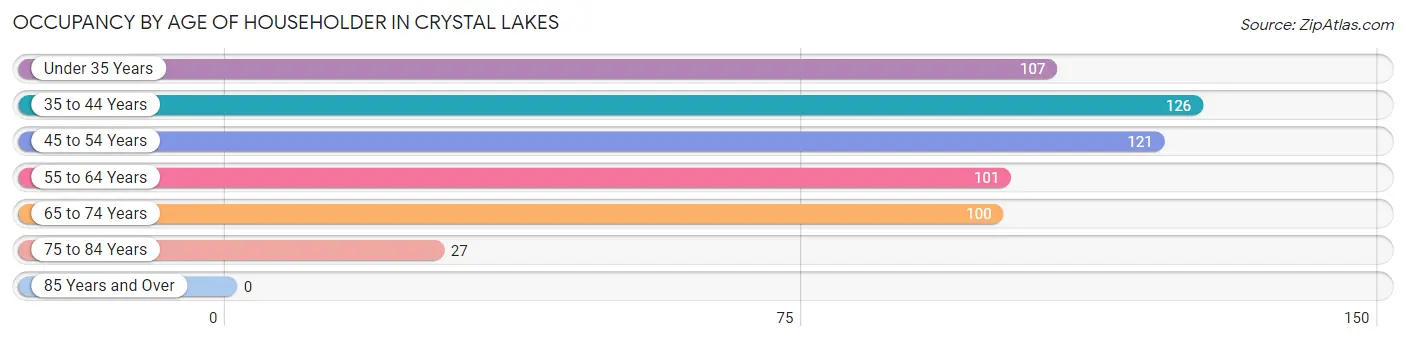
| Age Bracket | # Households | % Households |
| Under 35 Years | 107 | 18.4% |
| 35 to 44 Years | 126 | 21.6% |
| 45 to 54 Years | 121 | 20.8% |
| 55 to 64 Years | 101 | 17.3% |
| 65 to 74 Years | 100 | 17.2% |
| 75 to 84 Years | 27 | 4.6% |
| 85 Years and Over | 0 | 0.0% |
| Total | 582 | 100.0% |
Housing Finances in Crystal Lakes
Median Income by Occupancy in Crystal Lakes
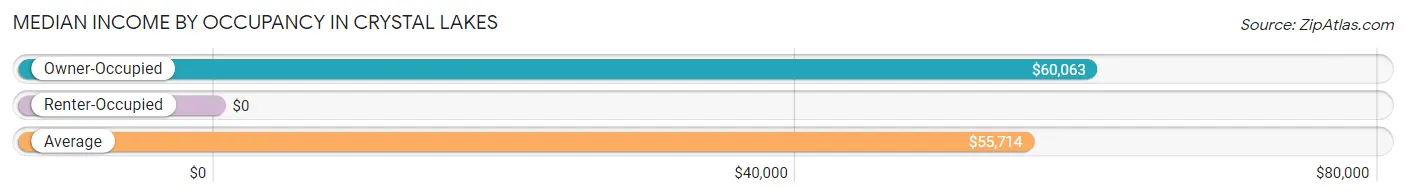
| Occupancy Type | # Households | Median Income |
| Owner-Occupied | 394 (67.7%) | $60,063 |
| Renter-Occupied | 188 (32.3%) | $0 |
| Average | 582 (100.0%) | $55,714 |
Occupancy by Householder Income Bracket in Crystal Lakes
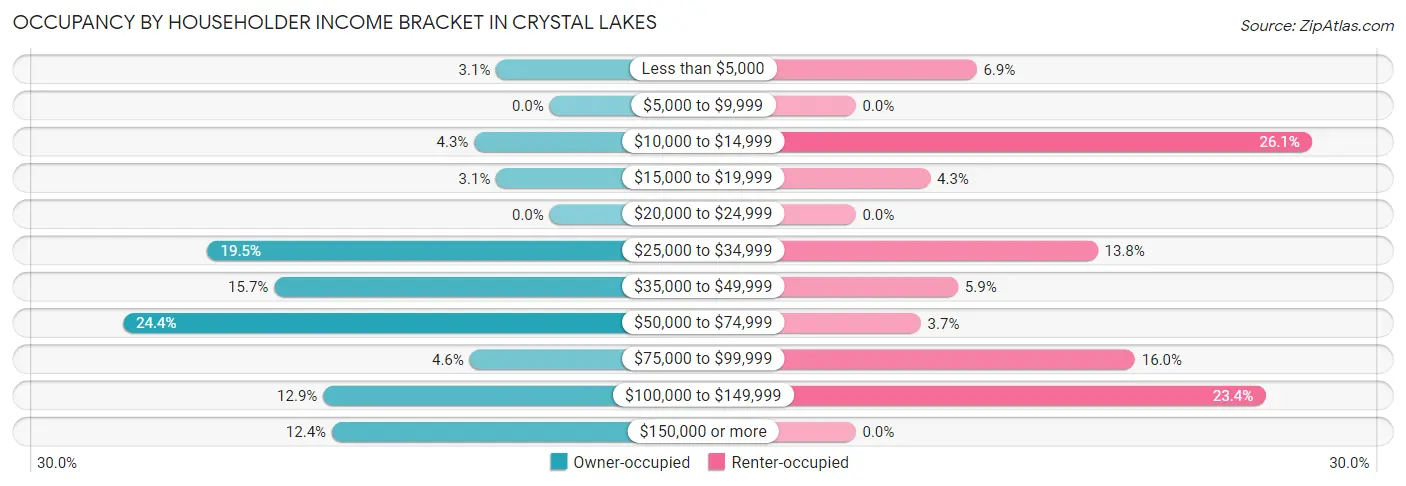
| Income Bracket | Owner-occupied | Renter-occupied |
| Less than $5,000 | 12 (3.0%) | 13 (6.9%) |
| $5,000 to $9,999 | 0 (0.0%) | 0 (0.0%) |
| $10,000 to $14,999 | 17 (4.3%) | 49 (26.1%) |
| $15,000 to $19,999 | 12 (3.0%) | 8 (4.3%) |
| $20,000 to $24,999 | 0 (0.0%) | 0 (0.0%) |
| $25,000 to $34,999 | 77 (19.5%) | 26 (13.8%) |
| $35,000 to $49,999 | 62 (15.7%) | 11 (5.9%) |
| $50,000 to $74,999 | 96 (24.4%) | 7 (3.7%) |
| $75,000 to $99,999 | 18 (4.6%) | 30 (16.0%) |
| $100,000 to $149,999 | 51 (12.9%) | 44 (23.4%) |
| $150,000 or more | 49 (12.4%) | 0 (0.0%) |
| Total | 394 (100.0%) | 188 (100.0%) |
Monthly Housing Cost Tiers in Crystal Lakes
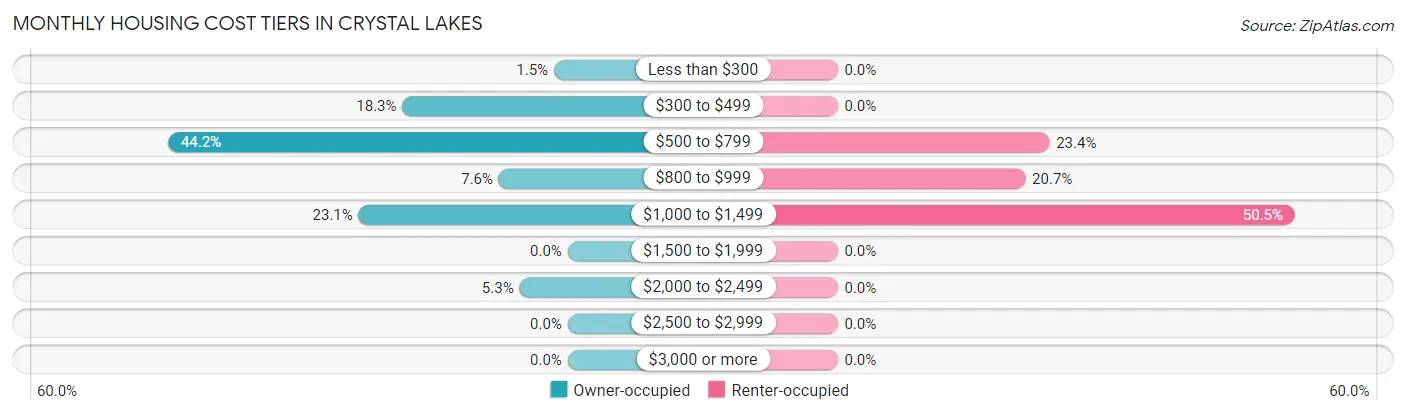
| Monthly Cost | Owner-occupied | Renter-occupied |
| Less than $300 | 6 (1.5%) | 0 (0.0%) |
| $300 to $499 | 72 (18.3%) | 0 (0.0%) |
| $500 to $799 | 174 (44.2%) | 44 (23.4%) |
| $800 to $999 | 30 (7.6%) | 39 (20.7%) |
| $1,000 to $1,499 | 91 (23.1%) | 95 (50.5%) |
| $1,500 to $1,999 | 0 (0.0%) | 0 (0.0%) |
| $2,000 to $2,499 | 21 (5.3%) | 0 (0.0%) |
| $2,500 to $2,999 | 0 (0.0%) | 0 (0.0%) |
| $3,000 or more | 0 (0.0%) | 0 (0.0%) |
| Total | 394 (100.0%) | 188 (100.0%) |
Physical Housing Characteristics in Crystal Lakes
Housing Structures in Crystal Lakes
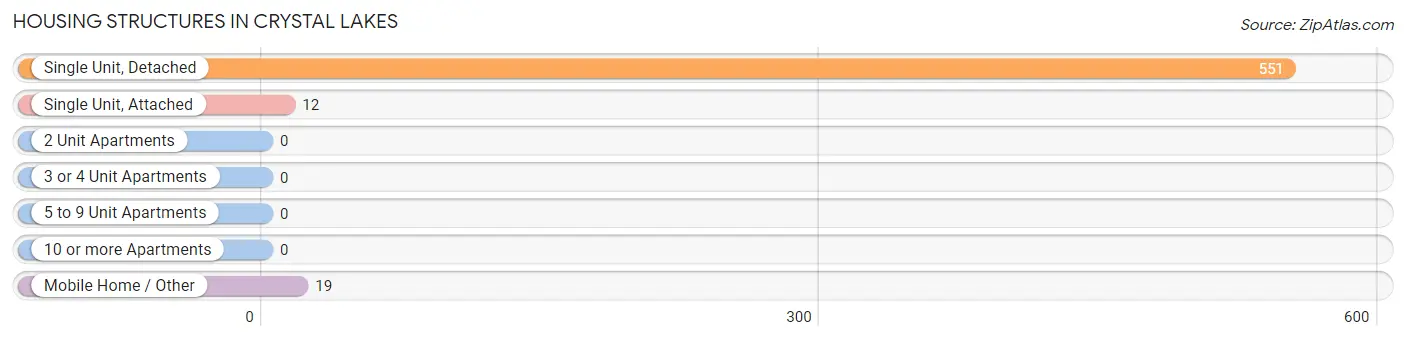
| Structure Type | # Housing Units | % Housing Units |
| Single Unit, Detached | 551 | 94.7% |
| Single Unit, Attached | 12 | 2.1% |
| 2 Unit Apartments | 0 | 0.0% |
| 3 or 4 Unit Apartments | 0 | 0.0% |
| 5 to 9 Unit Apartments | 0 | 0.0% |
| 10 or more Apartments | 0 | 0.0% |
| Mobile Home / Other | 19 | 3.3% |
| Total | 582 | 100.0% |
Housing Structures by Occupancy in Crystal Lakes
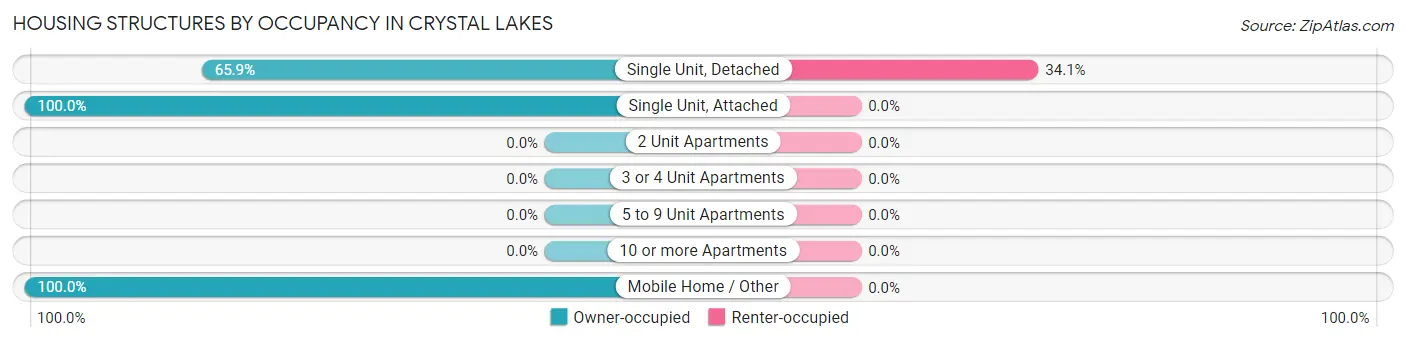
| Structure Type | Owner-occupied | Renter-occupied |
| Single Unit, Detached | 363 (65.9%) | 188 (34.1%) |
| Single Unit, Attached | 12 (100.0%) | 0 (0.0%) |
| 2 Unit Apartments | 0 (0.0%) | 0 (0.0%) |
| 3 or 4 Unit Apartments | 0 (0.0%) | 0 (0.0%) |
| 5 to 9 Unit Apartments | 0 (0.0%) | 0 (0.0%) |
| 10 or more Apartments | 0 (0.0%) | 0 (0.0%) |
| Mobile Home / Other | 19 (100.0%) | 0 (0.0%) |
| Total | 394 (67.7%) | 188 (32.3%) |
Housing Structures by Number of Rooms in Crystal Lakes
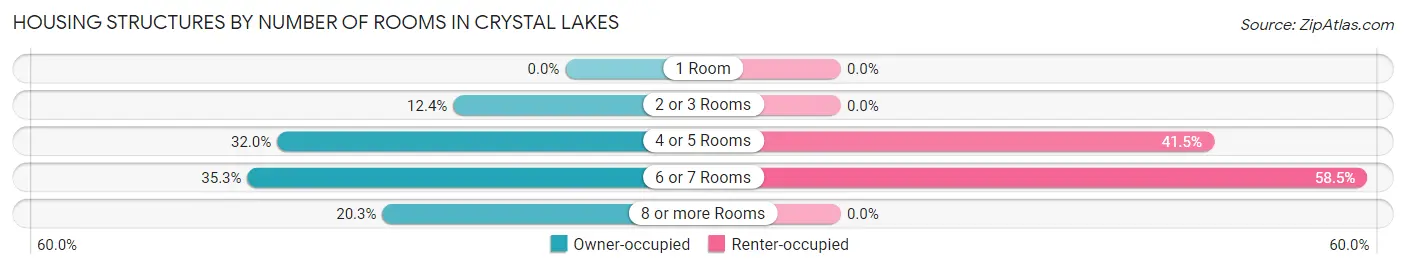
| Number of Rooms | Owner-occupied | Renter-occupied |
| 1 Room | 0 (0.0%) | 0 (0.0%) |
| 2 or 3 Rooms | 49 (12.4%) | 0 (0.0%) |
| 4 or 5 Rooms | 126 (32.0%) | 78 (41.5%) |
| 6 or 7 Rooms | 139 (35.3%) | 110 (58.5%) |
| 8 or more Rooms | 80 (20.3%) | 0 (0.0%) |
| Total | 394 (100.0%) | 188 (100.0%) |
Housing Structure by Heating Type in Crystal Lakes
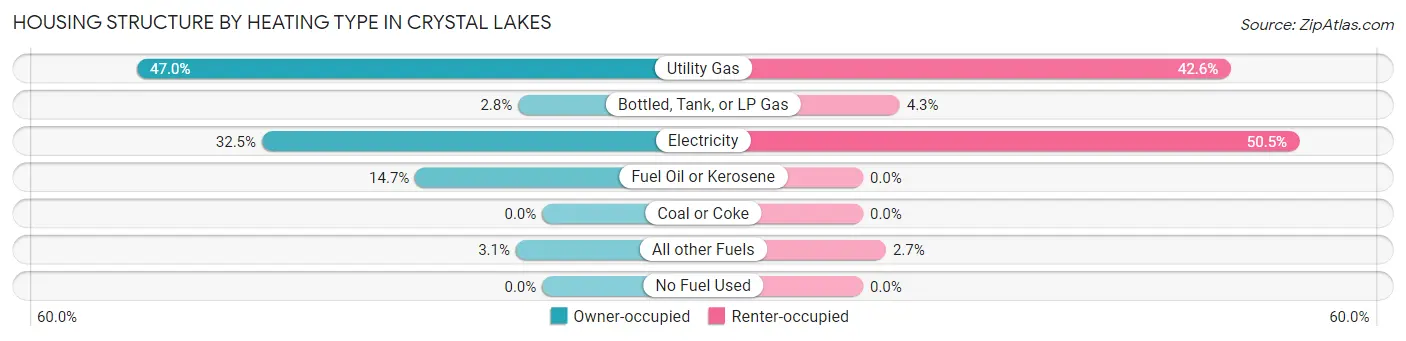
| Heating Type | Owner-occupied | Renter-occupied |
| Utility Gas | 185 (46.9%) | 80 (42.5%) |
| Bottled, Tank, or LP Gas | 11 (2.8%) | 8 (4.3%) |
| Electricity | 128 (32.5%) | 95 (50.5%) |
| Fuel Oil or Kerosene | 58 (14.7%) | 0 (0.0%) |
| Coal or Coke | 0 (0.0%) | 0 (0.0%) |
| All other Fuels | 12 (3.0%) | 5 (2.7%) |
| No Fuel Used | 0 (0.0%) | 0 (0.0%) |
| Total | 394 (100.0%) | 188 (100.0%) |
Household Vehicle Usage in Crystal Lakes
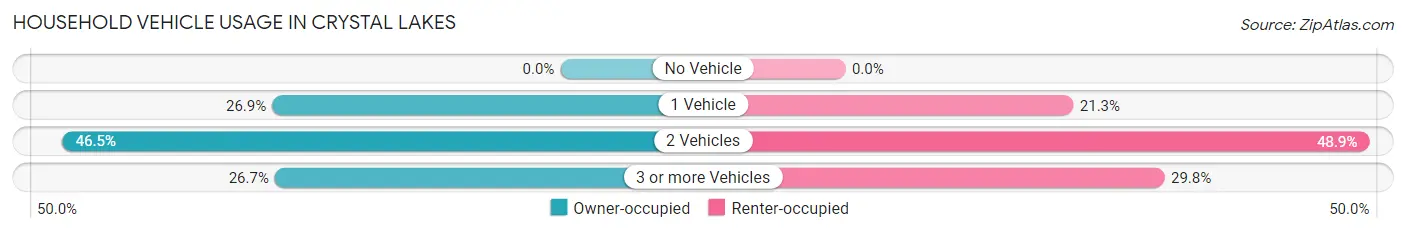
| Vehicles per Household | Owner-occupied | Renter-occupied |
| No Vehicle | 0 (0.0%) | 0 (0.0%) |
| 1 Vehicle | 106 (26.9%) | 40 (21.3%) |
| 2 Vehicles | 183 (46.5%) | 92 (48.9%) |
| 3 or more Vehicles | 105 (26.7%) | 56 (29.8%) |
| Total | 394 (100.0%) | 188 (100.0%) |
Real Estate & Mortgages in Crystal Lakes
Real Estate and Mortgage Overview in Crystal Lakes
| Characteristic | Without Mortgage | With Mortgage |
| Housing Units | 209 | 185 |
| Median Property Value | $145,200 | $96,800 |
| Median Household Income | - | - |
| Monthly Housing Costs | $548 | $0 |
| Real Estate Taxes | $1,450 | $0 |
Property Value by Mortgage Status in Crystal Lakes
| Property Value | Without Mortgage | With Mortgage |
| Less than $50,000 | 0 (0.0%) | 12 (6.5%) |
| $50,000 to $99,999 | 61 (29.2%) | 96 (51.9%) |
| $100,000 to $299,999 | 129 (61.7%) | 77 (41.6%) |
| $300,000 to $499,999 | 0 (0.0%) | 0 (0.0%) |
| $500,000 to $749,999 | 19 (9.1%) | 0 (0.0%) |
| $750,000 to $999,999 | 0 (0.0%) | 0 (0.0%) |
| $1,000,000 or more | 0 (0.0%) | 0 (0.0%) |
| Total | 209 (100.0%) | 185 (100.0%) |
Household Income by Mortgage Status in Crystal Lakes
| Household Income | Without Mortgage | With Mortgage |
| Less than $10,000 | 0 (0.0%) | 0 (0.0%) |
| $10,000 to $24,999 | 12 (5.7%) | 12 (6.5%) |
| $25,000 to $34,999 | 32 (15.3%) | 17 (9.2%) |
| $35,000 to $49,999 | 58 (27.8%) | 45 (24.3%) |
| $50,000 to $74,999 | 16 (7.7%) | 4 (2.2%) |
| $75,000 to $99,999 | 18 (8.6%) | 80 (43.2%) |
| $100,000 to $149,999 | 36 (17.2%) | 0 (0.0%) |
| $150,000 or more | 37 (17.7%) | 15 (8.1%) |
| Total | 209 (100.0%) | 185 (100.0%) |
Property Value to Household Income Ratio in Crystal Lakes
| Value-to-Income Ratio | Without Mortgage | With Mortgage |
| Less than 2.0x | 88 (42.1%) | 60,906 (32,922.2%) |
| 2.0x to 2.9x | 24 (11.5%) | 88 (47.6%) |
| 3.0x to 3.9x | 38 (18.2%) | 35 (18.9%) |
| 4.0x or more | 59 (28.2%) | 19 (10.3%) |
| Total | 209 (100.0%) | 185 (100.0%) |
Real Estate Taxes by Mortgage Status in Crystal Lakes
| Property Taxes | Without Mortgage | With Mortgage |
| Less than $800 | 50 (23.9%) | 0 (0.0%) |
| $800 to $1,499 | 50 (23.9%) | 11 (5.9%) |
| $800 to $1,499 | 90 (43.1%) | 87 (47.0%) |
| Total | 209 (100.0%) | 185 (100.0%) |
Health & Disability in Crystal Lakes
Health Insurance Coverage by Age in Crystal Lakes
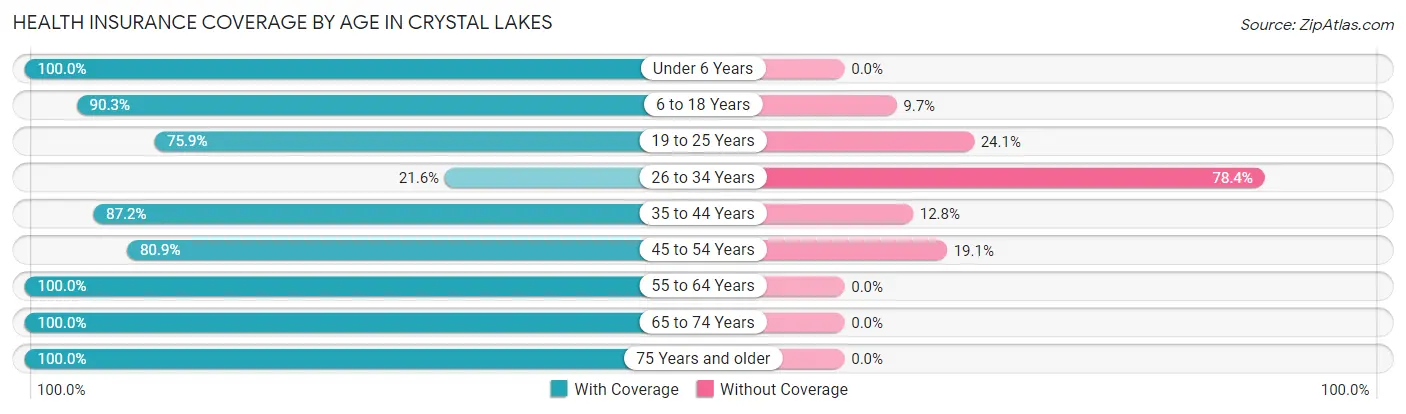
| Age Bracket | With Coverage | Without Coverage |
| Under 6 Years | 49 (100.0%) | 0 (0.0%) |
| 6 to 18 Years | 391 (90.3%) | 42 (9.7%) |
| 19 to 25 Years | 176 (75.9%) | 56 (24.1%) |
| 26 to 34 Years | 8 (21.6%) | 29 (78.4%) |
| 35 to 44 Years | 198 (87.2%) | 29 (12.8%) |
| 45 to 54 Years | 216 (80.9%) | 51 (19.1%) |
| 55 to 64 Years | 114 (100.0%) | 0 (0.0%) |
| 65 to 74 Years | 213 (100.0%) | 0 (0.0%) |
| 75 Years and older | 33 (100.0%) | 0 (0.0%) |
| Total | 1,398 (87.1%) | 207 (12.9%) |
Health Insurance Coverage by Citizenship Status in Crystal Lakes
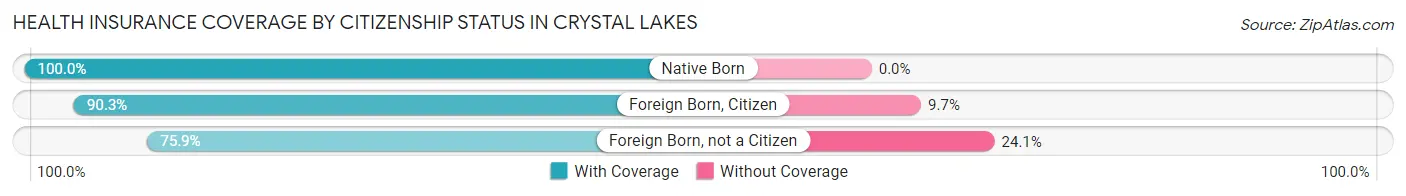
| Citizenship Status | With Coverage | Without Coverage |
| Native Born | 49 (100.0%) | 0 (0.0%) |
| Foreign Born, Citizen | 391 (90.3%) | 42 (9.7%) |
| Foreign Born, not a Citizen | 176 (75.9%) | 56 (24.1%) |
Health Insurance Coverage by Household Income in Crystal Lakes
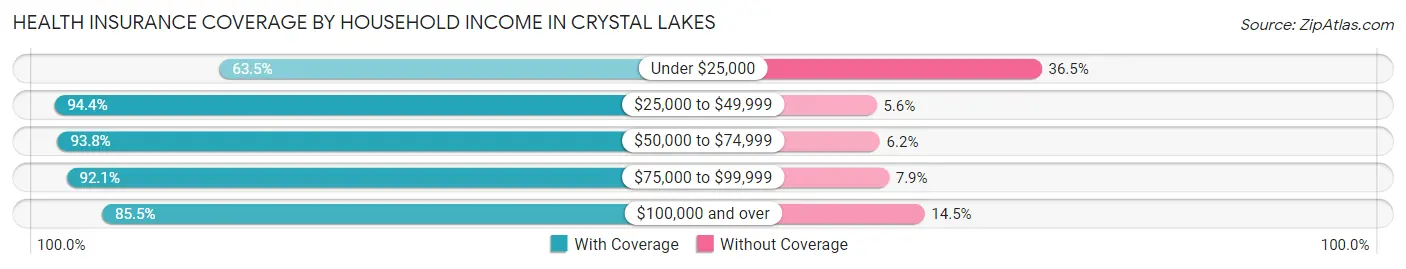
| Household Income | With Coverage | Without Coverage |
| Under $25,000 | 148 (63.5%) | 85 (36.5%) |
| $25,000 to $49,999 | 425 (94.4%) | 25 (5.6%) |
| $50,000 to $74,999 | 320 (93.8%) | 21 (6.2%) |
| $75,000 to $99,999 | 117 (92.1%) | 10 (7.9%) |
| $100,000 and over | 388 (85.5%) | 66 (14.5%) |
Public vs Private Health Insurance Coverage by Age in Crystal Lakes
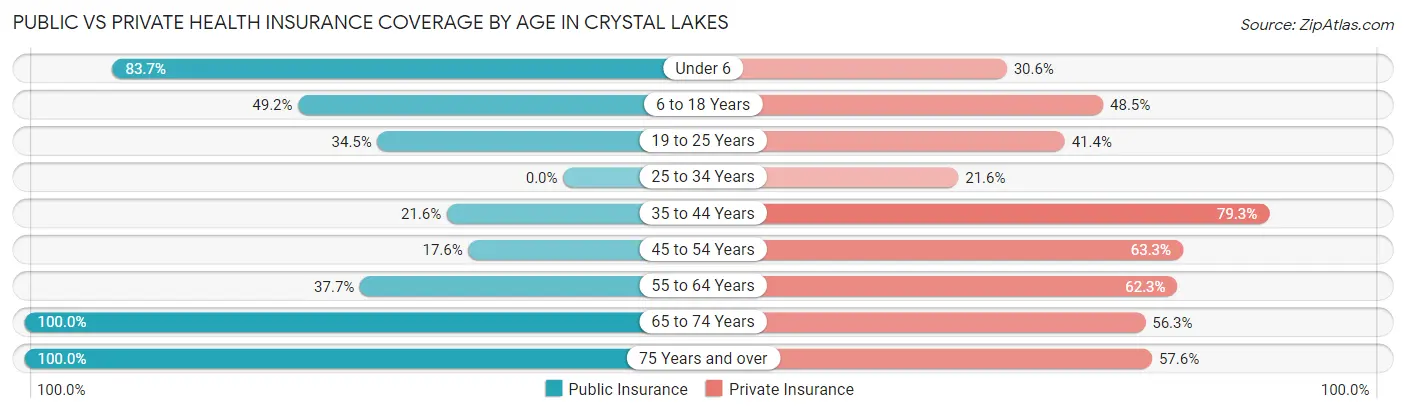
| Age Bracket | Public Insurance | Private Insurance |
| Under 6 | 41 (83.7%) | 15 (30.6%) |
| 6 to 18 Years | 213 (49.2%) | 210 (48.5%) |
| 19 to 25 Years | 80 (34.5%) | 96 (41.4%) |
| 25 to 34 Years | 0 (0.0%) | 8 (21.6%) |
| 35 to 44 Years | 49 (21.6%) | 180 (79.3%) |
| 45 to 54 Years | 47 (17.6%) | 169 (63.3%) |
| 55 to 64 Years | 43 (37.7%) | 71 (62.3%) |
| 65 to 74 Years | 213 (100.0%) | 120 (56.3%) |
| 75 Years and over | 33 (100.0%) | 19 (57.6%) |
| Total | 719 (44.8%) | 888 (55.3%) |
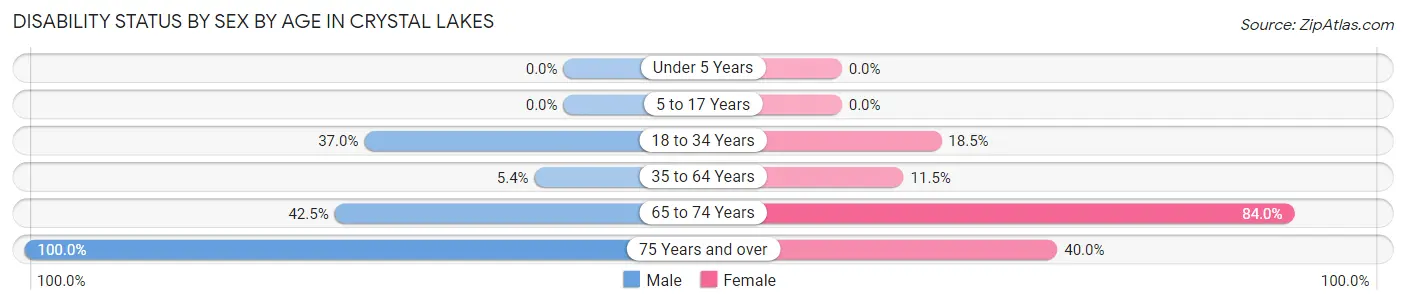
Disability Status by Sex by Age in Crystal Lakes
| Age Bracket | Male | Female |
| Under 5 Years | 0 (0.0%) | 0 (0.0%) |
| 5 to 17 Years | 0 (0.0%) | 0 (0.0%) |
| 18 to 34 Years | 51 (37.0%) | 27 (18.5%) |
| 35 to 64 Years | 13 (5.4%) | 42 (11.5%) |
| 65 to 74 Years | 48 (42.5%) | 84 (84.0%) |
| 75 Years and over | 13 (100.0%) | 8 (40.0%) |
Disability Class by Sex by Age in Crystal Lakes
Disability Class: Hearing Difficulty
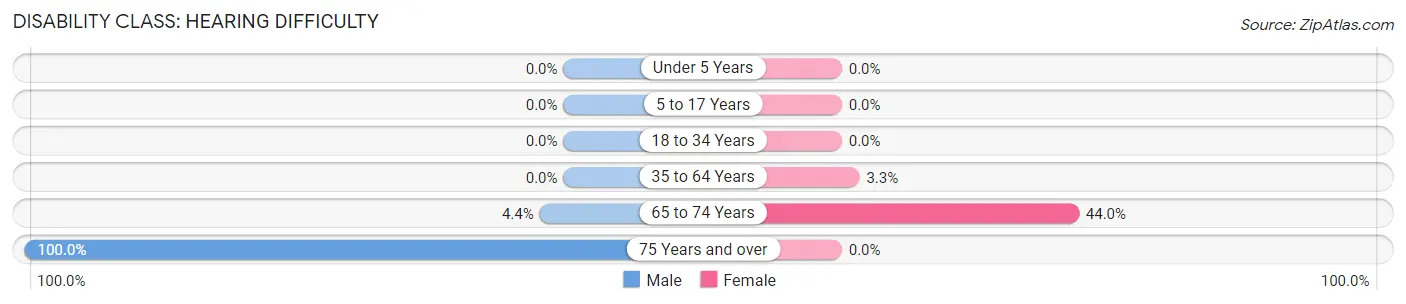
| Age Bracket | Male | Female |
| Under 5 Years | 0 (0.0%) | 0 (0.0%) |
| 5 to 17 Years | 0 (0.0%) | 0 (0.0%) |
| 18 to 34 Years | 0 (0.0%) | 0 (0.0%) |
| 35 to 64 Years | 0 (0.0%) | 12 (3.3%) |
| 65 to 74 Years | 5 (4.4%) | 44 (44.0%) |
| 75 Years and over | 13 (100.0%) | 0 (0.0%) |
Disability Class: Vision Difficulty
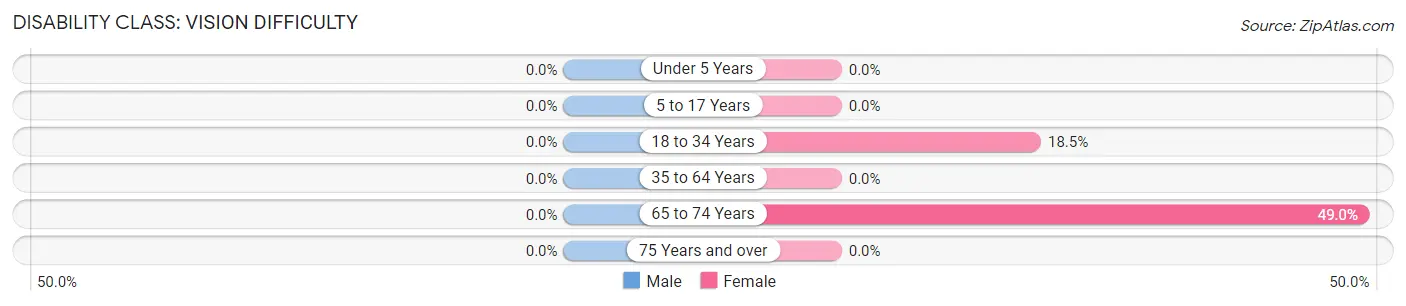
| Age Bracket | Male | Female |
| Under 5 Years | 0 (0.0%) | 0 (0.0%) |
| 5 to 17 Years | 0 (0.0%) | 0 (0.0%) |
| 18 to 34 Years | 0 (0.0%) | 27 (18.5%) |
| 35 to 64 Years | 0 (0.0%) | 0 (0.0%) |
| 65 to 74 Years | 0 (0.0%) | 49 (49.0%) |
| 75 Years and over | 0 (0.0%) | 0 (0.0%) |
Disability Class: Cognitive Difficulty
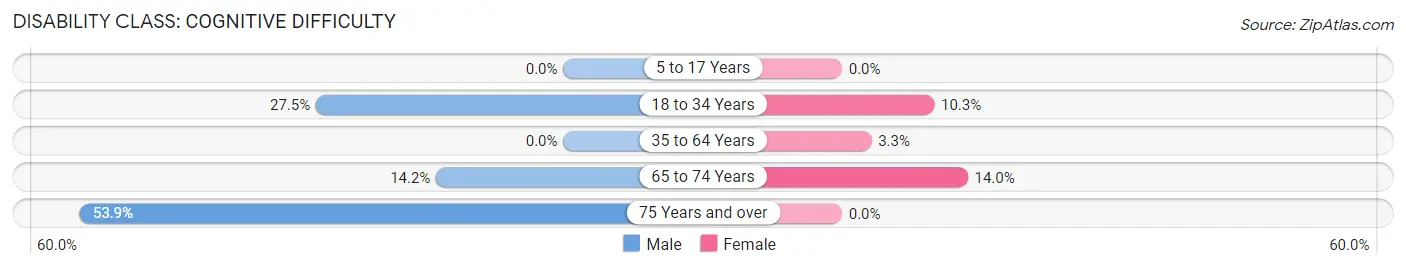
| Age Bracket | Male | Female |
| 5 to 17 Years | 0 (0.0%) | 0 (0.0%) |
| 18 to 34 Years | 38 (27.5%) | 15 (10.3%) |
| 35 to 64 Years | 0 (0.0%) | 12 (3.3%) |
| 65 to 74 Years | 16 (14.2%) | 14 (14.0%) |
| 75 Years and over | 7 (53.8%) | 0 (0.0%) |
Disability Class: Ambulatory Difficulty
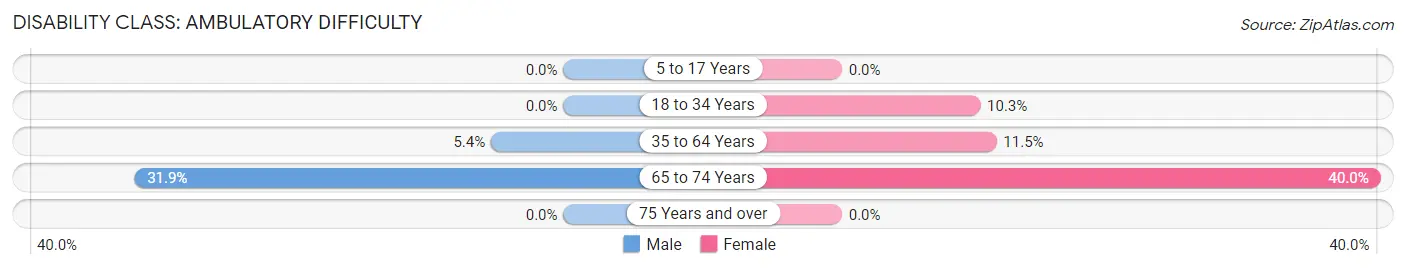
| Age Bracket | Male | Female |
| 5 to 17 Years | 0 (0.0%) | 0 (0.0%) |
| 18 to 34 Years | 0 (0.0%) | 15 (10.3%) |
| 35 to 64 Years | 13 (5.4%) | 42 (11.5%) |
| 65 to 74 Years | 36 (31.9%) | 40 (40.0%) |
| 75 Years and over | 0 (0.0%) | 0 (0.0%) |
Disability Class: Self-Care Difficulty
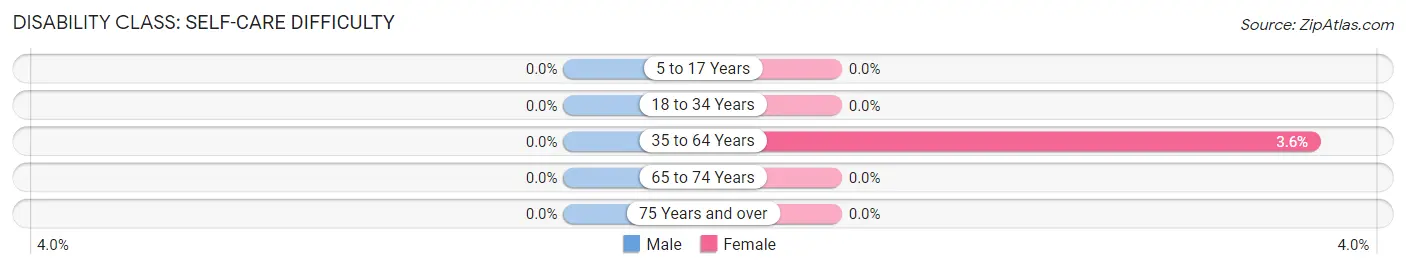
| Age Bracket | Male | Female |
| 5 to 17 Years | 0 (0.0%) | 0 (0.0%) |
| 18 to 34 Years | 0 (0.0%) | 0 (0.0%) |
| 35 to 64 Years | 0 (0.0%) | 13 (3.5%) |
| 65 to 74 Years | 0 (0.0%) | 0 (0.0%) |
| 75 Years and over | 0 (0.0%) | 0 (0.0%) |
Technology Access in Crystal Lakes
Computing Device Access in Crystal Lakes
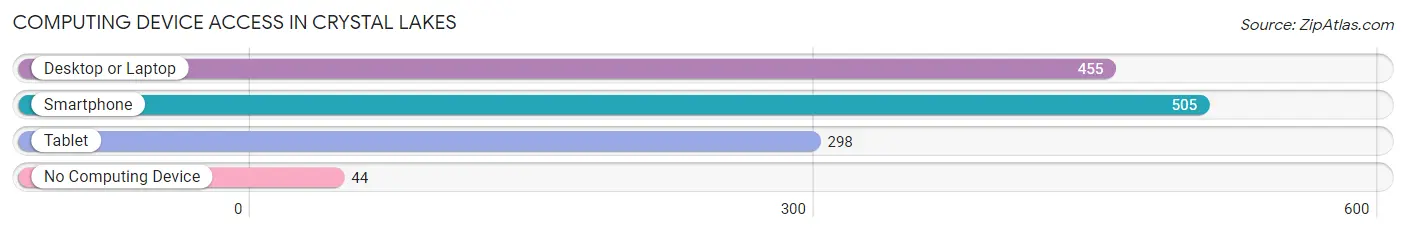
| Device Type | # Households | % Households |
| Desktop or Laptop | 455 | 78.2% |
| Smartphone | 505 | 86.8% |
| Tablet | 298 | 51.2% |
| No Computing Device | 44 | 7.6% |
| Total | 582 | 100.0% |
Internet Access in Crystal Lakes
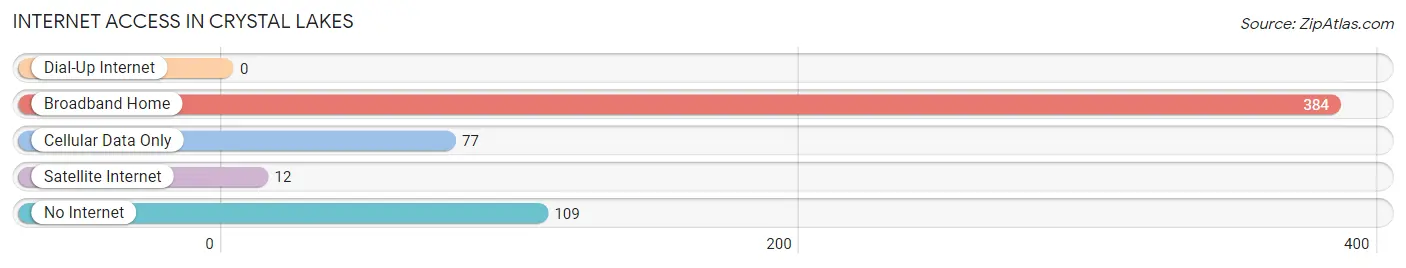
| Internet Type | # Households | % Households |
| Dial-Up Internet | 0 | 0.0% |
| Broadband Home | 384 | 66.0% |
| Cellular Data Only | 77 | 13.2% |
| Satellite Internet | 12 | 2.1% |
| No Internet | 109 | 18.7% |
| Total | 582 | 100.0% |
Crystal Lakes Summary
Lakes Crystal is a small village located in the state of Ohio, United States. It is situated in the county of Geauga and is part of the Cleveland-Elyria-Mentor Metropolitan Statistical Area. The village has a population of approximately 1,000 people and is located on the shores of Crystal Lake.
History
The area that is now known as Crystal Lakes was first settled in the early 1800s by a group of settlers from Connecticut. The settlers were attracted to the area due to its abundance of natural resources, including timber and fish. The settlers built a small village and named it Crystal Lakes.
The village grew slowly over the years and by the mid-1800s, it had become a popular destination for vacationers. The village was known for its beautiful scenery and its abundance of outdoor activities, such as fishing, hunting, and boating.
In the late 1800s, the village began to experience a period of growth and development. The village was incorporated in 1891 and the first mayor was elected in 1892. The village continued to grow and by the early 1900s, it had become a popular tourist destination.
Geography
Crystal Lakes is located in the northeastern part of Geauga County, Ohio. It is situated on the shores of Crystal Lake, which is a small lake that is part of the Chagrin River watershed. The village is surrounded by rolling hills and is located approximately 30 miles east of Cleveland.
The village has a total area of 0.6 square miles, all of which is land. The village is located at an elevation of 890 feet above sea level.
Economy
The economy of Crystal Lakes is largely based on tourism. The village is a popular destination for vacationers due to its abundance of outdoor activities, such as fishing, hunting, and boating. The village also has several restaurants, shops, and other businesses that cater to tourists.
The village also has a small manufacturing sector, which is primarily focused on the production of furniture and other wood products.
Demographics
As of the 2010 census, the population of Crystal Lakes was 1,000. The racial makeup of the village was 97.2% White, 0.7% African American, 0.2% Native American, 0.2% Asian, 0.2% from other races, and 1.7% from two or more races. Hispanic or Latino of any race were 0.7% of the population.
The median income for a household in the village was $45,000 and the median income for a family was $50,000. The per capita income for the village was $20,000. About 8.3% of families and 10.3% of the population were below the poverty line, including 14.3% of those under age 18 and none of those age 65 or over.
Conclusion
Crystal Lakes is a small village located in the state of Ohio, United States. It is situated in the county of Geauga and is part of the Cleveland-Elyria-Mentor Metropolitan Statistical Area. The village has a population of approximately 1,000 people and is located on the shores of Crystal Lake. The economy of Crystal Lakes is largely based on tourism and the village has several restaurants, shops, and other businesses that cater to tourists. The racial makeup of the village is 97.2% White, 0.7% African American, 0.2% Native American, 0.2% Asian, 0.2% from other races, and 1.7% from two or more races. The median income for a household in the village was $45,000 and the median income for a family was $50,000.
Common Questions
What is Per Capita Income in Crystal Lakes?
Per Capita income in Crystal Lakes is $26,152.
What is the Median Family Income in Crystal Lakes?
Median Family Income in Crystal Lakes is $59,006.
What is the Median Household income in Crystal Lakes?
Median Household Income in Crystal Lakes is $55,714.
What is Income or Wage Gap in Crystal Lakes?
Income or Wage Gap in Crystal Lakes is 68.0%.
Women in Crystal Lakes earn 32.0 cents for every dollar earned by a man.
What is Inequality or Gini Index in Crystal Lakes?
Inequality or Gini Index in Crystal Lakes is 0.47.
What is the Total Population of Crystal Lakes?
Total Population of Crystal Lakes is 1,605.
What is the Total Male Population of Crystal Lakes?
Total Male Population of Crystal Lakes is 652.
What is the Total Female Population of Crystal Lakes?
Total Female Population of Crystal Lakes is 953.
What is the Ratio of Males per 100 Females in Crystal Lakes?
There are 68.42 Males per 100 Females in Crystal Lakes.
What is the Ratio of Females per 100 Males in Crystal Lakes?
There are 146.17 Females per 100 Males in Crystal Lakes.
What is the Median Population Age in Crystal Lakes?
Median Population Age in Crystal Lakes is 38.8 Years.
What is the Average Family Size in Crystal Lakes
Average Family Size in Crystal Lakes is 3.1 People.
What is the Average Household Size in Crystal Lakes
Average Household Size in Crystal Lakes is 2.8 People.
How Large is the Labor Force in Crystal Lakes?
There are 663 People in the Labor Forcein in Crystal Lakes.
What is the Percentage of People in the Labor Force in Crystal Lakes?
54.8% of People are in the Labor Force in Crystal Lakes.
What is the Unemployment Rate in Crystal Lakes?
Unemployment Rate in Crystal Lakes is 9.8%.