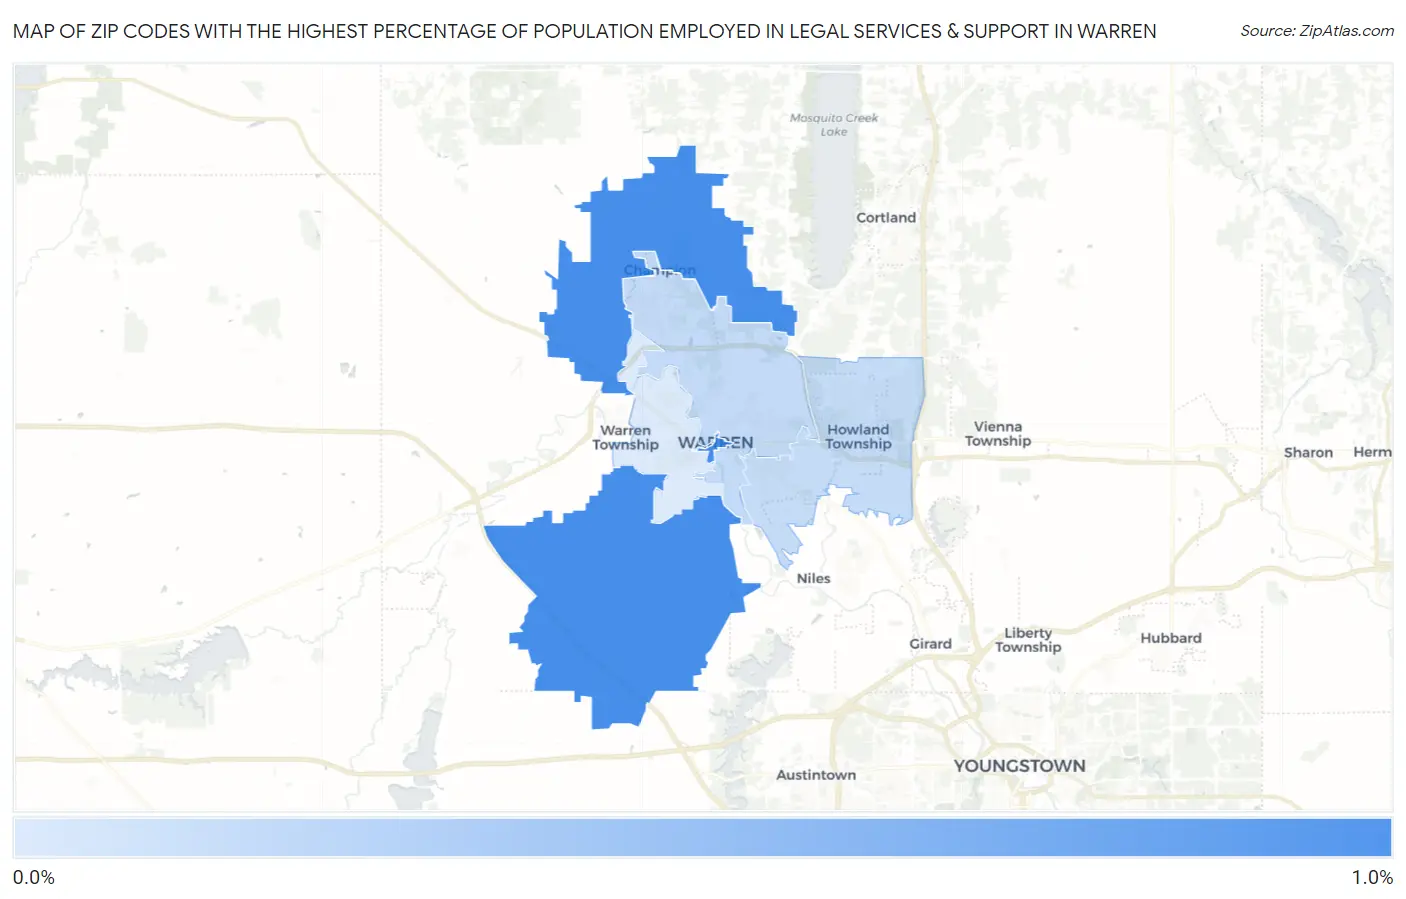
Zip Codes with the Highest Percentage of Population Employed in Legal Services & Support in Warren, OH
RELATED REPORTS & OPTIONS
Legal Services & Support
Warren
Compare Zip Codes
Map of Zip Codes with the Highest Percentage of Population Employed in Legal Services & Support in Warren
0.13%
0.90%
Zip Codes with the Highest Percentage of Population Employed in Legal Services & Support in Warren, OH
| Zip Code | % Employed | vs State | vs National | |
| 1. | 44481 | 0.90% | 0.92%(-0.020)#258 | 1.2%(-0.279)#8,563 |
| 2. | 44483 | 0.26% | 0.92%(-0.662)#547 | 1.2%(-0.921)#15,483 |
| 3. | 44484 | 0.25% | 0.92%(-0.672)#549 | 1.2%(-0.931)#15,594 |
| 4. | 44485 | 0.13% | 0.92%(-0.795)#614 | 1.2%(-1.05)#16,874 |
1
Common Questions
What are the Top 3 Zip Codes with the Highest Percentage of Population Employed in Legal Services & Support in Warren, OH?
Top 3 Zip Codes with the Highest Percentage of Population Employed in Legal Services & Support in Warren, OH are:
What zip code has the Highest Percentage of Population Employed in Legal Services & Support in Warren, OH?
44481 has the Highest Percentage of Population Employed in Legal Services & Support in Warren, OH with 0.90%.
What is the Percentage of Population Employed in Legal Services & Support in Warren, OH?
Percentage of Population Employed in Legal Services & Support in Warren is 0.19%.
What is the Percentage of Population Employed in Legal Services & Support in Ohio?
Percentage of Population Employed in Legal Services & Support in Ohio is 0.92%.
What is the Percentage of Population Employed in Legal Services & Support in the United States?
Percentage of Population Employed in Legal Services & Support in the United States is 1.2%.