Zip Codes with the Highest Percentage of Population Employed in Legal Services & Support in Ohio
RELATED REPORTS & OPTIONS
Legal Services & Support
Ohio
Compare Zip Codes
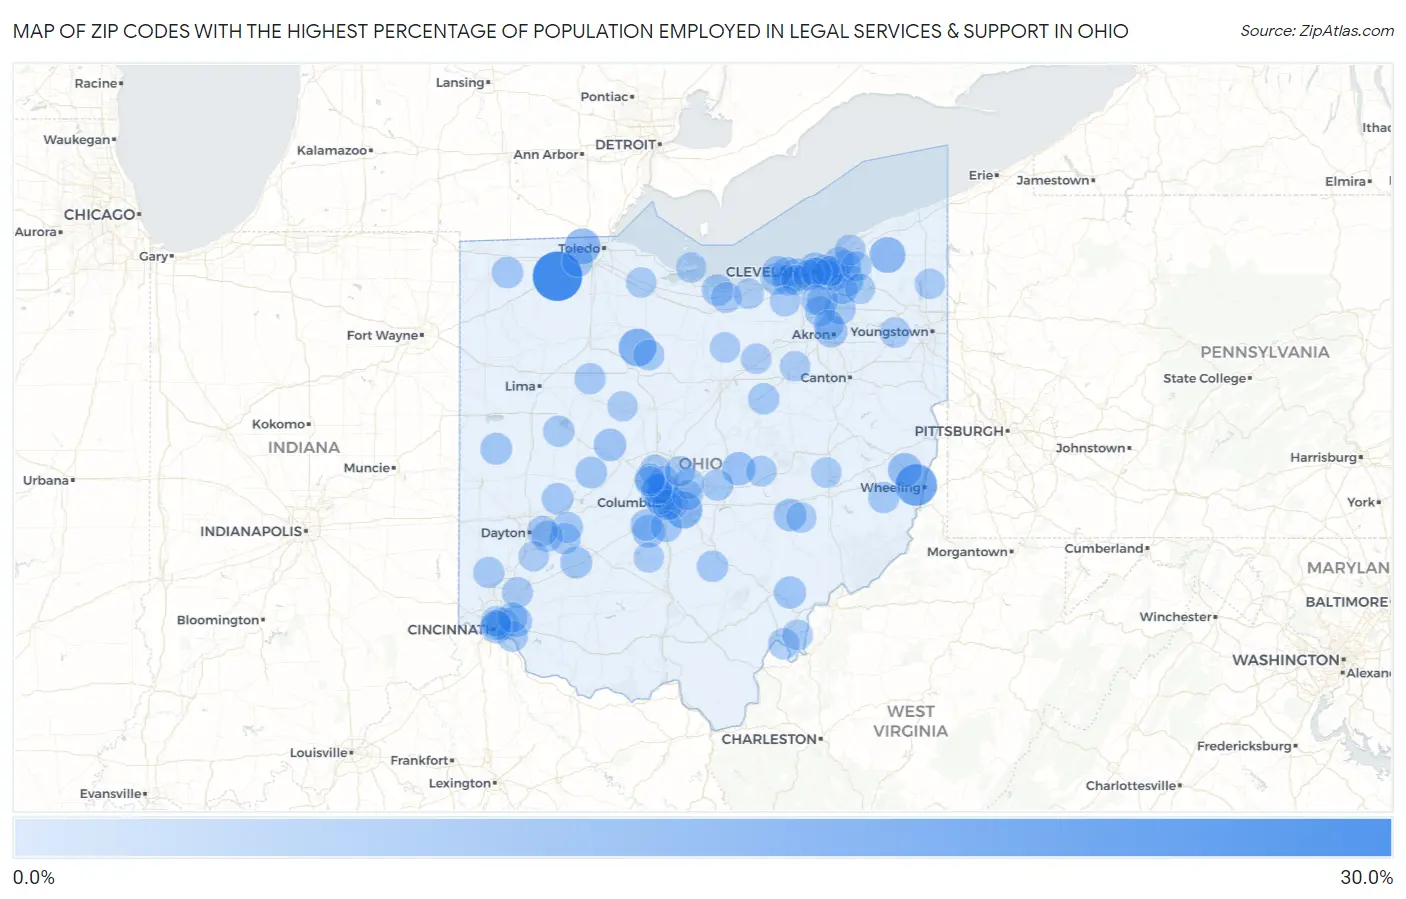
Map of Zip Codes with the Highest Percentage of Population Employed in Legal Services & Support in Ohio
0.0%
30.0%
Zip Codes with the Highest Percentage of Population Employed in Legal Services & Support in Ohio
| Zip Code | % Employed | vs State | vs National | |
| 1. | 43510 | 27.3% | 0.92%(+26.3)#1 | 1.2%(+26.1)#26 |
| 2. | 43934 | 16.7% | 0.92%(+15.7)#2 | 1.2%(+15.5)#71 |
| 3. | 44844 | 11.3% | 0.92%(+10.4)#3 | 1.2%(+10.1)#126 |
| 4. | 43109 | 10.5% | 0.92%(+9.60)#4 | 1.2%(+9.34)#142 |
| 5. | 44064 | 8.9% | 0.92%(+7.93)#5 | 1.2%(+7.67)#204 |
| 6. | 43617 | 8.6% | 0.92%(+7.72)#6 | 1.2%(+7.46)#217 |
| 7. | 43974 | 6.8% | 0.92%(+5.89)#7 | 1.2%(+5.63)#365 |
| 8. | 43071 | 5.9% | 0.92%(+4.98)#8 | 1.2%(+4.72)#499 |
| 9. | 43146 | 5.2% | 0.92%(+4.27)#9 | 1.2%(+4.01)#664 |
| 10. | 44116 | 5.2% | 0.92%(+4.23)#10 | 1.2%(+3.97)#678 |
| 11. | 43067 | 4.8% | 0.92%(+3.86)#11 | 1.2%(+3.60)#784 |
| 12. | 43734 | 4.8% | 0.92%(+3.83)#12 | 1.2%(+3.57)#797 |
| 13. | 44114 | 4.6% | 0.92%(+3.71)#13 | 1.2%(+3.45)#838 |
| 14. | 44303 | 4.6% | 0.92%(+3.71)#14 | 1.2%(+3.45)#840 |
| 15. | 44022 | 4.5% | 0.92%(+3.61)#15 | 1.2%(+3.35)#883 |
| 16. | 44040 | 4.3% | 0.92%(+3.36)#16 | 1.2%(+3.10)#986 |
| 17. | 45778 | 4.3% | 0.92%(+3.34)#17 | 1.2%(+3.08)#995 |
| 18. | 43215 | 4.2% | 0.92%(+3.26)#18 | 1.2%(+3.00)#1,027 |
| 19. | 44113 | 4.1% | 0.92%(+3.19)#19 | 1.2%(+2.93)#1,068 |
| 20. | 45208 | 4.0% | 0.92%(+3.11)#20 | 1.2%(+2.85)#1,108 |
| 21. | 45164 | 4.0% | 0.92%(+3.04)#21 | 1.2%(+2.78)#1,145 |
| 22. | 45388 | 3.8% | 0.92%(+2.87)#22 | 1.2%(+2.61)#1,239 |
| 23. | 43009 | 3.7% | 0.92%(+2.73)#23 | 1.2%(+2.48)#1,310 |
| 24. | 43209 | 3.6% | 0.92%(+2.67)#24 | 1.2%(+2.41)#1,353 |
| 25. | 44839 | 3.6% | 0.92%(+2.67)#25 | 1.2%(+2.41)#1,355 |
| 26. | 45174 | 3.6% | 0.92%(+2.65)#26 | 1.2%(+2.39)#1,364 |
| 27. | 43126 | 3.6% | 0.92%(+2.63)#27 | 1.2%(+2.37)#1,386 |
| 28. | 45349 | 3.5% | 0.92%(+2.61)#28 | 1.2%(+2.36)#1,398 |
| 29. | 43557 | 3.5% | 0.92%(+2.60)#29 | 1.2%(+2.34)#1,411 |
| 30. | 45202 | 3.5% | 0.92%(+2.58)#30 | 1.2%(+2.32)#1,431 |
| 31. | 43023 | 3.4% | 0.92%(+2.51)#31 | 1.2%(+2.25)#1,481 |
| 32. | 44236 | 3.4% | 0.92%(+2.50)#32 | 1.2%(+2.24)#1,490 |
| 33. | 43137 | 3.4% | 0.92%(+2.49)#33 | 1.2%(+2.23)#1,496 |
| 34. | 44011 | 3.4% | 0.92%(+2.44)#34 | 1.2%(+2.18)#1,521 |
| 35. | 44122 | 3.3% | 0.92%(+2.42)#35 | 1.2%(+2.16)#1,540 |
| 36. | 43149 | 3.2% | 0.92%(+2.26)#36 | 1.2%(+2.00)#1,663 |
| 37. | 44638 | 3.1% | 0.92%(+2.19)#37 | 1.2%(+1.93)#1,737 |
| 38. | 45779 | 3.1% | 0.92%(+2.14)#38 | 1.2%(+1.88)#1,789 |
| 39. | 45836 | 3.1% | 0.92%(+2.13)#39 | 1.2%(+1.87)#1,797 |
| 40. | 43333 | 3.0% | 0.92%(+2.10)#40 | 1.2%(+1.84)#1,822 |
| 41. | 43542 | 3.0% | 0.92%(+2.07)#41 | 1.2%(+1.81)#1,856 |
| 42. | 43719 | 3.0% | 0.92%(+2.06)#42 | 1.2%(+1.80)#1,864 |
| 43. | 44143 | 3.0% | 0.92%(+2.03)#43 | 1.2%(+1.77)#1,897 |
| 44. | 44140 | 2.9% | 0.92%(+2.01)#44 | 1.2%(+1.75)#1,923 |
| 45. | 43221 | 2.9% | 0.92%(+2.00)#45 | 1.2%(+1.74)#1,932 |
| 46. | 44141 | 2.9% | 0.92%(+1.99)#46 | 1.2%(+1.73)#1,949 |
| 47. | 45384 | 2.9% | 0.92%(+1.97)#47 | 1.2%(+1.71)#1,977 |
| 48. | 43212 | 2.9% | 0.92%(+1.95)#48 | 1.2%(+1.69)#1,998 |
| 49. | 45255 | 2.9% | 0.92%(+1.95)#49 | 1.2%(+1.69)#2,000 |
| 50. | 45062 | 2.8% | 0.92%(+1.91)#50 | 1.2%(+1.65)#2,038 |
| 51. | 45387 | 2.8% | 0.92%(+1.90)#51 | 1.2%(+1.64)#2,052 |
| 52. | 44145 | 2.8% | 0.92%(+1.87)#52 | 1.2%(+1.62)#2,086 |
| 53. | 44882 | 2.8% | 0.92%(+1.85)#53 | 1.2%(+1.59)#2,113 |
| 54. | 43214 | 2.7% | 0.92%(+1.80)#54 | 1.2%(+1.54)#2,179 |
| 55. | 43065 | 2.7% | 0.92%(+1.79)#55 | 1.2%(+1.54)#2,181 |
| 56. | 45434 | 2.7% | 0.92%(+1.77)#56 | 1.2%(+1.51)#2,213 |
| 57. | 44120 | 2.6% | 0.92%(+1.68)#57 | 1.2%(+1.42)#2,342 |
| 58. | 43054 | 2.5% | 0.92%(+1.61)#58 | 1.2%(+1.35)#2,460 |
| 59. | 43085 | 2.5% | 0.92%(+1.59)#59 | 1.2%(+1.33)#2,484 |
| 60. | 45040 | 2.5% | 0.92%(+1.59)#60 | 1.2%(+1.33)#2,486 |
| 61. | 45431 | 2.5% | 0.92%(+1.54)#61 | 1.2%(+1.29)#2,564 |
| 62. | 44139 | 2.5% | 0.92%(+1.53)#62 | 1.2%(+1.27)#2,594 |
| 63. | 44012 | 2.4% | 0.92%(+1.49)#63 | 1.2%(+1.23)#2,662 |
| 64. | 44106 | 2.4% | 0.92%(+1.48)#64 | 1.2%(+1.22)#2,668 |
| 65. | 45743 | 2.4% | 0.92%(+1.48)#65 | 1.2%(+1.22)#2,671 |
| 66. | 44118 | 2.4% | 0.92%(+1.47)#66 | 1.2%(+1.21)#2,694 |
| 67. | 43206 | 2.4% | 0.92%(+1.45)#67 | 1.2%(+1.19)#2,717 |
| 68. | 43822 | 2.3% | 0.92%(+1.39)#68 | 1.2%(+1.13)#2,812 |
| 69. | 44814 | 2.3% | 0.92%(+1.37)#69 | 1.2%(+1.11)#2,859 |
| 70. | 44102 | 2.3% | 0.92%(+1.35)#70 | 1.2%(+1.10)#2,874 |
| 71. | 43220 | 2.3% | 0.92%(+1.33)#71 | 1.2%(+1.07)#2,936 |
| 72. | 44286 | 2.2% | 0.92%(+1.29)#72 | 1.2%(+1.03)#3,013 |
| 73. | 43017 | 2.1% | 0.92%(+1.20)#73 | 1.2%(+0.946)#3,182 |
| 74. | 44094 | 2.1% | 0.92%(+1.20)#74 | 1.2%(+0.939)#3,189 |
| 75. | 43727 | 2.1% | 0.92%(+1.18)#75 | 1.2%(+0.924)#3,213 |
| 76. | 43442 | 2.1% | 0.92%(+1.17)#76 | 1.2%(+0.916)#3,228 |
| 77. | 44417 | 2.1% | 0.92%(+1.16)#77 | 1.2%(+0.903)#3,250 |
| 78. | 44866 | 2.1% | 0.92%(+1.15)#78 | 1.2%(+0.895)#3,268 |
| 79. | 44677 | 2.1% | 0.92%(+1.15)#79 | 1.2%(+0.889)#3,287 |
| 80. | 43004 | 2.1% | 0.92%(+1.15)#80 | 1.2%(+0.888)#3,293 |
| 81. | 43749 | 2.1% | 0.92%(+1.14)#81 | 1.2%(+0.881)#3,299 |
| 82. | 44429 | 2.0% | 0.92%(+1.11)#82 | 1.2%(+0.849)#3,382 |
| 83. | 43164 | 2.0% | 0.92%(+1.11)#83 | 1.2%(+0.847)#3,388 |
| 84. | 45229 | 2.0% | 0.92%(+1.09)#84 | 1.2%(+0.829)#3,444 |
| 85. | 44837 | 2.0% | 0.92%(+1.07)#85 | 1.2%(+0.815)#3,487 |
| 86. | 45243 | 2.0% | 0.92%(+1.06)#86 | 1.2%(+0.803)#3,513 |
| 87. | 44001 | 2.0% | 0.92%(+1.04)#87 | 1.2%(+0.777)#3,573 |
| 88. | 44126 | 1.9% | 0.92%(+1.02)#88 | 1.2%(+0.761)#3,614 |
| 89. | 45458 | 1.9% | 0.92%(+1.01)#89 | 1.2%(+0.755)#3,634 |
| 90. | 44028 | 1.9% | 0.92%(+1.01)#90 | 1.2%(+0.754)#3,636 |
| 91. | 44115 | 1.9% | 0.92%(+1.01)#91 | 1.2%(+0.748)#3,650 |
| 92. | 43082 | 1.9% | 0.92%(+1.000)#92 | 1.2%(+0.741)#3,664 |
| 93. | 44026 | 1.9% | 0.92%(+0.982)#93 | 1.2%(+0.723)#3,715 |
| 94. | 43332 | 1.9% | 0.92%(+0.980)#94 | 1.2%(+0.721)#3,722 |
| 95. | 44147 | 1.9% | 0.92%(+0.961)#95 | 1.2%(+0.702)#3,767 |
| 96. | 43440 | 1.9% | 0.92%(+0.940)#96 | 1.2%(+0.681)#3,822 |
| 97. | 45206 | 1.9% | 0.92%(+0.938)#97 | 1.2%(+0.679)#3,831 |
| 98. | 44313 | 1.9% | 0.92%(+0.938)#98 | 1.2%(+0.679)#3,833 |
| 99. | 43016 | 1.9% | 0.92%(+0.932)#99 | 1.2%(+0.673)#3,850 |
| 100. | 44023 | 1.9% | 0.92%(+0.928)#100 | 1.2%(+0.669)#3,857 |
Common Questions
What are the Top 10 Zip Codes with the Highest Percentage of Population Employed in Legal Services & Support in Ohio?
Top 10 Zip Codes with the Highest Percentage of Population Employed in Legal Services & Support in Ohio are:
What zip code has the Highest Percentage of Population Employed in Legal Services & Support in Ohio?
43510 has the Highest Percentage of Population Employed in Legal Services & Support in Ohio with 27.3%.
What is the Percentage of Population Employed in Legal Services & Support in the State of Ohio?
Percentage of Population Employed in Legal Services & Support in Ohio is 0.92%.
What is the Percentage of Population Employed in Legal Services & Support in the United States?
Percentage of Population Employed in Legal Services & Support in the United States is 1.2%.