Fruit Hill, OH Map & Demographics
Fruit Hill Map
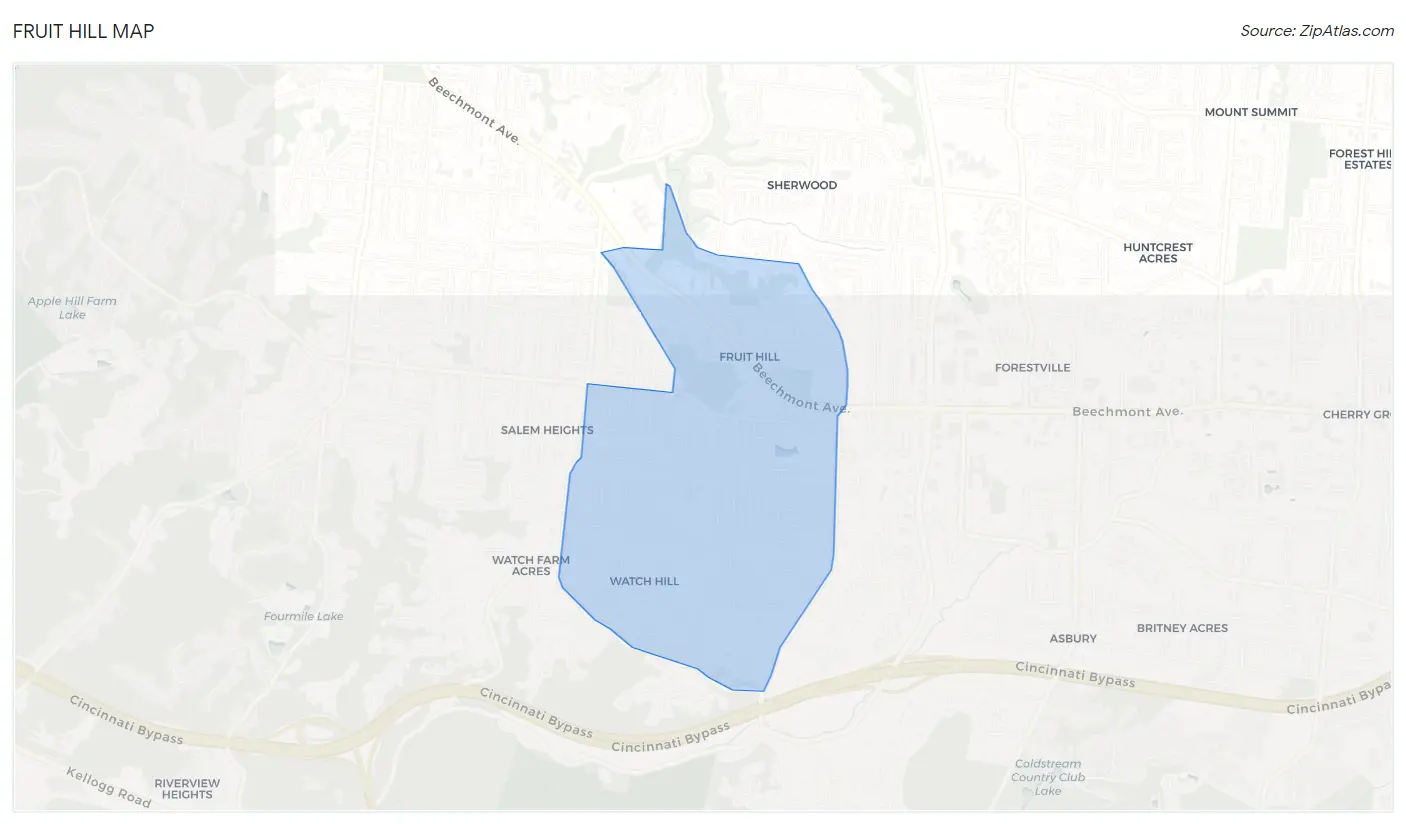
Fruit Hill Overview
$42,679
PER CAPITA INCOME
$98,778
AVG FAMILY INCOME
$98,361
AVG HOUSEHOLD INCOME
0.41
INEQUALITY / GINI INDEX
4,157
TOTAL POPULATION
1,709
MALE POPULATION
2,448
FEMALE POPULATION
69.81
MALES / 100 FEMALES
143.24
FEMALES / 100 MALES
37.8
MEDIAN AGE
3.1
AVG FAMILY SIZE
2.7
AVG HOUSEHOLD SIZE
2,275
LABOR FORCE [ PEOPLE ]
74.7%
PERCENT IN LABOR FORCE
2.7%
UNEMPLOYMENT RATE
Income in Fruit Hill
Income Overview in Fruit Hill
Per Capita Income in Fruit Hill is $42,679, while median incomes of families and households are $98,778 and $98,361 respectively.
| Characteristic | Number | Measure |
| Per Capita Income | 4,157 | $42,679 |
| Median Family Income | 1,162 | $98,778 |
| Mean Family Income | 1,162 | $127,597 |
| Median Household Income | 1,499 | $98,361 |
| Mean Household Income | 1,499 | $118,682 |
| Income Deficit | 1,162 | $0 |
| Wage / Income Gap (%) | 4,157 | 0.00% |
| Wage / Income Gap ($) | 4,157 | 100.00¢ per $1 |
| Gini / Inequality Index | 4,157 | 0.41 |
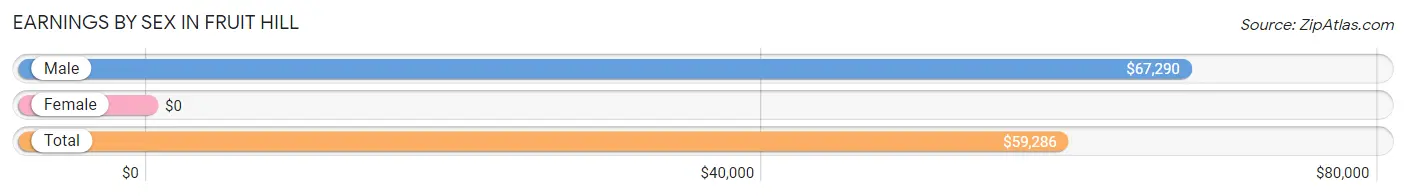
Earnings by Sex in Fruit Hill
| Sex | Number | Average Earnings |
| Male | 1,118 (48.5%) | $67,290 |
| Female | 1,188 (51.5%) | $0 |
| Total | 2,306 (100.0%) | $59,286 |
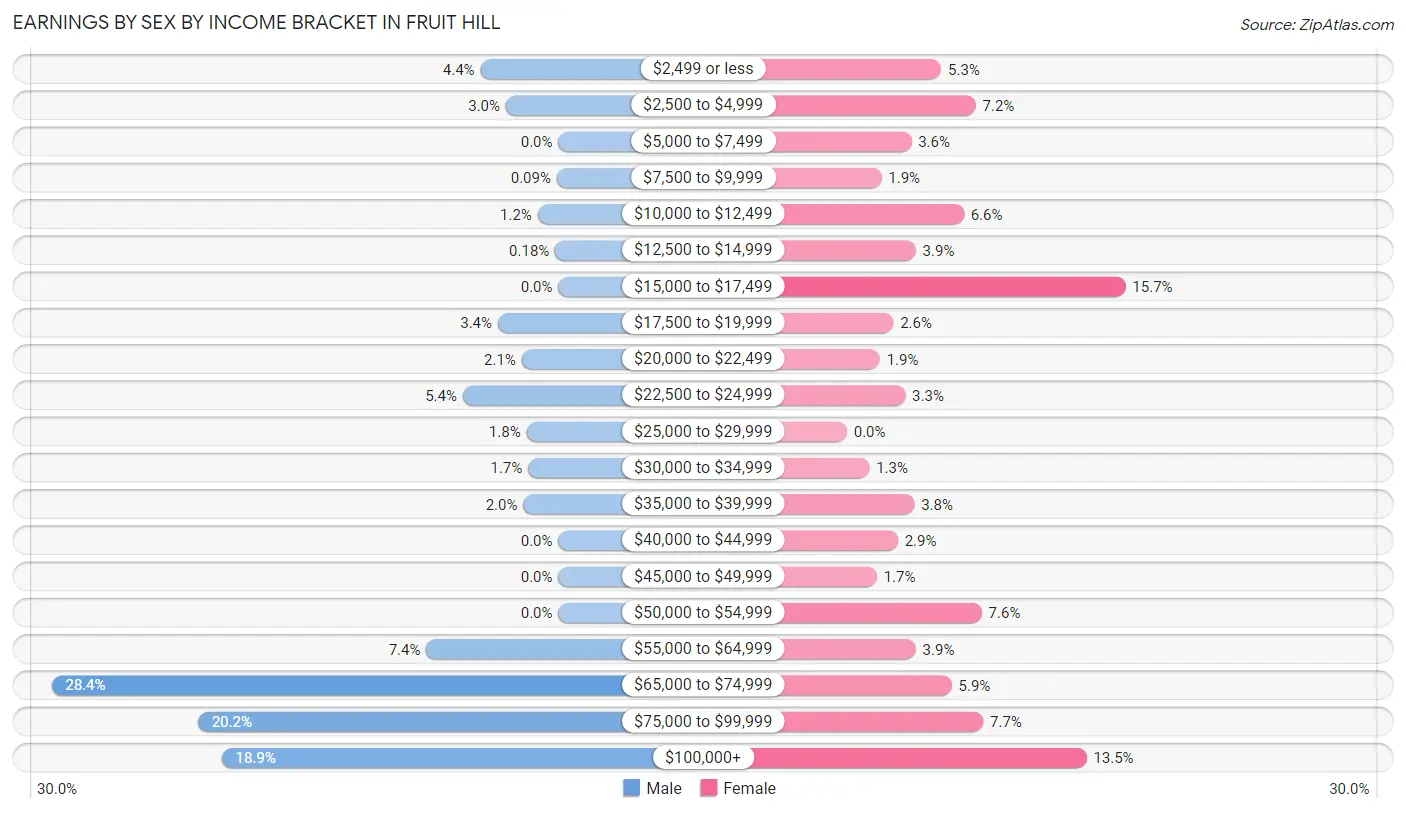
Earnings by Sex by Income Bracket in Fruit Hill
The most common earnings brackets in Fruit Hill are $65,000 to $74,999 for men (318 | 28.4%) and $15,000 to $17,499 for women (186 | 15.7%).
| Income | Male | Female |
| $2,499 or less | 49 (4.4%) | 63 (5.3%) |
| $2,500 to $4,999 | 33 (2.9%) | 86 (7.2%) |
| $5,000 to $7,499 | 0 (0.0%) | 43 (3.6%) |
| $7,500 to $9,999 | 1 (0.1%) | 23 (1.9%) |
| $10,000 to $12,499 | 13 (1.2%) | 78 (6.6%) |
| $12,500 to $14,999 | 2 (0.2%) | 46 (3.9%) |
| $15,000 to $17,499 | 0 (0.0%) | 186 (15.7%) |
| $17,500 to $19,999 | 38 (3.4%) | 31 (2.6%) |
| $20,000 to $22,499 | 23 (2.1%) | 22 (1.8%) |
| $22,500 to $24,999 | 60 (5.4%) | 39 (3.3%) |
| $25,000 to $29,999 | 20 (1.8%) | 0 (0.0%) |
| $30,000 to $34,999 | 19 (1.7%) | 15 (1.3%) |
| $35,000 to $39,999 | 22 (2.0%) | 45 (3.8%) |
| $40,000 to $44,999 | 0 (0.0%) | 34 (2.9%) |
| $45,000 to $49,999 | 0 (0.0%) | 20 (1.7%) |
| $50,000 to $54,999 | 0 (0.0%) | 90 (7.6%) |
| $55,000 to $64,999 | 83 (7.4%) | 46 (3.9%) |
| $65,000 to $74,999 | 318 (28.4%) | 70 (5.9%) |
| $75,000 to $99,999 | 226 (20.2%) | 91 (7.7%) |
| $100,000+ | 211 (18.9%) | 160 (13.5%) |
| Total | 1,118 (100.0%) | 1,188 (100.0%) |
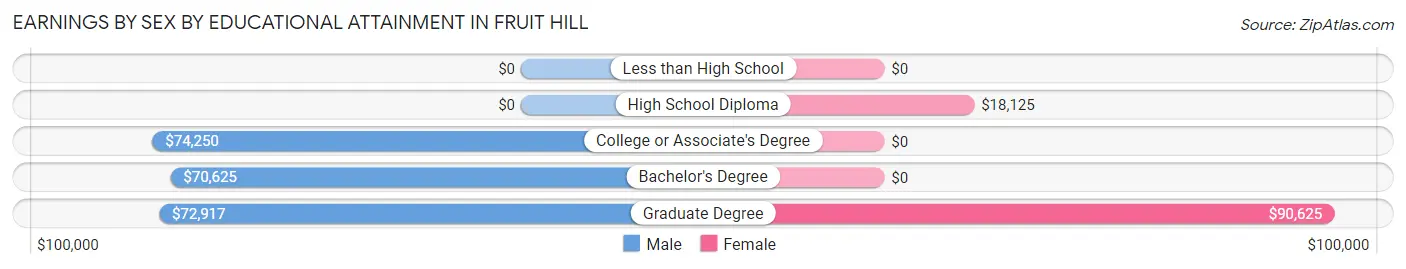
Earnings by Sex by Educational Attainment in Fruit Hill
Average earnings in Fruit Hill are $68,750 for men and $35,500 for women, a difference of 48.4%. Men with an educational attainment of college or associate's degree enjoy the highest average annual earnings of $74,250, while those with bachelor's degree education earn the least with $70,625. Women with an educational attainment of graduate degree earn the most with the average annual earnings of $90,625, while those with high school diploma education have the smallest earnings of $18,125.
| Educational Attainment | Male Income | Female Income |
| Less than High School | - | - |
| High School Diploma | - | - |
| College or Associate's Degree | $74,250 | $0 |
| Bachelor's Degree | $70,625 | $0 |
| Graduate Degree | $72,917 | $90,625 |
| Total | $68,750 | $35,500 |
Family Income in Fruit Hill
Family Income Brackets in Fruit Hill
According to the Fruit Hill family income data, there are 318 families falling into the $75,000 to $99,999 income range, which is the most common income bracket and makes up 27.4% of all families.
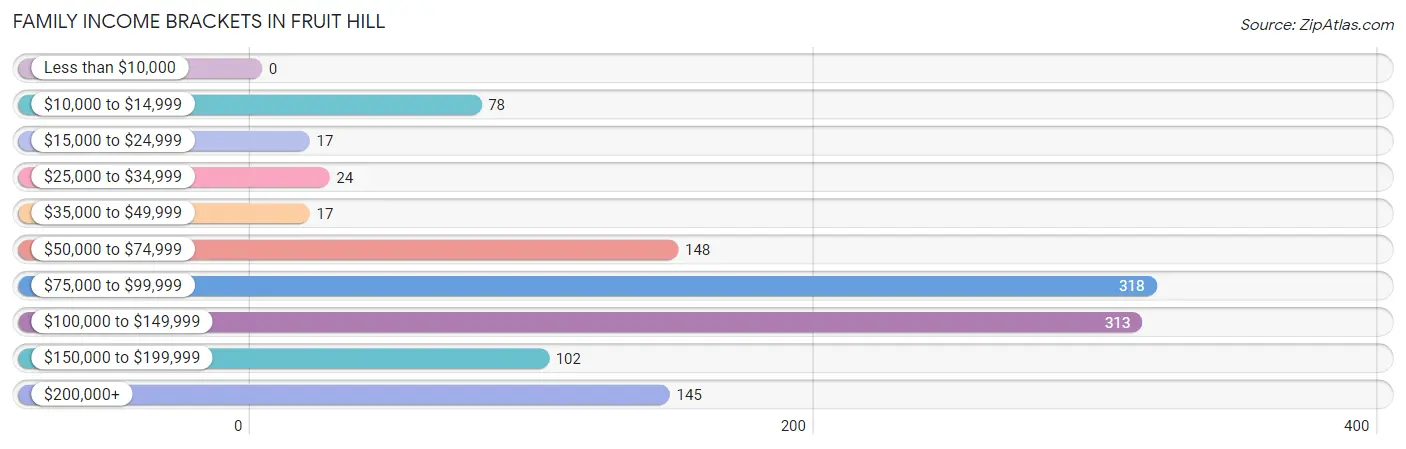
| Income Bracket | # Families | % Families |
| Less than $10,000 | 0 | 0.0% |
| $10,000 to $14,999 | 78 | 6.7% |
| $15,000 to $24,999 | 17 | 1.5% |
| $25,000 to $34,999 | 24 | 2.1% |
| $35,000 to $49,999 | 17 | 1.5% |
| $50,000 to $74,999 | 148 | 12.7% |
| $75,000 to $99,999 | 318 | 27.4% |
| $100,000 to $149,999 | 313 | 26.9% |
| $150,000 to $199,999 | 102 | 8.8% |
| $200,000+ | 145 | 12.5% |
Family Income by Famaliy Size in Fruit Hill
3-person families (261 | 22.5%) account for the highest median family income in Fruit Hill with $138,516 per family, while 2-person families (408 | 35.1%) have the highest median income of $49,140 per family member.
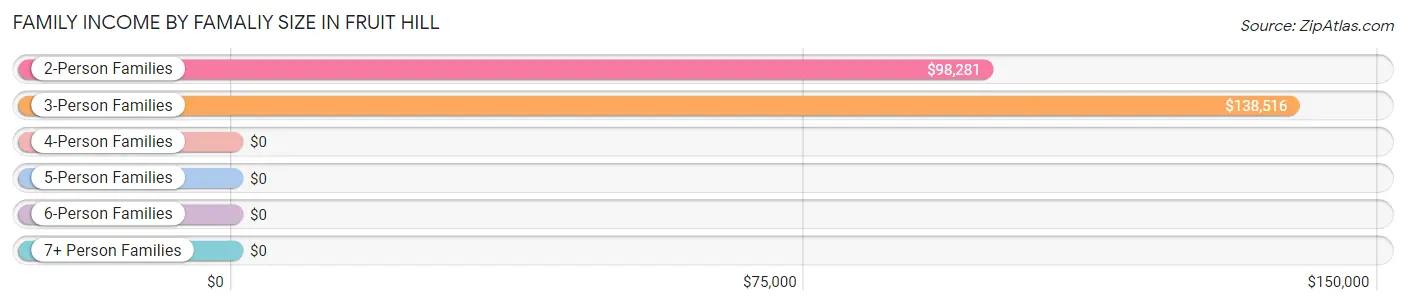
| Income Bracket | # Families | Median Income |
| 2-Person Families | 408 (35.1%) | $98,281 |
| 3-Person Families | 261 (22.5%) | $138,516 |
| 4-Person Families | 462 (39.8%) | $0 |
| 5-Person Families | 0 (0.0%) | $0 |
| 6-Person Families | 15 (1.3%) | $0 |
| 7+ Person Families | 16 (1.4%) | $0 |
| Total | 1,162 (100.0%) | $98,778 |
Family Income by Number of Earners in Fruit Hill
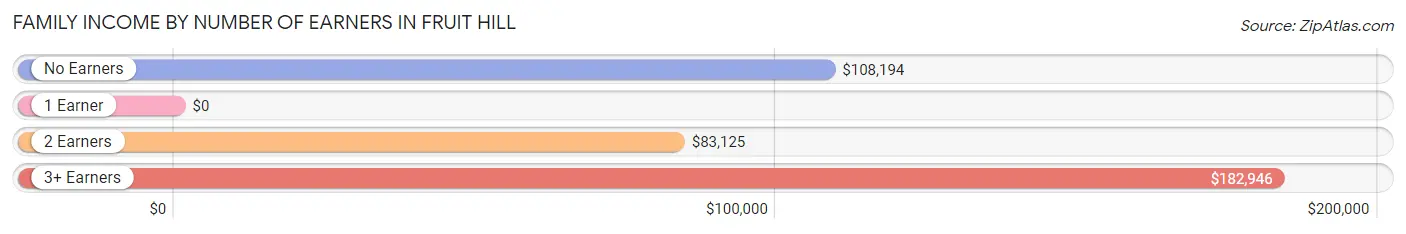
| Number of Earners | # Families | Median Income |
| No Earners | 115 (9.9%) | $108,194 |
| 1 Earner | 256 (22.0%) | $0 |
| 2 Earners | 648 (55.8%) | $83,125 |
| 3+ Earners | 143 (12.3%) | $182,946 |
| Total | 1,162 (100.0%) | $98,778 |
Household Income in Fruit Hill
Household Income Brackets in Fruit Hill
With 391 households falling in the category, the $100,000 to $149,999 income range is the most frequent in Fruit Hill, accounting for 26.1% of all households. In contrast, only 16 households (1.1%) fall into the less than $10,000 income bracket, making it the least populous group.
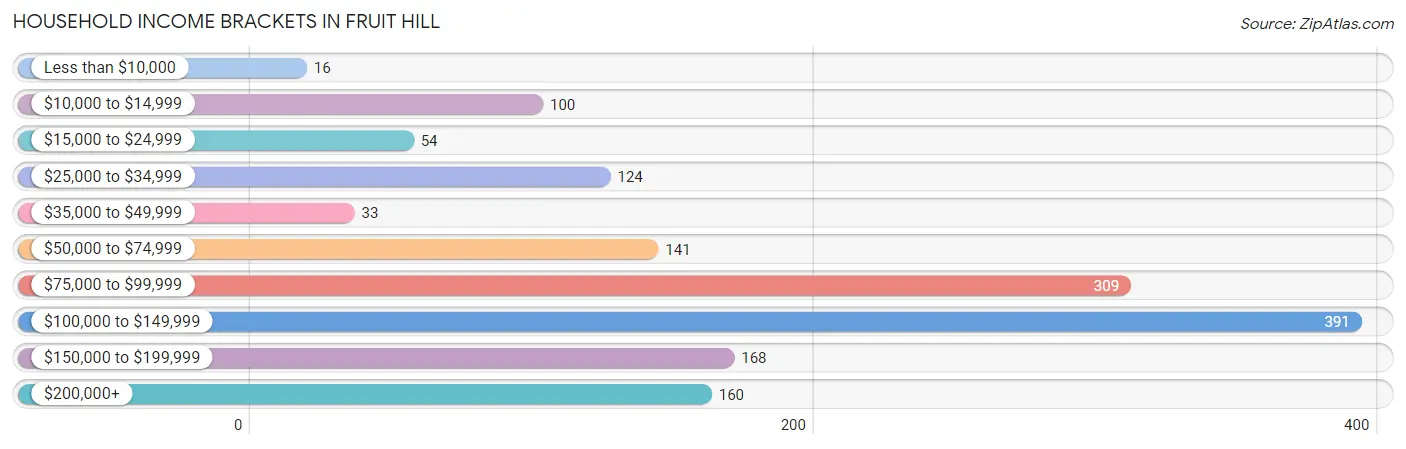
| Income Bracket | # Households | % Households |
| Less than $10,000 | 16 | 1.1% |
| $10,000 to $14,999 | 100 | 6.7% |
| $15,000 to $24,999 | 54 | 3.6% |
| $25,000 to $34,999 | 124 | 8.3% |
| $35,000 to $49,999 | 33 | 2.2% |
| $50,000 to $74,999 | 141 | 9.4% |
| $75,000 to $99,999 | 309 | 20.6% |
| $100,000 to $149,999 | 391 | 26.1% |
| $150,000 to $199,999 | 168 | 11.2% |
| $200,000+ | 160 | 10.7% |
Household Income by Householder Age in Fruit Hill
The median household income in Fruit Hill is $98,361, with the highest median household income of $116,302 found in the 45 to 64 years age bracket for the primary householder. A total of 541 households (36.1%) fall into this category. Meanwhile, the 15 to 24 years age bracket for the primary householder has the lowest median household income of $0, with 12 households (0.8%) in this group.
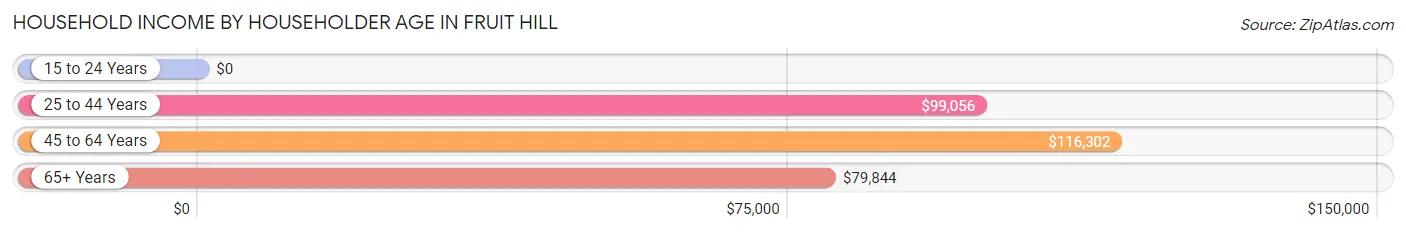
| Income Bracket | # Households | Median Income |
| 15 to 24 Years | 12 (0.8%) | $0 |
| 25 to 44 Years | 580 (38.7%) | $99,056 |
| 45 to 64 Years | 541 (36.1%) | $116,302 |
| 65+ Years | 366 (24.4%) | $79,844 |
| Total | 1,499 (100.0%) | $98,361 |
Poverty in Fruit Hill
Income Below Poverty by Sex and Age in Fruit Hill
With 5.2% poverty level for males and 13.8% for females among the residents of Fruit Hill, 18 to 24 year old males and 15 year old females are the most vulnerable to poverty, with 15 males (20.5%) and 59 females (100.0%) in their respective age groups living below the poverty level.
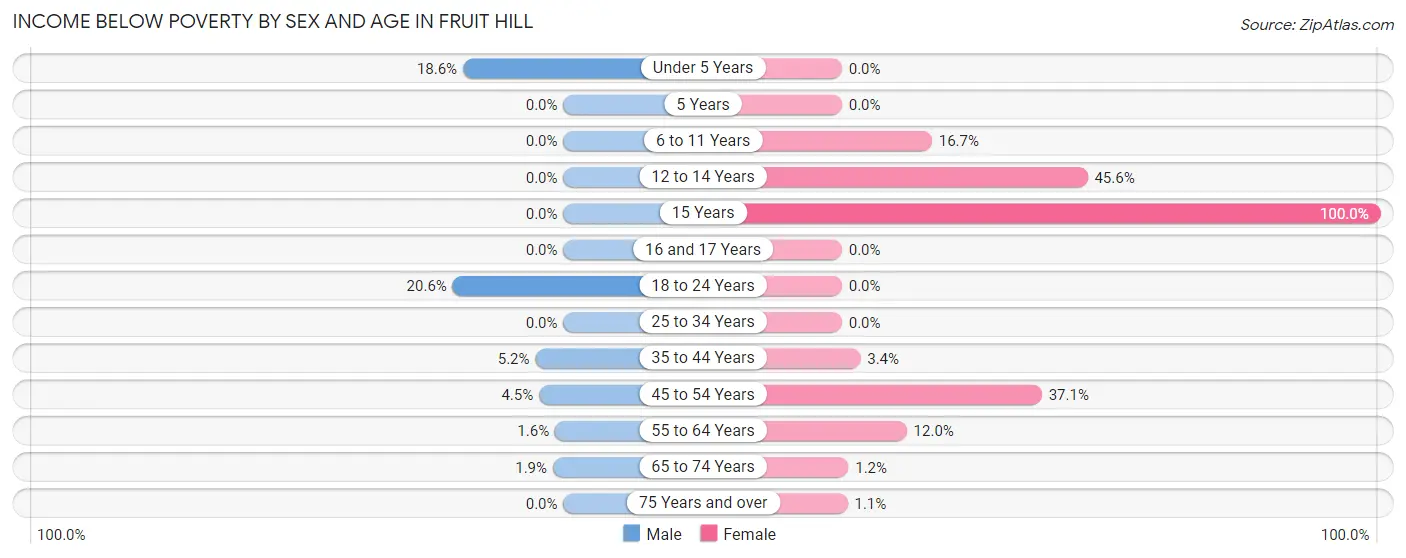
| Age Bracket | Male | Female |
| Under 5 Years | 33 (18.6%) | 0 (0.0%) |
| 5 Years | 0 (0.0%) | 0 (0.0%) |
| 6 to 11 Years | 0 (0.0%) | 73 (16.7%) |
| 12 to 14 Years | 0 (0.0%) | 57 (45.6%) |
| 15 Years | 0 (0.0%) | 59 (100.0%) |
| 16 and 17 Years | 0 (0.0%) | 0 (0.0%) |
| 18 to 24 Years | 15 (20.5%) | 0 (0.0%) |
| 25 to 34 Years | 0 (0.0%) | 0 (0.0%) |
| 35 to 44 Years | 18 (5.2%) | 15 (3.4%) |
| 45 to 54 Years | 16 (4.5%) | 95 (37.1%) |
| 55 to 64 Years | 2 (1.5%) | 23 (12.0%) |
| 65 to 74 Years | 2 (1.9%) | 2 (1.2%) |
| 75 Years and over | 0 (0.0%) | 2 (1.1%) |
| Total | 86 (5.2%) | 326 (13.8%) |
Income Above Poverty by Sex and Age in Fruit Hill
According to the poverty statistics in Fruit Hill, males aged 5 years and females aged under 5 years are the age groups that are most secure financially, with 100.0% of males and 100.0% of females in these age groups living above the poverty line.
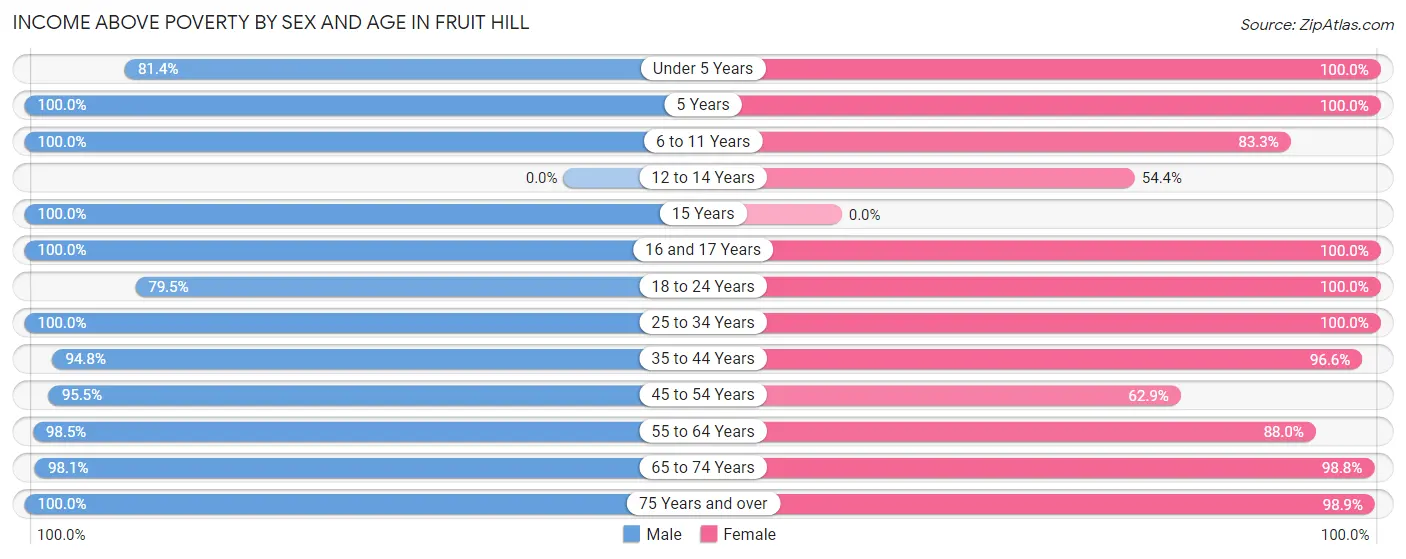
| Age Bracket | Male | Female |
| Under 5 Years | 144 (81.4%) | 112 (100.0%) |
| 5 Years | 29 (100.0%) | 8 (100.0%) |
| 6 to 11 Years | 97 (100.0%) | 364 (83.3%) |
| 12 to 14 Years | 0 (0.0%) | 68 (54.4%) |
| 15 Years | 32 (100.0%) | 0 (0.0%) |
| 16 and 17 Years | 33 (100.0%) | 56 (100.0%) |
| 18 to 24 Years | 58 (79.4%) | 62 (100.0%) |
| 25 to 34 Years | 233 (100.0%) | 271 (100.0%) |
| 35 to 44 Years | 329 (94.8%) | 422 (96.6%) |
| 45 to 54 Years | 339 (95.5%) | 161 (62.9%) |
| 55 to 64 Years | 127 (98.5%) | 168 (88.0%) |
| 65 to 74 Years | 101 (98.1%) | 164 (98.8%) |
| 75 Years and over | 60 (100.0%) | 187 (98.9%) |
| Total | 1,582 (94.8%) | 2,043 (86.2%) |
Income Below Poverty Among Married-Couple Families in Fruit Hill
The poverty statistics for married-couple families in Fruit Hill show that 1.7% or 15 of the total 904 families live below the poverty line. Families with 3 or 4 children have the highest poverty rate of 100.0%, comprising of 15 families. On the other hand, families with no children have the lowest poverty rate of 0.0%, which includes 0 families.
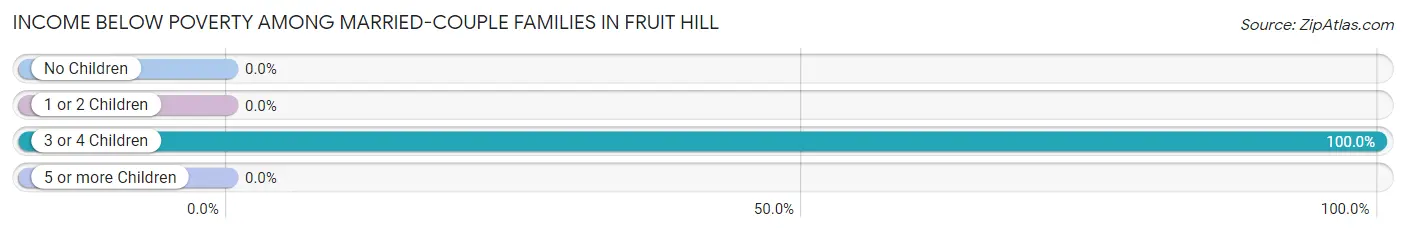
| Children | Above Poverty | Below Poverty |
| No Children | 410 (100.0%) | 0 (0.0%) |
| 1 or 2 Children | 466 (100.0%) | 0 (0.0%) |
| 3 or 4 Children | 0 (0.0%) | 15 (100.0%) |
| 5 or more Children | 13 (100.0%) | 0 (0.0%) |
| Total | 889 (98.3%) | 15 (1.7%) |
Income Below Poverty Among Single-Parent Households in Fruit Hill
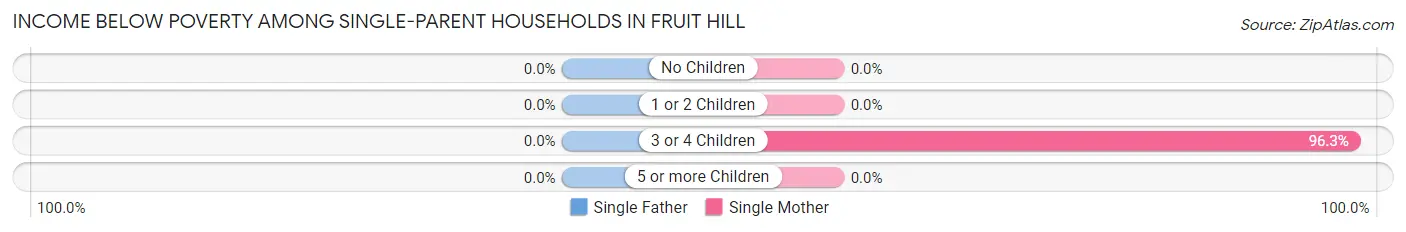
| Children | Single Father | Single Mother |
| No Children | 0 (0.0%) | 0 (0.0%) |
| 1 or 2 Children | 0 (0.0%) | 0 (0.0%) |
| 3 or 4 Children | 0 (0.0%) | 78 (96.3%) |
| 5 or more Children | 0 (0.0%) | 0 (0.0%) |
| Total | 0 (0.0%) | 78 (32.8%) |
Income Below Poverty Among Married-Couple vs Single-Parent Households in Fruit Hill
The poverty data for Fruit Hill shows that 15 of the married-couple family households (1.7%) and 78 of the single-parent households (30.2%) are living below the poverty level. Within the married-couple family households, those with 3 or 4 children have the highest poverty rate, with 15 households (100.0%) falling below the poverty line. Among the single-parent households, those with 3 or 4 children have the highest poverty rate, with 78 household (96.3%) living below poverty.
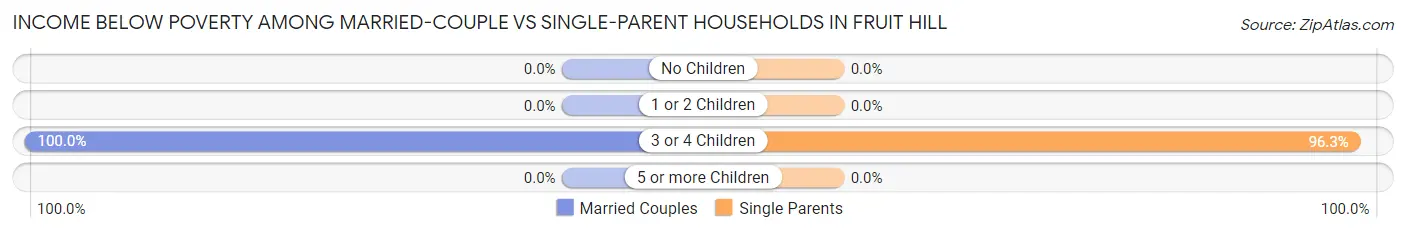
| Children | Married-Couple Families | Single-Parent Households |
| No Children | 0 (0.0%) | 0 (0.0%) |
| 1 or 2 Children | 0 (0.0%) | 0 (0.0%) |
| 3 or 4 Children | 15 (100.0%) | 78 (96.3%) |
| 5 or more Children | 0 (0.0%) | 0 (0.0%) |
| Total | 15 (1.7%) | 78 (30.2%) |
Race in Fruit Hill
The most populous races in Fruit Hill are White / Caucasian (3,915 | 94.2%), Two or more Races (160 | 3.8%), and Hispanic or Latino (153 | 3.7%).
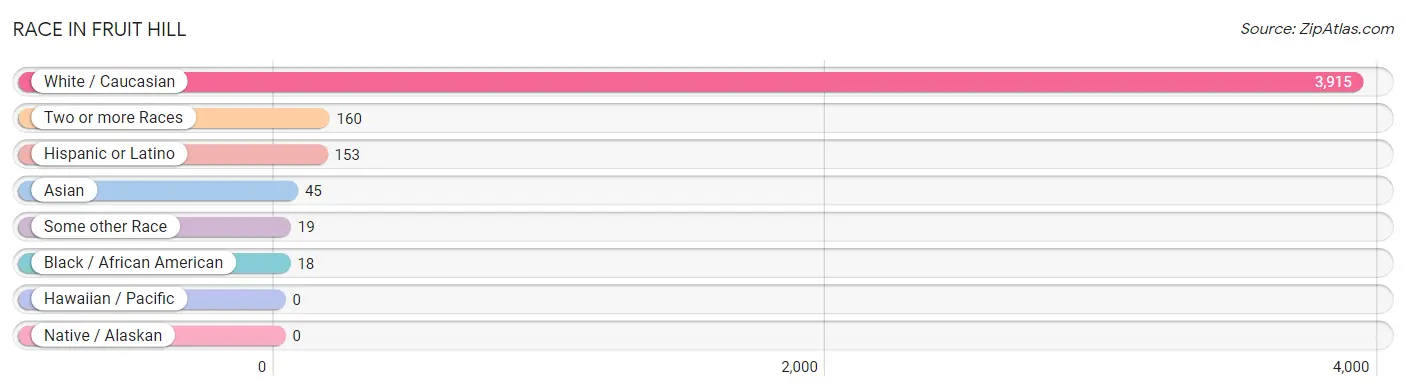
| Race | # Population | % Population |
| Asian | 45 | 1.1% |
| Black / African American | 18 | 0.4% |
| Hawaiian / Pacific | 0 | 0.0% |
| Hispanic or Latino | 153 | 3.7% |
| Native / Alaskan | 0 | 0.0% |
| White / Caucasian | 3,915 | 94.2% |
| Two or more Races | 160 | 3.8% |
| Some other Race | 19 | 0.5% |
| Total | 4,157 | 100.0% |
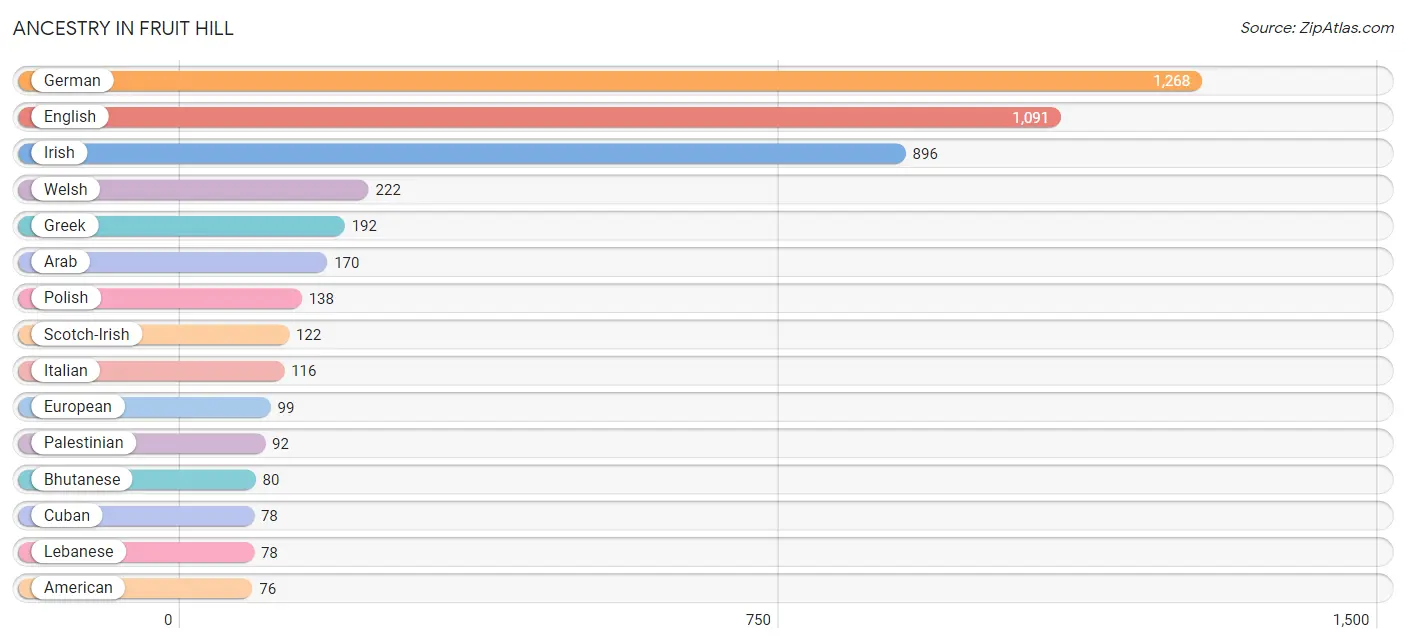
Ancestry in Fruit Hill
The most populous ancestries reported in Fruit Hill are German (1,268 | 30.5%), English (1,091 | 26.2%), Irish (896 | 21.5%), Welsh (222 | 5.3%), and Greek (192 | 4.6%), together accounting for 88.3% of all Fruit Hill residents.
| Ancestry | # Population | % Population |
| American | 76 | 1.8% |
| Arab | 170 | 4.1% |
| Armenian | 9 | 0.2% |
| Austrian | 33 | 0.8% |
| Bhutanese | 80 | 1.9% |
| British | 50 | 1.2% |
| Canadian | 24 | 0.6% |
| Chippewa | 8 | 0.2% |
| Cuban | 78 | 1.9% |
| Dutch | 53 | 1.3% |
| English | 1,091 | 26.2% |
| European | 99 | 2.4% |
| Finnish | 12 | 0.3% |
| French | 60 | 1.4% |
| German | 1,268 | 30.5% |
| Greek | 192 | 4.6% |
| Hungarian | 16 | 0.4% |
| Irish | 896 | 21.5% |
| Italian | 116 | 2.8% |
| Lebanese | 78 | 1.9% |
| Norwegian | 50 | 1.2% |
| Palestinian | 92 | 2.2% |
| Polish | 138 | 3.3% |
| Puerto Rican | 75 | 1.8% |
| Russian | 55 | 1.3% |
| Scotch-Irish | 122 | 2.9% |
| Scottish | 50 | 1.2% |
| Slovak | 14 | 0.3% |
| South African | 8 | 0.2% |
| Subsaharan African | 8 | 0.2% |
| Swedish | 12 | 0.3% |
| Welsh | 222 | 5.3% | View All 32 Rows |
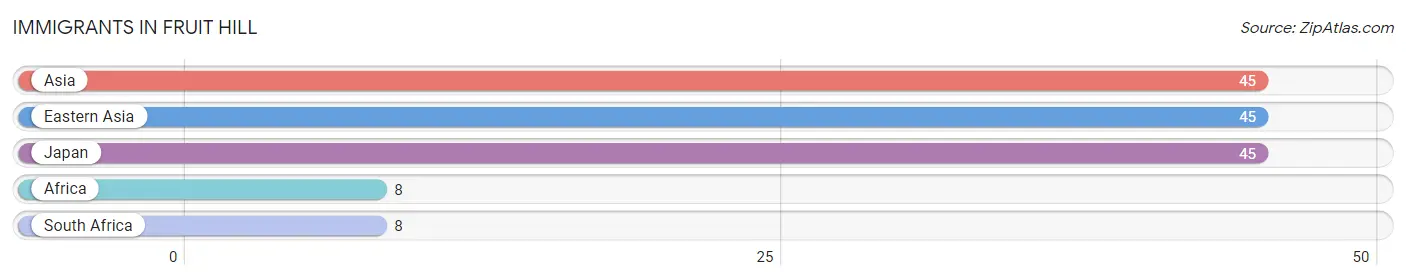
Immigrants in Fruit Hill
The most numerous immigrant groups reported in Fruit Hill came from Asia (45 | 1.1%), Eastern Asia (45 | 1.1%), Japan (45 | 1.1%), Africa (8 | 0.2%), and South Africa (8 | 0.2%), together accounting for 3.6% of all Fruit Hill residents.
| Immigration Origin | # Population | % Population |
| Africa | 8 | 0.2% |
| Asia | 45 | 1.1% |
| Eastern Asia | 45 | 1.1% |
| Japan | 45 | 1.1% |
| South Africa | 8 | 0.2% | View All 5 Rows |
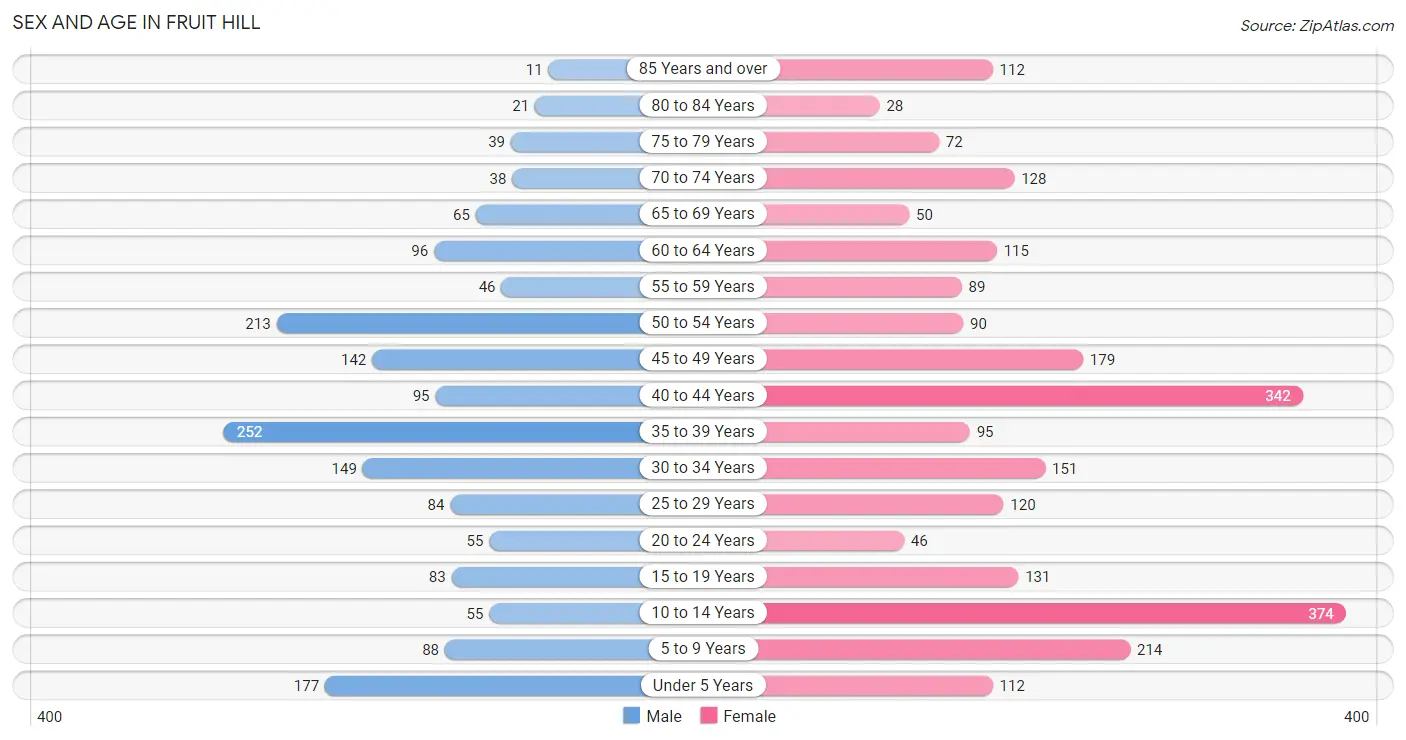
Sex and Age in Fruit Hill
Sex and Age in Fruit Hill
The most populous age groups in Fruit Hill are 35 to 39 Years (252 | 14.7%) for men and 10 to 14 Years (374 | 15.3%) for women.
| Age Bracket | Male | Female |
| Under 5 Years | 177 (10.4%) | 112 (4.6%) |
| 5 to 9 Years | 88 (5.1%) | 214 (8.7%) |
| 10 to 14 Years | 55 (3.2%) | 374 (15.3%) |
| 15 to 19 Years | 83 (4.9%) | 131 (5.3%) |
| 20 to 24 Years | 55 (3.2%) | 46 (1.9%) |
| 25 to 29 Years | 84 (4.9%) | 120 (4.9%) |
| 30 to 34 Years | 149 (8.7%) | 151 (6.2%) |
| 35 to 39 Years | 252 (14.7%) | 95 (3.9%) |
| 40 to 44 Years | 95 (5.6%) | 342 (14.0%) |
| 45 to 49 Years | 142 (8.3%) | 179 (7.3%) |
| 50 to 54 Years | 213 (12.5%) | 90 (3.7%) |
| 55 to 59 Years | 46 (2.7%) | 89 (3.6%) |
| 60 to 64 Years | 96 (5.6%) | 115 (4.7%) |
| 65 to 69 Years | 65 (3.8%) | 50 (2.0%) |
| 70 to 74 Years | 38 (2.2%) | 128 (5.2%) |
| 75 to 79 Years | 39 (2.3%) | 72 (2.9%) |
| 80 to 84 Years | 21 (1.2%) | 28 (1.1%) |
| 85 Years and over | 11 (0.6%) | 112 (4.6%) |
| Total | 1,709 (100.0%) | 2,448 (100.0%) |
Families and Households in Fruit Hill
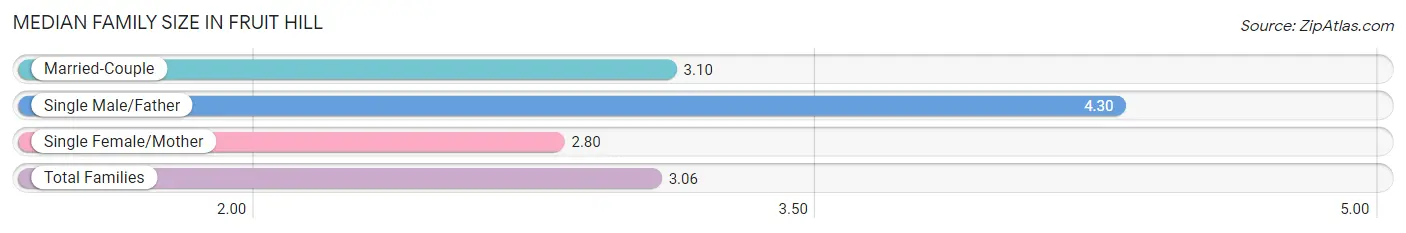
Median Family Size in Fruit Hill
The median family size in Fruit Hill is 3.06 persons per family, with single male/father families (20 | 1.7%) accounting for the largest median family size of 4.3 persons per family. On the other hand, single female/mother families (238 | 20.5%) represent the smallest median family size with 2.80 persons per family.
| Family Type | # Families | Family Size |
| Married-Couple | 904 (77.8%) | 3.10 |
| Single Male/Father | 20 (1.7%) | 4.30 |
| Single Female/Mother | 238 (20.5%) | 2.80 |
| Total Families | 1,162 (100.0%) | 3.06 |
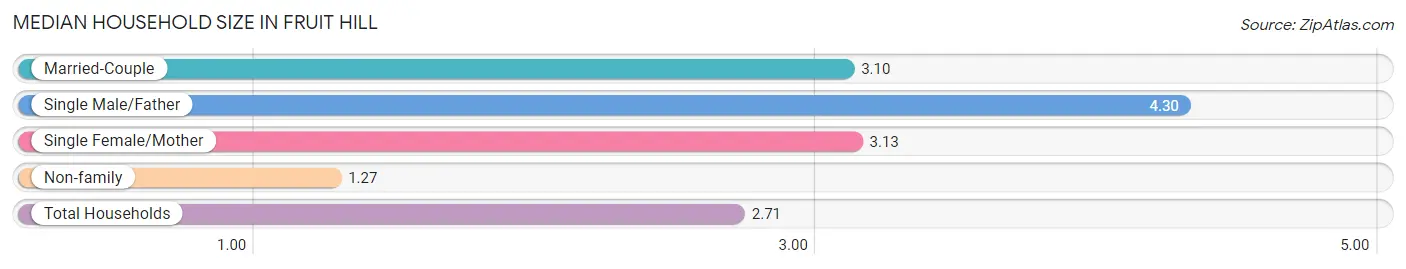
Median Household Size in Fruit Hill
The median household size in Fruit Hill is 2.71 persons per household, with single male/father households (20 | 1.3%) accounting for the largest median household size of 4.3 persons per household. non-family households (337 | 22.5%) represent the smallest median household size with 1.27 persons per household.
| Household Type | # Households | Household Size |
| Married-Couple | 904 (60.3%) | 3.10 |
| Single Male/Father | 20 (1.3%) | 4.30 |
| Single Female/Mother | 238 (15.9%) | 3.13 |
| Non-family | 337 (22.5%) | 1.27 |
| Total Households | 1,499 (100.0%) | 2.71 |
Household Size by Marriage Status in Fruit Hill
Out of a total of 1,499 households in Fruit Hill, 1,162 (77.5%) are family households, while 337 (22.5%) are nonfamily households. The most numerous type of family households are 4-person households, comprising 509, and the most common type of nonfamily households are 1-person households, comprising 284.
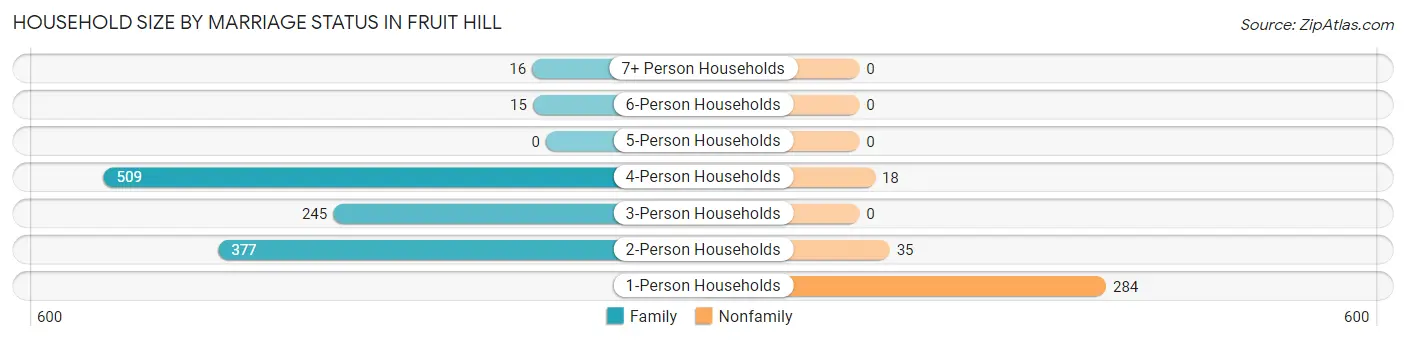
| Household Size | Family Households | Nonfamily Households |
| 1-Person Households | - | 284 (19.0%) |
| 2-Person Households | 377 (25.2%) | 35 (2.3%) |
| 3-Person Households | 245 (16.3%) | 0 (0.0%) |
| 4-Person Households | 509 (34.0%) | 18 (1.2%) |
| 5-Person Households | 0 (0.0%) | 0 (0.0%) |
| 6-Person Households | 15 (1.0%) | 0 (0.0%) |
| 7+ Person Households | 16 (1.1%) | 0 (0.0%) |
| Total | 1,162 (77.5%) | 337 (22.5%) |
Female Fertility in Fruit Hill
Fertility by Age in Fruit Hill
Average fertility rate in Fruit Hill is 45.0 births per 1,000 women. Women in the age bracket of 20 to 34 years have the highest fertility rate with 107.0 births per 1,000 women. Women in the age bracket of 20 to 34 years acount for 69.4% of all women with births.
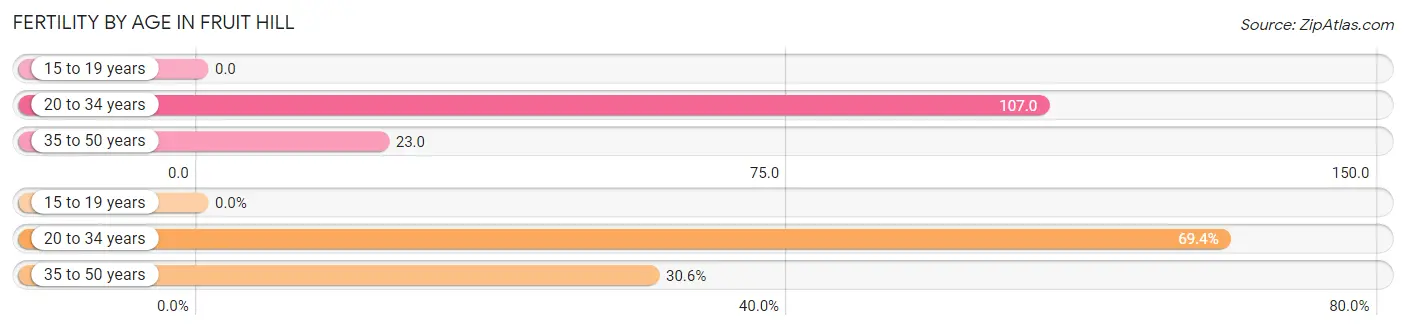
| Age Bracket | Women with Births | Births / 1,000 Women |
| 15 to 19 years | 0 (0.0%) | 0.0 |
| 20 to 34 years | 34 (69.4%) | 107.0 |
| 35 to 50 years | 15 (30.6%) | 23.0 |
| Total | 49 (100.0%) | 45.0 |
Fertility by Age by Marriage Status in Fruit Hill
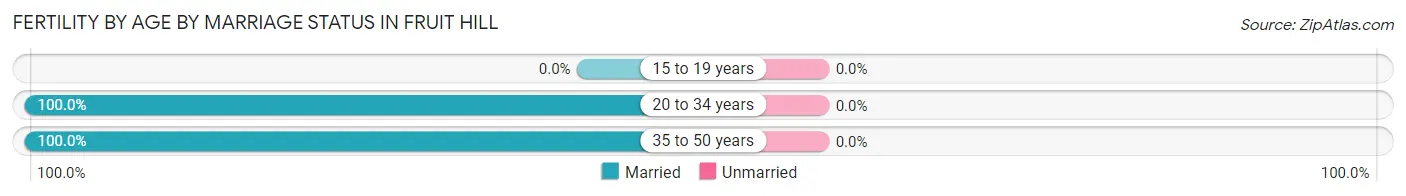
| Age Bracket | Married | Unmarried |
| 15 to 19 years | 0 (0.0%) | 0 (0.0%) |
| 20 to 34 years | 34 (100.0%) | 0 (0.0%) |
| 35 to 50 years | 15 (100.0%) | 0 (0.0%) |
| Total | 49 (100.0%) | 0 (0.0%) |
Fertility by Education in Fruit Hill
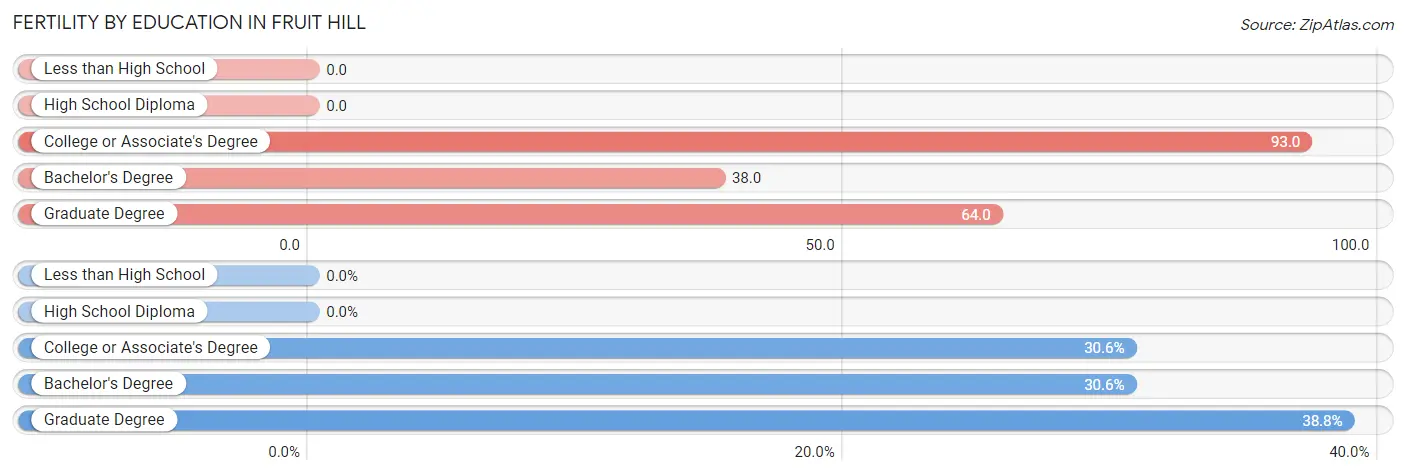
| Educational Attainment | Women with Births | Births / 1,000 Women |
| Less than High School | 0 (0.0%) | 0.0 |
| High School Diploma | 0 (0.0%) | 0.0 |
| College or Associate's Degree | 15 (30.6%) | 93.0 |
| Bachelor's Degree | 15 (30.6%) | 38.0 |
| Graduate Degree | 19 (38.8%) | 64.0 |
| Total | 49 (100.0%) | 45.0 |
Fertility by Education by Marriage Status in Fruit Hill
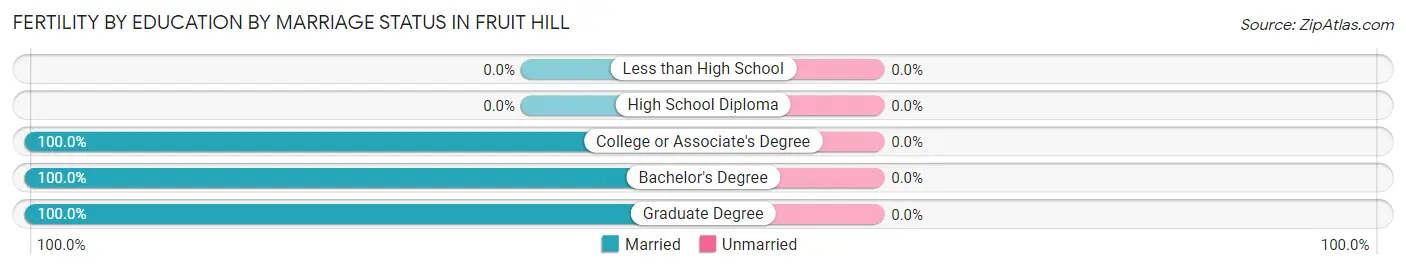
| Educational Attainment | Married | Unmarried |
| Less than High School | 0 (0.0%) | 0 (0.0%) |
| High School Diploma | 0 (0.0%) | 0 (0.0%) |
| College or Associate's Degree | 15 (100.0%) | 0 (0.0%) |
| Bachelor's Degree | 15 (100.0%) | 0 (0.0%) |
| Graduate Degree | 19 (100.0%) | 0 (0.0%) |
| Total | 49 (100.0%) | 0 (0.0%) |
Employment Characteristics in Fruit Hill
Employment by Class of Employer in Fruit Hill
Among the 2,163 employed individuals in Fruit Hill, private company employees (1,720 | 79.5%), not-for-profit organizations (258 | 11.9%), and self-employed (incorporated) (74 | 3.4%) make up the most common classes of employment.
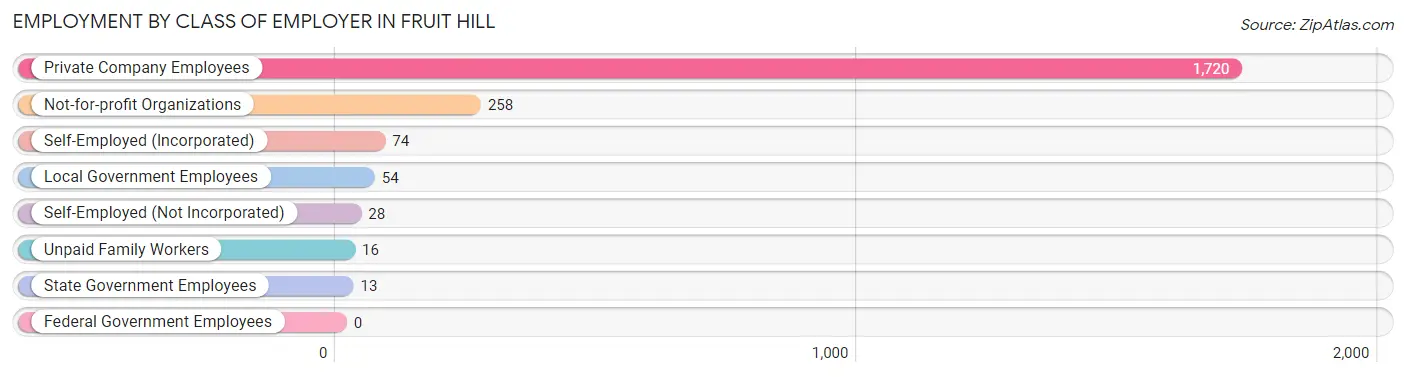
| Employer Class | # Employees | % Employees |
| Private Company Employees | 1,720 | 79.5% |
| Self-Employed (Incorporated) | 74 | 3.4% |
| Self-Employed (Not Incorporated) | 28 | 1.3% |
| Not-for-profit Organizations | 258 | 11.9% |
| Local Government Employees | 54 | 2.5% |
| State Government Employees | 13 | 0.6% |
| Federal Government Employees | 0 | 0.0% |
| Unpaid Family Workers | 16 | 0.7% |
| Total | 2,163 | 100.0% |
Employment Status by Age in Fruit Hill
According to the labor force statistics for Fruit Hill, out of the total population over 16 years of age (3,046), 74.7% or 2,275 individuals are in the labor force, with 2.7% or 61 of them unemployed. The age group with the highest labor force participation rate is 20 to 24 years, with 100.0% or 101 individuals in the labor force. Within the labor force, the 20 to 24 years age range has the highest percentage of unemployed individuals, with 16.8% or 17 of them being unemployed.
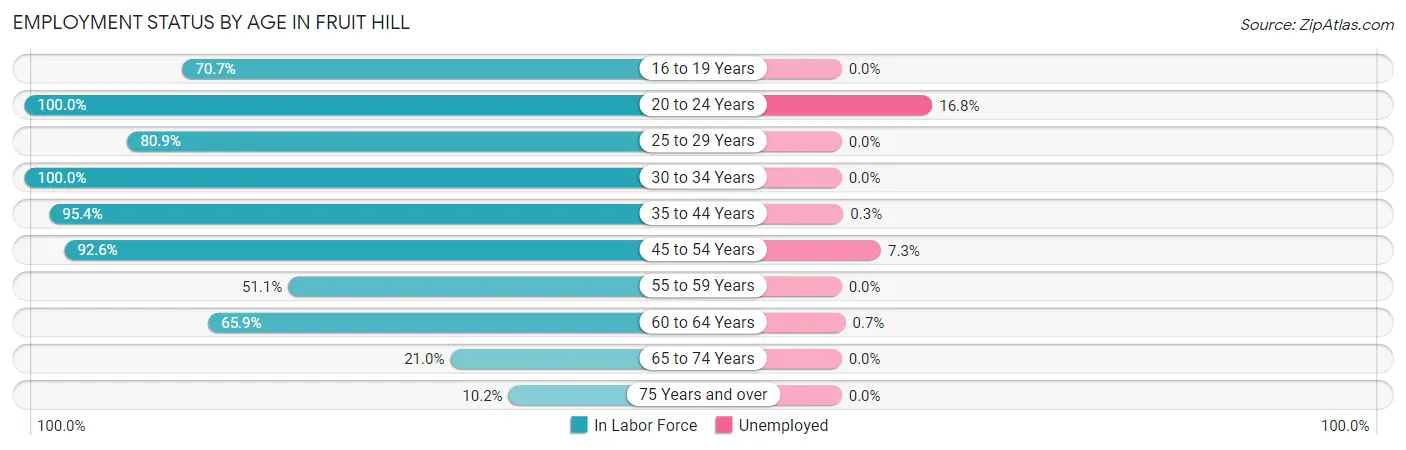
| Age Bracket | In Labor Force | Unemployed |
| 16 to 19 Years | 87 (70.7%) | 0 (0.0%) |
| 20 to 24 Years | 101 (100.0%) | 17 (16.8%) |
| 25 to 29 Years | 165 (80.9%) | 0 (0.0%) |
| 30 to 34 Years | 300 (100.0%) | 0 (0.0%) |
| 35 to 44 Years | 748 (95.4%) | 2 (0.3%) |
| 45 to 54 Years | 578 (92.6%) | 42 (7.3%) |
| 55 to 59 Years | 69 (51.1%) | 0 (0.0%) |
| 60 to 64 Years | 139 (65.9%) | 1 (0.7%) |
| 65 to 74 Years | 59 (21.0%) | 0 (0.0%) |
| 75 Years and over | 29 (10.2%) | 0 (0.0%) |
| Total | 2,275 (74.7%) | 61 (2.7%) |
Employment Status by Educational Attainment in Fruit Hill
According to labor force statistics for Fruit Hill, 88.5% of individuals (1,998) out of the total population between 25 and 64 years of age (2,258) are in the labor force, with 2.3% or 46 of them being unemployed. The group with the highest labor force participation rate are those with the educational attainment of bachelor's degree or higher, with 96.5% or 1,451 individuals in the labor force. Within the labor force, individuals with college / associate degree education have the highest percentage of unemployment, with 7.7% or 27 of them being unemployed.
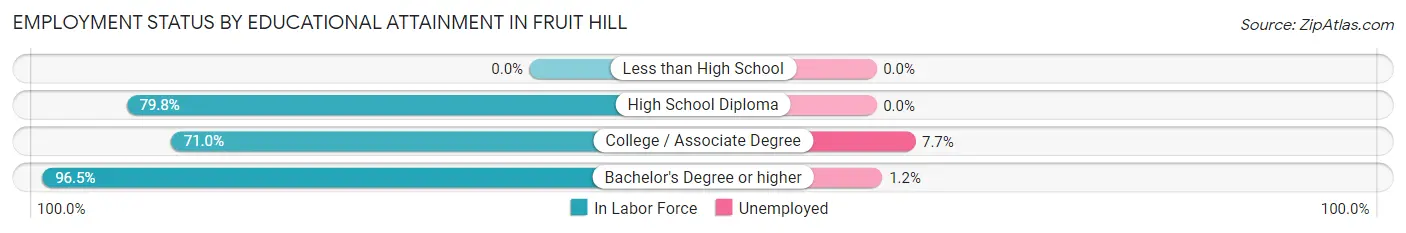
| Educational Attainment | In Labor Force | Unemployed |
| Less than High School | 0 (0.0%) | 0 (0.0%) |
| High School Diploma | 198 (79.8%) | 0 (0.0%) |
| College / Associate Degree | 350 (71.0%) | 38 (7.7%) |
| Bachelor's Degree or higher | 1,451 (96.5%) | 18 (1.2%) |
| Total | 1,998 (88.5%) | 52 (2.3%) |
Employment Occupations by Sex in Fruit Hill
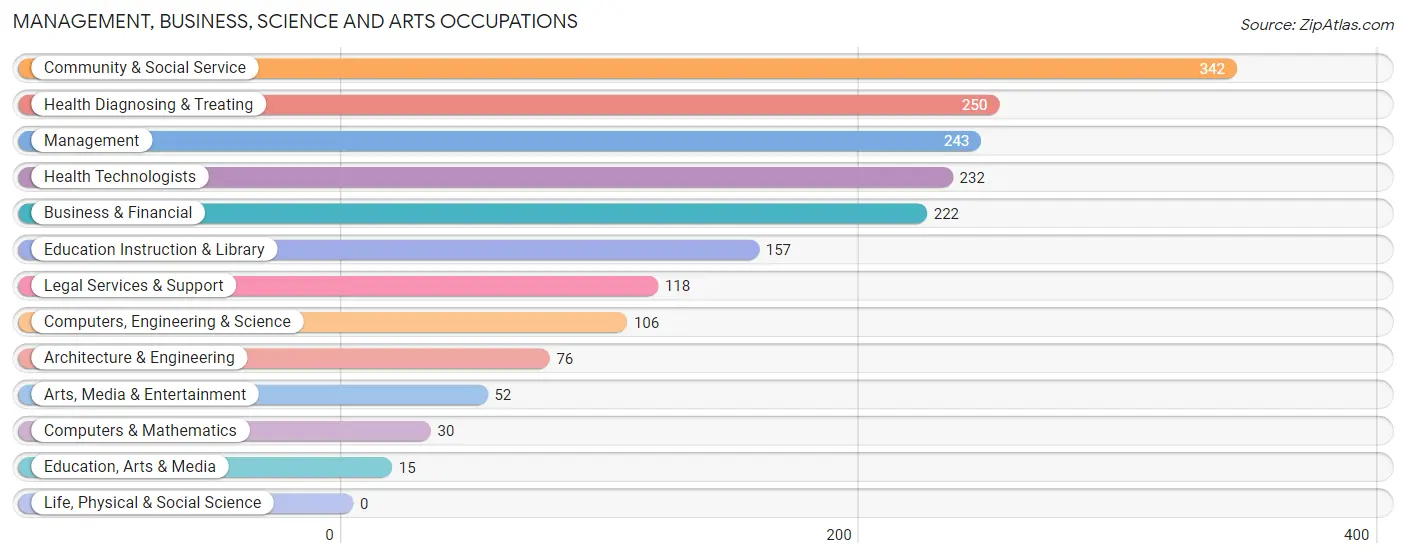
Management, Business, Science and Arts Occupations
The most common Management, Business, Science and Arts occupations in Fruit Hill are Community & Social Service (342 | 15.4%), Health Diagnosing & Treating (250 | 11.3%), Management (243 | 11.0%), Health Technologists (232 | 10.5%), and Business & Financial (222 | 10.0%).
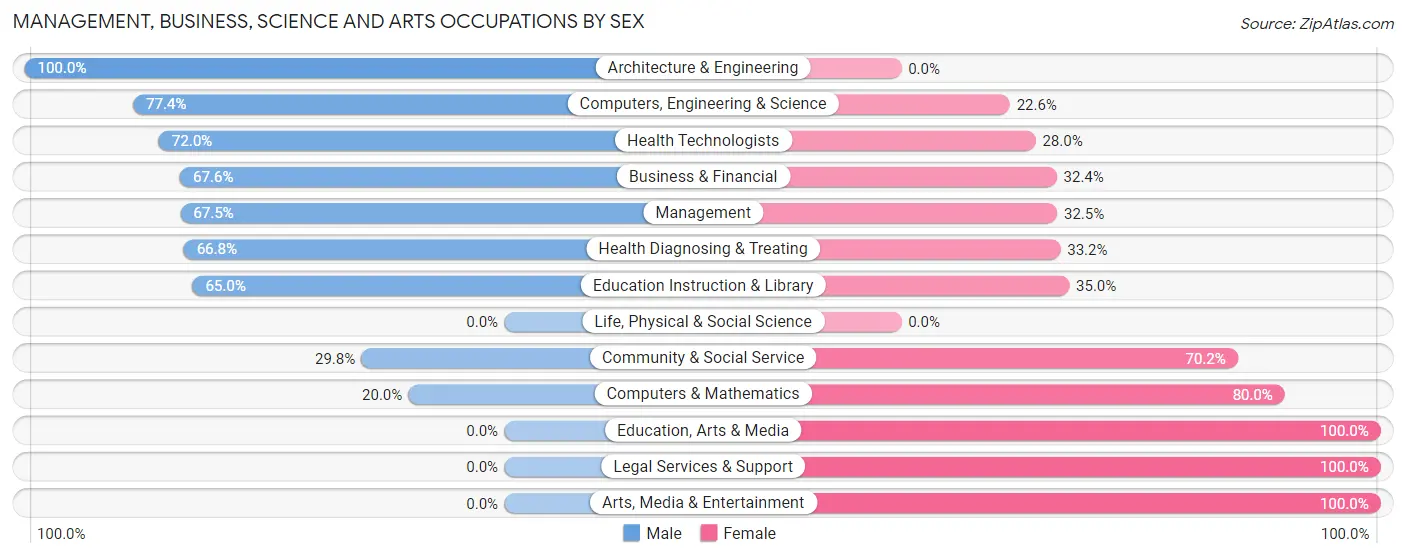
Management, Business, Science and Arts Occupations by Sex
Within the Management, Business, Science and Arts occupations in Fruit Hill, the most male-oriented occupations are Architecture & Engineering (100.0%), Computers, Engineering & Science (77.4%), and Health Technologists (72.0%), while the most female-oriented occupations are Education, Arts & Media (100.0%), Legal Services & Support (100.0%), and Arts, Media & Entertainment (100.0%).
| Occupation | Male | Female |
| Management | 164 (67.5%) | 79 (32.5%) |
| Business & Financial | 150 (67.6%) | 72 (32.4%) |
| Computers, Engineering & Science | 82 (77.4%) | 24 (22.6%) |
| Computers & Mathematics | 6 (20.0%) | 24 (80.0%) |
| Architecture & Engineering | 76 (100.0%) | 0 (0.0%) |
| Life, Physical & Social Science | 0 (0.0%) | 0 (0.0%) |
| Community & Social Service | 102 (29.8%) | 240 (70.2%) |
| Education, Arts & Media | 0 (0.0%) | 15 (100.0%) |
| Legal Services & Support | 0 (0.0%) | 118 (100.0%) |
| Education Instruction & Library | 102 (65.0%) | 55 (35.0%) |
| Arts, Media & Entertainment | 0 (0.0%) | 52 (100.0%) |
| Health Diagnosing & Treating | 167 (66.8%) | 83 (33.2%) |
| Health Technologists | 167 (72.0%) | 65 (28.0%) |
| Total (Category) | 665 (57.2%) | 498 (42.8%) |
| Total (Overall) | 1,064 (48.1%) | 1,149 (51.9%) |
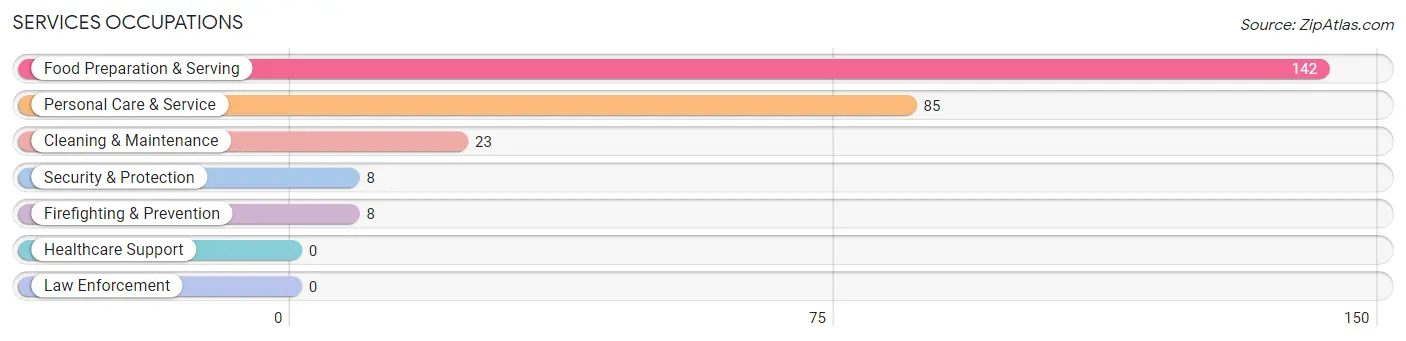
Services Occupations
The most common Services occupations in Fruit Hill are Food Preparation & Serving (142 | 6.4%), Personal Care & Service (85 | 3.8%), Cleaning & Maintenance (23 | 1.0%), Security & Protection (8 | 0.4%), and Firefighting & Prevention (8 | 0.4%).
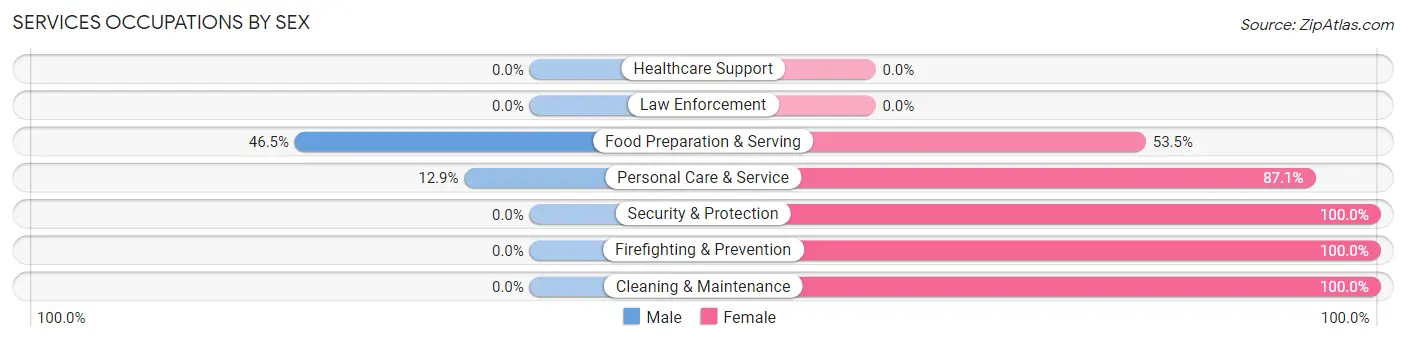
Services Occupations by Sex
Within the Services occupations in Fruit Hill, the most male-oriented occupations are Food Preparation & Serving (46.5%), and Personal Care & Service (12.9%), while the most female-oriented occupations are Security & Protection (100.0%), Firefighting & Prevention (100.0%), and Cleaning & Maintenance (100.0%).
| Occupation | Male | Female |
| Healthcare Support | 0 (0.0%) | 0 (0.0%) |
| Security & Protection | 0 (0.0%) | 8 (100.0%) |
| Firefighting & Prevention | 0 (0.0%) | 8 (100.0%) |
| Law Enforcement | 0 (0.0%) | 0 (0.0%) |
| Food Preparation & Serving | 66 (46.5%) | 76 (53.5%) |
| Cleaning & Maintenance | 0 (0.0%) | 23 (100.0%) |
| Personal Care & Service | 11 (12.9%) | 74 (87.1%) |
| Total (Category) | 77 (29.8%) | 181 (70.2%) |
| Total (Overall) | 1,064 (48.1%) | 1,149 (51.9%) |
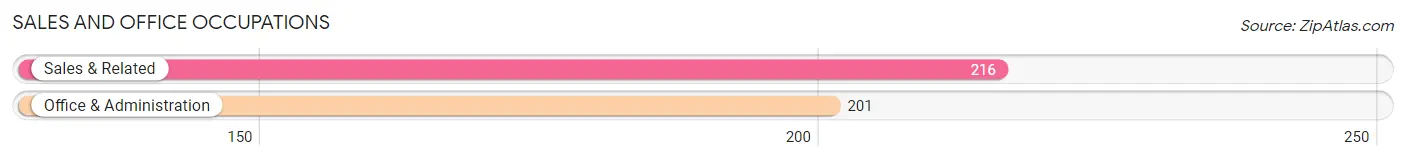
Sales and Office Occupations
The most common Sales and Office occupations in Fruit Hill are Sales & Related (216 | 9.8%), and Office & Administration (201 | 9.1%).
Sales and Office Occupations by Sex

| Occupation | Male | Female |
| Sales & Related | 135 (62.5%) | 81 (37.5%) |
| Office & Administration | 26 (12.9%) | 175 (87.1%) |
| Total (Category) | 161 (38.6%) | 256 (61.4%) |
| Total (Overall) | 1,064 (48.1%) | 1,149 (51.9%) |
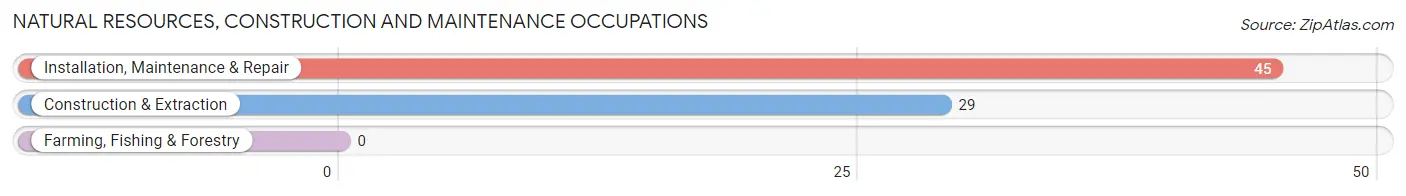
Natural Resources, Construction and Maintenance Occupations
The most common Natural Resources, Construction and Maintenance occupations in Fruit Hill are Installation, Maintenance & Repair (45 | 2.0%), and Construction & Extraction (29 | 1.3%).
Natural Resources, Construction and Maintenance Occupations by Sex
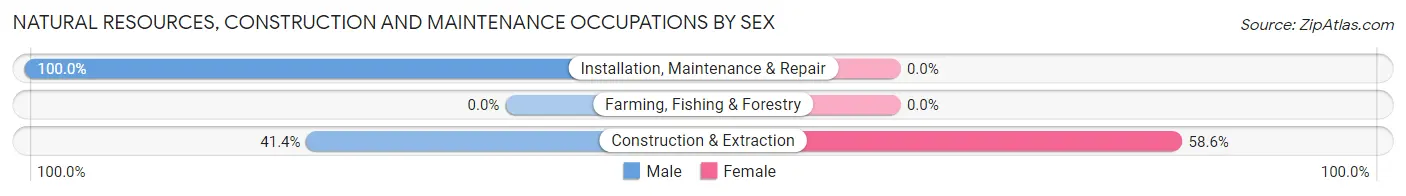
| Occupation | Male | Female |
| Farming, Fishing & Forestry | 0 (0.0%) | 0 (0.0%) |
| Construction & Extraction | 12 (41.4%) | 17 (58.6%) |
| Installation, Maintenance & Repair | 45 (100.0%) | 0 (0.0%) |
| Total (Category) | 57 (77.0%) | 17 (23.0%) |
| Total (Overall) | 1,064 (48.1%) | 1,149 (51.9%) |
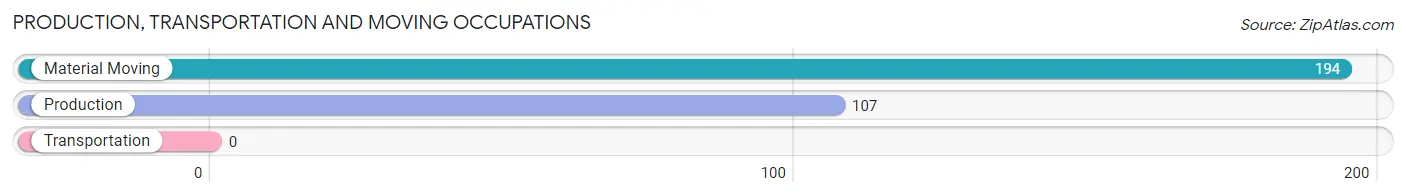
Production, Transportation and Moving Occupations
The most common Production, Transportation and Moving occupations in Fruit Hill are Material Moving (194 | 8.8%), and Production (107 | 4.8%).
Production, Transportation and Moving Occupations by Sex
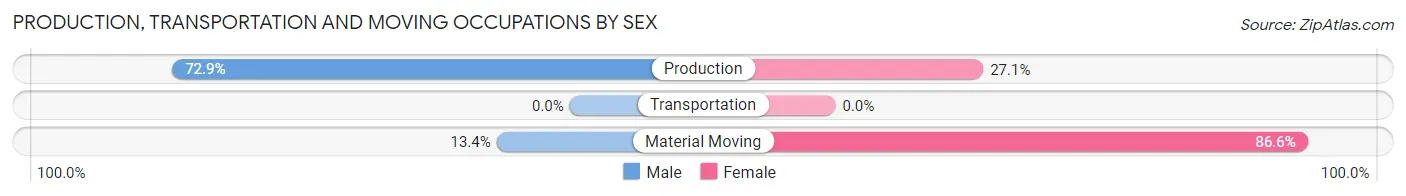
| Occupation | Male | Female |
| Production | 78 (72.9%) | 29 (27.1%) |
| Transportation | 0 (0.0%) | 0 (0.0%) |
| Material Moving | 26 (13.4%) | 168 (86.6%) |
| Total (Category) | 104 (34.5%) | 197 (65.4%) |
| Total (Overall) | 1,064 (48.1%) | 1,149 (51.9%) |
Employment Industries by Sex in Fruit Hill
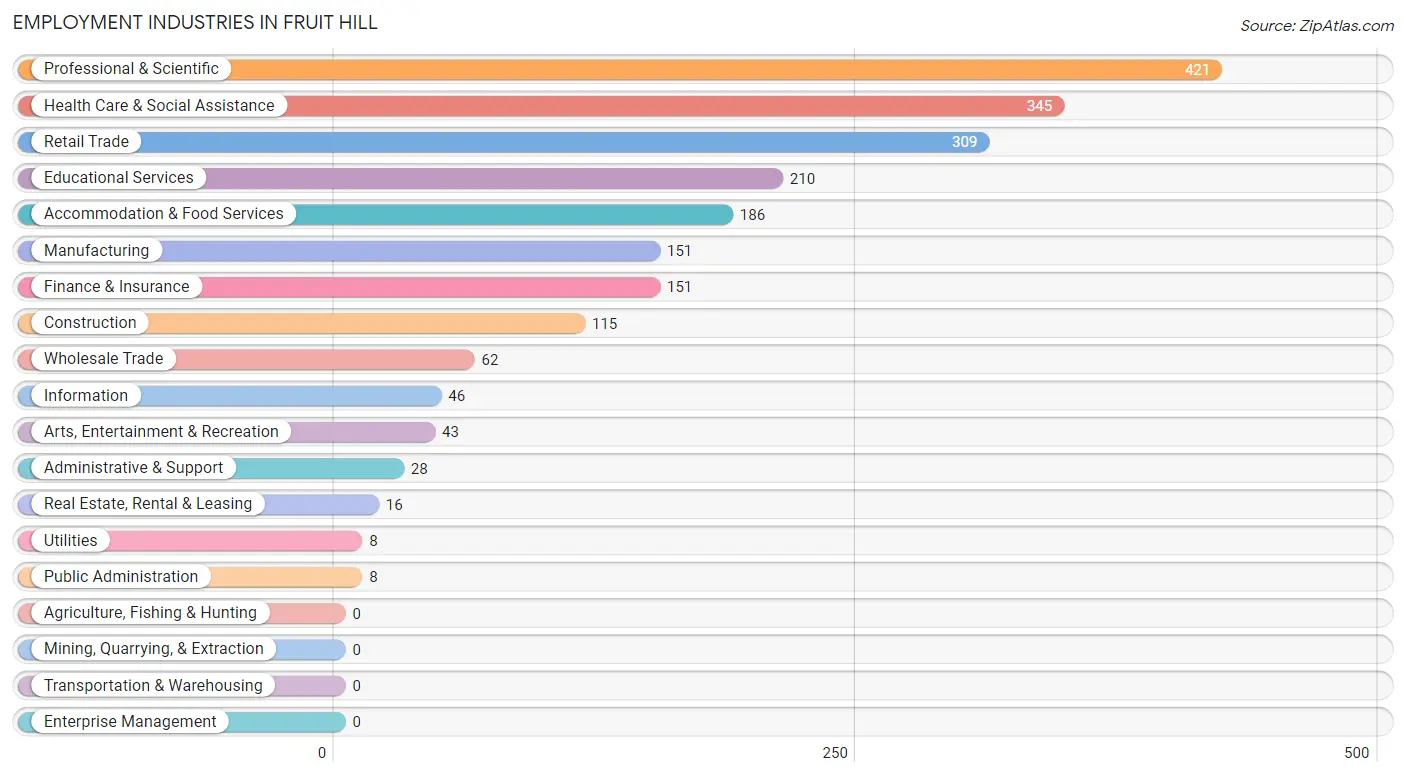
Employment Industries in Fruit Hill
The major employment industries in Fruit Hill include Professional & Scientific (421 | 19.0%), Health Care & Social Assistance (345 | 15.6%), Retail Trade (309 | 14.0%), Educational Services (210 | 9.5%), and Accommodation & Food Services (186 | 8.4%).
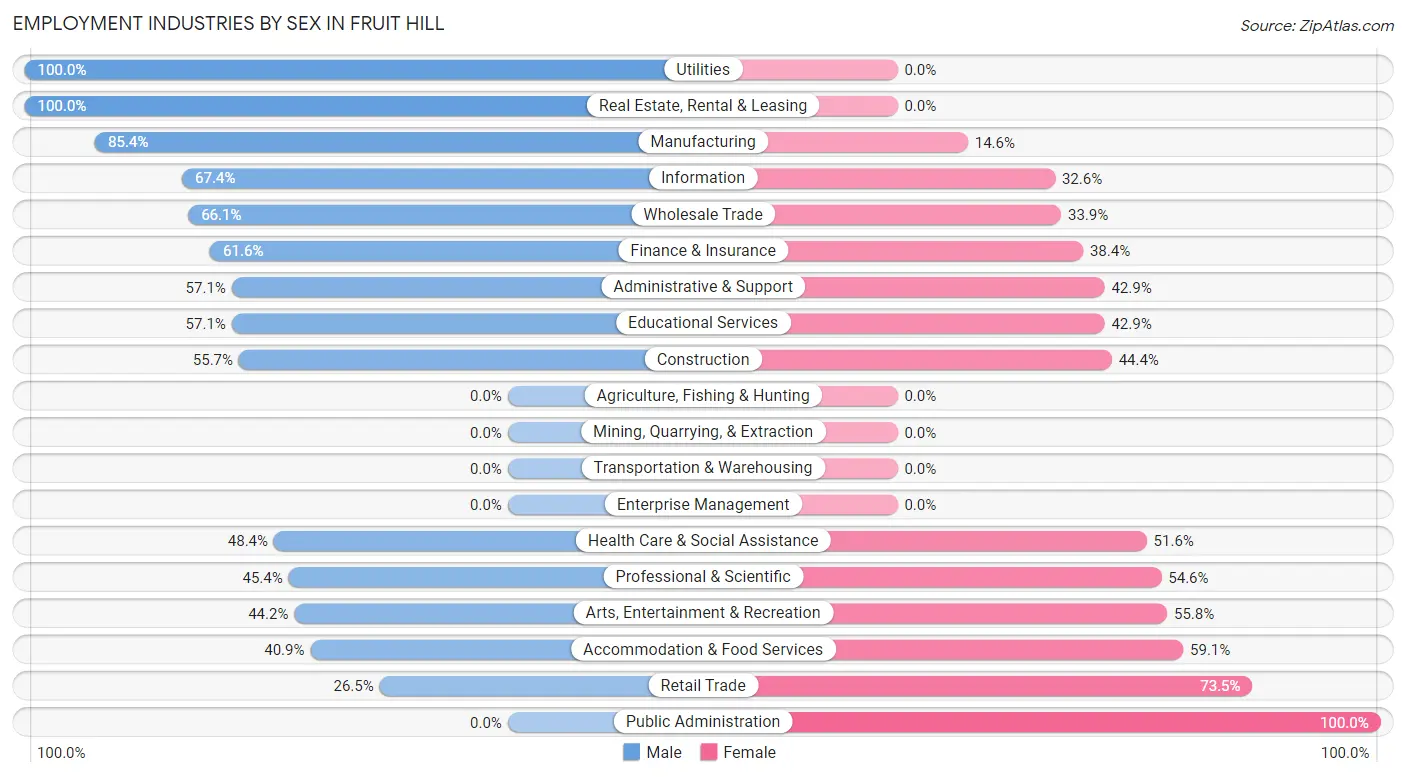
Employment Industries by Sex in Fruit Hill
The Fruit Hill industries that see more men than women are Utilities (100.0%), Real Estate, Rental & Leasing (100.0%), and Manufacturing (85.4%), whereas the industries that tend to have a higher number of women are Public Administration (100.0%), Retail Trade (73.5%), and Accommodation & Food Services (59.1%).
| Industry | Male | Female |
| Agriculture, Fishing & Hunting | 0 (0.0%) | 0 (0.0%) |
| Mining, Quarrying, & Extraction | 0 (0.0%) | 0 (0.0%) |
| Construction | 64 (55.6%) | 51 (44.4%) |
| Manufacturing | 129 (85.4%) | 22 (14.6%) |
| Wholesale Trade | 41 (66.1%) | 21 (33.9%) |
| Retail Trade | 82 (26.5%) | 227 (73.5%) |
| Transportation & Warehousing | 0 (0.0%) | 0 (0.0%) |
| Utilities | 8 (100.0%) | 0 (0.0%) |
| Information | 31 (67.4%) | 15 (32.6%) |
| Finance & Insurance | 93 (61.6%) | 58 (38.4%) |
| Real Estate, Rental & Leasing | 16 (100.0%) | 0 (0.0%) |
| Professional & Scientific | 191 (45.4%) | 230 (54.6%) |
| Enterprise Management | 0 (0.0%) | 0 (0.0%) |
| Administrative & Support | 16 (57.1%) | 12 (42.9%) |
| Educational Services | 120 (57.1%) | 90 (42.9%) |
| Health Care & Social Assistance | 167 (48.4%) | 178 (51.6%) |
| Arts, Entertainment & Recreation | 19 (44.2%) | 24 (55.8%) |
| Accommodation & Food Services | 76 (40.9%) | 110 (59.1%) |
| Public Administration | 0 (0.0%) | 8 (100.0%) |
| Total | 1,064 (48.1%) | 1,149 (51.9%) |
Education in Fruit Hill
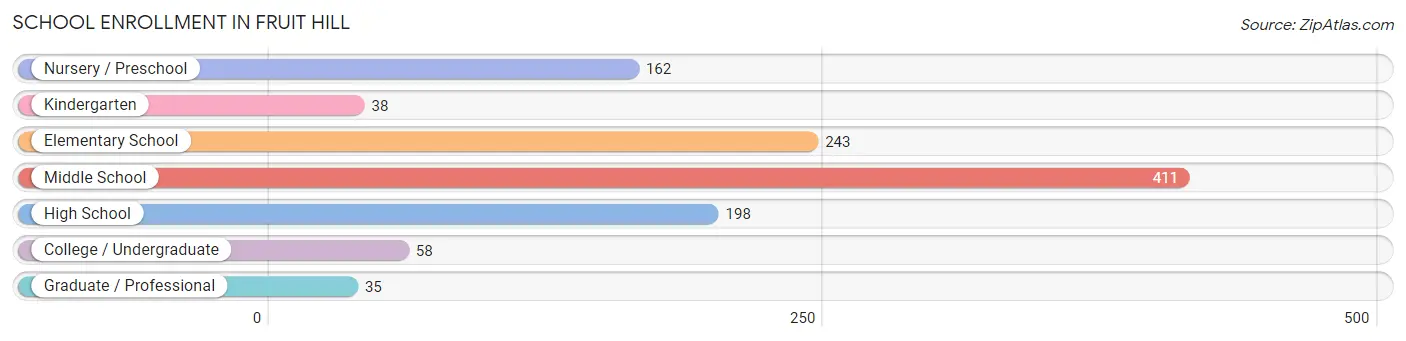
School Enrollment in Fruit Hill
The most common levels of schooling among the 1,145 students in Fruit Hill are middle school (411 | 35.9%), elementary school (243 | 21.2%), and high school (198 | 17.3%).
| School Level | # Students | % Students |
| Nursery / Preschool | 162 | 14.1% |
| Kindergarten | 38 | 3.3% |
| Elementary School | 243 | 21.2% |
| Middle School | 411 | 35.9% |
| High School | 198 | 17.3% |
| College / Undergraduate | 58 | 5.1% |
| Graduate / Professional | 35 | 3.1% |
| Total | 1,145 | 100.0% |
School Enrollment by Age by Funding Source in Fruit Hill
Out of a total of 1,145 students who are enrolled in schools in Fruit Hill, 487 (42.5%) attend a private institution, while the remaining 658 (57.5%) are enrolled in public schools. The age group of 18 to 19 year olds has the highest likelihood of being enrolled in private schools, with 18 (100.0% in the age bracket) enrolled. Conversely, the age group of 20 to 24 year olds has the lowest likelihood of being enrolled in a private school, with 33 (100.0% in the age bracket) attending a public institution.
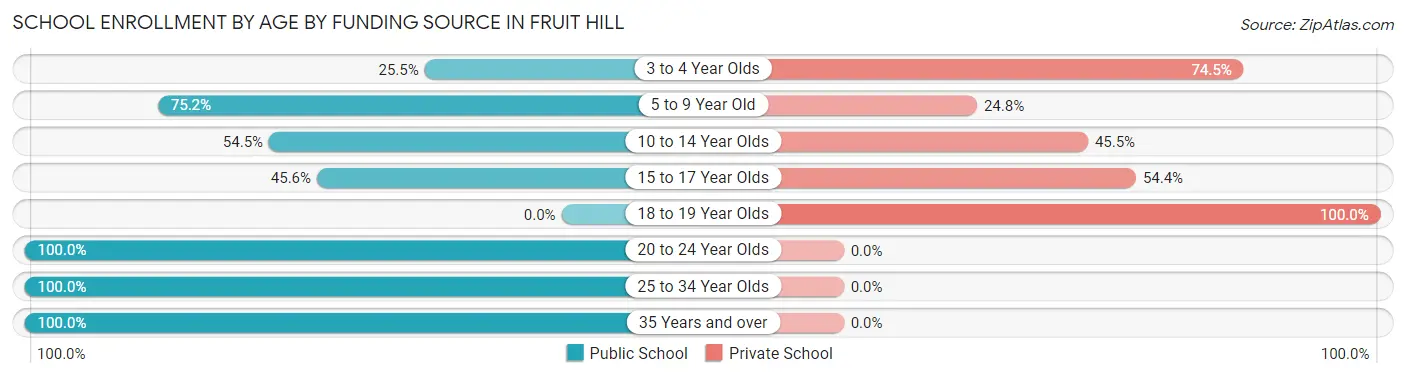
| Age Bracket | Public School | Private School |
| 3 to 4 Year Olds | 38 (25.5%) | 111 (74.5%) |
| 5 to 9 Year Old | 221 (75.2%) | 73 (24.8%) |
| 10 to 14 Year Olds | 224 (54.5%) | 187 (45.5%) |
| 15 to 17 Year Olds | 82 (45.6%) | 98 (54.4%) |
| 18 to 19 Year Olds | 0 (0.0%) | 18 (100.0%) |
| 20 to 24 Year Olds | 33 (100.0%) | 0 (0.0%) |
| 25 to 34 Year Olds | 46 (100.0%) | 0 (0.0%) |
| 35 Years and over | 14 (100.0%) | 0 (0.0%) |
| Total | 658 (57.5%) | 487 (42.5%) |
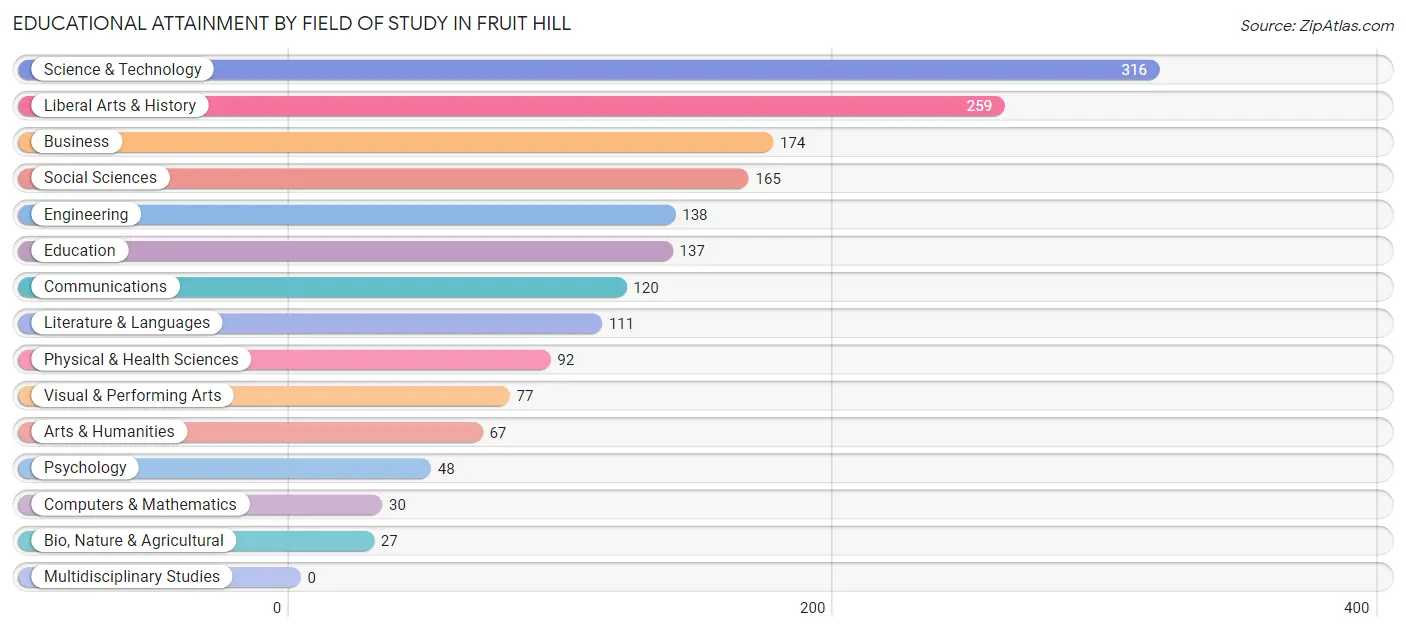
Educational Attainment by Field of Study in Fruit Hill
Science & technology (316 | 17.9%), liberal arts & history (259 | 14.7%), business (174 | 9.9%), social sciences (165 | 9.4%), and engineering (138 | 7.8%) are the most common fields of study among 1,761 individuals in Fruit Hill who have obtained a bachelor's degree or higher.
| Field of Study | # Graduates | % Graduates |
| Computers & Mathematics | 30 | 1.7% |
| Bio, Nature & Agricultural | 27 | 1.5% |
| Physical & Health Sciences | 92 | 5.2% |
| Psychology | 48 | 2.7% |
| Social Sciences | 165 | 9.4% |
| Engineering | 138 | 7.8% |
| Multidisciplinary Studies | 0 | 0.0% |
| Science & Technology | 316 | 17.9% |
| Business | 174 | 9.9% |
| Education | 137 | 7.8% |
| Literature & Languages | 111 | 6.3% |
| Liberal Arts & History | 259 | 14.7% |
| Visual & Performing Arts | 77 | 4.4% |
| Communications | 120 | 6.8% |
| Arts & Humanities | 67 | 3.8% |
| Total | 1,761 | 100.0% |
Transportation & Commute in Fruit Hill
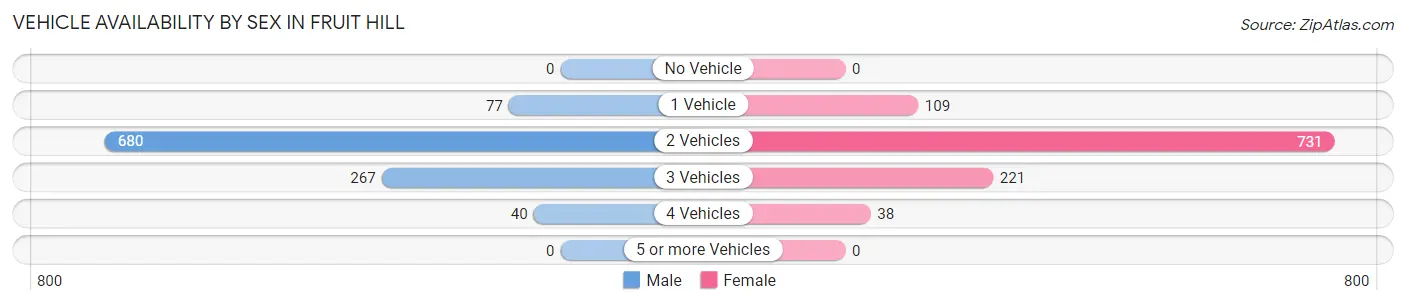
Vehicle Availability by Sex in Fruit Hill
The most prevalent vehicle ownership categories in Fruit Hill are males with 2 vehicles (680, accounting for 63.9%) and females with 2 vehicles (731, making up 61.9%).
| Vehicles Available | Male | Female |
| No Vehicle | 0 (0.0%) | 0 (0.0%) |
| 1 Vehicle | 77 (7.2%) | 109 (9.9%) |
| 2 Vehicles | 680 (63.9%) | 731 (66.5%) |
| 3 Vehicles | 267 (25.1%) | 221 (20.1%) |
| 4 Vehicles | 40 (3.8%) | 38 (3.5%) |
| 5 or more Vehicles | 0 (0.0%) | 0 (0.0%) |
| Total | 1,064 (100.0%) | 1,099 (100.0%) |
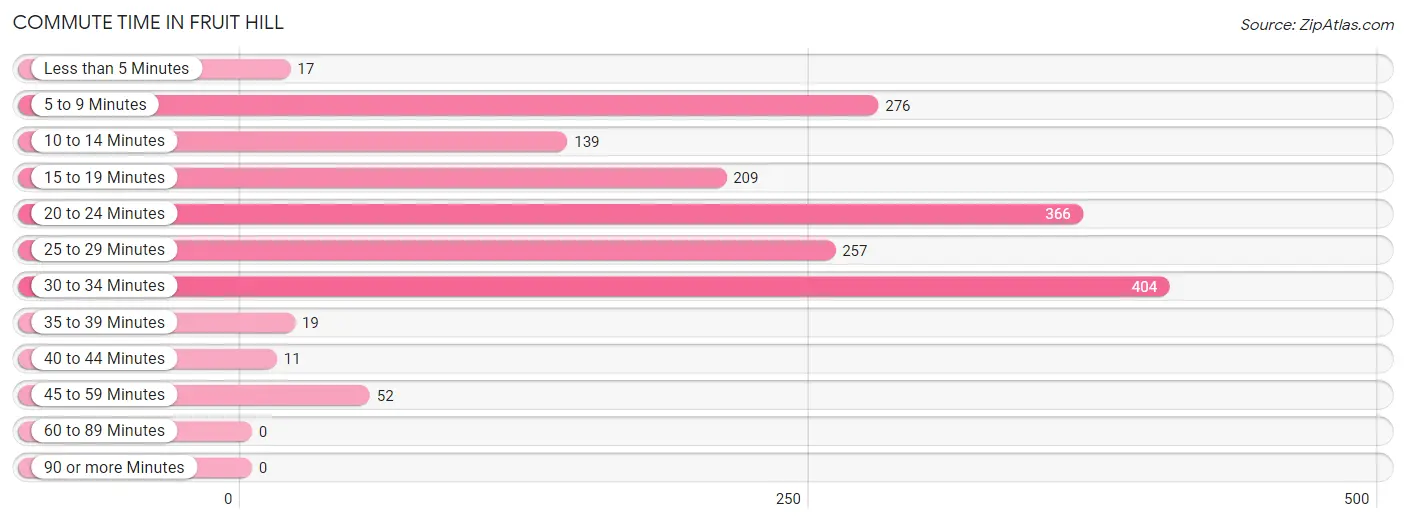
Commute Time in Fruit Hill
The most frequently occuring commute durations in Fruit Hill are 30 to 34 minutes (404 commuters, 23.1%), 20 to 24 minutes (366 commuters, 20.9%), and 5 to 9 minutes (276 commuters, 15.8%).
| Commute Time | # Commuters | % Commuters |
| Less than 5 Minutes | 17 | 1.0% |
| 5 to 9 Minutes | 276 | 15.8% |
| 10 to 14 Minutes | 139 | 7.9% |
| 15 to 19 Minutes | 209 | 11.9% |
| 20 to 24 Minutes | 366 | 20.9% |
| 25 to 29 Minutes | 257 | 14.7% |
| 30 to 34 Minutes | 404 | 23.1% |
| 35 to 39 Minutes | 19 | 1.1% |
| 40 to 44 Minutes | 11 | 0.6% |
| 45 to 59 Minutes | 52 | 3.0% |
| 60 to 89 Minutes | 0 | 0.0% |
| 90 or more Minutes | 0 | 0.0% |
Commute Time by Sex in Fruit Hill
The most common commute times in Fruit Hill are 30 to 34 minutes (310 commuters, 33.8%) for males and 5 to 9 minutes (253 commuters, 30.4%) for females.
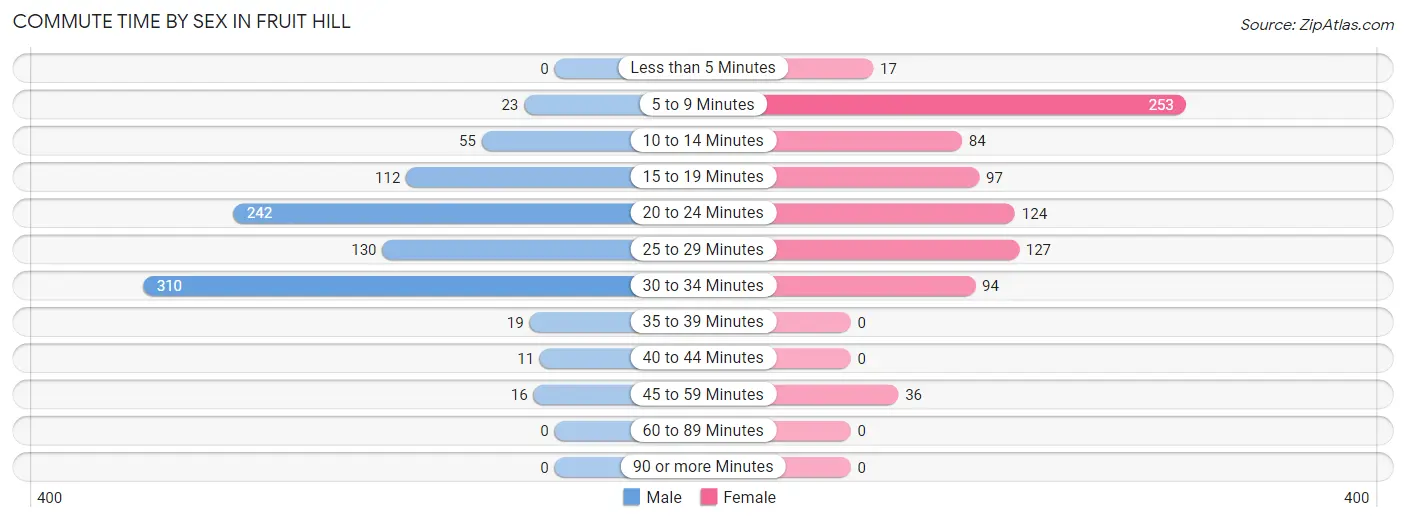
| Commute Time | Male | Female |
| Less than 5 Minutes | 0 (0.0%) | 17 (2.0%) |
| 5 to 9 Minutes | 23 (2.5%) | 253 (30.4%) |
| 10 to 14 Minutes | 55 (6.0%) | 84 (10.1%) |
| 15 to 19 Minutes | 112 (12.2%) | 97 (11.7%) |
| 20 to 24 Minutes | 242 (26.4%) | 124 (14.9%) |
| 25 to 29 Minutes | 130 (14.2%) | 127 (15.3%) |
| 30 to 34 Minutes | 310 (33.8%) | 94 (11.3%) |
| 35 to 39 Minutes | 19 (2.1%) | 0 (0.0%) |
| 40 to 44 Minutes | 11 (1.2%) | 0 (0.0%) |
| 45 to 59 Minutes | 16 (1.7%) | 36 (4.3%) |
| 60 to 89 Minutes | 0 (0.0%) | 0 (0.0%) |
| 90 or more Minutes | 0 (0.0%) | 0 (0.0%) |
Time of Departure to Work by Sex in Fruit Hill
The most frequent times of departure to work in Fruit Hill are 6:00 AM to 6:29 AM (186, 20.3%) for males and 9:00 AM to 9:59 AM (234, 28.1%) for females.
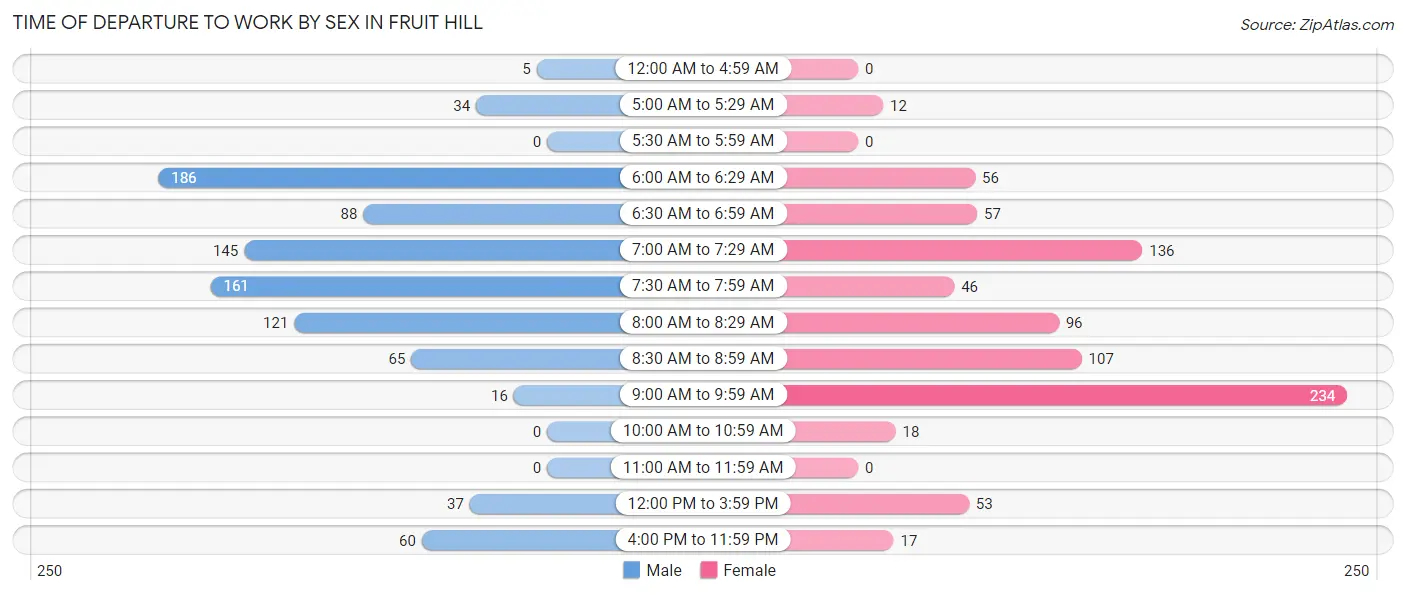
| Time of Departure | Male | Female |
| 12:00 AM to 4:59 AM | 5 (0.5%) | 0 (0.0%) |
| 5:00 AM to 5:29 AM | 34 (3.7%) | 12 (1.4%) |
| 5:30 AM to 5:59 AM | 0 (0.0%) | 0 (0.0%) |
| 6:00 AM to 6:29 AM | 186 (20.3%) | 56 (6.7%) |
| 6:30 AM to 6:59 AM | 88 (9.6%) | 57 (6.9%) |
| 7:00 AM to 7:29 AM | 145 (15.8%) | 136 (16.4%) |
| 7:30 AM to 7:59 AM | 161 (17.5%) | 46 (5.5%) |
| 8:00 AM to 8:29 AM | 121 (13.2%) | 96 (11.5%) |
| 8:30 AM to 8:59 AM | 65 (7.1%) | 107 (12.9%) |
| 9:00 AM to 9:59 AM | 16 (1.7%) | 234 (28.1%) |
| 10:00 AM to 10:59 AM | 0 (0.0%) | 18 (2.2%) |
| 11:00 AM to 11:59 AM | 0 (0.0%) | 0 (0.0%) |
| 12:00 PM to 3:59 PM | 37 (4.0%) | 53 (6.4%) |
| 4:00 PM to 11:59 PM | 60 (6.5%) | 17 (2.0%) |
| Total | 918 (100.0%) | 832 (100.0%) |
Housing Occupancy in Fruit Hill
Occupancy by Ownership in Fruit Hill
Of the total 1,499 dwellings in Fruit Hill, owner-occupied units account for 1,367 (91.2%), while renter-occupied units make up 132 (8.8%).
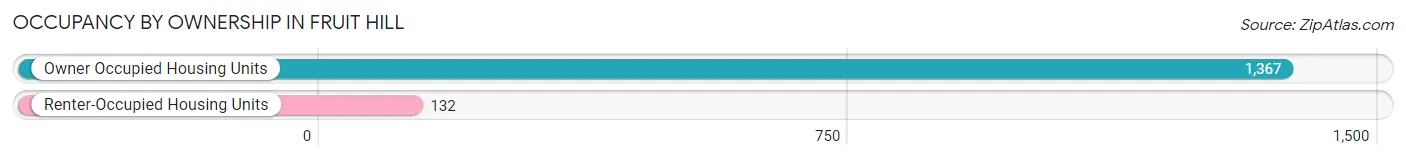
| Occupancy | # Housing Units | % Housing Units |
| Owner Occupied Housing Units | 1,367 | 91.2% |
| Renter-Occupied Housing Units | 132 | 8.8% |
| Total Occupied Housing Units | 1,499 | 100.0% |
Occupancy by Household Size in Fruit Hill
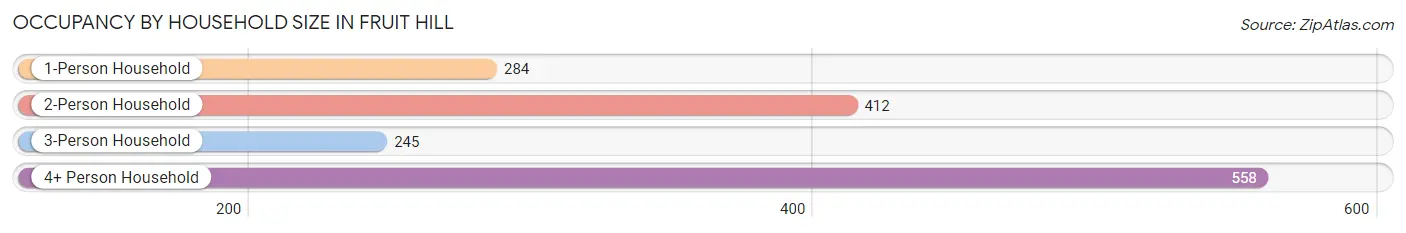
| Household Size | # Housing Units | % Housing Units |
| 1-Person Household | 284 | 19.0% |
| 2-Person Household | 412 | 27.5% |
| 3-Person Household | 245 | 16.3% |
| 4+ Person Household | 558 | 37.2% |
| Total Housing Units | 1,499 | 100.0% |
Occupancy by Ownership by Household Size in Fruit Hill
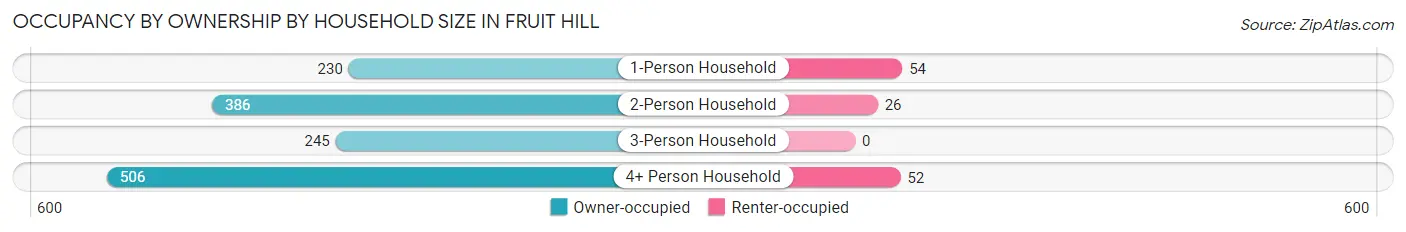
| Household Size | Owner-occupied | Renter-occupied |
| 1-Person Household | 230 (81.0%) | 54 (19.0%) |
| 2-Person Household | 386 (93.7%) | 26 (6.3%) |
| 3-Person Household | 245 (100.0%) | 0 (0.0%) |
| 4+ Person Household | 506 (90.7%) | 52 (9.3%) |
| Total Housing Units | 1,367 (91.2%) | 132 (8.8%) |
Occupancy by Educational Attainment in Fruit Hill
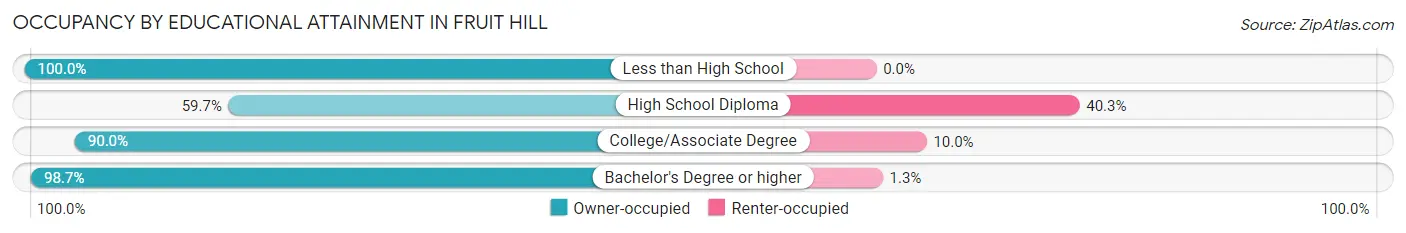
| Household Size | Owner-occupied | Renter-occupied |
| Less than High School | 45 (100.0%) | 0 (0.0%) |
| High School Diploma | 135 (59.7%) | 91 (40.3%) |
| College/Associate Degree | 262 (90.0%) | 29 (10.0%) |
| Bachelor's Degree or higher | 925 (98.7%) | 12 (1.3%) |
Occupancy by Age of Householder in Fruit Hill
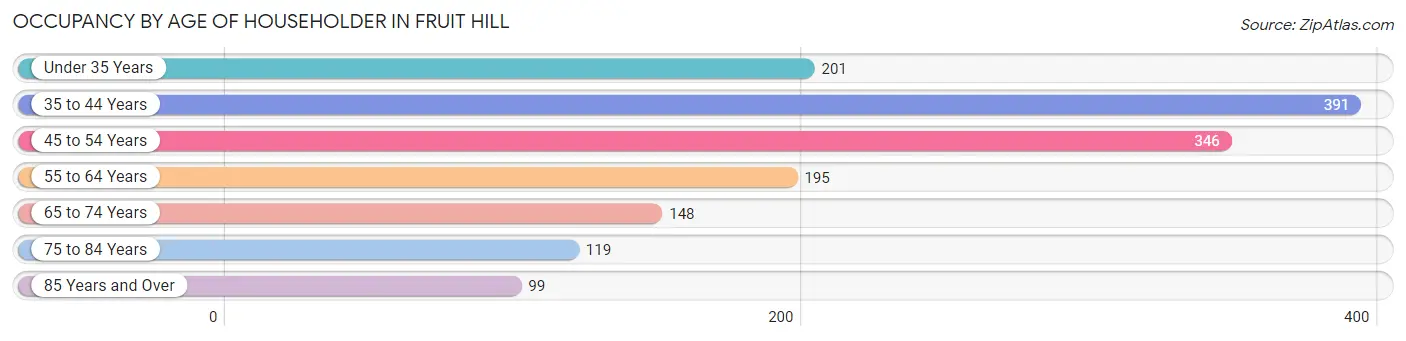
| Age Bracket | # Households | % Households |
| Under 35 Years | 201 | 13.4% |
| 35 to 44 Years | 391 | 26.1% |
| 45 to 54 Years | 346 | 23.1% |
| 55 to 64 Years | 195 | 13.0% |
| 65 to 74 Years | 148 | 9.9% |
| 75 to 84 Years | 119 | 7.9% |
| 85 Years and Over | 99 | 6.6% |
| Total | 1,499 | 100.0% |
Housing Finances in Fruit Hill
Median Income by Occupancy in Fruit Hill
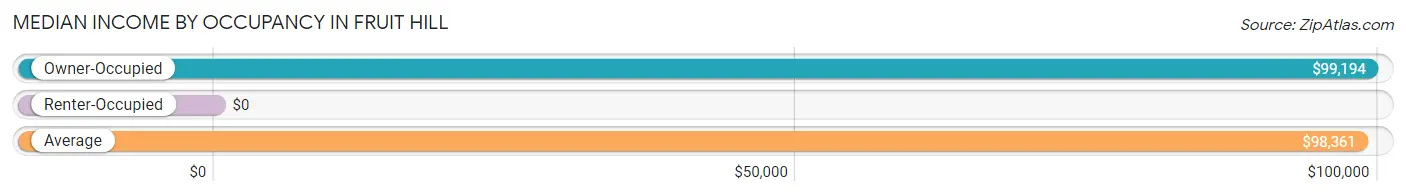
| Occupancy Type | # Households | Median Income |
| Owner-Occupied | 1,367 (91.2%) | $99,194 |
| Renter-Occupied | 132 (8.8%) | $0 |
| Average | 1,499 (100.0%) | $98,361 |
Occupancy by Householder Income Bracket in Fruit Hill
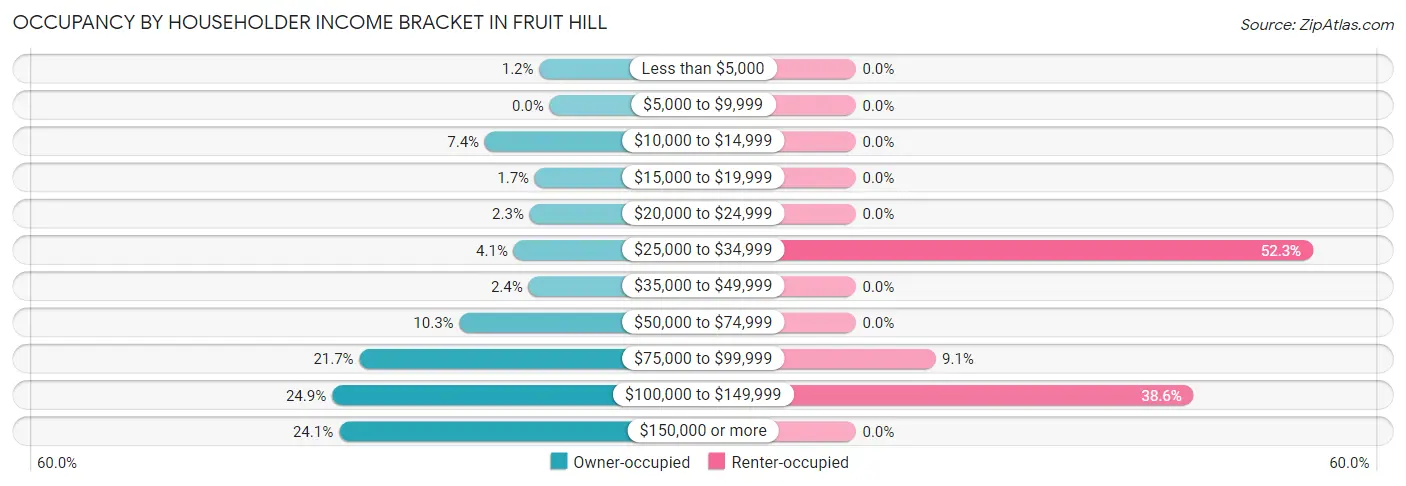
| Income Bracket | Owner-occupied | Renter-occupied |
| Less than $5,000 | 16 (1.2%) | 0 (0.0%) |
| $5,000 to $9,999 | 0 (0.0%) | 0 (0.0%) |
| $10,000 to $14,999 | 101 (7.4%) | 0 (0.0%) |
| $15,000 to $19,999 | 23 (1.7%) | 0 (0.0%) |
| $20,000 to $24,999 | 31 (2.3%) | 0 (0.0%) |
| $25,000 to $34,999 | 56 (4.1%) | 69 (52.3%) |
| $35,000 to $49,999 | 33 (2.4%) | 0 (0.0%) |
| $50,000 to $74,999 | 141 (10.3%) | 0 (0.0%) |
| $75,000 to $99,999 | 297 (21.7%) | 12 (9.1%) |
| $100,000 to $149,999 | 340 (24.9%) | 51 (38.6%) |
| $150,000 or more | 329 (24.1%) | 0 (0.0%) |
| Total | 1,367 (100.0%) | 132 (100.0%) |
Monthly Housing Cost Tiers in Fruit Hill
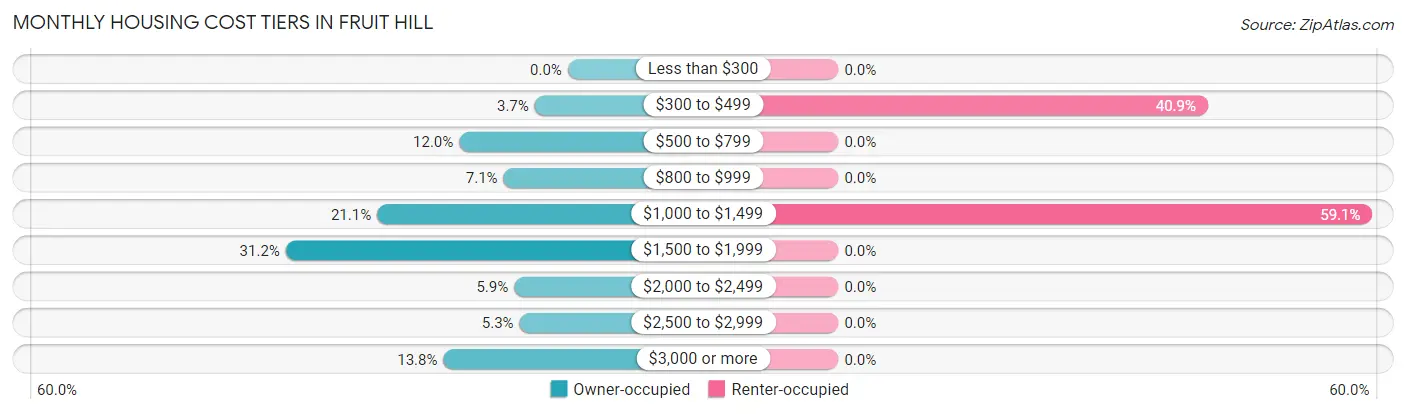
| Monthly Cost | Owner-occupied | Renter-occupied |
| Less than $300 | 0 (0.0%) | 0 (0.0%) |
| $300 to $499 | 50 (3.7%) | 54 (40.9%) |
| $500 to $799 | 164 (12.0%) | 0 (0.0%) |
| $800 to $999 | 97 (7.1%) | 0 (0.0%) |
| $1,000 to $1,499 | 288 (21.1%) | 78 (59.1%) |
| $1,500 to $1,999 | 426 (31.2%) | 0 (0.0%) |
| $2,000 to $2,499 | 81 (5.9%) | 0 (0.0%) |
| $2,500 to $2,999 | 73 (5.3%) | 0 (0.0%) |
| $3,000 or more | 188 (13.8%) | 0 (0.0%) |
| Total | 1,367 (100.0%) | 132 (100.0%) |
Physical Housing Characteristics in Fruit Hill
Housing Structures in Fruit Hill
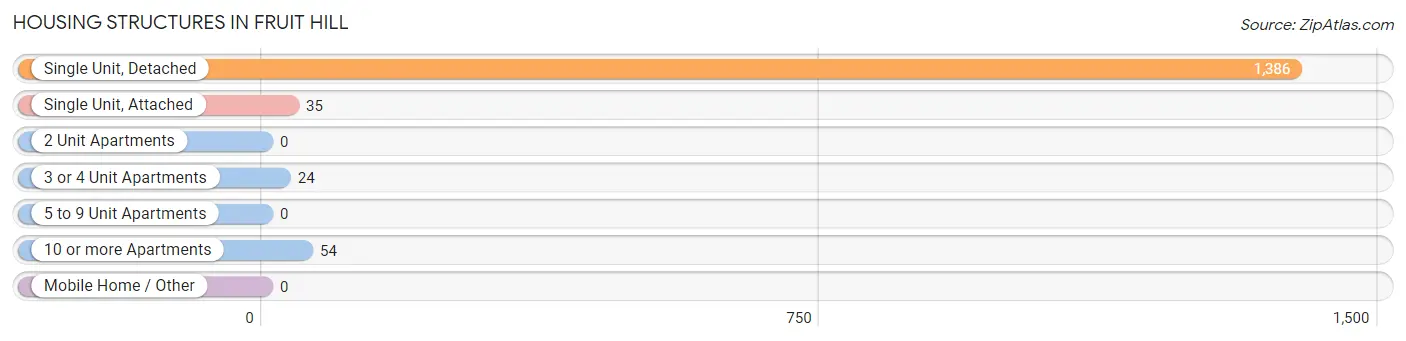
| Structure Type | # Housing Units | % Housing Units |
| Single Unit, Detached | 1,386 | 92.5% |
| Single Unit, Attached | 35 | 2.3% |
| 2 Unit Apartments | 0 | 0.0% |
| 3 or 4 Unit Apartments | 24 | 1.6% |
| 5 to 9 Unit Apartments | 0 | 0.0% |
| 10 or more Apartments | 54 | 3.6% |
| Mobile Home / Other | 0 | 0.0% |
| Total | 1,499 | 100.0% |
Housing Structures by Occupancy in Fruit Hill
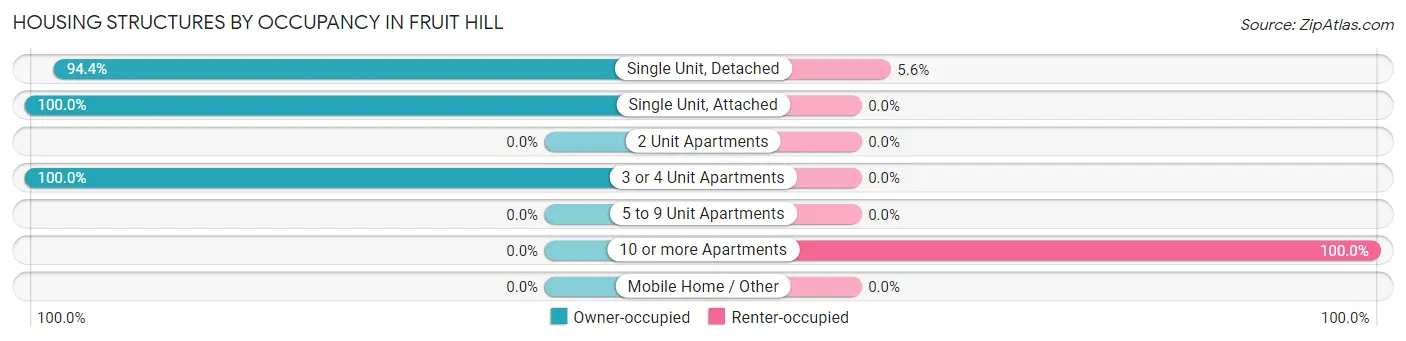
| Structure Type | Owner-occupied | Renter-occupied |
| Single Unit, Detached | 1,308 (94.4%) | 78 (5.6%) |
| Single Unit, Attached | 35 (100.0%) | 0 (0.0%) |
| 2 Unit Apartments | 0 (0.0%) | 0 (0.0%) |
| 3 or 4 Unit Apartments | 24 (100.0%) | 0 (0.0%) |
| 5 to 9 Unit Apartments | 0 (0.0%) | 0 (0.0%) |
| 10 or more Apartments | 0 (0.0%) | 54 (100.0%) |
| Mobile Home / Other | 0 (0.0%) | 0 (0.0%) |
| Total | 1,367 (91.2%) | 132 (8.8%) |
Housing Structures by Number of Rooms in Fruit Hill
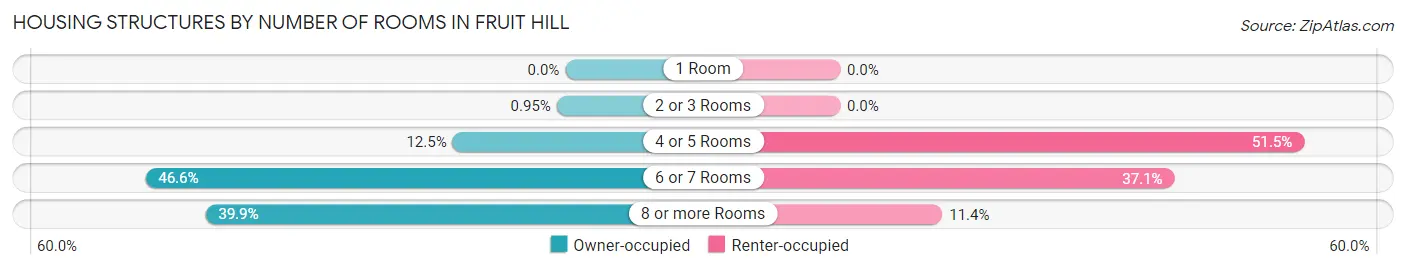
| Number of Rooms | Owner-occupied | Renter-occupied |
| 1 Room | 0 (0.0%) | 0 (0.0%) |
| 2 or 3 Rooms | 13 (0.9%) | 0 (0.0%) |
| 4 or 5 Rooms | 171 (12.5%) | 68 (51.5%) |
| 6 or 7 Rooms | 637 (46.6%) | 49 (37.1%) |
| 8 or more Rooms | 546 (39.9%) | 15 (11.4%) |
| Total | 1,367 (100.0%) | 132 (100.0%) |
Housing Structure by Heating Type in Fruit Hill
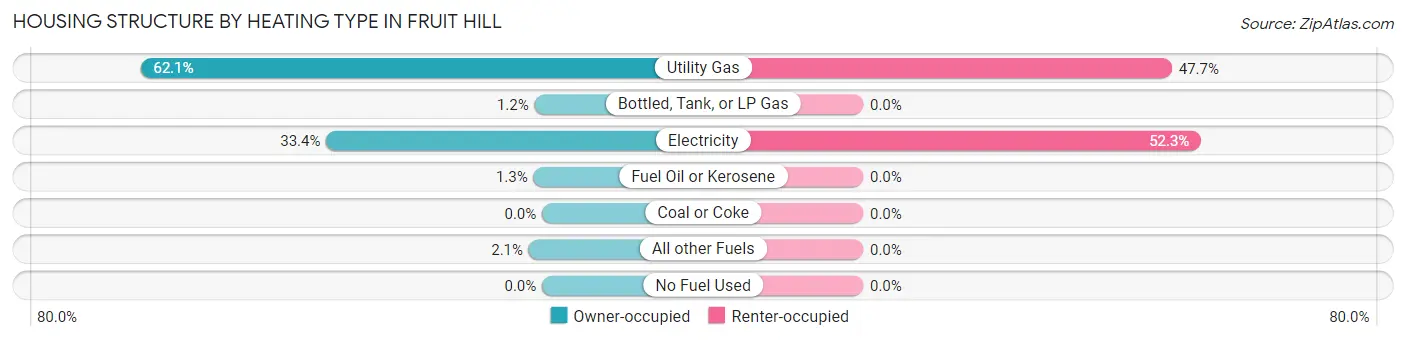
| Heating Type | Owner-occupied | Renter-occupied |
| Utility Gas | 849 (62.1%) | 63 (47.7%) |
| Bottled, Tank, or LP Gas | 16 (1.2%) | 0 (0.0%) |
| Electricity | 456 (33.4%) | 69 (52.3%) |
| Fuel Oil or Kerosene | 18 (1.3%) | 0 (0.0%) |
| Coal or Coke | 0 (0.0%) | 0 (0.0%) |
| All other Fuels | 28 (2.1%) | 0 (0.0%) |
| No Fuel Used | 0 (0.0%) | 0 (0.0%) |
| Total | 1,367 (100.0%) | 132 (100.0%) |
Household Vehicle Usage in Fruit Hill
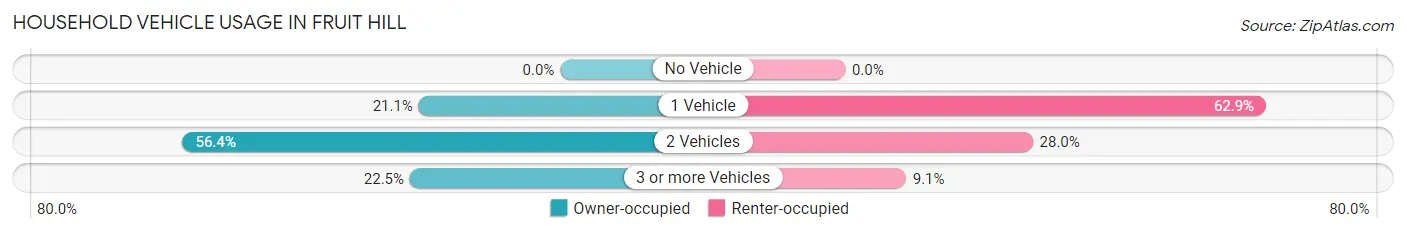
| Vehicles per Household | Owner-occupied | Renter-occupied |
| No Vehicle | 0 (0.0%) | 0 (0.0%) |
| 1 Vehicle | 289 (21.1%) | 83 (62.9%) |
| 2 Vehicles | 771 (56.4%) | 37 (28.0%) |
| 3 or more Vehicles | 307 (22.5%) | 12 (9.1%) |
| Total | 1,367 (100.0%) | 132 (100.0%) |
Real Estate & Mortgages in Fruit Hill
Real Estate and Mortgage Overview in Fruit Hill
| Characteristic | Without Mortgage | With Mortgage |
| Housing Units | 323 | 1,044 |
| Median Property Value | $220,000 | $234,300 |
| Median Household Income | $101,250 | $254 |
| Monthly Housing Costs | $696 | $188 |
| Real Estate Taxes | $4,147 | $16 |
Property Value by Mortgage Status in Fruit Hill
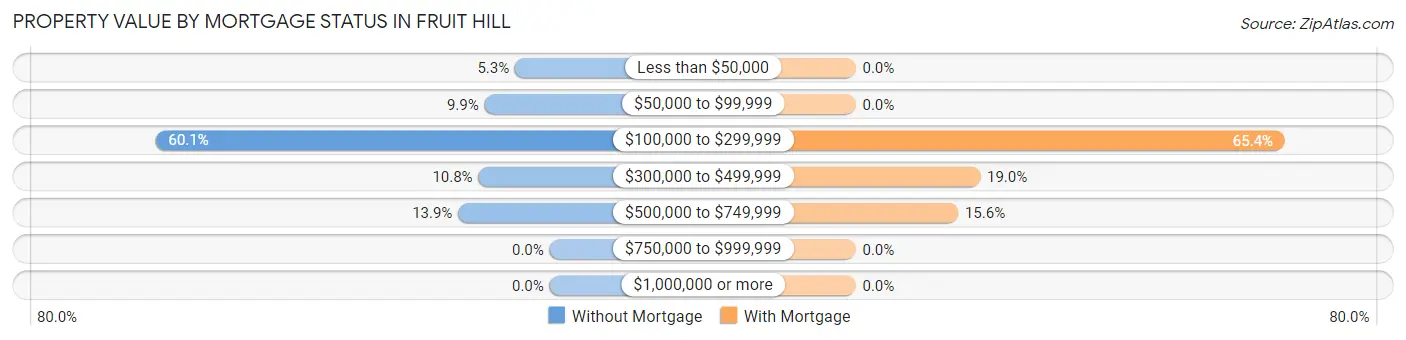
| Property Value | Without Mortgage | With Mortgage |
| Less than $50,000 | 17 (5.3%) | 0 (0.0%) |
| $50,000 to $99,999 | 32 (9.9%) | 0 (0.0%) |
| $100,000 to $299,999 | 194 (60.1%) | 683 (65.4%) |
| $300,000 to $499,999 | 35 (10.8%) | 198 (19.0%) |
| $500,000 to $749,999 | 45 (13.9%) | 163 (15.6%) |
| $750,000 to $999,999 | 0 (0.0%) | 0 (0.0%) |
| $1,000,000 or more | 0 (0.0%) | 0 (0.0%) |
| Total | 323 (100.0%) | 1,044 (100.0%) |
Household Income by Mortgage Status in Fruit Hill
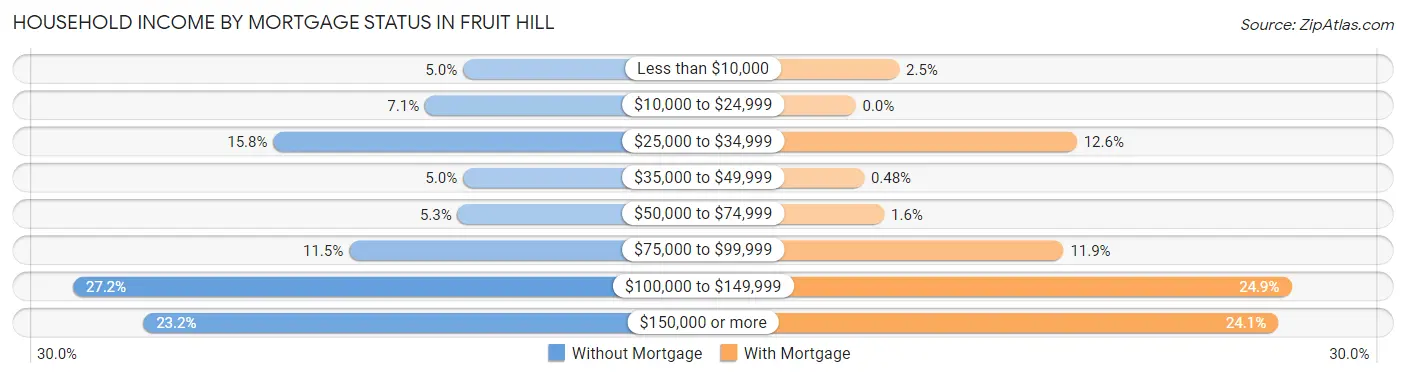
| Household Income | Without Mortgage | With Mortgage |
| Less than $10,000 | 16 (5.0%) | 26 (2.5%) |
| $10,000 to $24,999 | 23 (7.1%) | 0 (0.0%) |
| $25,000 to $34,999 | 51 (15.8%) | 132 (12.6%) |
| $35,000 to $49,999 | 16 (5.0%) | 5 (0.5%) |
| $50,000 to $74,999 | 17 (5.3%) | 17 (1.6%) |
| $75,000 to $99,999 | 37 (11.5%) | 124 (11.9%) |
| $100,000 to $149,999 | 88 (27.2%) | 260 (24.9%) |
| $150,000 or more | 75 (23.2%) | 252 (24.1%) |
| Total | 323 (100.0%) | 1,044 (100.0%) |
Property Value to Household Income Ratio in Fruit Hill
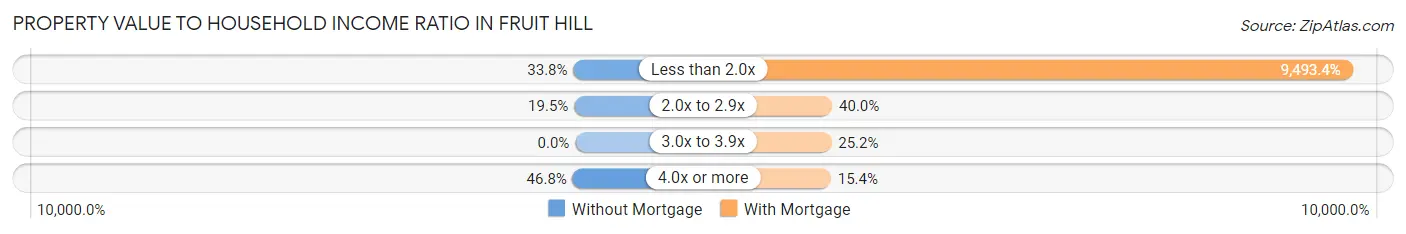
| Value-to-Income Ratio | Without Mortgage | With Mortgage |
| Less than 2.0x | 109 (33.8%) | 99,111 (9,493.4%) |
| 2.0x to 2.9x | 63 (19.5%) | 418 (40.0%) |
| 3.0x to 3.9x | 0 (0.0%) | 263 (25.2%) |
| 4.0x or more | 151 (46.8%) | 161 (15.4%) |
| Total | 323 (100.0%) | 1,044 (100.0%) |
Real Estate Taxes by Mortgage Status in Fruit Hill
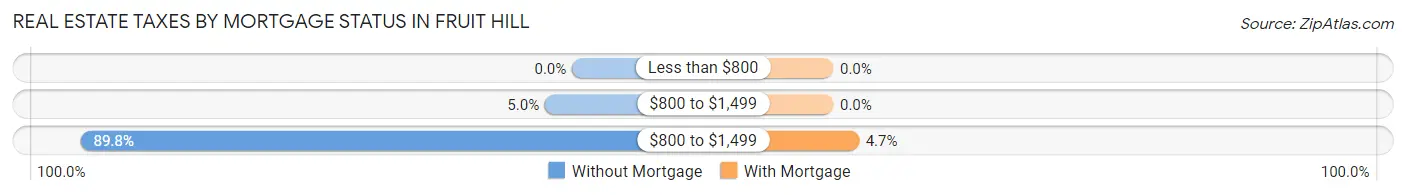
| Property Taxes | Without Mortgage | With Mortgage |
| Less than $800 | 0 (0.0%) | 0 (0.0%) |
| $800 to $1,499 | 16 (5.0%) | 0 (0.0%) |
| $800 to $1,499 | 290 (89.8%) | 49 (4.7%) |
| Total | 323 (100.0%) | 1,044 (100.0%) |
Health & Disability in Fruit Hill
Health Insurance Coverage by Age in Fruit Hill
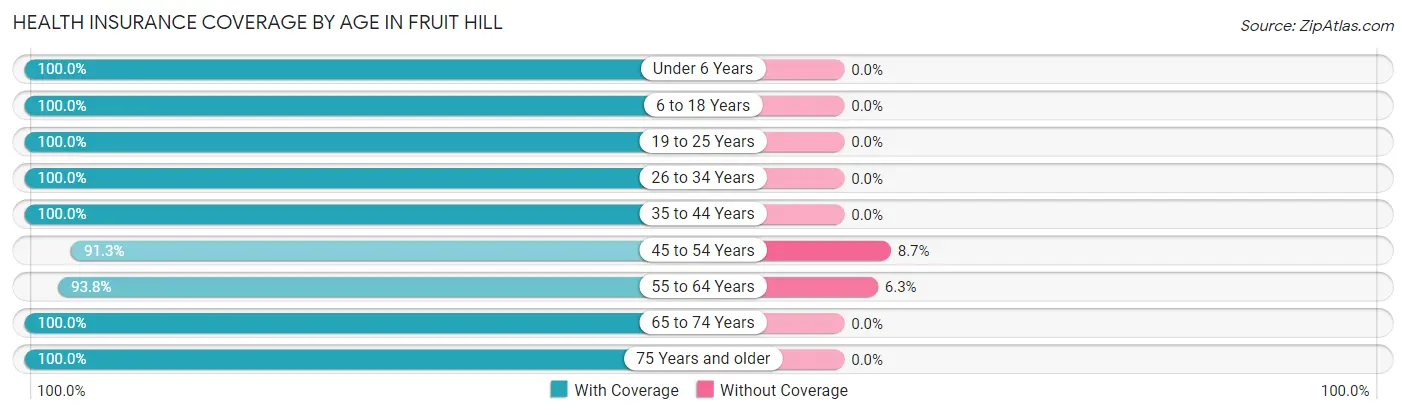
| Age Bracket | With Coverage | Without Coverage |
| Under 6 Years | 326 (100.0%) | 0 (0.0%) |
| 6 to 18 Years | 874 (100.0%) | 0 (0.0%) |
| 19 to 25 Years | 189 (100.0%) | 0 (0.0%) |
| 26 to 34 Years | 450 (100.0%) | 0 (0.0%) |
| 35 to 44 Years | 784 (100.0%) | 0 (0.0%) |
| 45 to 54 Years | 558 (91.3%) | 53 (8.7%) |
| 55 to 64 Years | 300 (93.8%) | 20 (6.2%) |
| 65 to 74 Years | 269 (100.0%) | 0 (0.0%) |
| 75 Years and older | 249 (100.0%) | 0 (0.0%) |
| Total | 3,999 (98.2%) | 73 (1.8%) |
Health Insurance Coverage by Citizenship Status in Fruit Hill
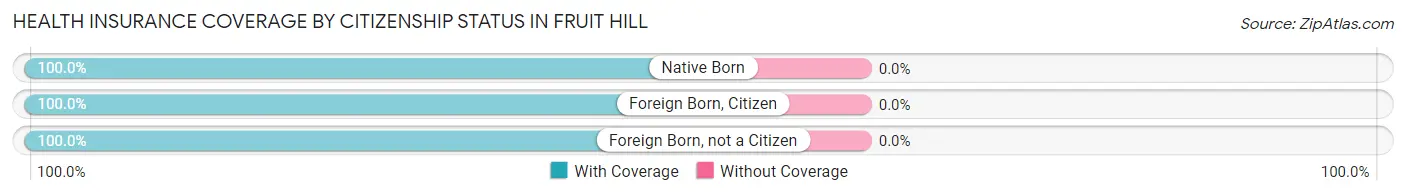
| Citizenship Status | With Coverage | Without Coverage |
| Native Born | 326 (100.0%) | 0 (0.0%) |
| Foreign Born, Citizen | 874 (100.0%) | 0 (0.0%) |
| Foreign Born, not a Citizen | 189 (100.0%) | 0 (0.0%) |
Health Insurance Coverage by Household Income in Fruit Hill
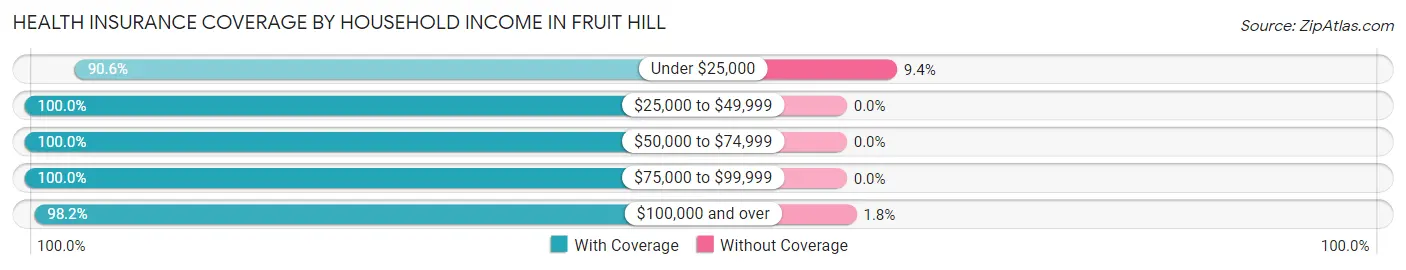
| Household Income | With Coverage | Without Coverage |
| Under $25,000 | 328 (90.6%) | 34 (9.4%) |
| $25,000 to $49,999 | 278 (100.0%) | 0 (0.0%) |
| $50,000 to $74,999 | 389 (100.0%) | 0 (0.0%) |
| $75,000 to $99,999 | 1,001 (100.0%) | 0 (0.0%) |
| $100,000 and over | 1,992 (98.2%) | 37 (1.8%) |
Public vs Private Health Insurance Coverage by Age in Fruit Hill
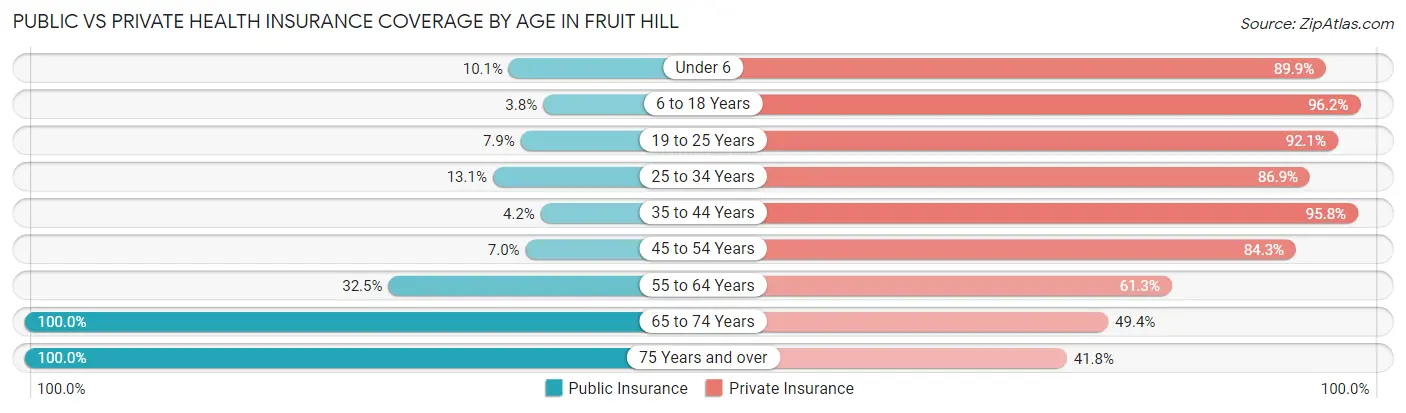
| Age Bracket | Public Insurance | Private Insurance |
| Under 6 | 33 (10.1%) | 293 (89.9%) |
| 6 to 18 Years | 33 (3.8%) | 841 (96.2%) |
| 19 to 25 Years | 15 (7.9%) | 174 (92.1%) |
| 25 to 34 Years | 59 (13.1%) | 391 (86.9%) |
| 35 to 44 Years | 33 (4.2%) | 751 (95.8%) |
| 45 to 54 Years | 43 (7.0%) | 515 (84.3%) |
| 55 to 64 Years | 104 (32.5%) | 196 (61.3%) |
| 65 to 74 Years | 269 (100.0%) | 133 (49.4%) |
| 75 Years and over | 249 (100.0%) | 104 (41.8%) |
| Total | 838 (20.6%) | 3,398 (83.5%) |
Disability Status by Sex by Age in Fruit Hill
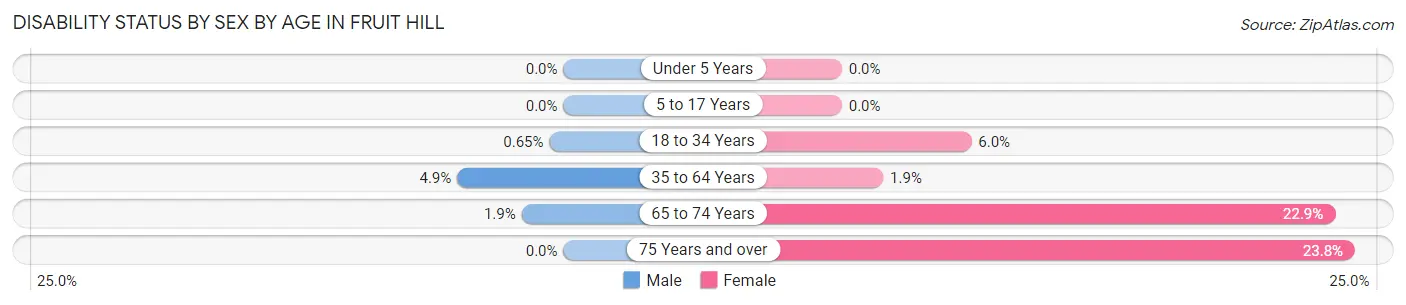
| Age Bracket | Male | Female |
| Under 5 Years | 0 (0.0%) | 0 (0.0%) |
| 5 to 17 Years | 0 (0.0%) | 0 (0.0%) |
| 18 to 34 Years | 2 (0.6%) | 20 (6.0%) |
| 35 to 64 Years | 41 (4.9%) | 17 (1.9%) |
| 65 to 74 Years | 2 (1.9%) | 38 (22.9%) |
| 75 Years and over | 0 (0.0%) | 45 (23.8%) |
Disability Class by Sex by Age in Fruit Hill
Disability Class: Hearing Difficulty
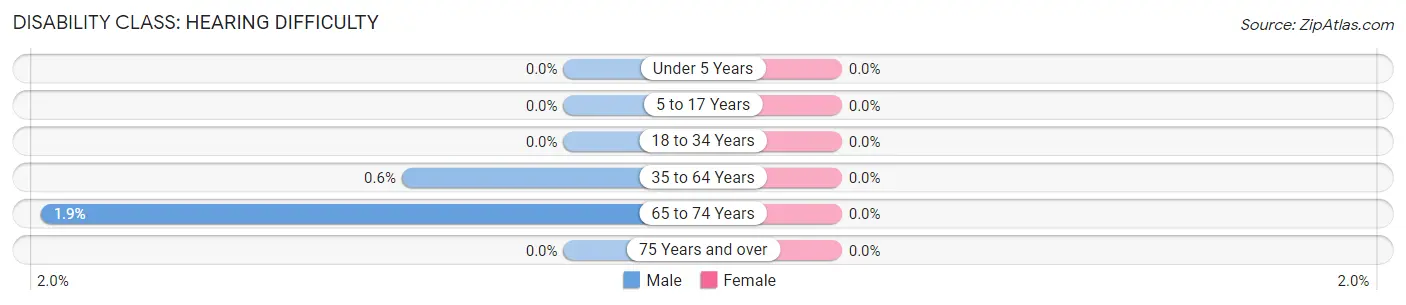
| Age Bracket | Male | Female |
| Under 5 Years | 0 (0.0%) | 0 (0.0%) |
| 5 to 17 Years | 0 (0.0%) | 0 (0.0%) |
| 18 to 34 Years | 0 (0.0%) | 0 (0.0%) |
| 35 to 64 Years | 5 (0.6%) | 0 (0.0%) |
| 65 to 74 Years | 2 (1.9%) | 0 (0.0%) |
| 75 Years and over | 0 (0.0%) | 0 (0.0%) |
Disability Class: Vision Difficulty
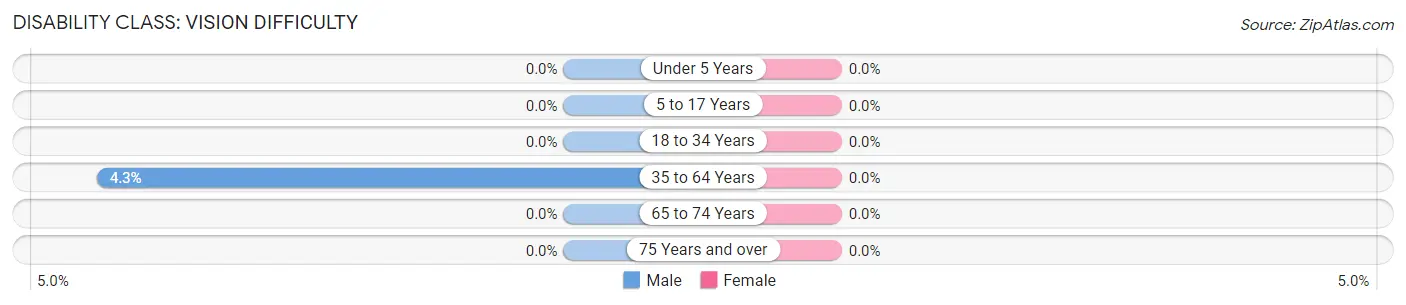
| Age Bracket | Male | Female |
| Under 5 Years | 0 (0.0%) | 0 (0.0%) |
| 5 to 17 Years | 0 (0.0%) | 0 (0.0%) |
| 18 to 34 Years | 0 (0.0%) | 0 (0.0%) |
| 35 to 64 Years | 36 (4.3%) | 0 (0.0%) |
| 65 to 74 Years | 0 (0.0%) | 0 (0.0%) |
| 75 Years and over | 0 (0.0%) | 0 (0.0%) |
Disability Class: Cognitive Difficulty
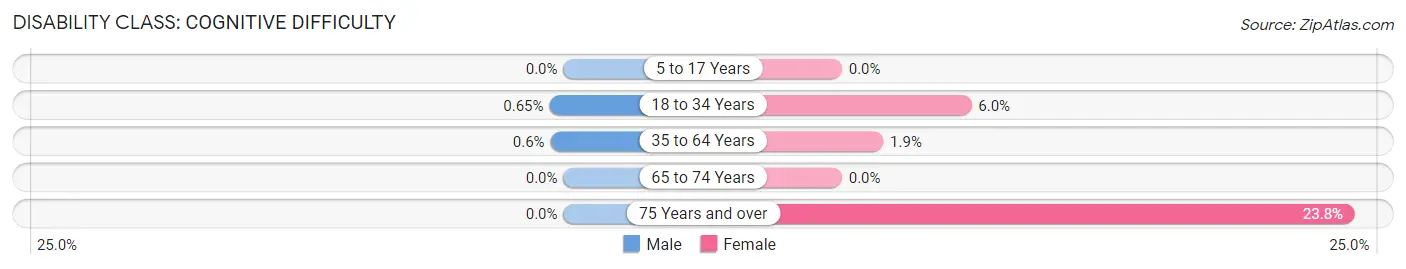
| Age Bracket | Male | Female |
| 5 to 17 Years | 0 (0.0%) | 0 (0.0%) |
| 18 to 34 Years | 2 (0.6%) | 20 (6.0%) |
| 35 to 64 Years | 5 (0.6%) | 17 (1.9%) |
| 65 to 74 Years | 0 (0.0%) | 0 (0.0%) |
| 75 Years and over | 0 (0.0%) | 45 (23.8%) |
Disability Class: Ambulatory Difficulty
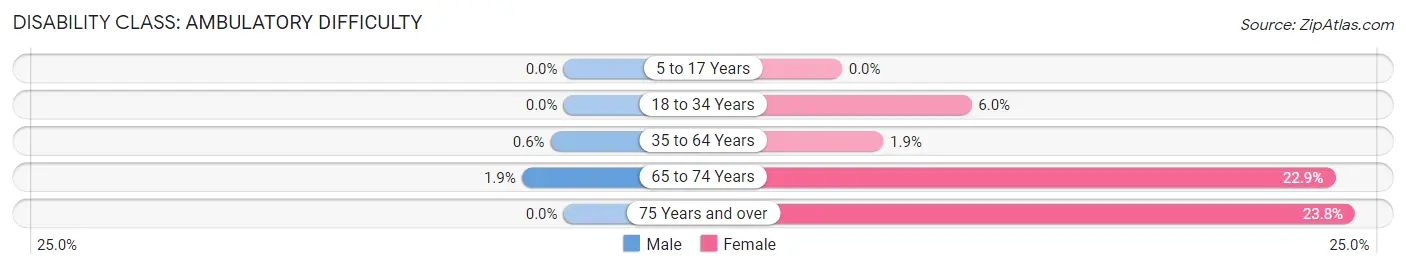
| Age Bracket | Male | Female |
| 5 to 17 Years | 0 (0.0%) | 0 (0.0%) |
| 18 to 34 Years | 0 (0.0%) | 20 (6.0%) |
| 35 to 64 Years | 5 (0.6%) | 17 (1.9%) |
| 65 to 74 Years | 2 (1.9%) | 38 (22.9%) |
| 75 Years and over | 0 (0.0%) | 45 (23.8%) |
Disability Class: Self-Care Difficulty
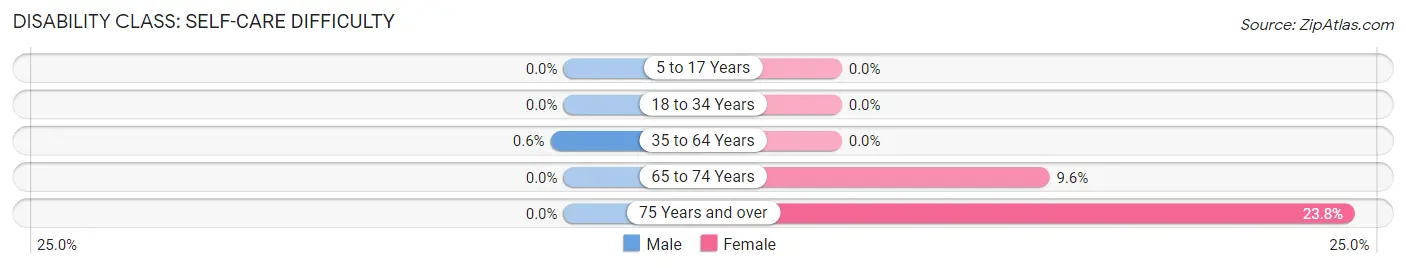
| Age Bracket | Male | Female |
| 5 to 17 Years | 0 (0.0%) | 0 (0.0%) |
| 18 to 34 Years | 0 (0.0%) | 0 (0.0%) |
| 35 to 64 Years | 5 (0.6%) | 0 (0.0%) |
| 65 to 74 Years | 0 (0.0%) | 16 (9.6%) |
| 75 Years and over | 0 (0.0%) | 45 (23.8%) |
Technology Access in Fruit Hill
Computing Device Access in Fruit Hill
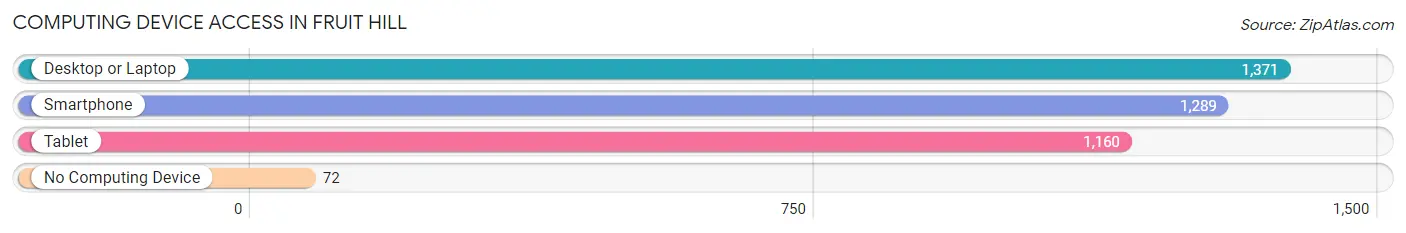
| Device Type | # Households | % Households |
| Desktop or Laptop | 1,371 | 91.5% |
| Smartphone | 1,289 | 86.0% |
| Tablet | 1,160 | 77.4% |
| No Computing Device | 72 | 4.8% |
| Total | 1,499 | 100.0% |
Internet Access in Fruit Hill
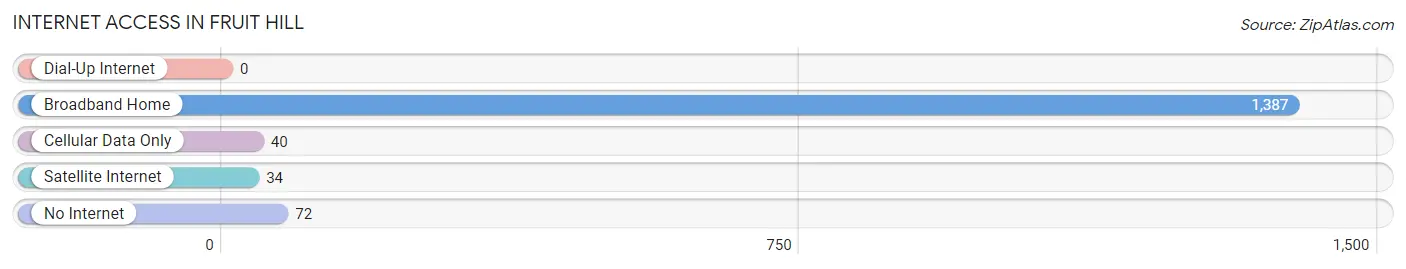
| Internet Type | # Households | % Households |
| Dial-Up Internet | 0 | 0.0% |
| Broadband Home | 1,387 | 92.5% |
| Cellular Data Only | 40 | 2.7% |
| Satellite Internet | 34 | 2.3% |
| No Internet | 72 | 4.8% |
| Total | 1,499 | 100.0% |
Fruit Hill Summary
Fruit Hill is a small village located in Montgomery County, Ohio, United States. It is situated in the Miami Valley region of the state, approximately 10 miles north of Dayton. The village has a population of approximately 1,000 people and is part of the Dayton Metropolitan Statistical Area.
History
Fruit Hill was founded in 1817 by a group of settlers from Pennsylvania. The village was originally known as “Fruit Hill” due to the abundance of fruit trees in the area. The village was incorporated in 1837 and was named after the nearby Fruit Hill Creek.
In the late 19th century, Fruit Hill was a thriving agricultural community. The village was home to several mills, a blacksmith shop, a general store, and a post office. The village also had a school, a church, and a cemetery.
In the early 20th century, Fruit Hill began to decline as the population shifted to larger cities. The village was eventually annexed by the City of Dayton in 1954.
Geography
Fruit Hill is located at 39°45'N 84°17'W (39.75, -84.28). The village is situated in the Miami Valley region of Ohio, approximately 10 miles north of Dayton. The village is bordered by the City of Dayton to the south, the City of Huber Heights to the east, and the City of Riverside to the west.
The village has a total area of 0.3 square miles, all of which is land. Fruit Hill is located in the Miami Valley region of Ohio, which is characterized by rolling hills and fertile farmland. The village is situated on the banks of the Great Miami River.
Economy
Fruit Hill is a primarily residential community. The village is home to several small businesses, including a grocery store, a hardware store, and a few restaurants. The village also has a post office and a library.
The village is served by the Dayton Public Schools system. The village is also home to a branch of the Montgomery County Public Library.
Demographics
As of the 2010 census, Fruit Hill had a population of 1,000 people. The racial makeup of the village was 95.2% White, 1.2% African American, 0.2% Native American, 0.7% Asian, 0.1% Pacific Islander, 0.7% from other races, and 1.9% from two or more races. Hispanic or Latino of any race were 2.2% of the population.
The median income for a household in Fruit Hill was $45,000, and the median income for a family was $50,000. The per capita income for the village was $20,000. About 8.2% of families and 10.2% of the population were below the poverty line, including 14.3% of those under age 18 and 5.2% of those age 65 or over.
Common Questions
What is Per Capita Income in Fruit Hill?
Per Capita income in Fruit Hill is $42,679.
What is the Median Family Income in Fruit Hill?
Median Family Income in Fruit Hill is $98,778.
What is the Median Household income in Fruit Hill?
Median Household Income in Fruit Hill is $98,361.
What is Inequality or Gini Index in Fruit Hill?
Inequality or Gini Index in Fruit Hill is 0.41.
What is the Total Population of Fruit Hill?
Total Population of Fruit Hill is 4,157.
What is the Total Male Population of Fruit Hill?
Total Male Population of Fruit Hill is 1,709.
What is the Total Female Population of Fruit Hill?
Total Female Population of Fruit Hill is 2,448.
What is the Ratio of Males per 100 Females in Fruit Hill?
There are 69.81 Males per 100 Females in Fruit Hill.
What is the Ratio of Females per 100 Males in Fruit Hill?
There are 143.24 Females per 100 Males in Fruit Hill.
What is the Median Population Age in Fruit Hill?
Median Population Age in Fruit Hill is 37.8 Years.
What is the Average Family Size in Fruit Hill
Average Family Size in Fruit Hill is 3.1 People.
What is the Average Household Size in Fruit Hill
Average Household Size in Fruit Hill is 2.7 People.
How Large is the Labor Force in Fruit Hill?
There are 2,275 People in the Labor Forcein in Fruit Hill.
What is the Percentage of People in the Labor Force in Fruit Hill?
74.7% of People are in the Labor Force in Fruit Hill.
What is the Unemployment Rate in Fruit Hill?
Unemployment Rate in Fruit Hill is 2.7%.