Hilltop, OH Map & Demographics
Hilltop Map
Hilltop Overview
$43,115
PER CAPITA INCOME
$103,333
AVG FAMILY INCOME
$70,774
AVG HOUSEHOLD INCOME
9.8%
WAGE / INCOME GAP [ % ]
90.2¢/ $1
WAGE / INCOME GAP [ $ ]
0.51
INEQUALITY / GINI INDEX
653
TOTAL POPULATION
349
MALE POPULATION
304
FEMALE POPULATION
114.80
MALES / 100 FEMALES
87.11
FEMALES / 100 MALES
39.7
MEDIAN AGE
3.3
AVG FAMILY SIZE
2.9
AVG HOUSEHOLD SIZE
351
LABOR FORCE [ PEOPLE ]
59.8%
PERCENT IN LABOR FORCE
4.8%
UNEMPLOYMENT RATE
Income in Hilltop
Income Overview in Hilltop
Per Capita Income in Hilltop is $43,115, while median incomes of families and households are $103,333 and $70,774 respectively.
| Characteristic | Number | Measure |
| Per Capita Income | 653 | $43,115 |
| Median Family Income | 186 | $103,333 |
| Mean Family Income | 186 | $139,487 |
| Median Household Income | 223 | $70,774 |
| Mean Household Income | 223 | $122,404 |
| Income Deficit | 186 | $0 |
| Wage / Income Gap (%) | 653 | 9.77% |
| Wage / Income Gap ($) | 653 | 90.23¢ per $1 |
| Gini / Inequality Index | 653 | 0.51 |
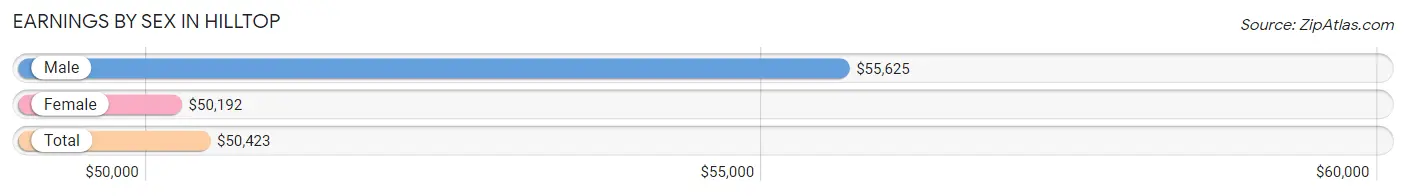
Earnings by Sex in Hilltop
Average Earnings in Hilltop are $50,423, $55,625 for men and $50,192 for women, a difference of 9.8%.
| Sex | Number | Average Earnings |
| Male | 180 (53.9%) | $55,625 |
| Female | 154 (46.1%) | $50,192 |
| Total | 334 (100.0%) | $50,423 |
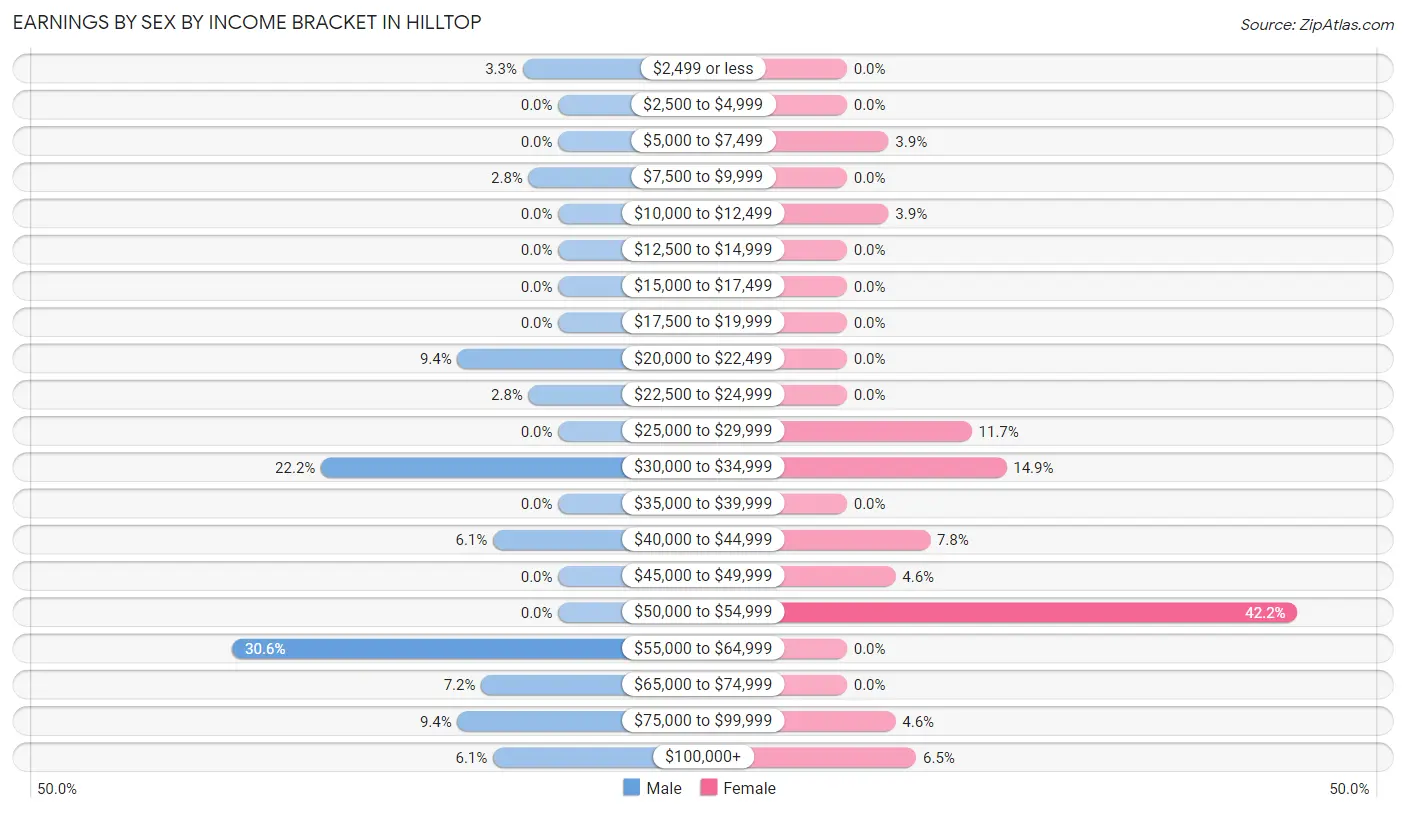
Earnings by Sex by Income Bracket in Hilltop
The most common earnings brackets in Hilltop are $55,000 to $64,999 for men (55 | 30.6%) and $50,000 to $54,999 for women (65 | 42.2%).
| Income | Male | Female |
| $2,499 or less | 6 (3.3%) | 0 (0.0%) |
| $2,500 to $4,999 | 0 (0.0%) | 0 (0.0%) |
| $5,000 to $7,499 | 0 (0.0%) | 6 (3.9%) |
| $7,500 to $9,999 | 5 (2.8%) | 0 (0.0%) |
| $10,000 to $12,499 | 0 (0.0%) | 6 (3.9%) |
| $12,500 to $14,999 | 0 (0.0%) | 0 (0.0%) |
| $15,000 to $17,499 | 0 (0.0%) | 0 (0.0%) |
| $17,500 to $19,999 | 0 (0.0%) | 0 (0.0%) |
| $20,000 to $22,499 | 17 (9.4%) | 0 (0.0%) |
| $22,500 to $24,999 | 5 (2.8%) | 0 (0.0%) |
| $25,000 to $29,999 | 0 (0.0%) | 18 (11.7%) |
| $30,000 to $34,999 | 40 (22.2%) | 23 (14.9%) |
| $35,000 to $39,999 | 0 (0.0%) | 0 (0.0%) |
| $40,000 to $44,999 | 11 (6.1%) | 12 (7.8%) |
| $45,000 to $49,999 | 0 (0.0%) | 7 (4.5%) |
| $50,000 to $54,999 | 0 (0.0%) | 65 (42.2%) |
| $55,000 to $64,999 | 55 (30.6%) | 0 (0.0%) |
| $65,000 to $74,999 | 13 (7.2%) | 0 (0.0%) |
| $75,000 to $99,999 | 17 (9.4%) | 7 (4.5%) |
| $100,000+ | 11 (6.1%) | 10 (6.5%) |
| Total | 180 (100.0%) | 154 (100.0%) |
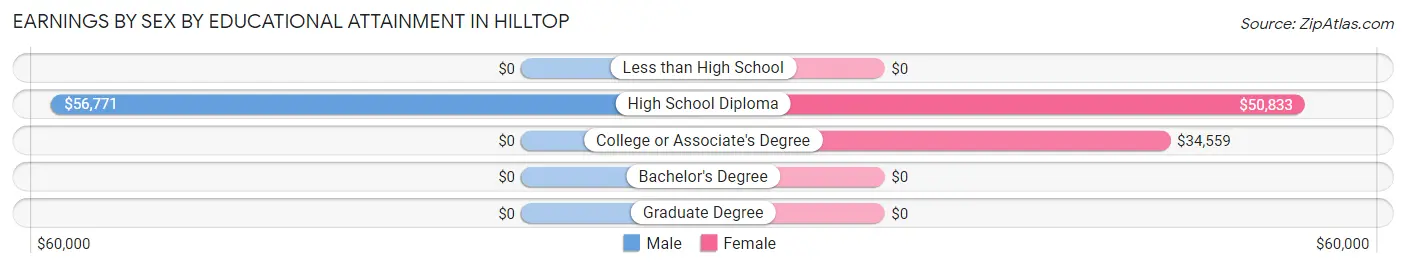
Earnings by Sex by Educational Attainment in Hilltop
Average earnings in Hilltop are $56,406 for men and $50,538 for women, a difference of 10.4%. Men with an educational attainment of high school diploma enjoy the highest average annual earnings of $56,771, while those with high school diploma education earn the least with $56,771. Women with an educational attainment of high school diploma earn the most with the average annual earnings of $50,833, while those with college or associate's degree education have the smallest earnings of $34,559.
| Educational Attainment | Male Income | Female Income |
| Less than High School | - | - |
| High School Diploma | $56,771 | $50,833 |
| College or Associate's Degree | - | - |
| Bachelor's Degree | - | - |
| Graduate Degree | - | - |
| Total | $56,406 | $50,538 |
Family Income in Hilltop
Family Income Brackets in Hilltop
According to the Hilltop family income data, there are 62 families falling into the $100,000 to $149,999 income range, which is the most common income bracket and makes up 33.3% of all families.
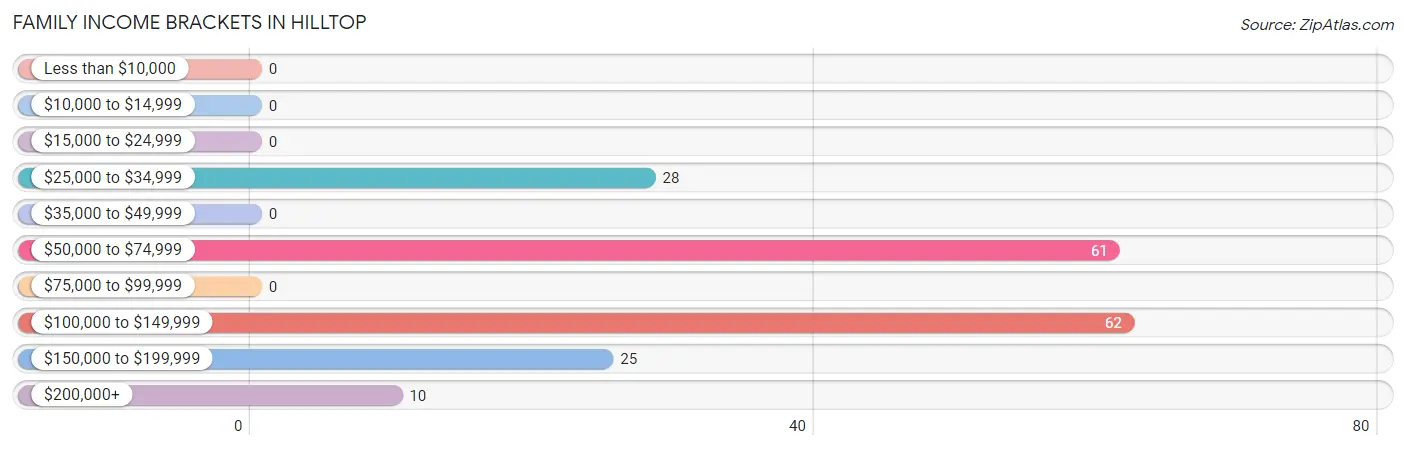
| Income Bracket | # Families | % Families |
| Less than $10,000 | 0 | 0.0% |
| $10,000 to $14,999 | 0 | 0.0% |
| $15,000 to $24,999 | 0 | 0.0% |
| $25,000 to $34,999 | 28 | 15.1% |
| $35,000 to $49,999 | 0 | 0.0% |
| $50,000 to $74,999 | 61 | 32.8% |
| $75,000 to $99,999 | 0 | 0.0% |
| $100,000 to $149,999 | 62 | 33.3% |
| $150,000 to $199,999 | 25 | 13.4% |
| $200,000+ | 10 | 5.4% |
Family Income by Famaliy Size in Hilltop
4-person families (57 | 30.6%) account for the highest median family income in Hilltop with $110,592 per family, while 2-person families (77 | 41.4%) have the highest median income of $31,948 per family member.
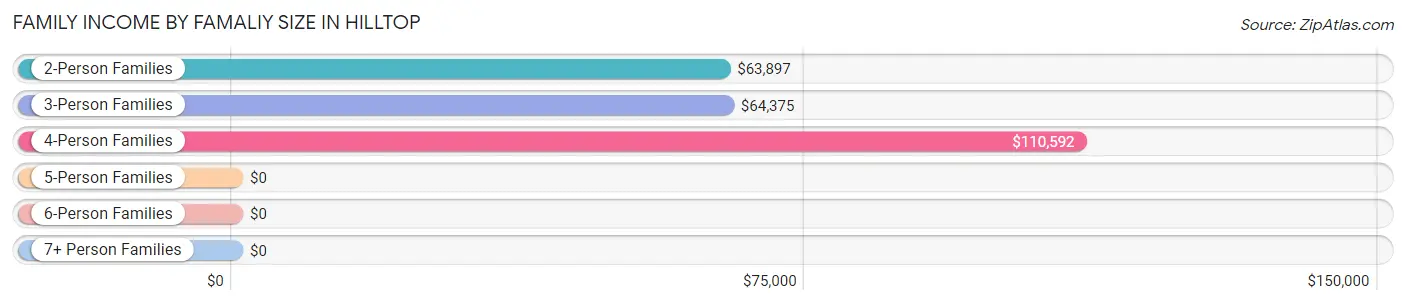
| Income Bracket | # Families | Median Income |
| 2-Person Families | 77 (41.4%) | $63,897 |
| 3-Person Families | 28 (15.0%) | $64,375 |
| 4-Person Families | 57 (30.6%) | $110,592 |
| 5-Person Families | 18 (9.7%) | $0 |
| 6-Person Families | 0 (0.0%) | $0 |
| 7+ Person Families | 6 (3.2%) | $0 |
| Total | 186 (100.0%) | $103,333 |
Family Income by Number of Earners in Hilltop
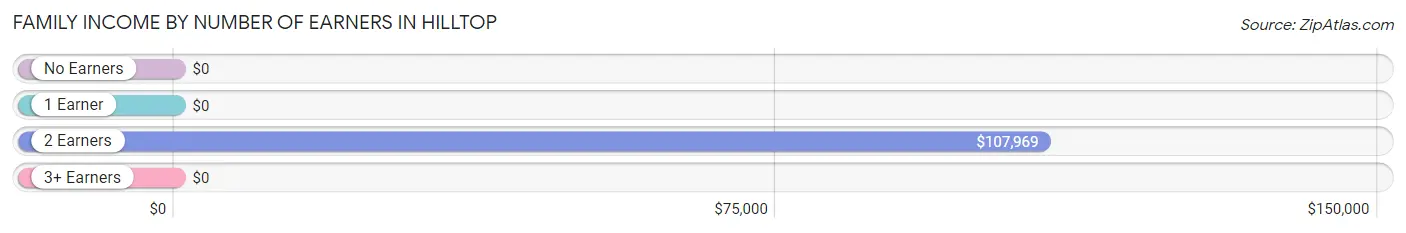
| Number of Earners | # Families | Median Income |
| No Earners | 40 (21.5%) | $0 |
| 1 Earner | 3 (1.6%) | $0 |
| 2 Earners | 125 (67.2%) | $107,969 |
| 3+ Earners | 18 (9.7%) | $0 |
| Total | 186 (100.0%) | $103,333 |
Household Income in Hilltop
Household Income Brackets in Hilltop
With 68 households falling in the category, the $50,000 to $74,999 income range is the most frequent in Hilltop, accounting for 30.5% of all households.
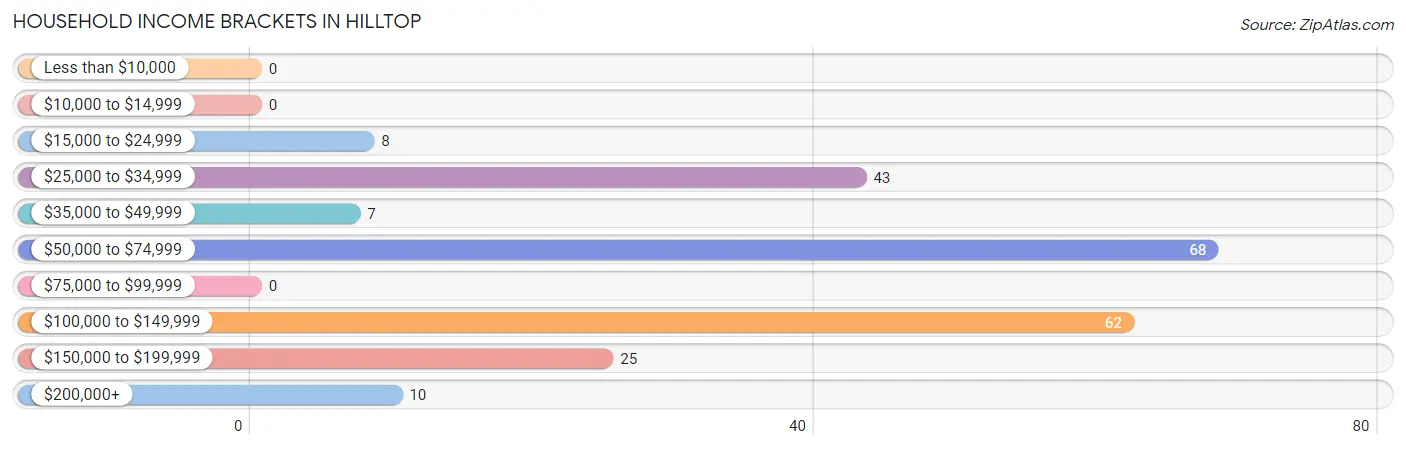
| Income Bracket | # Households | % Households |
| Less than $10,000 | 0 | 0.0% |
| $10,000 to $14,999 | 0 | 0.0% |
| $15,000 to $24,999 | 8 | 3.6% |
| $25,000 to $34,999 | 43 | 19.3% |
| $35,000 to $49,999 | 7 | 3.1% |
| $50,000 to $74,999 | 68 | 30.5% |
| $75,000 to $99,999 | 0 | 0.0% |
| $100,000 to $149,999 | 62 | 27.8% |
| $150,000 to $199,999 | 25 | 11.2% |
| $200,000+ | 10 | 4.5% |
Household Income by Householder Age in Hilltop
The median household income in Hilltop is $70,774, with the highest median household income of $109,792 found in the 25 to 44 years age bracket for the primary householder. A total of 56 households (25.1%) fall into this category. Meanwhile, the 15 to 24 years age bracket for the primary householder has the lowest median household income of $0, with 15 households (6.7%) in this group.
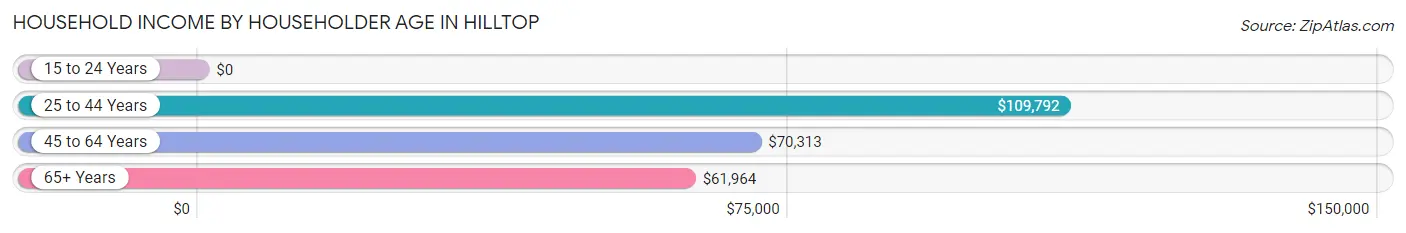
| Income Bracket | # Households | Median Income |
| 15 to 24 Years | 15 (6.7%) | $0 |
| 25 to 44 Years | 56 (25.1%) | $109,792 |
| 45 to 64 Years | 115 (51.6%) | $70,313 |
| 65+ Years | 37 (16.6%) | $61,964 |
| Total | 223 (100.0%) | $70,774 |
Poverty in Hilltop
Income Below Poverty by Sex and Age in Hilltop
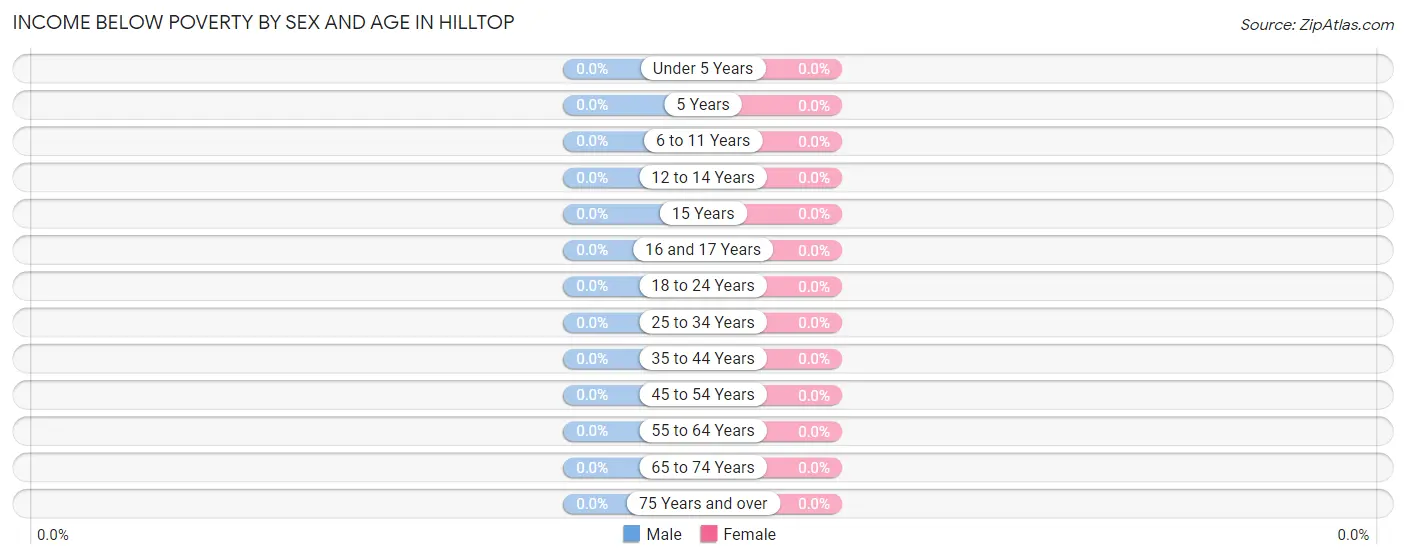
| Age Bracket | Male | Female |
| Under 5 Years | 0 (0.0%) | 0 (0.0%) |
| 5 Years | 0 (0.0%) | 0 (0.0%) |
| 6 to 11 Years | 0 (0.0%) | 0 (0.0%) |
| 12 to 14 Years | 0 (0.0%) | 0 (0.0%) |
| 15 Years | 0 (0.0%) | 0 (0.0%) |
| 16 and 17 Years | 0 (0.0%) | 0 (0.0%) |
| 18 to 24 Years | 0 (0.0%) | 0 (0.0%) |
| 25 to 34 Years | 0 (0.0%) | 0 (0.0%) |
| 35 to 44 Years | 0 (0.0%) | 0 (0.0%) |
| 45 to 54 Years | 0 (0.0%) | 0 (0.0%) |
| 55 to 64 Years | 0 (0.0%) | 0 (0.0%) |
| 65 to 74 Years | 0 (0.0%) | 0 (0.0%) |
| 75 Years and over | 0 (0.0%) | 0 (0.0%) |
| Total | 0 (0.0%) | 0 (0.0%) |
Income Above Poverty by Sex and Age in Hilltop
According to the poverty statistics in Hilltop, males aged 6 to 11 years and females aged under 5 years are the age groups that are most secure financially, with 100.0% of males and 100.0% of females in these age groups living above the poverty line.
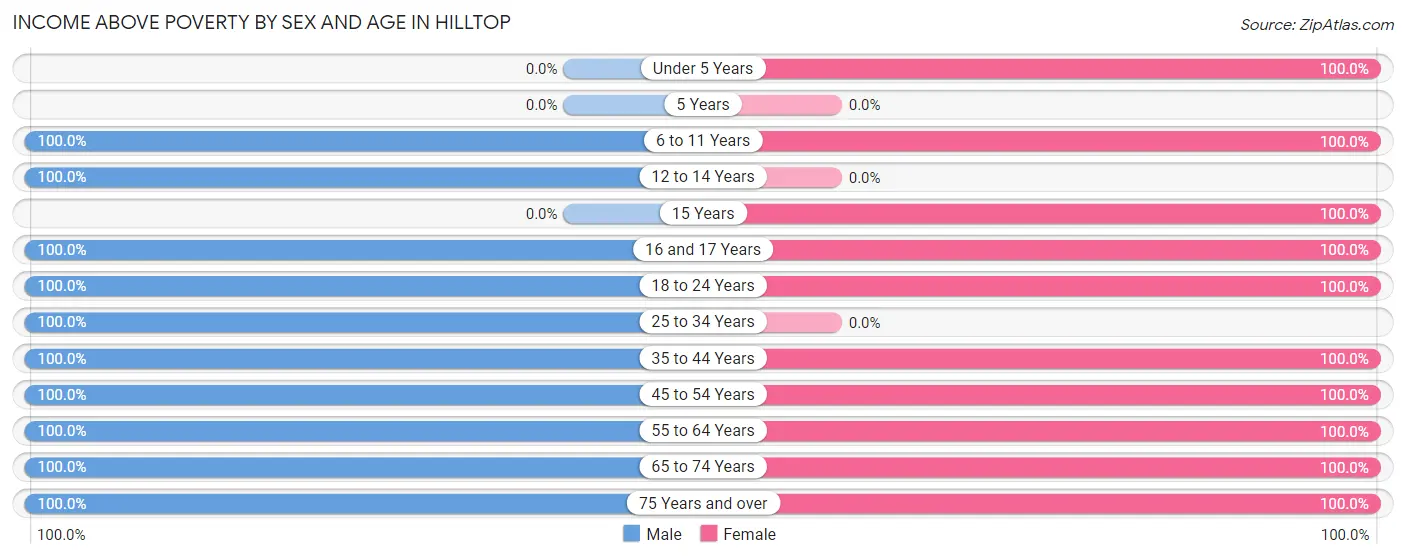
| Age Bracket | Male | Female |
| Under 5 Years | 0 (0.0%) | 32 (100.0%) |
| 5 Years | 0 (0.0%) | 0 (0.0%) |
| 6 to 11 Years | 6 (100.0%) | 13 (100.0%) |
| 12 to 14 Years | 8 (100.0%) | 0 (0.0%) |
| 15 Years | 0 (0.0%) | 7 (100.0%) |
| 16 and 17 Years | 48 (100.0%) | 26 (100.0%) |
| 18 to 24 Years | 55 (100.0%) | 18 (100.0%) |
| 25 to 34 Years | 44 (100.0%) | 0 (0.0%) |
| 35 to 44 Years | 35 (100.0%) | 78 (100.0%) |
| 45 to 54 Years | 24 (100.0%) | 58 (100.0%) |
| 55 to 64 Years | 81 (100.0%) | 23 (100.0%) |
| 65 to 74 Years | 40 (100.0%) | 46 (100.0%) |
| 75 Years and over | 8 (100.0%) | 3 (100.0%) |
| Total | 349 (100.0%) | 304 (100.0%) |
Income Below Poverty Among Married-Couple Families in Hilltop
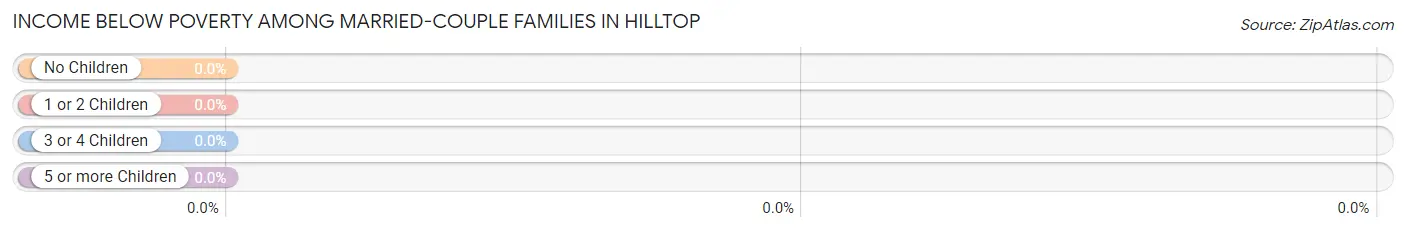
| Children | Above Poverty | Below Poverty |
| No Children | 102 (100.0%) | 0 (0.0%) |
| 1 or 2 Children | 81 (100.0%) | 0 (0.0%) |
| 3 or 4 Children | 0 (0.0%) | 0 (0.0%) |
| 5 or more Children | 0 (0.0%) | 0 (0.0%) |
| Total | 183 (100.0%) | 0 (0.0%) |
Income Below Poverty Among Single-Parent Households in Hilltop
| Children | Single Father | Single Mother |
| No Children | 0 (0.0%) | 0 (0.0%) |
| 1 or 2 Children | 0 (0.0%) | 0 (0.0%) |
| 3 or 4 Children | 0 (0.0%) | 0 (0.0%) |
| 5 or more Children | 0 (0.0%) | 0 (0.0%) |
| Total | 0 (0.0%) | 0 (0.0%) |
Income Below Poverty Among Married-Couple vs Single-Parent Households in Hilltop
| Children | Married-Couple Families | Single-Parent Households |
| No Children | 0 (0.0%) | 0 (0.0%) |
| 1 or 2 Children | 0 (0.0%) | 0 (0.0%) |
| 3 or 4 Children | 0 (0.0%) | 0 (0.0%) |
| 5 or more Children | 0 (0.0%) | 0 (0.0%) |
| Total | 0 (0.0%) | 0 (0.0%) |
Race in Hilltop
The most populous races in Hilltop are White / Caucasian (642 | 98.3%), and Two or more Races (11 | 1.7%).
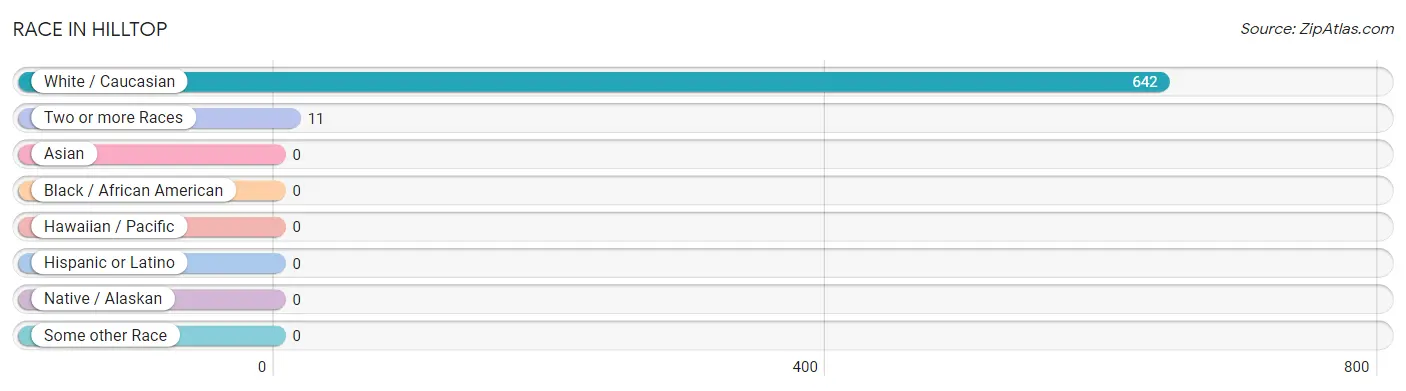
| Race | # Population | % Population |
| Asian | 0 | 0.0% |
| Black / African American | 0 | 0.0% |
| Hawaiian / Pacific | 0 | 0.0% |
| Hispanic or Latino | 0 | 0.0% |
| Native / Alaskan | 0 | 0.0% |
| White / Caucasian | 642 | 98.3% |
| Two or more Races | 11 | 1.7% |
| Some other Race | 0 | 0.0% |
| Total | 653 | 100.0% |
Ancestry in Hilltop
The most populous ancestries reported in Hilltop are German (146 | 22.4%), Italian (49 | 7.5%), Irish (31 | 4.8%), Welsh (21 | 3.2%), and Slovak (19 | 2.9%), together accounting for 40.7% of all Hilltop residents.
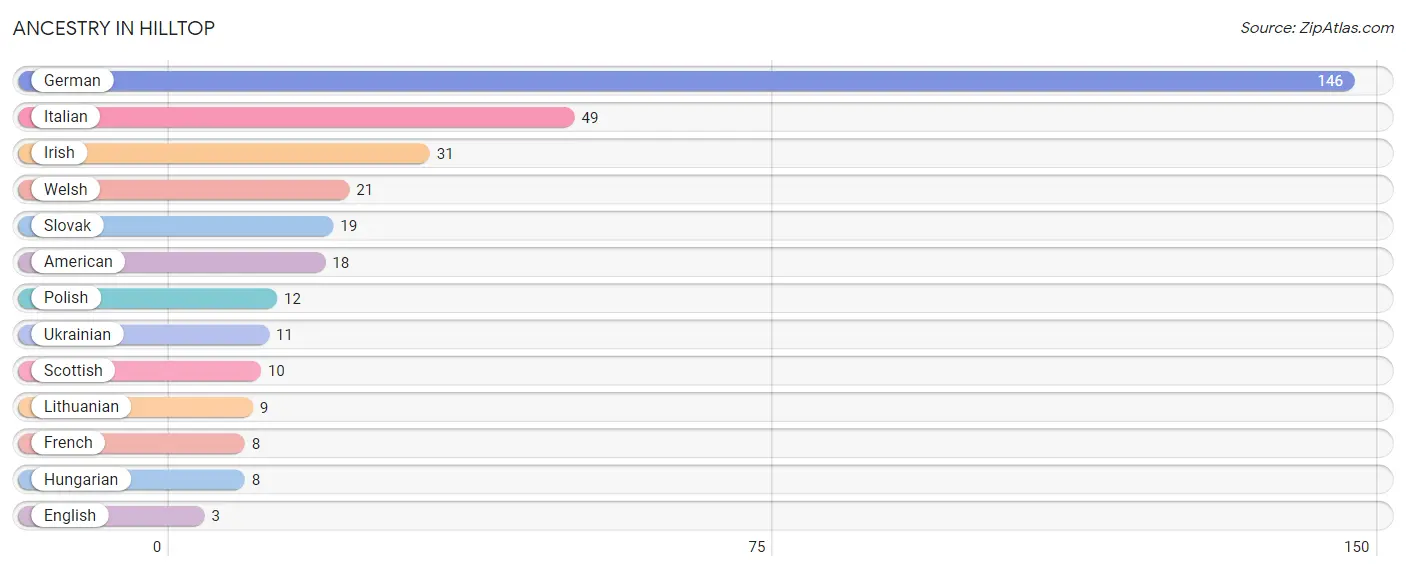
| Ancestry | # Population | % Population |
| American | 18 | 2.8% |
| English | 3 | 0.5% |
| French | 8 | 1.2% |
| German | 146 | 22.4% |
| Hungarian | 8 | 1.2% |
| Irish | 31 | 4.8% |
| Italian | 49 | 7.5% |
| Lithuanian | 9 | 1.4% |
| Polish | 12 | 1.8% |
| Scottish | 10 | 1.5% |
| Slovak | 19 | 2.9% |
| Ukrainian | 11 | 1.7% |
| Welsh | 21 | 3.2% | View All 13 Rows |
Immigrants in Hilltop

| Immigration Origin | # Population | % Population | View All 0 Rows |
Sex and Age in Hilltop
Sex and Age in Hilltop
The most populous age groups in Hilltop are 15 to 19 Years (65 | 18.6%) for men and 35 to 39 Years (53 | 17.4%) for women.
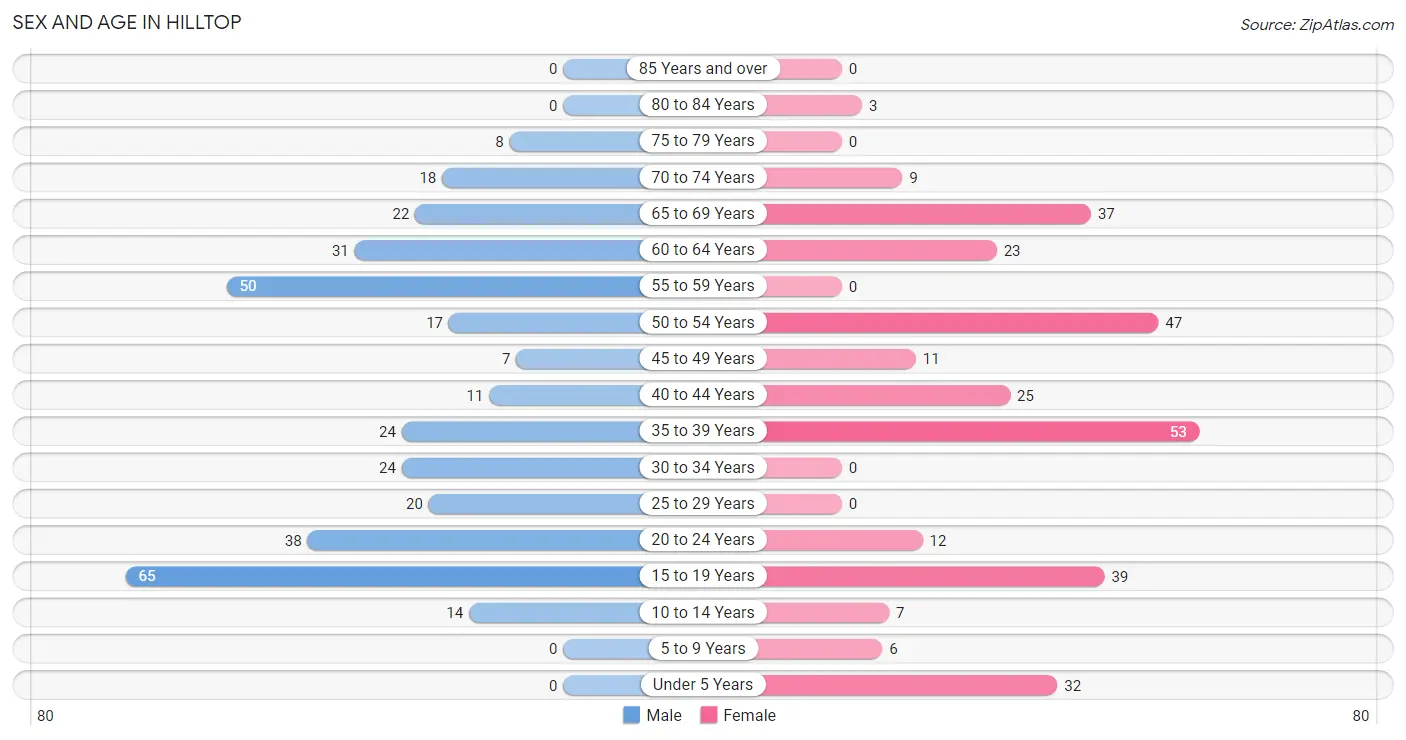
| Age Bracket | Male | Female |
| Under 5 Years | 0 (0.0%) | 32 (10.5%) |
| 5 to 9 Years | 0 (0.0%) | 6 (2.0%) |
| 10 to 14 Years | 14 (4.0%) | 7 (2.3%) |
| 15 to 19 Years | 65 (18.6%) | 39 (12.8%) |
| 20 to 24 Years | 38 (10.9%) | 12 (4.0%) |
| 25 to 29 Years | 20 (5.7%) | 0 (0.0%) |
| 30 to 34 Years | 24 (6.9%) | 0 (0.0%) |
| 35 to 39 Years | 24 (6.9%) | 53 (17.4%) |
| 40 to 44 Years | 11 (3.2%) | 25 (8.2%) |
| 45 to 49 Years | 7 (2.0%) | 11 (3.6%) |
| 50 to 54 Years | 17 (4.9%) | 47 (15.5%) |
| 55 to 59 Years | 50 (14.3%) | 0 (0.0%) |
| 60 to 64 Years | 31 (8.9%) | 23 (7.6%) |
| 65 to 69 Years | 22 (6.3%) | 37 (12.2%) |
| 70 to 74 Years | 18 (5.2%) | 9 (3.0%) |
| 75 to 79 Years | 8 (2.3%) | 0 (0.0%) |
| 80 to 84 Years | 0 (0.0%) | 3 (1.0%) |
| 85 Years and over | 0 (0.0%) | 0 (0.0%) |
| Total | 349 (100.0%) | 304 (100.0%) |
Families and Households in Hilltop
Median Family Size in Hilltop
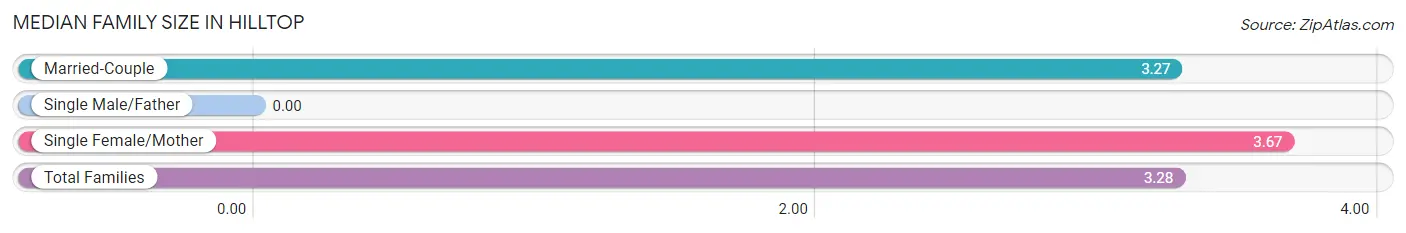
| Family Type | # Families | Family Size |
| Married-Couple | 183 (98.4%) | 3.27 |
| Single Male/Father | 0 (0.0%) | - |
| Single Female/Mother | 3 (1.6%) | 3.67 |
| Total Families | 186 (100.0%) | 3.28 |
Median Household Size in Hilltop
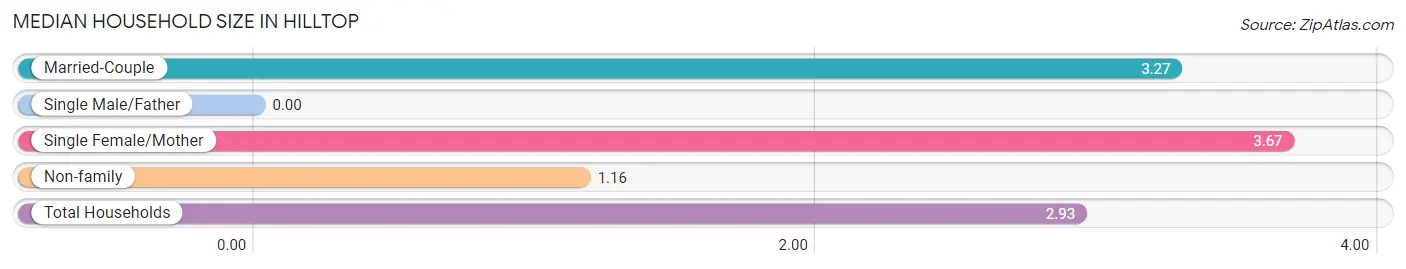
| Household Type | # Households | Household Size |
| Married-Couple | 183 (82.1%) | 3.27 |
| Single Male/Father | 0 (0.0%) | - |
| Single Female/Mother | 3 (1.3%) | 3.67 |
| Non-family | 37 (16.6%) | 1.16 |
| Total Households | 223 (100.0%) | 2.93 |
Household Size by Marriage Status in Hilltop
Out of a total of 223 households in Hilltop, 186 (83.4%) are family households, while 37 (16.6%) are nonfamily households. The most numerous type of family households are 2-person households, comprising 77, and the most common type of nonfamily households are 1-person households, comprising 30.
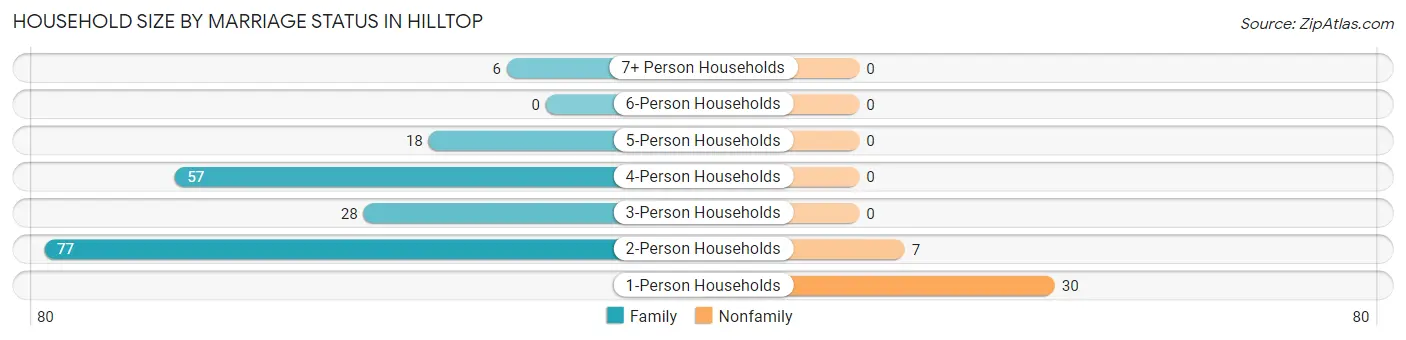
| Household Size | Family Households | Nonfamily Households |
| 1-Person Households | - | 30 (13.5%) |
| 2-Person Households | 77 (34.5%) | 7 (3.1%) |
| 3-Person Households | 28 (12.6%) | 0 (0.0%) |
| 4-Person Households | 57 (25.6%) | 0 (0.0%) |
| 5-Person Households | 18 (8.1%) | 0 (0.0%) |
| 6-Person Households | 0 (0.0%) | 0 (0.0%) |
| 7+ Person Households | 6 (2.7%) | 0 (0.0%) |
| Total | 186 (83.4%) | 37 (16.6%) |
Female Fertility in Hilltop
Fertility by Age in Hilltop
| Age Bracket | Women with Births | Births / 1,000 Women |
| 15 to 19 years | 0 (0.0%) | 0.0 |
| 20 to 34 years | 0 (0.0%) | 0.0 |
| 35 to 50 years | 0 (0.0%) | 0.0 |
| Total | 0 (0.0%) | 0.0 |
Fertility by Age by Marriage Status in Hilltop
| Age Bracket | Married | Unmarried |
| 15 to 19 years | 0 (0.0%) | 0 (0.0%) |
| 20 to 34 years | 0 (0.0%) | 0 (0.0%) |
| 35 to 50 years | 0 (0.0%) | 0 (0.0%) |
| Total | 0 (0.0%) | 0 (0.0%) |
Fertility by Education in Hilltop
| Educational Attainment | Women with Births | Births / 1,000 Women |
| Less than High School | 0 (0.0%) | 0.0 |
| High School Diploma | 0 (0.0%) | 0.0 |
| College or Associate's Degree | 0 (0.0%) | 0.0 |
| Bachelor's Degree | 0 (0.0%) | 0.0 |
| Graduate Degree | 0 (0.0%) | 0.0 |
| Total | 0 (0.0%) | 0.0 |
Fertility by Education by Marriage Status in Hilltop
| Educational Attainment | Married | Unmarried |
| Less than High School | 0 (0.0%) | 0 (0.0%) |
| High School Diploma | 0 (0.0%) | 0 (0.0%) |
| College or Associate's Degree | 0 (0.0%) | 0 (0.0%) |
| Bachelor's Degree | 0 (0.0%) | 0 (0.0%) |
| Graduate Degree | 0 (0.0%) | 0 (0.0%) |
| Total | 0 (0.0%) | 0 (0.0%) |
Employment Characteristics in Hilltop
Employment by Class of Employer in Hilltop
Among the 310 employed individuals in Hilltop, private company employees (256 | 82.6%), state government employees (17 | 5.5%), and federal government employees (14 | 4.5%) make up the most common classes of employment.
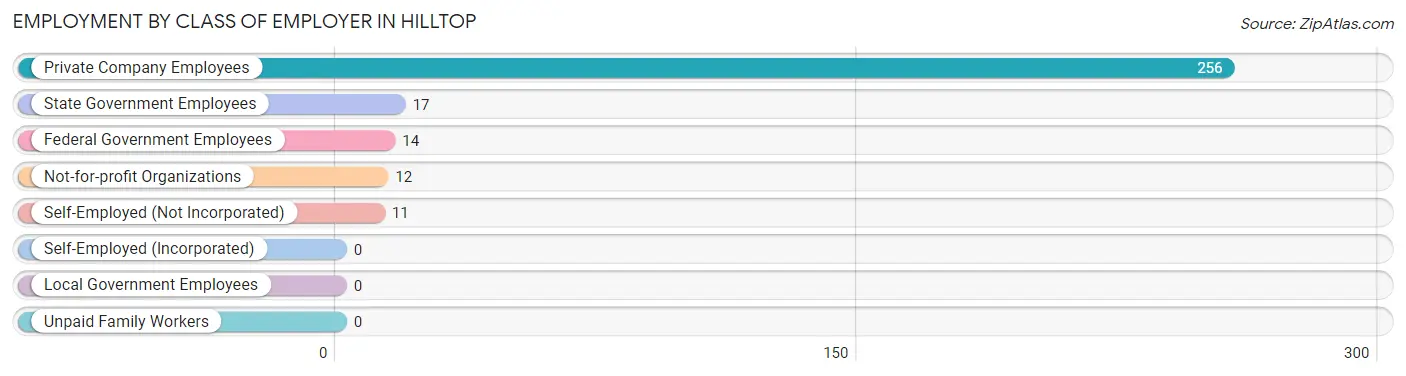
| Employer Class | # Employees | % Employees |
| Private Company Employees | 256 | 82.6% |
| Self-Employed (Incorporated) | 0 | 0.0% |
| Self-Employed (Not Incorporated) | 11 | 3.5% |
| Not-for-profit Organizations | 12 | 3.9% |
| Local Government Employees | 0 | 0.0% |
| State Government Employees | 17 | 5.5% |
| Federal Government Employees | 14 | 4.5% |
| Unpaid Family Workers | 0 | 0.0% |
| Total | 310 | 100.0% |
Employment Status by Age in Hilltop
According to the labor force statistics for Hilltop, out of the total population over 16 years of age (587), 59.8% or 351 individuals are in the labor force, with 4.8% or 17 of them unemployed. The age group with the highest labor force participation rate is 25 to 29 years, with 100.0% or 20 individuals in the labor force. Within the labor force, the 16 to 19 years age range has the highest percentage of unemployed individuals, with 73.9% or 17 of them being unemployed.
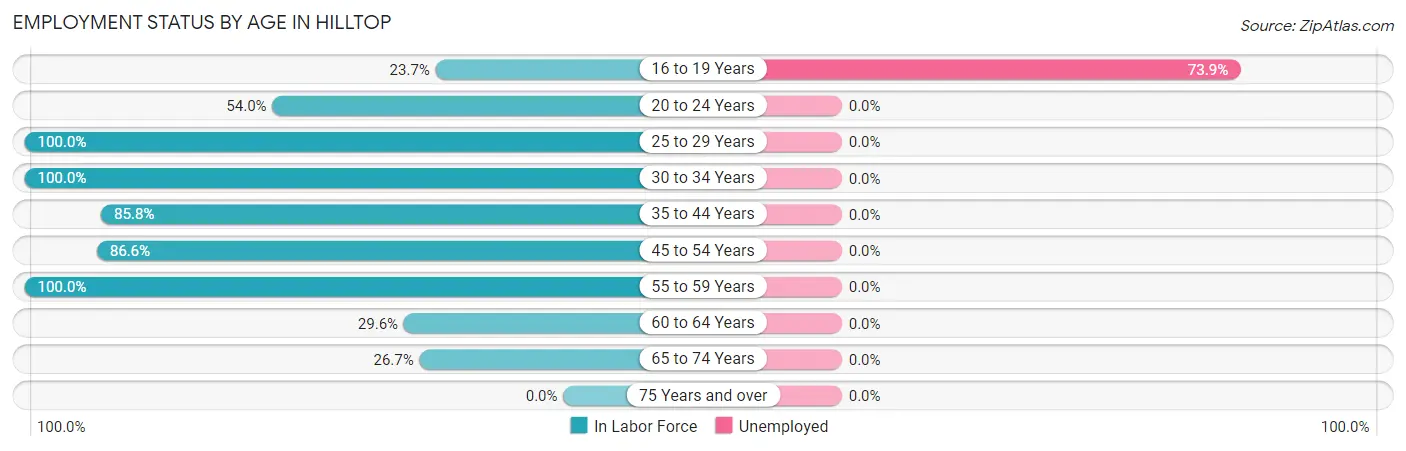
| Age Bracket | In Labor Force | Unemployed |
| 16 to 19 Years | 23 (23.7%) | 17 (73.9%) |
| 20 to 24 Years | 27 (54.0%) | 0 (0.0%) |
| 25 to 29 Years | 20 (100.0%) | 0 (0.0%) |
| 30 to 34 Years | 24 (100.0%) | 0 (0.0%) |
| 35 to 44 Years | 97 (85.8%) | 0 (0.0%) |
| 45 to 54 Years | 71 (86.6%) | 0 (0.0%) |
| 55 to 59 Years | 50 (100.0%) | 0 (0.0%) |
| 60 to 64 Years | 16 (29.6%) | 0 (0.0%) |
| 65 to 74 Years | 23 (26.7%) | 0 (0.0%) |
| 75 Years and over | 0 (0.0%) | 0 (0.0%) |
| Total | 351 (59.8%) | 17 (4.8%) |
Employment Status by Educational Attainment in Hilltop

| Educational Attainment | In Labor Force | Unemployed |
| Less than High School | 11 (68.8%) | 0 (0.0%) |
| High School Diploma | 140 (70.0%) | 0 (0.0%) |
| College / Associate Degree | 110 (100.0%) | 0 (0.0%) |
| Bachelor's Degree or higher | 17 (100.0%) | 0 (0.0%) |
| Total | 278 (81.0%) | 0 (0.0%) |
Employment Occupations by Sex in Hilltop
Management, Business, Science and Arts Occupations
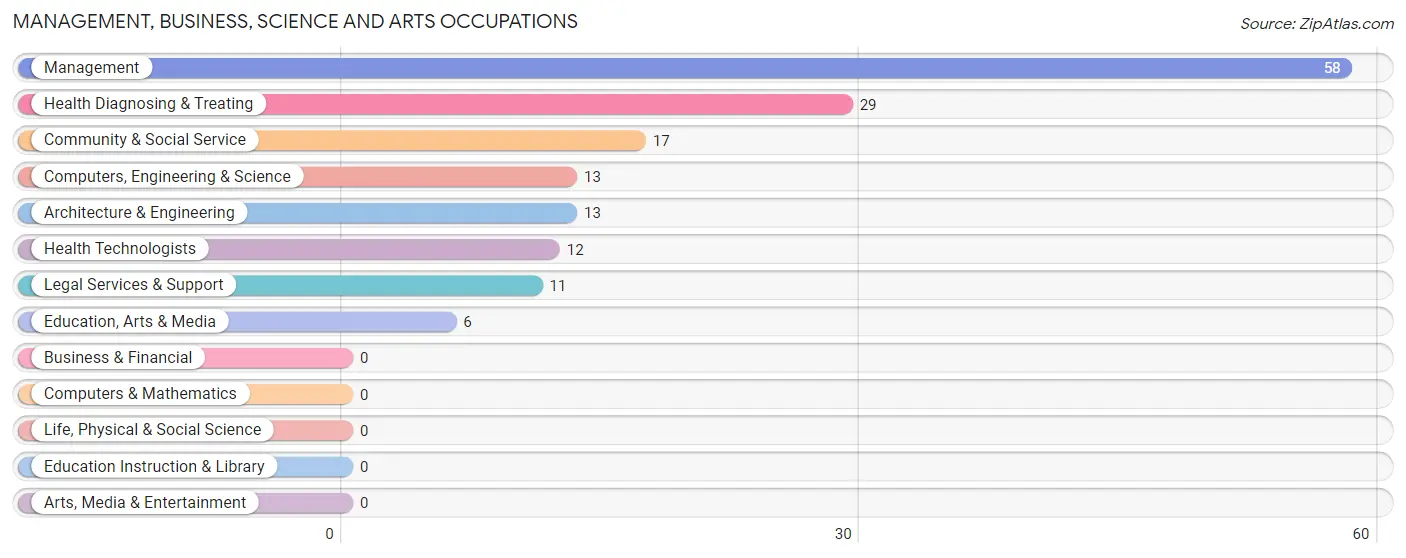
The most common Management, Business, Science and Arts occupations in Hilltop are Management (58 | 17.4%), Health Diagnosing & Treating (29 | 8.7%), Community & Social Service (17 | 5.1%), Computers, Engineering & Science (13 | 3.9%), and Architecture & Engineering (13 | 3.9%).
Management, Business, Science and Arts Occupations by Sex
Within the Management, Business, Science and Arts occupations in Hilltop, the most male-oriented occupations are Computers, Engineering & Science (100.0%), Architecture & Engineering (100.0%), and Legal Services & Support (100.0%), while the most female-oriented occupations are Education, Arts & Media (100.0%), Health Technologists (100.0%), and Management (60.3%).
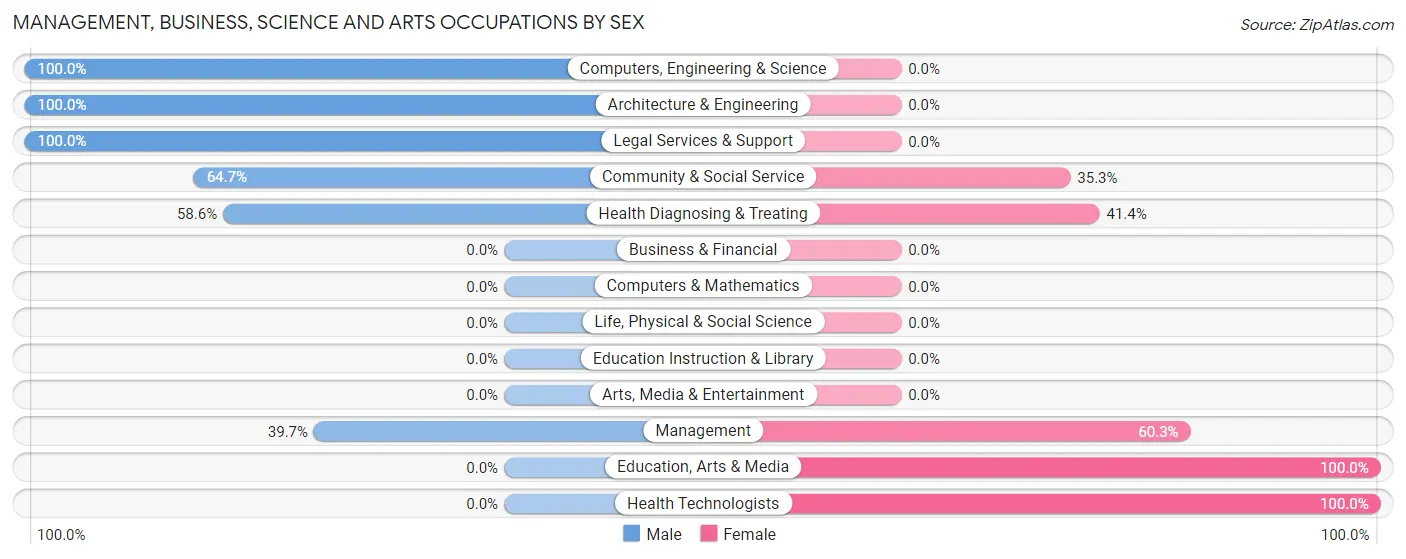
| Occupation | Male | Female |
| Management | 23 (39.7%) | 35 (60.3%) |
| Business & Financial | 0 (0.0%) | 0 (0.0%) |
| Computers, Engineering & Science | 13 (100.0%) | 0 (0.0%) |
| Computers & Mathematics | 0 (0.0%) | 0 (0.0%) |
| Architecture & Engineering | 13 (100.0%) | 0 (0.0%) |
| Life, Physical & Social Science | 0 (0.0%) | 0 (0.0%) |
| Community & Social Service | 11 (64.7%) | 6 (35.3%) |
| Education, Arts & Media | 0 (0.0%) | 6 (100.0%) |
| Legal Services & Support | 11 (100.0%) | 0 (0.0%) |
| Education Instruction & Library | 0 (0.0%) | 0 (0.0%) |
| Arts, Media & Entertainment | 0 (0.0%) | 0 (0.0%) |
| Health Diagnosing & Treating | 17 (58.6%) | 12 (41.4%) |
| Health Technologists | 0 (0.0%) | 12 (100.0%) |
| Total (Category) | 64 (54.7%) | 53 (45.3%) |
| Total (Overall) | 180 (53.9%) | 154 (46.1%) |
Services Occupations
The most common Services occupations in Hilltop are Healthcare Support (12 | 3.6%), and Food Preparation & Serving (6 | 1.8%).
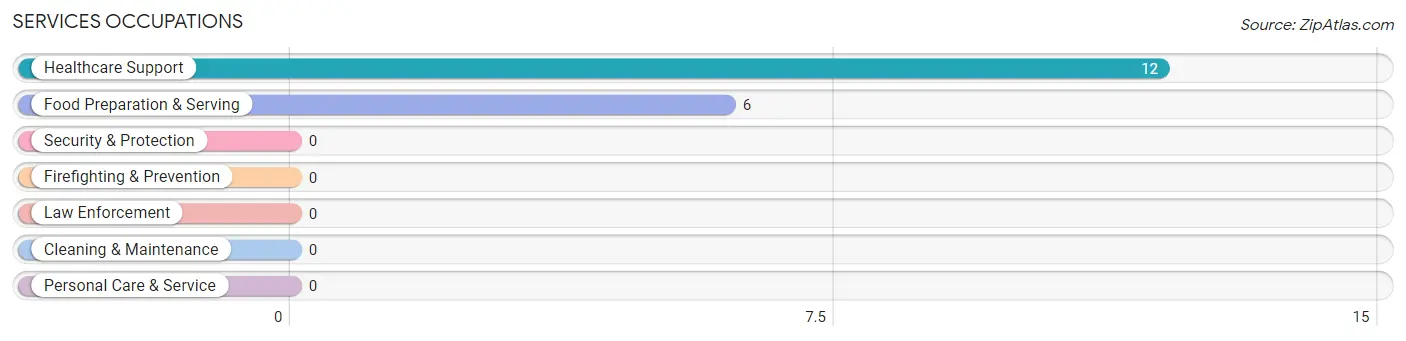
Services Occupations by Sex
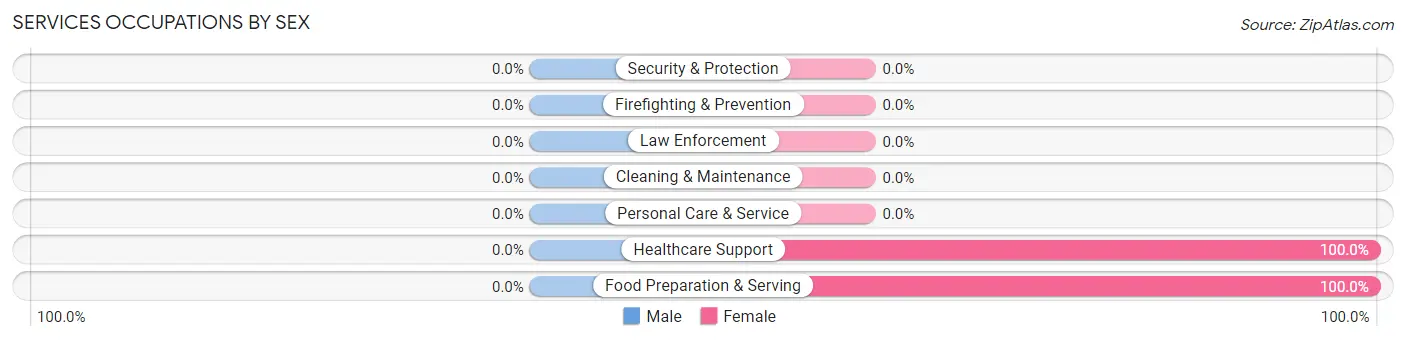
| Occupation | Male | Female |
| Healthcare Support | 0 (0.0%) | 12 (100.0%) |
| Security & Protection | 0 (0.0%) | 0 (0.0%) |
| Firefighting & Prevention | 0 (0.0%) | 0 (0.0%) |
| Law Enforcement | 0 (0.0%) | 0 (0.0%) |
| Food Preparation & Serving | 0 (0.0%) | 6 (100.0%) |
| Cleaning & Maintenance | 0 (0.0%) | 0 (0.0%) |
| Personal Care & Service | 0 (0.0%) | 0 (0.0%) |
| Total (Category) | 0 (0.0%) | 18 (100.0%) |
| Total (Overall) | 180 (53.9%) | 154 (46.1%) |
Sales and Office Occupations
The most common Sales and Office occupations in Hilltop are Office & Administration (46 | 13.8%), and Sales & Related (5 | 1.5%).
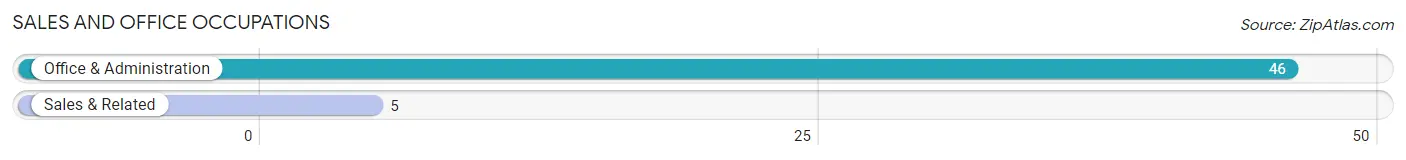
Sales and Office Occupations by Sex
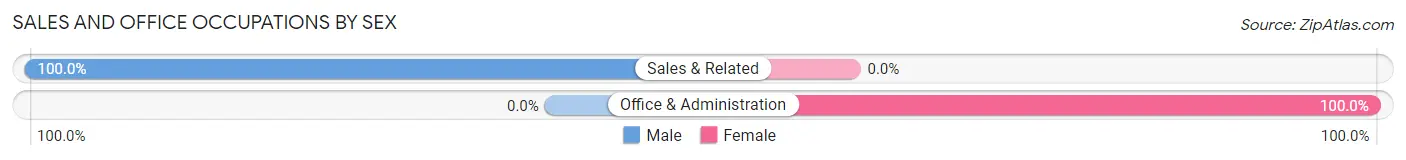
| Occupation | Male | Female |
| Sales & Related | 5 (100.0%) | 0 (0.0%) |
| Office & Administration | 0 (0.0%) | 46 (100.0%) |
| Total (Category) | 5 (9.8%) | 46 (90.2%) |
| Total (Overall) | 180 (53.9%) | 154 (46.1%) |
Natural Resources, Construction and Maintenance Occupations
The most common Natural Resources, Construction and Maintenance occupations in Hilltop are Installation, Maintenance & Repair (24 | 7.2%), and Construction & Extraction (5 | 1.5%).
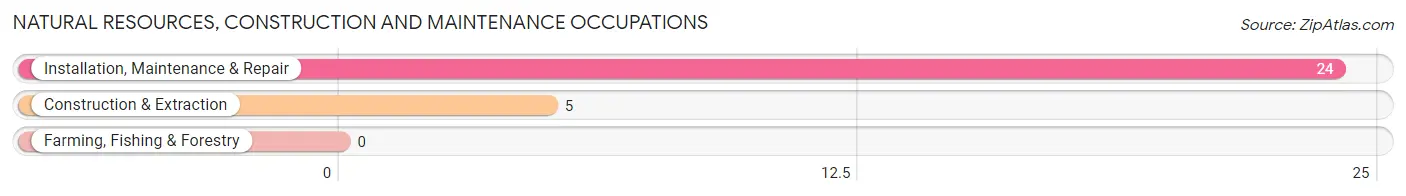
Natural Resources, Construction and Maintenance Occupations by Sex
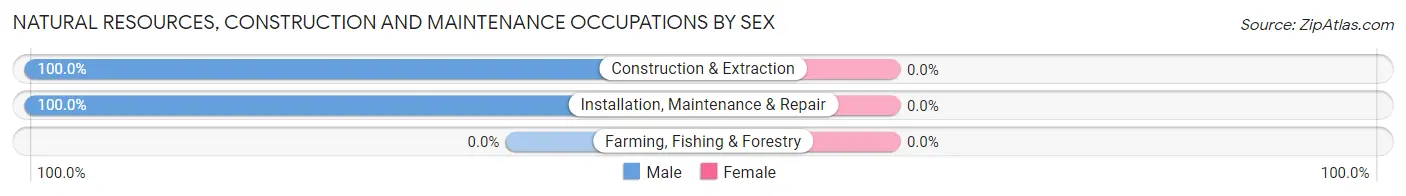
| Occupation | Male | Female |
| Farming, Fishing & Forestry | 0 (0.0%) | 0 (0.0%) |
| Construction & Extraction | 5 (100.0%) | 0 (0.0%) |
| Installation, Maintenance & Repair | 24 (100.0%) | 0 (0.0%) |
| Total (Category) | 29 (100.0%) | 0 (0.0%) |
| Total (Overall) | 180 (53.9%) | 154 (46.1%) |
Production, Transportation and Moving Occupations
The most common Production, Transportation and Moving occupations in Hilltop are Production (91 | 27.3%), Material Moving (22 | 6.6%), and Transportation (6 | 1.8%).
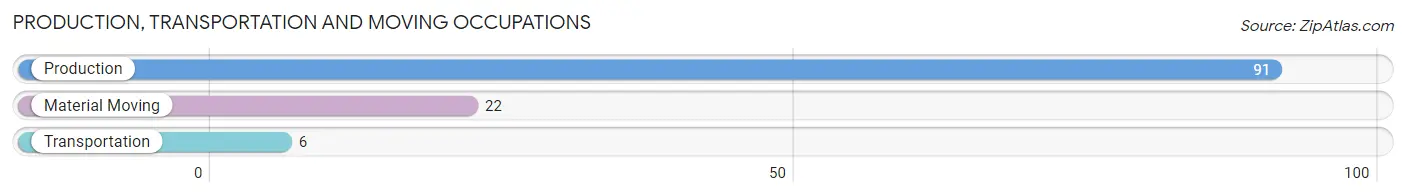
Production, Transportation and Moving Occupations by Sex
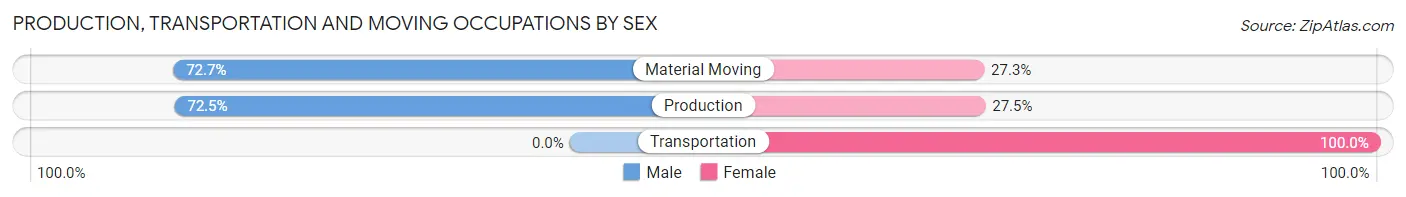
| Occupation | Male | Female |
| Production | 66 (72.5%) | 25 (27.5%) |
| Transportation | 0 (0.0%) | 6 (100.0%) |
| Material Moving | 16 (72.7%) | 6 (27.3%) |
| Total (Category) | 82 (68.9%) | 37 (31.1%) |
| Total (Overall) | 180 (53.9%) | 154 (46.1%) |
Employment Industries by Sex in Hilltop
Employment Industries in Hilltop
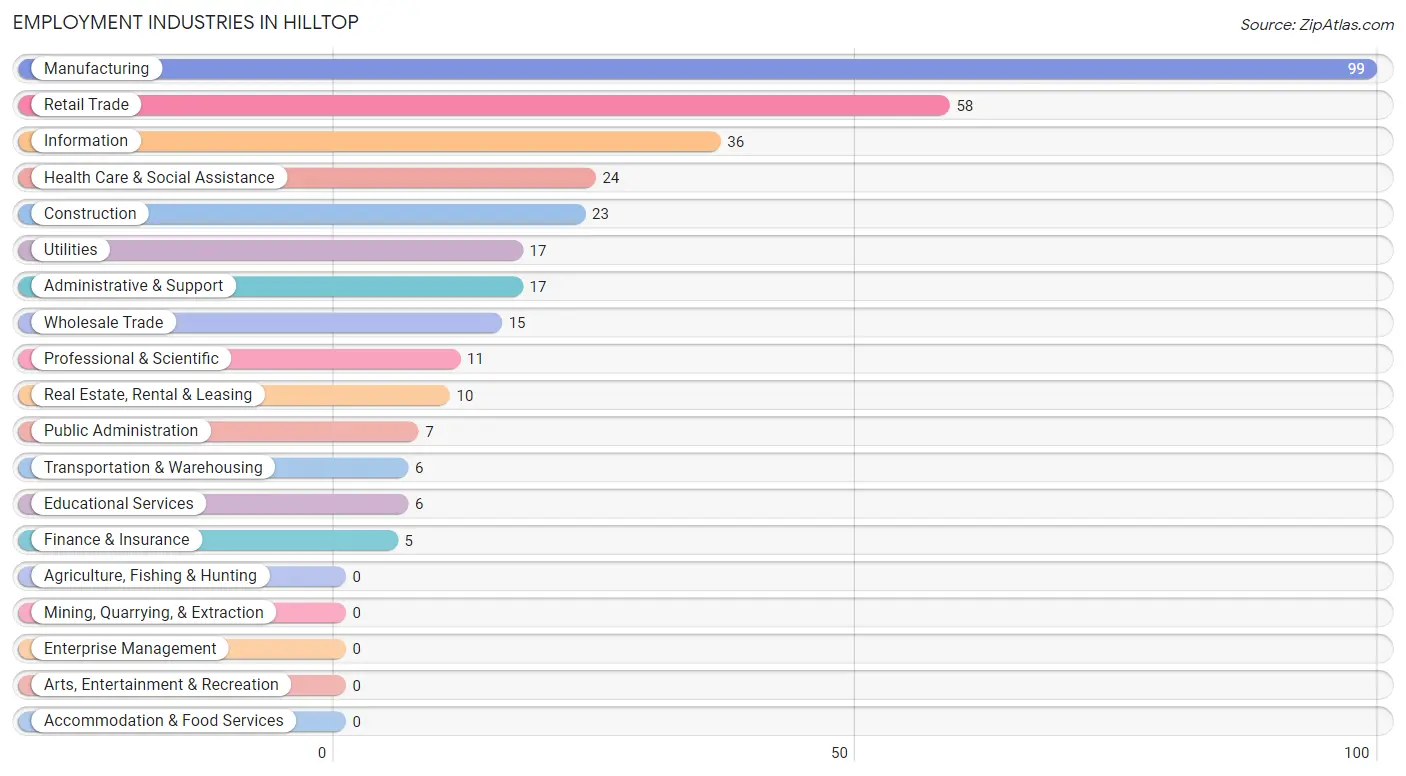
The major employment industries in Hilltop include Manufacturing (99 | 29.6%), Retail Trade (58 | 17.4%), Information (36 | 10.8%), Health Care & Social Assistance (24 | 7.2%), and Construction (23 | 6.9%).
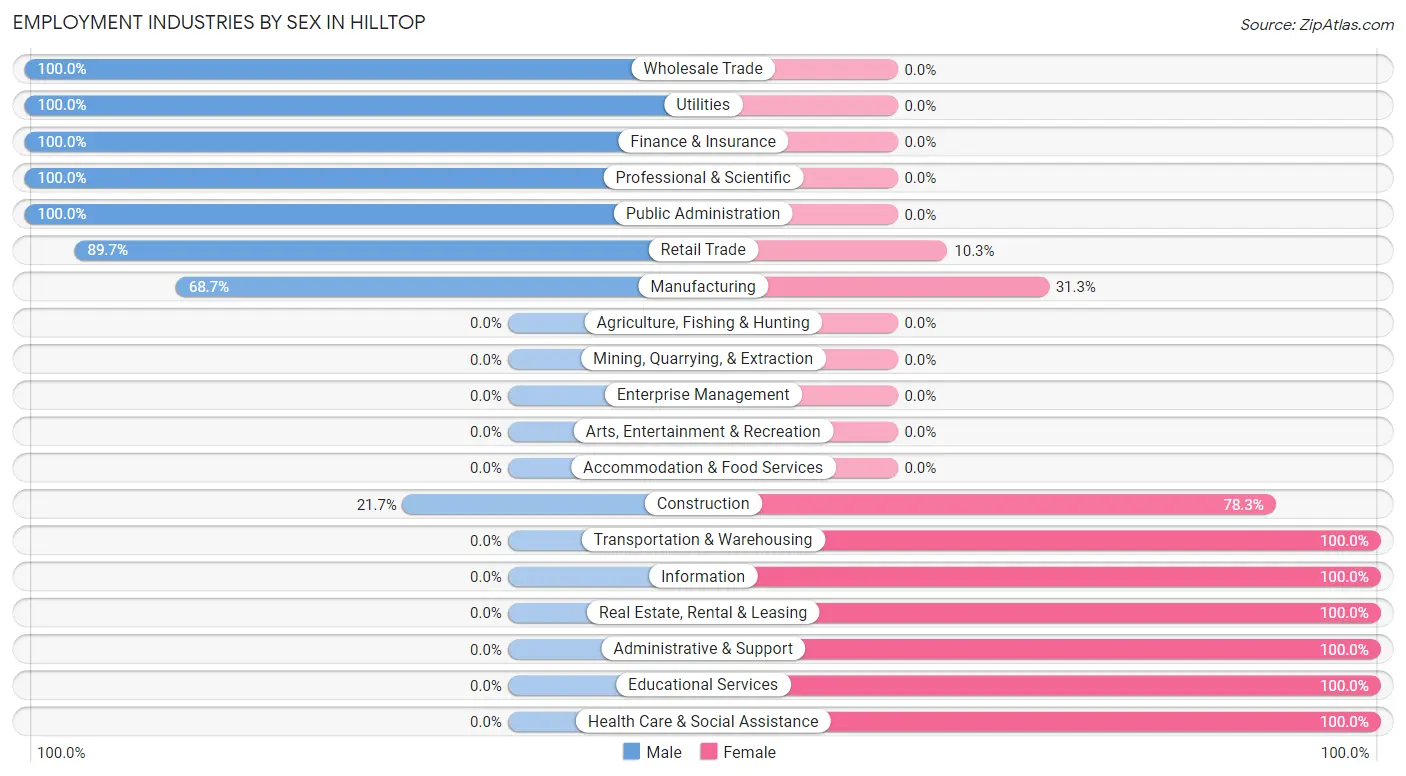
Employment Industries by Sex in Hilltop
The Hilltop industries that see more men than women are Wholesale Trade (100.0%), Utilities (100.0%), and Finance & Insurance (100.0%), whereas the industries that tend to have a higher number of women are Transportation & Warehousing (100.0%), Information (100.0%), and Real Estate, Rental & Leasing (100.0%).
| Industry | Male | Female |
| Agriculture, Fishing & Hunting | 0 (0.0%) | 0 (0.0%) |
| Mining, Quarrying, & Extraction | 0 (0.0%) | 0 (0.0%) |
| Construction | 5 (21.7%) | 18 (78.3%) |
| Manufacturing | 68 (68.7%) | 31 (31.3%) |
| Wholesale Trade | 15 (100.0%) | 0 (0.0%) |
| Retail Trade | 52 (89.7%) | 6 (10.3%) |
| Transportation & Warehousing | 0 (0.0%) | 6 (100.0%) |
| Utilities | 17 (100.0%) | 0 (0.0%) |
| Information | 0 (0.0%) | 36 (100.0%) |
| Finance & Insurance | 5 (100.0%) | 0 (0.0%) |
| Real Estate, Rental & Leasing | 0 (0.0%) | 10 (100.0%) |
| Professional & Scientific | 11 (100.0%) | 0 (0.0%) |
| Enterprise Management | 0 (0.0%) | 0 (0.0%) |
| Administrative & Support | 0 (0.0%) | 17 (100.0%) |
| Educational Services | 0 (0.0%) | 6 (100.0%) |
| Health Care & Social Assistance | 0 (0.0%) | 24 (100.0%) |
| Arts, Entertainment & Recreation | 0 (0.0%) | 0 (0.0%) |
| Accommodation & Food Services | 0 (0.0%) | 0 (0.0%) |
| Public Administration | 7 (100.0%) | 0 (0.0%) |
| Total | 180 (53.9%) | 154 (46.1%) |
Education in Hilltop
School Enrollment in Hilltop
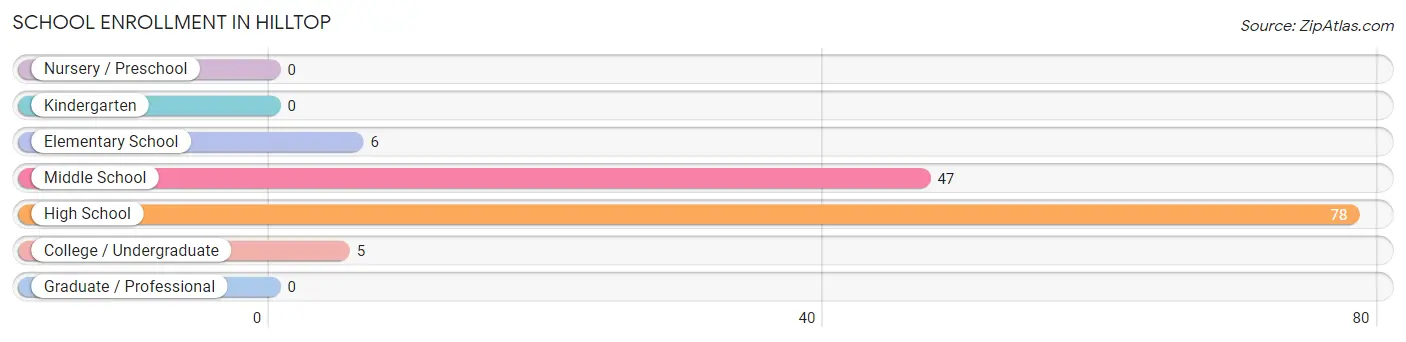
The most common levels of schooling among the 136 students in Hilltop are high school (78 | 57.4%), middle school (47 | 34.6%), and elementary school (6 | 4.4%).
| School Level | # Students | % Students |
| Nursery / Preschool | 0 | 0.0% |
| Kindergarten | 0 | 0.0% |
| Elementary School | 6 | 4.4% |
| Middle School | 47 | 34.6% |
| High School | 78 | 57.4% |
| College / Undergraduate | 5 | 3.7% |
| Graduate / Professional | 0 | 0.0% |
| Total | 136 | 100.0% |
School Enrollment by Age by Funding Source in Hilltop
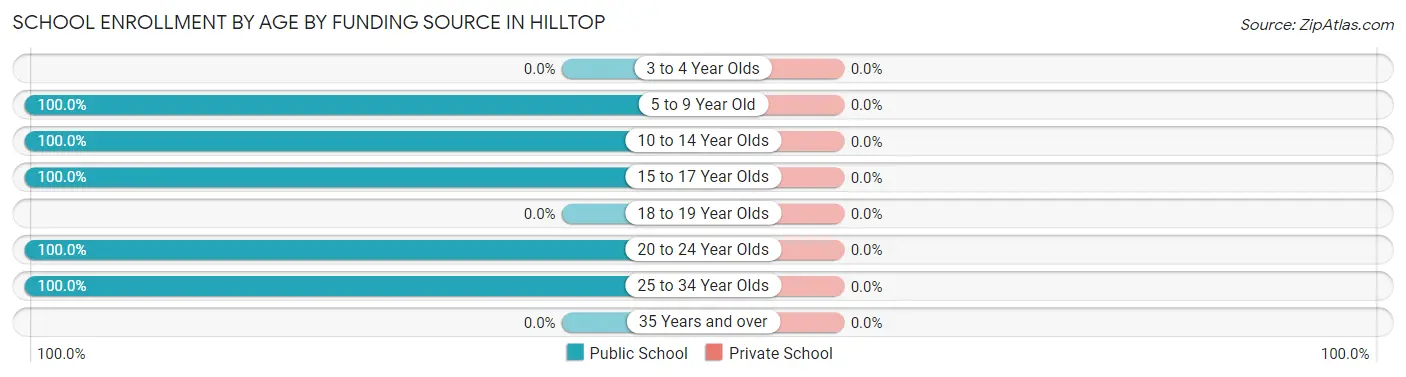
| Age Bracket | Public School | Private School |
| 3 to 4 Year Olds | 0 (0.0%) | 0 (0.0%) |
| 5 to 9 Year Old | 6 (100.0%) | 0 (0.0%) |
| 10 to 14 Year Olds | 21 (100.0%) | 0 (0.0%) |
| 15 to 17 Year Olds | 81 (100.0%) | 0 (0.0%) |
| 18 to 19 Year Olds | 0 (0.0%) | 0 (0.0%) |
| 20 to 24 Year Olds | 23 (100.0%) | 0 (0.0%) |
| 25 to 34 Year Olds | 5 (100.0%) | 0 (0.0%) |
| 35 Years and over | 0 (0.0%) | 0 (0.0%) |
| Total | 136 (100.0%) | 0 (0.0%) |
Educational Attainment by Field of Study in Hilltop
Physical & health sciences (11 | 39.3%), literature & languages (10 | 35.7%), and business (7 | 25.0%) are the most common fields of study among 28 individuals in Hilltop who have obtained a bachelor's degree or higher.
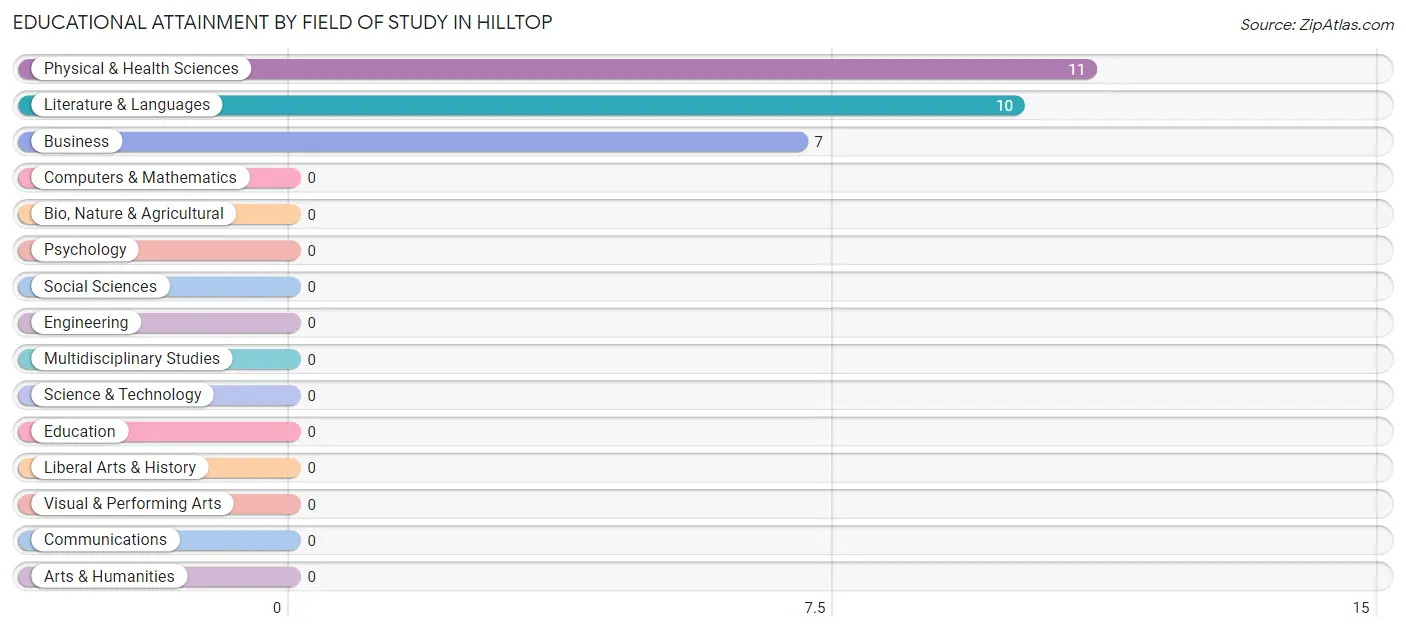
| Field of Study | # Graduates | % Graduates |
| Computers & Mathematics | 0 | 0.0% |
| Bio, Nature & Agricultural | 0 | 0.0% |
| Physical & Health Sciences | 11 | 39.3% |
| Psychology | 0 | 0.0% |
| Social Sciences | 0 | 0.0% |
| Engineering | 0 | 0.0% |
| Multidisciplinary Studies | 0 | 0.0% |
| Science & Technology | 0 | 0.0% |
| Business | 7 | 25.0% |
| Education | 0 | 0.0% |
| Literature & Languages | 10 | 35.7% |
| Liberal Arts & History | 0 | 0.0% |
| Visual & Performing Arts | 0 | 0.0% |
| Communications | 0 | 0.0% |
| Arts & Humanities | 0 | 0.0% |
| Total | 28 | 100.0% |
Transportation & Commute in Hilltop
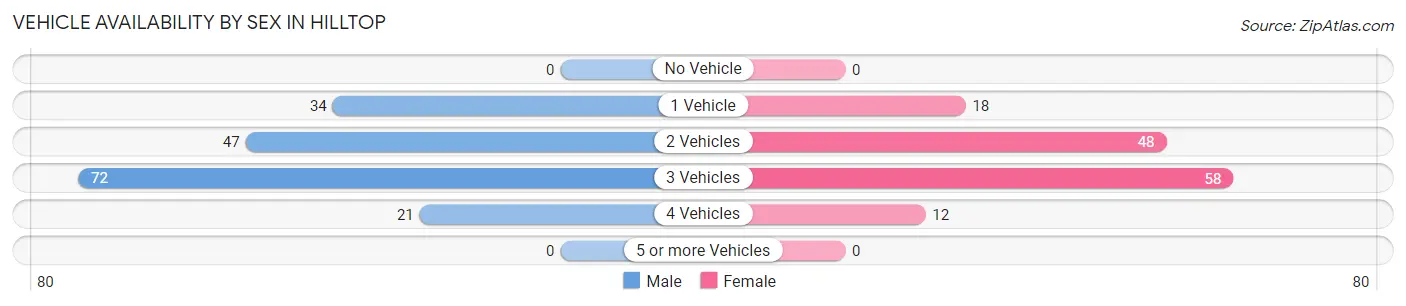
Vehicle Availability by Sex in Hilltop
The most prevalent vehicle ownership categories in Hilltop are males with 3 vehicles (72, accounting for 41.4%) and females with 3 vehicles (58, making up 52.9%).
| Vehicles Available | Male | Female |
| No Vehicle | 0 (0.0%) | 0 (0.0%) |
| 1 Vehicle | 34 (19.5%) | 18 (13.2%) |
| 2 Vehicles | 47 (27.0%) | 48 (35.3%) |
| 3 Vehicles | 72 (41.4%) | 58 (42.6%) |
| 4 Vehicles | 21 (12.1%) | 12 (8.8%) |
| 5 or more Vehicles | 0 (0.0%) | 0 (0.0%) |
| Total | 174 (100.0%) | 136 (100.0%) |
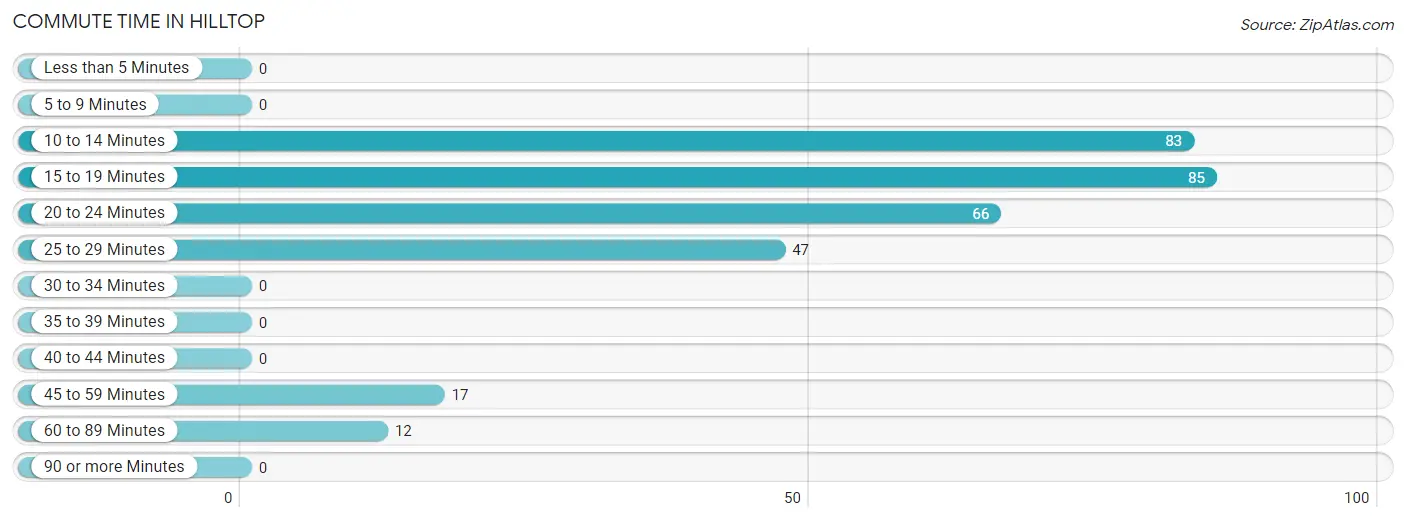
Commute Time in Hilltop
The most frequently occuring commute durations in Hilltop are 15 to 19 minutes (85 commuters, 27.4%), 10 to 14 minutes (83 commuters, 26.8%), and 20 to 24 minutes (66 commuters, 21.3%).
| Commute Time | # Commuters | % Commuters |
| Less than 5 Minutes | 0 | 0.0% |
| 5 to 9 Minutes | 0 | 0.0% |
| 10 to 14 Minutes | 83 | 26.8% |
| 15 to 19 Minutes | 85 | 27.4% |
| 20 to 24 Minutes | 66 | 21.3% |
| 25 to 29 Minutes | 47 | 15.2% |
| 30 to 34 Minutes | 0 | 0.0% |
| 35 to 39 Minutes | 0 | 0.0% |
| 40 to 44 Minutes | 0 | 0.0% |
| 45 to 59 Minutes | 17 | 5.5% |
| 60 to 89 Minutes | 12 | 3.9% |
| 90 or more Minutes | 0 | 0.0% |
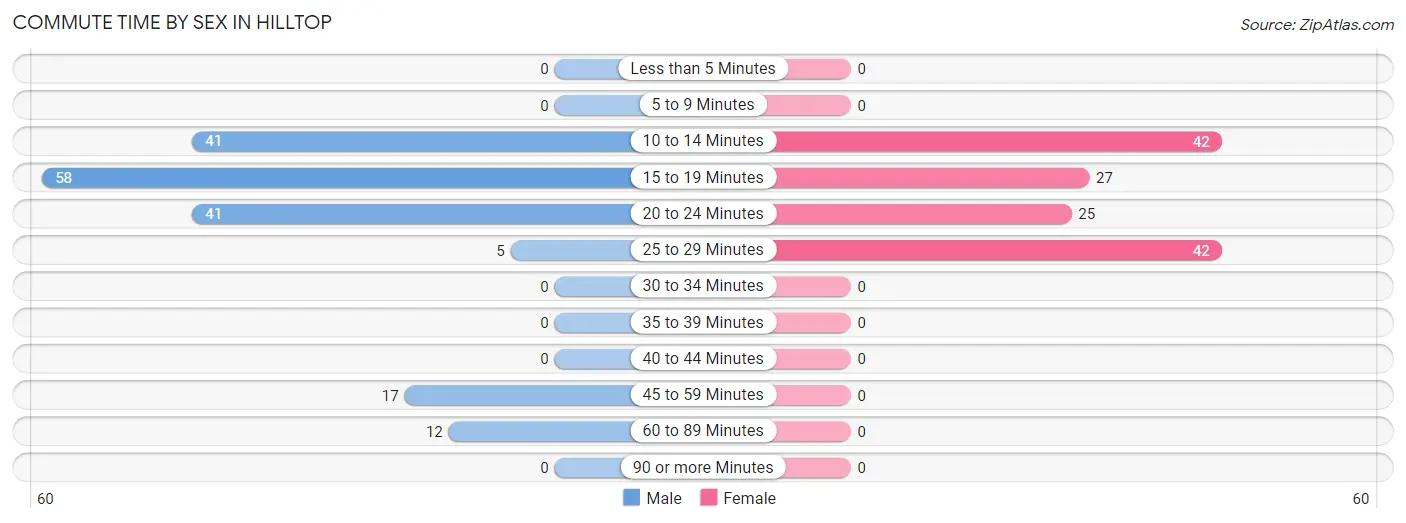
Commute Time by Sex in Hilltop
The most common commute times in Hilltop are 15 to 19 minutes (58 commuters, 33.3%) for males and 10 to 14 minutes (42 commuters, 30.9%) for females.
| Commute Time | Male | Female |
| Less than 5 Minutes | 0 (0.0%) | 0 (0.0%) |
| 5 to 9 Minutes | 0 (0.0%) | 0 (0.0%) |
| 10 to 14 Minutes | 41 (23.6%) | 42 (30.9%) |
| 15 to 19 Minutes | 58 (33.3%) | 27 (19.9%) |
| 20 to 24 Minutes | 41 (23.6%) | 25 (18.4%) |
| 25 to 29 Minutes | 5 (2.9%) | 42 (30.9%) |
| 30 to 34 Minutes | 0 (0.0%) | 0 (0.0%) |
| 35 to 39 Minutes | 0 (0.0%) | 0 (0.0%) |
| 40 to 44 Minutes | 0 (0.0%) | 0 (0.0%) |
| 45 to 59 Minutes | 17 (9.8%) | 0 (0.0%) |
| 60 to 89 Minutes | 12 (6.9%) | 0 (0.0%) |
| 90 or more Minutes | 0 (0.0%) | 0 (0.0%) |
Time of Departure to Work by Sex in Hilltop
The most frequent times of departure to work in Hilltop are 6:30 AM to 6:59 AM (45, 25.9%) for males and 7:00 AM to 7:29 AM (53, 39.0%) for females.
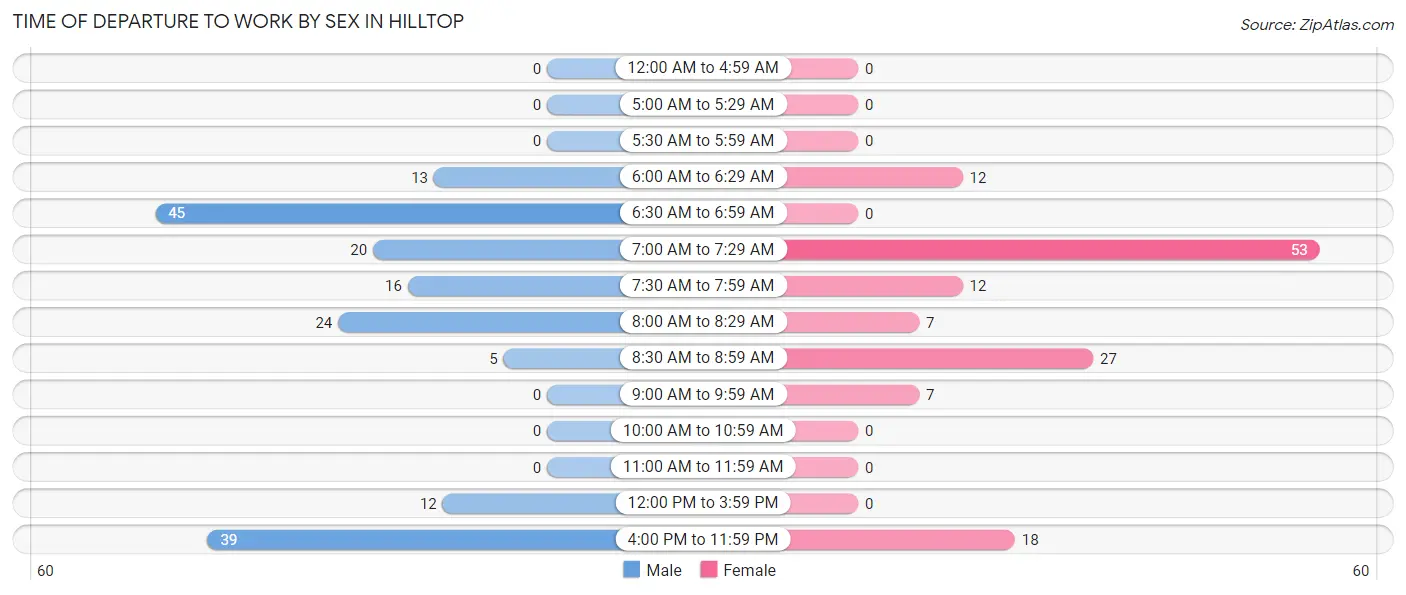
| Time of Departure | Male | Female |
| 12:00 AM to 4:59 AM | 0 (0.0%) | 0 (0.0%) |
| 5:00 AM to 5:29 AM | 0 (0.0%) | 0 (0.0%) |
| 5:30 AM to 5:59 AM | 0 (0.0%) | 0 (0.0%) |
| 6:00 AM to 6:29 AM | 13 (7.5%) | 12 (8.8%) |
| 6:30 AM to 6:59 AM | 45 (25.9%) | 0 (0.0%) |
| 7:00 AM to 7:29 AM | 20 (11.5%) | 53 (39.0%) |
| 7:30 AM to 7:59 AM | 16 (9.2%) | 12 (8.8%) |
| 8:00 AM to 8:29 AM | 24 (13.8%) | 7 (5.1%) |
| 8:30 AM to 8:59 AM | 5 (2.9%) | 27 (19.9%) |
| 9:00 AM to 9:59 AM | 0 (0.0%) | 7 (5.1%) |
| 10:00 AM to 10:59 AM | 0 (0.0%) | 0 (0.0%) |
| 11:00 AM to 11:59 AM | 0 (0.0%) | 0 (0.0%) |
| 12:00 PM to 3:59 PM | 12 (6.9%) | 0 (0.0%) |
| 4:00 PM to 11:59 PM | 39 (22.4%) | 18 (13.2%) |
| Total | 174 (100.0%) | 136 (100.0%) |
Housing Occupancy in Hilltop
Occupancy by Ownership in Hilltop
Of the total 223 dwellings in Hilltop, owner-occupied units account for 202 (90.6%), while renter-occupied units make up 21 (9.4%).
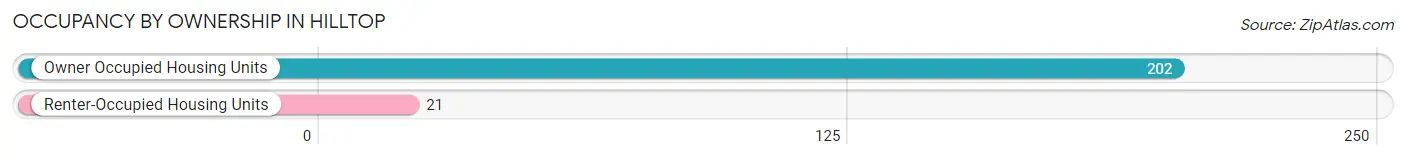
| Occupancy | # Housing Units | % Housing Units |
| Owner Occupied Housing Units | 202 | 90.6% |
| Renter-Occupied Housing Units | 21 | 9.4% |
| Total Occupied Housing Units | 223 | 100.0% |
Occupancy by Household Size in Hilltop
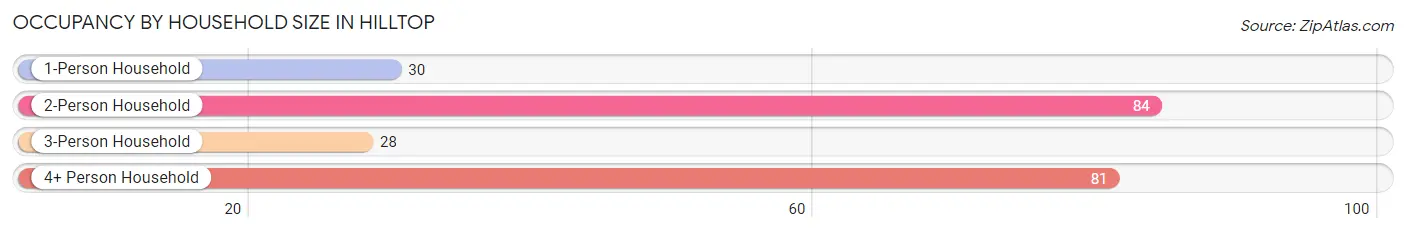
| Household Size | # Housing Units | % Housing Units |
| 1-Person Household | 30 | 13.5% |
| 2-Person Household | 84 | 37.7% |
| 3-Person Household | 28 | 12.6% |
| 4+ Person Household | 81 | 36.3% |
| Total Housing Units | 223 | 100.0% |
Occupancy by Ownership by Household Size in Hilltop
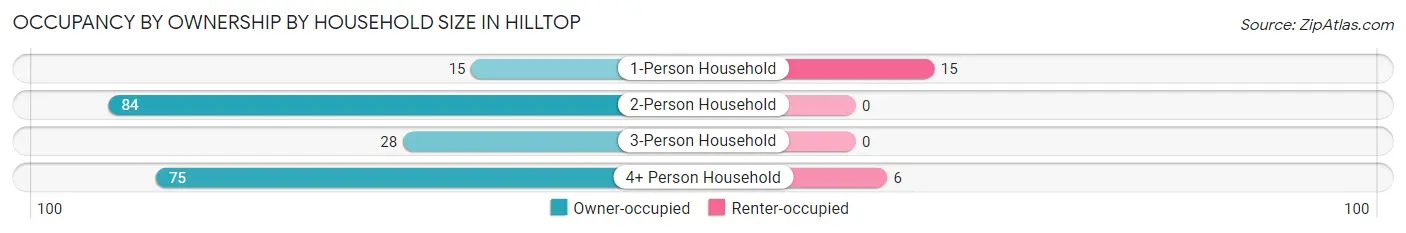
| Household Size | Owner-occupied | Renter-occupied |
| 1-Person Household | 15 (50.0%) | 15 (50.0%) |
| 2-Person Household | 84 (100.0%) | 0 (0.0%) |
| 3-Person Household | 28 (100.0%) | 0 (0.0%) |
| 4+ Person Household | 75 (92.6%) | 6 (7.4%) |
| Total Housing Units | 202 (90.6%) | 21 (9.4%) |
Occupancy by Educational Attainment in Hilltop
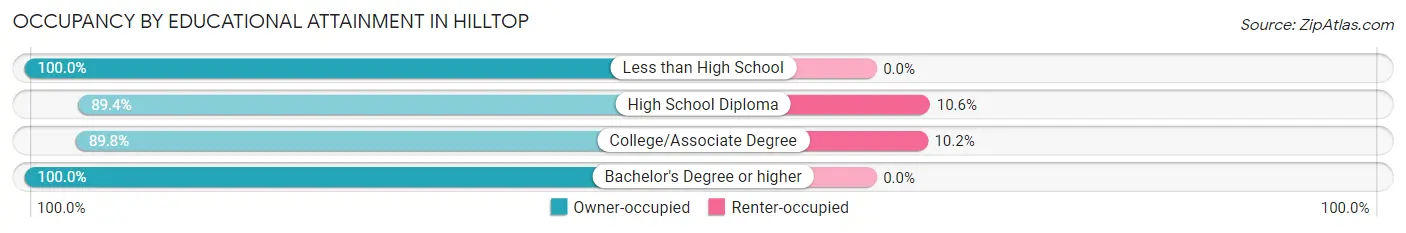
| Household Size | Owner-occupied | Renter-occupied |
| Less than High School | 6 (100.0%) | 0 (0.0%) |
| High School Diploma | 126 (89.4%) | 15 (10.6%) |
| College/Associate Degree | 53 (89.8%) | 6 (10.2%) |
| Bachelor's Degree or higher | 17 (100.0%) | 0 (0.0%) |
Occupancy by Age of Householder in Hilltop
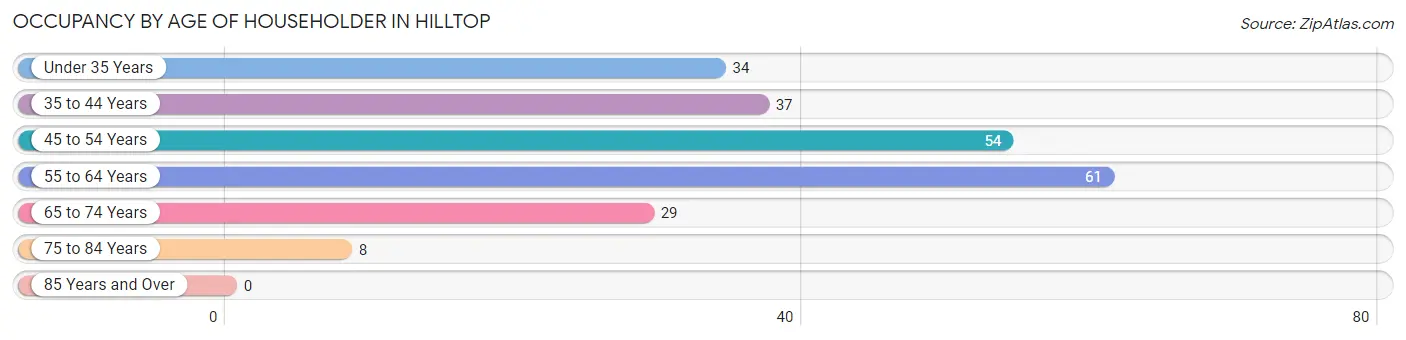
| Age Bracket | # Households | % Households |
| Under 35 Years | 34 | 15.2% |
| 35 to 44 Years | 37 | 16.6% |
| 45 to 54 Years | 54 | 24.2% |
| 55 to 64 Years | 61 | 27.4% |
| 65 to 74 Years | 29 | 13.0% |
| 75 to 84 Years | 8 | 3.6% |
| 85 Years and Over | 0 | 0.0% |
| Total | 223 | 100.0% |
Housing Finances in Hilltop
Median Income by Occupancy in Hilltop
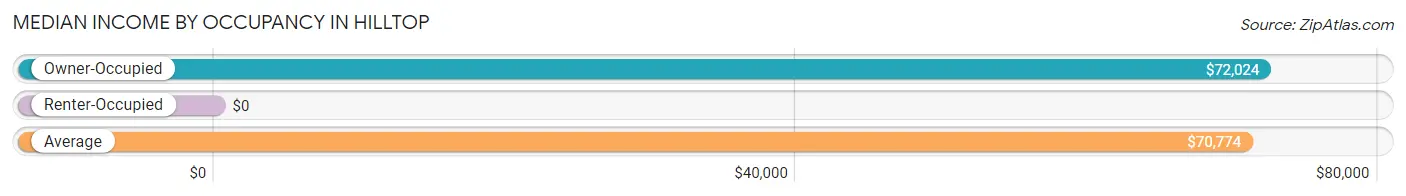
| Occupancy Type | # Households | Median Income |
| Owner-Occupied | 202 (90.6%) | $72,024 |
| Renter-Occupied | 21 (9.4%) | $0 |
| Average | 223 (100.0%) | $70,774 |
Occupancy by Householder Income Bracket in Hilltop
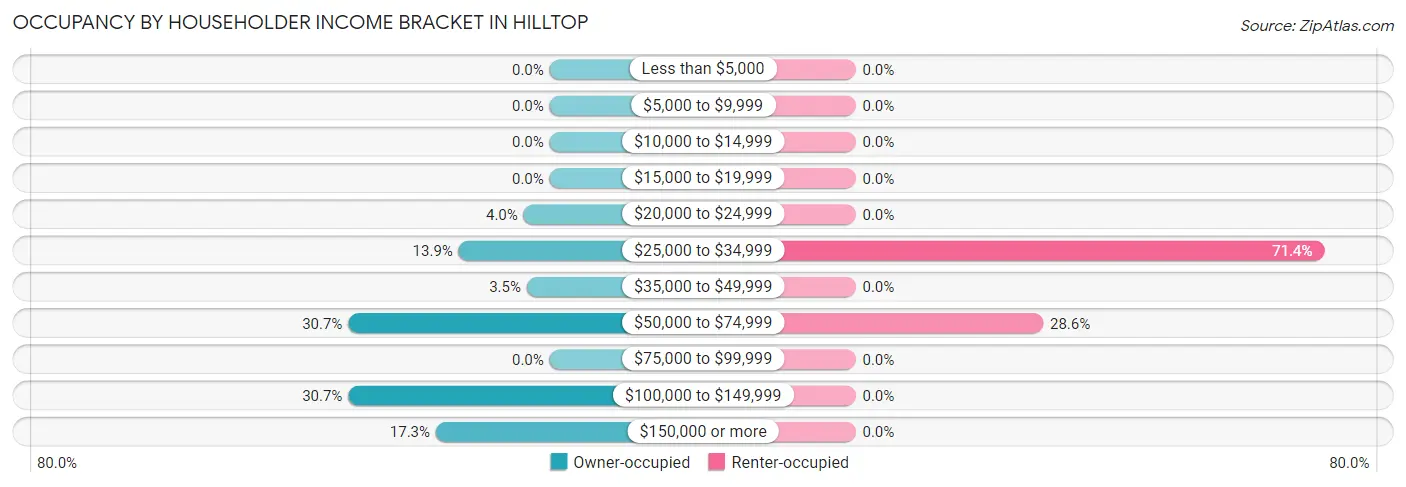
| Income Bracket | Owner-occupied | Renter-occupied |
| Less than $5,000 | 0 (0.0%) | 0 (0.0%) |
| $5,000 to $9,999 | 0 (0.0%) | 0 (0.0%) |
| $10,000 to $14,999 | 0 (0.0%) | 0 (0.0%) |
| $15,000 to $19,999 | 0 (0.0%) | 0 (0.0%) |
| $20,000 to $24,999 | 8 (4.0%) | 0 (0.0%) |
| $25,000 to $34,999 | 28 (13.9%) | 15 (71.4%) |
| $35,000 to $49,999 | 7 (3.5%) | 0 (0.0%) |
| $50,000 to $74,999 | 62 (30.7%) | 6 (28.6%) |
| $75,000 to $99,999 | 0 (0.0%) | 0 (0.0%) |
| $100,000 to $149,999 | 62 (30.7%) | 0 (0.0%) |
| $150,000 or more | 35 (17.3%) | 0 (0.0%) |
| Total | 202 (100.0%) | 21 (100.0%) |
Monthly Housing Cost Tiers in Hilltop
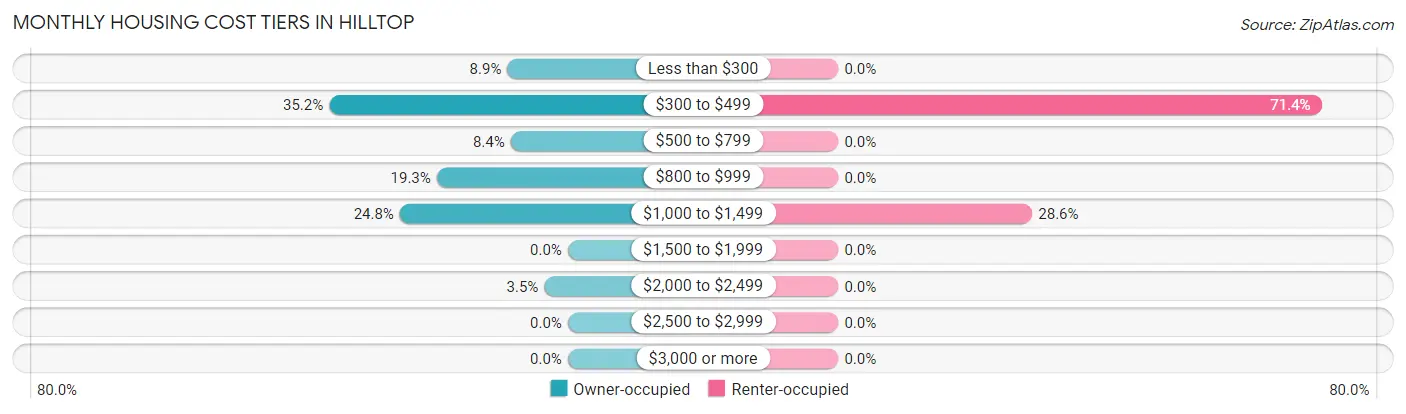
| Monthly Cost | Owner-occupied | Renter-occupied |
| Less than $300 | 18 (8.9%) | 0 (0.0%) |
| $300 to $499 | 71 (35.1%) | 15 (71.4%) |
| $500 to $799 | 17 (8.4%) | 0 (0.0%) |
| $800 to $999 | 39 (19.3%) | 0 (0.0%) |
| $1,000 to $1,499 | 50 (24.7%) | 6 (28.6%) |
| $1,500 to $1,999 | 0 (0.0%) | 0 (0.0%) |
| $2,000 to $2,499 | 7 (3.5%) | 0 (0.0%) |
| $2,500 to $2,999 | 0 (0.0%) | 0 (0.0%) |
| $3,000 or more | 0 (0.0%) | 0 (0.0%) |
| Total | 202 (100.0%) | 21 (100.0%) |
Physical Housing Characteristics in Hilltop
Housing Structures in Hilltop
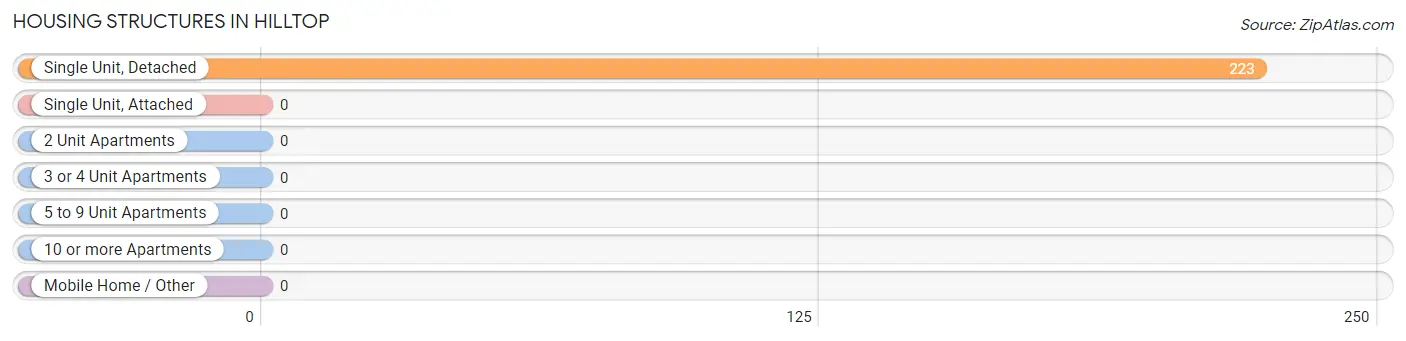
| Structure Type | # Housing Units | % Housing Units |
| Single Unit, Detached | 223 | 100.0% |
| Single Unit, Attached | 0 | 0.0% |
| 2 Unit Apartments | 0 | 0.0% |
| 3 or 4 Unit Apartments | 0 | 0.0% |
| 5 to 9 Unit Apartments | 0 | 0.0% |
| 10 or more Apartments | 0 | 0.0% |
| Mobile Home / Other | 0 | 0.0% |
| Total | 223 | 100.0% |
Housing Structures by Occupancy in Hilltop
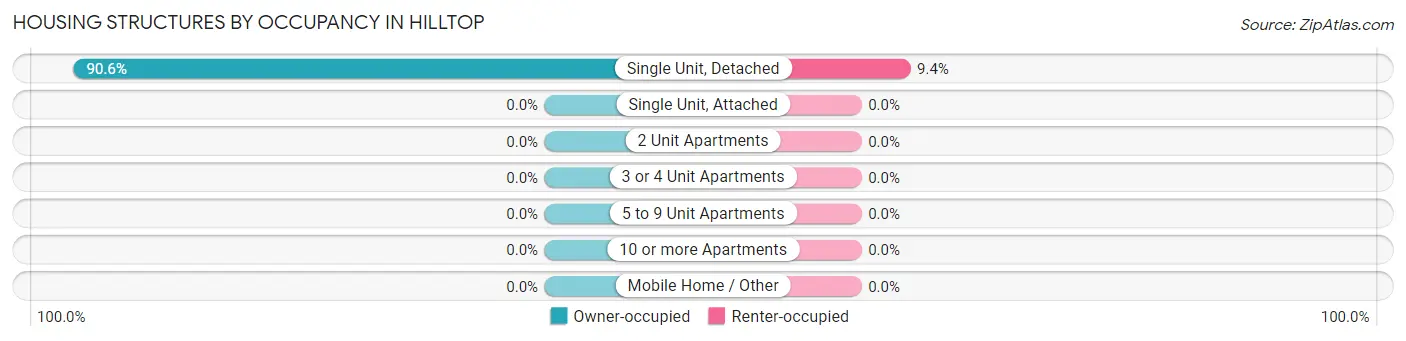
| Structure Type | Owner-occupied | Renter-occupied |
| Single Unit, Detached | 202 (90.6%) | 21 (9.4%) |
| Single Unit, Attached | 0 (0.0%) | 0 (0.0%) |
| 2 Unit Apartments | 0 (0.0%) | 0 (0.0%) |
| 3 or 4 Unit Apartments | 0 (0.0%) | 0 (0.0%) |
| 5 to 9 Unit Apartments | 0 (0.0%) | 0 (0.0%) |
| 10 or more Apartments | 0 (0.0%) | 0 (0.0%) |
| Mobile Home / Other | 0 (0.0%) | 0 (0.0%) |
| Total | 202 (90.6%) | 21 (9.4%) |
Housing Structures by Number of Rooms in Hilltop
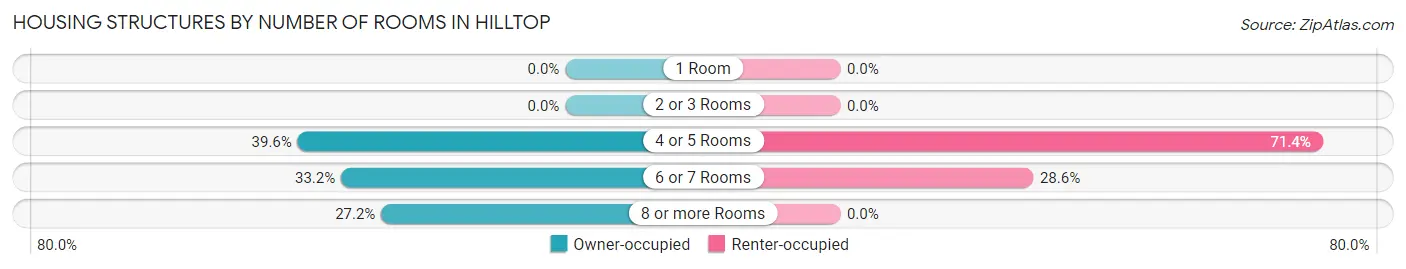
| Number of Rooms | Owner-occupied | Renter-occupied |
| 1 Room | 0 (0.0%) | 0 (0.0%) |
| 2 or 3 Rooms | 0 (0.0%) | 0 (0.0%) |
| 4 or 5 Rooms | 80 (39.6%) | 15 (71.4%) |
| 6 or 7 Rooms | 67 (33.2%) | 6 (28.6%) |
| 8 or more Rooms | 55 (27.2%) | 0 (0.0%) |
| Total | 202 (100.0%) | 21 (100.0%) |
Housing Structure by Heating Type in Hilltop
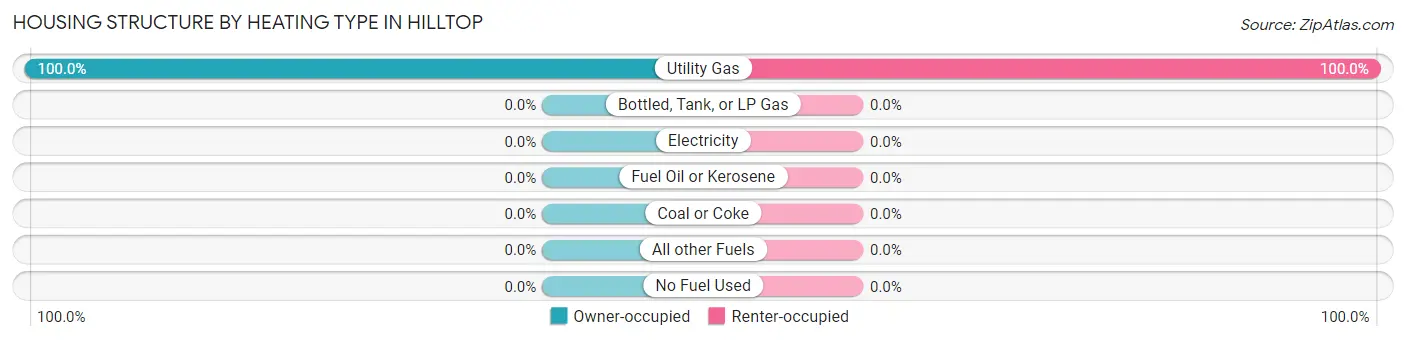
| Heating Type | Owner-occupied | Renter-occupied |
| Utility Gas | 202 (100.0%) | 21 (100.0%) |
| Bottled, Tank, or LP Gas | 0 (0.0%) | 0 (0.0%) |
| Electricity | 0 (0.0%) | 0 (0.0%) |
| Fuel Oil or Kerosene | 0 (0.0%) | 0 (0.0%) |
| Coal or Coke | 0 (0.0%) | 0 (0.0%) |
| All other Fuels | 0 (0.0%) | 0 (0.0%) |
| No Fuel Used | 0 (0.0%) | 0 (0.0%) |
| Total | 202 (100.0%) | 21 (100.0%) |
Household Vehicle Usage in Hilltop
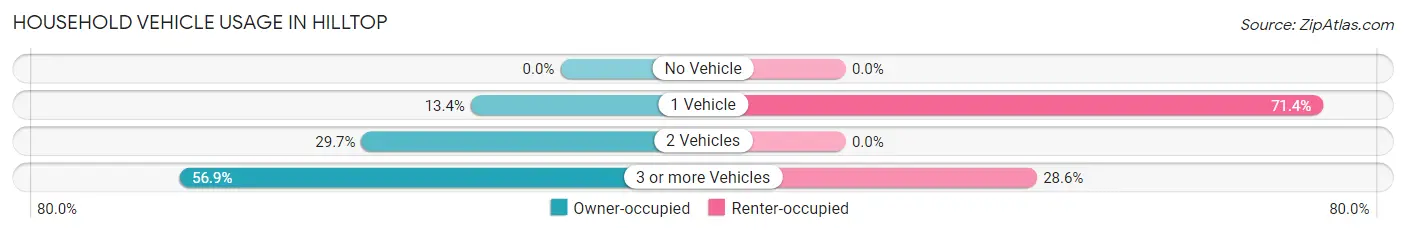
| Vehicles per Household | Owner-occupied | Renter-occupied |
| No Vehicle | 0 (0.0%) | 0 (0.0%) |
| 1 Vehicle | 27 (13.4%) | 15 (71.4%) |
| 2 Vehicles | 60 (29.7%) | 0 (0.0%) |
| 3 or more Vehicles | 115 (56.9%) | 6 (28.6%) |
| Total | 202 (100.0%) | 21 (100.0%) |
Real Estate & Mortgages in Hilltop
Real Estate and Mortgage Overview in Hilltop
| Characteristic | Without Mortgage | With Mortgage |
| Housing Units | 99 | 103 |
| Median Property Value | $61,900 | $173,800 |
| Median Household Income | $109,740 | $7 |
| Monthly Housing Costs | $341 | $0 |
| Real Estate Taxes | $704 | $0 |
Property Value by Mortgage Status in Hilltop
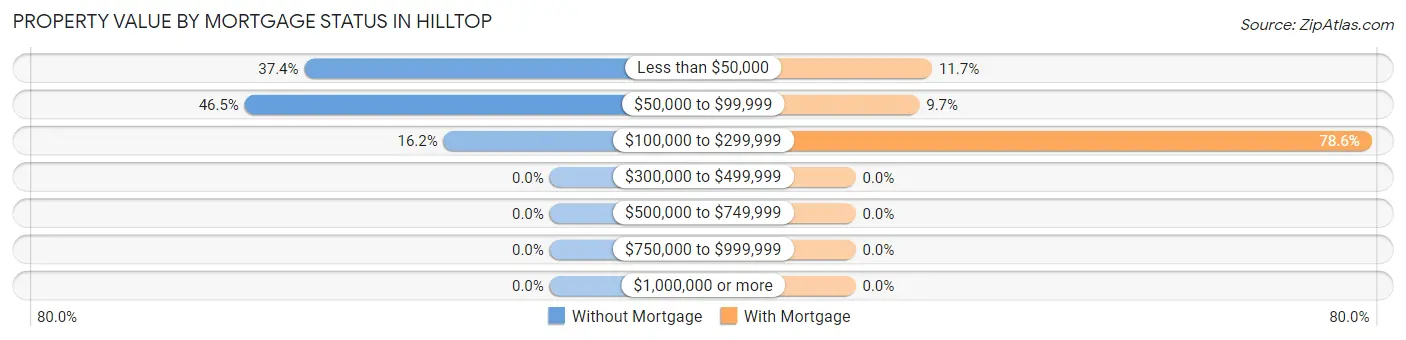
| Property Value | Without Mortgage | With Mortgage |
| Less than $50,000 | 37 (37.4%) | 12 (11.7%) |
| $50,000 to $99,999 | 46 (46.5%) | 10 (9.7%) |
| $100,000 to $299,999 | 16 (16.2%) | 81 (78.6%) |
| $300,000 to $499,999 | 0 (0.0%) | 0 (0.0%) |
| $500,000 to $749,999 | 0 (0.0%) | 0 (0.0%) |
| $750,000 to $999,999 | 0 (0.0%) | 0 (0.0%) |
| $1,000,000 or more | 0 (0.0%) | 0 (0.0%) |
| Total | 99 (100.0%) | 103 (100.0%) |
Household Income by Mortgage Status in Hilltop
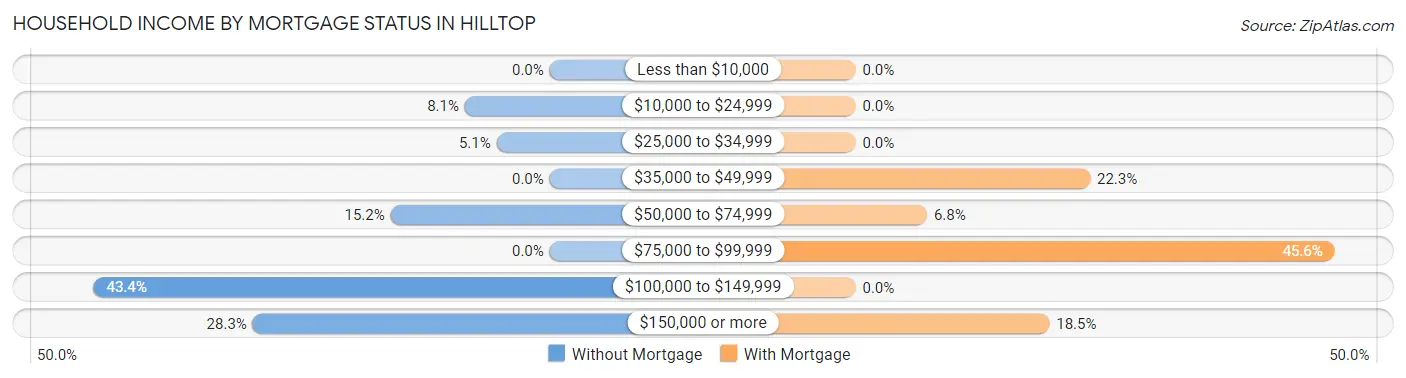
| Household Income | Without Mortgage | With Mortgage |
| Less than $10,000 | 0 (0.0%) | 0 (0.0%) |
| $10,000 to $24,999 | 8 (8.1%) | 0 (0.0%) |
| $25,000 to $34,999 | 5 (5.1%) | 0 (0.0%) |
| $35,000 to $49,999 | 0 (0.0%) | 23 (22.3%) |
| $50,000 to $74,999 | 15 (15.1%) | 7 (6.8%) |
| $75,000 to $99,999 | 0 (0.0%) | 47 (45.6%) |
| $100,000 to $149,999 | 43 (43.4%) | 0 (0.0%) |
| $150,000 or more | 28 (28.3%) | 19 (18.4%) |
| Total | 99 (100.0%) | 103 (100.0%) |
Property Value to Household Income Ratio in Hilltop
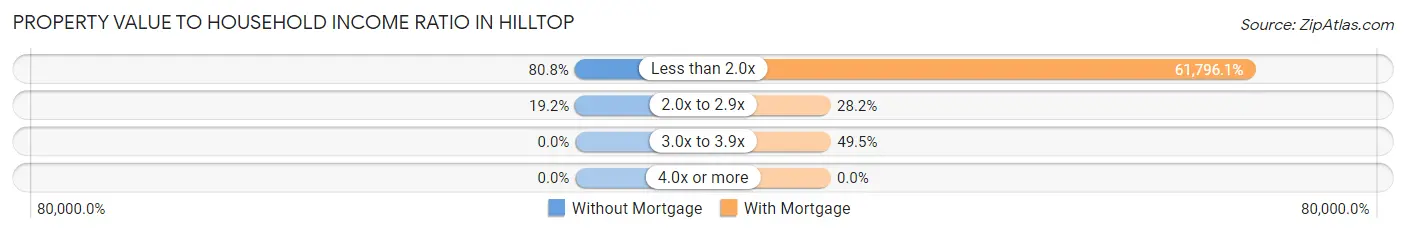
| Value-to-Income Ratio | Without Mortgage | With Mortgage |
| Less than 2.0x | 80 (80.8%) | 63,650 (61,796.1%) |
| 2.0x to 2.9x | 19 (19.2%) | 29 (28.2%) |
| 3.0x to 3.9x | 0 (0.0%) | 51 (49.5%) |
| 4.0x or more | 0 (0.0%) | 0 (0.0%) |
| Total | 99 (100.0%) | 103 (100.0%) |
Real Estate Taxes by Mortgage Status in Hilltop
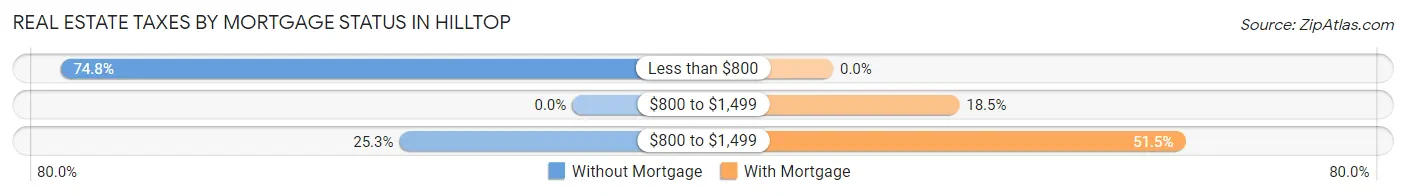
| Property Taxes | Without Mortgage | With Mortgage |
| Less than $800 | 74 (74.8%) | 0 (0.0%) |
| $800 to $1,499 | 0 (0.0%) | 19 (18.4%) |
| $800 to $1,499 | 25 (25.3%) | 53 (51.5%) |
| Total | 99 (100.0%) | 103 (100.0%) |
Health & Disability in Hilltop
Health Insurance Coverage by Age in Hilltop
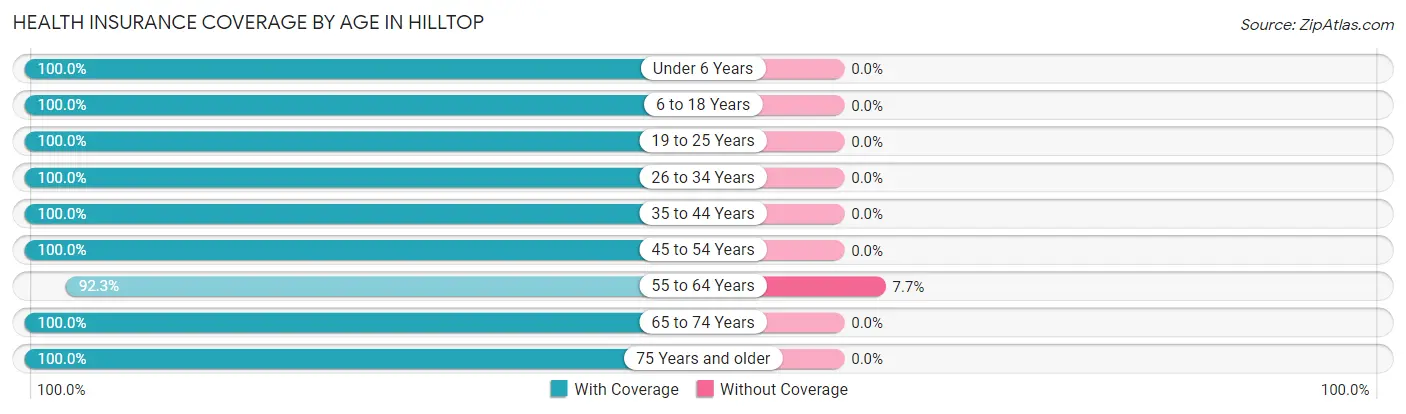
| Age Bracket | With Coverage | Without Coverage |
| Under 6 Years | 32 (100.0%) | 0 (0.0%) |
| 6 to 18 Years | 119 (100.0%) | 0 (0.0%) |
| 19 to 25 Years | 62 (100.0%) | 0 (0.0%) |
| 26 to 34 Years | 44 (100.0%) | 0 (0.0%) |
| 35 to 44 Years | 113 (100.0%) | 0 (0.0%) |
| 45 to 54 Years | 82 (100.0%) | 0 (0.0%) |
| 55 to 64 Years | 96 (92.3%) | 8 (7.7%) |
| 65 to 74 Years | 86 (100.0%) | 0 (0.0%) |
| 75 Years and older | 11 (100.0%) | 0 (0.0%) |
| Total | 645 (98.8%) | 8 (1.2%) |
Health Insurance Coverage by Citizenship Status in Hilltop
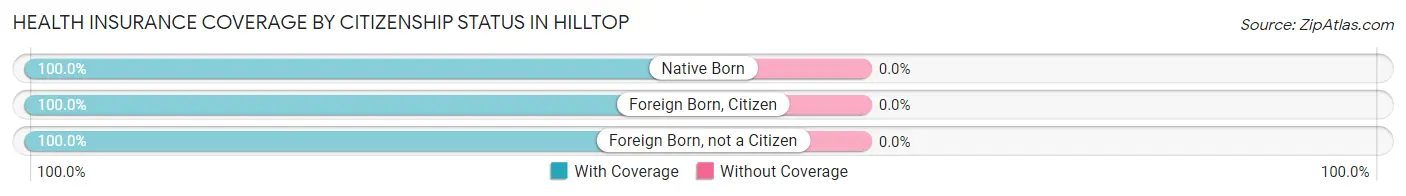
| Citizenship Status | With Coverage | Without Coverage |
| Native Born | 32 (100.0%) | 0 (0.0%) |
| Foreign Born, Citizen | 119 (100.0%) | 0 (0.0%) |
| Foreign Born, not a Citizen | 62 (100.0%) | 0 (0.0%) |
Health Insurance Coverage by Household Income in Hilltop
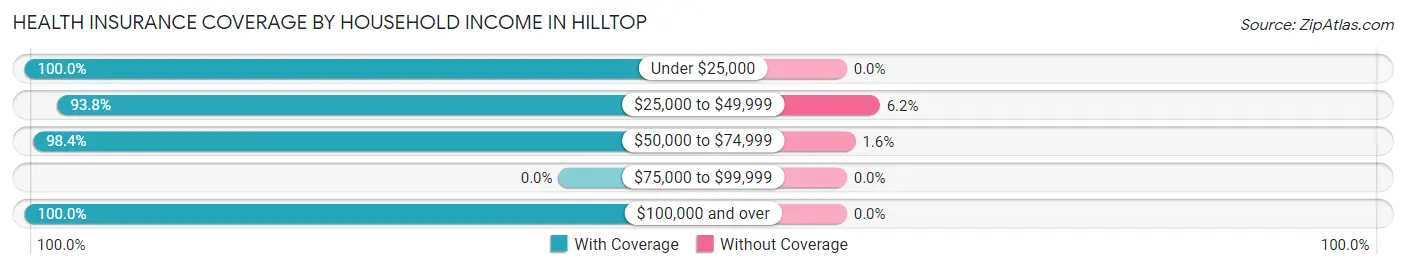
| Household Income | With Coverage | Without Coverage |
| Under $25,000 | 8 (100.0%) | 0 (0.0%) |
| $25,000 to $49,999 | 76 (93.8%) | 5 (6.2%) |
| $50,000 to $74,999 | 182 (98.4%) | 3 (1.6%) |
| $75,000 to $99,999 | 0 (0.0%) | 0 (0.0%) |
| $100,000 and over | 379 (100.0%) | 0 (0.0%) |
Public vs Private Health Insurance Coverage by Age in Hilltop
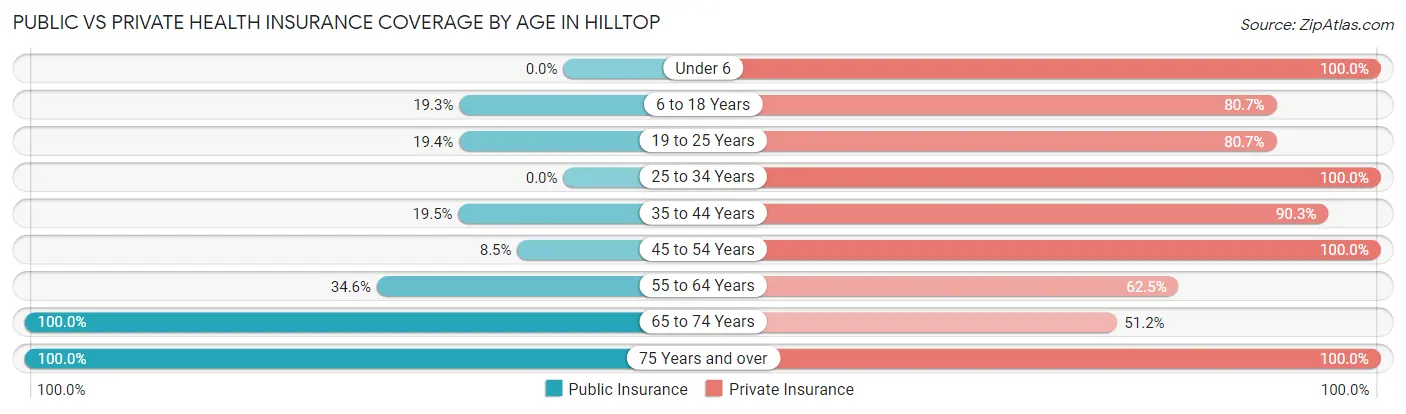
| Age Bracket | Public Insurance | Private Insurance |
| Under 6 | 0 (0.0%) | 32 (100.0%) |
| 6 to 18 Years | 23 (19.3%) | 96 (80.7%) |
| 19 to 25 Years | 12 (19.4%) | 50 (80.6%) |
| 25 to 34 Years | 0 (0.0%) | 44 (100.0%) |
| 35 to 44 Years | 22 (19.5%) | 102 (90.3%) |
| 45 to 54 Years | 7 (8.5%) | 82 (100.0%) |
| 55 to 64 Years | 36 (34.6%) | 65 (62.5%) |
| 65 to 74 Years | 86 (100.0%) | 44 (51.2%) |
| 75 Years and over | 11 (100.0%) | 11 (100.0%) |
| Total | 197 (30.2%) | 526 (80.5%) |
Disability Status by Sex by Age in Hilltop
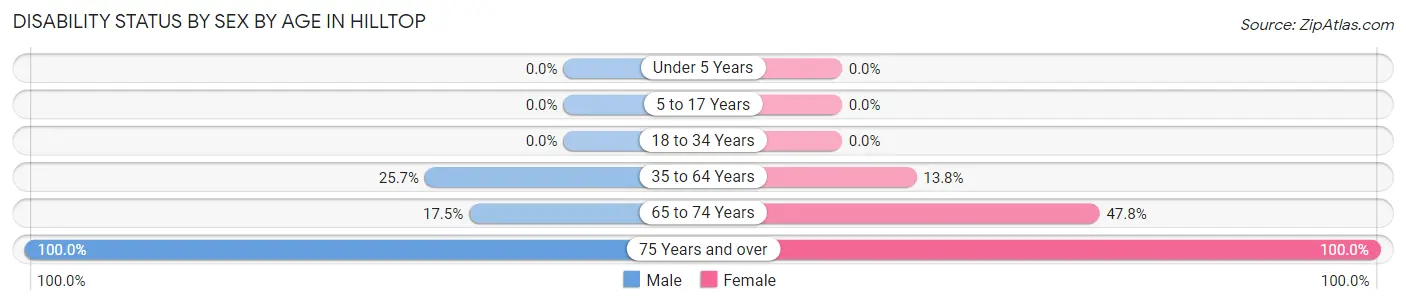
| Age Bracket | Male | Female |
| Under 5 Years | 0 (0.0%) | 0 (0.0%) |
| 5 to 17 Years | 0 (0.0%) | 0 (0.0%) |
| 18 to 34 Years | 0 (0.0%) | 0 (0.0%) |
| 35 to 64 Years | 36 (25.7%) | 22 (13.8%) |
| 65 to 74 Years | 7 (17.5%) | 22 (47.8%) |
| 75 Years and over | 8 (100.0%) | 3 (100.0%) |
Disability Class by Sex by Age in Hilltop
Disability Class: Hearing Difficulty
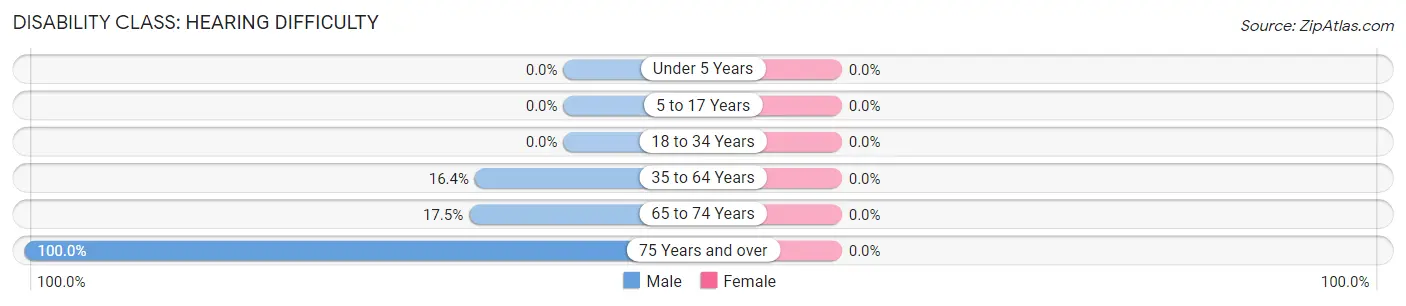
| Age Bracket | Male | Female |
| Under 5 Years | 0 (0.0%) | 0 (0.0%) |
| 5 to 17 Years | 0 (0.0%) | 0 (0.0%) |
| 18 to 34 Years | 0 (0.0%) | 0 (0.0%) |
| 35 to 64 Years | 23 (16.4%) | 0 (0.0%) |
| 65 to 74 Years | 7 (17.5%) | 0 (0.0%) |
| 75 Years and over | 8 (100.0%) | 0 (0.0%) |
Disability Class: Vision Difficulty
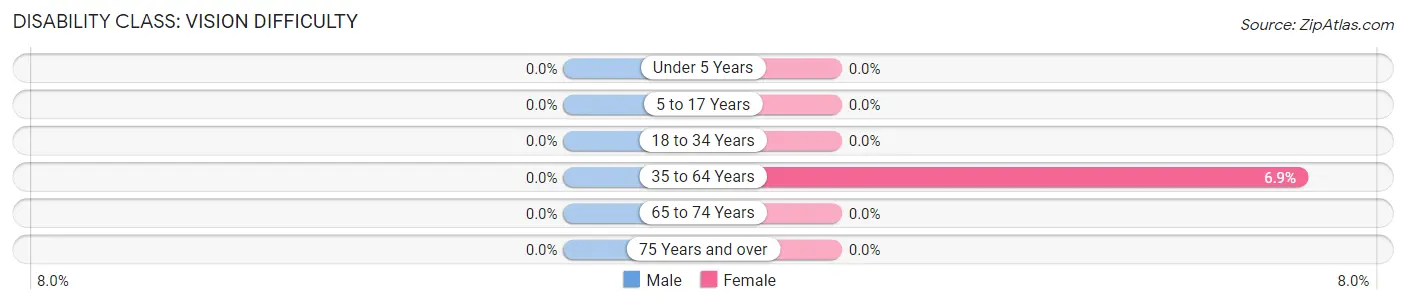
| Age Bracket | Male | Female |
| Under 5 Years | 0 (0.0%) | 0 (0.0%) |
| 5 to 17 Years | 0 (0.0%) | 0 (0.0%) |
| 18 to 34 Years | 0 (0.0%) | 0 (0.0%) |
| 35 to 64 Years | 0 (0.0%) | 11 (6.9%) |
| 65 to 74 Years | 0 (0.0%) | 0 (0.0%) |
| 75 Years and over | 0 (0.0%) | 0 (0.0%) |
Disability Class: Cognitive Difficulty
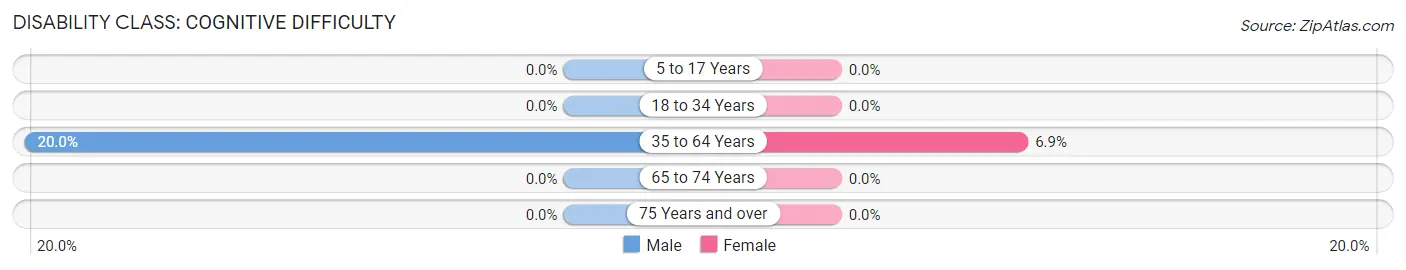
| Age Bracket | Male | Female |
| 5 to 17 Years | 0 (0.0%) | 0 (0.0%) |
| 18 to 34 Years | 0 (0.0%) | 0 (0.0%) |
| 35 to 64 Years | 28 (20.0%) | 11 (6.9%) |
| 65 to 74 Years | 0 (0.0%) | 0 (0.0%) |
| 75 Years and over | 0 (0.0%) | 0 (0.0%) |
Disability Class: Ambulatory Difficulty
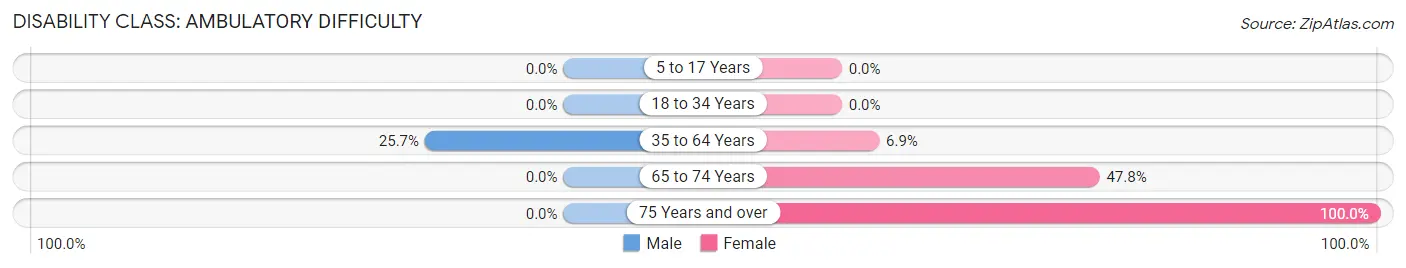
| Age Bracket | Male | Female |
| 5 to 17 Years | 0 (0.0%) | 0 (0.0%) |
| 18 to 34 Years | 0 (0.0%) | 0 (0.0%) |
| 35 to 64 Years | 36 (25.7%) | 11 (6.9%) |
| 65 to 74 Years | 0 (0.0%) | 22 (47.8%) |
| 75 Years and over | 0 (0.0%) | 3 (100.0%) |
Disability Class: Self-Care Difficulty
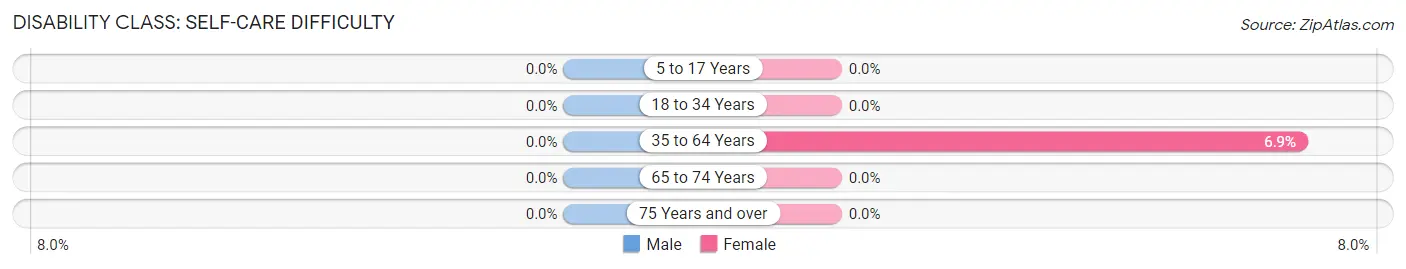
| Age Bracket | Male | Female |
| 5 to 17 Years | 0 (0.0%) | 0 (0.0%) |
| 18 to 34 Years | 0 (0.0%) | 0 (0.0%) |
| 35 to 64 Years | 0 (0.0%) | 11 (6.9%) |
| 65 to 74 Years | 0 (0.0%) | 0 (0.0%) |
| 75 Years and over | 0 (0.0%) | 0 (0.0%) |
Technology Access in Hilltop
Computing Device Access in Hilltop
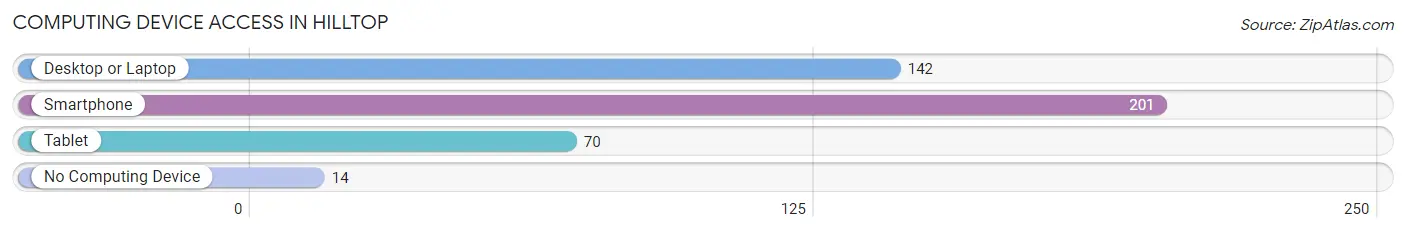
| Device Type | # Households | % Households |
| Desktop or Laptop | 142 | 63.7% |
| Smartphone | 201 | 90.1% |
| Tablet | 70 | 31.4% |
| No Computing Device | 14 | 6.3% |
| Total | 223 | 100.0% |
Internet Access in Hilltop
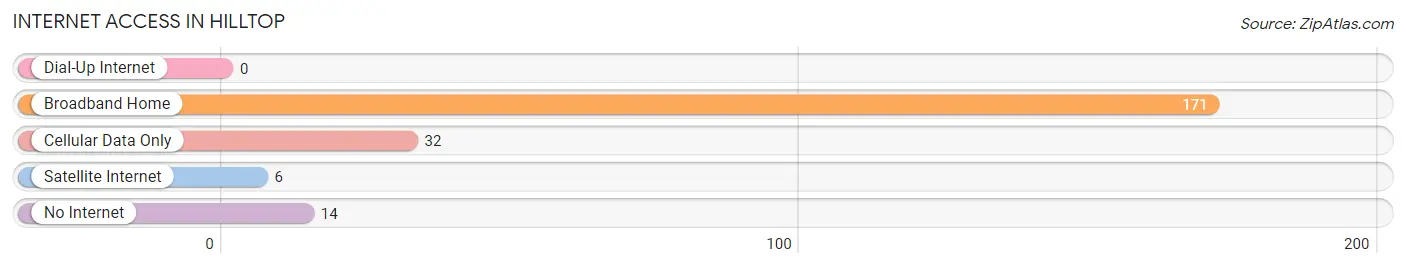
| Internet Type | # Households | % Households |
| Dial-Up Internet | 0 | 0.0% |
| Broadband Home | 171 | 76.7% |
| Cellular Data Only | 32 | 14.3% |
| Satellite Internet | 6 | 2.7% |
| No Internet | 14 | 6.3% |
| Total | 223 | 100.0% |
Hilltop Summary
Hilltop, Ohio is a small city located in Franklin County, Ohio. It is a suburb of Columbus, the state capital, and is located just west of the city. The population of Hilltop was estimated to be 8,845 in 2019.
History
Hilltop was founded in 1851 by a group of settlers from Pennsylvania. The settlers named the area Hilltop because of its location on a hill overlooking the Scioto River. The area was originally part of Hamilton Township, but was annexed by the City of Columbus in 1871.
The area was primarily agricultural until the early 20th century, when it began to develop into a residential suburb of Columbus. The first major development was the construction of the Hilltop Shopping Center in the 1950s. This shopping center was the first of its kind in the area and helped to spur further development.
Geography
Hilltop is located in Franklin County, Ohio, just west of the city of Columbus. It is situated on a hill overlooking the Scioto River. The city is bordered by the cities of Whitehall to the north, Bexley to the east, and Grove City to the south.
The terrain of Hilltop is mostly flat, with some rolling hills. The city is located in the Central Lowland region of the United States, and is part of the Appalachian Plateau. The climate is humid continental, with hot summers and cold winters.
Economy
The economy of Hilltop is largely based on retail and services. The Hilltop Shopping Center is the largest employer in the city, with over 1,000 employees. Other major employers include the Hilltop Community Center, Hilltop Medical Center, and Hilltop Public Library.
The city also has a number of small businesses, including restaurants, bars, and shops. The city is also home to a number of manufacturing companies, including a plastics factory and a metal fabrication plant.
Demographics
As of the 2019 census, the population of Hilltop was 8,845. The racial makeup of the city was 79.3% White, 13.2% African American, 2.2% Asian, and 5.3% other. The median household income was $45,845, and the median home value was $150,000.
The city is served by the Hilltop City School District, which includes four elementary schools, one middle school, and one high school. The city is also home to a number of private schools, including St. Mary's Catholic School and Hilltop Christian Academy.
Conclusion
Hilltop, Ohio is a small city located in Franklin County, Ohio. It is a suburb of Columbus, the state capital, and is located just west of the city. The population of Hilltop was estimated to be 8,845 in 2019. The economy of Hilltop is largely based on retail and services, with the Hilltop Shopping Center being the largest employer in the city. The racial makeup of the city was 79.3% White, 13.2% African American, 2.2% Asian, and 5.3% other. The city is served by the Hilltop City School District, which includes four elementary schools, one middle school, and one high school. Hilltop is a vibrant and diverse community that offers its residents a variety of amenities and opportunities.
Common Questions
What is Per Capita Income in Hilltop?
Per Capita income in Hilltop is $43,115.
What is the Median Family Income in Hilltop?
Median Family Income in Hilltop is $103,333.
What is the Median Household income in Hilltop?
Median Household Income in Hilltop is $70,774.
What is Income or Wage Gap in Hilltop?
Income or Wage Gap in Hilltop is 9.8%.
Women in Hilltop earn 90.2 cents for every dollar earned by a man.
What is Inequality or Gini Index in Hilltop?
Inequality or Gini Index in Hilltop is 0.51.
What is the Total Population of Hilltop?
Total Population of Hilltop is 653.
What is the Total Male Population of Hilltop?
Total Male Population of Hilltop is 349.
What is the Total Female Population of Hilltop?
Total Female Population of Hilltop is 304.
What is the Ratio of Males per 100 Females in Hilltop?
There are 114.80 Males per 100 Females in Hilltop.
What is the Ratio of Females per 100 Males in Hilltop?
There are 87.11 Females per 100 Males in Hilltop.
What is the Median Population Age in Hilltop?
Median Population Age in Hilltop is 39.7 Years.
What is the Average Family Size in Hilltop
Average Family Size in Hilltop is 3.3 People.
What is the Average Household Size in Hilltop
Average Household Size in Hilltop is 2.9 People.
How Large is the Labor Force in Hilltop?
There are 351 People in the Labor Forcein in Hilltop.
What is the Percentage of People in the Labor Force in Hilltop?
59.8% of People are in the Labor Force in Hilltop.
What is the Unemployment Rate in Hilltop?
Unemployment Rate in Hilltop is 4.8%.