Myers Corner, NY Map & Demographics
Myers Corner Map
Myers Corner Overview
$51,181
PER CAPITA INCOME
$129,219
AVG FAMILY INCOME
$109,963
AVG HOUSEHOLD INCOME
26.6%
WAGE / INCOME GAP [ % ]
73.4¢/ $1
WAGE / INCOME GAP [ $ ]
$11,066
FAMILY INCOME DEFICIT
0.39
INEQUALITY / GINI INDEX
10,653
TOTAL POPULATION
5,409
MALE POPULATION
5,244
FEMALE POPULATION
103.15
MALES / 100 FEMALES
96.95
FEMALES / 100 MALES
47.7
MEDIAN AGE
3.1
AVG FAMILY SIZE
2.6
AVG HOUSEHOLD SIZE
6,280
LABOR FORCE [ PEOPLE ]
69.2%
PERCENT IN LABOR FORCE
4.0%
UNEMPLOYMENT RATE
Income in Myers Corner
Income Overview in Myers Corner
Per Capita Income in Myers Corner is $51,181, while median incomes of families and households are $129,219 and $109,963 respectively.
| Characteristic | Number | Measure |
| Per Capita Income | 10,653 | $51,181 |
| Median Family Income | 2,852 | $129,219 |
| Mean Family Income | 2,852 | $150,455 |
| Median Household Income | 4,044 | $109,963 |
| Mean Household Income | 4,044 | $129,795 |
| Income Deficit | 2,852 | $11,066 |
| Wage / Income Gap (%) | 10,653 | 26.55% |
| Wage / Income Gap ($) | 10,653 | 73.45¢ per $1 |
| Gini / Inequality Index | 10,653 | 0.39 |
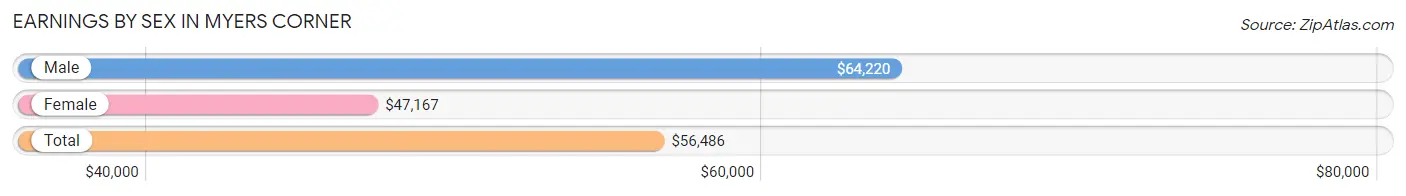
Earnings by Sex in Myers Corner
Average Earnings in Myers Corner are $56,486, $64,220 for men and $47,167 for women, a difference of 26.6%.
| Sex | Number | Average Earnings |
| Male | 3,293 (52.1%) | $64,220 |
| Female | 3,024 (47.9%) | $47,167 |
| Total | 6,317 (100.0%) | $56,486 |
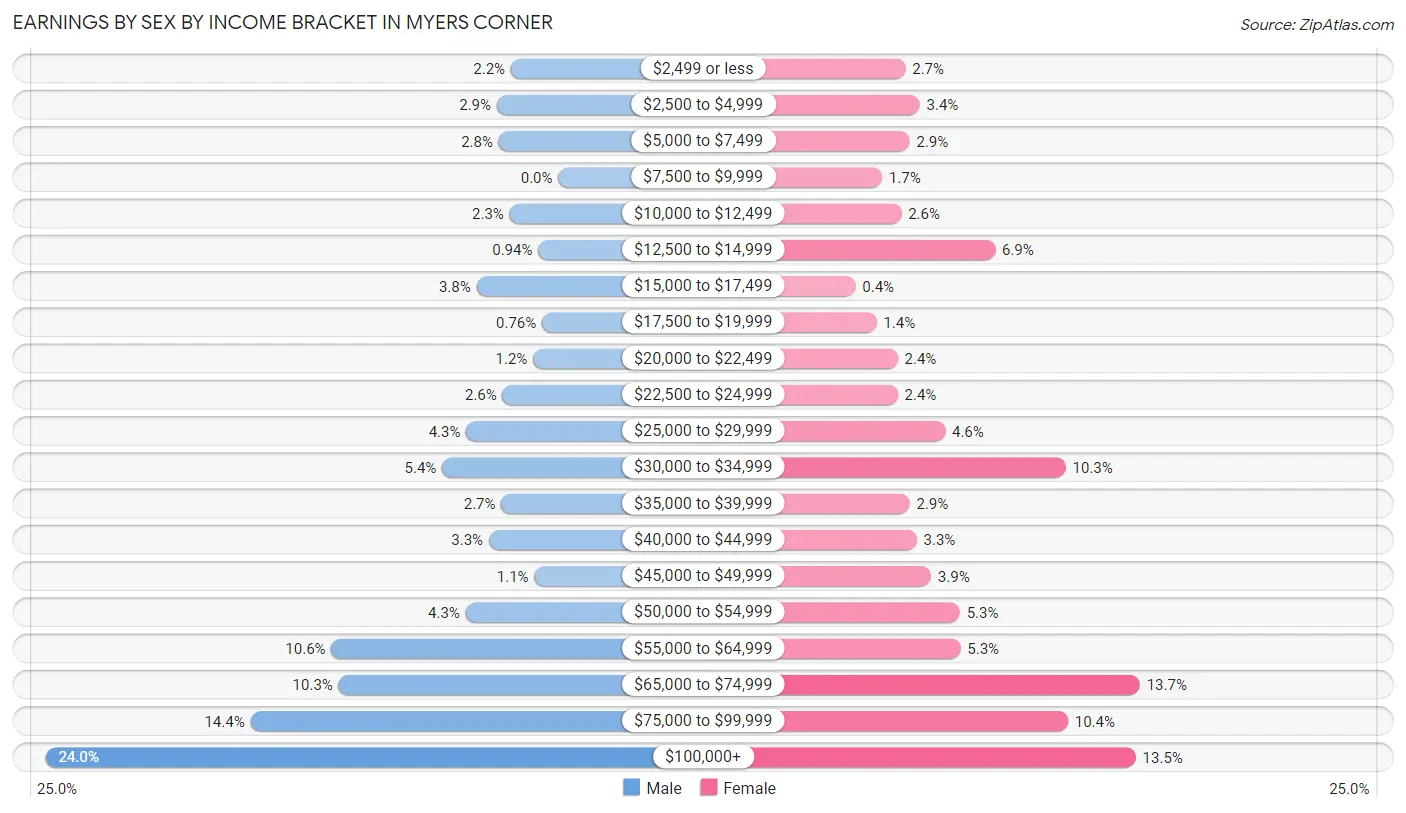
Earnings by Sex by Income Bracket in Myers Corner
The most common earnings brackets in Myers Corner are $100,000+ for men (791 | 24.0%) and $65,000 to $74,999 for women (415 | 13.7%).
| Income | Male | Female |
| $2,499 or less | 73 (2.2%) | 83 (2.7%) |
| $2,500 to $4,999 | 95 (2.9%) | 103 (3.4%) |
| $5,000 to $7,499 | 92 (2.8%) | 89 (2.9%) |
| $7,500 to $9,999 | 0 (0.0%) | 50 (1.7%) |
| $10,000 to $12,499 | 75 (2.3%) | 77 (2.5%) |
| $12,500 to $14,999 | 31 (0.9%) | 210 (6.9%) |
| $15,000 to $17,499 | 126 (3.8%) | 12 (0.4%) |
| $17,500 to $19,999 | 25 (0.8%) | 42 (1.4%) |
| $20,000 to $22,499 | 39 (1.2%) | 72 (2.4%) |
| $22,500 to $24,999 | 86 (2.6%) | 72 (2.4%) |
| $25,000 to $29,999 | 142 (4.3%) | 139 (4.6%) |
| $30,000 to $34,999 | 179 (5.4%) | 310 (10.2%) |
| $35,000 to $39,999 | 88 (2.7%) | 89 (2.9%) |
| $40,000 to $44,999 | 107 (3.3%) | 99 (3.3%) |
| $45,000 to $49,999 | 37 (1.1%) | 119 (3.9%) |
| $50,000 to $54,999 | 143 (4.3%) | 160 (5.3%) |
| $55,000 to $64,999 | 350 (10.6%) | 161 (5.3%) |
| $65,000 to $74,999 | 339 (10.3%) | 415 (13.7%) |
| $75,000 to $99,999 | 475 (14.4%) | 313 (10.3%) |
| $100,000+ | 791 (24.0%) | 409 (13.5%) |
| Total | 3,293 (100.0%) | 3,024 (100.0%) |
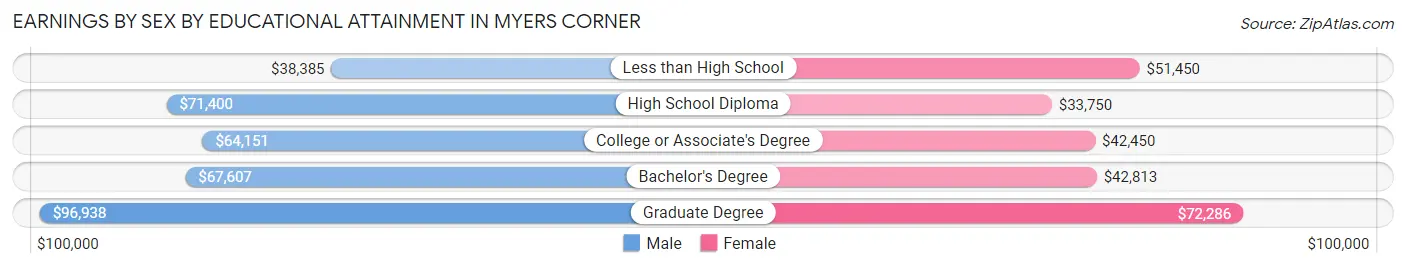
Earnings by Sex by Educational Attainment in Myers Corner
Average earnings in Myers Corner are $72,639 for men and $54,020 for women, a difference of 25.6%. Men with an educational attainment of graduate degree enjoy the highest average annual earnings of $96,938, while those with less than high school education earn the least with $38,385. Women with an educational attainment of graduate degree earn the most with the average annual earnings of $72,286, while those with high school diploma education have the smallest earnings of $33,750.
| Educational Attainment | Male Income | Female Income |
| Less than High School | $38,385 | $51,450 |
| High School Diploma | $71,400 | $33,750 |
| College or Associate's Degree | $64,151 | $42,450 |
| Bachelor's Degree | $67,607 | $42,813 |
| Graduate Degree | $96,938 | $72,286 |
| Total | $72,639 | $54,020 |
Family Income in Myers Corner
Family Income Brackets in Myers Corner
According to the Myers Corner family income data, there are 707 families falling into the $200,000+ income range, which is the most common income bracket and makes up 24.8% of all families. Conversely, the $10,000 to $14,999 income bracket is the least frequent group with only 9 families (0.3%) belonging to this category.
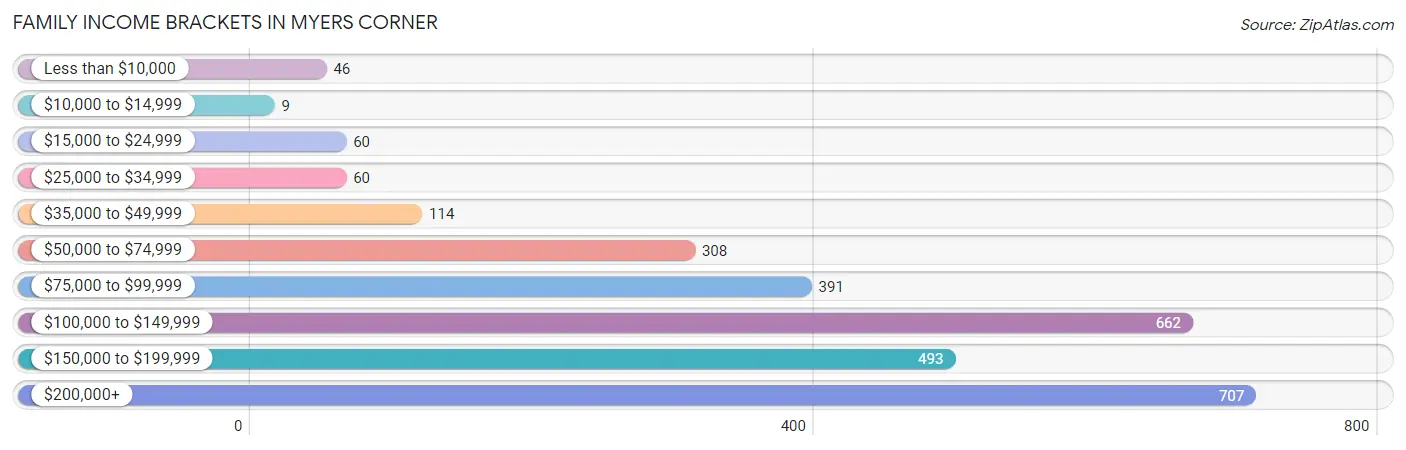
| Income Bracket | # Families | % Families |
| Less than $10,000 | 46 | 1.6% |
| $10,000 to $14,999 | 9 | 0.3% |
| $15,000 to $24,999 | 60 | 2.1% |
| $25,000 to $34,999 | 60 | 2.1% |
| $35,000 to $49,999 | 114 | 4.0% |
| $50,000 to $74,999 | 308 | 10.8% |
| $75,000 to $99,999 | 391 | 13.7% |
| $100,000 to $149,999 | 662 | 23.2% |
| $150,000 to $199,999 | 493 | 17.3% |
| $200,000+ | 707 | 24.8% |
Family Income by Famaliy Size in Myers Corner
7+ person families (46 | 1.6%) account for the highest median family income in Myers Corner with $218,611 per family, while 2-person families (1,251 | 43.9%) have the highest median income of $53,797 per family member.
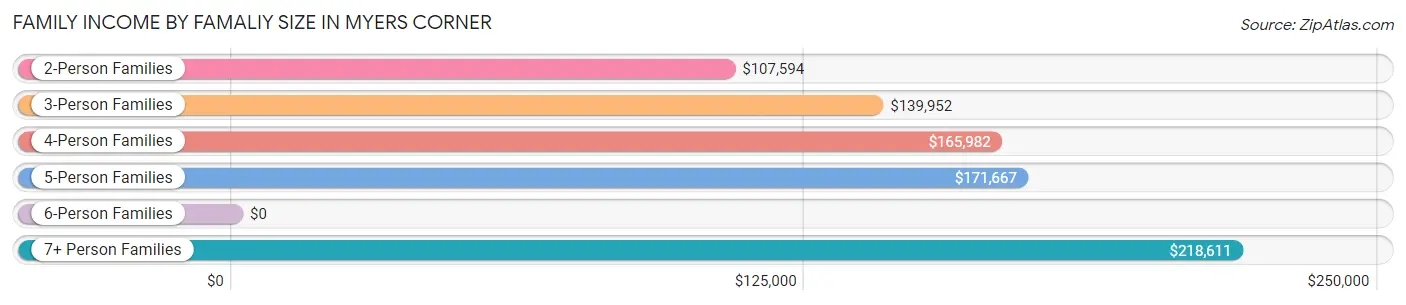
| Income Bracket | # Families | Median Income |
| 2-Person Families | 1,251 (43.9%) | $107,594 |
| 3-Person Families | 789 (27.7%) | $139,952 |
| 4-Person Families | 587 (20.6%) | $165,982 |
| 5-Person Families | 134 (4.7%) | $171,667 |
| 6-Person Families | 45 (1.6%) | $0 |
| 7+ Person Families | 46 (1.6%) | $218,611 |
| Total | 2,852 (100.0%) | $129,219 |
Family Income by Number of Earners in Myers Corner
The median family income in Myers Corner is $129,219, with families comprising 3+ earners (592) having the highest median family income of $177,292, while families with no earners (433) have the lowest median family income of $85,694, accounting for 20.8% and 15.2% of families, respectively.
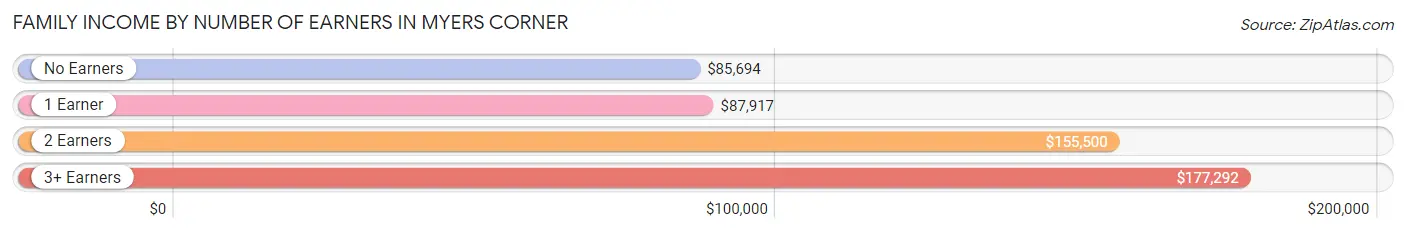
| Number of Earners | # Families | Median Income |
| No Earners | 433 (15.2%) | $85,694 |
| 1 Earner | 715 (25.1%) | $87,917 |
| 2 Earners | 1,112 (39.0%) | $155,500 |
| 3+ Earners | 592 (20.8%) | $177,292 |
| Total | 2,852 (100.0%) | $129,219 |
Household Income in Myers Corner
Household Income Brackets in Myers Corner
With 821 households falling in the category, the $100,000 to $149,999 income range is the most frequent in Myers Corner, accounting for 20.3% of all households. In contrast, only 8 households (0.2%) fall into the $10,000 to $14,999 income bracket, making it the least populous group.
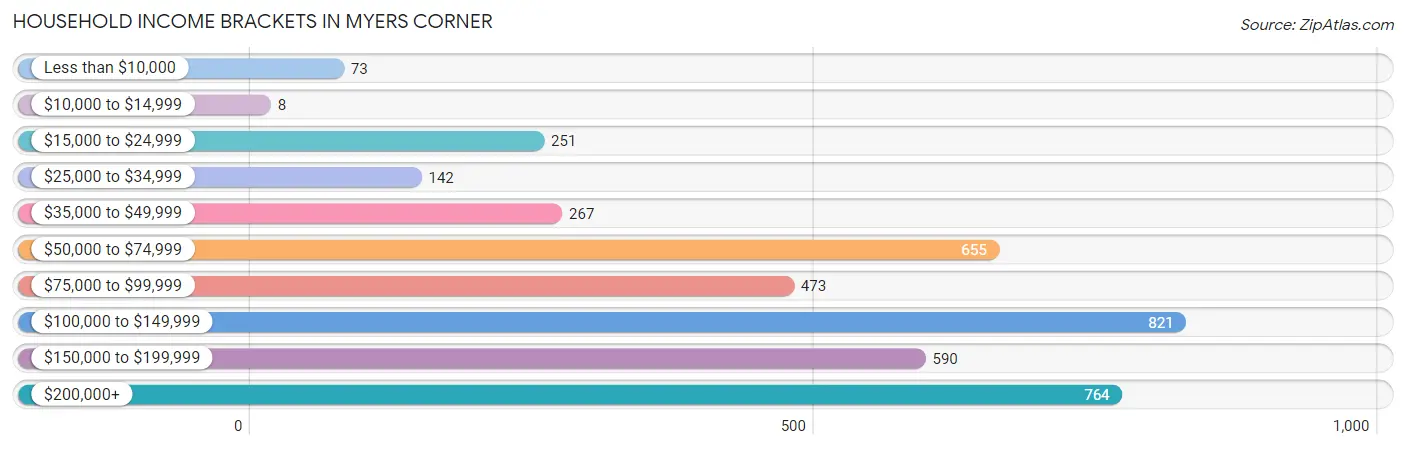
| Income Bracket | # Households | % Households |
| Less than $10,000 | 73 | 1.8% |
| $10,000 to $14,999 | 8 | 0.2% |
| $15,000 to $24,999 | 251 | 6.2% |
| $25,000 to $34,999 | 142 | 3.5% |
| $35,000 to $49,999 | 267 | 6.6% |
| $50,000 to $74,999 | 655 | 16.2% |
| $75,000 to $99,999 | 473 | 11.7% |
| $100,000 to $149,999 | 821 | 20.3% |
| $150,000 to $199,999 | 590 | 14.6% |
| $200,000+ | 764 | 18.9% |
Household Income by Householder Age in Myers Corner
The median household income in Myers Corner is $109,963, with the highest median household income of $140,905 found in the 45 to 64 years age bracket for the primary householder. A total of 2,019 households (49.9%) fall into this category. Meanwhile, the 15 to 24 years age bracket for the primary householder has the lowest median household income of $0, with 74 households (1.8%) in this group.
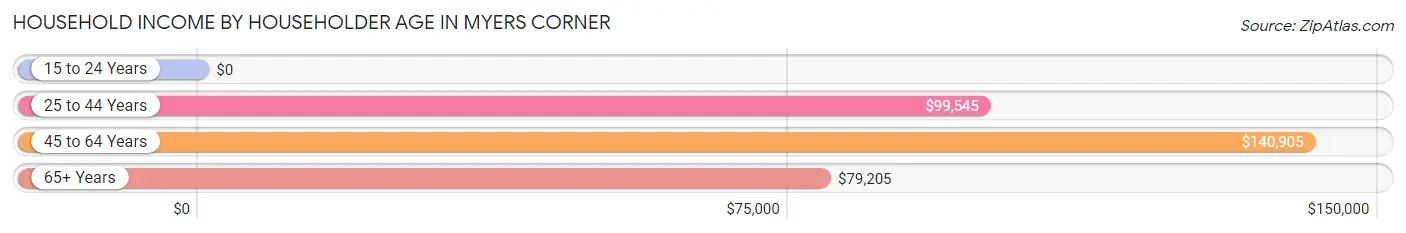
| Income Bracket | # Households | Median Income |
| 15 to 24 Years | 74 (1.8%) | $0 |
| 25 to 44 Years | 792 (19.6%) | $99,545 |
| 45 to 64 Years | 2,019 (49.9%) | $140,905 |
| 65+ Years | 1,159 (28.7%) | $79,205 |
| Total | 4,044 (100.0%) | $109,963 |
Poverty in Myers Corner
Income Below Poverty by Sex and Age in Myers Corner
With 2.8% poverty level for males and 6.6% for females among the residents of Myers Corner, 75 year old and over males and 12 to 14 year old females are the most vulnerable to poverty, with 24 males (4.7%) and 49 females (35.0%) in their respective age groups living below the poverty level.
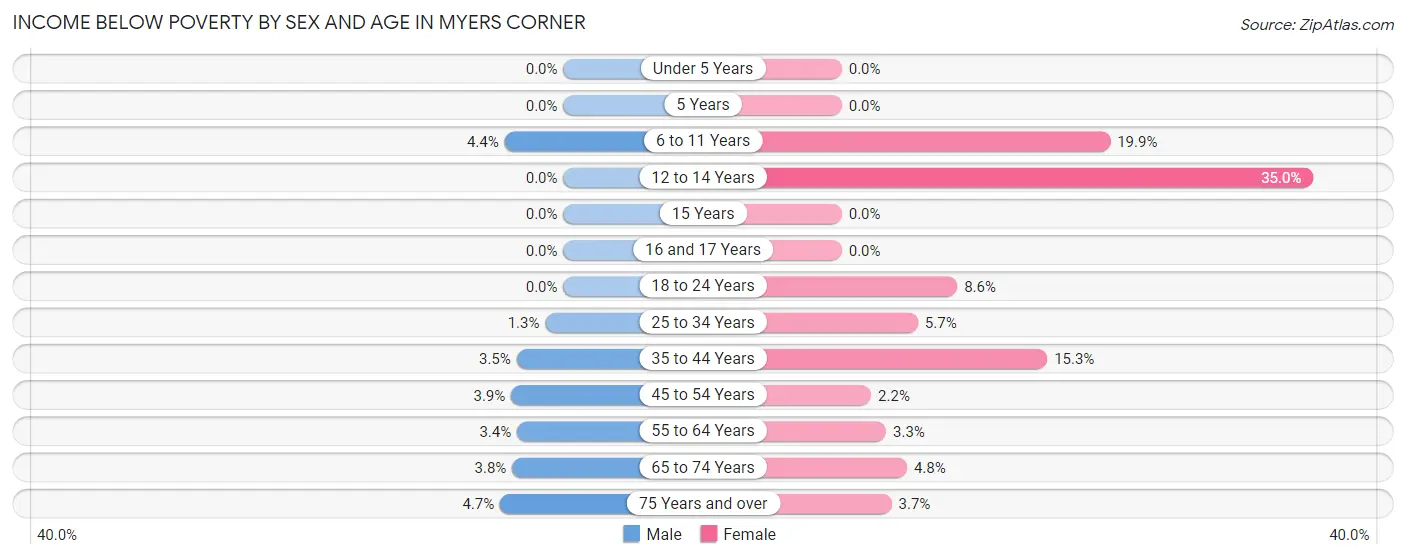
| Age Bracket | Male | Female |
| Under 5 Years | 0 (0.0%) | 0 (0.0%) |
| 5 Years | 0 (0.0%) | 0 (0.0%) |
| 6 to 11 Years | 12 (4.4%) | 57 (19.9%) |
| 12 to 14 Years | 0 (0.0%) | 49 (35.0%) |
| 15 Years | 0 (0.0%) | 0 (0.0%) |
| 16 and 17 Years | 0 (0.0%) | 0 (0.0%) |
| 18 to 24 Years | 0 (0.0%) | 39 (8.6%) |
| 25 to 34 Years | 8 (1.3%) | 35 (5.7%) |
| 35 to 44 Years | 17 (3.5%) | 68 (15.2%) |
| 45 to 54 Years | 36 (3.9%) | 15 (2.2%) |
| 55 to 64 Years | 30 (3.4%) | 31 (3.3%) |
| 65 to 74 Years | 23 (3.8%) | 40 (4.8%) |
| 75 Years and over | 24 (4.7%) | 13 (3.7%) |
| Total | 150 (2.8%) | 347 (6.6%) |
Income Above Poverty by Sex and Age in Myers Corner
According to the poverty statistics in Myers Corner, males aged under 5 years and females aged under 5 years are the age groups that are most secure financially, with 100.0% of males and 100.0% of females in these age groups living above the poverty line.
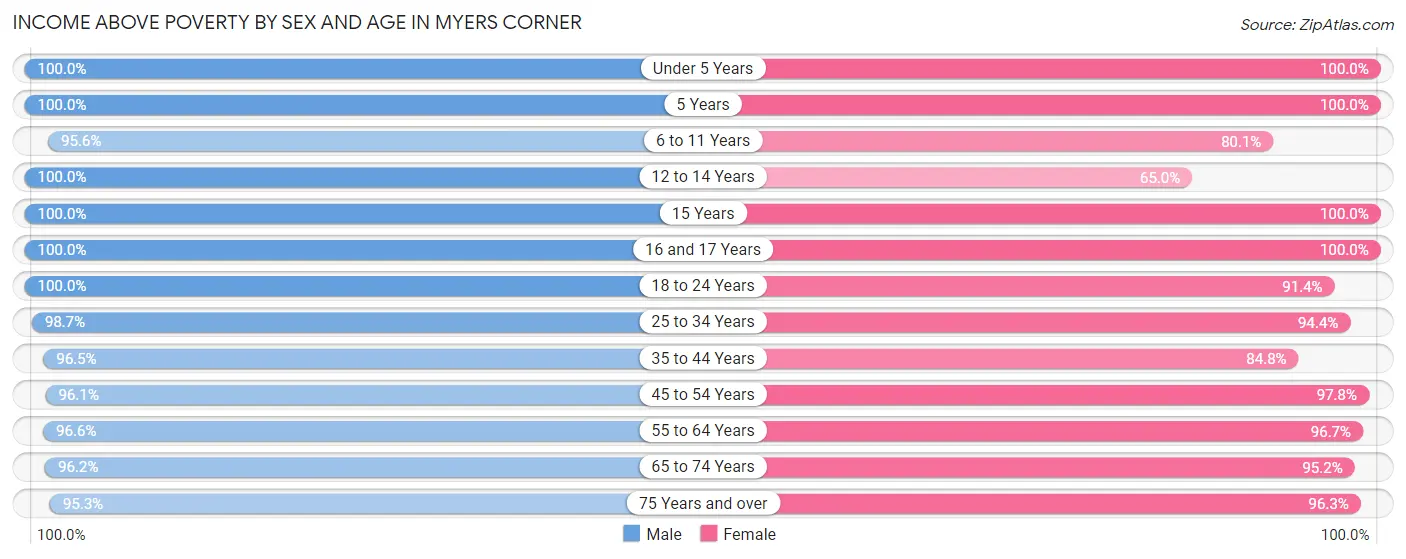
| Age Bracket | Male | Female |
| Under 5 Years | 163 (100.0%) | 172 (100.0%) |
| 5 Years | 62 (100.0%) | 46 (100.0%) |
| 6 to 11 Years | 263 (95.6%) | 229 (80.1%) |
| 12 to 14 Years | 214 (100.0%) | 91 (65.0%) |
| 15 Years | 47 (100.0%) | 165 (100.0%) |
| 16 and 17 Years | 164 (100.0%) | 86 (100.0%) |
| 18 to 24 Years | 468 (100.0%) | 416 (91.4%) |
| 25 to 34 Years | 590 (98.7%) | 585 (94.4%) |
| 35 to 44 Years | 473 (96.5%) | 378 (84.8%) |
| 45 to 54 Years | 891 (96.1%) | 673 (97.8%) |
| 55 to 64 Years | 843 (96.6%) | 910 (96.7%) |
| 65 to 74 Years | 583 (96.2%) | 787 (95.2%) |
| 75 Years and over | 487 (95.3%) | 338 (96.3%) |
| Total | 5,248 (97.2%) | 4,876 (93.4%) |
Income Below Poverty Among Married-Couple Families in Myers Corner
The poverty statistics for married-couple families in Myers Corner show that 0.9% or 21 of the total 2,271 families live below the poverty line. Families with 1 or 2 children have the highest poverty rate of 1.3%, comprising of 9 families. On the other hand, families with 3 or 4 children have the lowest poverty rate of 0.0%, which includes 0 families.
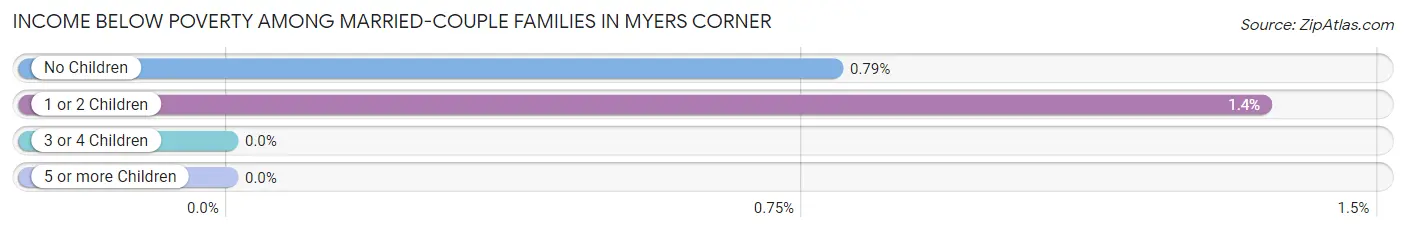
| Children | Above Poverty | Below Poverty |
| No Children | 1,512 (99.2%) | 12 (0.8%) |
| 1 or 2 Children | 658 (98.7%) | 9 (1.3%) |
| 3 or 4 Children | 65 (100.0%) | 0 (0.0%) |
| 5 or more Children | 15 (100.0%) | 0 (0.0%) |
| Total | 2,250 (99.1%) | 21 (0.9%) |
Income Below Poverty Among Single-Parent Households in Myers Corner
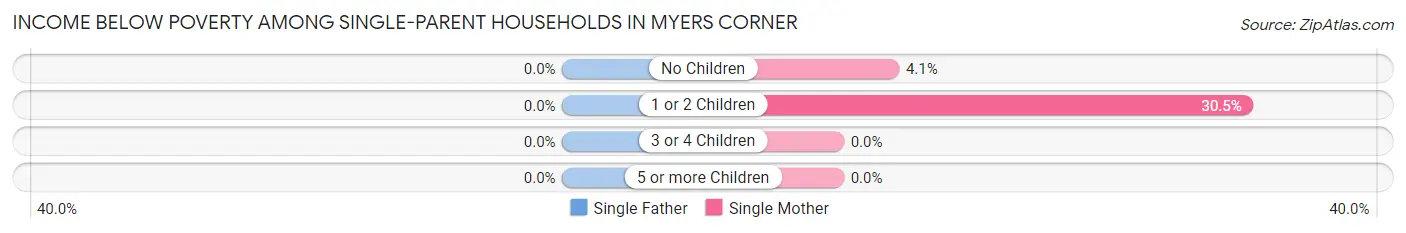
| Children | Single Father | Single Mother |
| No Children | 0 (0.0%) | 8 (4.1%) |
| 1 or 2 Children | 0 (0.0%) | 51 (30.5%) |
| 3 or 4 Children | 0 (0.0%) | 0 (0.0%) |
| 5 or more Children | 0 (0.0%) | 0 (0.0%) |
| Total | 0 (0.0%) | 59 (15.1%) |
Income Below Poverty Among Married-Couple vs Single-Parent Households in Myers Corner
The poverty data for Myers Corner shows that 21 of the married-couple family households (0.9%) and 59 of the single-parent households (10.2%) are living below the poverty level. Within the married-couple family households, those with 1 or 2 children have the highest poverty rate, with 9 households (1.3%) falling below the poverty line. Among the single-parent households, those with 1 or 2 children have the highest poverty rate, with 51 household (27.0%) living below poverty.
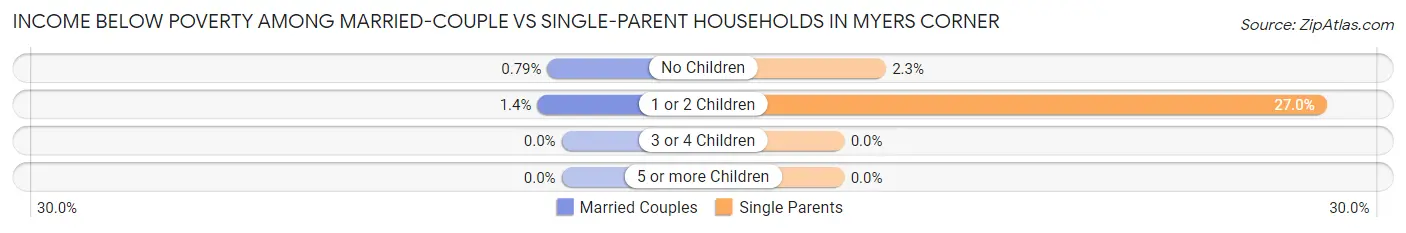
| Children | Married-Couple Families | Single-Parent Households |
| No Children | 12 (0.8%) | 8 (2.3%) |
| 1 or 2 Children | 9 (1.3%) | 51 (27.0%) |
| 3 or 4 Children | 0 (0.0%) | 0 (0.0%) |
| 5 or more Children | 0 (0.0%) | 0 (0.0%) |
| Total | 21 (0.9%) | 59 (10.2%) |
Race in Myers Corner
The most populous races in Myers Corner are White / Caucasian (8,106 | 76.1%), Hispanic or Latino (1,674 | 15.7%), and Two or more Races (784 | 7.4%).
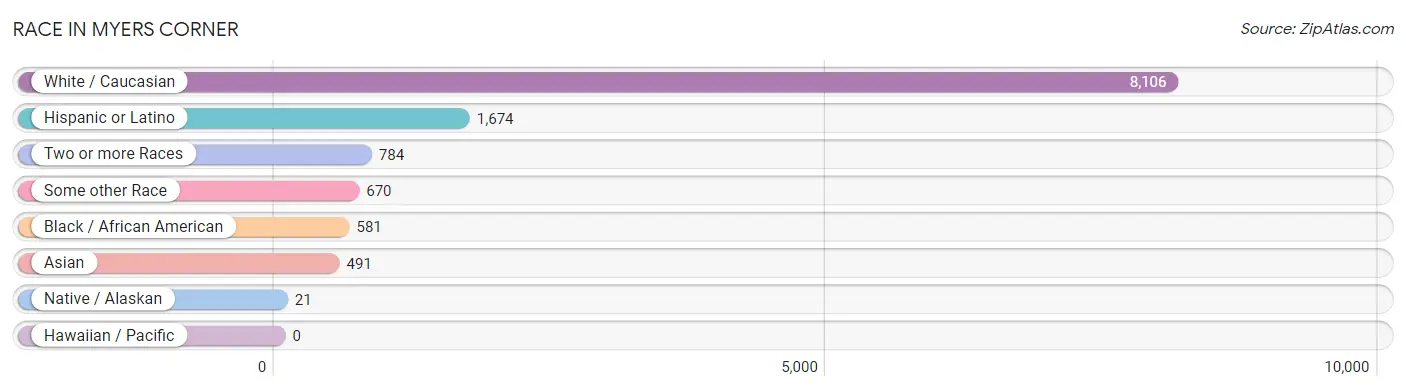
| Race | # Population | % Population |
| Asian | 491 | 4.6% |
| Black / African American | 581 | 5.4% |
| Hawaiian / Pacific | 0 | 0.0% |
| Hispanic or Latino | 1,674 | 15.7% |
| Native / Alaskan | 21 | 0.2% |
| White / Caucasian | 8,106 | 76.1% |
| Two or more Races | 784 | 7.4% |
| Some other Race | 670 | 6.3% |
| Total | 10,653 | 100.0% |
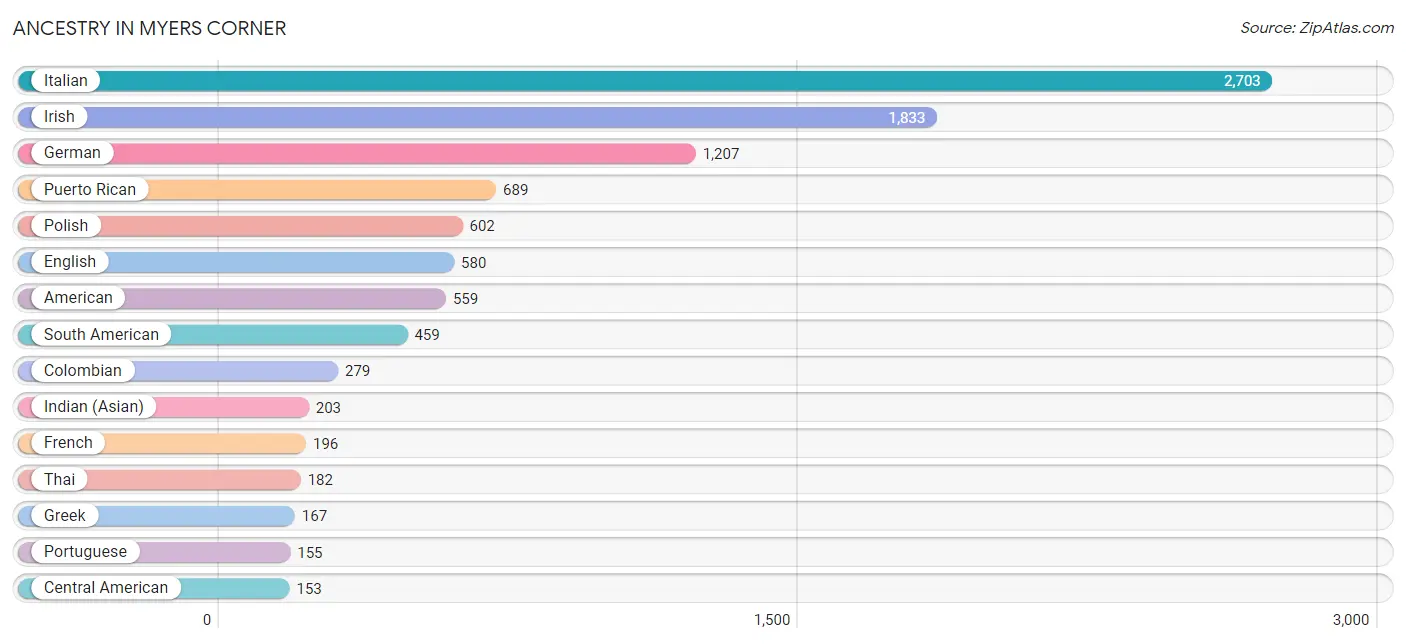
Ancestry in Myers Corner
The most populous ancestries reported in Myers Corner are Italian (2,703 | 25.4%), Irish (1,833 | 17.2%), German (1,207 | 11.3%), Puerto Rican (689 | 6.5%), and Polish (602 | 5.7%), together accounting for 66.0% of all Myers Corner residents.
| Ancestry | # Population | % Population |
| African | 24 | 0.2% |
| American | 559 | 5.2% |
| Arab | 30 | 0.3% |
| Argentinean | 75 | 0.7% |
| Austrian | 37 | 0.4% |
| Belgian | 10 | 0.1% |
| Bhutanese | 48 | 0.4% |
| British | 42 | 0.4% |
| Canadian | 29 | 0.3% |
| Central American | 153 | 1.4% |
| Chilean | 8 | 0.1% |
| Colombian | 279 | 2.6% |
| Cuban | 43 | 0.4% |
| Czech | 20 | 0.2% |
| Czechoslovakian | 40 | 0.4% |
| Danish | 8 | 0.1% |
| Dominican | 140 | 1.3% |
| Dutch | 93 | 0.9% |
| Ecuadorian | 51 | 0.5% |
| Egyptian | 30 | 0.3% |
| English | 580 | 5.4% |
| European | 80 | 0.7% |
| Finnish | 17 | 0.2% |
| French | 196 | 1.8% |
| French Canadian | 70 | 0.7% |
| German | 1,207 | 11.3% |
| Greek | 167 | 1.6% |
| Guatemalan | 90 | 0.8% |
| Honduran | 63 | 0.6% |
| Hungarian | 81 | 0.8% |
| Indian (Asian) | 203 | 1.9% |
| Irish | 1,833 | 17.2% |
| Israeli | 18 | 0.2% |
| Italian | 2,703 | 25.4% |
| Jamaican | 123 | 1.1% |
| Kenyan | 66 | 0.6% |
| Latvian | 9 | 0.1% |
| Mexican | 119 | 1.1% |
| Norwegian | 36 | 0.3% |
| Peruvian | 46 | 0.4% |
| Polish | 602 | 5.7% |
| Portuguese | 155 | 1.5% |
| Puerto Rican | 689 | 6.5% |
| Russian | 131 | 1.2% |
| Scotch-Irish | 108 | 1.0% |
| Scottish | 151 | 1.4% |
| Slavic | 7 | 0.1% |
| Slovak | 28 | 0.3% |
| South American | 459 | 4.3% |
| Spaniard | 71 | 0.7% |
| Subsaharan African | 90 | 0.8% |
| Swedish | 86 | 0.8% |
| Thai | 182 | 1.7% |
| Ukrainian | 63 | 0.6% |
| Welsh | 61 | 0.6% | View All 55 Rows |
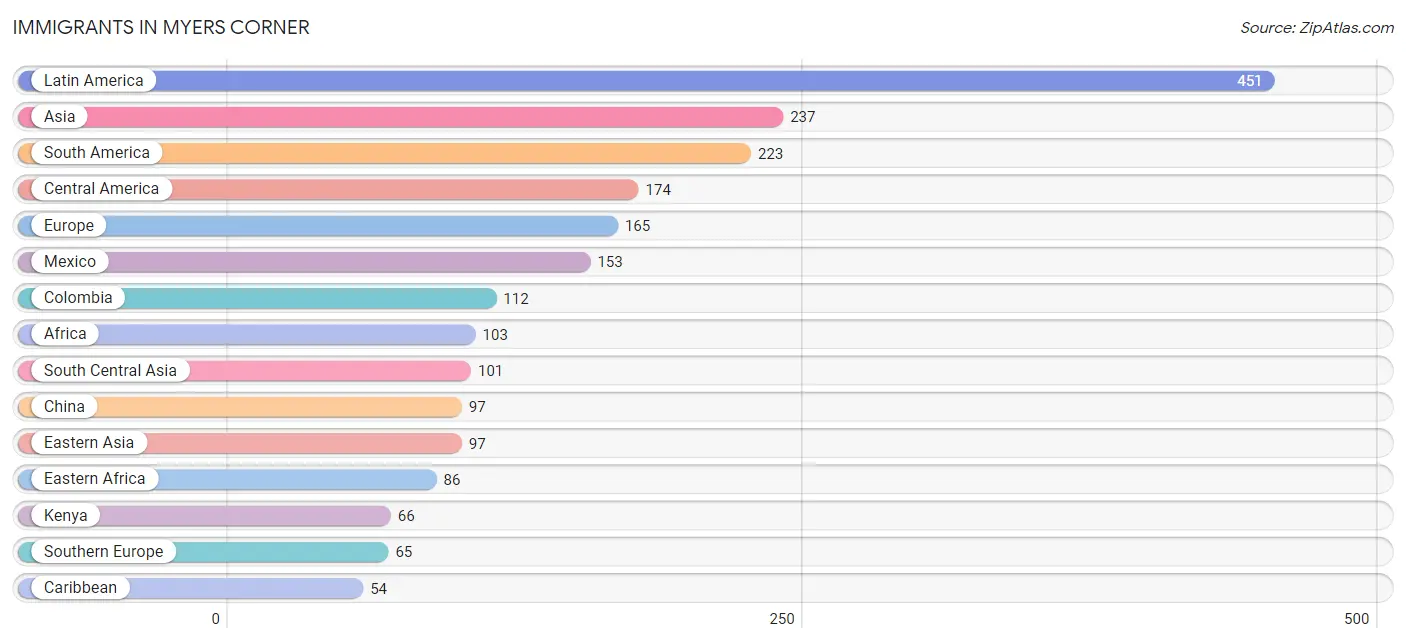
Immigrants in Myers Corner
The most numerous immigrant groups reported in Myers Corner came from Latin America (451 | 4.2%), Asia (237 | 2.2%), South America (223 | 2.1%), Central America (174 | 1.6%), and Europe (165 | 1.5%), together accounting for 11.7% of all Myers Corner residents.
| Immigration Origin | # Population | % Population |
| Africa | 103 | 1.0% |
| Argentina | 22 | 0.2% |
| Asia | 237 | 2.2% |
| Australia | 11 | 0.1% |
| Belarus | 8 | 0.1% |
| Canada | 21 | 0.2% |
| Caribbean | 54 | 0.5% |
| Central America | 174 | 1.6% |
| China | 97 | 0.9% |
| Colombia | 112 | 1.1% |
| Dominican Republic | 12 | 0.1% |
| Eastern Africa | 86 | 0.8% |
| Eastern Asia | 97 | 0.9% |
| Eastern Europe | 35 | 0.3% |
| Ecuador | 51 | 0.5% |
| Egypt | 10 | 0.1% |
| England | 14 | 0.1% |
| Europe | 165 | 1.5% |
| France | 8 | 0.1% |
| Germany | 20 | 0.2% |
| Guatemala | 1 | 0.0% |
| Guyana | 16 | 0.2% |
| Honduras | 20 | 0.2% |
| Hong Kong | 30 | 0.3% |
| Hungary | 13 | 0.1% |
| India | 51 | 0.5% |
| Israel | 18 | 0.2% |
| Italy | 41 | 0.4% |
| Jamaica | 24 | 0.2% |
| Kenya | 66 | 0.6% |
| Kuwait | 21 | 0.2% |
| Latin America | 451 | 4.2% |
| Mexico | 153 | 1.4% |
| Netherlands | 8 | 0.1% |
| Northern Africa | 10 | 0.1% |
| Northern Europe | 29 | 0.3% |
| Oceania | 11 | 0.1% |
| Pakistan | 50 | 0.5% |
| Peru | 22 | 0.2% |
| Poland | 9 | 0.1% |
| Scotland | 11 | 0.1% |
| South Africa | 7 | 0.1% |
| South America | 223 | 2.1% |
| South Central Asia | 101 | 0.9% |
| Southern Europe | 65 | 0.6% |
| Spain | 24 | 0.2% |
| Trinidad and Tobago | 18 | 0.2% |
| Uganda | 20 | 0.2% |
| Ukraine | 5 | 0.1% |
| Western Asia | 39 | 0.4% |
| Western Europe | 36 | 0.3% | View All 51 Rows |
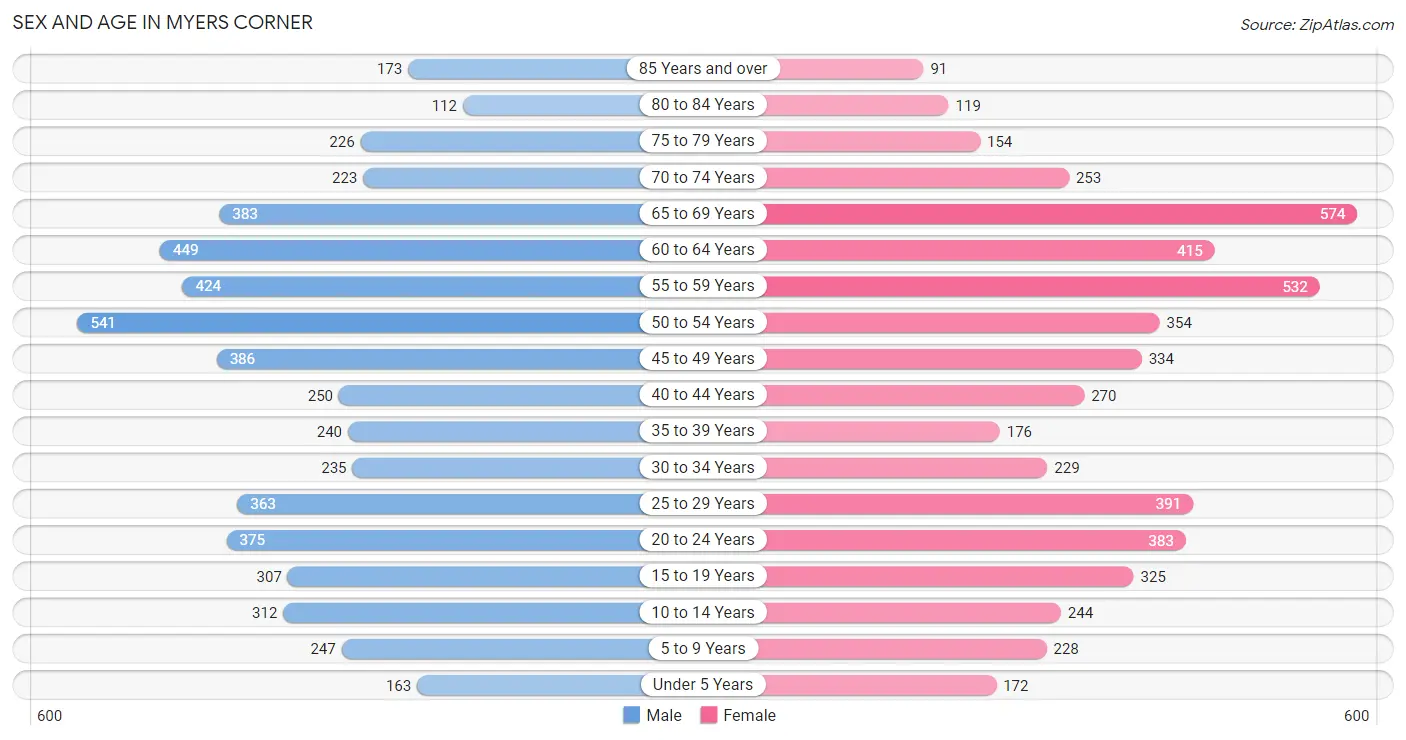
Sex and Age in Myers Corner
Sex and Age in Myers Corner
The most populous age groups in Myers Corner are 50 to 54 Years (541 | 10.0%) for men and 65 to 69 Years (574 | 11.0%) for women.
| Age Bracket | Male | Female |
| Under 5 Years | 163 (3.0%) | 172 (3.3%) |
| 5 to 9 Years | 247 (4.6%) | 228 (4.3%) |
| 10 to 14 Years | 312 (5.8%) | 244 (4.6%) |
| 15 to 19 Years | 307 (5.7%) | 325 (6.2%) |
| 20 to 24 Years | 375 (6.9%) | 383 (7.3%) |
| 25 to 29 Years | 363 (6.7%) | 391 (7.5%) |
| 30 to 34 Years | 235 (4.3%) | 229 (4.4%) |
| 35 to 39 Years | 240 (4.4%) | 176 (3.4%) |
| 40 to 44 Years | 250 (4.6%) | 270 (5.1%) |
| 45 to 49 Years | 386 (7.1%) | 334 (6.4%) |
| 50 to 54 Years | 541 (10.0%) | 354 (6.8%) |
| 55 to 59 Years | 424 (7.8%) | 532 (10.1%) |
| 60 to 64 Years | 449 (8.3%) | 415 (7.9%) |
| 65 to 69 Years | 383 (7.1%) | 574 (11.0%) |
| 70 to 74 Years | 223 (4.1%) | 253 (4.8%) |
| 75 to 79 Years | 226 (4.2%) | 154 (2.9%) |
| 80 to 84 Years | 112 (2.1%) | 119 (2.3%) |
| 85 Years and over | 173 (3.2%) | 91 (1.7%) |
| Total | 5,409 (100.0%) | 5,244 (100.0%) |
Families and Households in Myers Corner
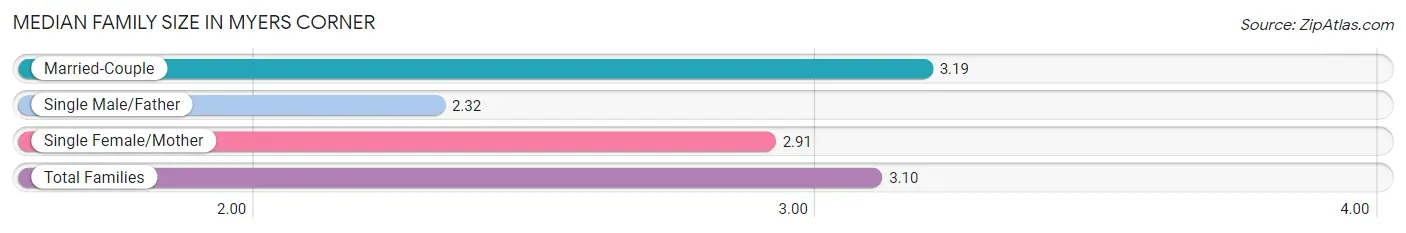
Median Family Size in Myers Corner
The median family size in Myers Corner is 3.10 persons per family, with married-couple families (2,271 | 79.6%) accounting for the largest median family size of 3.19 persons per family. On the other hand, single male/father families (191 | 6.7%) represent the smallest median family size with 2.32 persons per family.
| Family Type | # Families | Family Size |
| Married-Couple | 2,271 (79.6%) | 3.19 |
| Single Male/Father | 191 (6.7%) | 2.32 |
| Single Female/Mother | 390 (13.7%) | 2.91 |
| Total Families | 2,852 (100.0%) | 3.10 |
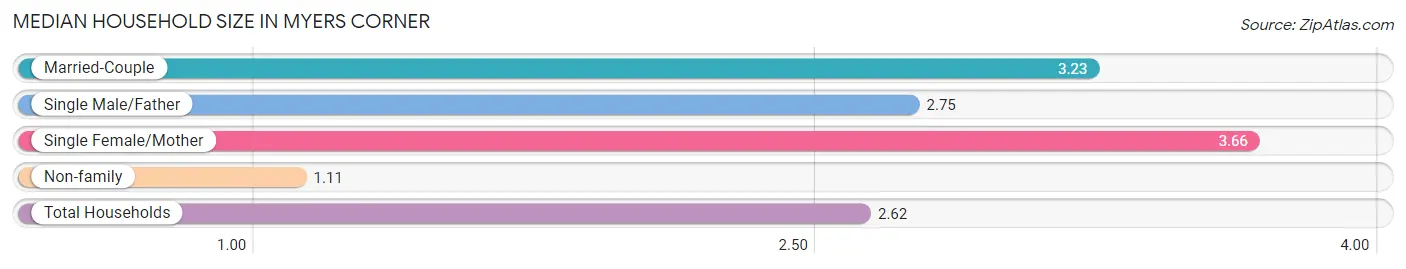
Median Household Size in Myers Corner
The median household size in Myers Corner is 2.62 persons per household, with single female/mother households (390 | 9.6%) accounting for the largest median household size of 3.66 persons per household. non-family households (1,192 | 29.5%) represent the smallest median household size with 1.11 persons per household.
| Household Type | # Households | Household Size |
| Married-Couple | 2,271 (56.2%) | 3.23 |
| Single Male/Father | 191 (4.7%) | 2.75 |
| Single Female/Mother | 390 (9.6%) | 3.66 |
| Non-family | 1,192 (29.5%) | 1.11 |
| Total Households | 4,044 (100.0%) | 2.62 |
Household Size by Marriage Status in Myers Corner
Out of a total of 4,044 households in Myers Corner, 2,852 (70.5%) are family households, while 1,192 (29.5%) are nonfamily households. The most numerous type of family households are 2-person households, comprising 1,141, and the most common type of nonfamily households are 1-person households, comprising 1,094.
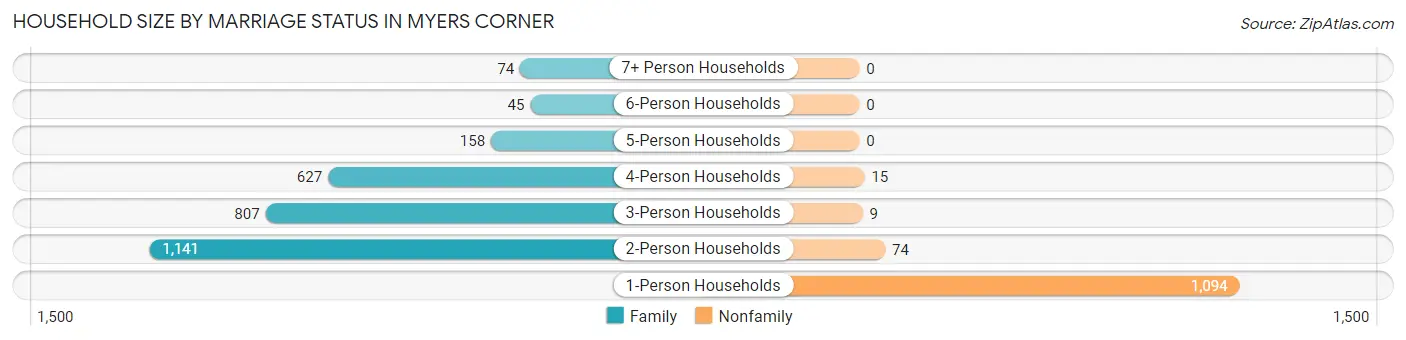
| Household Size | Family Households | Nonfamily Households |
| 1-Person Households | - | 1,094 (27.1%) |
| 2-Person Households | 1,141 (28.2%) | 74 (1.8%) |
| 3-Person Households | 807 (20.0%) | 9 (0.2%) |
| 4-Person Households | 627 (15.5%) | 15 (0.4%) |
| 5-Person Households | 158 (3.9%) | 0 (0.0%) |
| 6-Person Households | 45 (1.1%) | 0 (0.0%) |
| 7+ Person Households | 74 (1.8%) | 0 (0.0%) |
| Total | 2,852 (70.5%) | 1,192 (29.5%) |
Female Fertility in Myers Corner
Fertility by Age in Myers Corner
Average fertility rate in Myers Corner is 33.0 births per 1,000 women. Women in the age bracket of 35 to 50 years have the highest fertility rate with 58.0 births per 1,000 women. Women in the age bracket of 35 to 50 years acount for 67.6% of all women with births.
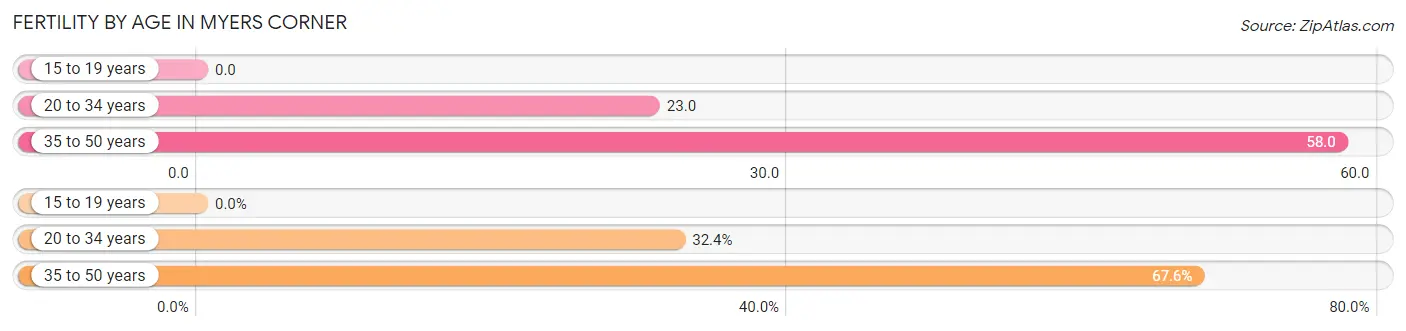
| Age Bracket | Women with Births | Births / 1,000 Women |
| 15 to 19 years | 0 (0.0%) | 0.0 |
| 20 to 34 years | 23 (32.4%) | 23.0 |
| 35 to 50 years | 48 (67.6%) | 58.0 |
| Total | 71 (100.0%) | 33.0 |
Fertility by Age by Marriage Status in Myers Corner
77.5% of women with births (71) in Myers Corner are married. The highest percentage of unmarried women with births falls into 35 to 50 years age bracket with 33.3% of them unmarried at the time of birth, while the lowest percentage of unmarried women with births belong to 20 to 34 years age bracket with 0.0% of them unmarried.
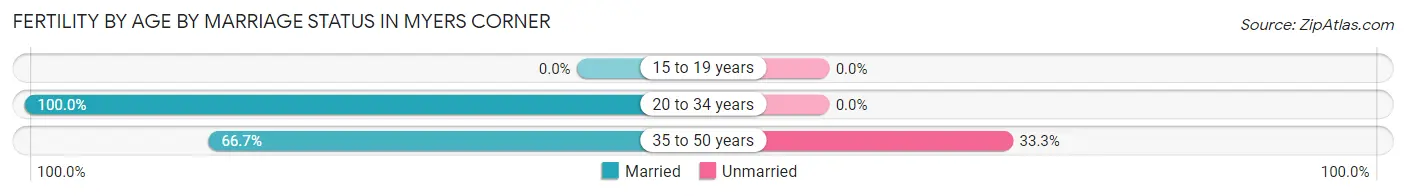
| Age Bracket | Married | Unmarried |
| 15 to 19 years | 0 (0.0%) | 0 (0.0%) |
| 20 to 34 years | 23 (100.0%) | 0 (0.0%) |
| 35 to 50 years | 32 (66.7%) | 16 (33.3%) |
| Total | 55 (77.5%) | 16 (22.5%) |
Fertility by Education in Myers Corner
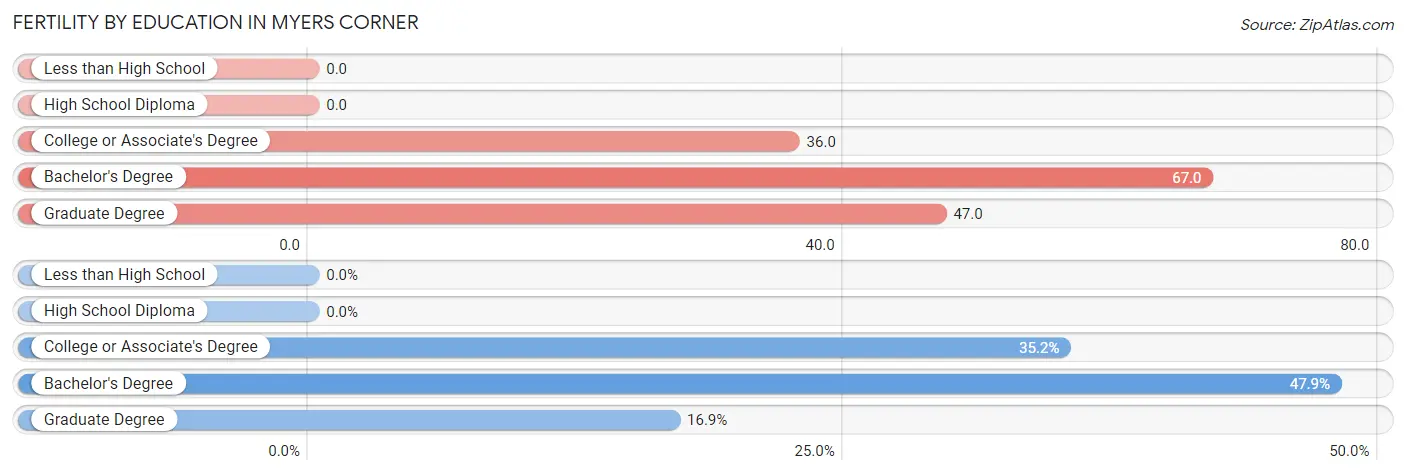
| Educational Attainment | Women with Births | Births / 1,000 Women |
| Less than High School | 0 (0.0%) | 0.0 |
| High School Diploma | 0 (0.0%) | 0.0 |
| College or Associate's Degree | 25 (35.2%) | 36.0 |
| Bachelor's Degree | 34 (47.9%) | 67.0 |
| Graduate Degree | 12 (16.9%) | 47.0 |
| Total | 71 (100.0%) | 33.0 |
Fertility by Education by Marriage Status in Myers Corner
22.5% of women with births in Myers Corner are unmarried. Women with the educational attainment of bachelor's degree are most likely to be married with 100.0% of them married at childbirth, while women with the educational attainment of college or associate's degree are least likely to be married with 64.0% of them unmarried at childbirth.
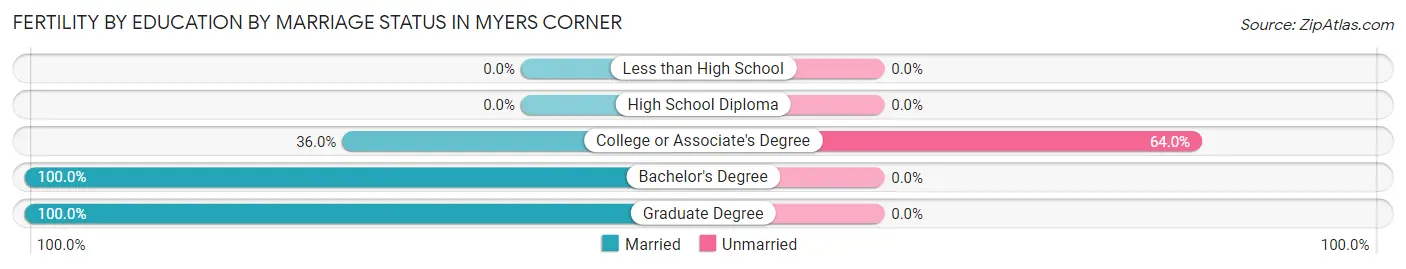
| Educational Attainment | Married | Unmarried |
| Less than High School | 0 (0.0%) | 0 (0.0%) |
| High School Diploma | 0 (0.0%) | 0 (0.0%) |
| College or Associate's Degree | 9 (36.0%) | 16 (64.0%) |
| Bachelor's Degree | 34 (100.0%) | 0 (0.0%) |
| Graduate Degree | 12 (100.0%) | 0 (0.0%) |
| Total | 55 (77.5%) | 16 (22.5%) |
Employment Characteristics in Myers Corner
Employment by Class of Employer in Myers Corner
Among the 5,830 employed individuals in Myers Corner, private company employees (4,151 | 71.2%), not-for-profit organizations (519 | 8.9%), and local government employees (489 | 8.4%) make up the most common classes of employment.
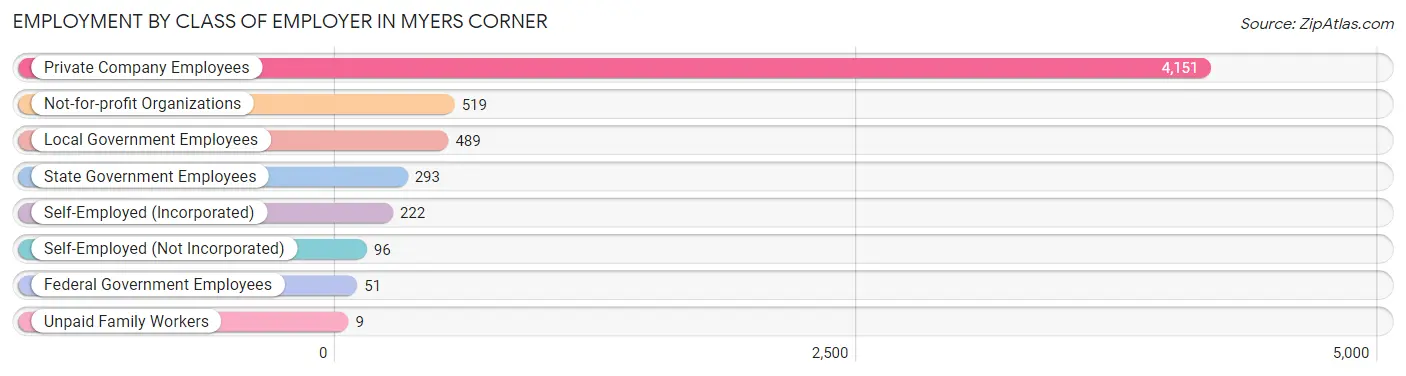
| Employer Class | # Employees | % Employees |
| Private Company Employees | 4,151 | 71.2% |
| Self-Employed (Incorporated) | 222 | 3.8% |
| Self-Employed (Not Incorporated) | 96 | 1.7% |
| Not-for-profit Organizations | 519 | 8.9% |
| Local Government Employees | 489 | 8.4% |
| State Government Employees | 293 | 5.0% |
| Federal Government Employees | 51 | 0.9% |
| Unpaid Family Workers | 9 | 0.2% |
| Total | 5,830 | 100.0% |
Employment Status by Age in Myers Corner
According to the labor force statistics for Myers Corner, out of the total population over 16 years of age (9,075), 69.2% or 6,280 individuals are in the labor force, with 4.0% or 251 of them unemployed. The age group with the highest labor force participation rate is 25 to 29 years, with 99.9% or 753 individuals in the labor force. Within the labor force, the 35 to 44 years age range has the highest percentage of unemployed individuals, with 10.2% or 79 of them being unemployed.
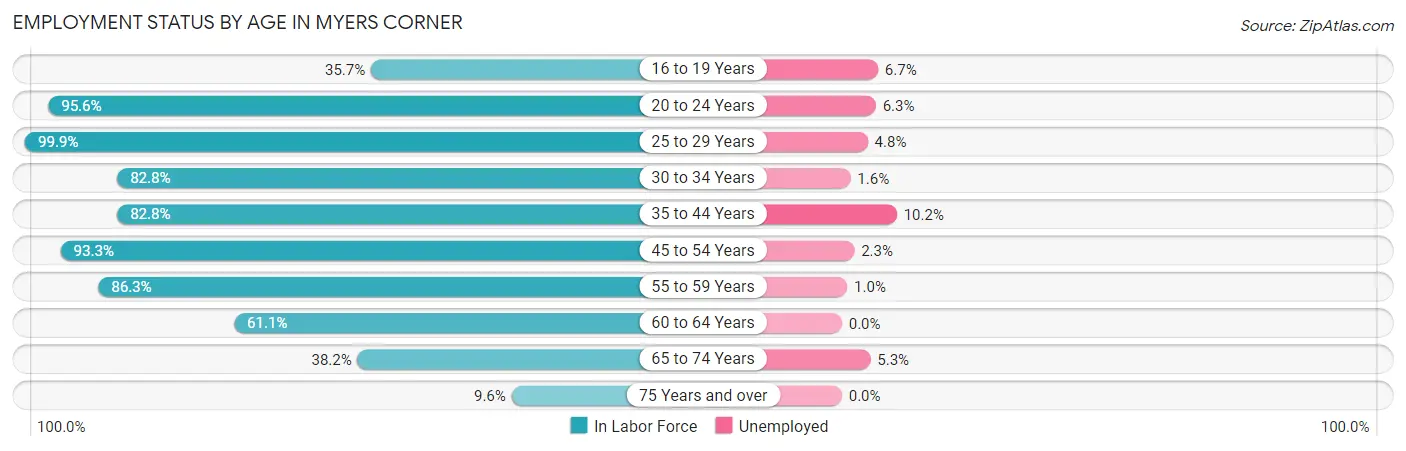
| Age Bracket | In Labor Force | Unemployed |
| 16 to 19 Years | 150 (35.7%) | 10 (6.7%) |
| 20 to 24 Years | 725 (95.6%) | 46 (6.3%) |
| 25 to 29 Years | 753 (99.9%) | 36 (4.8%) |
| 30 to 34 Years | 384 (82.8%) | 6 (1.6%) |
| 35 to 44 Years | 775 (82.8%) | 79 (10.2%) |
| 45 to 54 Years | 1,507 (93.3%) | 35 (2.3%) |
| 55 to 59 Years | 825 (86.3%) | 8 (1.0%) |
| 60 to 64 Years | 528 (61.1%) | 0 (0.0%) |
| 65 to 74 Years | 547 (38.2%) | 29 (5.3%) |
| 75 Years and over | 84 (9.6%) | 0 (0.0%) |
| Total | 6,280 (69.2%) | 251 (4.0%) |
Employment Status by Educational Attainment in Myers Corner
According to labor force statistics for Myers Corner, 85.4% of individuals (4,773) out of the total population between 25 and 64 years of age (5,589) are in the labor force, with 3.4% or 162 of them being unemployed. The group with the highest labor force participation rate are those with the educational attainment of bachelor's degree or higher, with 91.1% or 2,016 individuals in the labor force. Within the labor force, individuals with high school diploma education have the highest percentage of unemployment, with 7.9% or 79 of them being unemployed.
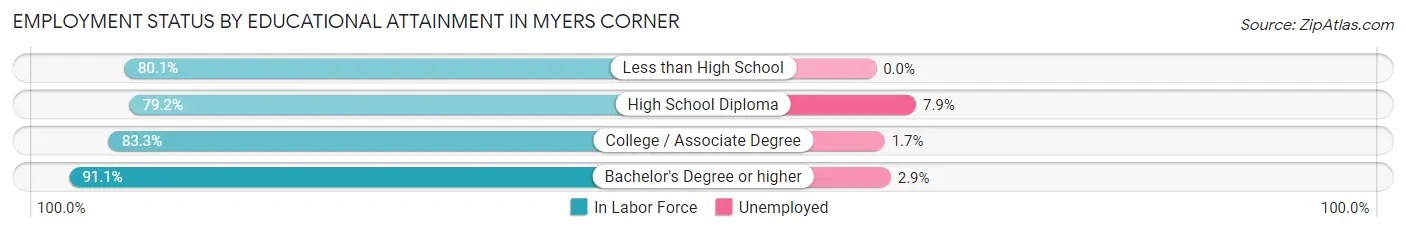
| Educational Attainment | In Labor Force | Unemployed |
| Less than High School | 169 (80.1%) | 0 (0.0%) |
| High School Diploma | 995 (79.2%) | 99 (7.9%) |
| College / Associate Degree | 1,590 (83.3%) | 32 (1.7%) |
| Bachelor's Degree or higher | 2,016 (91.1%) | 64 (2.9%) |
| Total | 4,773 (85.4%) | 190 (3.4%) |
Employment Occupations by Sex in Myers Corner
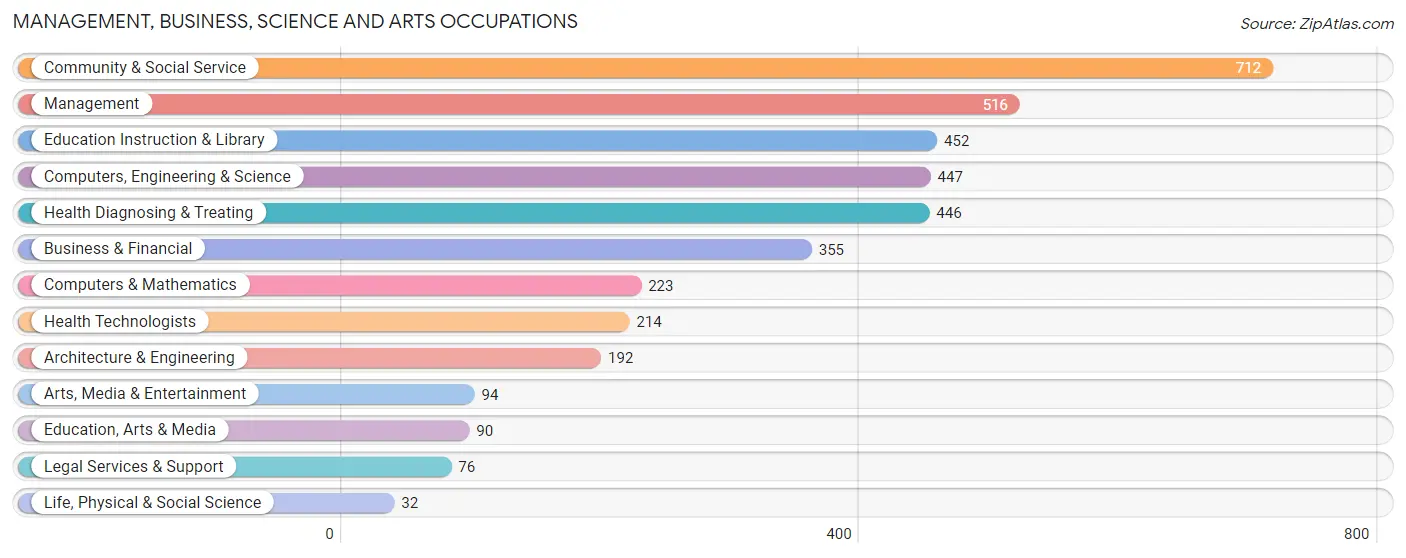
Management, Business, Science and Arts Occupations
The most common Management, Business, Science and Arts occupations in Myers Corner are Community & Social Service (712 | 11.8%), Management (516 | 8.6%), Education Instruction & Library (452 | 7.5%), Computers, Engineering & Science (447 | 7.4%), and Health Diagnosing & Treating (446 | 7.4%).
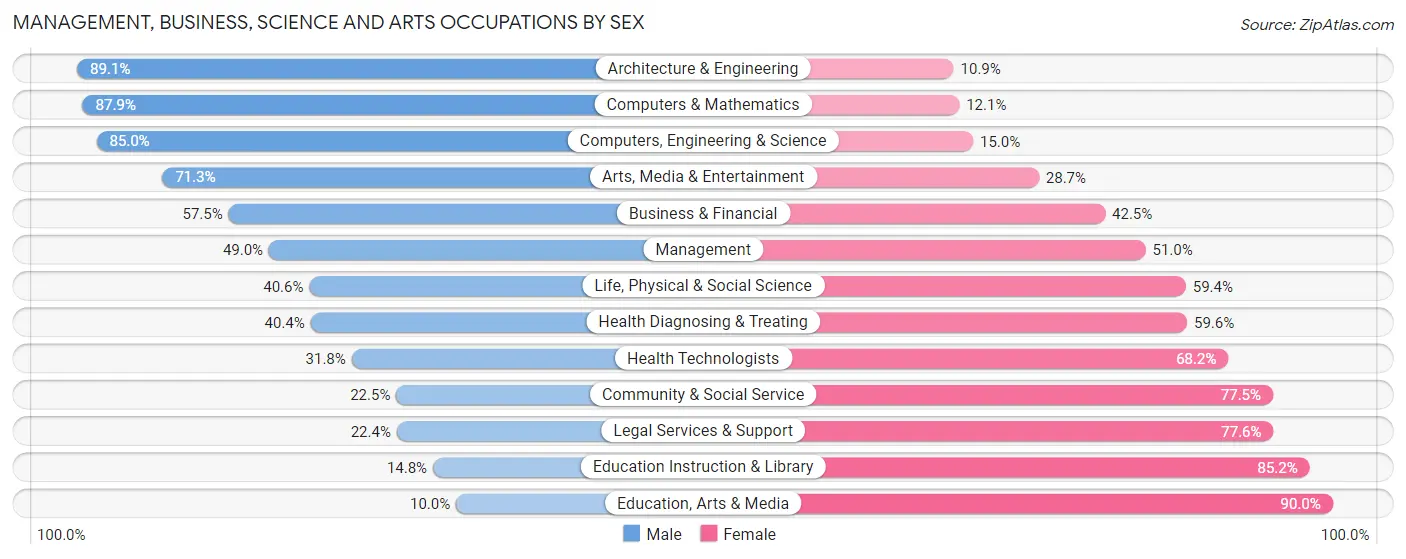
Management, Business, Science and Arts Occupations by Sex
Within the Management, Business, Science and Arts occupations in Myers Corner, the most male-oriented occupations are Architecture & Engineering (89.1%), Computers & Mathematics (87.9%), and Computers, Engineering & Science (85.0%), while the most female-oriented occupations are Education, Arts & Media (90.0%), Education Instruction & Library (85.2%), and Legal Services & Support (77.6%).
| Occupation | Male | Female |
| Management | 253 (49.0%) | 263 (51.0%) |
| Business & Financial | 204 (57.5%) | 151 (42.5%) |
| Computers, Engineering & Science | 380 (85.0%) | 67 (15.0%) |
| Computers & Mathematics | 196 (87.9%) | 27 (12.1%) |
| Architecture & Engineering | 171 (89.1%) | 21 (10.9%) |
| Life, Physical & Social Science | 13 (40.6%) | 19 (59.4%) |
| Community & Social Service | 160 (22.5%) | 552 (77.5%) |
| Education, Arts & Media | 9 (10.0%) | 81 (90.0%) |
| Legal Services & Support | 17 (22.4%) | 59 (77.6%) |
| Education Instruction & Library | 67 (14.8%) | 385 (85.2%) |
| Arts, Media & Entertainment | 67 (71.3%) | 27 (28.7%) |
| Health Diagnosing & Treating | 180 (40.4%) | 266 (59.6%) |
| Health Technologists | 68 (31.8%) | 146 (68.2%) |
| Total (Category) | 1,177 (47.5%) | 1,299 (52.5%) |
| Total (Overall) | 3,158 (52.4%) | 2,870 (47.6%) |
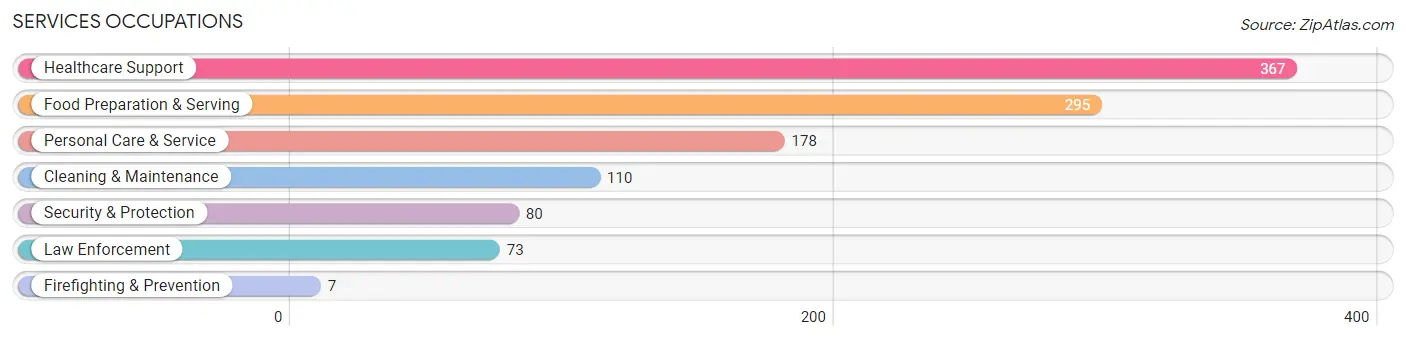
Services Occupations
The most common Services occupations in Myers Corner are Healthcare Support (367 | 6.1%), Food Preparation & Serving (295 | 4.9%), Personal Care & Service (178 | 2.9%), Cleaning & Maintenance (110 | 1.8%), and Security & Protection (80 | 1.3%).
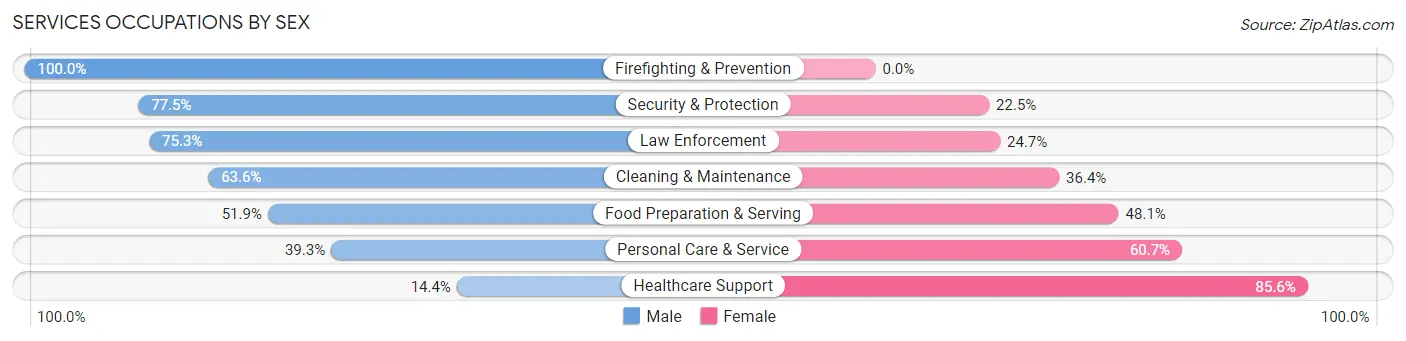
Services Occupations by Sex
Within the Services occupations in Myers Corner, the most male-oriented occupations are Firefighting & Prevention (100.0%), Security & Protection (77.5%), and Law Enforcement (75.3%), while the most female-oriented occupations are Healthcare Support (85.6%), Personal Care & Service (60.7%), and Food Preparation & Serving (48.1%).
| Occupation | Male | Female |
| Healthcare Support | 53 (14.4%) | 314 (85.6%) |
| Security & Protection | 62 (77.5%) | 18 (22.5%) |
| Firefighting & Prevention | 7 (100.0%) | 0 (0.0%) |
| Law Enforcement | 55 (75.3%) | 18 (24.7%) |
| Food Preparation & Serving | 153 (51.9%) | 142 (48.1%) |
| Cleaning & Maintenance | 70 (63.6%) | 40 (36.4%) |
| Personal Care & Service | 70 (39.3%) | 108 (60.7%) |
| Total (Category) | 408 (39.6%) | 622 (60.4%) |
| Total (Overall) | 3,158 (52.4%) | 2,870 (47.6%) |
Sales and Office Occupations
The most common Sales and Office occupations in Myers Corner are Office & Administration (745 | 12.4%), and Sales & Related (655 | 10.9%).
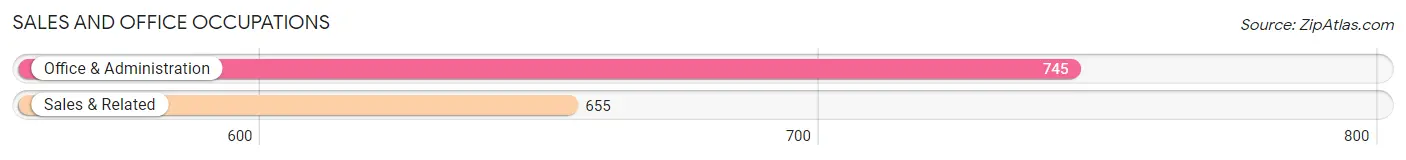
Sales and Office Occupations by Sex
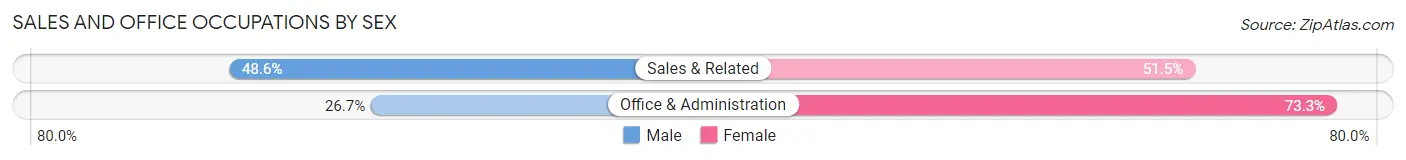
| Occupation | Male | Female |
| Sales & Related | 318 (48.5%) | 337 (51.4%) |
| Office & Administration | 199 (26.7%) | 546 (73.3%) |
| Total (Category) | 517 (36.9%) | 883 (63.1%) |
| Total (Overall) | 3,158 (52.4%) | 2,870 (47.6%) |
Natural Resources, Construction and Maintenance Occupations
The most common Natural Resources, Construction and Maintenance occupations in Myers Corner are Installation, Maintenance & Repair (396 | 6.6%), Construction & Extraction (174 | 2.9%), and Farming, Fishing & Forestry (10 | 0.2%).
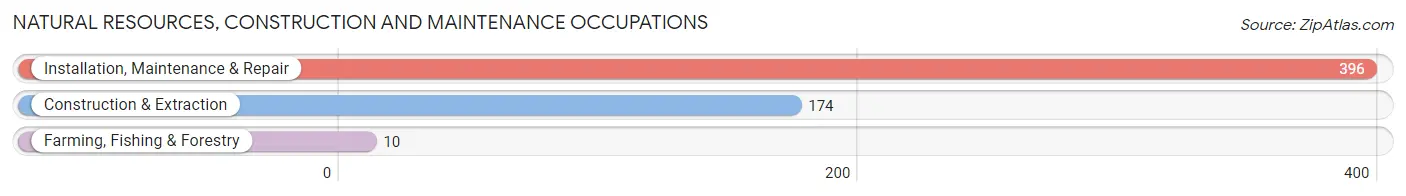
Natural Resources, Construction and Maintenance Occupations by Sex
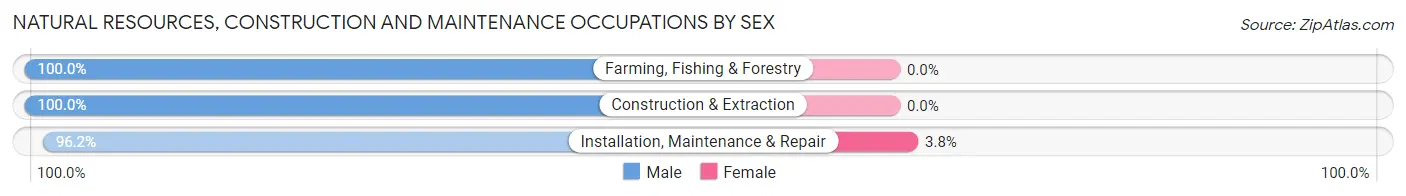
| Occupation | Male | Female |
| Farming, Fishing & Forestry | 10 (100.0%) | 0 (0.0%) |
| Construction & Extraction | 174 (100.0%) | 0 (0.0%) |
| Installation, Maintenance & Repair | 381 (96.2%) | 15 (3.8%) |
| Total (Category) | 565 (97.4%) | 15 (2.6%) |
| Total (Overall) | 3,158 (52.4%) | 2,870 (47.6%) |
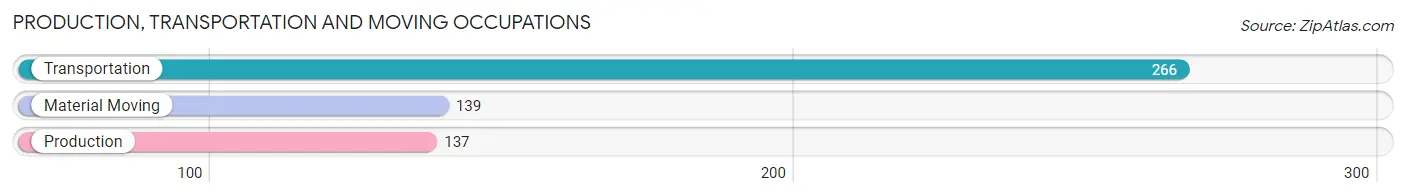
Production, Transportation and Moving Occupations
The most common Production, Transportation and Moving occupations in Myers Corner are Transportation (266 | 4.4%), Material Moving (139 | 2.3%), and Production (137 | 2.3%).
Production, Transportation and Moving Occupations by Sex
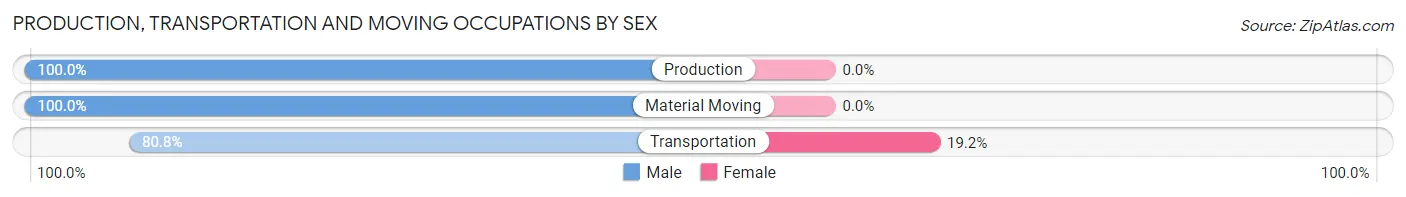
| Occupation | Male | Female |
| Production | 137 (100.0%) | 0 (0.0%) |
| Transportation | 215 (80.8%) | 51 (19.2%) |
| Material Moving | 139 (100.0%) | 0 (0.0%) |
| Total (Category) | 491 (90.6%) | 51 (9.4%) |
| Total (Overall) | 3,158 (52.4%) | 2,870 (47.6%) |
Employment Industries by Sex in Myers Corner
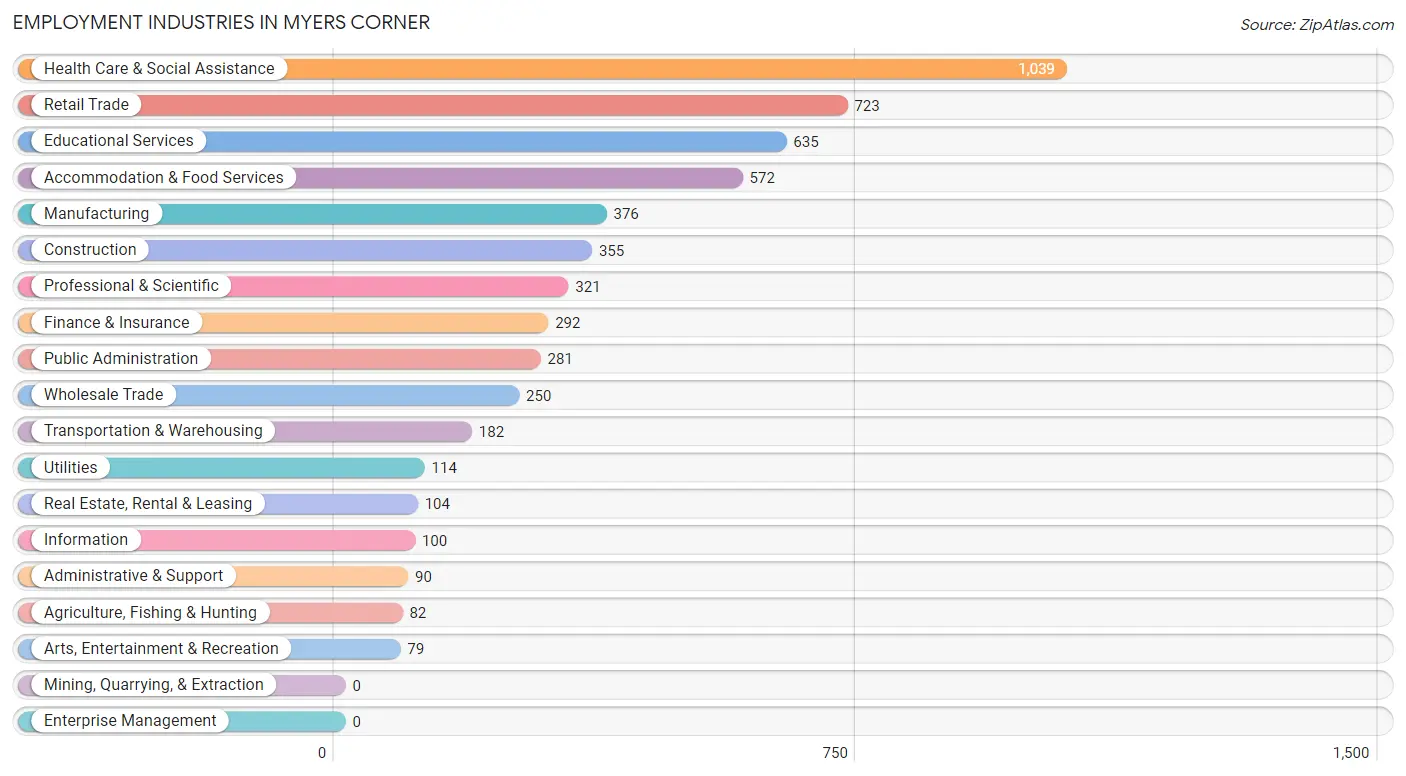
Employment Industries in Myers Corner
The major employment industries in Myers Corner include Health Care & Social Assistance (1,039 | 17.2%), Retail Trade (723 | 12.0%), Educational Services (635 | 10.5%), Accommodation & Food Services (572 | 9.5%), and Manufacturing (376 | 6.2%).
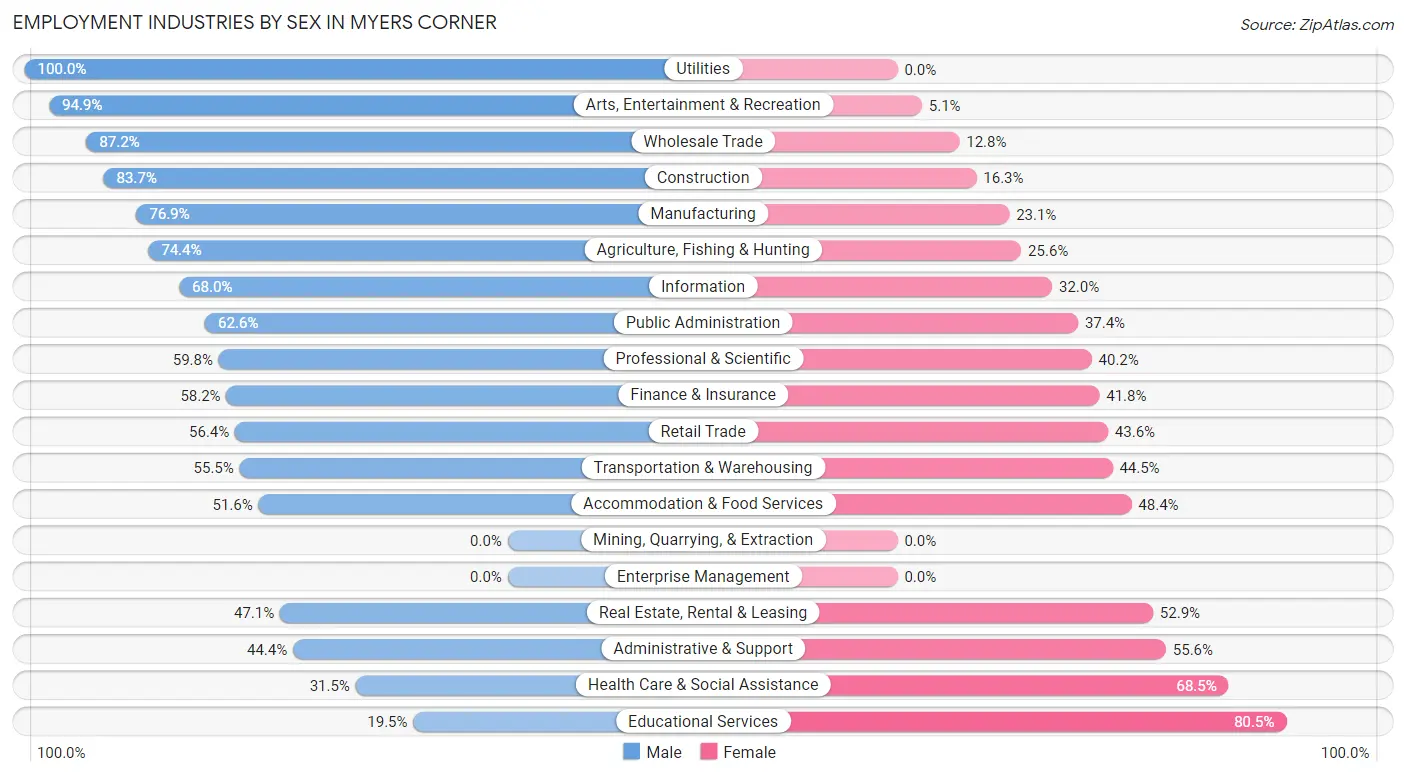
Employment Industries by Sex in Myers Corner
The Myers Corner industries that see more men than women are Utilities (100.0%), Arts, Entertainment & Recreation (94.9%), and Wholesale Trade (87.2%), whereas the industries that tend to have a higher number of women are Educational Services (80.5%), Health Care & Social Assistance (68.5%), and Administrative & Support (55.6%).
| Industry | Male | Female |
| Agriculture, Fishing & Hunting | 61 (74.4%) | 21 (25.6%) |
| Mining, Quarrying, & Extraction | 0 (0.0%) | 0 (0.0%) |
| Construction | 297 (83.7%) | 58 (16.3%) |
| Manufacturing | 289 (76.9%) | 87 (23.1%) |
| Wholesale Trade | 218 (87.2%) | 32 (12.8%) |
| Retail Trade | 408 (56.4%) | 315 (43.6%) |
| Transportation & Warehousing | 101 (55.5%) | 81 (44.5%) |
| Utilities | 114 (100.0%) | 0 (0.0%) |
| Information | 68 (68.0%) | 32 (32.0%) |
| Finance & Insurance | 170 (58.2%) | 122 (41.8%) |
| Real Estate, Rental & Leasing | 49 (47.1%) | 55 (52.9%) |
| Professional & Scientific | 192 (59.8%) | 129 (40.2%) |
| Enterprise Management | 0 (0.0%) | 0 (0.0%) |
| Administrative & Support | 40 (44.4%) | 50 (55.6%) |
| Educational Services | 124 (19.5%) | 511 (80.5%) |
| Health Care & Social Assistance | 327 (31.5%) | 712 (68.5%) |
| Arts, Entertainment & Recreation | 75 (94.9%) | 4 (5.1%) |
| Accommodation & Food Services | 295 (51.6%) | 277 (48.4%) |
| Public Administration | 176 (62.6%) | 105 (37.4%) |
| Total | 3,158 (52.4%) | 2,870 (47.6%) |
Education in Myers Corner
School Enrollment in Myers Corner
The most common levels of schooling among the 2,164 students in Myers Corner are high school (637 | 29.4%), college / undergraduate (526 | 24.3%), and middle school (400 | 18.5%).
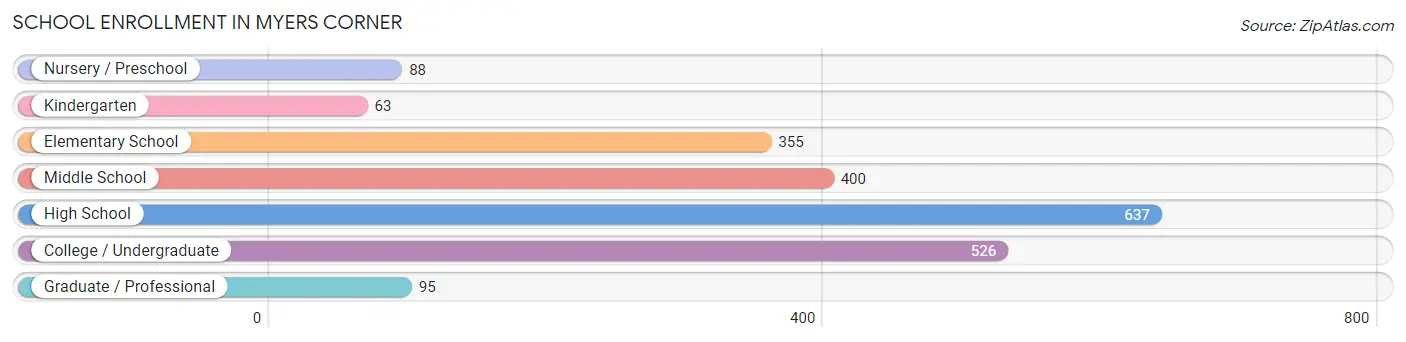
| School Level | # Students | % Students |
| Nursery / Preschool | 88 | 4.1% |
| Kindergarten | 63 | 2.9% |
| Elementary School | 355 | 16.4% |
| Middle School | 400 | 18.5% |
| High School | 637 | 29.4% |
| College / Undergraduate | 526 | 24.3% |
| Graduate / Professional | 95 | 4.4% |
| Total | 2,164 | 100.0% |
School Enrollment by Age by Funding Source in Myers Corner
Out of a total of 2,164 students who are enrolled in schools in Myers Corner, 489 (22.6%) attend a private institution, while the remaining 1,675 (77.4%) are enrolled in public schools. The age group of 3 to 4 year olds has the highest likelihood of being enrolled in private schools, with 67 (88.2% in the age bracket) enrolled. Conversely, the age group of 15 to 17 year olds has the lowest likelihood of being enrolled in a private school, with 443 (95.1% in the age bracket) attending a public institution.
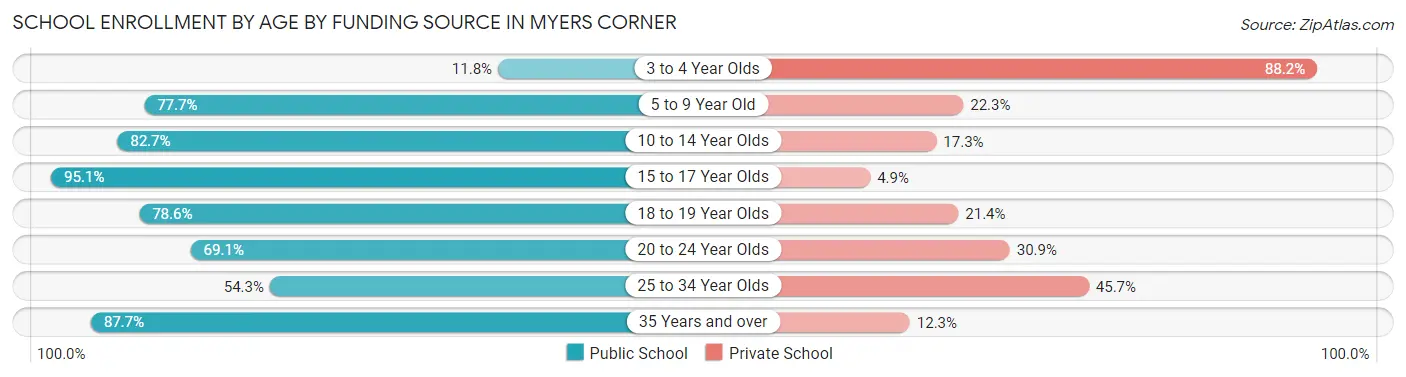
| Age Bracket | Public School | Private School |
| 3 to 4 Year Olds | 9 (11.8%) | 67 (88.2%) |
| 5 to 9 Year Old | 314 (77.7%) | 90 (22.3%) |
| 10 to 14 Year Olds | 460 (82.7%) | 96 (17.3%) |
| 15 to 17 Year Olds | 443 (95.1%) | 23 (4.9%) |
| 18 to 19 Year Olds | 81 (78.6%) | 22 (21.4%) |
| 20 to 24 Year Olds | 192 (69.1%) | 86 (30.9%) |
| 25 to 34 Year Olds | 113 (54.3%) | 95 (45.7%) |
| 35 Years and over | 64 (87.7%) | 9 (12.3%) |
| Total | 1,675 (77.4%) | 489 (22.6%) |
Educational Attainment by Field of Study in Myers Corner
Education (574 | 16.8%), business (535 | 15.7%), science & technology (415 | 12.1%), engineering (281 | 8.2%), and literature & languages (242 | 7.1%) are the most common fields of study among 3,418 individuals in Myers Corner who have obtained a bachelor's degree or higher.
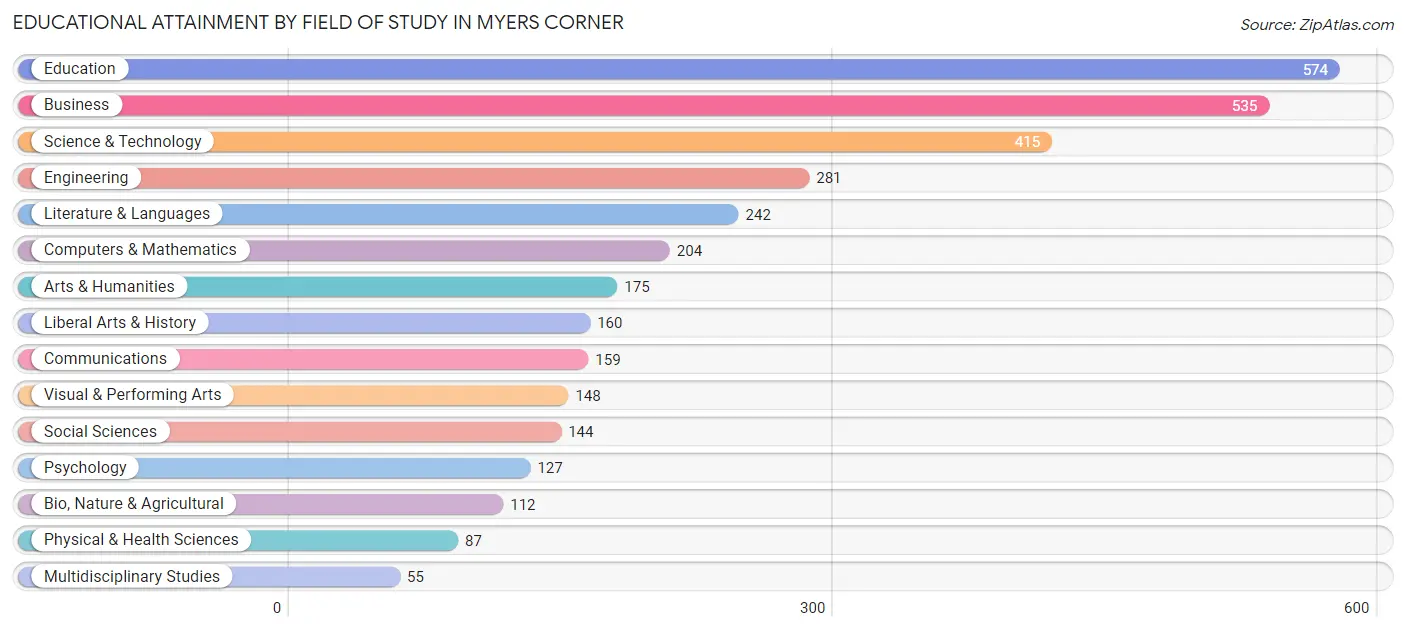
| Field of Study | # Graduates | % Graduates |
| Computers & Mathematics | 204 | 6.0% |
| Bio, Nature & Agricultural | 112 | 3.3% |
| Physical & Health Sciences | 87 | 2.5% |
| Psychology | 127 | 3.7% |
| Social Sciences | 144 | 4.2% |
| Engineering | 281 | 8.2% |
| Multidisciplinary Studies | 55 | 1.6% |
| Science & Technology | 415 | 12.1% |
| Business | 535 | 15.7% |
| Education | 574 | 16.8% |
| Literature & Languages | 242 | 7.1% |
| Liberal Arts & History | 160 | 4.7% |
| Visual & Performing Arts | 148 | 4.3% |
| Communications | 159 | 4.6% |
| Arts & Humanities | 175 | 5.1% |
| Total | 3,418 | 100.0% |
Transportation & Commute in Myers Corner
Vehicle Availability by Sex in Myers Corner
The most prevalent vehicle ownership categories in Myers Corner are males with 2 vehicles (1,091, accounting for 35.6%) and females with 2 vehicles (867, making up 39.5%).
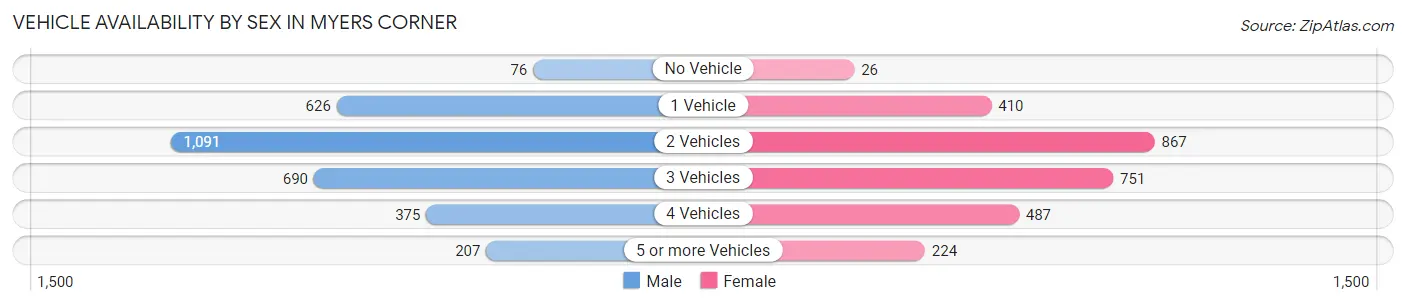
| Vehicles Available | Male | Female |
| No Vehicle | 76 (2.5%) | 26 (0.9%) |
| 1 Vehicle | 626 (20.4%) | 410 (14.8%) |
| 2 Vehicles | 1,091 (35.6%) | 867 (31.4%) |
| 3 Vehicles | 690 (22.5%) | 751 (27.2%) |
| 4 Vehicles | 375 (12.2%) | 487 (17.6%) |
| 5 or more Vehicles | 207 (6.8%) | 224 (8.1%) |
| Total | 3,065 (100.0%) | 2,765 (100.0%) |
Commute Time in Myers Corner
The most frequently occuring commute durations in Myers Corner are 10 to 14 minutes (684 commuters, 13.7%), 20 to 24 minutes (682 commuters, 13.7%), and 30 to 34 minutes (642 commuters, 12.9%).
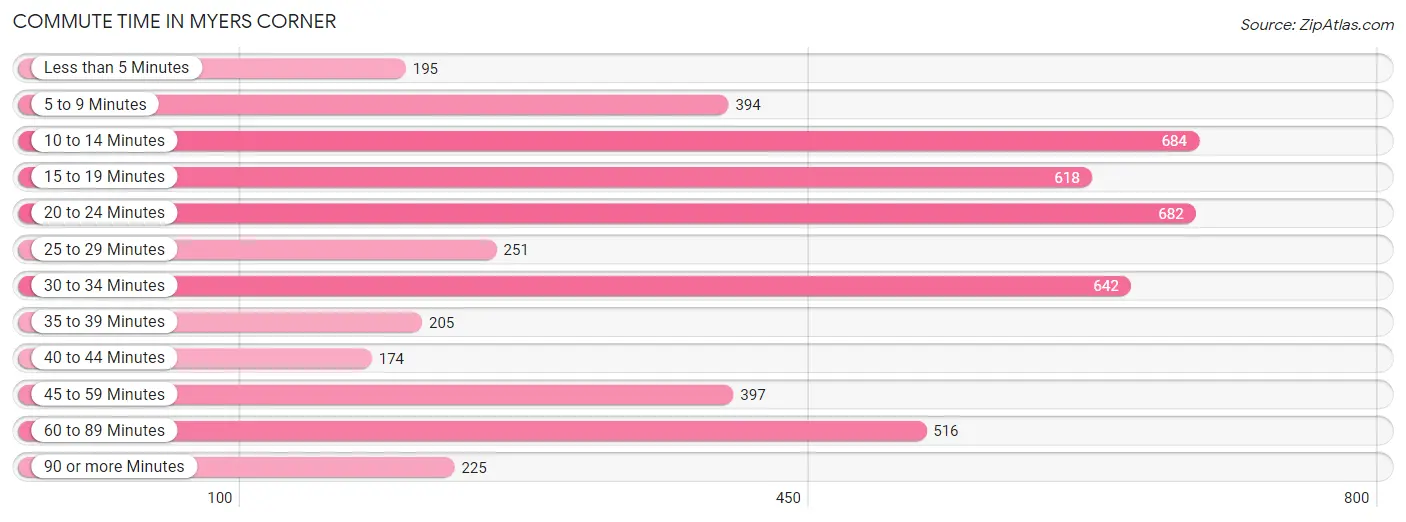
| Commute Time | # Commuters | % Commuters |
| Less than 5 Minutes | 195 | 3.9% |
| 5 to 9 Minutes | 394 | 7.9% |
| 10 to 14 Minutes | 684 | 13.7% |
| 15 to 19 Minutes | 618 | 12.4% |
| 20 to 24 Minutes | 682 | 13.7% |
| 25 to 29 Minutes | 251 | 5.0% |
| 30 to 34 Minutes | 642 | 12.9% |
| 35 to 39 Minutes | 205 | 4.1% |
| 40 to 44 Minutes | 174 | 3.5% |
| 45 to 59 Minutes | 397 | 8.0% |
| 60 to 89 Minutes | 516 | 10.4% |
| 90 or more Minutes | 225 | 4.5% |
Commute Time by Sex in Myers Corner
The most common commute times in Myers Corner are 60 to 89 minutes (366 commuters, 13.7%) for males and 20 to 24 minutes (377 commuters, 16.3%) for females.
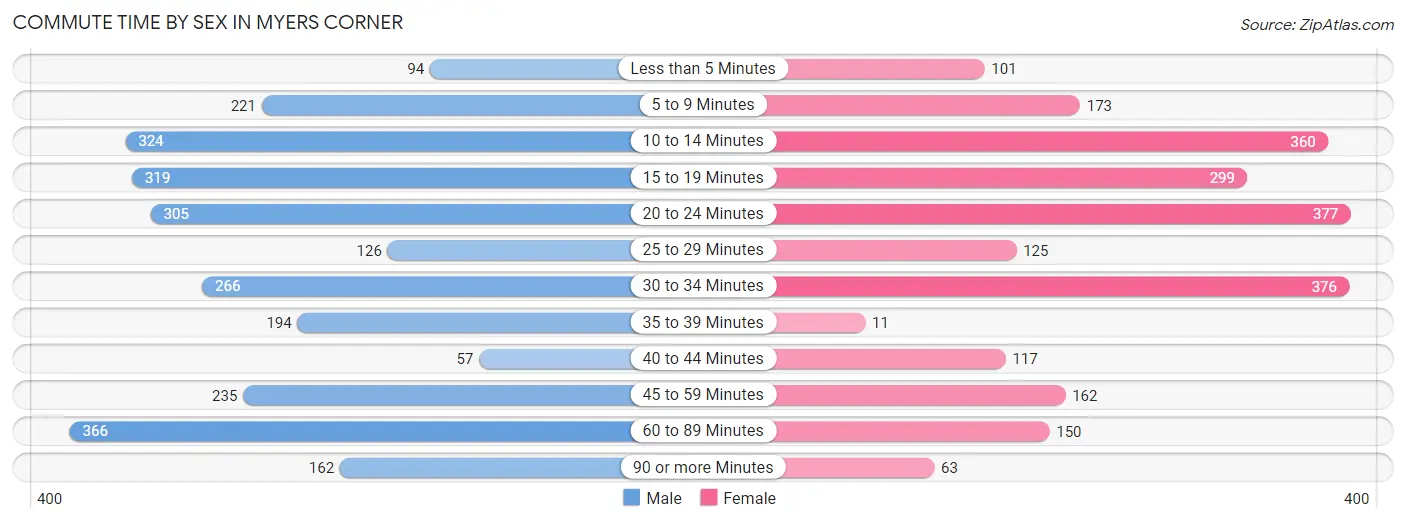
| Commute Time | Male | Female |
| Less than 5 Minutes | 94 (3.5%) | 101 (4.4%) |
| 5 to 9 Minutes | 221 (8.3%) | 173 (7.5%) |
| 10 to 14 Minutes | 324 (12.1%) | 360 (15.6%) |
| 15 to 19 Minutes | 319 (11.9%) | 299 (12.9%) |
| 20 to 24 Minutes | 305 (11.4%) | 377 (16.3%) |
| 25 to 29 Minutes | 126 (4.7%) | 125 (5.4%) |
| 30 to 34 Minutes | 266 (10.0%) | 376 (16.3%) |
| 35 to 39 Minutes | 194 (7.3%) | 11 (0.5%) |
| 40 to 44 Minutes | 57 (2.1%) | 117 (5.1%) |
| 45 to 59 Minutes | 235 (8.8%) | 162 (7.0%) |
| 60 to 89 Minutes | 366 (13.7%) | 150 (6.5%) |
| 90 or more Minutes | 162 (6.1%) | 63 (2.7%) |
Time of Departure to Work by Sex in Myers Corner
The most frequent times of departure to work in Myers Corner are 4:00 PM to 11:59 PM (416, 15.6%) for males and 8:00 AM to 8:29 AM (455, 19.7%) for females.
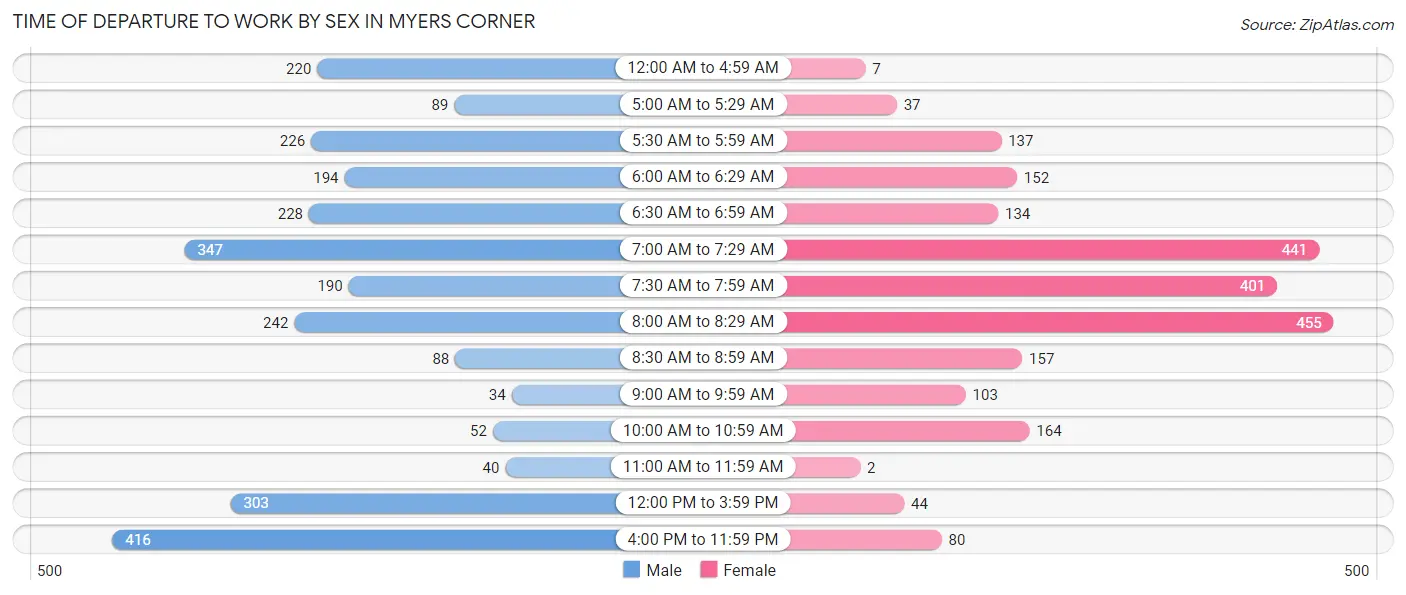
| Time of Departure | Male | Female |
| 12:00 AM to 4:59 AM | 220 (8.2%) | 7 (0.3%) |
| 5:00 AM to 5:29 AM | 89 (3.3%) | 37 (1.6%) |
| 5:30 AM to 5:59 AM | 226 (8.5%) | 137 (5.9%) |
| 6:00 AM to 6:29 AM | 194 (7.3%) | 152 (6.6%) |
| 6:30 AM to 6:59 AM | 228 (8.5%) | 134 (5.8%) |
| 7:00 AM to 7:29 AM | 347 (13.0%) | 441 (19.1%) |
| 7:30 AM to 7:59 AM | 190 (7.1%) | 401 (17.3%) |
| 8:00 AM to 8:29 AM | 242 (9.1%) | 455 (19.7%) |
| 8:30 AM to 8:59 AM | 88 (3.3%) | 157 (6.8%) |
| 9:00 AM to 9:59 AM | 34 (1.3%) | 103 (4.4%) |
| 10:00 AM to 10:59 AM | 52 (1.9%) | 164 (7.1%) |
| 11:00 AM to 11:59 AM | 40 (1.5%) | 2 (0.1%) |
| 12:00 PM to 3:59 PM | 303 (11.4%) | 44 (1.9%) |
| 4:00 PM to 11:59 PM | 416 (15.6%) | 80 (3.5%) |
| Total | 2,669 (100.0%) | 2,314 (100.0%) |
Housing Occupancy in Myers Corner
Occupancy by Ownership in Myers Corner
Of the total 4,044 dwellings in Myers Corner, owner-occupied units account for 3,551 (87.8%), while renter-occupied units make up 493 (12.2%).
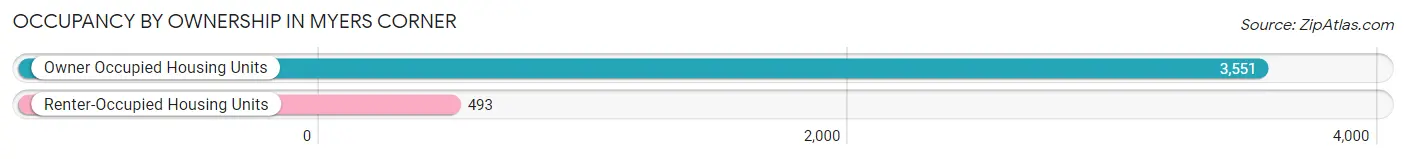
| Occupancy | # Housing Units | % Housing Units |
| Owner Occupied Housing Units | 3,551 | 87.8% |
| Renter-Occupied Housing Units | 493 | 12.2% |
| Total Occupied Housing Units | 4,044 | 100.0% |
Occupancy by Household Size in Myers Corner
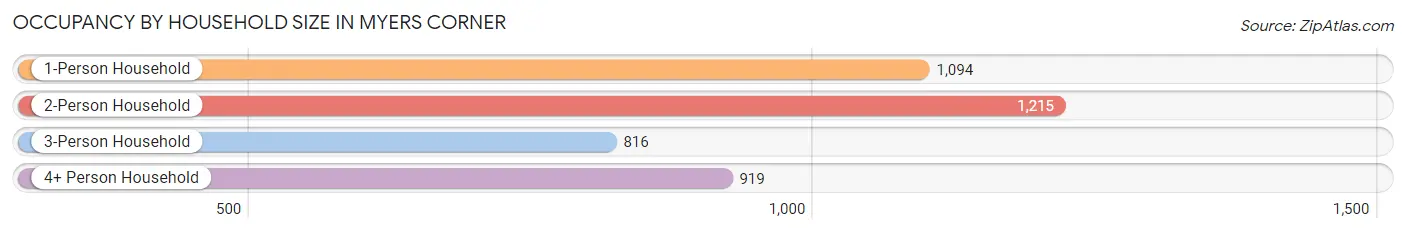
| Household Size | # Housing Units | % Housing Units |
| 1-Person Household | 1,094 | 27.1% |
| 2-Person Household | 1,215 | 30.0% |
| 3-Person Household | 816 | 20.2% |
| 4+ Person Household | 919 | 22.7% |
| Total Housing Units | 4,044 | 100.0% |
Occupancy by Ownership by Household Size in Myers Corner
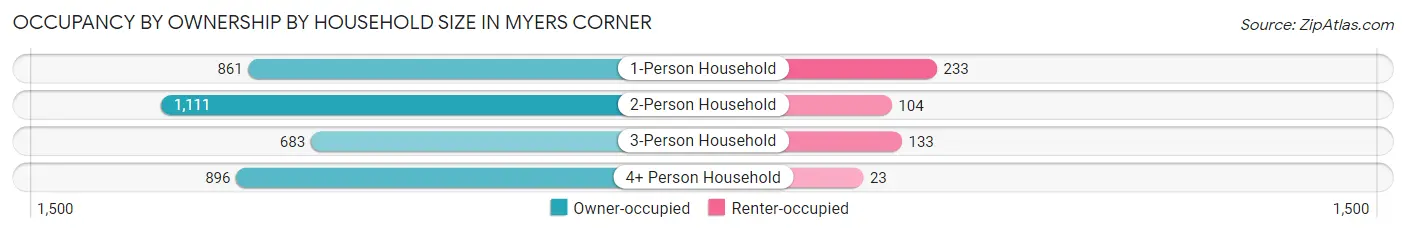
| Household Size | Owner-occupied | Renter-occupied |
| 1-Person Household | 861 (78.7%) | 233 (21.3%) |
| 2-Person Household | 1,111 (91.4%) | 104 (8.6%) |
| 3-Person Household | 683 (83.7%) | 133 (16.3%) |
| 4+ Person Household | 896 (97.5%) | 23 (2.5%) |
| Total Housing Units | 3,551 (87.8%) | 493 (12.2%) |
Occupancy by Educational Attainment in Myers Corner
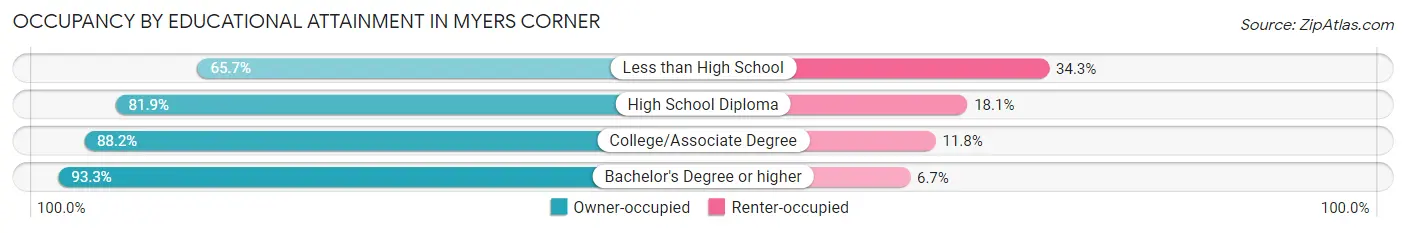
| Household Size | Owner-occupied | Renter-occupied |
| Less than High School | 92 (65.7%) | 48 (34.3%) |
| High School Diploma | 803 (81.9%) | 177 (18.1%) |
| College/Associate Degree | 1,252 (88.2%) | 167 (11.8%) |
| Bachelor's Degree or higher | 1,404 (93.3%) | 101 (6.7%) |
Occupancy by Age of Householder in Myers Corner
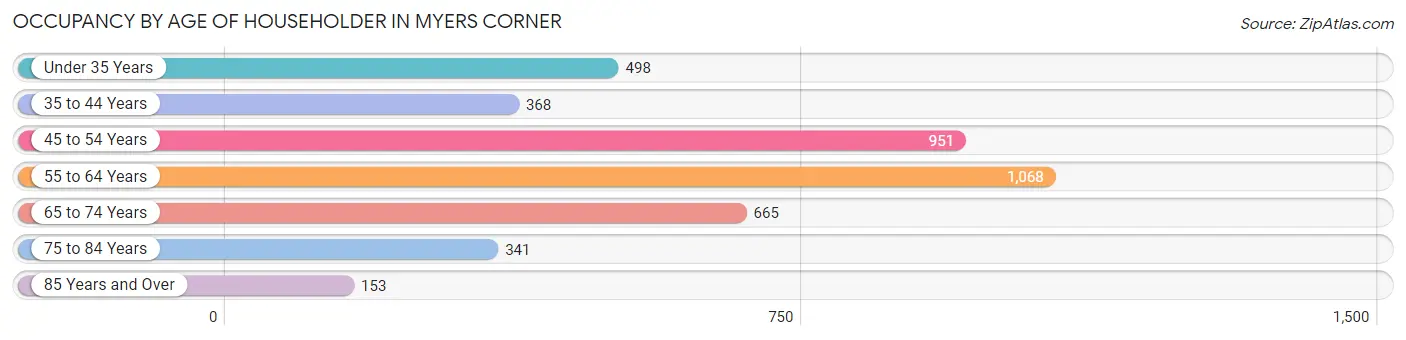
| Age Bracket | # Households | % Households |
| Under 35 Years | 498 | 12.3% |
| 35 to 44 Years | 368 | 9.1% |
| 45 to 54 Years | 951 | 23.5% |
| 55 to 64 Years | 1,068 | 26.4% |
| 65 to 74 Years | 665 | 16.4% |
| 75 to 84 Years | 341 | 8.4% |
| 85 Years and Over | 153 | 3.8% |
| Total | 4,044 | 100.0% |
Housing Finances in Myers Corner
Median Income by Occupancy in Myers Corner
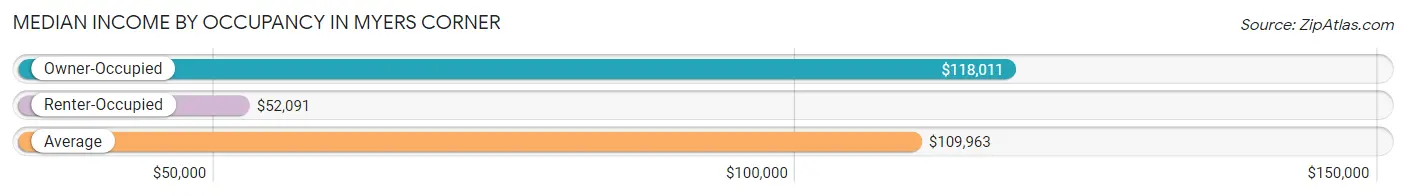
| Occupancy Type | # Households | Median Income |
| Owner-Occupied | 3,551 (87.8%) | $118,011 |
| Renter-Occupied | 493 (12.2%) | $52,091 |
| Average | 4,044 (100.0%) | $109,963 |
Occupancy by Householder Income Bracket in Myers Corner
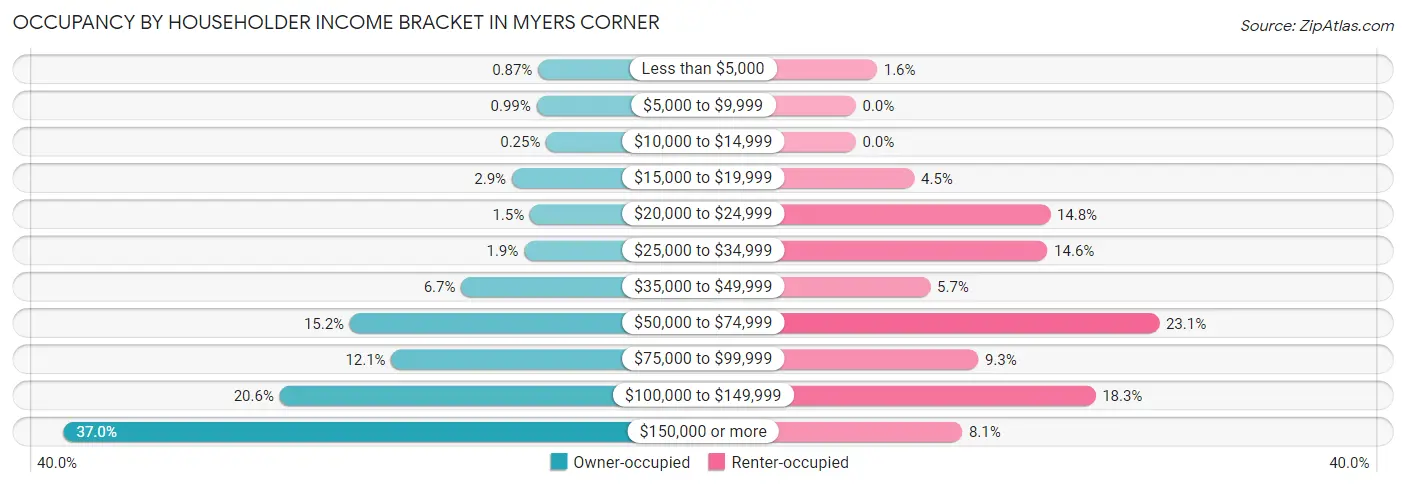
| Income Bracket | Owner-occupied | Renter-occupied |
| Less than $5,000 | 31 (0.9%) | 8 (1.6%) |
| $5,000 to $9,999 | 35 (1.0%) | 0 (0.0%) |
| $10,000 to $14,999 | 9 (0.3%) | 0 (0.0%) |
| $15,000 to $19,999 | 102 (2.9%) | 22 (4.5%) |
| $20,000 to $24,999 | 53 (1.5%) | 73 (14.8%) |
| $25,000 to $34,999 | 69 (1.9%) | 72 (14.6%) |
| $35,000 to $49,999 | 239 (6.7%) | 28 (5.7%) |
| $50,000 to $74,999 | 540 (15.2%) | 114 (23.1%) |
| $75,000 to $99,999 | 428 (12.0%) | 46 (9.3%) |
| $100,000 to $149,999 | 730 (20.6%) | 90 (18.3%) |
| $150,000 or more | 1,315 (37.0%) | 40 (8.1%) |
| Total | 3,551 (100.0%) | 493 (100.0%) |
Monthly Housing Cost Tiers in Myers Corner
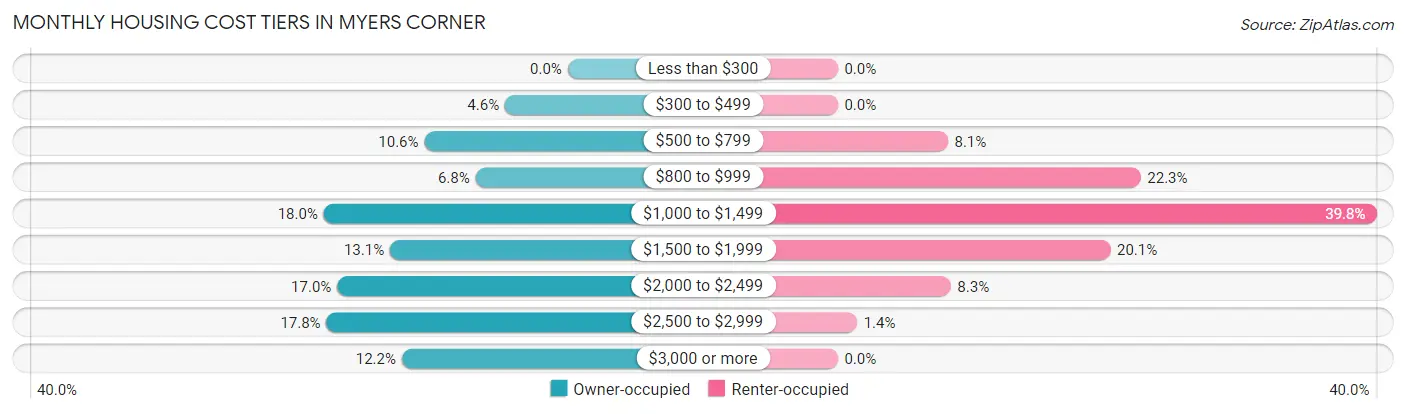
| Monthly Cost | Owner-occupied | Renter-occupied |
| Less than $300 | 0 (0.0%) | 0 (0.0%) |
| $300 to $499 | 164 (4.6%) | 0 (0.0%) |
| $500 to $799 | 375 (10.6%) | 40 (8.1%) |
| $800 to $999 | 241 (6.8%) | 110 (22.3%) |
| $1,000 to $1,499 | 638 (18.0%) | 196 (39.8%) |
| $1,500 to $1,999 | 465 (13.1%) | 99 (20.1%) |
| $2,000 to $2,499 | 603 (17.0%) | 41 (8.3%) |
| $2,500 to $2,999 | 631 (17.8%) | 7 (1.4%) |
| $3,000 or more | 434 (12.2%) | 0 (0.0%) |
| Total | 3,551 (100.0%) | 493 (100.0%) |
Physical Housing Characteristics in Myers Corner
Housing Structures in Myers Corner
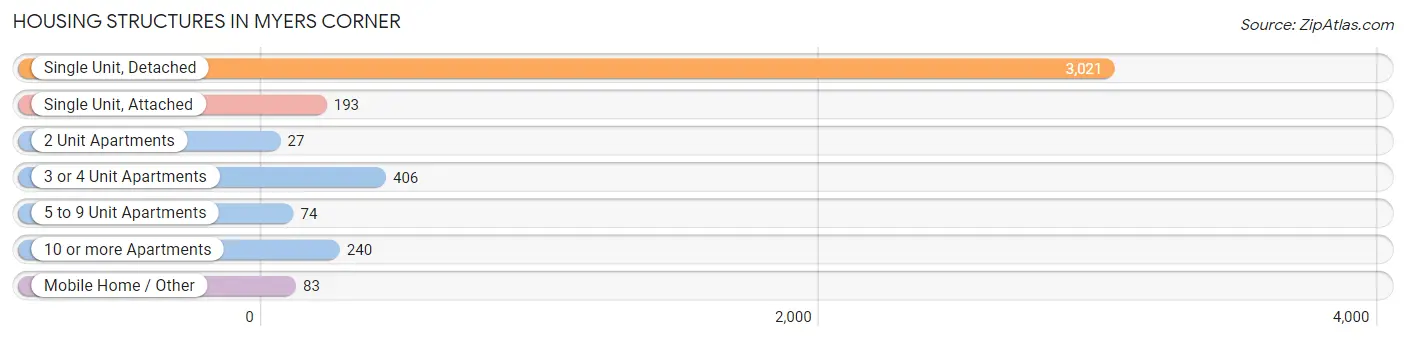
| Structure Type | # Housing Units | % Housing Units |
| Single Unit, Detached | 3,021 | 74.7% |
| Single Unit, Attached | 193 | 4.8% |
| 2 Unit Apartments | 27 | 0.7% |
| 3 or 4 Unit Apartments | 406 | 10.0% |
| 5 to 9 Unit Apartments | 74 | 1.8% |
| 10 or more Apartments | 240 | 5.9% |
| Mobile Home / Other | 83 | 2.1% |
| Total | 4,044 | 100.0% |
Housing Structures by Occupancy in Myers Corner
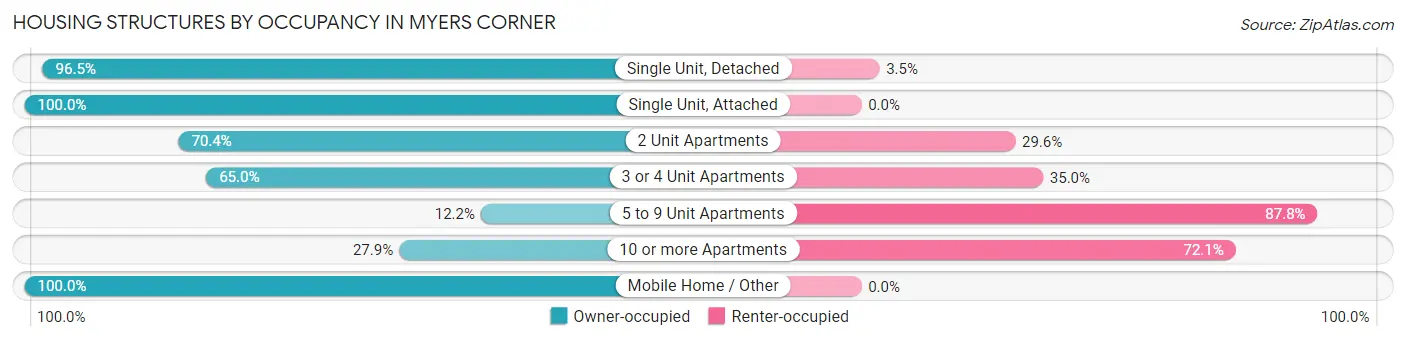
| Structure Type | Owner-occupied | Renter-occupied |
| Single Unit, Detached | 2,916 (96.5%) | 105 (3.5%) |
| Single Unit, Attached | 193 (100.0%) | 0 (0.0%) |
| 2 Unit Apartments | 19 (70.4%) | 8 (29.6%) |
| 3 or 4 Unit Apartments | 264 (65.0%) | 142 (35.0%) |
| 5 to 9 Unit Apartments | 9 (12.2%) | 65 (87.8%) |
| 10 or more Apartments | 67 (27.9%) | 173 (72.1%) |
| Mobile Home / Other | 83 (100.0%) | 0 (0.0%) |
| Total | 3,551 (87.8%) | 493 (12.2%) |
Housing Structures by Number of Rooms in Myers Corner
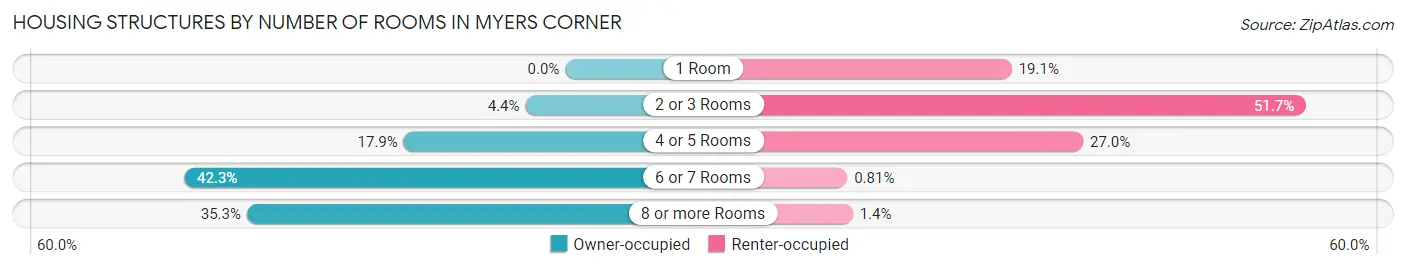
| Number of Rooms | Owner-occupied | Renter-occupied |
| 1 Room | 0 (0.0%) | 94 (19.1%) |
| 2 or 3 Rooms | 157 (4.4%) | 255 (51.7%) |
| 4 or 5 Rooms | 637 (17.9%) | 133 (27.0%) |
| 6 or 7 Rooms | 1,502 (42.3%) | 4 (0.8%) |
| 8 or more Rooms | 1,255 (35.3%) | 7 (1.4%) |
| Total | 3,551 (100.0%) | 493 (100.0%) |
Housing Structure by Heating Type in Myers Corner
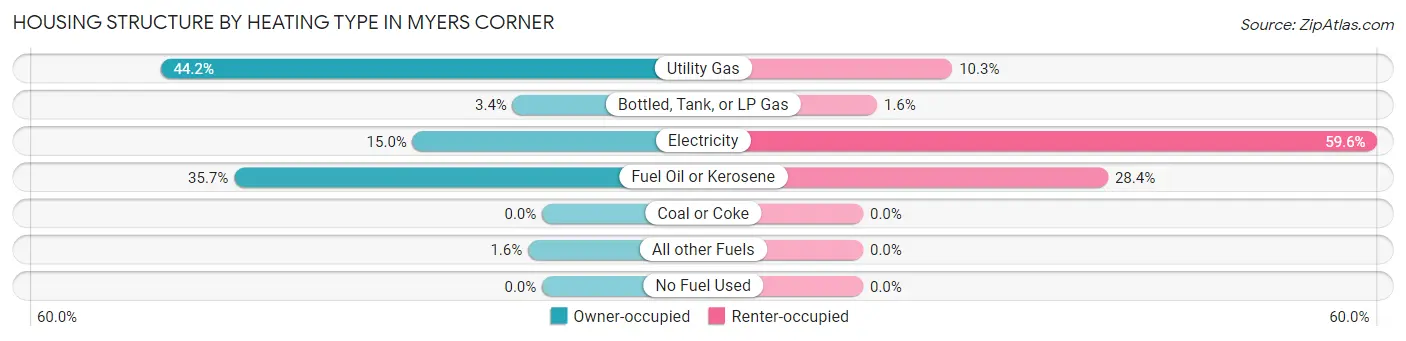
| Heating Type | Owner-occupied | Renter-occupied |
| Utility Gas | 1,571 (44.2%) | 51 (10.3%) |
| Bottled, Tank, or LP Gas | 121 (3.4%) | 8 (1.6%) |
| Electricity | 533 (15.0%) | 294 (59.6%) |
| Fuel Oil or Kerosene | 1,268 (35.7%) | 140 (28.4%) |
| Coal or Coke | 0 (0.0%) | 0 (0.0%) |
| All other Fuels | 58 (1.6%) | 0 (0.0%) |
| No Fuel Used | 0 (0.0%) | 0 (0.0%) |
| Total | 3,551 (100.0%) | 493 (100.0%) |
Household Vehicle Usage in Myers Corner
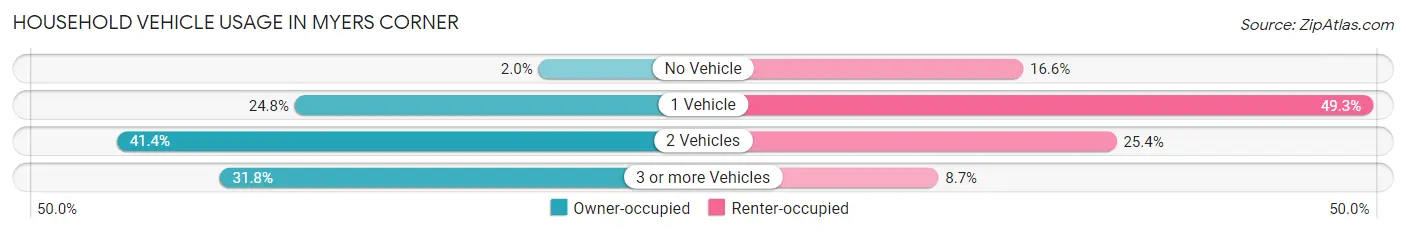
| Vehicles per Household | Owner-occupied | Renter-occupied |
| No Vehicle | 72 (2.0%) | 82 (16.6%) |
| 1 Vehicle | 880 (24.8%) | 243 (49.3%) |
| 2 Vehicles | 1,470 (41.4%) | 125 (25.4%) |
| 3 or more Vehicles | 1,129 (31.8%) | 43 (8.7%) |
| Total | 3,551 (100.0%) | 493 (100.0%) |
Real Estate & Mortgages in Myers Corner
Real Estate and Mortgage Overview in Myers Corner
| Characteristic | Without Mortgage | With Mortgage |
| Housing Units | 1,442 | 2,109 |
| Median Property Value | $362,000 | $361,800 |
| Median Household Income | $84,375 | $890 |
| Monthly Housing Costs | $973 | $424 |
| Real Estate Taxes | $5,966 | $43 |
Property Value by Mortgage Status in Myers Corner
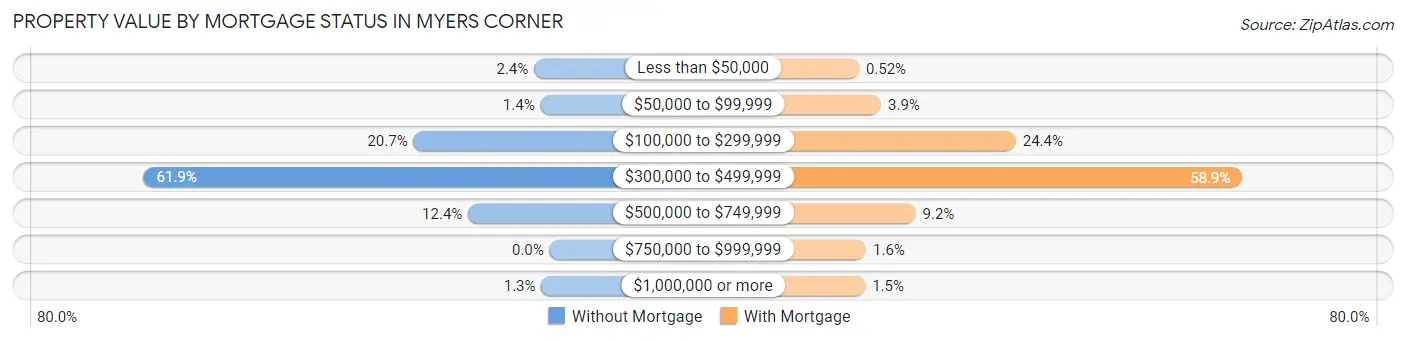
| Property Value | Without Mortgage | With Mortgage |
| Less than $50,000 | 34 (2.4%) | 11 (0.5%) |
| $50,000 to $99,999 | 20 (1.4%) | 82 (3.9%) |
| $100,000 to $299,999 | 299 (20.7%) | 515 (24.4%) |
| $300,000 to $499,999 | 892 (61.9%) | 1,243 (58.9%) |
| $500,000 to $749,999 | 179 (12.4%) | 193 (9.1%) |
| $750,000 to $999,999 | 0 (0.0%) | 34 (1.6%) |
| $1,000,000 or more | 18 (1.3%) | 31 (1.5%) |
| Total | 1,442 (100.0%) | 2,109 (100.0%) |
Household Income by Mortgage Status in Myers Corner
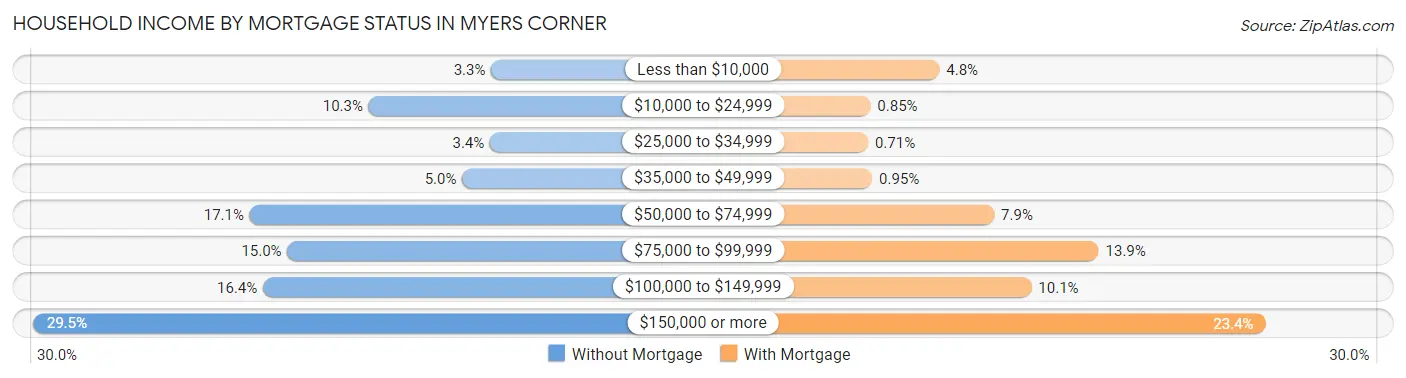
| Household Income | Without Mortgage | With Mortgage |
| Less than $10,000 | 48 (3.3%) | 101 (4.8%) |
| $10,000 to $24,999 | 149 (10.3%) | 18 (0.9%) |
| $25,000 to $34,999 | 49 (3.4%) | 15 (0.7%) |
| $35,000 to $49,999 | 72 (5.0%) | 20 (0.9%) |
| $50,000 to $74,999 | 247 (17.1%) | 167 (7.9%) |
| $75,000 to $99,999 | 216 (15.0%) | 293 (13.9%) |
| $100,000 to $149,999 | 236 (16.4%) | 212 (10.1%) |
| $150,000 or more | 425 (29.5%) | 494 (23.4%) |
| Total | 1,442 (100.0%) | 2,109 (100.0%) |
Property Value to Household Income Ratio in Myers Corner
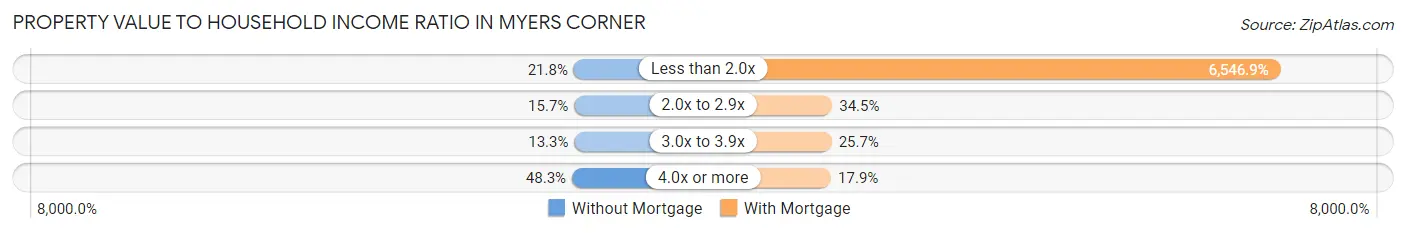
| Value-to-Income Ratio | Without Mortgage | With Mortgage |
| Less than 2.0x | 315 (21.8%) | 138,075 (6,546.9%) |
| 2.0x to 2.9x | 227 (15.7%) | 727 (34.5%) |
| 3.0x to 3.9x | 192 (13.3%) | 542 (25.7%) |
| 4.0x or more | 697 (48.3%) | 378 (17.9%) |
| Total | 1,442 (100.0%) | 2,109 (100.0%) |
Real Estate Taxes by Mortgage Status in Myers Corner
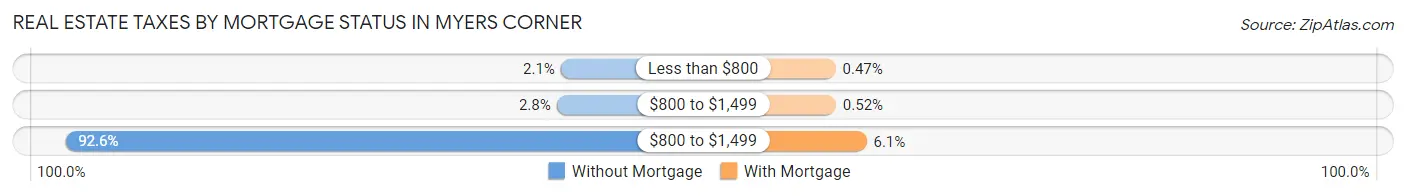
| Property Taxes | Without Mortgage | With Mortgage |
| Less than $800 | 30 (2.1%) | 10 (0.5%) |
| $800 to $1,499 | 41 (2.8%) | 11 (0.5%) |
| $800 to $1,499 | 1,335 (92.6%) | 129 (6.1%) |
| Total | 1,442 (100.0%) | 2,109 (100.0%) |
Health & Disability in Myers Corner
Health Insurance Coverage by Age in Myers Corner
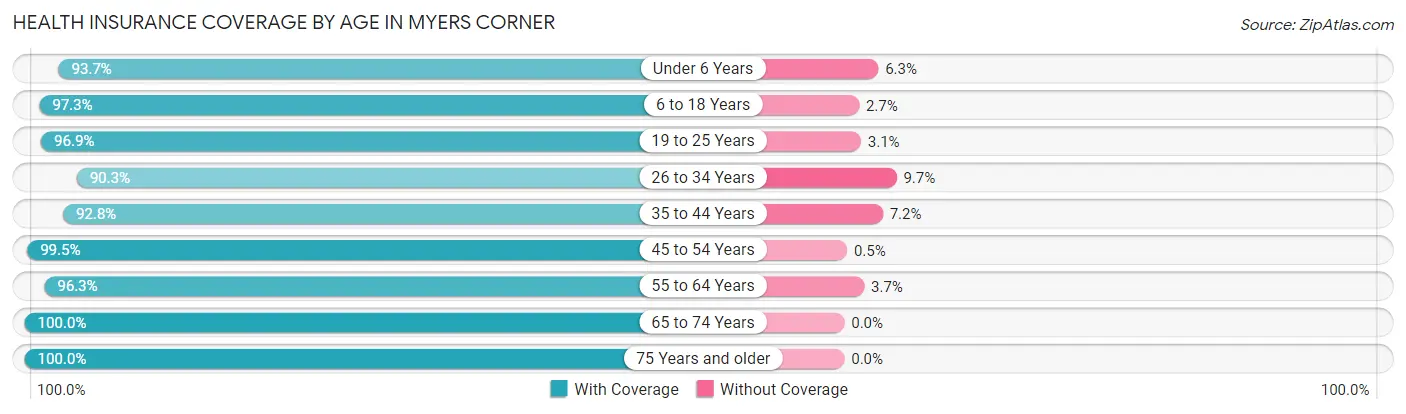
| Age Bracket | With Coverage | Without Coverage |
| Under 6 Years | 415 (93.7%) | 28 (6.3%) |
| 6 to 18 Years | 1,454 (97.3%) | 41 (2.7%) |
| 19 to 25 Years | 941 (96.9%) | 30 (3.1%) |
| 26 to 34 Years | 956 (90.3%) | 103 (9.7%) |
| 35 to 44 Years | 869 (92.8%) | 67 (7.2%) |
| 45 to 54 Years | 1,607 (99.5%) | 8 (0.5%) |
| 55 to 64 Years | 1,747 (96.3%) | 67 (3.7%) |
| 65 to 74 Years | 1,433 (100.0%) | 0 (0.0%) |
| 75 Years and older | 862 (100.0%) | 0 (0.0%) |
| Total | 10,284 (96.8%) | 344 (3.2%) |
Health Insurance Coverage by Citizenship Status in Myers Corner
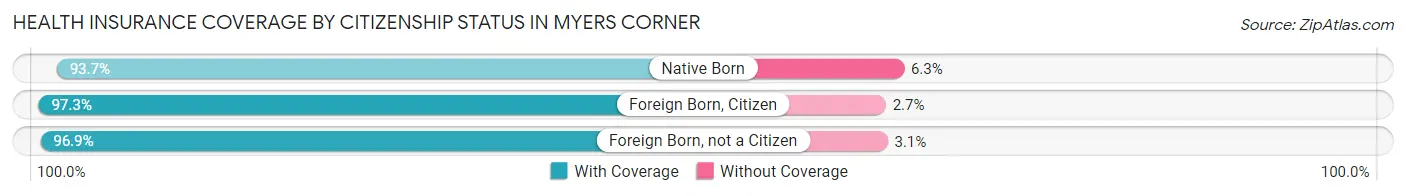
| Citizenship Status | With Coverage | Without Coverage |
| Native Born | 415 (93.7%) | 28 (6.3%) |
| Foreign Born, Citizen | 1,454 (97.3%) | 41 (2.7%) |
| Foreign Born, not a Citizen | 941 (96.9%) | 30 (3.1%) |
Health Insurance Coverage by Household Income in Myers Corner
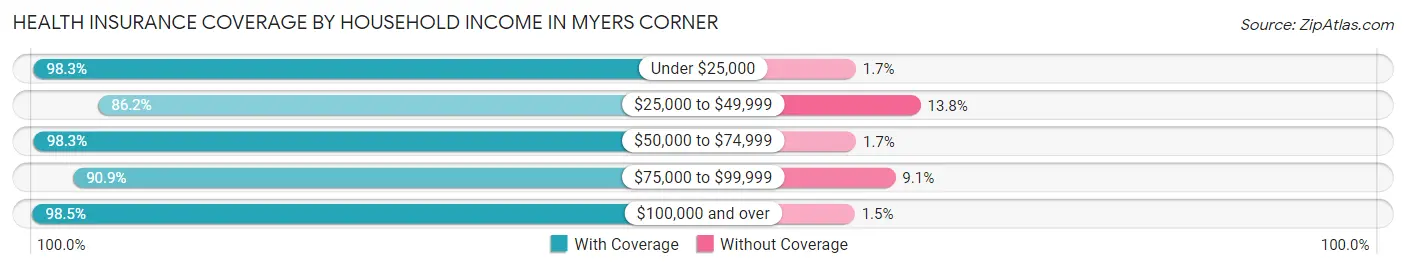
| Household Income | With Coverage | Without Coverage |
| Under $25,000 | 466 (98.3%) | 8 (1.7%) |
| $25,000 to $49,999 | 673 (86.2%) | 108 (13.8%) |
| $50,000 to $74,999 | 1,522 (98.3%) | 27 (1.7%) |
| $75,000 to $99,999 | 1,008 (90.9%) | 101 (9.1%) |
| $100,000 and over | 6,591 (98.5%) | 100 (1.5%) |
Public vs Private Health Insurance Coverage by Age in Myers Corner
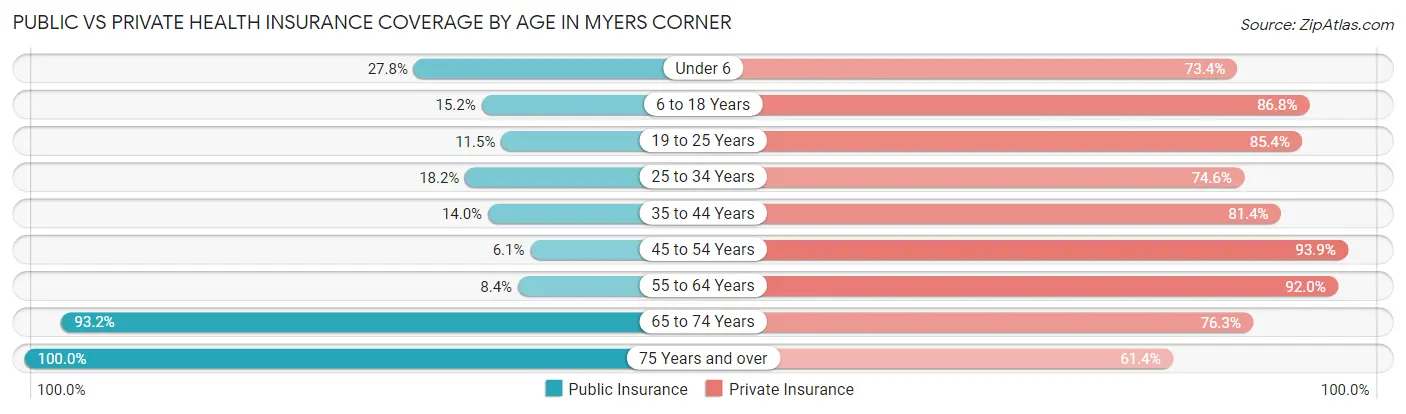
| Age Bracket | Public Insurance | Private Insurance |
| Under 6 | 123 (27.8%) | 325 (73.4%) |
| 6 to 18 Years | 227 (15.2%) | 1,297 (86.8%) |
| 19 to 25 Years | 112 (11.5%) | 829 (85.4%) |
| 25 to 34 Years | 193 (18.2%) | 790 (74.6%) |
| 35 to 44 Years | 131 (14.0%) | 762 (81.4%) |
| 45 to 54 Years | 99 (6.1%) | 1,516 (93.9%) |
| 55 to 64 Years | 153 (8.4%) | 1,669 (92.0%) |
| 65 to 74 Years | 1,335 (93.2%) | 1,093 (76.3%) |
| 75 Years and over | 862 (100.0%) | 529 (61.4%) |
| Total | 3,235 (30.4%) | 8,810 (82.9%) |
Disability Status by Sex by Age in Myers Corner
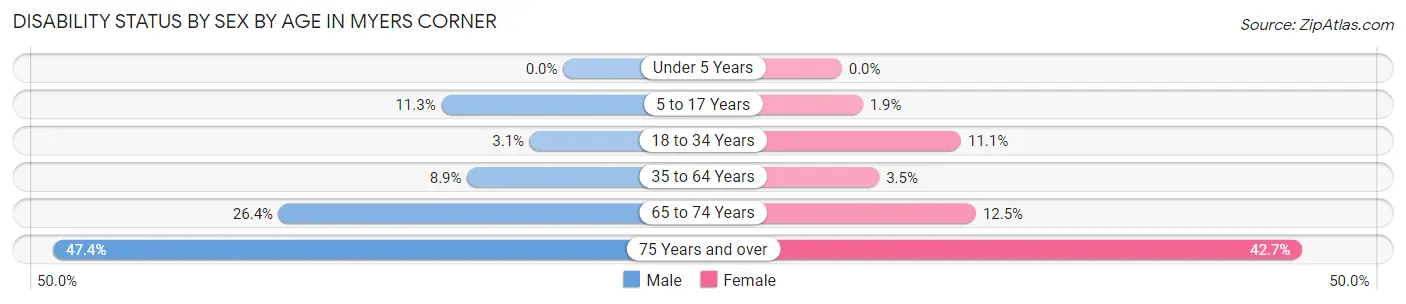
| Age Bracket | Male | Female |
| Under 5 Years | 0 (0.0%) | 0 (0.0%) |
| 5 to 17 Years | 87 (11.3%) | 14 (1.9%) |
| 18 to 34 Years | 33 (3.1%) | 119 (11.1%) |
| 35 to 64 Years | 204 (8.9%) | 72 (3.5%) |
| 65 to 74 Years | 160 (26.4%) | 103 (12.4%) |
| 75 Years and over | 242 (47.4%) | 150 (42.7%) |
Disability Class by Sex by Age in Myers Corner
Disability Class: Hearing Difficulty
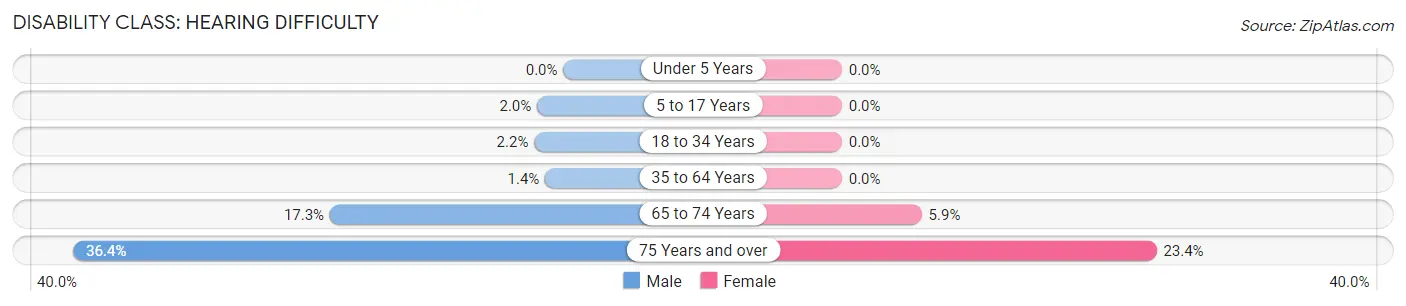
| Age Bracket | Male | Female |
| Under 5 Years | 0 (0.0%) | 0 (0.0%) |
| 5 to 17 Years | 15 (1.9%) | 0 (0.0%) |
| 18 to 34 Years | 23 (2.2%) | 0 (0.0%) |
| 35 to 64 Years | 31 (1.3%) | 0 (0.0%) |
| 65 to 74 Years | 105 (17.3%) | 49 (5.9%) |
| 75 Years and over | 186 (36.4%) | 82 (23.4%) |
Disability Class: Vision Difficulty
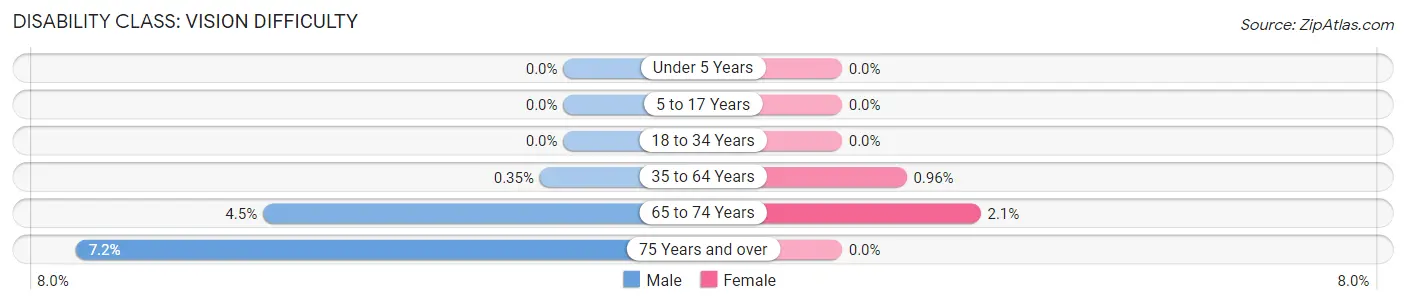
| Age Bracket | Male | Female |
| Under 5 Years | 0 (0.0%) | 0 (0.0%) |
| 5 to 17 Years | 0 (0.0%) | 0 (0.0%) |
| 18 to 34 Years | 0 (0.0%) | 0 (0.0%) |
| 35 to 64 Years | 8 (0.4%) | 20 (1.0%) |
| 65 to 74 Years | 27 (4.5%) | 17 (2.1%) |
| 75 Years and over | 37 (7.2%) | 0 (0.0%) |
Disability Class: Cognitive Difficulty
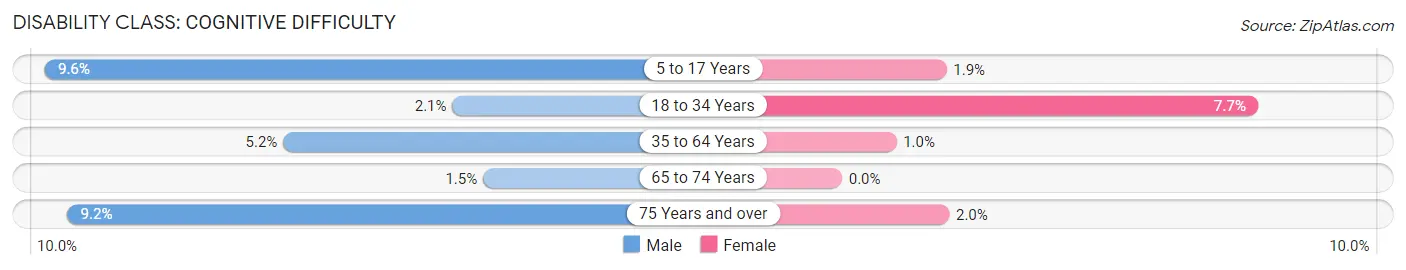
| Age Bracket | Male | Female |
| 5 to 17 Years | 74 (9.6%) | 14 (1.9%) |
| 18 to 34 Years | 22 (2.1%) | 83 (7.7%) |
| 35 to 64 Years | 119 (5.2%) | 21 (1.0%) |
| 65 to 74 Years | 9 (1.5%) | 0 (0.0%) |
| 75 Years and over | 47 (9.2%) | 7 (2.0%) |
Disability Class: Ambulatory Difficulty
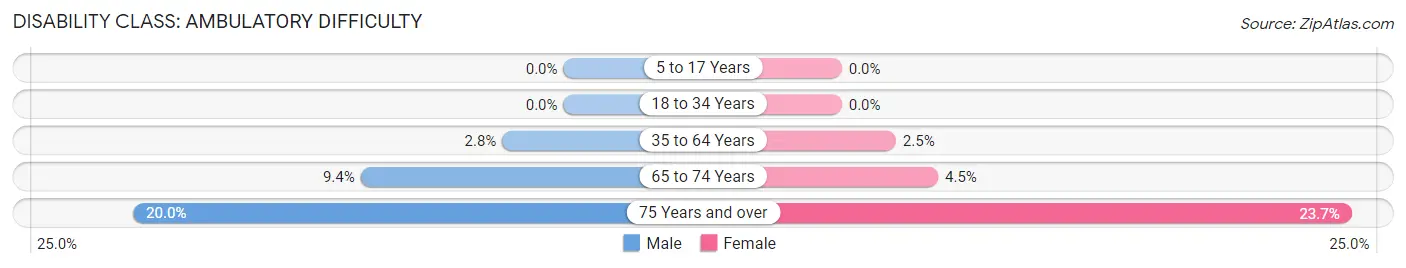
| Age Bracket | Male | Female |
| 5 to 17 Years | 0 (0.0%) | 0 (0.0%) |
| 18 to 34 Years | 0 (0.0%) | 0 (0.0%) |
| 35 to 64 Years | 65 (2.8%) | 52 (2.5%) |
| 65 to 74 Years | 57 (9.4%) | 37 (4.5%) |
| 75 Years and over | 102 (20.0%) | 83 (23.6%) |
Disability Class: Self-Care Difficulty
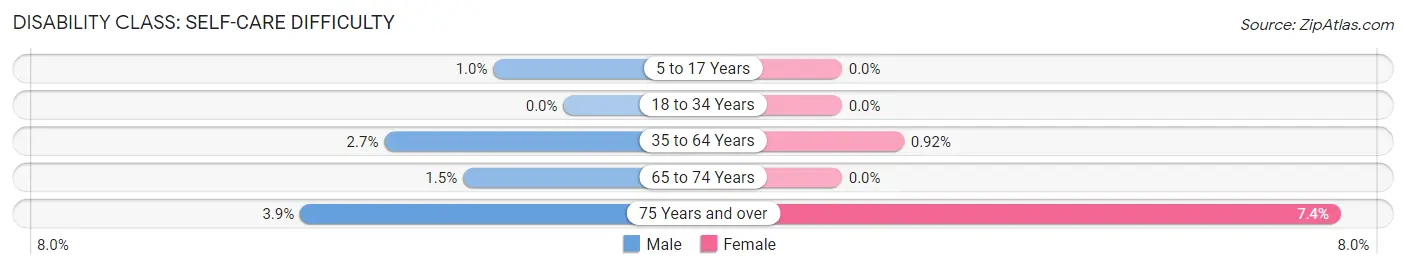
| Age Bracket | Male | Female |
| 5 to 17 Years | 8 (1.0%) | 0 (0.0%) |
| 18 to 34 Years | 0 (0.0%) | 0 (0.0%) |
| 35 to 64 Years | 61 (2.7%) | 19 (0.9%) |
| 65 to 74 Years | 9 (1.5%) | 0 (0.0%) |
| 75 Years and over | 20 (3.9%) | 26 (7.4%) |
Technology Access in Myers Corner
Computing Device Access in Myers Corner
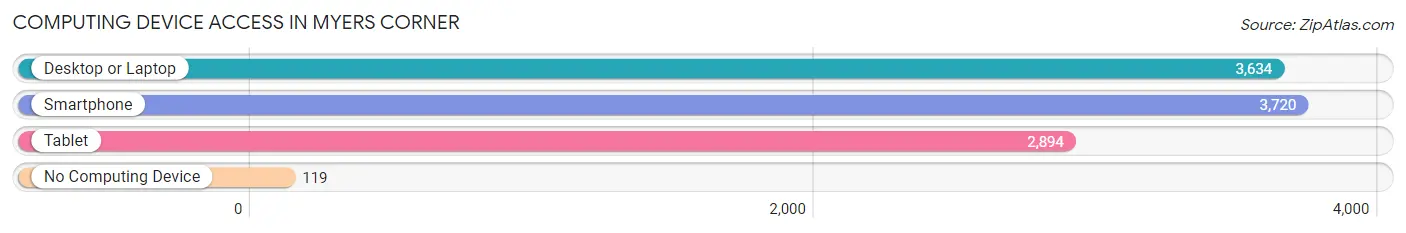
| Device Type | # Households | % Households |
| Desktop or Laptop | 3,634 | 89.9% |
| Smartphone | 3,720 | 92.0% |
| Tablet | 2,894 | 71.6% |
| No Computing Device | 119 | 2.9% |
| Total | 4,044 | 100.0% |
Internet Access in Myers Corner
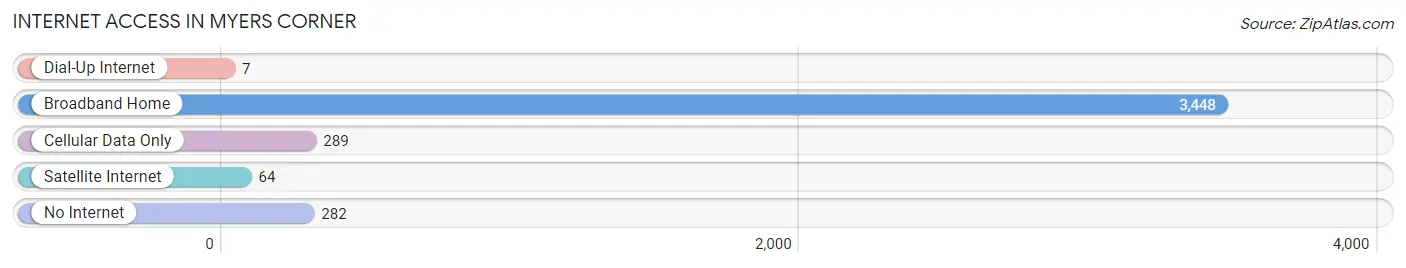
| Internet Type | # Households | % Households |
| Dial-Up Internet | 7 | 0.2% |
| Broadband Home | 3,448 | 85.3% |
| Cellular Data Only | 289 | 7.1% |
| Satellite Internet | 64 | 1.6% |
| No Internet | 282 | 7.0% |
| Total | 4,044 | 100.0% |
Myers Corner Summary
Myers Corner is a hamlet located in the town of Wappinger, Dutchess County, New York. It is situated on the east side of the Hudson River, approximately 25 miles south of Albany. The hamlet is bordered by the towns of Fishkill to the north, East Fishkill to the east, and Poughkeepsie to the south.
History
Myers Corner was first settled in the late 1700s by the Myers family, who were of Dutch descent. The hamlet was originally known as Myers’ Corner, and was named after the Myers family. The hamlet was officially incorporated in 1845.
In the late 1800s, Myers Corner was a thriving agricultural community. The hamlet was home to several farms, as well as a sawmill, gristmill, and a blacksmith shop. The hamlet also had a post office, which was established in 1851.
In the early 1900s, Myers Corner began to experience a period of growth and development. The hamlet was home to several businesses, including a general store, a hotel, a barber shop, and a movie theater. The hamlet also had a train station, which was built in 1910.
In the mid-1900s, Myers Corner began to experience a period of decline. Many of the businesses in the hamlet closed, and the population began to decline. The train station was closed in the 1950s, and the post office was closed in the 1970s.
Geography
Myers Corner is located in the Hudson Valley region of New York. The hamlet is situated on the east side of the Hudson River, approximately 25 miles south of Albany. The hamlet is bordered by the towns of Fishkill to the north, East Fishkill to the east, and Poughkeepsie to the south.
The hamlet is located in a rural area, and is surrounded by farmland. The terrain is mostly flat, with some rolling hills. The hamlet is located in a temperate climate, with hot summers and cold winters.
Economy
Myers Corner is a primarily residential community. The hamlet is home to several small businesses, including a gas station, a convenience store, and a few restaurants. The hamlet also has a few small manufacturing companies.
The hamlet is home to several farms, which produce a variety of crops, including corn, soybeans, and hay. The hamlet also has a few wineries, which produce a variety of wines.
Demographics
As of the 2010 census, the population of Myers Corner was 1,845. The population is primarily white (94.3%), with a small percentage of African Americans (2.2%) and Hispanics (2.5%). The median household income is $60,000, and the median home value is $250,000.
The hamlet is served by the Wappingers Central School District. The hamlet is home to several churches, including the Myers Corner United Methodist Church and the Myers Corner Baptist Church.
Conclusion
Myers Corner is a small hamlet located in the town of Wappinger, Dutchess County, New York. The hamlet was first settled in the late 1700s by the Myers family, and was officially incorporated in 1845. The hamlet was once a thriving agricultural community, but has since experienced a period of decline. Today, Myers Corner is a primarily residential community, with a population of 1,845. The hamlet is home to several small businesses, farms, and wineries.
Common Questions
What is Per Capita Income in Myers Corner?
Per Capita income in Myers Corner is $51,181.
What is the Median Family Income in Myers Corner?
Median Family Income in Myers Corner is $129,219.
What is the Median Household income in Myers Corner?
Median Household Income in Myers Corner is $109,963.
What is Income or Wage Gap in Myers Corner?
Income or Wage Gap in Myers Corner is 26.6%.
Women in Myers Corner earn 73.4 cents for every dollar earned by a man.
What is Family Income Deficit in Myers Corner?
Family Income Deficit in Myers Corner is $11,066.
Families that are below poverty line in Myers Corner earn $11,066 less on average than the poverty threshold level.
What is Inequality or Gini Index in Myers Corner?
Inequality or Gini Index in Myers Corner is 0.39.
What is the Total Population of Myers Corner?
Total Population of Myers Corner is 10,653.
What is the Total Male Population of Myers Corner?
Total Male Population of Myers Corner is 5,409.
What is the Total Female Population of Myers Corner?
Total Female Population of Myers Corner is 5,244.
What is the Ratio of Males per 100 Females in Myers Corner?
There are 103.15 Males per 100 Females in Myers Corner.
What is the Ratio of Females per 100 Males in Myers Corner?
There are 96.95 Females per 100 Males in Myers Corner.
What is the Median Population Age in Myers Corner?
Median Population Age in Myers Corner is 47.7 Years.
What is the Average Family Size in Myers Corner
Average Family Size in Myers Corner is 3.1 People.
What is the Average Household Size in Myers Corner
Average Household Size in Myers Corner is 2.6 People.
How Large is the Labor Force in Myers Corner?
There are 6,280 People in the Labor Forcein in Myers Corner.
What is the Percentage of People in the Labor Force in Myers Corner?
69.2% of People are in the Labor Force in Myers Corner.
What is the Unemployment Rate in Myers Corner?
Unemployment Rate in Myers Corner is 4.0%.