East Rockaway, NY Map & Demographics
East Rockaway Map
East Rockaway Overview
$59,364
PER CAPITA INCOME
$127,250
AVG FAMILY INCOME
$115,701
AVG HOUSEHOLD INCOME
28.7%
WAGE / INCOME GAP [ % ]
71.3¢/ $1
WAGE / INCOME GAP [ $ ]
0.46
INEQUALITY / GINI INDEX
10,070
TOTAL POPULATION
4,453
MALE POPULATION
5,617
FEMALE POPULATION
79.28
MALES / 100 FEMALES
126.14
FEMALES / 100 MALES
40.5
MEDIAN AGE
3.1
AVG FAMILY SIZE
2.6
AVG HOUSEHOLD SIZE
5,606
LABOR FORCE [ PEOPLE ]
68.9%
PERCENT IN LABOR FORCE
6.3%
UNEMPLOYMENT RATE
East Rockaway Zip Codes
East Rockaway Area Codes
Income in East Rockaway
Income Overview in East Rockaway
Per Capita Income in East Rockaway is $59,364, while median incomes of families and households are $127,250 and $115,701 respectively.
| Characteristic | Number | Measure |
| Per Capita Income | 10,070 | $59,364 |
| Median Family Income | 2,611 | $127,250 |
| Mean Family Income | 2,611 | $182,605 |
| Median Household Income | 3,822 | $115,701 |
| Mean Household Income | 3,822 | $153,139 |
| Income Deficit | 2,611 | $0 |
| Wage / Income Gap (%) | 10,070 | 28.74% |
| Wage / Income Gap ($) | 10,070 | 71.26¢ per $1 |
| Gini / Inequality Index | 10,070 | 0.46 |
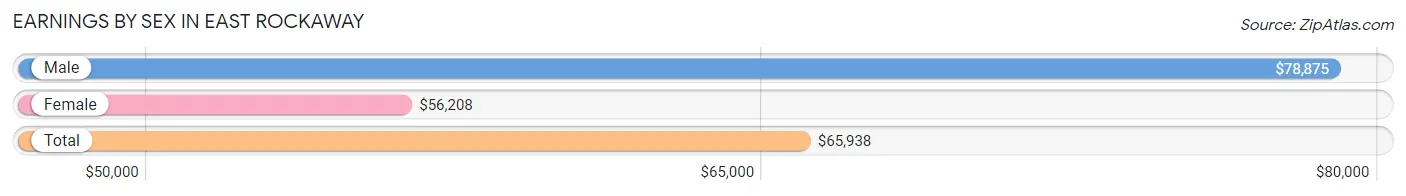
Earnings by Sex in East Rockaway
Average Earnings in East Rockaway are $65,938, $78,875 for men and $56,208 for women, a difference of 28.7%.
| Sex | Number | Average Earnings |
| Male | 2,957 (49.9%) | $78,875 |
| Female | 2,971 (50.1%) | $56,208 |
| Total | 5,928 (100.0%) | $65,938 |
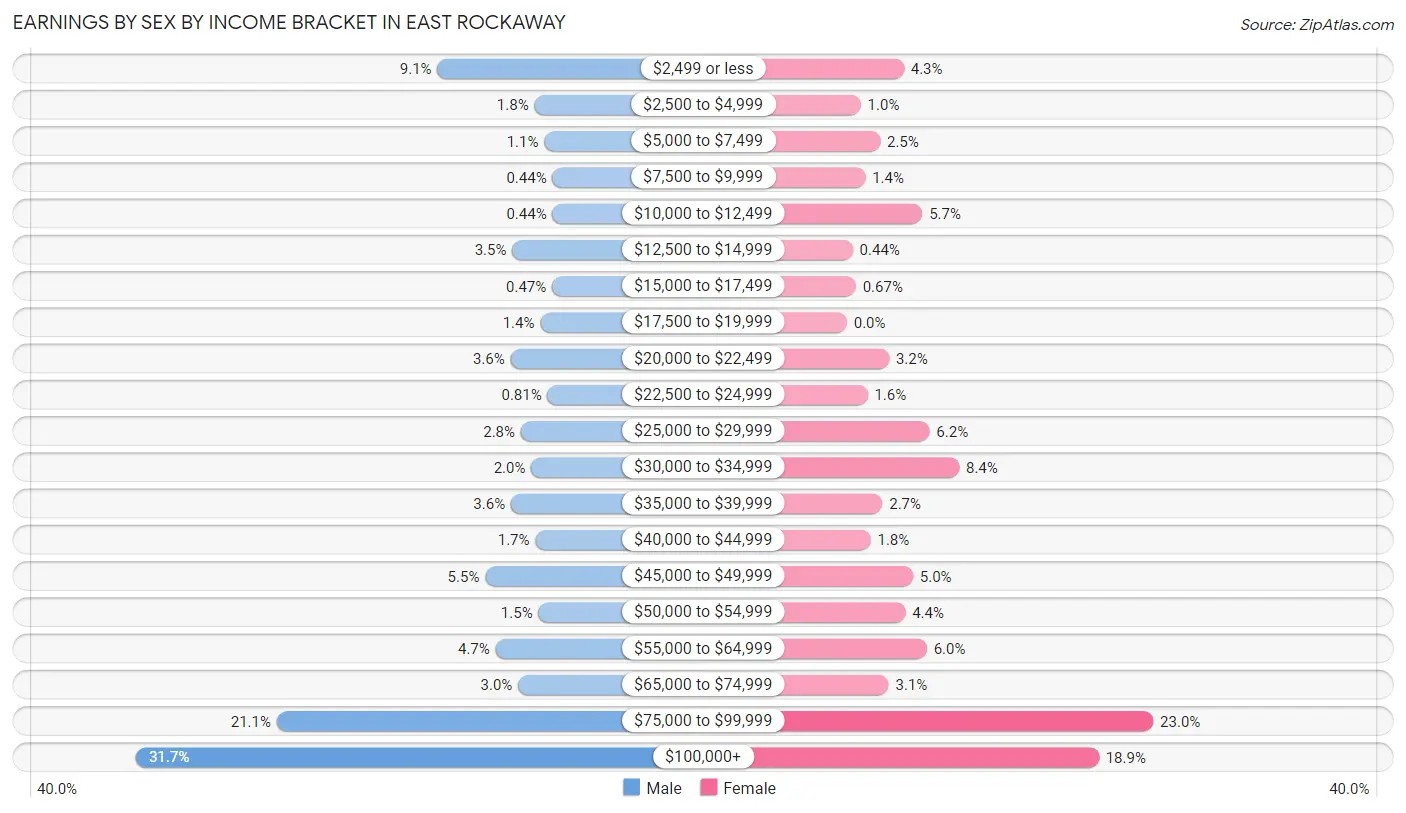
Earnings by Sex by Income Bracket in East Rockaway
The most common earnings brackets in East Rockaway are $100,000+ for men (936 | 31.7%) and $75,000 to $99,999 for women (682 | 23.0%).
| Income | Male | Female |
| $2,499 or less | 268 (9.1%) | 127 (4.3%) |
| $2,500 to $4,999 | 53 (1.8%) | 31 (1.0%) |
| $5,000 to $7,499 | 31 (1.1%) | 74 (2.5%) |
| $7,500 to $9,999 | 13 (0.4%) | 41 (1.4%) |
| $10,000 to $12,499 | 13 (0.4%) | 168 (5.7%) |
| $12,500 to $14,999 | 102 (3.5%) | 13 (0.4%) |
| $15,000 to $17,499 | 14 (0.5%) | 20 (0.7%) |
| $17,500 to $19,999 | 40 (1.3%) | 0 (0.0%) |
| $20,000 to $22,499 | 106 (3.6%) | 94 (3.2%) |
| $22,500 to $24,999 | 24 (0.8%) | 46 (1.5%) |
| $25,000 to $29,999 | 83 (2.8%) | 184 (6.2%) |
| $30,000 to $34,999 | 60 (2.0%) | 250 (8.4%) |
| $35,000 to $39,999 | 105 (3.5%) | 79 (2.7%) |
| $40,000 to $44,999 | 51 (1.7%) | 53 (1.8%) |
| $45,000 to $49,999 | 162 (5.5%) | 147 (5.0%) |
| $50,000 to $54,999 | 44 (1.5%) | 130 (4.4%) |
| $55,000 to $64,999 | 139 (4.7%) | 178 (6.0%) |
| $65,000 to $74,999 | 89 (3.0%) | 93 (3.1%) |
| $75,000 to $99,999 | 624 (21.1%) | 682 (23.0%) |
| $100,000+ | 936 (31.7%) | 561 (18.9%) |
| Total | 2,957 (100.0%) | 2,971 (100.0%) |
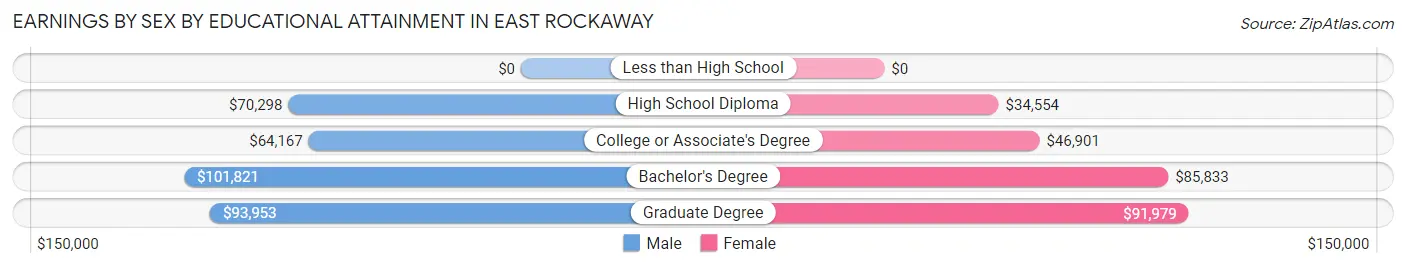
Earnings by Sex by Educational Attainment in East Rockaway
Average earnings in East Rockaway are $86,271 for men and $68,587 for women, a difference of 20.5%. Men with an educational attainment of bachelor's degree enjoy the highest average annual earnings of $101,821, while those with college or associate's degree education earn the least with $64,167. Women with an educational attainment of graduate degree earn the most with the average annual earnings of $91,979, while those with high school diploma education have the smallest earnings of $34,554.
| Educational Attainment | Male Income | Female Income |
| Less than High School | - | - |
| High School Diploma | $70,298 | $34,554 |
| College or Associate's Degree | $64,167 | $46,901 |
| Bachelor's Degree | $101,821 | $85,833 |
| Graduate Degree | $93,953 | $91,979 |
| Total | $86,271 | $68,587 |
Family Income in East Rockaway
Family Income Brackets in East Rockaway
According to the East Rockaway family income data, there are 728 families falling into the $200,000+ income range, which is the most common income bracket and makes up 27.9% of all families.
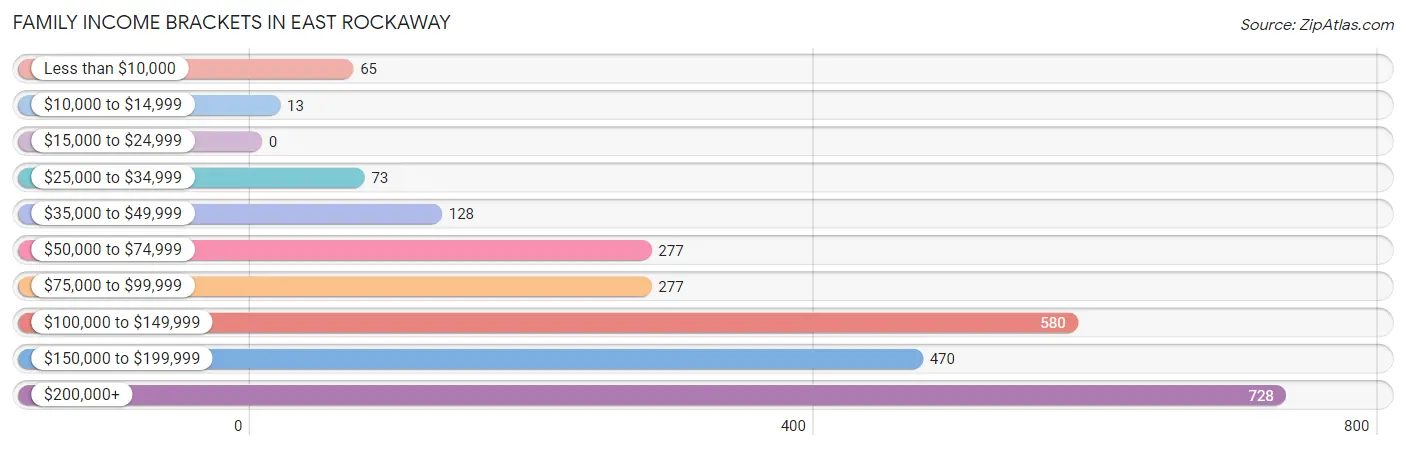
| Income Bracket | # Families | % Families |
| Less than $10,000 | 65 | 2.5% |
| $10,000 to $14,999 | 13 | 0.5% |
| $15,000 to $24,999 | 0 | 0.0% |
| $25,000 to $34,999 | 73 | 2.8% |
| $35,000 to $49,999 | 128 | 4.9% |
| $50,000 to $74,999 | 277 | 10.6% |
| $75,000 to $99,999 | 277 | 10.6% |
| $100,000 to $149,999 | 580 | 22.2% |
| $150,000 to $199,999 | 470 | 18.0% |
| $200,000+ | 728 | 27.9% |
Family Income by Famaliy Size in East Rockaway
5-person families (163 | 6.2%) account for the highest median family income in East Rockaway with $233,371 per family, while 2-person families (1,077 | 41.2%) have the highest median income of $61,094 per family member.
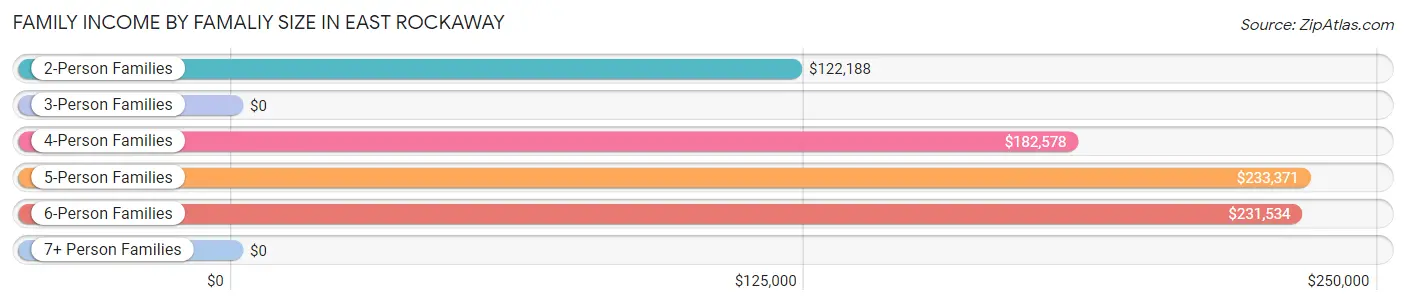
| Income Bracket | # Families | Median Income |
| 2-Person Families | 1,077 (41.2%) | $122,188 |
| 3-Person Families | 615 (23.5%) | $0 |
| 4-Person Families | 599 (22.9%) | $182,578 |
| 5-Person Families | 163 (6.2%) | $233,371 |
| 6-Person Families | 157 (6.0%) | $231,534 |
| 7+ Person Families | 0 (0.0%) | $0 |
| Total | 2,611 (100.0%) | $127,250 |
Family Income by Number of Earners in East Rockaway
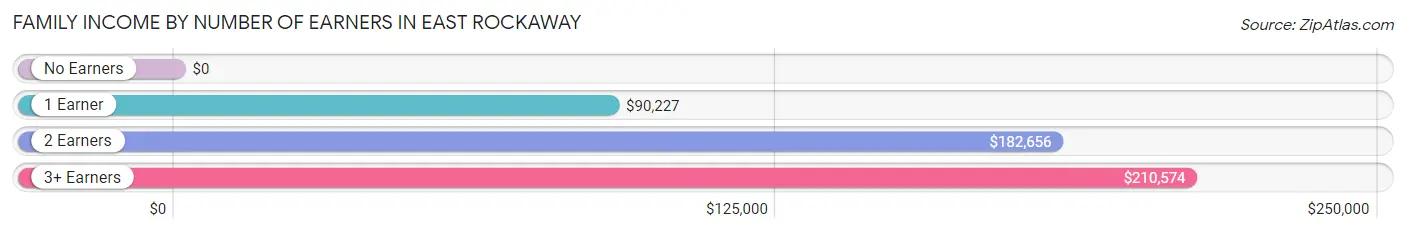
| Number of Earners | # Families | Median Income |
| No Earners | 222 (8.5%) | $0 |
| 1 Earner | 858 (32.9%) | $90,227 |
| 2 Earners | 1,062 (40.7%) | $182,656 |
| 3+ Earners | 469 (18.0%) | $210,574 |
| Total | 2,611 (100.0%) | $127,250 |
Household Income in East Rockaway
Household Income Brackets in East Rockaway
With 845 households falling in the category, the $200,000+ income range is the most frequent in East Rockaway, accounting for 22.1% of all households. In contrast, only 23 households (0.6%) fall into the $10,000 to $14,999 income bracket, making it the least populous group.
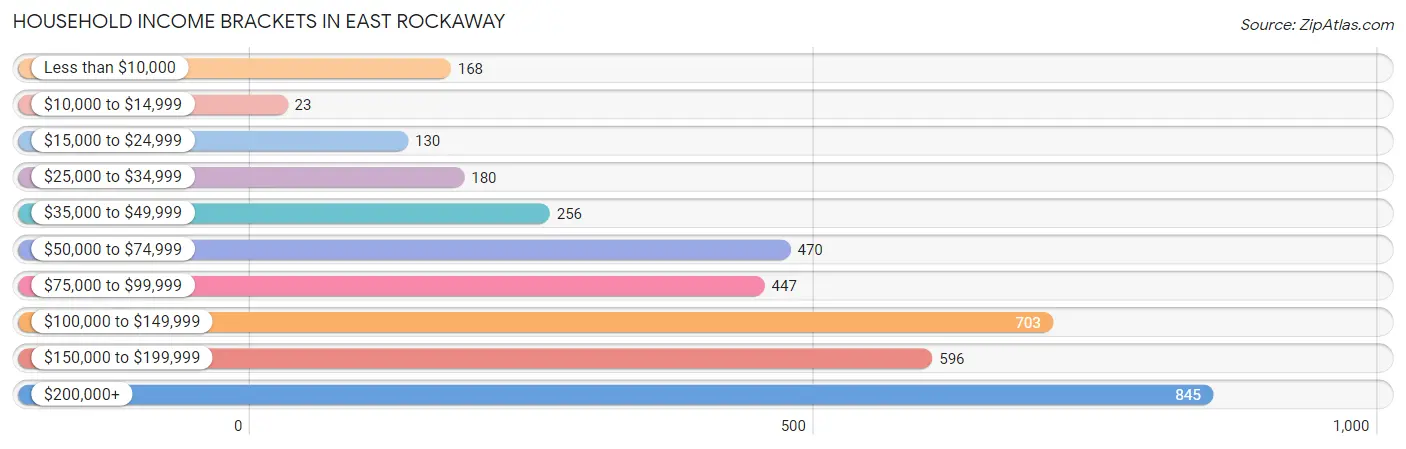
| Income Bracket | # Households | % Households |
| Less than $10,000 | 168 | 4.4% |
| $10,000 to $14,999 | 23 | 0.6% |
| $15,000 to $24,999 | 130 | 3.4% |
| $25,000 to $34,999 | 180 | 4.7% |
| $35,000 to $49,999 | 256 | 6.7% |
| $50,000 to $74,999 | 470 | 12.3% |
| $75,000 to $99,999 | 447 | 11.7% |
| $100,000 to $149,999 | 703 | 18.4% |
| $150,000 to $199,999 | 596 | 15.6% |
| $200,000+ | 845 | 22.1% |
Household Income by Householder Age in East Rockaway
The median household income in East Rockaway is $115,701, with the highest median household income of $134,224 found in the 45 to 64 years age bracket for the primary householder. A total of 1,426 households (37.3%) fall into this category. Meanwhile, the 15 to 24 years age bracket for the primary householder has the lowest median household income of $0, with 32 households (0.8%) in this group.
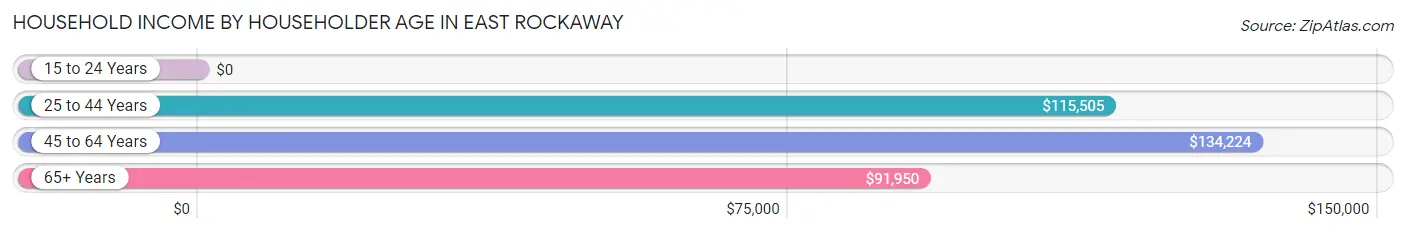
| Income Bracket | # Households | Median Income |
| 15 to 24 Years | 32 (0.8%) | $0 |
| 25 to 44 Years | 1,305 (34.1%) | $115,505 |
| 45 to 64 Years | 1,426 (37.3%) | $134,224 |
| 65+ Years | 1,059 (27.7%) | $91,950 |
| Total | 3,822 (100.0%) | $115,701 |
Poverty in East Rockaway
Income Below Poverty by Sex and Age in East Rockaway
With 1.6% poverty level for males and 4.1% for females among the residents of East Rockaway, 15 year old males and 5 year old females are the most vulnerable to poverty, with 16 males (33.3%) and 12 females (34.3%) in their respective age groups living below the poverty level.
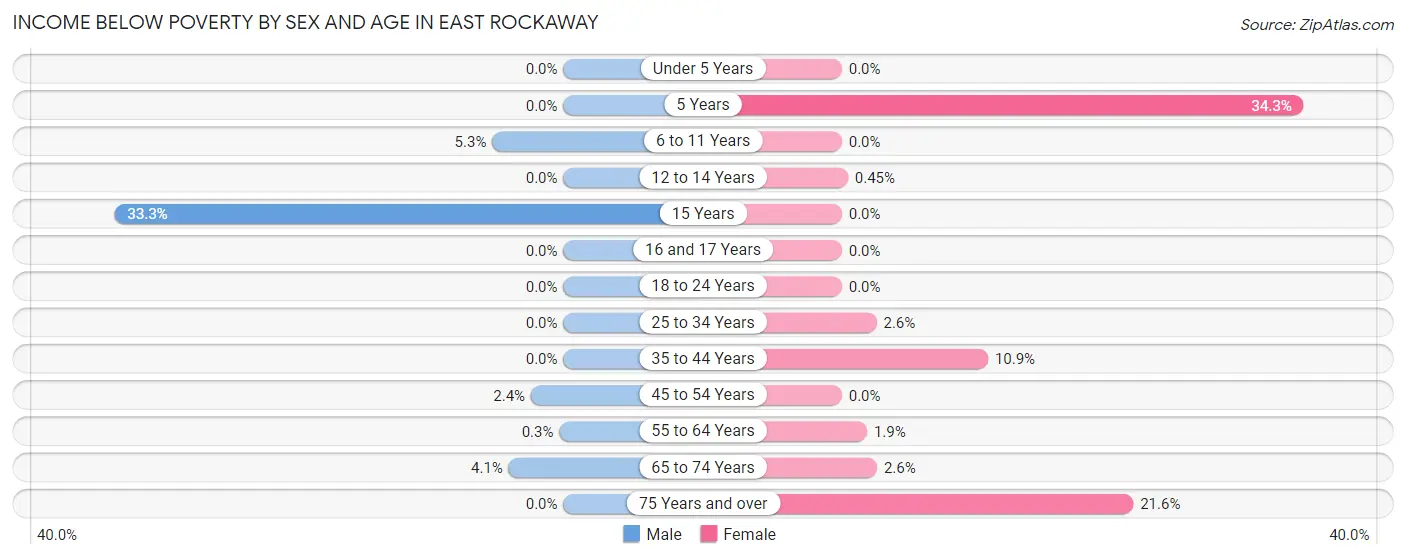
| Age Bracket | Male | Female |
| Under 5 Years | 0 (0.0%) | 0 (0.0%) |
| 5 Years | 0 (0.0%) | 12 (34.3%) |
| 6 to 11 Years | 16 (5.3%) | 0 (0.0%) |
| 12 to 14 Years | 0 (0.0%) | 1 (0.4%) |
| 15 Years | 16 (33.3%) | 0 (0.0%) |
| 16 and 17 Years | 0 (0.0%) | 0 (0.0%) |
| 18 to 24 Years | 0 (0.0%) | 0 (0.0%) |
| 25 to 34 Years | 0 (0.0%) | 21 (2.6%) |
| 35 to 44 Years | 0 (0.0%) | 83 (10.8%) |
| 45 to 54 Years | 13 (2.4%) | 0 (0.0%) |
| 55 to 64 Years | 2 (0.3%) | 17 (1.9%) |
| 65 to 74 Years | 22 (4.1%) | 13 (2.6%) |
| 75 Years and over | 0 (0.0%) | 79 (21.6%) |
| Total | 69 (1.6%) | 226 (4.1%) |
Income Above Poverty by Sex and Age in East Rockaway
According to the poverty statistics in East Rockaway, males aged under 5 years and females aged under 5 years are the age groups that are most secure financially, with 100.0% of males and 100.0% of females in these age groups living above the poverty line.
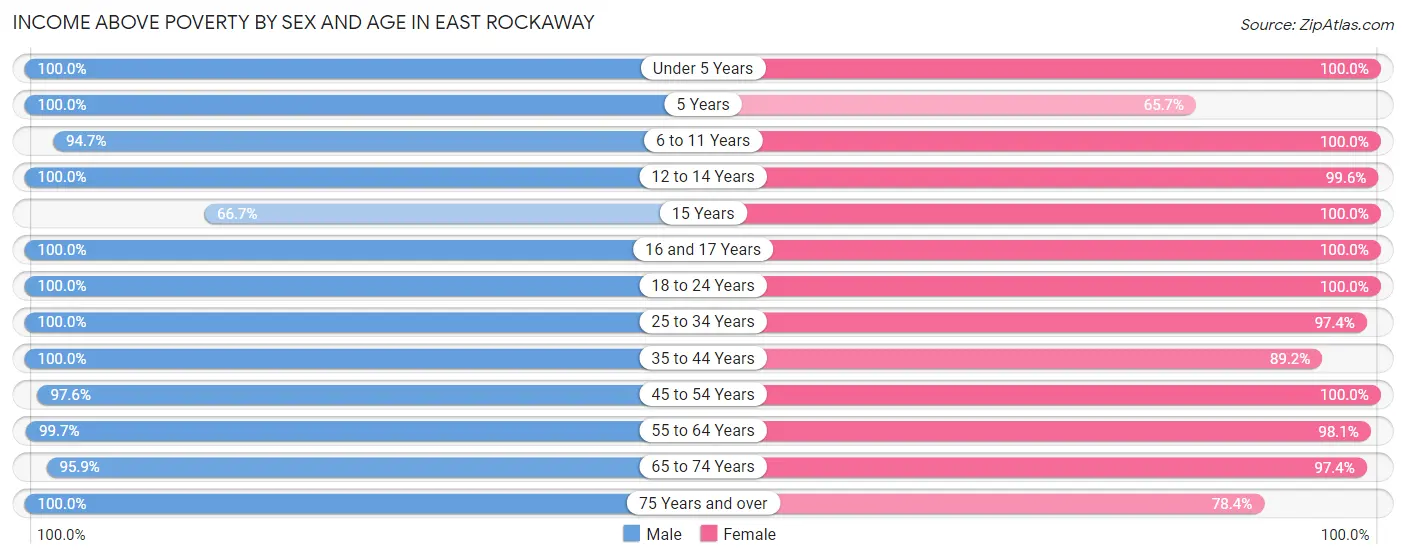
| Age Bracket | Male | Female |
| Under 5 Years | 248 (100.0%) | 177 (100.0%) |
| 5 Years | 12 (100.0%) | 23 (65.7%) |
| 6 to 11 Years | 287 (94.7%) | 475 (100.0%) |
| 12 to 14 Years | 229 (100.0%) | 221 (99.6%) |
| 15 Years | 32 (66.7%) | 109 (100.0%) |
| 16 and 17 Years | 104 (100.0%) | 177 (100.0%) |
| 18 to 24 Years | 151 (100.0%) | 512 (100.0%) |
| 25 to 34 Years | 369 (100.0%) | 794 (97.4%) |
| 35 to 44 Years | 905 (100.0%) | 682 (89.1%) |
| 45 to 54 Years | 526 (97.6%) | 461 (100.0%) |
| 55 to 64 Years | 667 (99.7%) | 894 (98.1%) |
| 65 to 74 Years | 520 (95.9%) | 486 (97.4%) |
| 75 Years and over | 250 (100.0%) | 286 (78.4%) |
| Total | 4,300 (98.4%) | 5,297 (95.9%) |
Income Below Poverty Among Married-Couple Families in East Rockaway
The poverty statistics for married-couple families in East Rockaway show that 0.7% or 13 of the total 1,967 families live below the poverty line. Families with no children have the highest poverty rate of 1.1%, comprising of 13 families. On the other hand, families with 1 or 2 children have the lowest poverty rate of 0.0%, which includes 0 families.
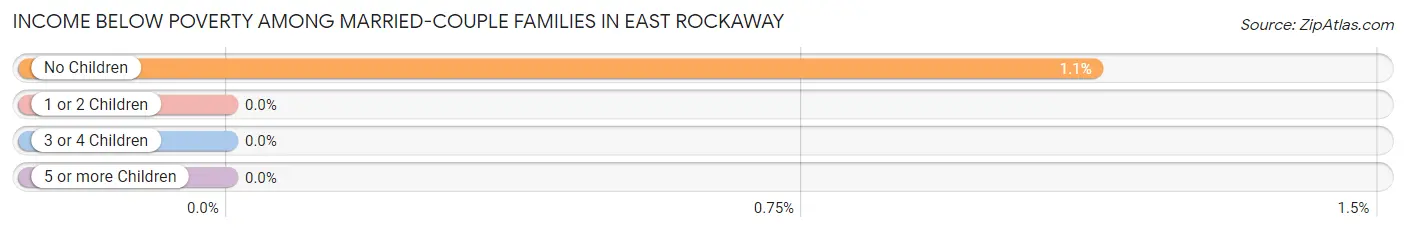
| Children | Above Poverty | Below Poverty |
| No Children | 1,137 (98.9%) | 13 (1.1%) |
| 1 or 2 Children | 606 (100.0%) | 0 (0.0%) |
| 3 or 4 Children | 211 (100.0%) | 0 (0.0%) |
| 5 or more Children | 0 (0.0%) | 0 (0.0%) |
| Total | 1,954 (99.3%) | 13 (0.7%) |
Income Below Poverty Among Single-Parent Households in East Rockaway
According to the poverty data in East Rockaway, 16.9% or 13 single-father households and 9.3% or 53 single-mother households are living below the poverty line. Among single-father households, those with 1 or 2 children have the highest poverty rate, with 13 households (100.0%) experiencing poverty. Likewise, among single-mother households, those with 1 or 2 children have the highest poverty rate, with 53 households (16.6%) falling below the poverty line.
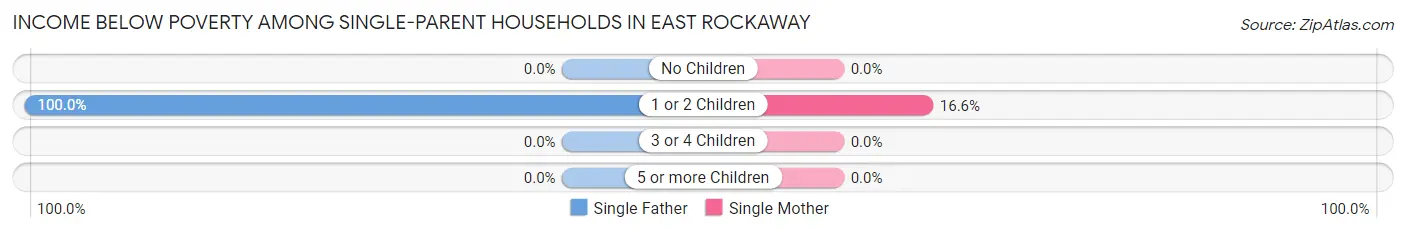
| Children | Single Father | Single Mother |
| No Children | 0 (0.0%) | 0 (0.0%) |
| 1 or 2 Children | 13 (100.0%) | 53 (16.6%) |
| 3 or 4 Children | 0 (0.0%) | 0 (0.0%) |
| 5 or more Children | 0 (0.0%) | 0 (0.0%) |
| Total | 13 (16.9%) | 53 (9.3%) |
Income Below Poverty Among Married-Couple vs Single-Parent Households in East Rockaway
The poverty data for East Rockaway shows that 13 of the married-couple family households (0.7%) and 66 of the single-parent households (10.2%) are living below the poverty level. Within the married-couple family households, those with no children have the highest poverty rate, with 13 households (1.1%) falling below the poverty line. Among the single-parent households, those with 1 or 2 children have the highest poverty rate, with 66 household (19.9%) living below poverty.
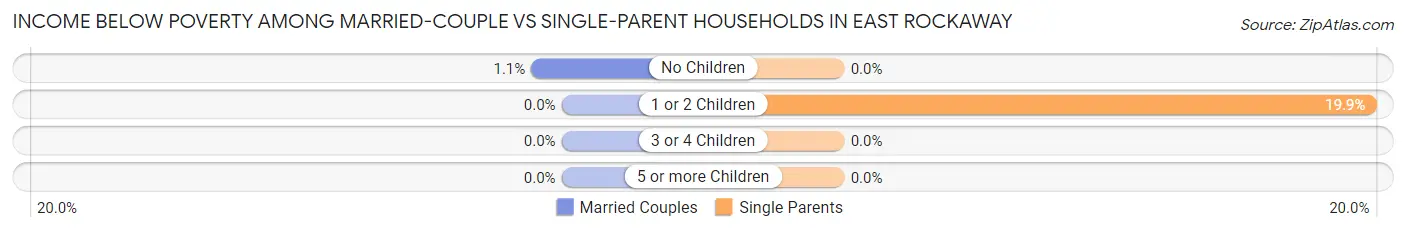
| Children | Married-Couple Families | Single-Parent Households |
| No Children | 13 (1.1%) | 0 (0.0%) |
| 1 or 2 Children | 0 (0.0%) | 66 (19.9%) |
| 3 or 4 Children | 0 (0.0%) | 0 (0.0%) |
| 5 or more Children | 0 (0.0%) | 0 (0.0%) |
| Total | 13 (0.7%) | 66 (10.2%) |
Race in East Rockaway
The most populous races in East Rockaway are White / Caucasian (8,328 | 82.7%), Hispanic or Latino (958 | 9.5%), and Black / African American (629 | 6.2%).
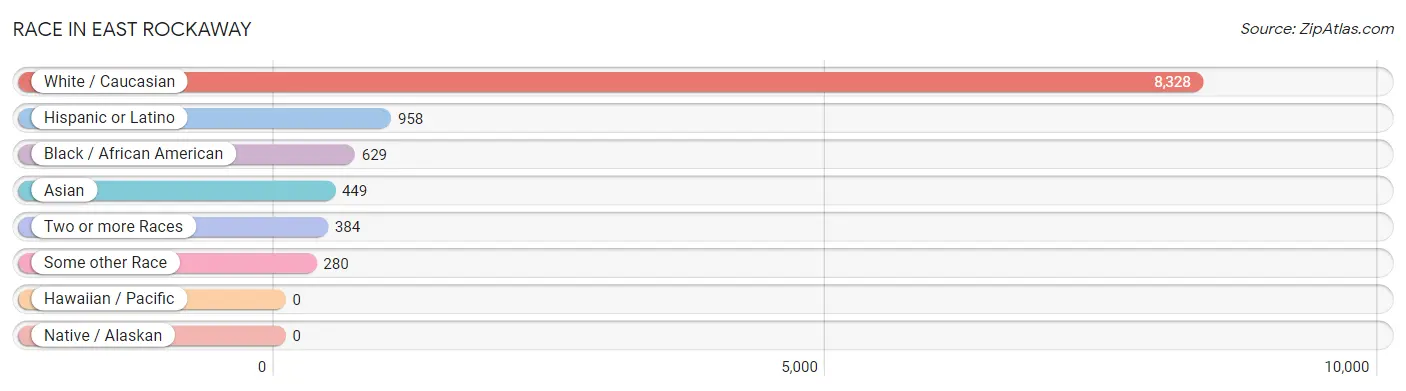
| Race | # Population | % Population |
| Asian | 449 | 4.5% |
| Black / African American | 629 | 6.2% |
| Hawaiian / Pacific | 0 | 0.0% |
| Hispanic or Latino | 958 | 9.5% |
| Native / Alaskan | 0 | 0.0% |
| White / Caucasian | 8,328 | 82.7% |
| Two or more Races | 384 | 3.8% |
| Some other Race | 280 | 2.8% |
| Total | 10,070 | 100.0% |
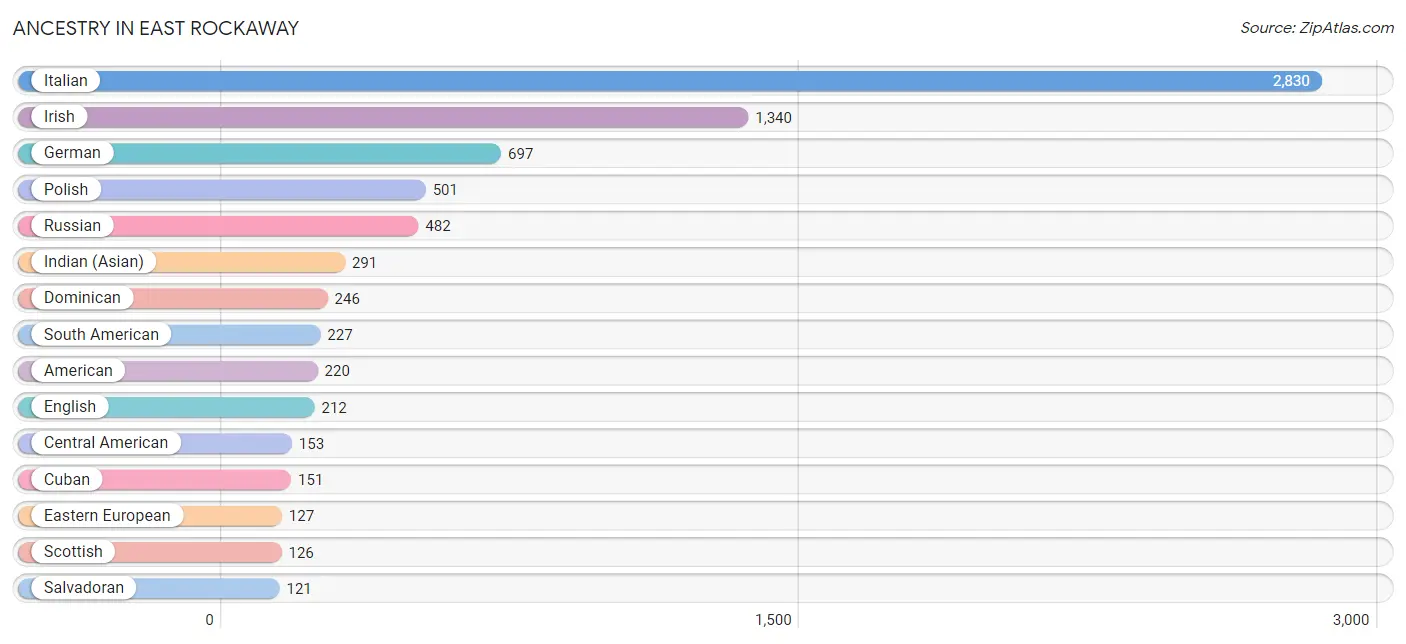
Ancestry in East Rockaway
The most populous ancestries reported in East Rockaway are Italian (2,830 | 28.1%), Irish (1,340 | 13.3%), German (697 | 6.9%), Polish (501 | 5.0%), and Russian (482 | 4.8%), together accounting for 58.1% of all East Rockaway residents.
| Ancestry | # Population | % Population |
| African | 18 | 0.2% |
| American | 220 | 2.2% |
| Arab | 11 | 0.1% |
| Austrian | 9 | 0.1% |
| Blackfeet | 10 | 0.1% |
| Bolivian | 47 | 0.5% |
| Canadian | 13 | 0.1% |
| Central American | 153 | 1.5% |
| Colombian | 117 | 1.2% |
| Cuban | 151 | 1.5% |
| Czech | 13 | 0.1% |
| Danish | 14 | 0.1% |
| Dominican | 246 | 2.4% |
| Eastern European | 127 | 1.3% |
| Ecuadorian | 18 | 0.2% |
| English | 212 | 2.1% |
| European | 44 | 0.4% |
| French | 25 | 0.3% |
| German | 697 | 6.9% |
| Greek | 77 | 0.8% |
| Guatemalan | 32 | 0.3% |
| Haitian | 60 | 0.6% |
| Hungarian | 25 | 0.3% |
| Indian (Asian) | 291 | 2.9% |
| Iraqi | 11 | 0.1% |
| Irish | 1,340 | 13.3% |
| Italian | 2,830 | 28.1% |
| Korean | 58 | 0.6% |
| Nigerian | 23 | 0.2% |
| Norwegian | 105 | 1.0% |
| Peruvian | 45 | 0.4% |
| Polish | 501 | 5.0% |
| Puerto Rican | 107 | 1.1% |
| Russian | 482 | 4.8% |
| Salvadoran | 121 | 1.2% |
| Scandinavian | 37 | 0.4% |
| Scotch-Irish | 13 | 0.1% |
| Scottish | 126 | 1.3% |
| Slovak | 15 | 0.2% |
| South American | 227 | 2.2% |
| Spanish | 20 | 0.2% |
| Subsaharan African | 41 | 0.4% |
| Syrian | 11 | 0.1% |
| Thai | 100 | 1.0% |
| Ukrainian | 28 | 0.3% |
| Welsh | 14 | 0.1% |
| West Indian | 99 | 1.0% | View All 47 Rows |
Immigrants in East Rockaway
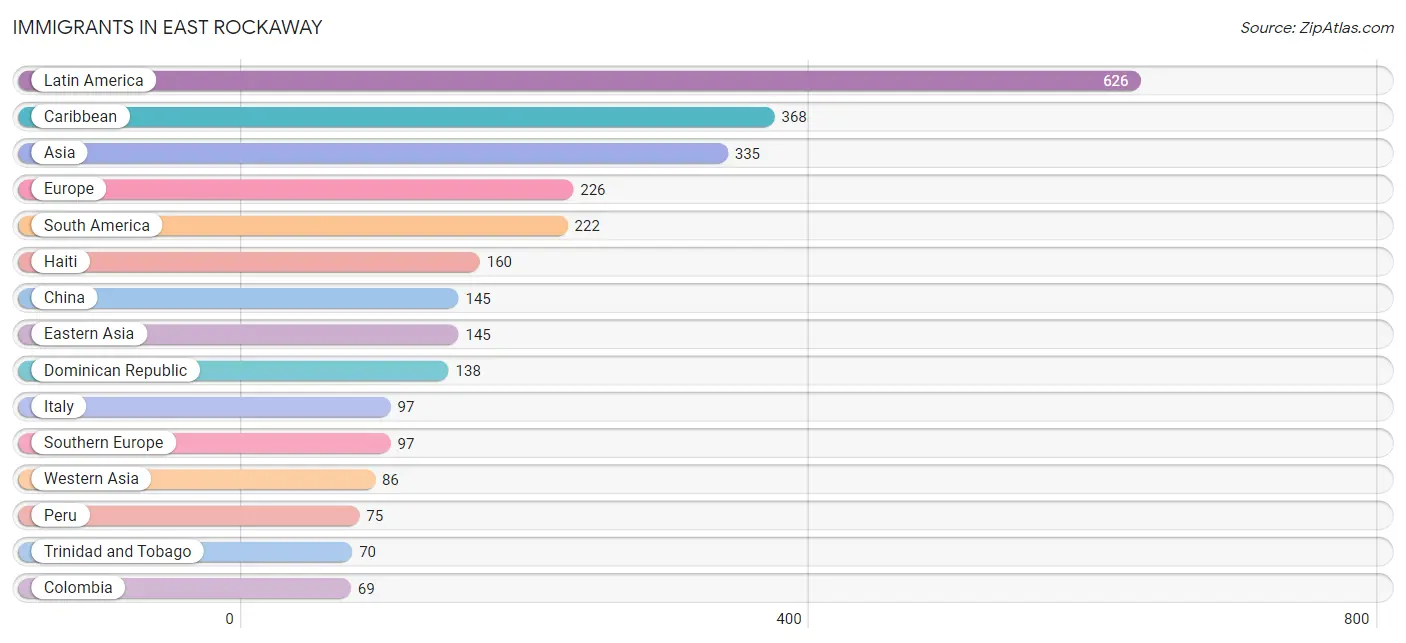
The most numerous immigrant groups reported in East Rockaway came from Latin America (626 | 6.2%), Caribbean (368 | 3.6%), Asia (335 | 3.3%), Europe (226 | 2.2%), and South America (222 | 2.2%), together accounting for 17.6% of all East Rockaway residents.
| Immigration Origin | # Population | % Population |
| Argentina | 17 | 0.2% |
| Asia | 335 | 3.3% |
| Caribbean | 368 | 3.6% |
| Central America | 36 | 0.4% |
| Chile | 43 | 0.4% |
| China | 145 | 1.4% |
| Colombia | 69 | 0.7% |
| Dominican Republic | 138 | 1.4% |
| Eastern Asia | 145 | 1.4% |
| Eastern Europe | 64 | 0.6% |
| Ecuador | 18 | 0.2% |
| El Salvador | 36 | 0.4% |
| England | 16 | 0.2% |
| Europe | 226 | 2.2% |
| Germany | 17 | 0.2% |
| Haiti | 160 | 1.6% |
| India | 47 | 0.5% |
| Ireland | 32 | 0.3% |
| Israel | 36 | 0.4% |
| Italy | 97 | 1.0% |
| Latin America | 626 | 6.2% |
| Northern Europe | 48 | 0.5% |
| Pakistan | 13 | 0.1% |
| Peru | 75 | 0.7% |
| Philippines | 44 | 0.4% |
| Russia | 64 | 0.6% |
| South America | 222 | 2.2% |
| South Central Asia | 60 | 0.6% |
| South Eastern Asia | 44 | 0.4% |
| Southern Europe | 97 | 1.0% |
| Trinidad and Tobago | 70 | 0.7% |
| Turkey | 50 | 0.5% |
| Western Asia | 86 | 0.9% |
| Western Europe | 17 | 0.2% | View All 34 Rows |
Sex and Age in East Rockaway
Sex and Age in East Rockaway
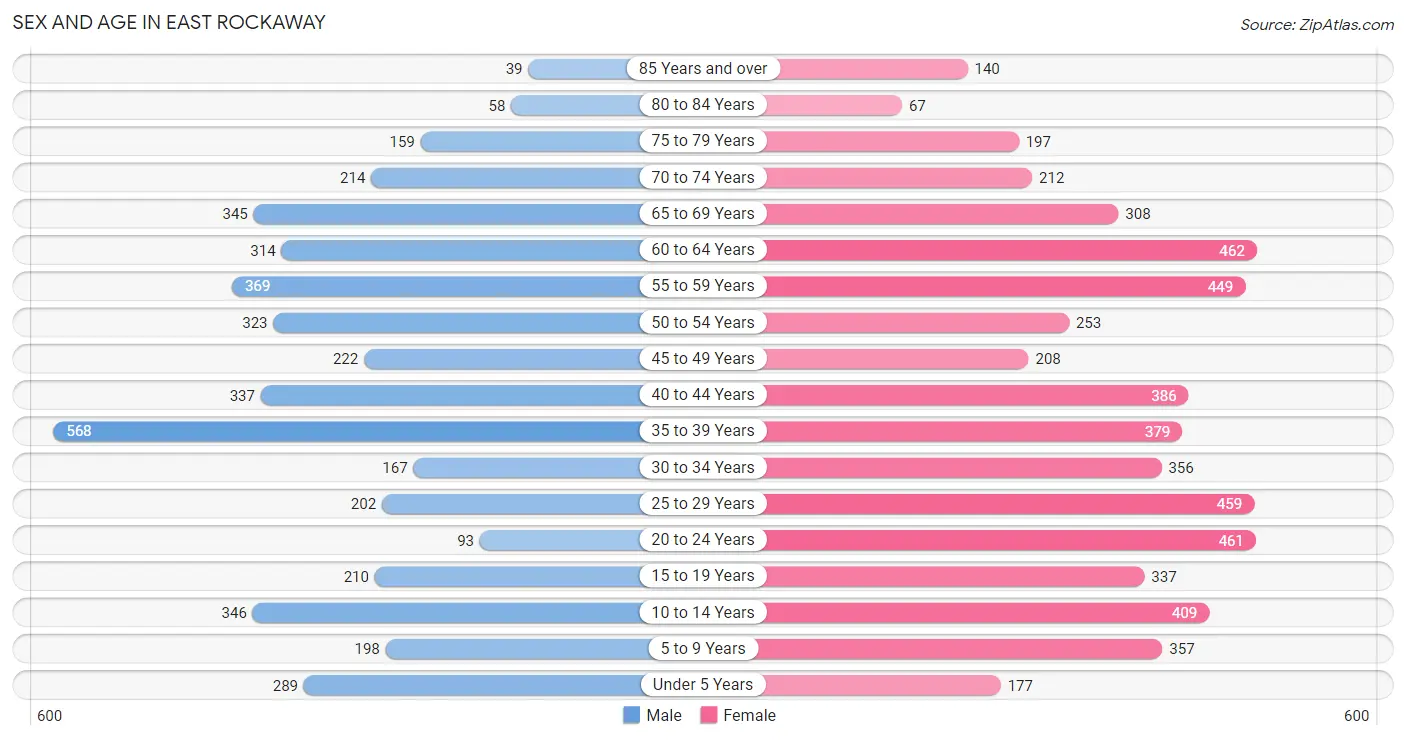
The most populous age groups in East Rockaway are 35 to 39 Years (568 | 12.8%) for men and 60 to 64 Years (462 | 8.2%) for women.
| Age Bracket | Male | Female |
| Under 5 Years | 289 (6.5%) | 177 (3.2%) |
| 5 to 9 Years | 198 (4.4%) | 357 (6.4%) |
| 10 to 14 Years | 346 (7.8%) | 409 (7.3%) |
| 15 to 19 Years | 210 (4.7%) | 337 (6.0%) |
| 20 to 24 Years | 93 (2.1%) | 461 (8.2%) |
| 25 to 29 Years | 202 (4.5%) | 459 (8.2%) |
| 30 to 34 Years | 167 (3.7%) | 356 (6.3%) |
| 35 to 39 Years | 568 (12.8%) | 379 (6.8%) |
| 40 to 44 Years | 337 (7.6%) | 386 (6.9%) |
| 45 to 49 Years | 222 (5.0%) | 208 (3.7%) |
| 50 to 54 Years | 323 (7.2%) | 253 (4.5%) |
| 55 to 59 Years | 369 (8.3%) | 449 (8.0%) |
| 60 to 64 Years | 314 (7.0%) | 462 (8.2%) |
| 65 to 69 Years | 345 (7.7%) | 308 (5.5%) |
| 70 to 74 Years | 214 (4.8%) | 212 (3.8%) |
| 75 to 79 Years | 159 (3.6%) | 197 (3.5%) |
| 80 to 84 Years | 58 (1.3%) | 67 (1.2%) |
| 85 Years and over | 39 (0.9%) | 140 (2.5%) |
| Total | 4,453 (100.0%) | 5,617 (100.0%) |
Families and Households in East Rockaway
Median Family Size in East Rockaway
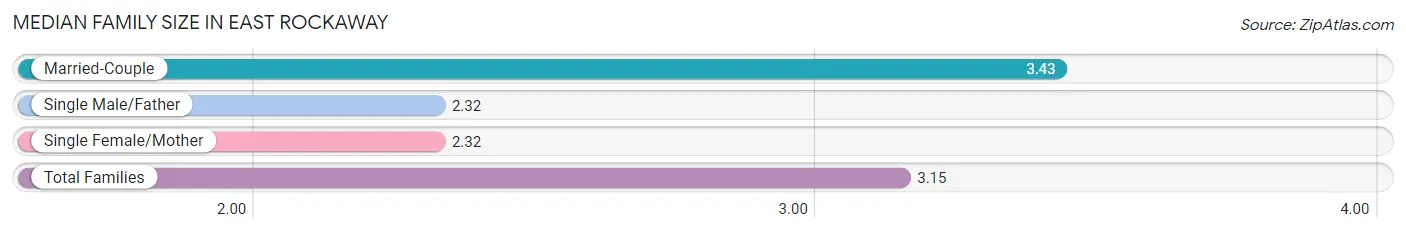
The median family size in East Rockaway is 3.15 persons per family, with married-couple families (1,967 | 75.3%) accounting for the largest median family size of 3.43 persons per family. On the other hand, single male/father families (77 | 2.9%) represent the smallest median family size with 2.32 persons per family.
| Family Type | # Families | Family Size |
| Married-Couple | 1,967 (75.3%) | 3.43 |
| Single Male/Father | 77 (2.9%) | 2.32 |
| Single Female/Mother | 567 (21.7%) | 2.32 |
| Total Families | 2,611 (100.0%) | 3.15 |
Median Household Size in East Rockaway
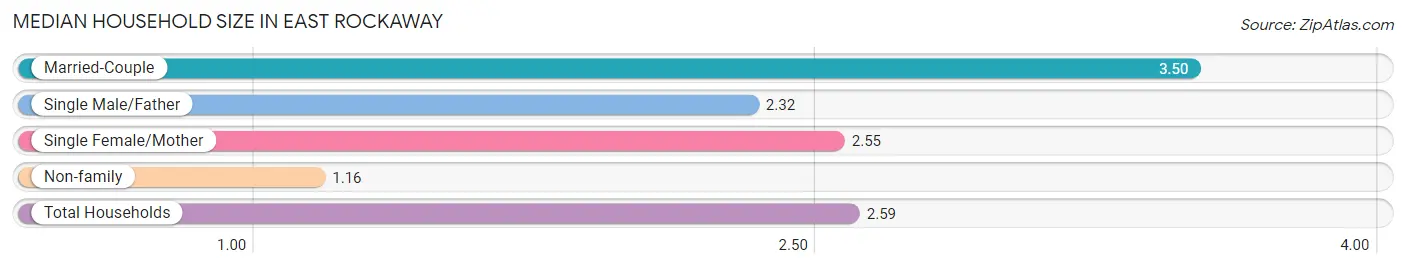
The median household size in East Rockaway is 2.59 persons per household, with married-couple households (1,967 | 51.5%) accounting for the largest median household size of 3.5 persons per household. non-family households (1,211 | 31.7%) represent the smallest median household size with 1.16 persons per household.
| Household Type | # Households | Household Size |
| Married-Couple | 1,967 (51.5%) | 3.50 |
| Single Male/Father | 77 (2.0%) | 2.32 |
| Single Female/Mother | 567 (14.8%) | 2.55 |
| Non-family | 1,211 (31.7%) | 1.16 |
| Total Households | 3,822 (100.0%) | 2.59 |
Household Size by Marriage Status in East Rockaway
Out of a total of 3,822 households in East Rockaway, 2,611 (68.3%) are family households, while 1,211 (31.7%) are nonfamily households. The most numerous type of family households are 2-person households, comprising 985, and the most common type of nonfamily households are 1-person households, comprising 1,049.
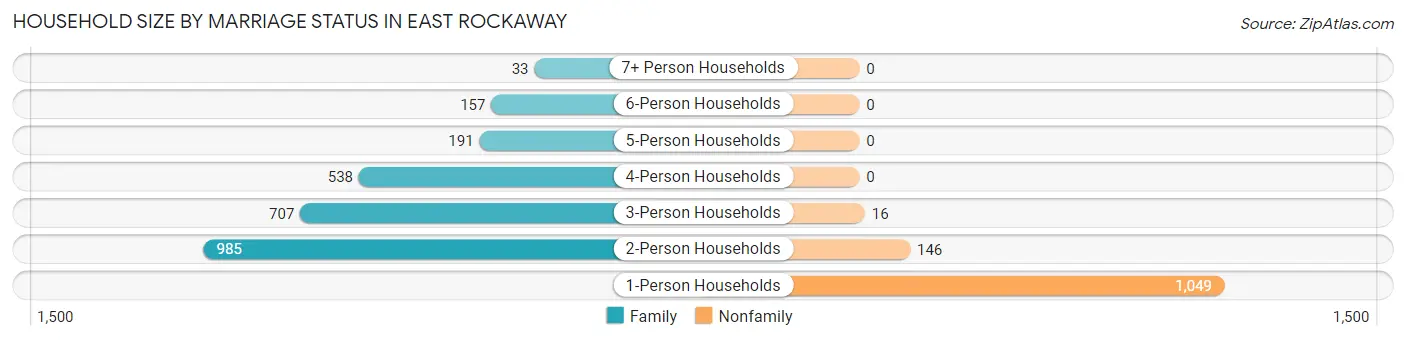
| Household Size | Family Households | Nonfamily Households |
| 1-Person Households | - | 1,049 (27.5%) |
| 2-Person Households | 985 (25.8%) | 146 (3.8%) |
| 3-Person Households | 707 (18.5%) | 16 (0.4%) |
| 4-Person Households | 538 (14.1%) | 0 (0.0%) |
| 5-Person Households | 191 (5.0%) | 0 (0.0%) |
| 6-Person Households | 157 (4.1%) | 0 (0.0%) |
| 7+ Person Households | 33 (0.9%) | 0 (0.0%) |
| Total | 2,611 (68.3%) | 1,211 (31.7%) |
Female Fertility in East Rockaway
Fertility by Age in East Rockaway
Average fertility rate in East Rockaway is 37.0 births per 1,000 women. Women in the age bracket of 35 to 50 years have the highest fertility rate with 96.0 births per 1,000 women. Women in the age bracket of 35 to 50 years acount for 100.0% of all women with births.
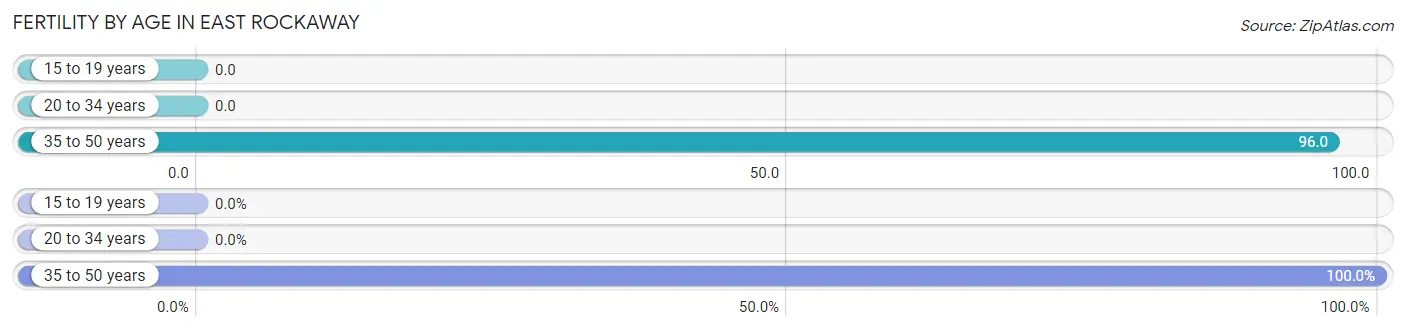
| Age Bracket | Women with Births | Births / 1,000 Women |
| 15 to 19 years | 0 (0.0%) | 0.0 |
| 20 to 34 years | 0 (0.0%) | 0.0 |
| 35 to 50 years | 98 (100.0%) | 96.0 |
| Total | 98 (100.0%) | 37.0 |
Fertility by Age by Marriage Status in East Rockaway
77.6% of women with births (98) in East Rockaway are married. The highest percentage of unmarried women with births falls into 35 to 50 years age bracket with 22.5% of them unmarried at the time of birth, while the lowest percentage of unmarried women with births belong to 35 to 50 years age bracket with 22.5% of them unmarried.
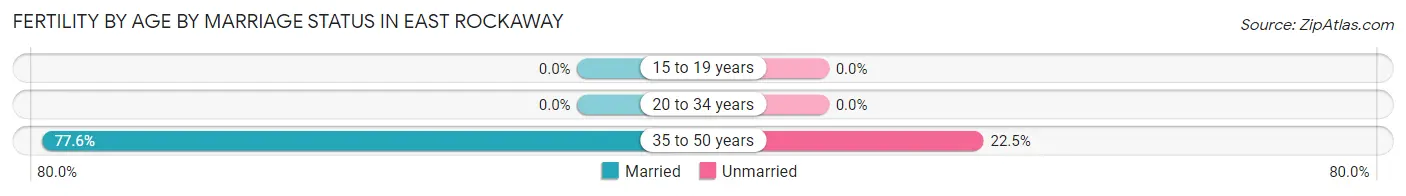
| Age Bracket | Married | Unmarried |
| 15 to 19 years | 0 (0.0%) | 0 (0.0%) |
| 20 to 34 years | 0 (0.0%) | 0 (0.0%) |
| 35 to 50 years | 76 (77.5%) | 22 (22.5%) |
| Total | 76 (77.5%) | 22 (22.5%) |
Fertility by Education in East Rockaway
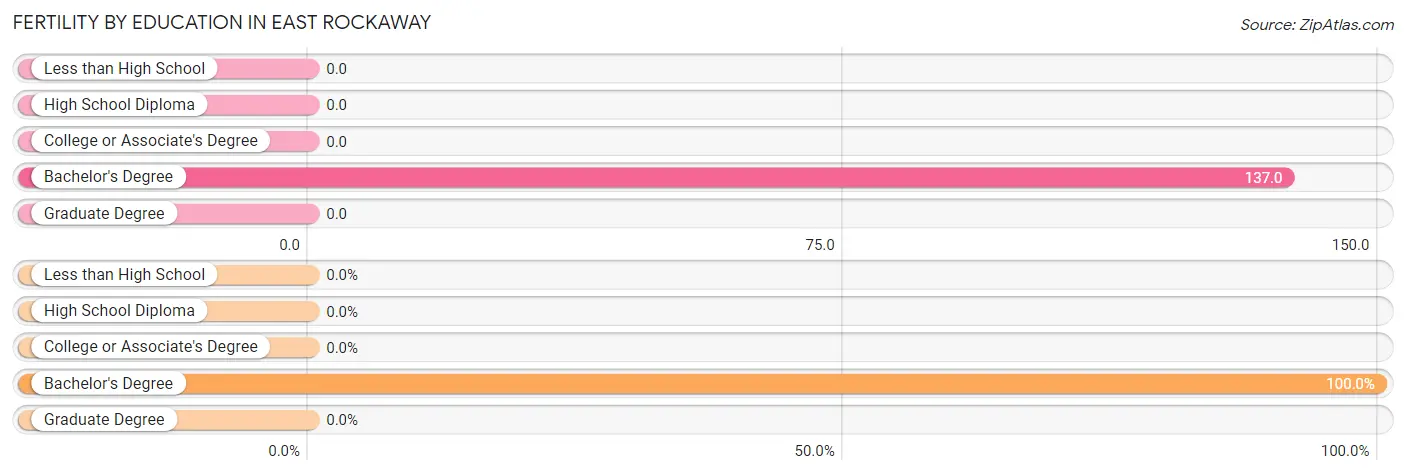
| Educational Attainment | Women with Births | Births / 1,000 Women |
| Less than High School | 0 (0.0%) | 0.0 |
| High School Diploma | 0 (0.0%) | 0.0 |
| College or Associate's Degree | 0 (0.0%) | 0.0 |
| Bachelor's Degree | 98 (100.0%) | 137.0 |
| Graduate Degree | 0 (0.0%) | 0.0 |
| Total | 98 (100.0%) | 37.0 |
Fertility by Education by Marriage Status in East Rockaway
22.5% of women with births in East Rockaway are unmarried. Women with the educational attainment of bachelor's degree are most likely to be married with 77.5% of them married at childbirth, while women with the educational attainment of bachelor's degree are least likely to be married with 22.5% of them unmarried at childbirth.
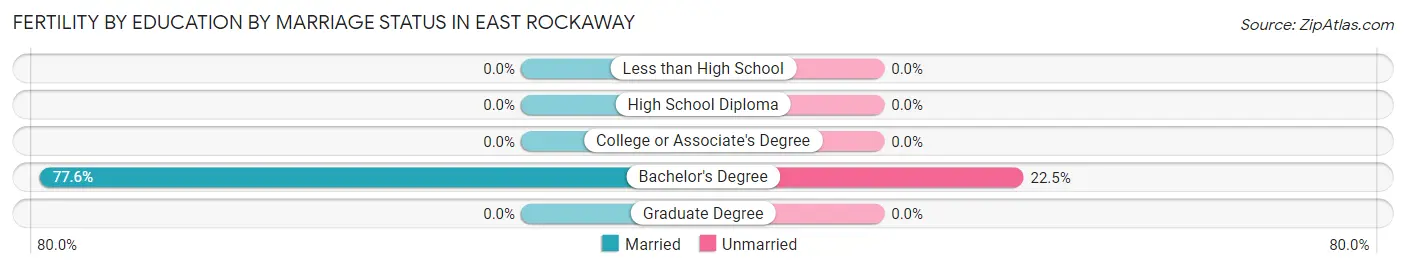
| Educational Attainment | Married | Unmarried |
| Less than High School | 0 (0.0%) | 0 (0.0%) |
| High School Diploma | 0 (0.0%) | 0 (0.0%) |
| College or Associate's Degree | 0 (0.0%) | 0 (0.0%) |
| Bachelor's Degree | 76 (77.5%) | 22 (22.5%) |
| Graduate Degree | 0 (0.0%) | 0 (0.0%) |
| Total | 76 (77.5%) | 22 (22.5%) |
Employment Characteristics in East Rockaway
Employment by Class of Employer in East Rockaway
Among the 5,126 employed individuals in East Rockaway, private company employees (3,078 | 60.1%), local government employees (802 | 15.7%), and not-for-profit organizations (627 | 12.2%) make up the most common classes of employment.
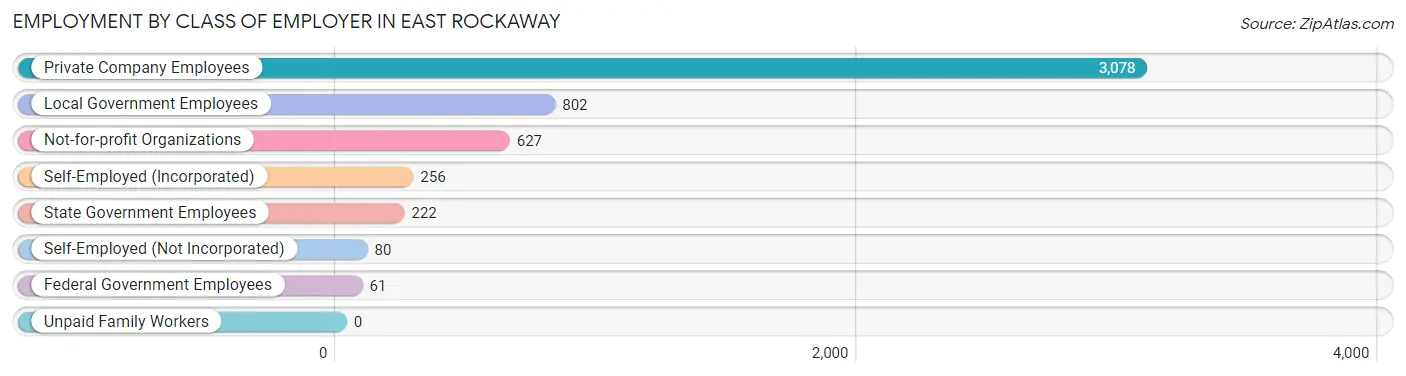
| Employer Class | # Employees | % Employees |
| Private Company Employees | 3,078 | 60.1% |
| Self-Employed (Incorporated) | 256 | 5.0% |
| Self-Employed (Not Incorporated) | 80 | 1.6% |
| Not-for-profit Organizations | 627 | 12.2% |
| Local Government Employees | 802 | 15.7% |
| State Government Employees | 222 | 4.3% |
| Federal Government Employees | 61 | 1.2% |
| Unpaid Family Workers | 0 | 0.0% |
| Total | 5,126 | 100.0% |
Employment Status by Age in East Rockaway
According to the labor force statistics for East Rockaway, out of the total population over 16 years of age (8,137), 68.9% or 5,606 individuals are in the labor force, with 6.3% or 353 of them unemployed. The age group with the highest labor force participation rate is 25 to 29 years, with 96.5% or 638 individuals in the labor force. Within the labor force, the 65 to 74 years age range has the highest percentage of unemployed individuals, with 11.6% or 60 of them being unemployed.
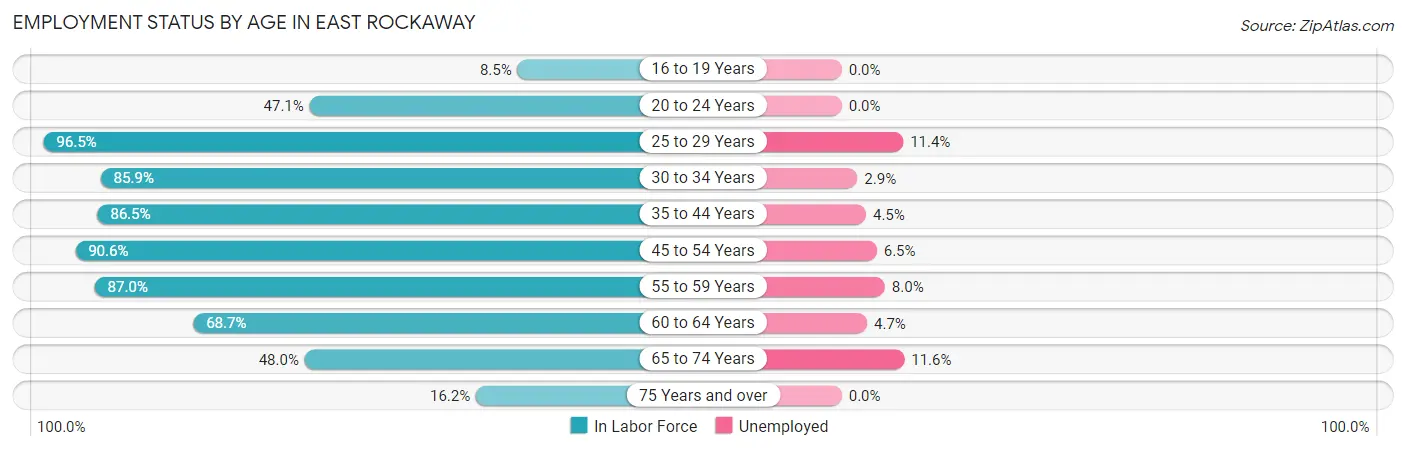
| Age Bracket | In Labor Force | Unemployed |
| 16 to 19 Years | 33 (8.5%) | 0 (0.0%) |
| 20 to 24 Years | 261 (47.1%) | 0 (0.0%) |
| 25 to 29 Years | 638 (96.5%) | 73 (11.4%) |
| 30 to 34 Years | 449 (85.9%) | 13 (2.9%) |
| 35 to 44 Years | 1,445 (86.5%) | 65 (4.5%) |
| 45 to 54 Years | 911 (90.6%) | 59 (6.5%) |
| 55 to 59 Years | 712 (87.0%) | 57 (8.0%) |
| 60 to 64 Years | 533 (68.7%) | 25 (4.7%) |
| 65 to 74 Years | 518 (48.0%) | 60 (11.6%) |
| 75 Years and over | 107 (16.2%) | 0 (0.0%) |
| Total | 5,606 (68.9%) | 353 (6.3%) |
Employment Status by Educational Attainment in East Rockaway
According to labor force statistics for East Rockaway, 86.0% of individuals (4,690) out of the total population between 25 and 64 years of age (5,454) are in the labor force, with 6.2% or 291 of them being unemployed. The group with the highest labor force participation rate are those with the educational attainment of bachelor's degree or higher, with 90.0% or 2,444 individuals in the labor force. Within the labor force, individuals with high school diploma education have the highest percentage of unemployment, with 11.3% or 113 of them being unemployed.
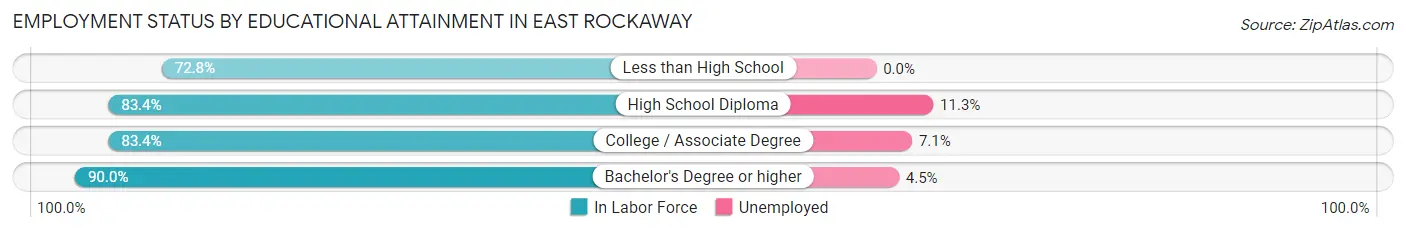
| Educational Attainment | In Labor Force | Unemployed |
| Less than High School | 273 (72.8%) | 0 (0.0%) |
| High School Diploma | 1,002 (83.4%) | 136 (11.3%) |
| College / Associate Degree | 970 (83.4%) | 83 (7.1%) |
| Bachelor's Degree or higher | 2,444 (90.0%) | 122 (4.5%) |
| Total | 4,690 (86.0%) | 338 (6.2%) |
Employment Occupations by Sex in East Rockaway
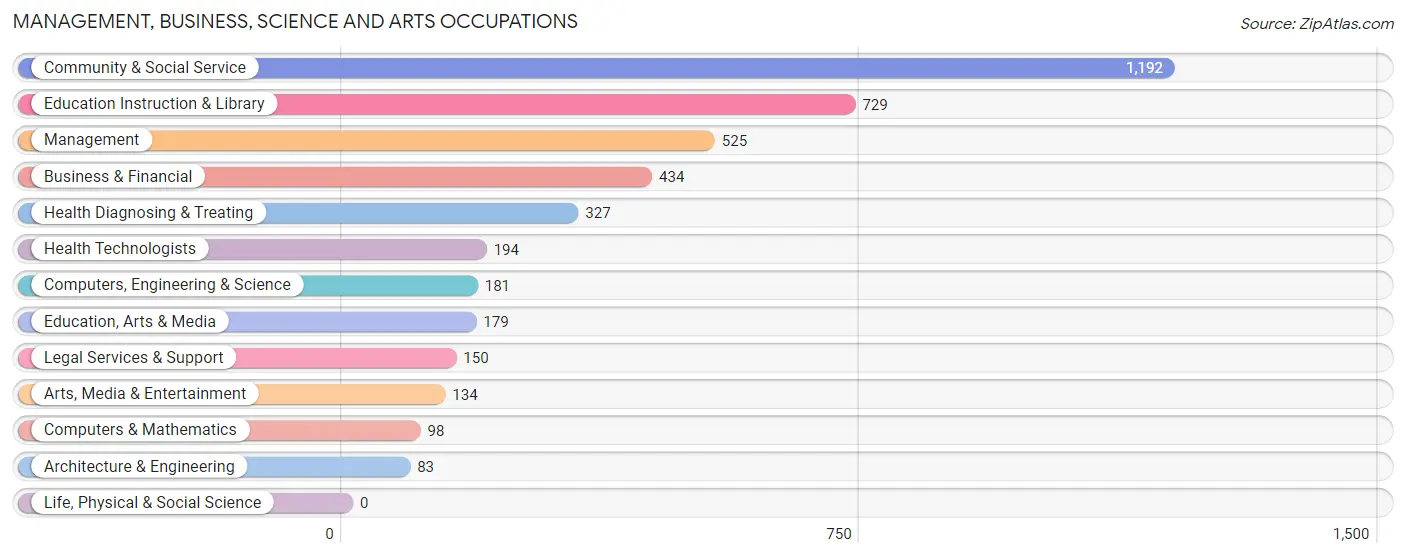
Management, Business, Science and Arts Occupations
The most common Management, Business, Science and Arts occupations in East Rockaway are Community & Social Service (1,192 | 22.7%), Education Instruction & Library (729 | 13.9%), Management (525 | 10.0%), Business & Financial (434 | 8.3%), and Health Diagnosing & Treating (327 | 6.2%).
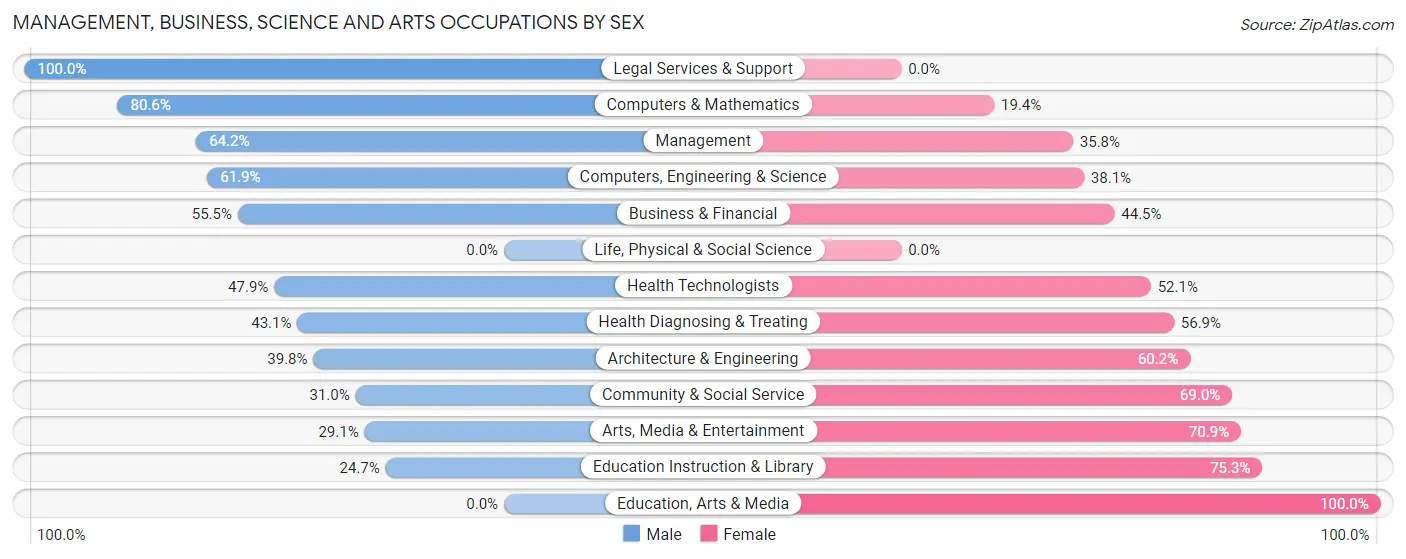
Management, Business, Science and Arts Occupations by Sex
Within the Management, Business, Science and Arts occupations in East Rockaway, the most male-oriented occupations are Legal Services & Support (100.0%), Computers & Mathematics (80.6%), and Management (64.2%), while the most female-oriented occupations are Education, Arts & Media (100.0%), Education Instruction & Library (75.3%), and Arts, Media & Entertainment (70.9%).
| Occupation | Male | Female |
| Management | 337 (64.2%) | 188 (35.8%) |
| Business & Financial | 241 (55.5%) | 193 (44.5%) |
| Computers, Engineering & Science | 112 (61.9%) | 69 (38.1%) |
| Computers & Mathematics | 79 (80.6%) | 19 (19.4%) |
| Architecture & Engineering | 33 (39.8%) | 50 (60.2%) |
| Life, Physical & Social Science | 0 (0.0%) | 0 (0.0%) |
| Community & Social Service | 369 (31.0%) | 823 (69.0%) |
| Education, Arts & Media | 0 (0.0%) | 179 (100.0%) |
| Legal Services & Support | 150 (100.0%) | 0 (0.0%) |
| Education Instruction & Library | 180 (24.7%) | 549 (75.3%) |
| Arts, Media & Entertainment | 39 (29.1%) | 95 (70.9%) |
| Health Diagnosing & Treating | 141 (43.1%) | 186 (56.9%) |
| Health Technologists | 93 (47.9%) | 101 (52.1%) |
| Total (Category) | 1,200 (45.1%) | 1,459 (54.9%) |
| Total (Overall) | 2,537 (48.3%) | 2,718 (51.7%) |
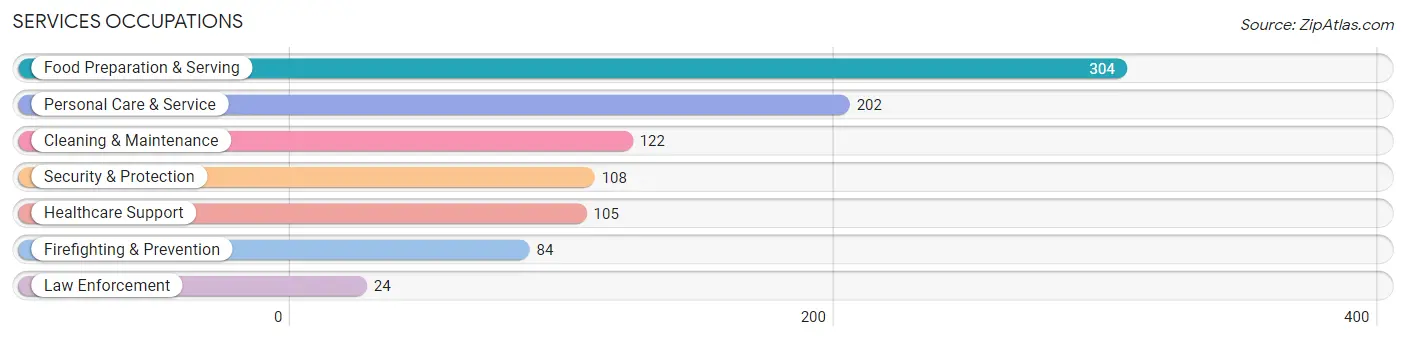
Services Occupations
The most common Services occupations in East Rockaway are Food Preparation & Serving (304 | 5.8%), Personal Care & Service (202 | 3.8%), Cleaning & Maintenance (122 | 2.3%), Security & Protection (108 | 2.1%), and Healthcare Support (105 | 2.0%).
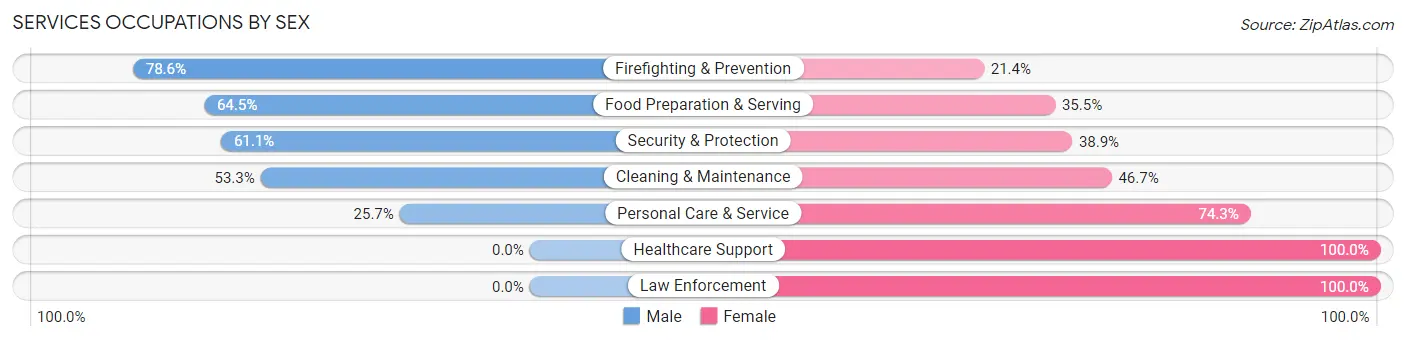
Services Occupations by Sex
Within the Services occupations in East Rockaway, the most male-oriented occupations are Firefighting & Prevention (78.6%), Food Preparation & Serving (64.5%), and Security & Protection (61.1%), while the most female-oriented occupations are Healthcare Support (100.0%), Law Enforcement (100.0%), and Personal Care & Service (74.3%).
| Occupation | Male | Female |
| Healthcare Support | 0 (0.0%) | 105 (100.0%) |
| Security & Protection | 66 (61.1%) | 42 (38.9%) |
| Firefighting & Prevention | 66 (78.6%) | 18 (21.4%) |
| Law Enforcement | 0 (0.0%) | 24 (100.0%) |
| Food Preparation & Serving | 196 (64.5%) | 108 (35.5%) |
| Cleaning & Maintenance | 65 (53.3%) | 57 (46.7%) |
| Personal Care & Service | 52 (25.7%) | 150 (74.3%) |
| Total (Category) | 379 (45.1%) | 462 (54.9%) |
| Total (Overall) | 2,537 (48.3%) | 2,718 (51.7%) |
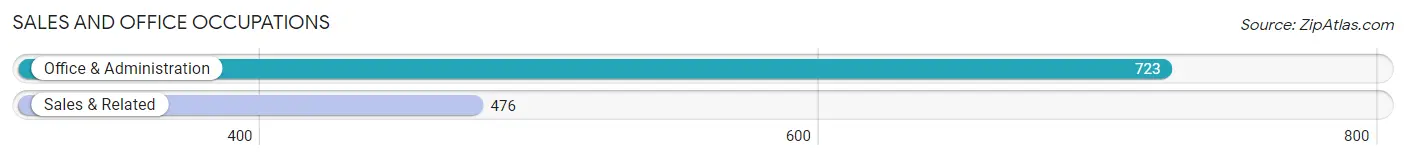
Sales and Office Occupations
The most common Sales and Office occupations in East Rockaway are Office & Administration (723 | 13.8%), and Sales & Related (476 | 9.1%).
Sales and Office Occupations by Sex
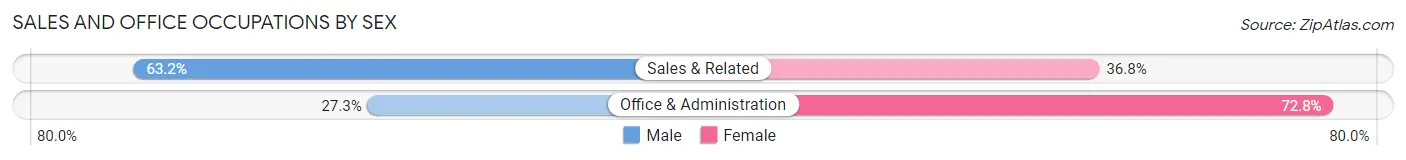
| Occupation | Male | Female |
| Sales & Related | 301 (63.2%) | 175 (36.8%) |
| Office & Administration | 197 (27.3%) | 526 (72.8%) |
| Total (Category) | 498 (41.5%) | 701 (58.5%) |
| Total (Overall) | 2,537 (48.3%) | 2,718 (51.7%) |
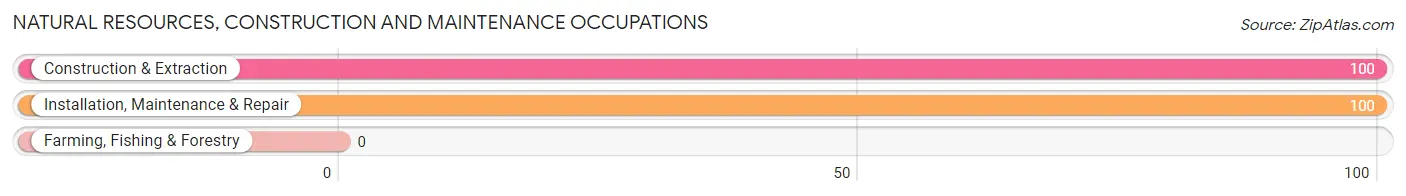
Natural Resources, Construction and Maintenance Occupations
The most common Natural Resources, Construction and Maintenance occupations in East Rockaway are Construction & Extraction (100 | 1.9%), and Installation, Maintenance & Repair (100 | 1.9%).
Natural Resources, Construction and Maintenance Occupations by Sex
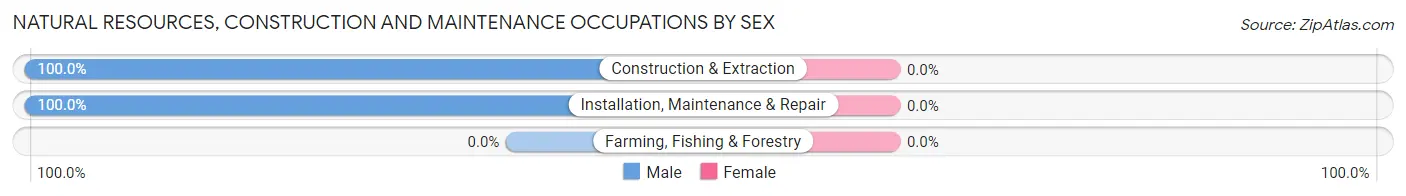
| Occupation | Male | Female |
| Farming, Fishing & Forestry | 0 (0.0%) | 0 (0.0%) |
| Construction & Extraction | 100 (100.0%) | 0 (0.0%) |
| Installation, Maintenance & Repair | 100 (100.0%) | 0 (0.0%) |
| Total (Category) | 200 (100.0%) | 0 (0.0%) |
| Total (Overall) | 2,537 (48.3%) | 2,718 (51.7%) |
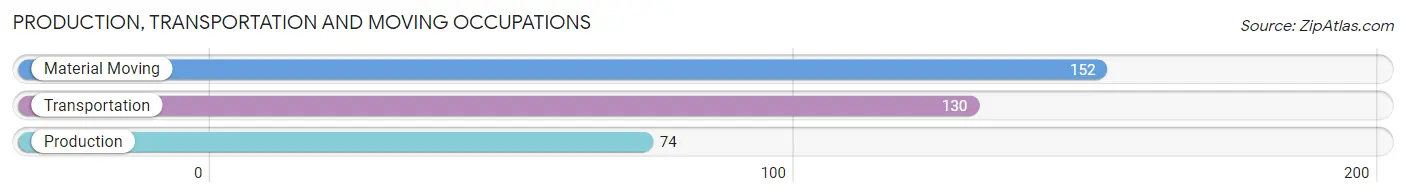
Production, Transportation and Moving Occupations
The most common Production, Transportation and Moving occupations in East Rockaway are Material Moving (152 | 2.9%), Transportation (130 | 2.5%), and Production (74 | 1.4%).
Production, Transportation and Moving Occupations by Sex
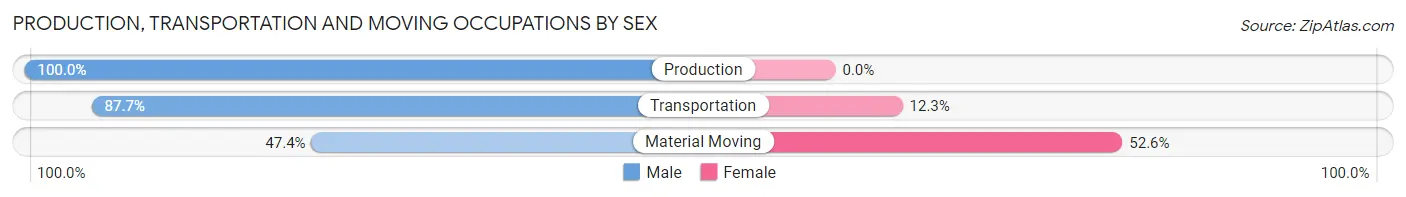
| Occupation | Male | Female |
| Production | 74 (100.0%) | 0 (0.0%) |
| Transportation | 114 (87.7%) | 16 (12.3%) |
| Material Moving | 72 (47.4%) | 80 (52.6%) |
| Total (Category) | 260 (73.0%) | 96 (27.0%) |
| Total (Overall) | 2,537 (48.3%) | 2,718 (51.7%) |
Employment Industries by Sex in East Rockaway
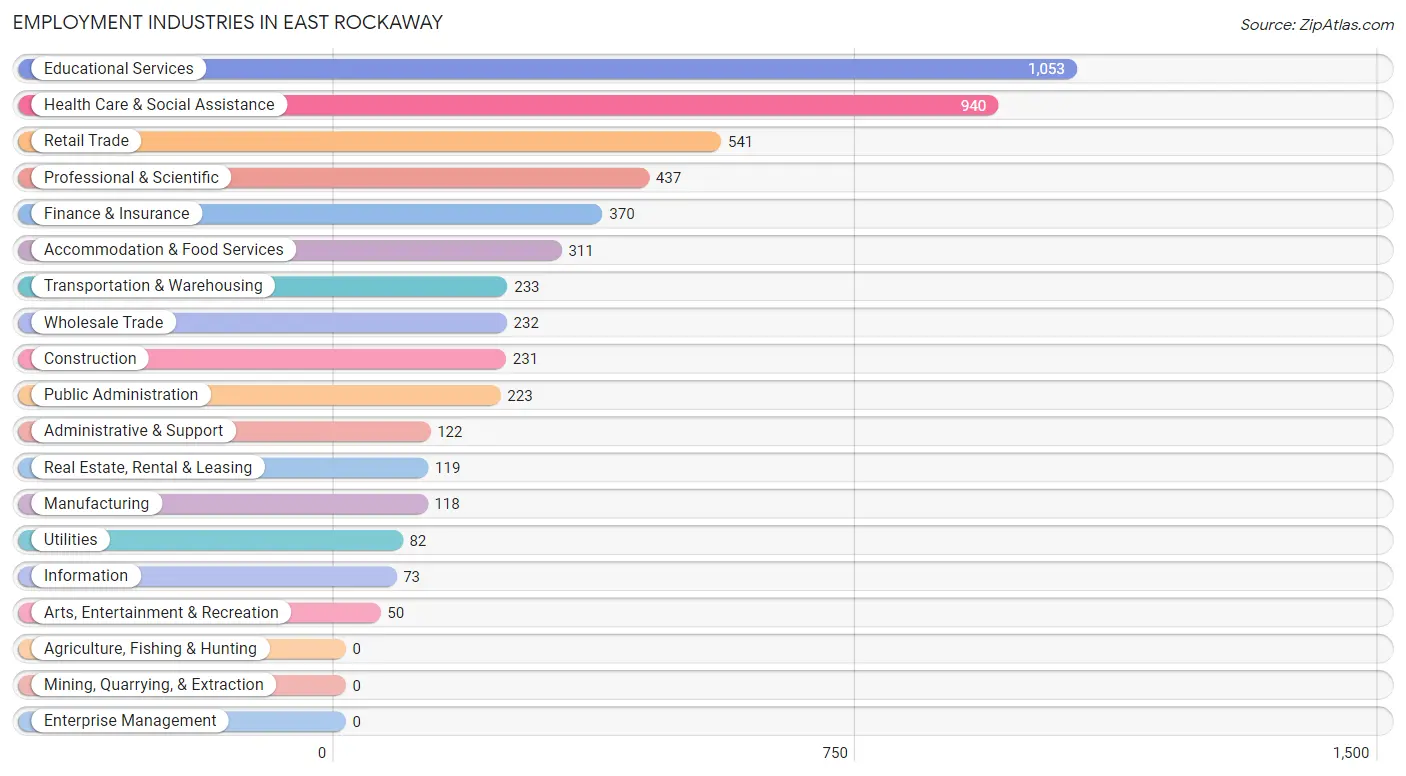
Employment Industries in East Rockaway
The major employment industries in East Rockaway include Educational Services (1,053 | 20.0%), Health Care & Social Assistance (940 | 17.9%), Retail Trade (541 | 10.3%), Professional & Scientific (437 | 8.3%), and Finance & Insurance (370 | 7.0%).
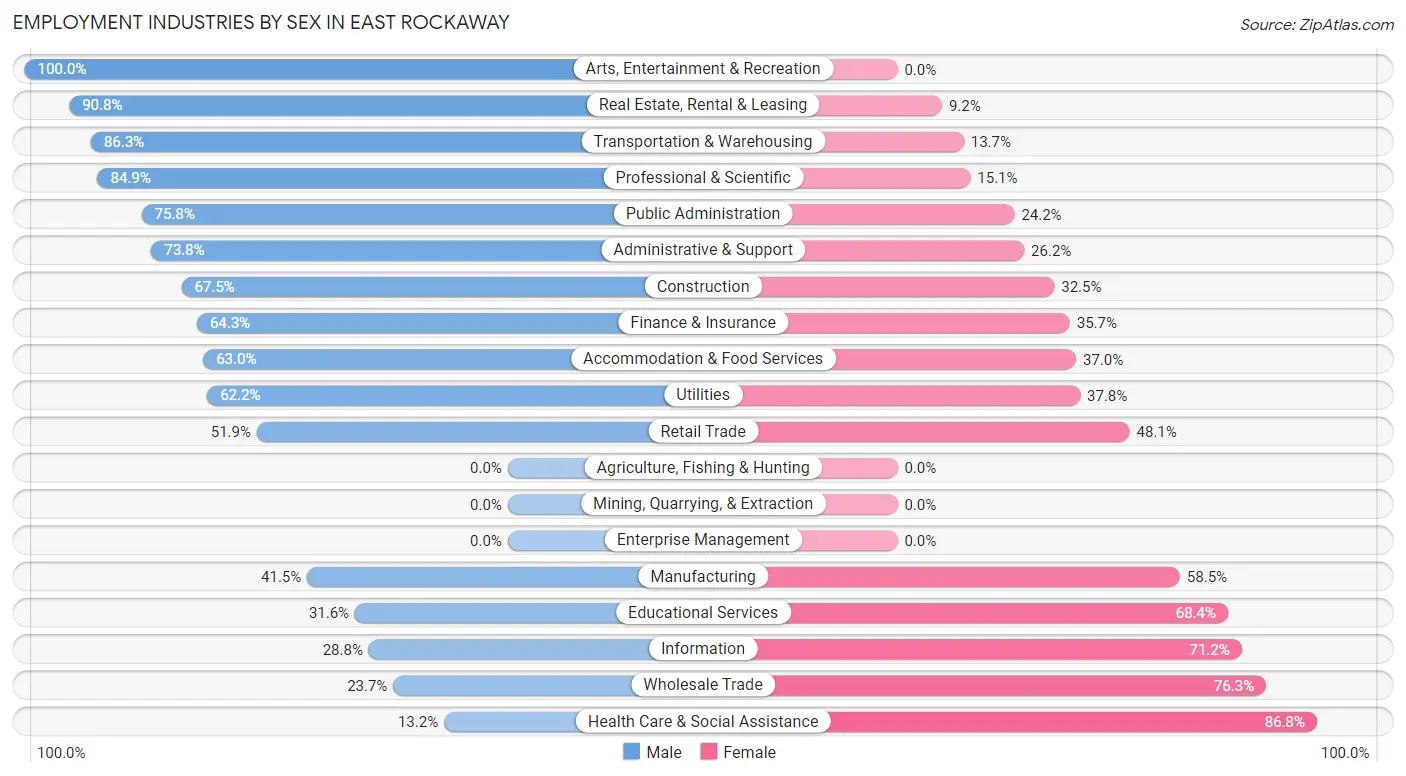
Employment Industries by Sex in East Rockaway
The East Rockaway industries that see more men than women are Arts, Entertainment & Recreation (100.0%), Real Estate, Rental & Leasing (90.8%), and Transportation & Warehousing (86.3%), whereas the industries that tend to have a higher number of women are Health Care & Social Assistance (86.8%), Wholesale Trade (76.3%), and Information (71.2%).
| Industry | Male | Female |
| Agriculture, Fishing & Hunting | 0 (0.0%) | 0 (0.0%) |
| Mining, Quarrying, & Extraction | 0 (0.0%) | 0 (0.0%) |
| Construction | 156 (67.5%) | 75 (32.5%) |
| Manufacturing | 49 (41.5%) | 69 (58.5%) |
| Wholesale Trade | 55 (23.7%) | 177 (76.3%) |
| Retail Trade | 281 (51.9%) | 260 (48.1%) |
| Transportation & Warehousing | 201 (86.3%) | 32 (13.7%) |
| Utilities | 51 (62.2%) | 31 (37.8%) |
| Information | 21 (28.8%) | 52 (71.2%) |
| Finance & Insurance | 238 (64.3%) | 132 (35.7%) |
| Real Estate, Rental & Leasing | 108 (90.8%) | 11 (9.2%) |
| Professional & Scientific | 371 (84.9%) | 66 (15.1%) |
| Enterprise Management | 0 (0.0%) | 0 (0.0%) |
| Administrative & Support | 90 (73.8%) | 32 (26.2%) |
| Educational Services | 333 (31.6%) | 720 (68.4%) |
| Health Care & Social Assistance | 124 (13.2%) | 816 (86.8%) |
| Arts, Entertainment & Recreation | 50 (100.0%) | 0 (0.0%) |
| Accommodation & Food Services | 196 (63.0%) | 115 (37.0%) |
| Public Administration | 169 (75.8%) | 54 (24.2%) |
| Total | 2,537 (48.3%) | 2,718 (51.7%) |
Education in East Rockaway
School Enrollment in East Rockaway
The most common levels of schooling among the 2,334 students in East Rockaway are middle school (615 | 26.4%), high school (563 | 24.1%), and elementary school (541 | 23.2%).
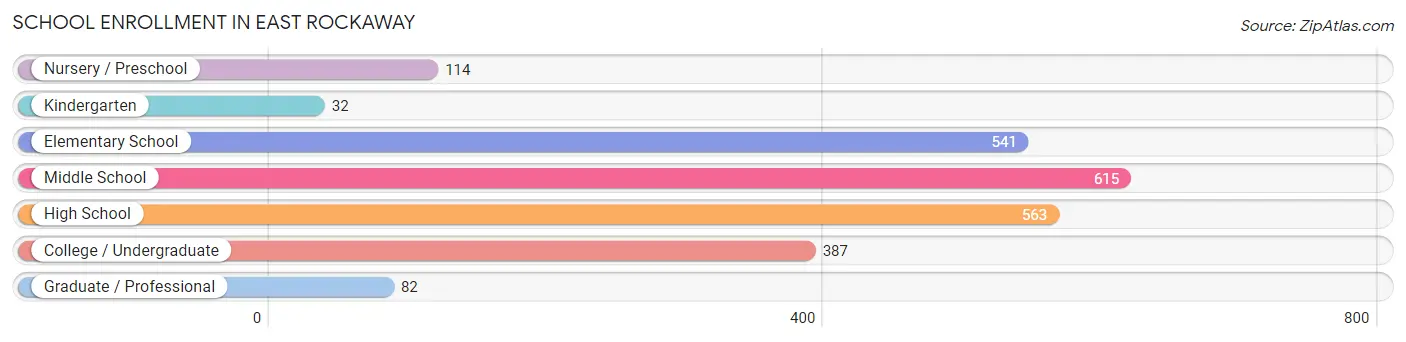
| School Level | # Students | % Students |
| Nursery / Preschool | 114 | 4.9% |
| Kindergarten | 32 | 1.4% |
| Elementary School | 541 | 23.2% |
| Middle School | 615 | 26.4% |
| High School | 563 | 24.1% |
| College / Undergraduate | 387 | 16.6% |
| Graduate / Professional | 82 | 3.5% |
| Total | 2,334 | 100.0% |
School Enrollment by Age by Funding Source in East Rockaway
Out of a total of 2,334 students who are enrolled in schools in East Rockaway, 327 (14.0%) attend a private institution, while the remaining 2,007 (86.0%) are enrolled in public schools. The age group of 3 to 4 year olds has the highest likelihood of being enrolled in private schools, with 114 (85.1% in the age bracket) enrolled. Conversely, the age group of 15 to 17 year olds has the lowest likelihood of being enrolled in a private school, with 438 (100.0% in the age bracket) attending a public institution.
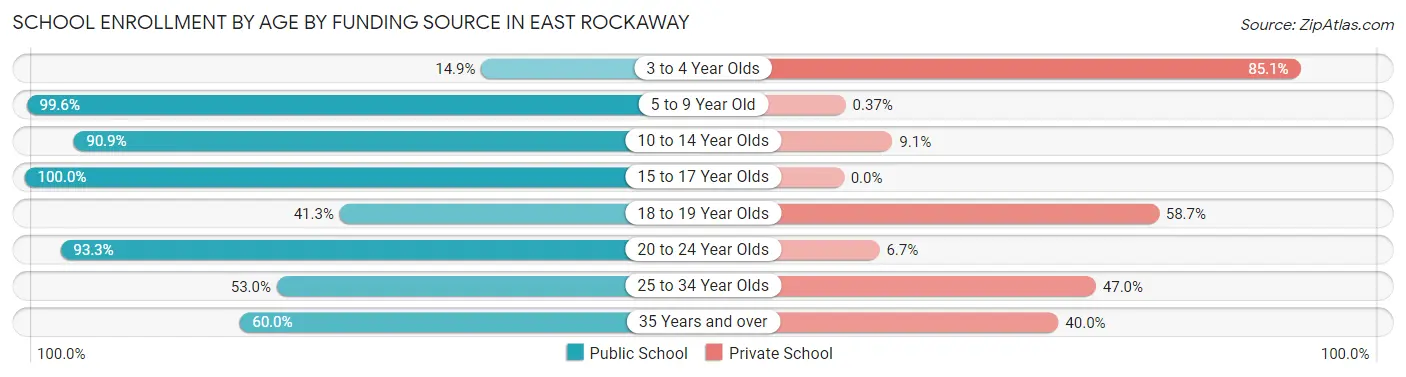
| Age Bracket | Public School | Private School |
| 3 to 4 Year Olds | 20 (14.9%) | 114 (85.1%) |
| 5 to 9 Year Old | 541 (99.6%) | 2 (0.4%) |
| 10 to 14 Year Olds | 641 (90.9%) | 64 (9.1%) |
| 15 to 17 Year Olds | 438 (100.0%) | 0 (0.0%) |
| 18 to 19 Year Olds | 38 (41.3%) | 54 (58.7%) |
| 20 to 24 Year Olds | 238 (93.3%) | 17 (6.7%) |
| 25 to 34 Year Olds | 70 (53.0%) | 62 (47.0%) |
| 35 Years and over | 21 (60.0%) | 14 (40.0%) |
| Total | 2,007 (86.0%) | 327 (14.0%) |
Educational Attainment by Field of Study in East Rockaway
Business (617 | 17.4%), education (539 | 15.2%), science & technology (396 | 11.2%), social sciences (349 | 9.8%), and psychology (244 | 6.9%) are the most common fields of study among 3,546 individuals in East Rockaway who have obtained a bachelor's degree or higher.
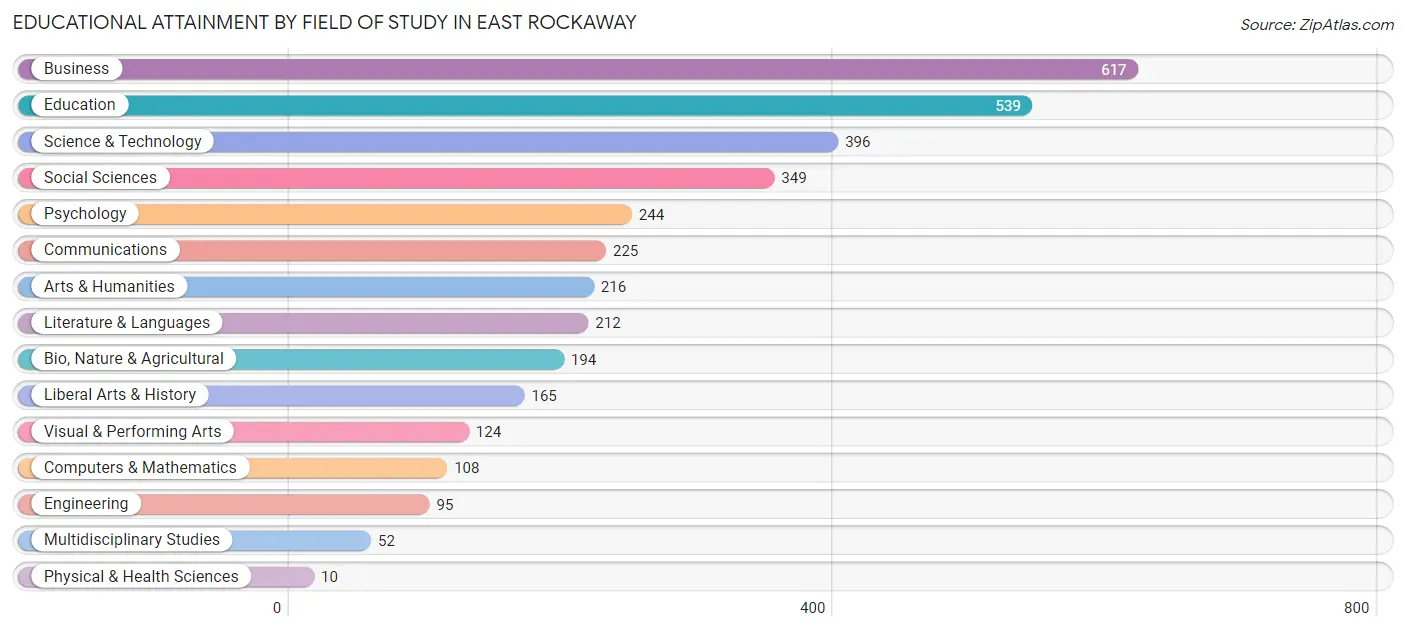
| Field of Study | # Graduates | % Graduates |
| Computers & Mathematics | 108 | 3.0% |
| Bio, Nature & Agricultural | 194 | 5.5% |
| Physical & Health Sciences | 10 | 0.3% |
| Psychology | 244 | 6.9% |
| Social Sciences | 349 | 9.8% |
| Engineering | 95 | 2.7% |
| Multidisciplinary Studies | 52 | 1.5% |
| Science & Technology | 396 | 11.2% |
| Business | 617 | 17.4% |
| Education | 539 | 15.2% |
| Literature & Languages | 212 | 6.0% |
| Liberal Arts & History | 165 | 4.6% |
| Visual & Performing Arts | 124 | 3.5% |
| Communications | 225 | 6.4% |
| Arts & Humanities | 216 | 6.1% |
| Total | 3,546 | 100.0% |
Transportation & Commute in East Rockaway
Vehicle Availability by Sex in East Rockaway
The most prevalent vehicle ownership categories in East Rockaway are males with 2 vehicles (1,265, accounting for 51.4%) and females with 2 vehicles (1,178, making up 47.4%).
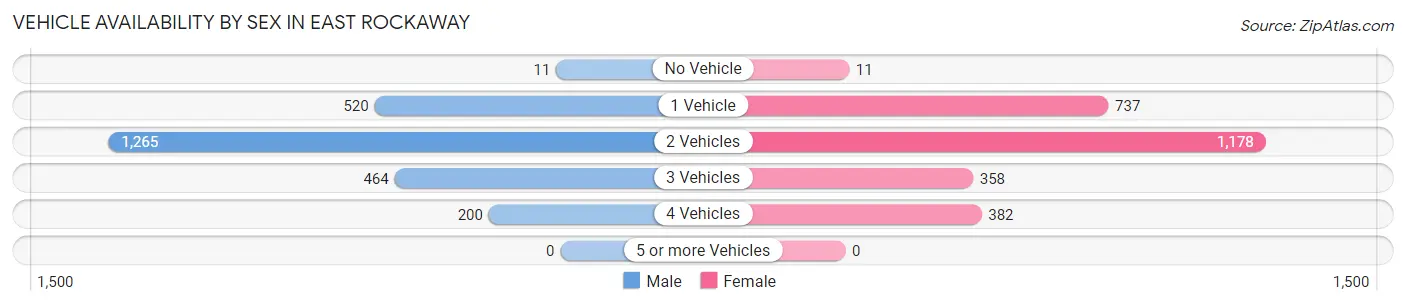
| Vehicles Available | Male | Female |
| No Vehicle | 11 (0.4%) | 11 (0.4%) |
| 1 Vehicle | 520 (21.1%) | 737 (27.6%) |
| 2 Vehicles | 1,265 (51.4%) | 1,178 (44.2%) |
| 3 Vehicles | 464 (18.9%) | 358 (13.4%) |
| 4 Vehicles | 200 (8.1%) | 382 (14.3%) |
| 5 or more Vehicles | 0 (0.0%) | 0 (0.0%) |
| Total | 2,460 (100.0%) | 2,666 (100.0%) |
Commute Time in East Rockaway
The most frequently occuring commute durations in East Rockaway are 15 to 19 minutes (788 commuters, 17.8%), 30 to 34 minutes (594 commuters, 13.4%), and 20 to 24 minutes (547 commuters, 12.3%).
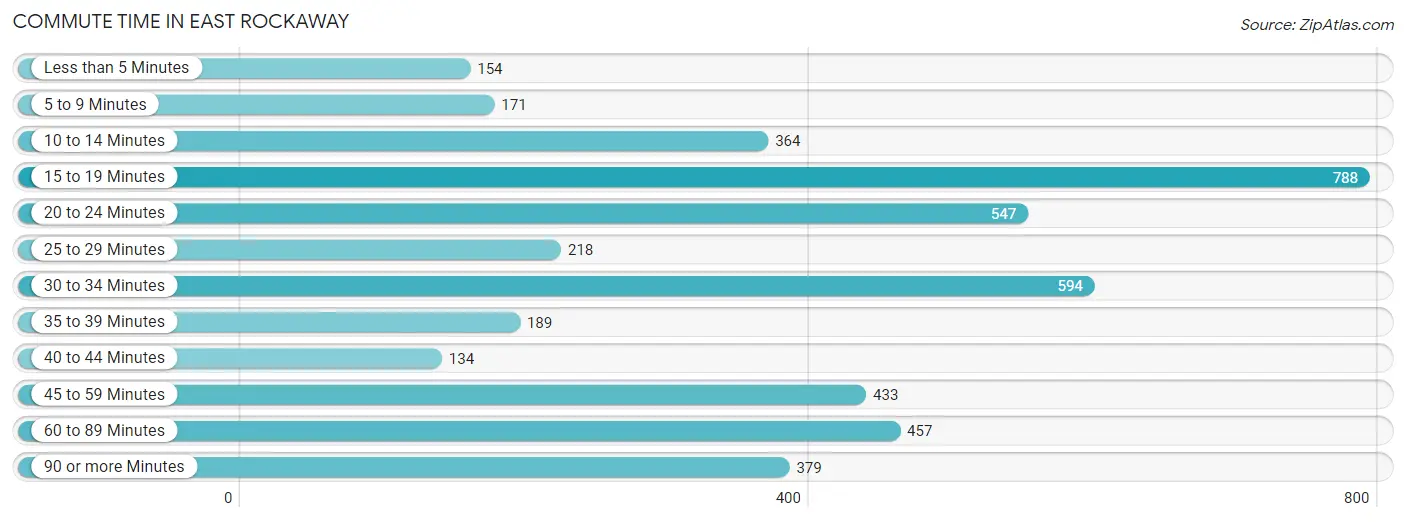
| Commute Time | # Commuters | % Commuters |
| Less than 5 Minutes | 154 | 3.5% |
| 5 to 9 Minutes | 171 | 3.9% |
| 10 to 14 Minutes | 364 | 8.2% |
| 15 to 19 Minutes | 788 | 17.8% |
| 20 to 24 Minutes | 547 | 12.3% |
| 25 to 29 Minutes | 218 | 4.9% |
| 30 to 34 Minutes | 594 | 13.4% |
| 35 to 39 Minutes | 189 | 4.3% |
| 40 to 44 Minutes | 134 | 3.0% |
| 45 to 59 Minutes | 433 | 9.8% |
| 60 to 89 Minutes | 457 | 10.3% |
| 90 or more Minutes | 379 | 8.6% |
Commute Time by Sex in East Rockaway
The most common commute times in East Rockaway are 15 to 19 minutes (367 commuters, 17.4%) for males and 15 to 19 minutes (421 commuters, 18.1%) for females.
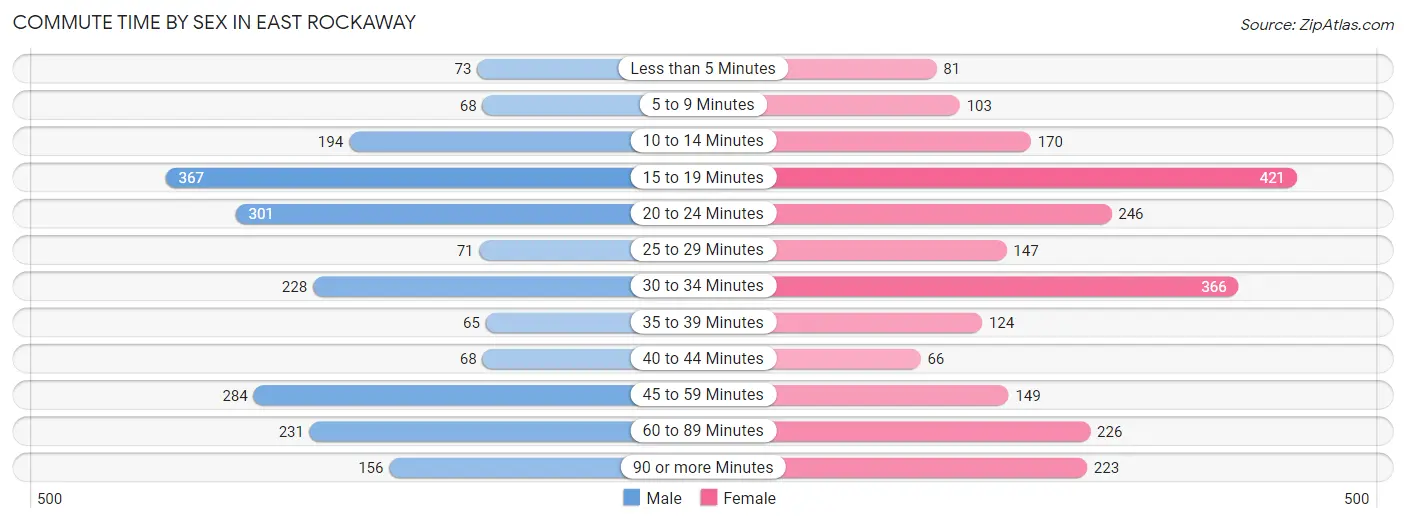
| Commute Time | Male | Female |
| Less than 5 Minutes | 73 (3.5%) | 81 (3.5%) |
| 5 to 9 Minutes | 68 (3.2%) | 103 (4.4%) |
| 10 to 14 Minutes | 194 (9.2%) | 170 (7.3%) |
| 15 to 19 Minutes | 367 (17.4%) | 421 (18.1%) |
| 20 to 24 Minutes | 301 (14.3%) | 246 (10.6%) |
| 25 to 29 Minutes | 71 (3.4%) | 147 (6.3%) |
| 30 to 34 Minutes | 228 (10.8%) | 366 (15.8%) |
| 35 to 39 Minutes | 65 (3.1%) | 124 (5.3%) |
| 40 to 44 Minutes | 68 (3.2%) | 66 (2.8%) |
| 45 to 59 Minutes | 284 (13.5%) | 149 (6.4%) |
| 60 to 89 Minutes | 231 (11.0%) | 226 (9.7%) |
| 90 or more Minutes | 156 (7.4%) | 223 (9.6%) |
Time of Departure to Work by Sex in East Rockaway
The most frequent times of departure to work in East Rockaway are 7:30 AM to 7:59 AM (336, 16.0%) for males and 7:00 AM to 7:29 AM (492, 21.2%) for females.
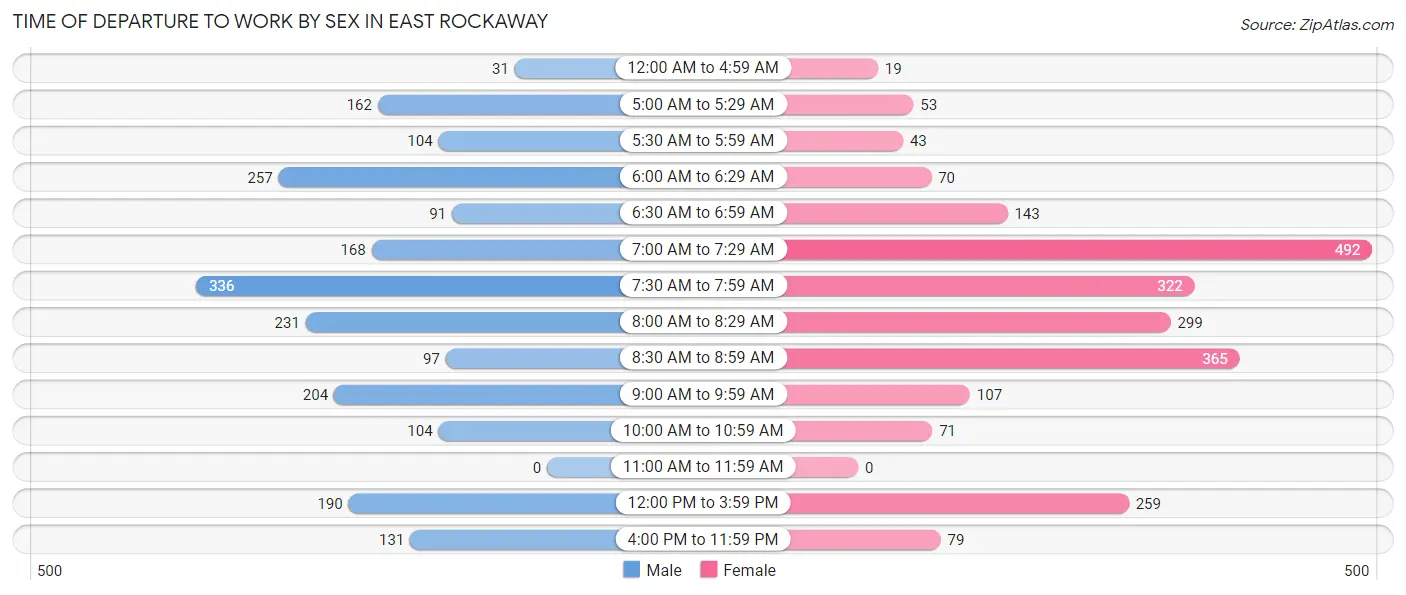
| Time of Departure | Male | Female |
| 12:00 AM to 4:59 AM | 31 (1.5%) | 19 (0.8%) |
| 5:00 AM to 5:29 AM | 162 (7.7%) | 53 (2.3%) |
| 5:30 AM to 5:59 AM | 104 (4.9%) | 43 (1.8%) |
| 6:00 AM to 6:29 AM | 257 (12.2%) | 70 (3.0%) |
| 6:30 AM to 6:59 AM | 91 (4.3%) | 143 (6.2%) |
| 7:00 AM to 7:29 AM | 168 (8.0%) | 492 (21.2%) |
| 7:30 AM to 7:59 AM | 336 (16.0%) | 322 (13.9%) |
| 8:00 AM to 8:29 AM | 231 (11.0%) | 299 (12.9%) |
| 8:30 AM to 8:59 AM | 97 (4.6%) | 365 (15.7%) |
| 9:00 AM to 9:59 AM | 204 (9.7%) | 107 (4.6%) |
| 10:00 AM to 10:59 AM | 104 (4.9%) | 71 (3.1%) |
| 11:00 AM to 11:59 AM | 0 (0.0%) | 0 (0.0%) |
| 12:00 PM to 3:59 PM | 190 (9.0%) | 259 (11.2%) |
| 4:00 PM to 11:59 PM | 131 (6.2%) | 79 (3.4%) |
| Total | 2,106 (100.0%) | 2,322 (100.0%) |
Housing Occupancy in East Rockaway
Occupancy by Ownership in East Rockaway
Of the total 3,822 dwellings in East Rockaway, owner-occupied units account for 2,825 (73.9%), while renter-occupied units make up 997 (26.1%).
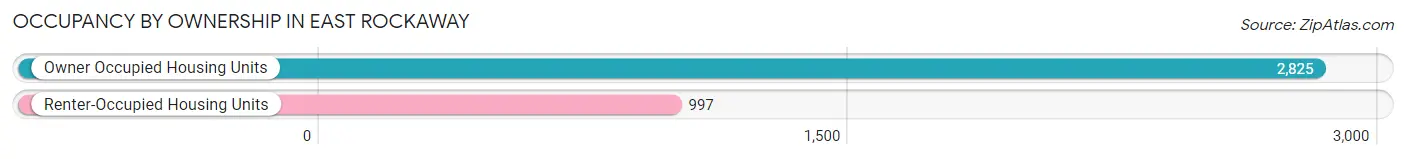
| Occupancy | # Housing Units | % Housing Units |
| Owner Occupied Housing Units | 2,825 | 73.9% |
| Renter-Occupied Housing Units | 997 | 26.1% |
| Total Occupied Housing Units | 3,822 | 100.0% |
Occupancy by Household Size in East Rockaway
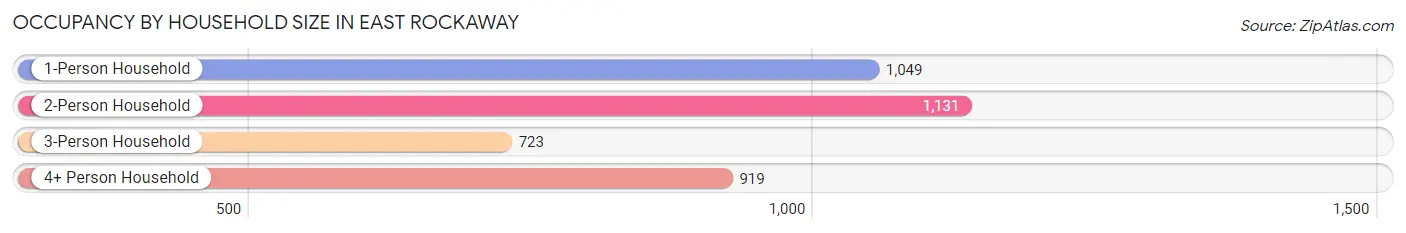
| Household Size | # Housing Units | % Housing Units |
| 1-Person Household | 1,049 | 27.5% |
| 2-Person Household | 1,131 | 29.6% |
| 3-Person Household | 723 | 18.9% |
| 4+ Person Household | 919 | 24.0% |
| Total Housing Units | 3,822 | 100.0% |
Occupancy by Ownership by Household Size in East Rockaway
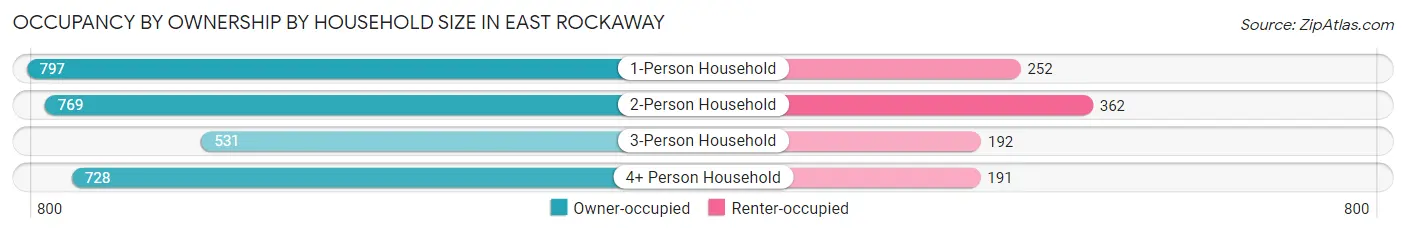
| Household Size | Owner-occupied | Renter-occupied |
| 1-Person Household | 797 (76.0%) | 252 (24.0%) |
| 2-Person Household | 769 (68.0%) | 362 (32.0%) |
| 3-Person Household | 531 (73.4%) | 192 (26.6%) |
| 4+ Person Household | 728 (79.2%) | 191 (20.8%) |
| Total Housing Units | 2,825 (73.9%) | 997 (26.1%) |
Occupancy by Educational Attainment in East Rockaway
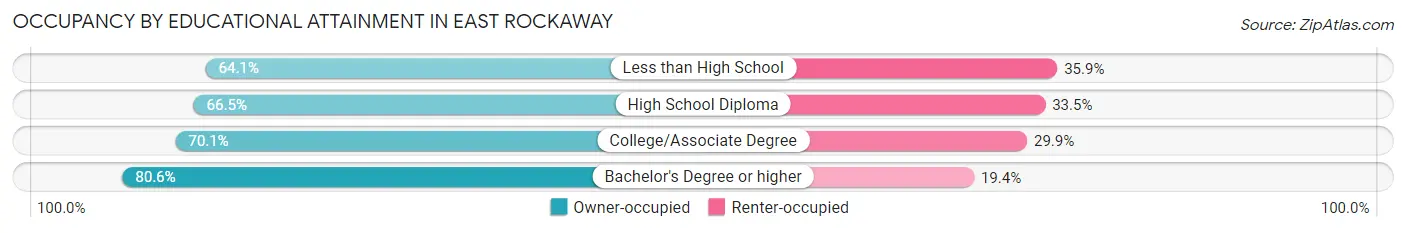
| Household Size | Owner-occupied | Renter-occupied |
| Less than High School | 250 (64.1%) | 140 (35.9%) |
| High School Diploma | 478 (66.5%) | 241 (33.5%) |
| College/Associate Degree | 600 (70.1%) | 256 (29.9%) |
| Bachelor's Degree or higher | 1,497 (80.6%) | 360 (19.4%) |
Occupancy by Age of Householder in East Rockaway
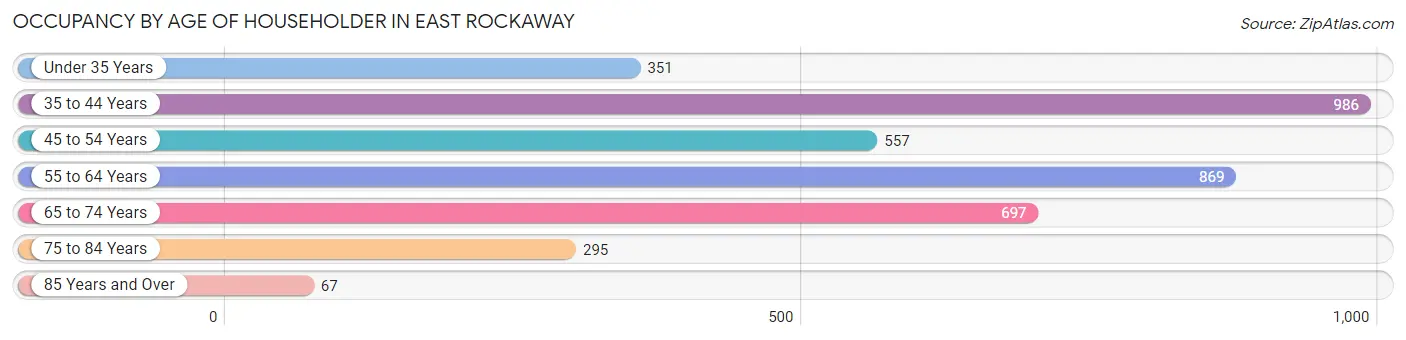
| Age Bracket | # Households | % Households |
| Under 35 Years | 351 | 9.2% |
| 35 to 44 Years | 986 | 25.8% |
| 45 to 54 Years | 557 | 14.6% |
| 55 to 64 Years | 869 | 22.7% |
| 65 to 74 Years | 697 | 18.2% |
| 75 to 84 Years | 295 | 7.7% |
| 85 Years and Over | 67 | 1.8% |
| Total | 3,822 | 100.0% |
Housing Finances in East Rockaway
Median Income by Occupancy in East Rockaway
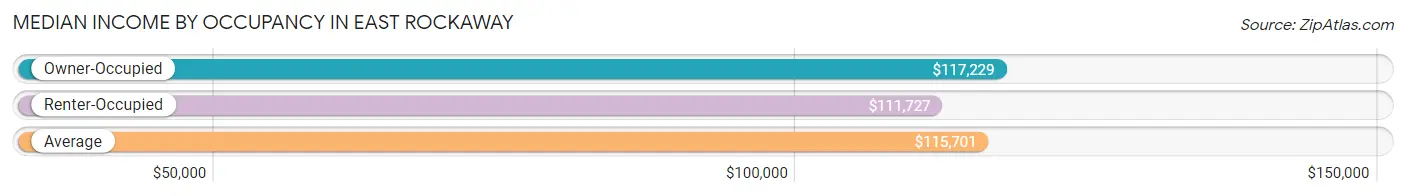
| Occupancy Type | # Households | Median Income |
| Owner-Occupied | 2,825 (73.9%) | $117,229 |
| Renter-Occupied | 997 (26.1%) | $111,727 |
| Average | 3,822 (100.0%) | $115,701 |
Occupancy by Householder Income Bracket in East Rockaway
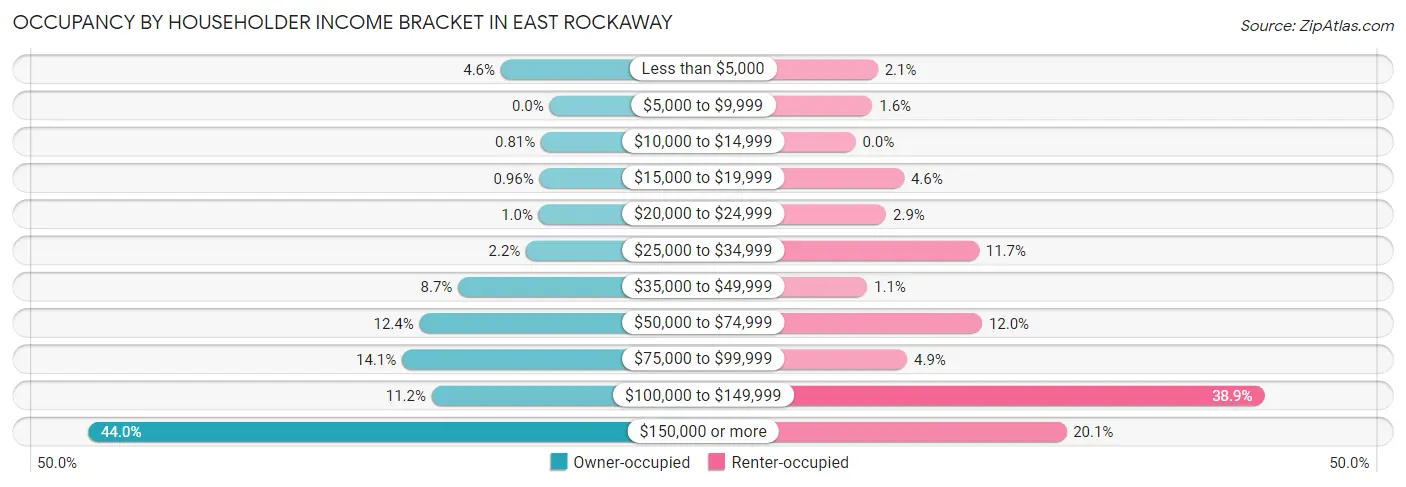
| Income Bracket | Owner-occupied | Renter-occupied |
| Less than $5,000 | 131 (4.6%) | 21 (2.1%) |
| $5,000 to $9,999 | 0 (0.0%) | 16 (1.6%) |
| $10,000 to $14,999 | 23 (0.8%) | 0 (0.0%) |
| $15,000 to $19,999 | 27 (1.0%) | 46 (4.6%) |
| $20,000 to $24,999 | 29 (1.0%) | 29 (2.9%) |
| $25,000 to $34,999 | 63 (2.2%) | 117 (11.7%) |
| $35,000 to $49,999 | 246 (8.7%) | 11 (1.1%) |
| $50,000 to $74,999 | 350 (12.4%) | 120 (12.0%) |
| $75,000 to $99,999 | 397 (14.1%) | 49 (4.9%) |
| $100,000 to $149,999 | 317 (11.2%) | 388 (38.9%) |
| $150,000 or more | 1,242 (44.0%) | 200 (20.1%) |
| Total | 2,825 (100.0%) | 997 (100.0%) |
Monthly Housing Cost Tiers in East Rockaway
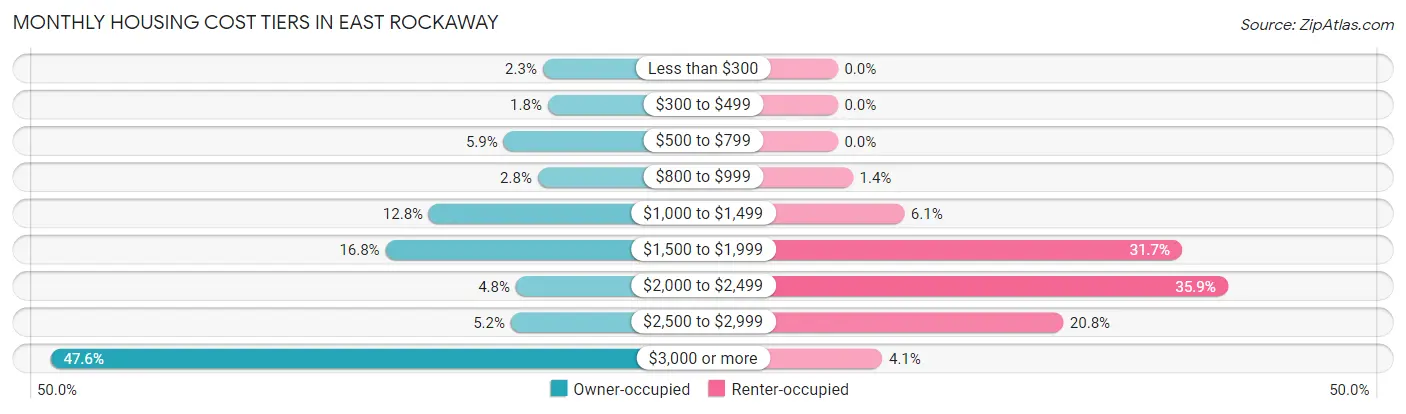
| Monthly Cost | Owner-occupied | Renter-occupied |
| Less than $300 | 65 (2.3%) | 0 (0.0%) |
| $300 to $499 | 52 (1.8%) | 0 (0.0%) |
| $500 to $799 | 167 (5.9%) | 0 (0.0%) |
| $800 to $999 | 78 (2.8%) | 14 (1.4%) |
| $1,000 to $1,499 | 361 (12.8%) | 61 (6.1%) |
| $1,500 to $1,999 | 474 (16.8%) | 316 (31.7%) |
| $2,000 to $2,499 | 135 (4.8%) | 358 (35.9%) |
| $2,500 to $2,999 | 148 (5.2%) | 207 (20.8%) |
| $3,000 or more | 1,345 (47.6%) | 41 (4.1%) |
| Total | 2,825 (100.0%) | 997 (100.0%) |
Physical Housing Characteristics in East Rockaway
Housing Structures in East Rockaway
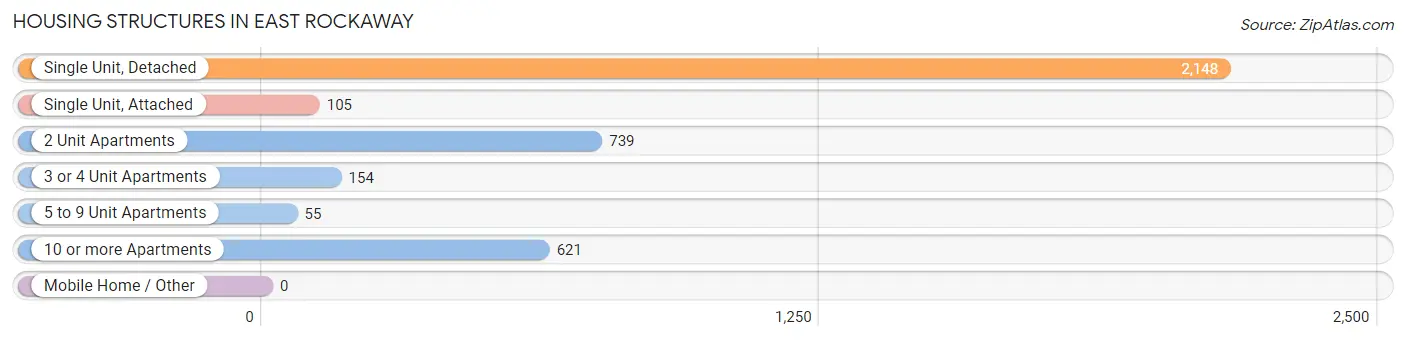
| Structure Type | # Housing Units | % Housing Units |
| Single Unit, Detached | 2,148 | 56.2% |
| Single Unit, Attached | 105 | 2.8% |
| 2 Unit Apartments | 739 | 19.3% |
| 3 or 4 Unit Apartments | 154 | 4.0% |
| 5 to 9 Unit Apartments | 55 | 1.4% |
| 10 or more Apartments | 621 | 16.3% |
| Mobile Home / Other | 0 | 0.0% |
| Total | 3,822 | 100.0% |
Housing Structures by Occupancy in East Rockaway
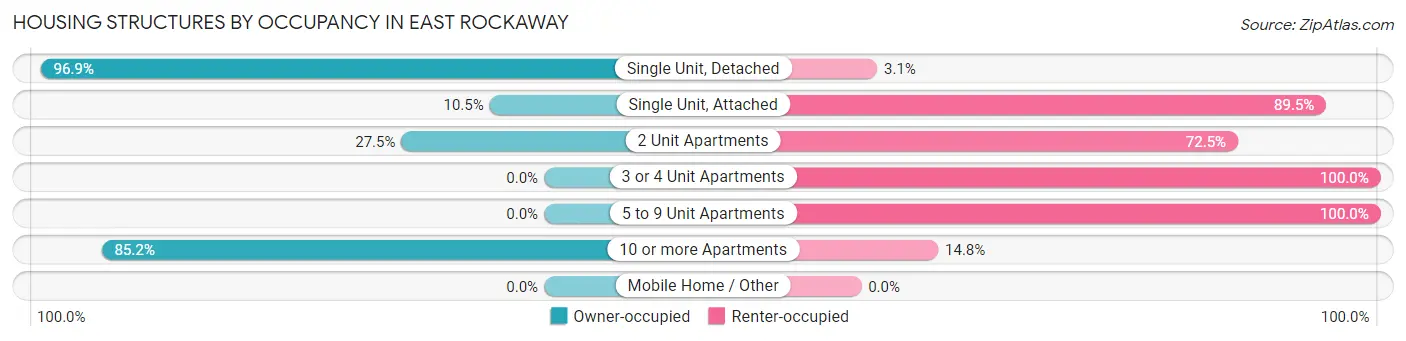
| Structure Type | Owner-occupied | Renter-occupied |
| Single Unit, Detached | 2,082 (96.9%) | 66 (3.1%) |
| Single Unit, Attached | 11 (10.5%) | 94 (89.5%) |
| 2 Unit Apartments | 203 (27.5%) | 536 (72.5%) |
| 3 or 4 Unit Apartments | 0 (0.0%) | 154 (100.0%) |
| 5 to 9 Unit Apartments | 0 (0.0%) | 55 (100.0%) |
| 10 or more Apartments | 529 (85.2%) | 92 (14.8%) |
| Mobile Home / Other | 0 (0.0%) | 0 (0.0%) |
| Total | 2,825 (73.9%) | 997 (26.1%) |
Housing Structures by Number of Rooms in East Rockaway
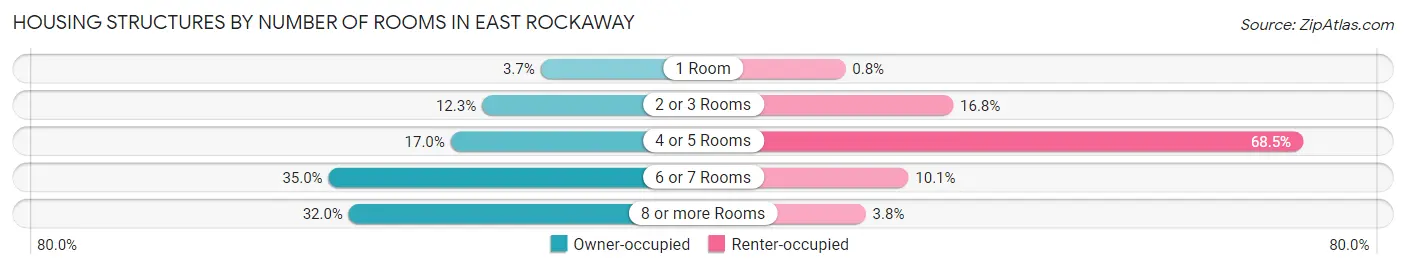
| Number of Rooms | Owner-occupied | Renter-occupied |
| 1 Room | 103 (3.6%) | 8 (0.8%) |
| 2 or 3 Rooms | 348 (12.3%) | 167 (16.8%) |
| 4 or 5 Rooms | 479 (17.0%) | 683 (68.5%) |
| 6 or 7 Rooms | 990 (35.0%) | 101 (10.1%) |
| 8 or more Rooms | 905 (32.0%) | 38 (3.8%) |
| Total | 2,825 (100.0%) | 997 (100.0%) |
Housing Structure by Heating Type in East Rockaway
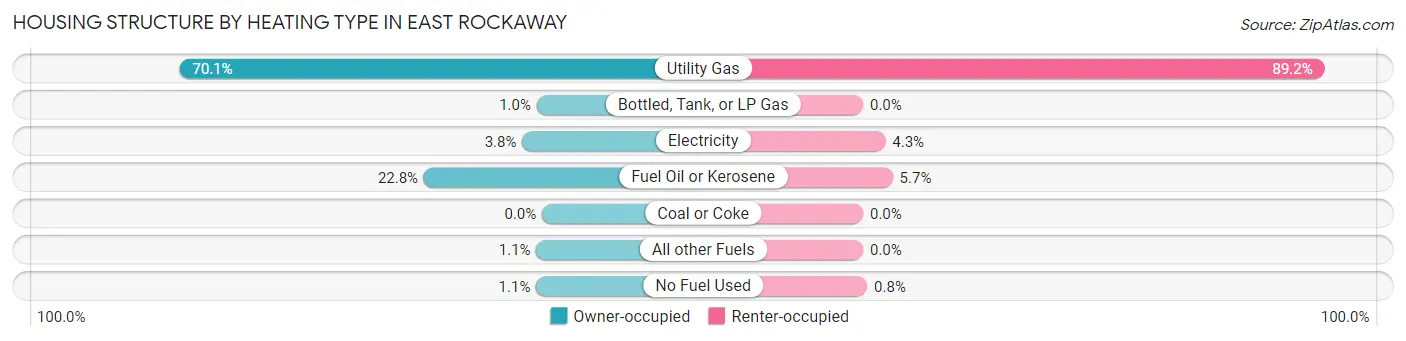
| Heating Type | Owner-occupied | Renter-occupied |
| Utility Gas | 1,980 (70.1%) | 889 (89.2%) |
| Bottled, Tank, or LP Gas | 29 (1.0%) | 0 (0.0%) |
| Electricity | 108 (3.8%) | 43 (4.3%) |
| Fuel Oil or Kerosene | 645 (22.8%) | 57 (5.7%) |
| Coal or Coke | 0 (0.0%) | 0 (0.0%) |
| All other Fuels | 31 (1.1%) | 0 (0.0%) |
| No Fuel Used | 32 (1.1%) | 8 (0.8%) |
| Total | 2,825 (100.0%) | 997 (100.0%) |
Household Vehicle Usage in East Rockaway
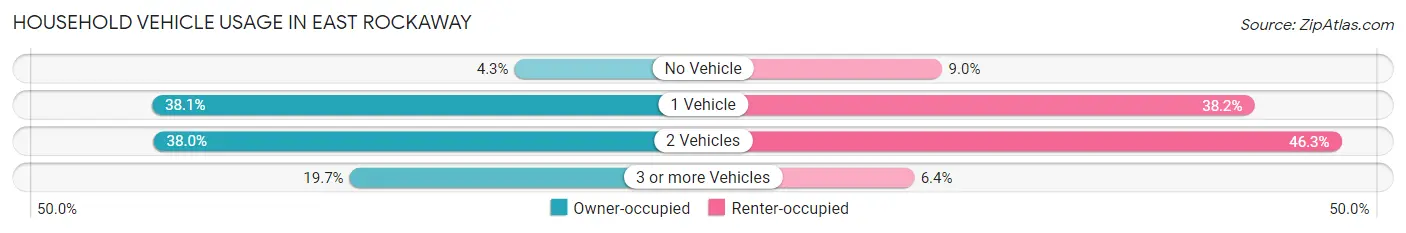
| Vehicles per Household | Owner-occupied | Renter-occupied |
| No Vehicle | 121 (4.3%) | 90 (9.0%) |
| 1 Vehicle | 1,076 (38.1%) | 381 (38.2%) |
| 2 Vehicles | 1,072 (38.0%) | 462 (46.3%) |
| 3 or more Vehicles | 556 (19.7%) | 64 (6.4%) |
| Total | 2,825 (100.0%) | 997 (100.0%) |
Real Estate & Mortgages in East Rockaway
Real Estate and Mortgage Overview in East Rockaway
| Characteristic | Without Mortgage | With Mortgage |
| Housing Units | 974 | 1,851 |
| Median Property Value | $554,100 | $627,400 |
| Median Household Income | $92,200 | $930 |
| Monthly Housing Costs | $1,501 | $1,317 |
| Real Estate Taxes | $10,001 | $119 |
Property Value by Mortgage Status in East Rockaway
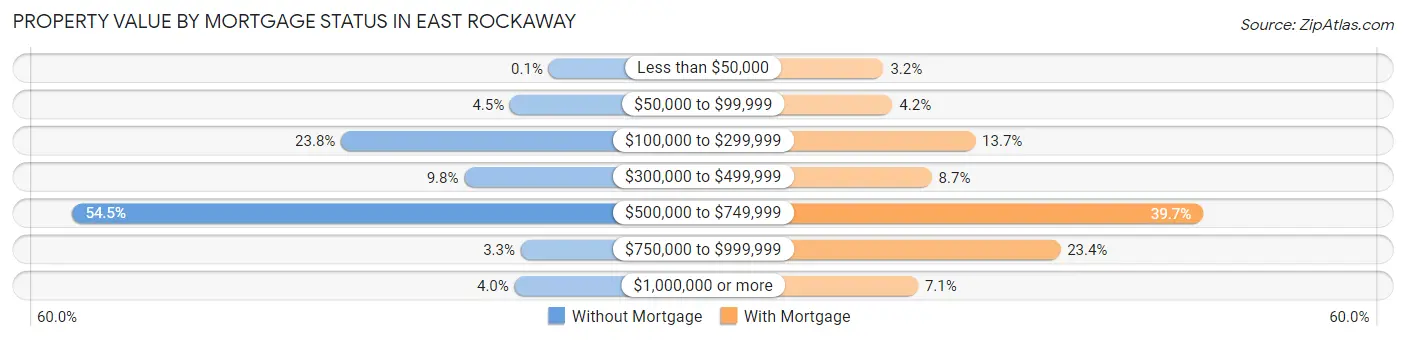
| Property Value | Without Mortgage | With Mortgage |
| Less than $50,000 | 1 (0.1%) | 59 (3.2%) |
| $50,000 to $99,999 | 44 (4.5%) | 78 (4.2%) |
| $100,000 to $299,999 | 232 (23.8%) | 253 (13.7%) |
| $300,000 to $499,999 | 95 (9.8%) | 161 (8.7%) |
| $500,000 to $749,999 | 531 (54.5%) | 735 (39.7%) |
| $750,000 to $999,999 | 32 (3.3%) | 433 (23.4%) |
| $1,000,000 or more | 39 (4.0%) | 132 (7.1%) |
| Total | 974 (100.0%) | 1,851 (100.0%) |
Household Income by Mortgage Status in East Rockaway
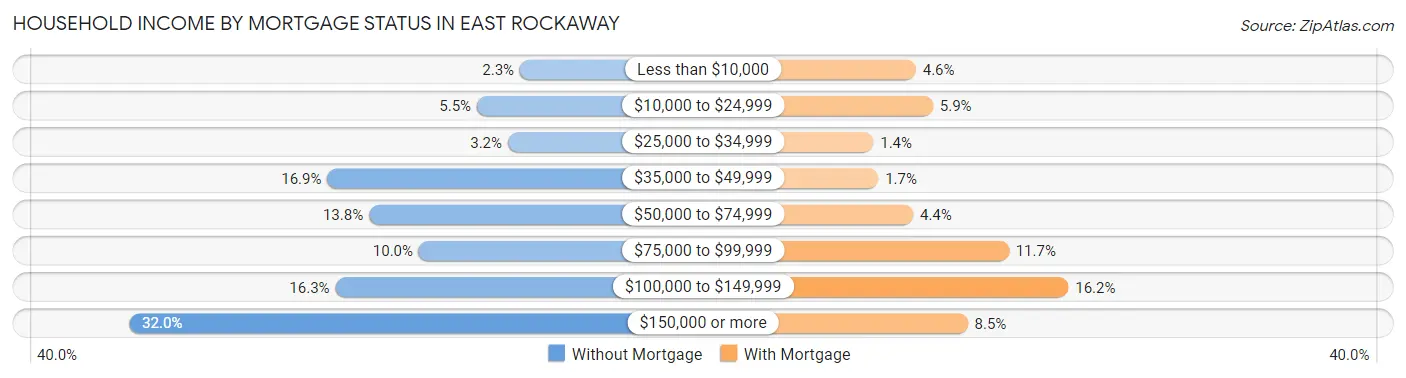
| Household Income | Without Mortgage | With Mortgage |
| Less than $10,000 | 22 (2.3%) | 85 (4.6%) |
| $10,000 to $24,999 | 54 (5.5%) | 109 (5.9%) |
| $25,000 to $34,999 | 31 (3.2%) | 25 (1.3%) |
| $35,000 to $49,999 | 165 (16.9%) | 32 (1.7%) |
| $50,000 to $74,999 | 134 (13.8%) | 81 (4.4%) |
| $75,000 to $99,999 | 97 (10.0%) | 216 (11.7%) |
| $100,000 to $149,999 | 159 (16.3%) | 300 (16.2%) |
| $150,000 or more | 312 (32.0%) | 158 (8.5%) |
| Total | 974 (100.0%) | 1,851 (100.0%) |
Property Value to Household Income Ratio in East Rockaway
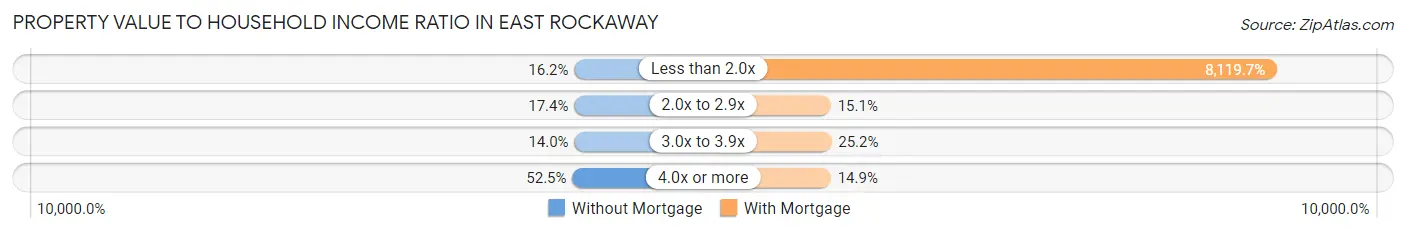
| Value-to-Income Ratio | Without Mortgage | With Mortgage |
| Less than 2.0x | 158 (16.2%) | 150,296 (8,119.7%) |
| 2.0x to 2.9x | 169 (17.3%) | 279 (15.1%) |
| 3.0x to 3.9x | 136 (14.0%) | 467 (25.2%) |
| 4.0x or more | 511 (52.5%) | 276 (14.9%) |
| Total | 974 (100.0%) | 1,851 (100.0%) |
Real Estate Taxes by Mortgage Status in East Rockaway
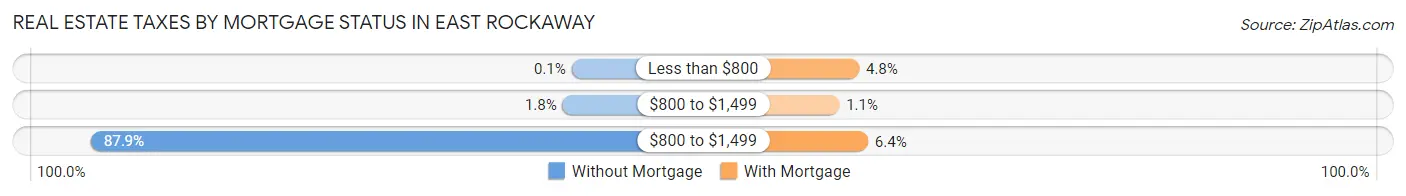
| Property Taxes | Without Mortgage | With Mortgage |
| Less than $800 | 1 (0.1%) | 88 (4.8%) |
| $800 to $1,499 | 17 (1.8%) | 21 (1.1%) |
| $800 to $1,499 | 856 (87.9%) | 118 (6.4%) |
| Total | 974 (100.0%) | 1,851 (100.0%) |
Health & Disability in East Rockaway
Health Insurance Coverage by Age in East Rockaway
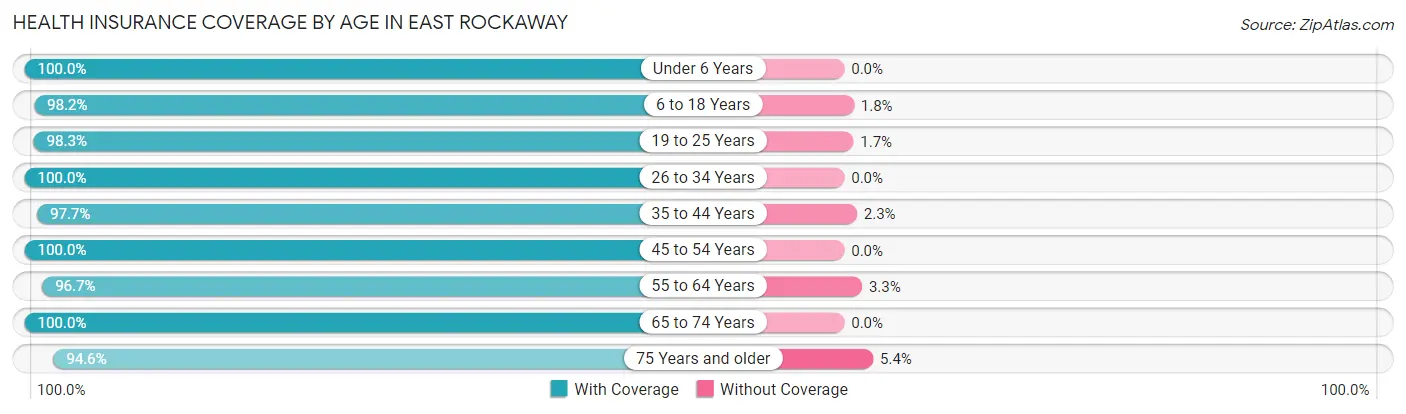
| Age Bracket | With Coverage | Without Coverage |
| Under 6 Years | 513 (100.0%) | 0 (0.0%) |
| 6 to 18 Years | 1,715 (98.2%) | 31 (1.8%) |
| 19 to 25 Years | 816 (98.3%) | 14 (1.7%) |
| 26 to 34 Years | 972 (100.0%) | 0 (0.0%) |
| 35 to 44 Years | 1,631 (97.7%) | 39 (2.3%) |
| 45 to 54 Years | 1,000 (100.0%) | 0 (0.0%) |
| 55 to 64 Years | 1,528 (96.7%) | 52 (3.3%) |
| 65 to 74 Years | 1,041 (100.0%) | 0 (0.0%) |
| 75 Years and older | 582 (94.6%) | 33 (5.4%) |
| Total | 9,798 (98.3%) | 169 (1.7%) |
Health Insurance Coverage by Citizenship Status in East Rockaway
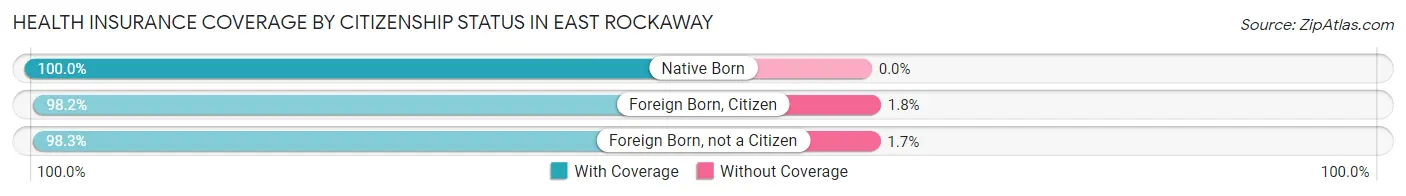
| Citizenship Status | With Coverage | Without Coverage |
| Native Born | 513 (100.0%) | 0 (0.0%) |
| Foreign Born, Citizen | 1,715 (98.2%) | 31 (1.8%) |
| Foreign Born, not a Citizen | 816 (98.3%) | 14 (1.7%) |
Health Insurance Coverage by Household Income in East Rockaway
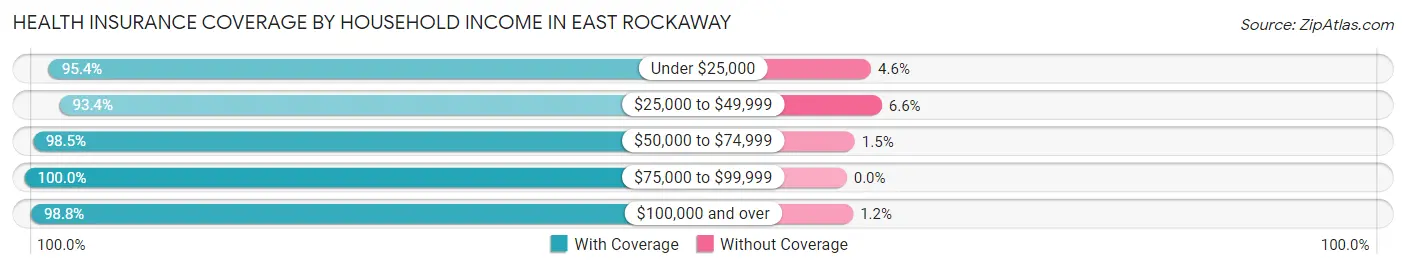
| Household Income | With Coverage | Without Coverage |
| Under $25,000 | 356 (95.4%) | 17 (4.6%) |
| $25,000 to $49,999 | 740 (93.4%) | 52 (6.6%) |
| $50,000 to $74,999 | 972 (98.5%) | 15 (1.5%) |
| $75,000 to $99,999 | 687 (100.0%) | 0 (0.0%) |
| $100,000 and over | 6,980 (98.8%) | 85 (1.2%) |
Public vs Private Health Insurance Coverage by Age in East Rockaway
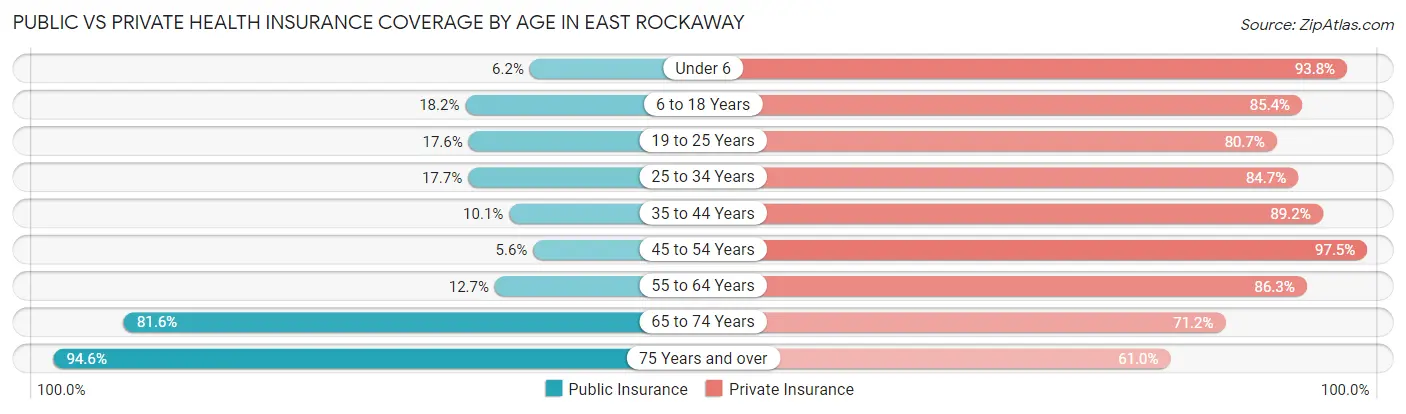
| Age Bracket | Public Insurance | Private Insurance |
| Under 6 | 32 (6.2%) | 481 (93.8%) |
| 6 to 18 Years | 318 (18.2%) | 1,491 (85.4%) |
| 19 to 25 Years | 146 (17.6%) | 670 (80.7%) |
| 25 to 34 Years | 172 (17.7%) | 823 (84.7%) |
| 35 to 44 Years | 168 (10.1%) | 1,490 (89.2%) |
| 45 to 54 Years | 56 (5.6%) | 975 (97.5%) |
| 55 to 64 Years | 201 (12.7%) | 1,363 (86.3%) |
| 65 to 74 Years | 849 (81.6%) | 741 (71.2%) |
| 75 Years and over | 582 (94.6%) | 375 (61.0%) |
| Total | 2,524 (25.3%) | 8,409 (84.4%) |
Disability Status by Sex by Age in East Rockaway
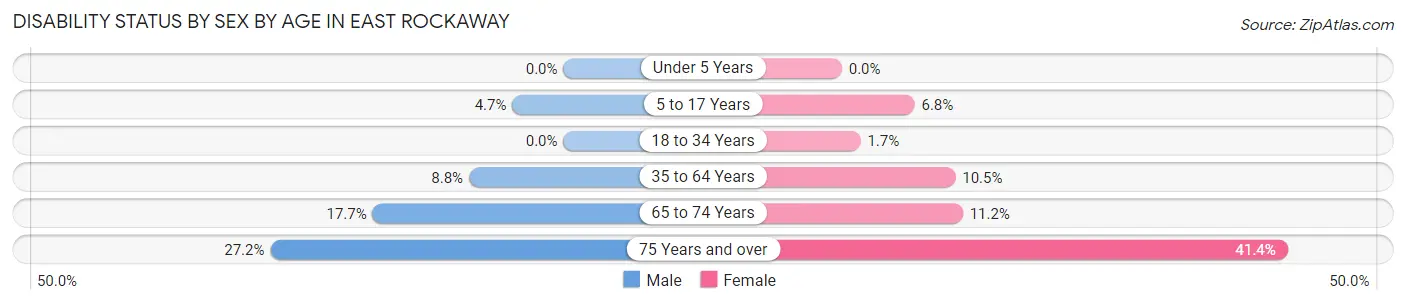
| Age Bracket | Male | Female |
| Under 5 Years | 0 (0.0%) | 0 (0.0%) |
| 5 to 17 Years | 33 (4.7%) | 71 (6.8%) |
| 18 to 34 Years | 0 (0.0%) | 23 (1.7%) |
| 35 to 64 Years | 185 (8.8%) | 225 (10.5%) |
| 65 to 74 Years | 96 (17.7%) | 56 (11.2%) |
| 75 Years and over | 68 (27.2%) | 151 (41.4%) |
Disability Class by Sex by Age in East Rockaway
Disability Class: Hearing Difficulty
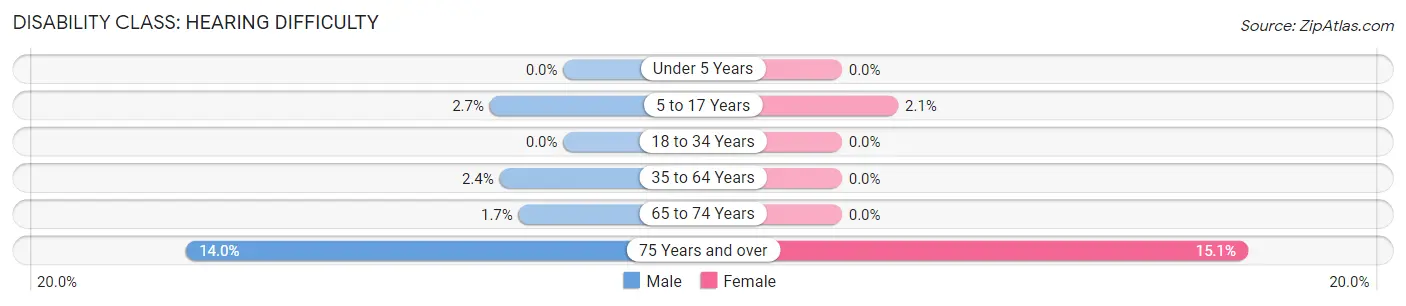
| Age Bracket | Male | Female |
| Under 5 Years | 0 (0.0%) | 0 (0.0%) |
| 5 to 17 Years | 19 (2.7%) | 22 (2.1%) |
| 18 to 34 Years | 0 (0.0%) | 0 (0.0%) |
| 35 to 64 Years | 50 (2.4%) | 0 (0.0%) |
| 65 to 74 Years | 9 (1.7%) | 0 (0.0%) |
| 75 Years and over | 35 (14.0%) | 55 (15.1%) |
Disability Class: Vision Difficulty
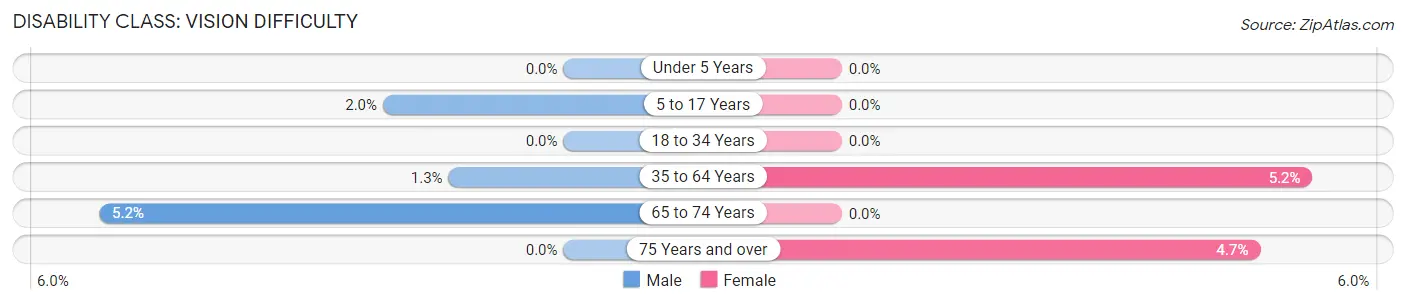
| Age Bracket | Male | Female |
| Under 5 Years | 0 (0.0%) | 0 (0.0%) |
| 5 to 17 Years | 14 (2.0%) | 0 (0.0%) |
| 18 to 34 Years | 0 (0.0%) | 0 (0.0%) |
| 35 to 64 Years | 27 (1.3%) | 112 (5.2%) |
| 65 to 74 Years | 28 (5.2%) | 0 (0.0%) |
| 75 Years and over | 0 (0.0%) | 17 (4.7%) |
Disability Class: Cognitive Difficulty

| Age Bracket | Male | Female |
| 5 to 17 Years | 0 (0.0%) | 49 (4.7%) |
| 18 to 34 Years | 0 (0.0%) | 23 (1.7%) |
| 35 to 64 Years | 75 (3.5%) | 0 (0.0%) |
| 65 to 74 Years | 0 (0.0%) | 0 (0.0%) |
| 75 Years and over | 7 (2.8%) | 0 (0.0%) |
Disability Class: Ambulatory Difficulty
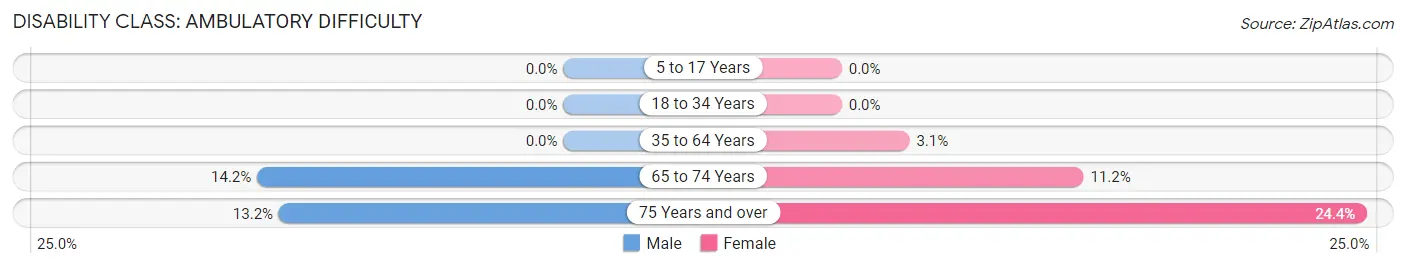
| Age Bracket | Male | Female |
| 5 to 17 Years | 0 (0.0%) | 0 (0.0%) |
| 18 to 34 Years | 0 (0.0%) | 0 (0.0%) |
| 35 to 64 Years | 0 (0.0%) | 67 (3.1%) |
| 65 to 74 Years | 77 (14.2%) | 56 (11.2%) |
| 75 Years and over | 33 (13.2%) | 89 (24.4%) |
Disability Class: Self-Care Difficulty
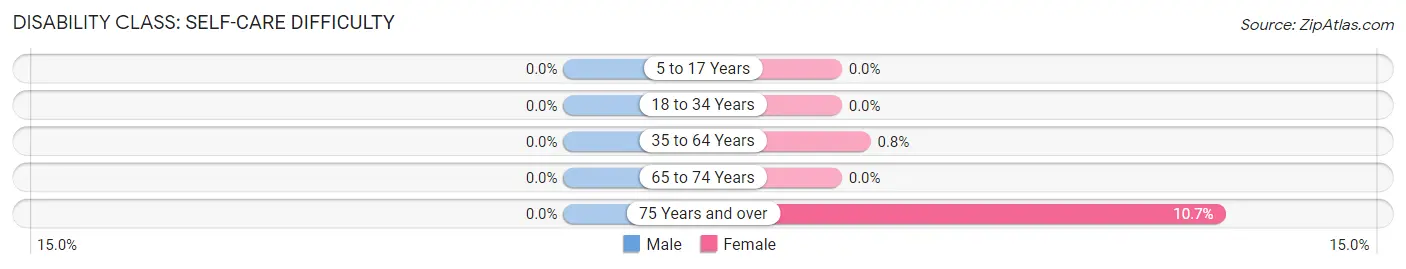
| Age Bracket | Male | Female |
| 5 to 17 Years | 0 (0.0%) | 0 (0.0%) |
| 18 to 34 Years | 0 (0.0%) | 0 (0.0%) |
| 35 to 64 Years | 0 (0.0%) | 17 (0.8%) |
| 65 to 74 Years | 0 (0.0%) | 0 (0.0%) |
| 75 Years and over | 0 (0.0%) | 39 (10.7%) |
Technology Access in East Rockaway
Computing Device Access in East Rockaway
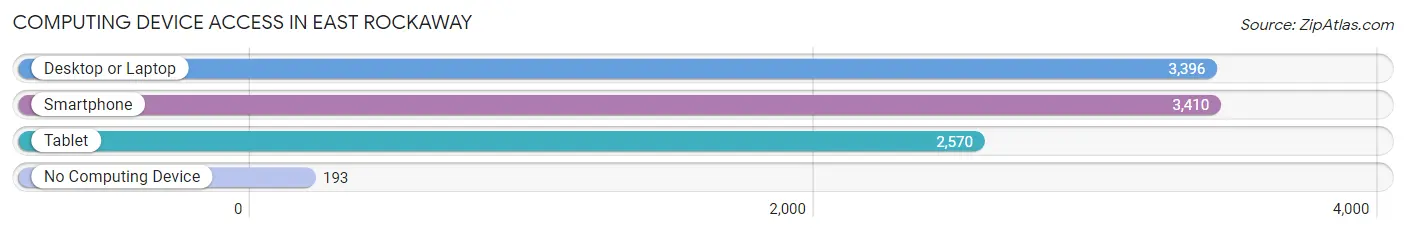
| Device Type | # Households | % Households |
| Desktop or Laptop | 3,396 | 88.8% |
| Smartphone | 3,410 | 89.2% |
| Tablet | 2,570 | 67.2% |
| No Computing Device | 193 | 5.1% |
| Total | 3,822 | 100.0% |
Internet Access in East Rockaway
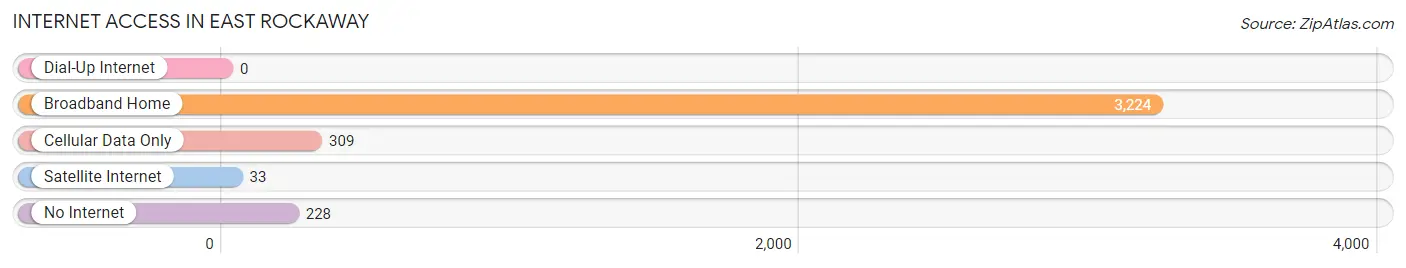
| Internet Type | # Households | % Households |
| Dial-Up Internet | 0 | 0.0% |
| Broadband Home | 3,224 | 84.4% |
| Cellular Data Only | 309 | 8.1% |
| Satellite Internet | 33 | 0.9% |
| No Internet | 228 | 6.0% |
| Total | 3,822 | 100.0% |
East Rockaway Summary
History
East Rockaway is a village located in Nassau County, New York. It is part of the Town of Hempstead and is located on the south shore of Long Island. The village was originally part of the Rockaway tribe, who were part of the Lenape people. The area was first settled by Europeans in the late 1600s, and the village was officially incorporated in 1875.
The village was originally known as East Rockaway Neck, and was a small farming community. The village was home to a number of mills, including a grist mill, a saw mill, and a paper mill. The paper mill was the largest employer in the village, and was in operation until the early 1900s.
The village was also home to a number of shipbuilding companies, which built ships for the US Navy during World War II. The village was also home to a number of resorts, which attracted visitors from New York City and other parts of Long Island.
Geography
East Rockaway is located on the south shore of Long Island, in Nassau County, New York. It is bordered by the villages of Lynbrook to the west, Hewlett to the north, and Oceanside to the east. The village is located on the Hempstead Harbor, and is approximately 25 miles east of New York City.
The village has a total area of 1.3 square miles, all of which is land. The village is located on a peninsula, and is surrounded by water on three sides. The village is located on the Atlantic Coastal Plain, and is mostly flat.
Economy
The economy of East Rockaway is largely based on retail and services. The village is home to a number of small businesses, including restaurants, shops, and professional services. The village is also home to a number of industrial businesses, including a printing company and a metal fabrication company.
The village is also home to a number of government offices, including the Nassau County Department of Social Services and the Nassau County Department of Health. The village is also home to a number of educational institutions, including East Rockaway High School and East Rockaway Junior-Senior High School.
Demographics
As of the 2010 census, the population of East Rockaway was 9,818. The population is largely white (83.3%), with a small percentage of African Americans (7.2%), Asians (3.7%), and Hispanics (4.8%). The median household income is $90,945, and the median home value is $521,000.
The village is home to a number of religious institutions, including churches, synagogues, and mosques. The village is also home to a number of parks and recreational facilities, including a public beach, a public pool, and a public library.
Conclusion
East Rockaway is a village located in Nassau County, New York. It is part of the Town of Hempstead and is located on the south shore of Long Island. The village was originally part of the Rockaway tribe, and was first settled by Europeans in the late 1600s. The village is home to a number of small businesses, government offices, and educational institutions. The population of East Rockaway is largely white, with a small percentage of African Americans, Asians, and Hispanics. The median household income is $90,945, and the median home value is $521,000. The village is home to a number of religious institutions, parks, and recreational facilities.
Common Questions
What is Per Capita Income in East Rockaway?
Per Capita income in East Rockaway is $59,364.
What is the Median Family Income in East Rockaway?
Median Family Income in East Rockaway is $127,250.
What is the Median Household income in East Rockaway?
Median Household Income in East Rockaway is $115,701.
What is Income or Wage Gap in East Rockaway?
Income or Wage Gap in East Rockaway is 28.7%.
Women in East Rockaway earn 71.3 cents for every dollar earned by a man.
What is Inequality or Gini Index in East Rockaway?
Inequality or Gini Index in East Rockaway is 0.46.
What is the Total Population of East Rockaway?
Total Population of East Rockaway is 10,070.
What is the Total Male Population of East Rockaway?
Total Male Population of East Rockaway is 4,453.
What is the Total Female Population of East Rockaway?
Total Female Population of East Rockaway is 5,617.
What is the Ratio of Males per 100 Females in East Rockaway?
There are 79.28 Males per 100 Females in East Rockaway.
What is the Ratio of Females per 100 Males in East Rockaway?
There are 126.14 Females per 100 Males in East Rockaway.
What is the Median Population Age in East Rockaway?
Median Population Age in East Rockaway is 40.5 Years.
What is the Average Family Size in East Rockaway
Average Family Size in East Rockaway is 3.1 People.
What is the Average Household Size in East Rockaway
Average Household Size in East Rockaway is 2.6 People.
How Large is the Labor Force in East Rockaway?
There are 5,606 People in the Labor Forcein in East Rockaway.
What is the Percentage of People in the Labor Force in East Rockaway?
68.9% of People are in the Labor Force in East Rockaway.
What is the Unemployment Rate in East Rockaway?
Unemployment Rate in East Rockaway is 6.3%.