East Glenville, NY Map & Demographics
East Glenville Map
East Glenville Overview
$45,900
PER CAPITA INCOME
$124,200
AVG FAMILY INCOME
$83,045
AVG HOUSEHOLD INCOME
10.9%
WAGE / INCOME GAP [ % ]
89.1¢/ $1
WAGE / INCOME GAP [ $ ]
0.42
INEQUALITY / GINI INDEX
11,477
TOTAL POPULATION
5,548
MALE POPULATION
5,929
FEMALE POPULATION
93.57
MALES / 100 FEMALES
106.87
FEMALES / 100 MALES
42.0
MEDIAN AGE
3.2
AVG FAMILY SIZE
2.4
AVG HOUSEHOLD SIZE
5,559
LABOR FORCE [ PEOPLE ]
60.5%
PERCENT IN LABOR FORCE
6.7%
UNEMPLOYMENT RATE
Income in East Glenville
Income Overview in East Glenville
Per Capita Income in East Glenville is $45,900, while median incomes of families and households are $124,200 and $83,045 respectively.
| Characteristic | Number | Measure |
| Per Capita Income | 11,477 | $45,900 |
| Median Family Income | 2,663 | $124,200 |
| Mean Family Income | 2,663 | $140,303 |
| Median Household Income | 4,704 | $83,045 |
| Mean Household Income | 4,704 | $107,371 |
| Income Deficit | 2,663 | $0 |
| Wage / Income Gap (%) | 11,477 | 10.90% |
| Wage / Income Gap ($) | 11,477 | 89.10¢ per $1 |
| Gini / Inequality Index | 11,477 | 0.42 |
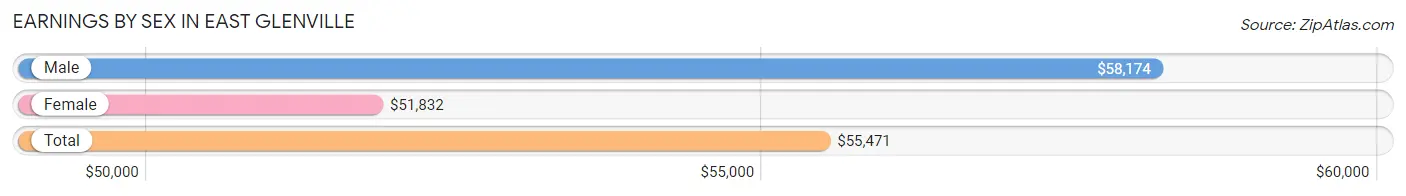
Earnings by Sex in East Glenville
Average Earnings in East Glenville are $55,471, $58,174 for men and $51,832 for women, a difference of 10.9%.
| Sex | Number | Average Earnings |
| Male | 3,093 (53.4%) | $58,174 |
| Female | 2,701 (46.6%) | $51,832 |
| Total | 5,794 (100.0%) | $55,471 |
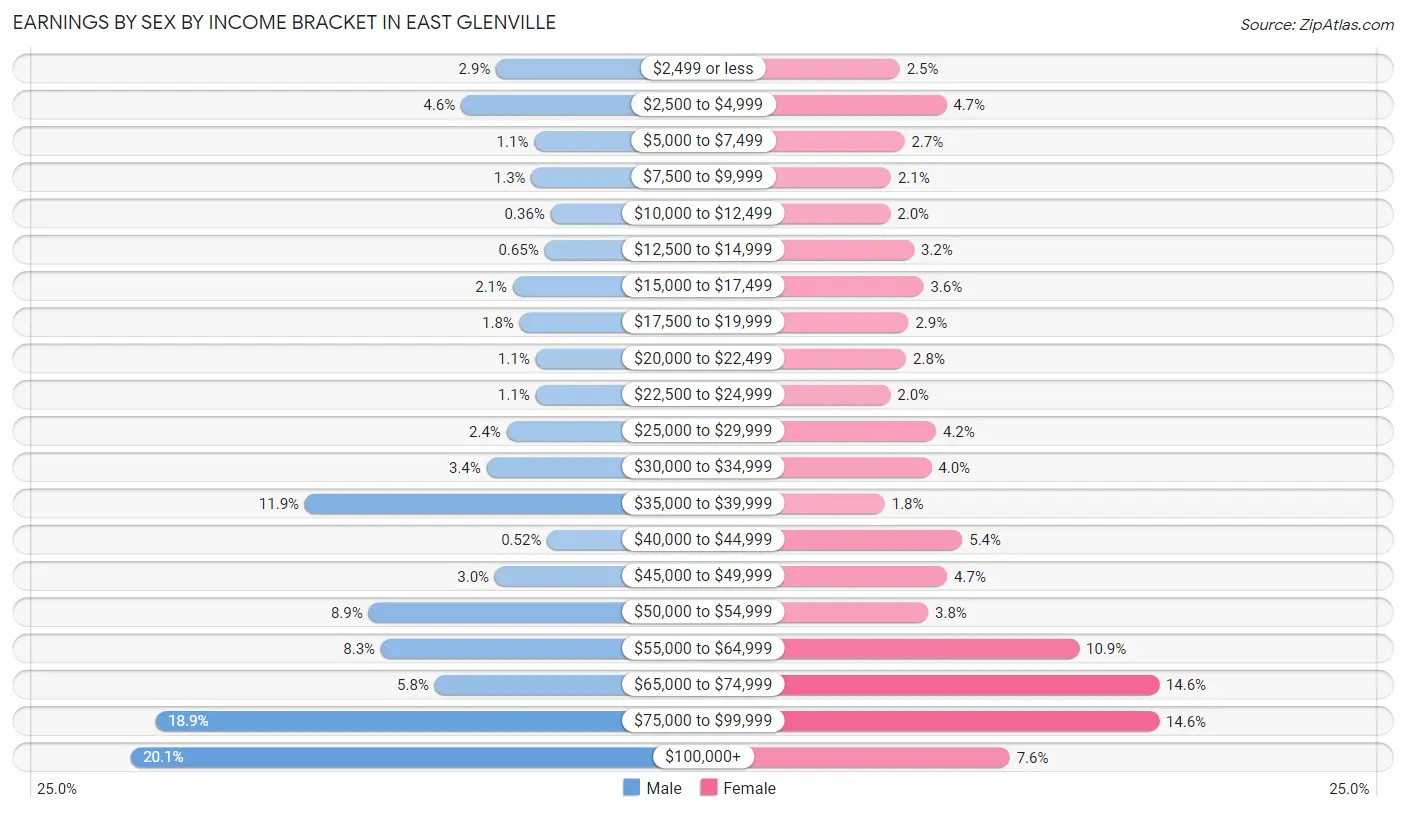
Earnings by Sex by Income Bracket in East Glenville
The most common earnings brackets in East Glenville are $100,000+ for men (620 | 20.1%) and $65,000 to $74,999 for women (395 | 14.6%).
| Income | Male | Female |
| $2,499 or less | 90 (2.9%) | 67 (2.5%) |
| $2,500 to $4,999 | 141 (4.6%) | 126 (4.7%) |
| $5,000 to $7,499 | 35 (1.1%) | 73 (2.7%) |
| $7,500 to $9,999 | 39 (1.3%) | 56 (2.1%) |
| $10,000 to $12,499 | 11 (0.4%) | 55 (2.0%) |
| $12,500 to $14,999 | 20 (0.6%) | 85 (3.2%) |
| $15,000 to $17,499 | 66 (2.1%) | 97 (3.6%) |
| $17,500 to $19,999 | 56 (1.8%) | 78 (2.9%) |
| $20,000 to $22,499 | 33 (1.1%) | 75 (2.8%) |
| $22,500 to $24,999 | 33 (1.1%) | 55 (2.0%) |
| $25,000 to $29,999 | 75 (2.4%) | 113 (4.2%) |
| $30,000 to $34,999 | 104 (3.4%) | 107 (4.0%) |
| $35,000 to $39,999 | 367 (11.9%) | 48 (1.8%) |
| $40,000 to $44,999 | 16 (0.5%) | 146 (5.4%) |
| $45,000 to $49,999 | 92 (3.0%) | 127 (4.7%) |
| $50,000 to $54,999 | 275 (8.9%) | 103 (3.8%) |
| $55,000 to $64,999 | 257 (8.3%) | 294 (10.9%) |
| $65,000 to $74,999 | 179 (5.8%) | 395 (14.6%) |
| $75,000 to $99,999 | 584 (18.9%) | 395 (14.6%) |
| $100,000+ | 620 (20.1%) | 206 (7.6%) |
| Total | 3,093 (100.0%) | 2,701 (100.0%) |
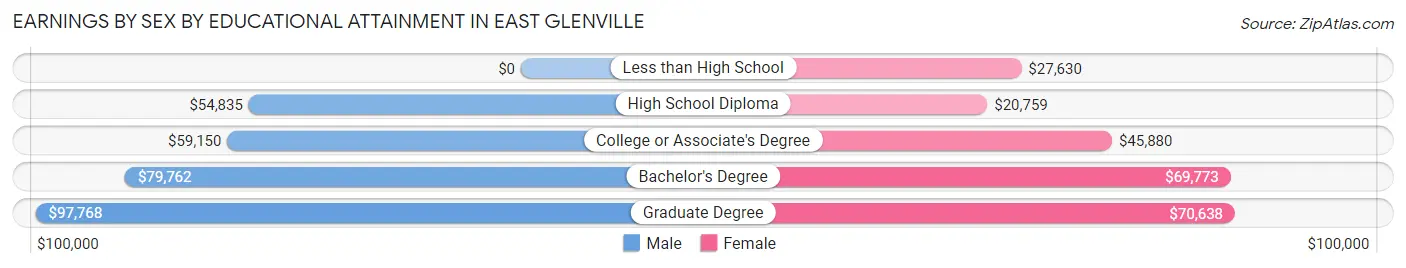
Earnings by Sex by Educational Attainment in East Glenville
Average earnings in East Glenville are $69,428 for men and $57,156 for women, a difference of 17.7%. Men with an educational attainment of graduate degree enjoy the highest average annual earnings of $97,768, while those with high school diploma education earn the least with $54,835. Women with an educational attainment of graduate degree earn the most with the average annual earnings of $70,638, while those with high school diploma education have the smallest earnings of $20,759.
| Educational Attainment | Male Income | Female Income |
| Less than High School | - | - |
| High School Diploma | $54,835 | $20,759 |
| College or Associate's Degree | $59,150 | $45,880 |
| Bachelor's Degree | $79,762 | $69,773 |
| Graduate Degree | $97,768 | $70,638 |
| Total | $69,428 | $57,156 |
Family Income in East Glenville
Family Income Brackets in East Glenville
According to the East Glenville family income data, there are 796 families falling into the $100,000 to $149,999 income range, which is the most common income bracket and makes up 29.9% of all families. Conversely, the $10,000 to $14,999 income bracket is the least frequent group with only 27 families (1.0%) belonging to this category.
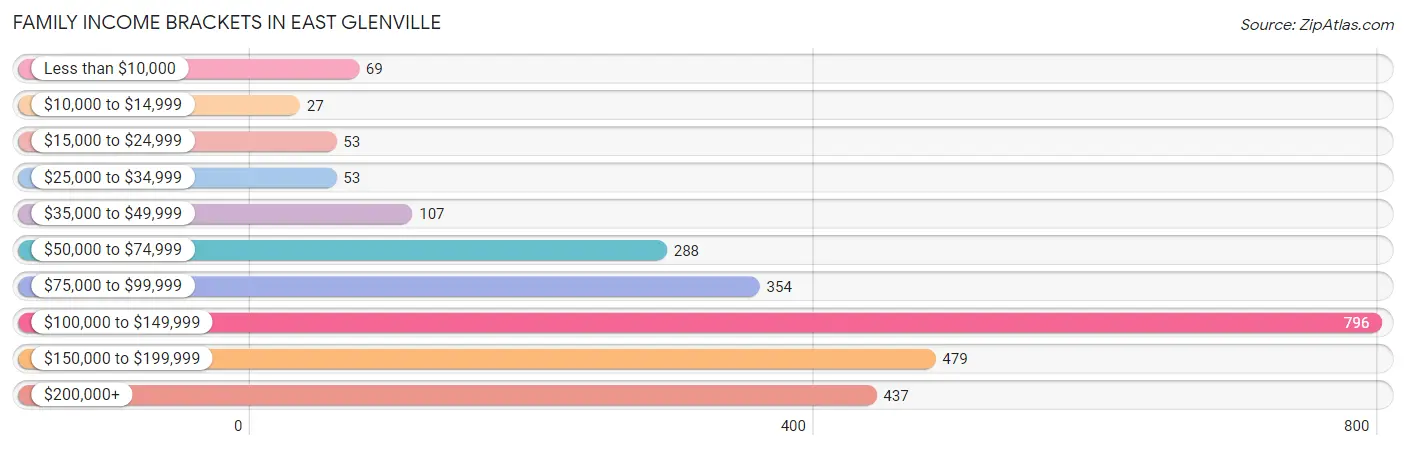
| Income Bracket | # Families | % Families |
| Less than $10,000 | 69 | 2.6% |
| $10,000 to $14,999 | 27 | 1.0% |
| $15,000 to $24,999 | 53 | 2.0% |
| $25,000 to $34,999 | 53 | 2.0% |
| $35,000 to $49,999 | 107 | 4.0% |
| $50,000 to $74,999 | 288 | 10.8% |
| $75,000 to $99,999 | 354 | 13.3% |
| $100,000 to $149,999 | 796 | 29.9% |
| $150,000 to $199,999 | 479 | 18.0% |
| $200,000+ | 437 | 16.4% |
Family Income by Famaliy Size in East Glenville
5-person families (149 | 5.6%) account for the highest median family income in East Glenville with $182,375 per family, while 2-person families (1,320 | 49.6%) have the highest median income of $54,030 per family member.
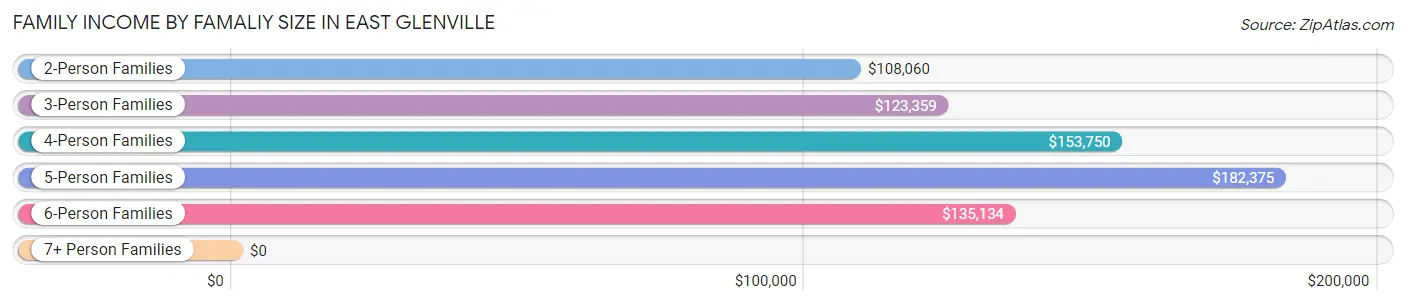
| Income Bracket | # Families | Median Income |
| 2-Person Families | 1,320 (49.6%) | $108,060 |
| 3-Person Families | 659 (24.7%) | $123,359 |
| 4-Person Families | 438 (16.5%) | $153,750 |
| 5-Person Families | 149 (5.6%) | $182,375 |
| 6-Person Families | 69 (2.6%) | $135,134 |
| 7+ Person Families | 28 (1.1%) | $0 |
| Total | 2,663 (100.0%) | $124,200 |
Family Income by Number of Earners in East Glenville
The median family income in East Glenville is $124,200, with families comprising 3+ earners (249) having the highest median family income of $191,827, while families with no earners (620) have the lowest median family income of $83,889, accounting for 9.3% and 23.3% of families, respectively.
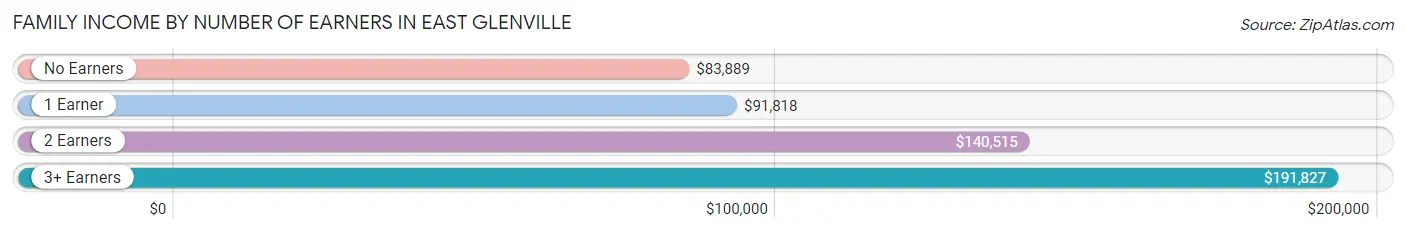
| Number of Earners | # Families | Median Income |
| No Earners | 620 (23.3%) | $83,889 |
| 1 Earner | 604 (22.7%) | $91,818 |
| 2 Earners | 1,190 (44.7%) | $140,515 |
| 3+ Earners | 249 (9.3%) | $191,827 |
| Total | 2,663 (100.0%) | $124,200 |
Household Income in East Glenville
Household Income Brackets in East Glenville
With 946 households falling in the category, the $100,000 to $149,999 income range is the most frequent in East Glenville, accounting for 20.1% of all households. In contrast, only 75 households (1.6%) fall into the $10,000 to $14,999 income bracket, making it the least populous group.
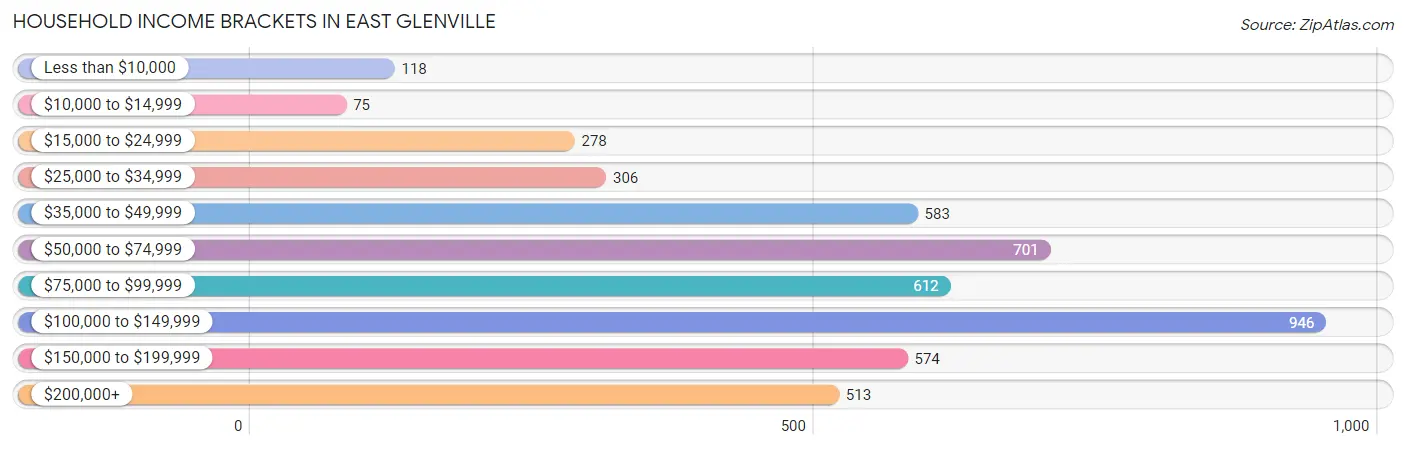
| Income Bracket | # Households | % Households |
| Less than $10,000 | 118 | 2.5% |
| $10,000 to $14,999 | 75 | 1.6% |
| $15,000 to $24,999 | 278 | 5.9% |
| $25,000 to $34,999 | 306 | 6.5% |
| $35,000 to $49,999 | 583 | 12.4% |
| $50,000 to $74,999 | 701 | 14.9% |
| $75,000 to $99,999 | 612 | 13.0% |
| $100,000 to $149,999 | 946 | 20.1% |
| $150,000 to $199,999 | 574 | 12.2% |
| $200,000+ | 513 | 10.9% |
Household Income by Householder Age in East Glenville
The median household income in East Glenville is $83,045, with the highest median household income of $123,125 found in the 45 to 64 years age bracket for the primary householder. A total of 1,432 households (30.4%) fall into this category. Meanwhile, the 15 to 24 years age bracket for the primary householder has the lowest median household income of $36,902, with 213 households (4.5%) in this group.
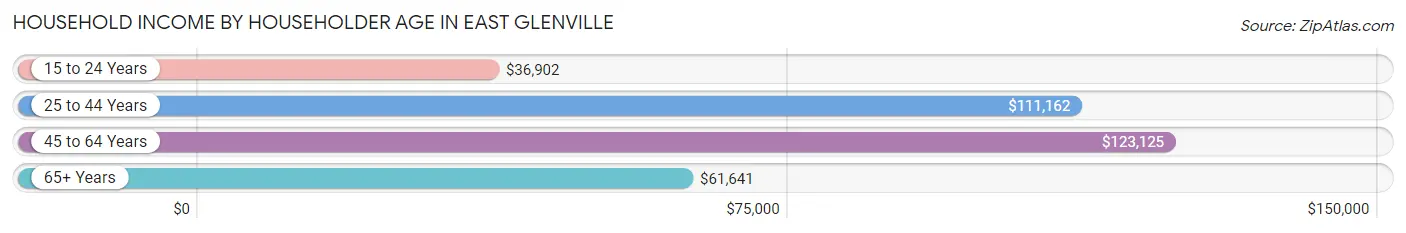
| Income Bracket | # Households | Median Income |
| 15 to 24 Years | 213 (4.5%) | $36,902 |
| 25 to 44 Years | 1,311 (27.9%) | $111,162 |
| 45 to 64 Years | 1,432 (30.4%) | $123,125 |
| 65+ Years | 1,748 (37.2%) | $61,641 |
| Total | 4,704 (100.0%) | $83,045 |
Poverty in East Glenville
Income Below Poverty by Sex and Age in East Glenville
With 4.7% poverty level for males and 7.5% for females among the residents of East Glenville, 45 to 54 year old males and 6 to 11 year old females are the most vulnerable to poverty, with 84 males (12.6%) and 65 females (16.5%) in their respective age groups living below the poverty level.
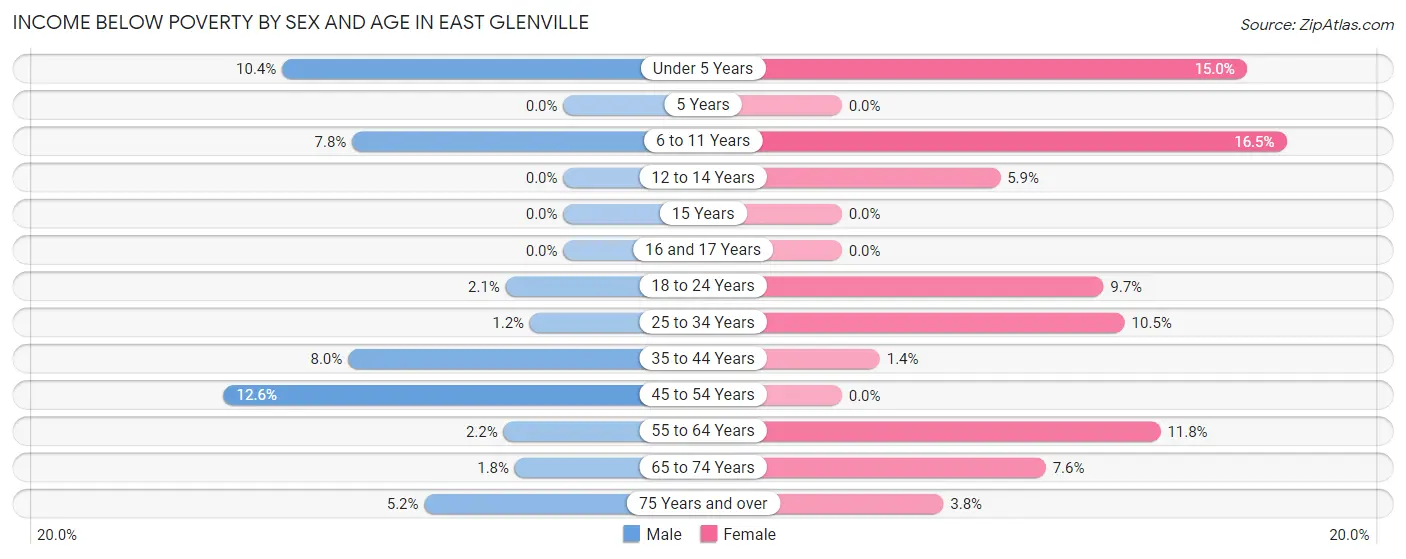
| Age Bracket | Male | Female |
| Under 5 Years | 26 (10.4%) | 66 (15.0%) |
| 5 Years | 0 (0.0%) | 0 (0.0%) |
| 6 to 11 Years | 36 (7.8%) | 65 (16.5%) |
| 12 to 14 Years | 0 (0.0%) | 10 (5.9%) |
| 15 Years | 0 (0.0%) | 0 (0.0%) |
| 16 and 17 Years | 0 (0.0%) | 0 (0.0%) |
| 18 to 24 Years | 11 (2.1%) | 33 (9.7%) |
| 25 to 34 Years | 8 (1.2%) | 76 (10.5%) |
| 35 to 44 Years | 43 (8.0%) | 9 (1.4%) |
| 45 to 54 Years | 84 (12.6%) | 0 (0.0%) |
| 55 to 64 Years | 17 (2.2%) | 93 (11.8%) |
| 65 to 74 Years | 10 (1.8%) | 49 (7.6%) |
| 75 Years and over | 24 (5.2%) | 36 (3.8%) |
| Total | 259 (4.7%) | 437 (7.5%) |
Income Above Poverty by Sex and Age in East Glenville
According to the poverty statistics in East Glenville, males aged 5 years and females aged 5 years are the age groups that are most secure financially, with 100.0% of males and 100.0% of females in these age groups living above the poverty line.
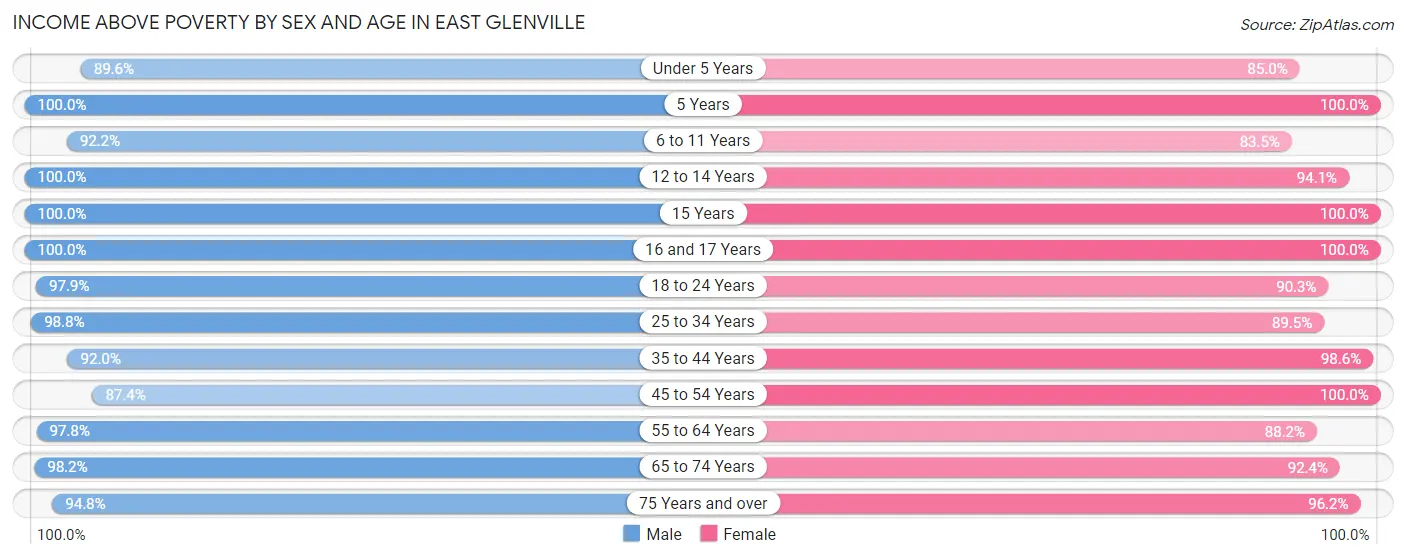
| Age Bracket | Male | Female |
| Under 5 Years | 223 (89.6%) | 373 (85.0%) |
| 5 Years | 68 (100.0%) | 64 (100.0%) |
| 6 to 11 Years | 423 (92.2%) | 329 (83.5%) |
| 12 to 14 Years | 262 (100.0%) | 160 (94.1%) |
| 15 Years | 72 (100.0%) | 78 (100.0%) |
| 16 and 17 Years | 219 (100.0%) | 67 (100.0%) |
| 18 to 24 Years | 502 (97.9%) | 307 (90.3%) |
| 25 to 34 Years | 639 (98.8%) | 648 (89.5%) |
| 35 to 44 Years | 495 (92.0%) | 628 (98.6%) |
| 45 to 54 Years | 582 (87.4%) | 491 (100.0%) |
| 55 to 64 Years | 748 (97.8%) | 693 (88.2%) |
| 65 to 74 Years | 545 (98.2%) | 598 (92.4%) |
| 75 Years and over | 441 (94.8%) | 919 (96.2%) |
| Total | 5,219 (95.3%) | 5,355 (92.5%) |
Income Below Poverty Among Married-Couple Families in East Glenville
The poverty statistics for married-couple families in East Glenville show that 0.8% or 18 of the total 2,271 families live below the poverty line. Families with no children have the highest poverty rate of 1.3%, comprising of 18 families. On the other hand, families with 1 or 2 children have the lowest poverty rate of 0.0%, which includes 0 families.
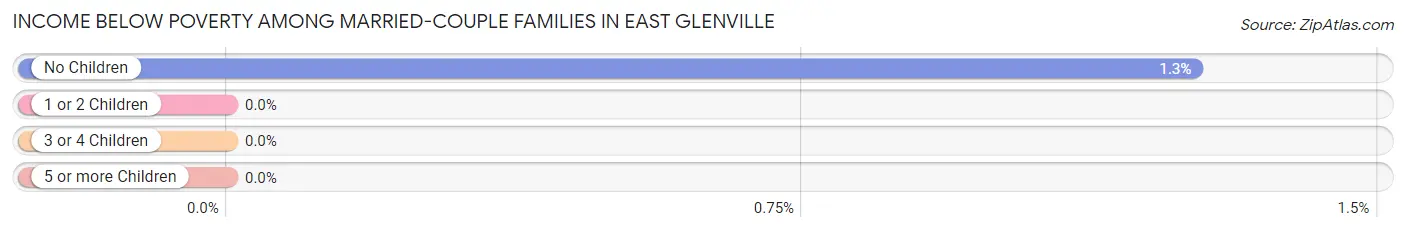
| Children | Above Poverty | Below Poverty |
| No Children | 1,407 (98.7%) | 18 (1.3%) |
| 1 or 2 Children | 658 (100.0%) | 0 (0.0%) |
| 3 or 4 Children | 178 (100.0%) | 0 (0.0%) |
| 5 or more Children | 10 (100.0%) | 0 (0.0%) |
| Total | 2,253 (99.2%) | 18 (0.8%) |
Income Below Poverty Among Single-Parent Households in East Glenville
According to the poverty data in East Glenville, 32.2% or 57 single-father households and 20.9% or 45 single-mother households are living below the poverty line. Among single-father households, those with 3 or 4 children have the highest poverty rate, with 37 households (100.0%) experiencing poverty. Likewise, among single-mother households, those with 1 or 2 children have the highest poverty rate, with 31 households (27.2%) falling below the poverty line.
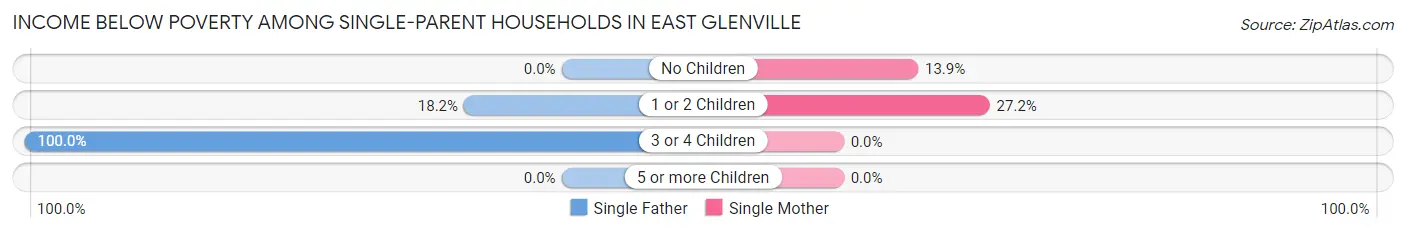
| Children | Single Father | Single Mother |
| No Children | 0 (0.0%) | 14 (13.9%) |
| 1 or 2 Children | 20 (18.2%) | 31 (27.2%) |
| 3 or 4 Children | 37 (100.0%) | 0 (0.0%) |
| 5 or more Children | 0 (0.0%) | 0 (0.0%) |
| Total | 57 (32.2%) | 45 (20.9%) |
Income Below Poverty Among Married-Couple vs Single-Parent Households in East Glenville
The poverty data for East Glenville shows that 18 of the married-couple family households (0.8%) and 102 of the single-parent households (26.0%) are living below the poverty level. Within the married-couple family households, those with no children have the highest poverty rate, with 18 households (1.3%) falling below the poverty line. Among the single-parent households, those with 3 or 4 children have the highest poverty rate, with 37 household (100.0%) living below poverty.
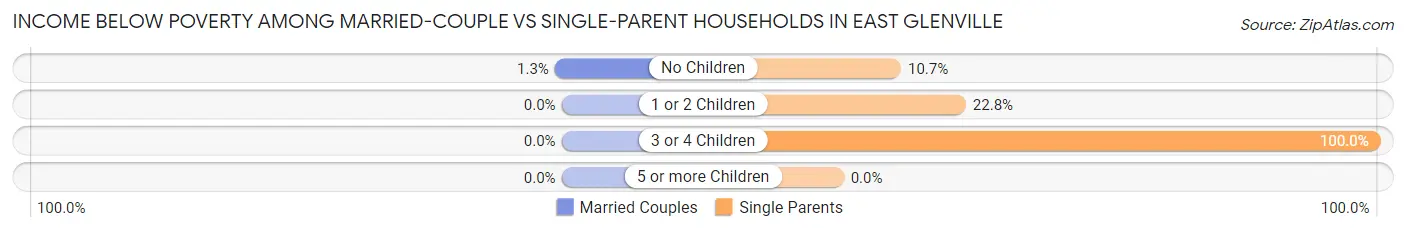
| Children | Married-Couple Families | Single-Parent Households |
| No Children | 18 (1.3%) | 14 (10.7%) |
| 1 or 2 Children | 0 (0.0%) | 51 (22.8%) |
| 3 or 4 Children | 0 (0.0%) | 37 (100.0%) |
| 5 or more Children | 0 (0.0%) | 0 (0.0%) |
| Total | 18 (0.8%) | 102 (26.0%) |
Race in East Glenville
The most populous races in East Glenville are White / Caucasian (10,669 | 93.0%), Two or more Races (445 | 3.9%), and Hispanic or Latino (350 | 3.0%).
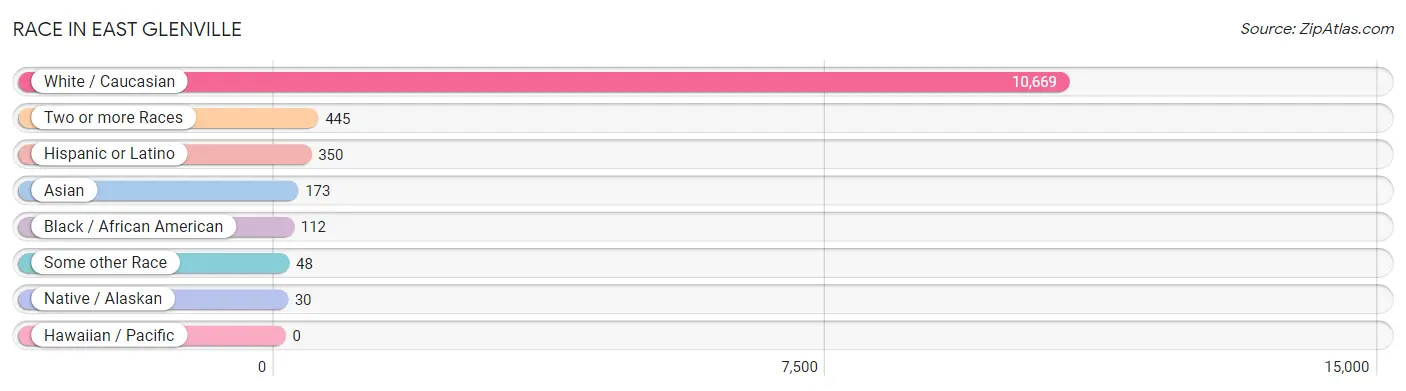
| Race | # Population | % Population |
| Asian | 173 | 1.5% |
| Black / African American | 112 | 1.0% |
| Hawaiian / Pacific | 0 | 0.0% |
| Hispanic or Latino | 350 | 3.0% |
| Native / Alaskan | 30 | 0.3% |
| White / Caucasian | 10,669 | 93.0% |
| Two or more Races | 445 | 3.9% |
| Some other Race | 48 | 0.4% |
| Total | 11,477 | 100.0% |
Ancestry in East Glenville
The most populous ancestries reported in East Glenville are Irish (3,539 | 30.8%), Italian (2,372 | 20.7%), German (2,274 | 19.8%), English (1,504 | 13.1%), and French (680 | 5.9%), together accounting for 90.3% of all East Glenville residents.
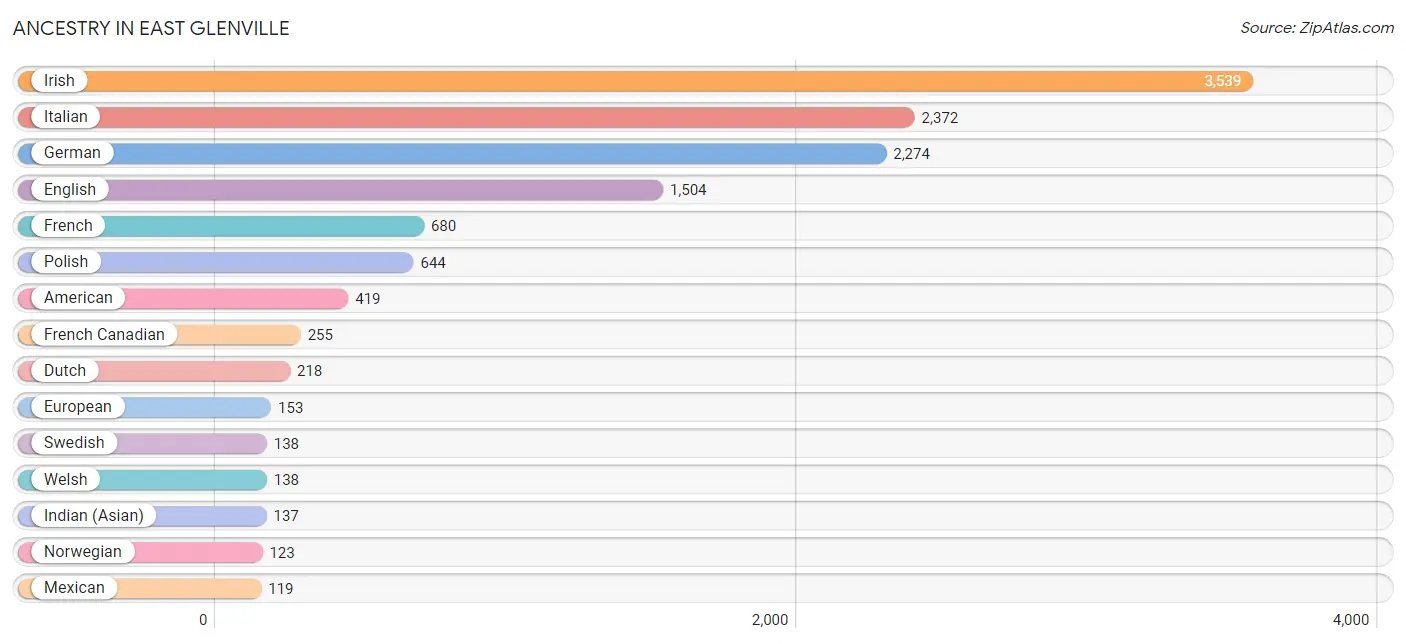
| Ancestry | # Population | % Population |
| African | 63 | 0.5% |
| American | 419 | 3.6% |
| Arab | 22 | 0.2% |
| Armenian | 19 | 0.2% |
| Australian | 5 | 0.0% |
| Austrian | 20 | 0.2% |
| British | 71 | 0.6% |
| Burmese | 11 | 0.1% |
| Canadian | 61 | 0.5% |
| Central American | 64 | 0.6% |
| Croatian | 22 | 0.2% |
| Cuban | 8 | 0.1% |
| Czech | 36 | 0.3% |
| Czechoslovakian | 40 | 0.4% |
| Danish | 54 | 0.5% |
| Dutch | 218 | 1.9% |
| English | 1,504 | 13.1% |
| European | 153 | 1.3% |
| French | 680 | 5.9% |
| French Canadian | 255 | 2.2% |
| German | 2,274 | 19.8% |
| Greek | 34 | 0.3% |
| Guatemalan | 1 | 0.0% |
| Guyanese | 17 | 0.2% |
| Haitian | 3 | 0.0% |
| Hungarian | 68 | 0.6% |
| Indian (Asian) | 137 | 1.2% |
| Iraqi | 12 | 0.1% |
| Irish | 3,539 | 30.8% |
| Iroquois | 7 | 0.1% |
| Italian | 2,372 | 20.7% |
| Lebanese | 10 | 0.1% |
| Lithuanian | 32 | 0.3% |
| Mexican | 119 | 1.0% |
| Mexican American Indian | 50 | 0.4% |
| Northern European | 17 | 0.2% |
| Norwegian | 123 | 1.1% |
| Pennsylvania German | 5 | 0.0% |
| Polish | 644 | 5.6% |
| Portuguese | 39 | 0.3% |
| Puerto Rican | 102 | 0.9% |
| Russian | 73 | 0.6% |
| Salvadoran | 63 | 0.5% |
| Scotch-Irish | 43 | 0.4% |
| Scottish | 116 | 1.0% |
| Sioux | 3 | 0.0% |
| Slovak | 34 | 0.3% |
| Slovene | 10 | 0.1% |
| South American | 31 | 0.3% |
| Subsaharan African | 64 | 0.6% |
| Swedish | 138 | 1.2% |
| Swiss | 7 | 0.1% |
| Thai | 83 | 0.7% |
| Trinidadian and Tobagonian | 15 | 0.1% |
| Ukrainian | 56 | 0.5% |
| Venezuelan | 31 | 0.3% |
| Welsh | 138 | 1.2% | View All 57 Rows |
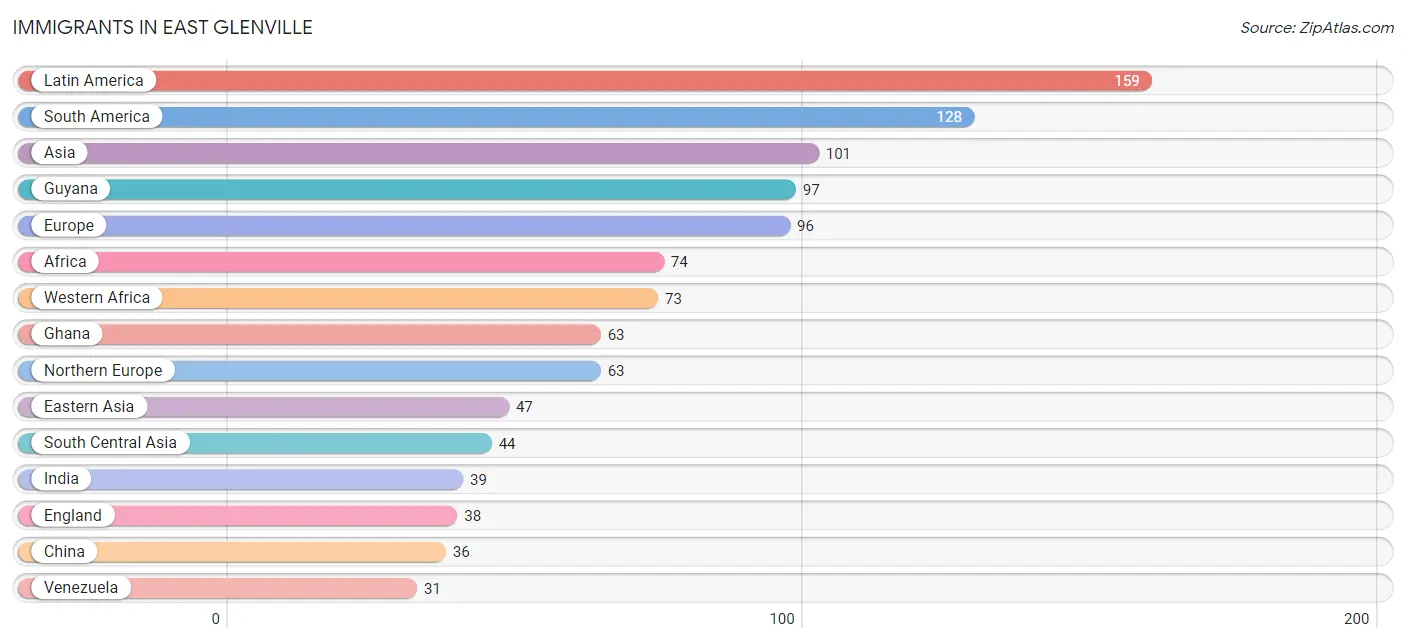
Immigrants in East Glenville
The most numerous immigrant groups reported in East Glenville came from Latin America (159 | 1.4%), South America (128 | 1.1%), Asia (101 | 0.9%), Guyana (97 | 0.9%), and Europe (96 | 0.8%), together accounting for 5.1% of all East Glenville residents.
| Immigration Origin | # Population | % Population |
| Africa | 74 | 0.6% |
| Asia | 101 | 0.9% |
| Australia | 7 | 0.1% |
| Canada | 25 | 0.2% |
| Caribbean | 7 | 0.1% |
| Central America | 24 | 0.2% |
| China | 36 | 0.3% |
| Eastern Africa | 1 | 0.0% |
| Eastern Asia | 47 | 0.4% |
| Eastern Europe | 11 | 0.1% |
| El Salvador | 21 | 0.2% |
| England | 38 | 0.3% |
| Europe | 96 | 0.8% |
| Germany | 22 | 0.2% |
| Ghana | 63 | 0.5% |
| Guyana | 97 | 0.9% |
| Hungary | 11 | 0.1% |
| India | 39 | 0.3% |
| Korea | 11 | 0.1% |
| Latin America | 159 | 1.4% |
| Liberia | 10 | 0.1% |
| Malaysia | 10 | 0.1% |
| Nicaragua | 3 | 0.0% |
| Northern Europe | 63 | 0.5% |
| Oceania | 7 | 0.1% |
| Scotland | 25 | 0.2% |
| South America | 128 | 1.1% |
| South Central Asia | 44 | 0.4% |
| South Eastern Asia | 10 | 0.1% |
| Taiwan | 7 | 0.1% |
| Trinidad and Tobago | 7 | 0.1% |
| Uzbekistan | 5 | 0.0% |
| Venezuela | 31 | 0.3% |
| Western Africa | 73 | 0.6% |
| Western Europe | 22 | 0.2% | View All 35 Rows |
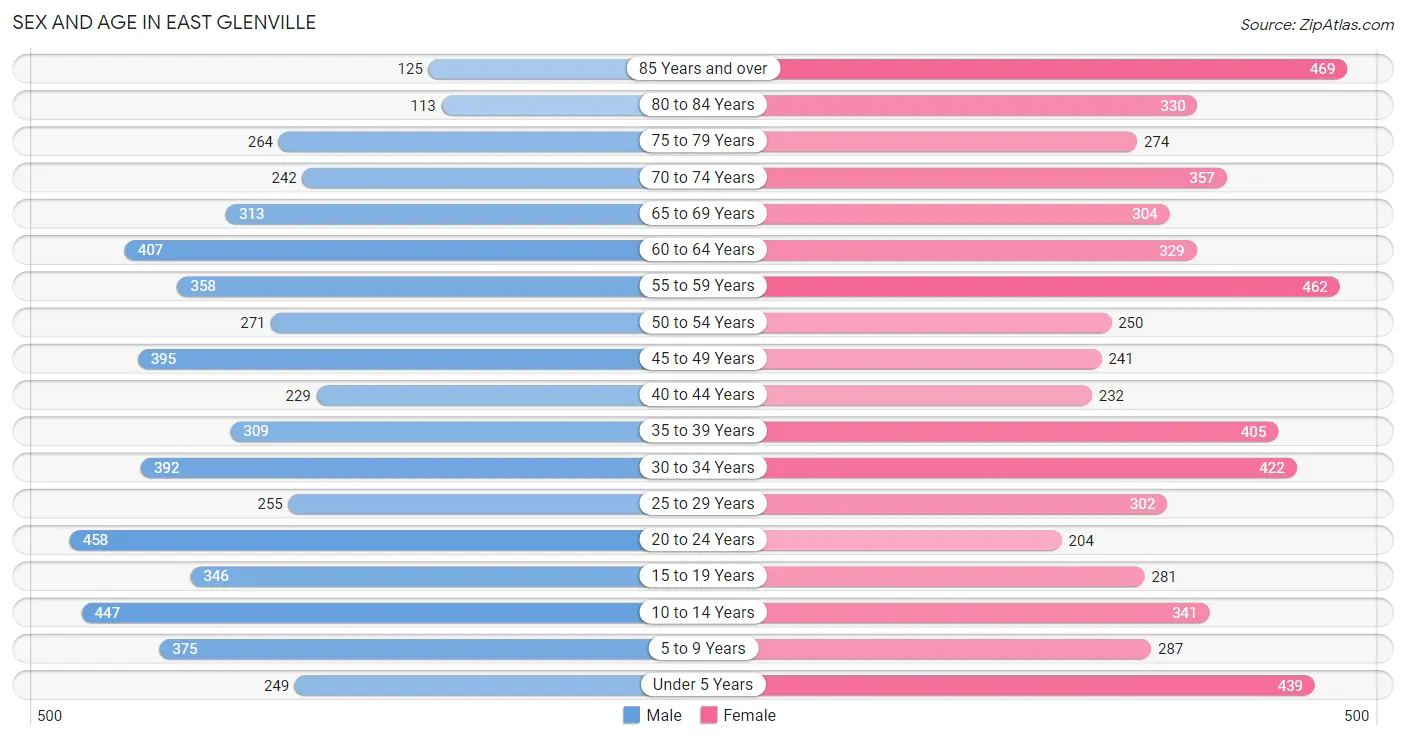
Sex and Age in East Glenville
Sex and Age in East Glenville
The most populous age groups in East Glenville are 20 to 24 Years (458 | 8.3%) for men and 85 Years and over (469 | 7.9%) for women.
| Age Bracket | Male | Female |
| Under 5 Years | 249 (4.5%) | 439 (7.4%) |
| 5 to 9 Years | 375 (6.8%) | 287 (4.8%) |
| 10 to 14 Years | 447 (8.1%) | 341 (5.8%) |
| 15 to 19 Years | 346 (6.2%) | 281 (4.7%) |
| 20 to 24 Years | 458 (8.3%) | 204 (3.4%) |
| 25 to 29 Years | 255 (4.6%) | 302 (5.1%) |
| 30 to 34 Years | 392 (7.1%) | 422 (7.1%) |
| 35 to 39 Years | 309 (5.6%) | 405 (6.8%) |
| 40 to 44 Years | 229 (4.1%) | 232 (3.9%) |
| 45 to 49 Years | 395 (7.1%) | 241 (4.1%) |
| 50 to 54 Years | 271 (4.9%) | 250 (4.2%) |
| 55 to 59 Years | 358 (6.5%) | 462 (7.8%) |
| 60 to 64 Years | 407 (7.3%) | 329 (5.6%) |
| 65 to 69 Years | 313 (5.6%) | 304 (5.1%) |
| 70 to 74 Years | 242 (4.4%) | 357 (6.0%) |
| 75 to 79 Years | 264 (4.8%) | 274 (4.6%) |
| 80 to 84 Years | 113 (2.0%) | 330 (5.6%) |
| 85 Years and over | 125 (2.2%) | 469 (7.9%) |
| Total | 5,548 (100.0%) | 5,929 (100.0%) |
Families and Households in East Glenville
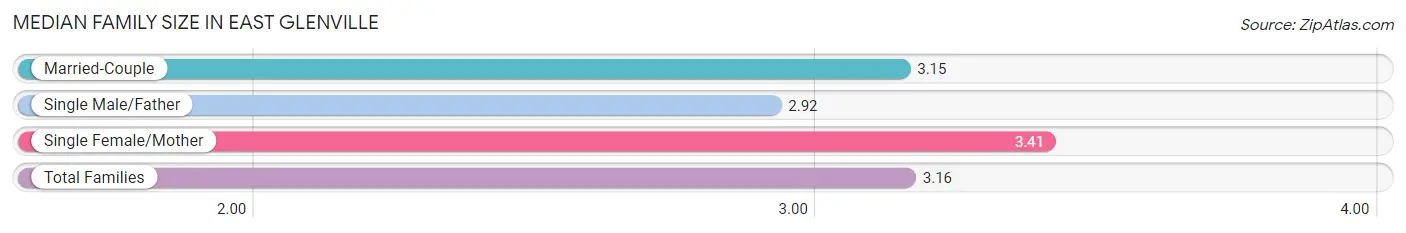
Median Family Size in East Glenville
The median family size in East Glenville is 3.16 persons per family, with single female/mother families (215 | 8.1%) accounting for the largest median family size of 3.41 persons per family. On the other hand, single male/father families (177 | 6.7%) represent the smallest median family size with 2.92 persons per family.
| Family Type | # Families | Family Size |
| Married-Couple | 2,271 (85.3%) | 3.15 |
| Single Male/Father | 177 (6.7%) | 2.92 |
| Single Female/Mother | 215 (8.1%) | 3.41 |
| Total Families | 2,663 (100.0%) | 3.16 |
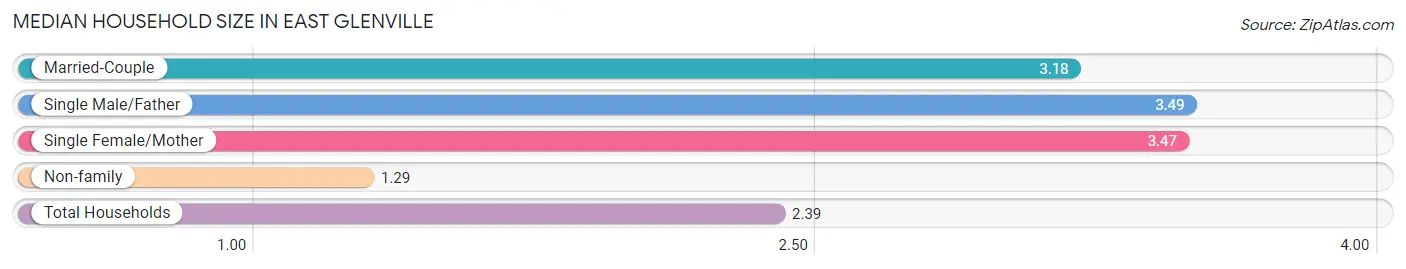
Median Household Size in East Glenville
The median household size in East Glenville is 2.39 persons per household, with single male/father households (177 | 3.8%) accounting for the largest median household size of 3.49 persons per household. non-family households (2,041 | 43.4%) represent the smallest median household size with 1.29 persons per household.
| Household Type | # Households | Household Size |
| Married-Couple | 2,271 (48.3%) | 3.18 |
| Single Male/Father | 177 (3.8%) | 3.49 |
| Single Female/Mother | 215 (4.6%) | 3.47 |
| Non-family | 2,041 (43.4%) | 1.29 |
| Total Households | 4,704 (100.0%) | 2.39 |
Household Size by Marriage Status in East Glenville
Out of a total of 4,704 households in East Glenville, 2,663 (56.6%) are family households, while 2,041 (43.4%) are nonfamily households. The most numerous type of family households are 2-person households, comprising 1,274, and the most common type of nonfamily households are 1-person households, comprising 1,733.
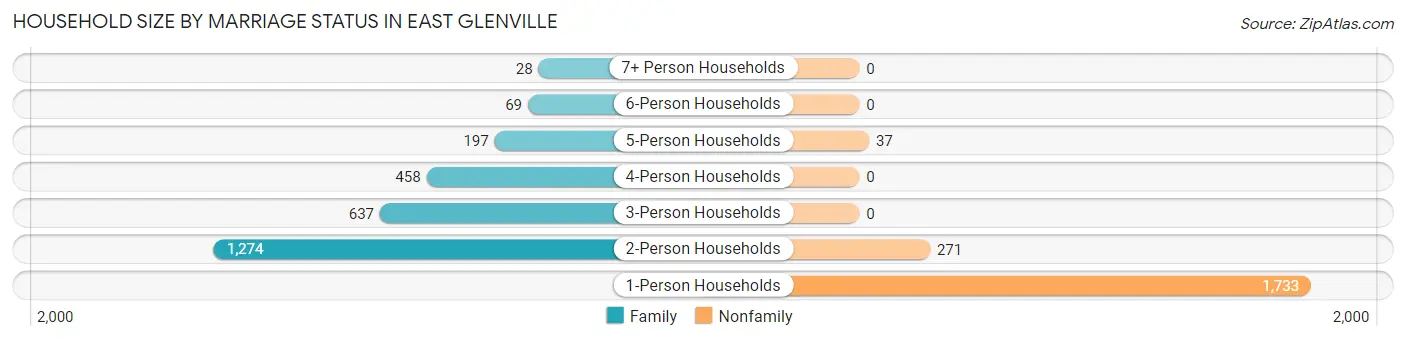
| Household Size | Family Households | Nonfamily Households |
| 1-Person Households | - | 1,733 (36.8%) |
| 2-Person Households | 1,274 (27.1%) | 271 (5.8%) |
| 3-Person Households | 637 (13.5%) | 0 (0.0%) |
| 4-Person Households | 458 (9.7%) | 0 (0.0%) |
| 5-Person Households | 197 (4.2%) | 37 (0.8%) |
| 6-Person Households | 69 (1.5%) | 0 (0.0%) |
| 7+ Person Households | 28 (0.6%) | 0 (0.0%) |
| Total | 2,663 (56.6%) | 2,041 (43.4%) |
Female Fertility in East Glenville
Fertility by Age in East Glenville
Average fertility rate in East Glenville is 58.0 births per 1,000 women. Women in the age bracket of 20 to 34 years have the highest fertility rate with 113.0 births per 1,000 women. Women in the age bracket of 20 to 34 years acount for 86.8% of all women with births.
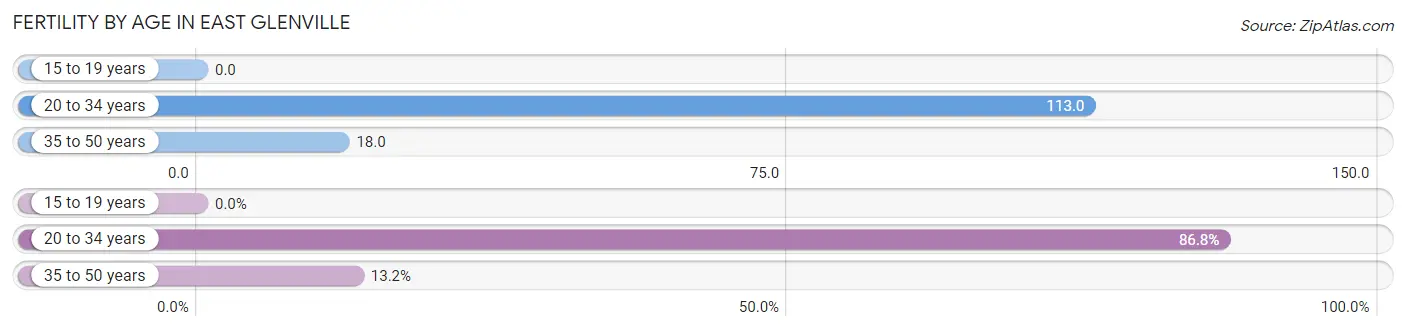
| Age Bracket | Women with Births | Births / 1,000 Women |
| 15 to 19 years | 0 (0.0%) | 0.0 |
| 20 to 34 years | 105 (86.8%) | 113.0 |
| 35 to 50 years | 16 (13.2%) | 18.0 |
| Total | 121 (100.0%) | 58.0 |
Fertility by Age by Marriage Status in East Glenville
97.5% of women with births (121) in East Glenville are married. The highest percentage of unmarried women with births falls into 35 to 50 years age bracket with 18.8% of them unmarried at the time of birth, while the lowest percentage of unmarried women with births belong to 20 to 34 years age bracket with 0.0% of them unmarried.
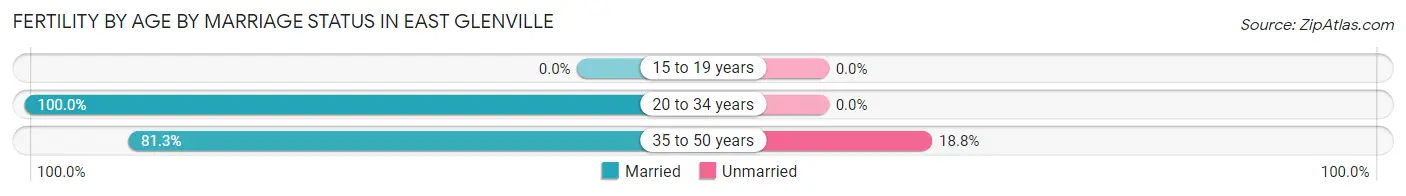
| Age Bracket | Married | Unmarried |
| 15 to 19 years | 0 (0.0%) | 0 (0.0%) |
| 20 to 34 years | 105 (100.0%) | 0 (0.0%) |
| 35 to 50 years | 13 (81.2%) | 3 (18.8%) |
| Total | 118 (97.5%) | 3 (2.5%) |
Fertility by Education in East Glenville
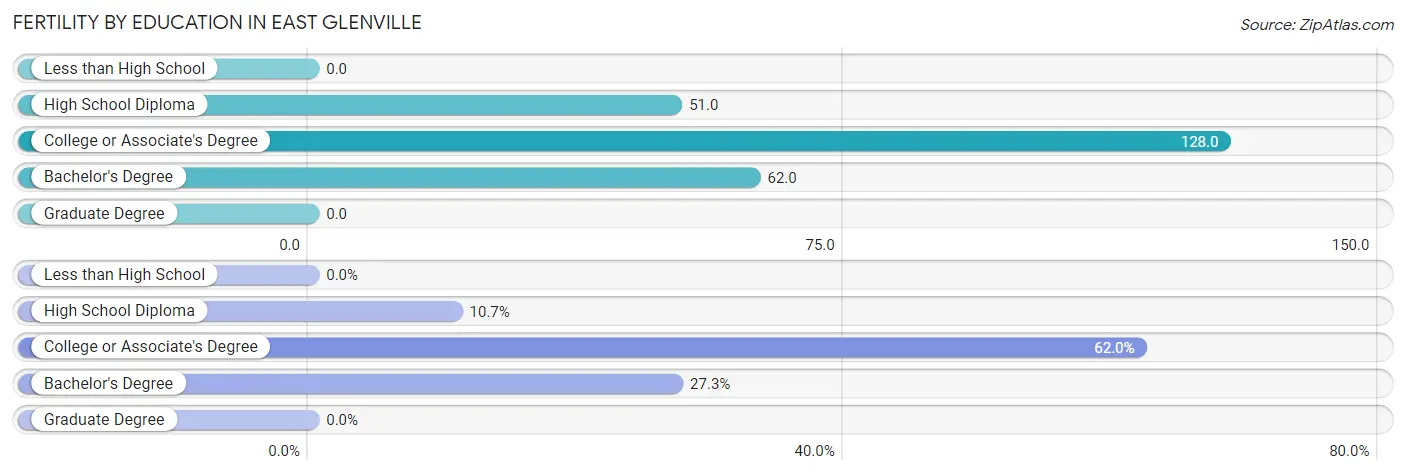
| Educational Attainment | Women with Births | Births / 1,000 Women |
| Less than High School | 0 (0.0%) | 0.0 |
| High School Diploma | 13 (10.7%) | 51.0 |
| College or Associate's Degree | 75 (62.0%) | 128.0 |
| Bachelor's Degree | 33 (27.3%) | 62.0 |
| Graduate Degree | 0 (0.0%) | 0.0 |
| Total | 121 (100.0%) | 58.0 |
Fertility by Education by Marriage Status in East Glenville
2.5% of women with births in East Glenville are unmarried. Women with the educational attainment of high school diploma are most likely to be married with 100.0% of them married at childbirth, while women with the educational attainment of bachelor's degree are least likely to be married with 9.1% of them unmarried at childbirth.
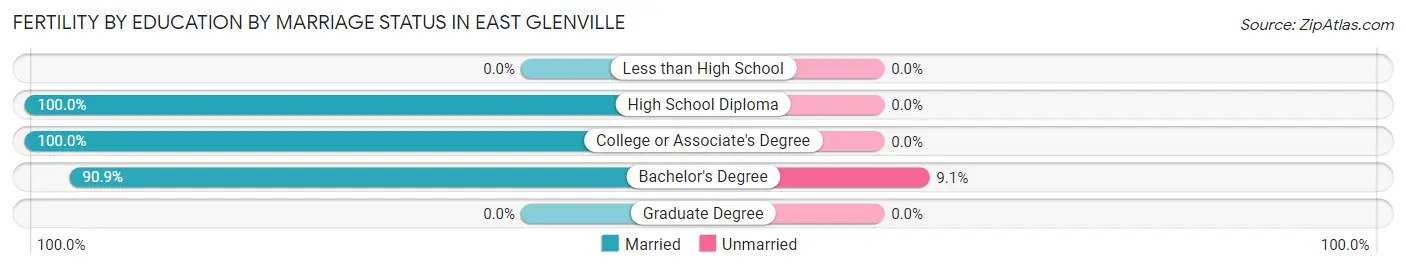
| Educational Attainment | Married | Unmarried |
| Less than High School | 0 (0.0%) | 0 (0.0%) |
| High School Diploma | 13 (100.0%) | 0 (0.0%) |
| College or Associate's Degree | 75 (100.0%) | 0 (0.0%) |
| Bachelor's Degree | 30 (90.9%) | 3 (9.1%) |
| Graduate Degree | 0 (0.0%) | 0 (0.0%) |
| Total | 118 (97.5%) | 3 (2.5%) |
Employment Characteristics in East Glenville
Employment by Class of Employer in East Glenville
Among the 5,000 employed individuals in East Glenville, private company employees (2,591 | 51.8%), not-for-profit organizations (936 | 18.7%), and state government employees (548 | 11.0%) make up the most common classes of employment.
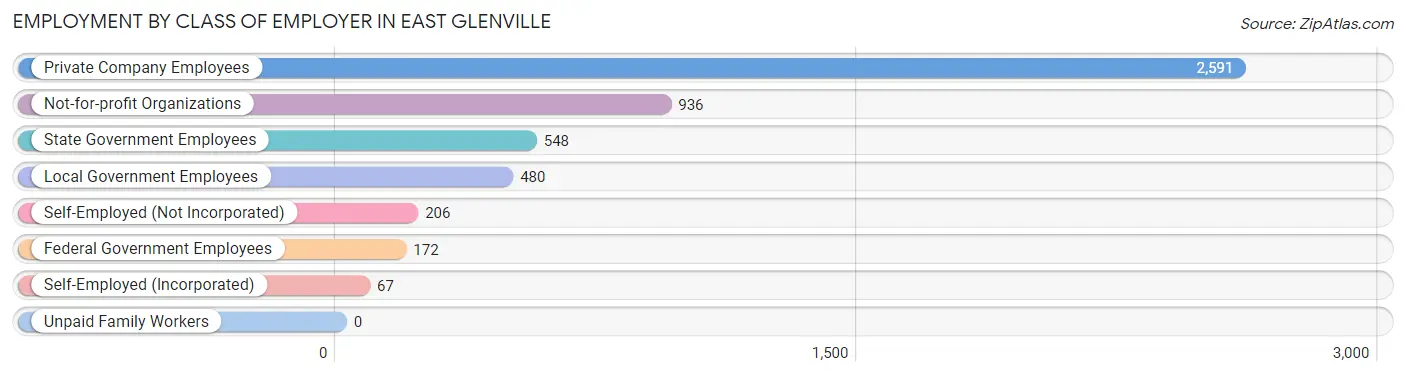
| Employer Class | # Employees | % Employees |
| Private Company Employees | 2,591 | 51.8% |
| Self-Employed (Incorporated) | 67 | 1.3% |
| Self-Employed (Not Incorporated) | 206 | 4.1% |
| Not-for-profit Organizations | 936 | 18.7% |
| Local Government Employees | 480 | 9.6% |
| State Government Employees | 548 | 11.0% |
| Federal Government Employees | 172 | 3.4% |
| Unpaid Family Workers | 0 | 0.0% |
| Total | 5,000 | 100.0% |
Employment Status by Age in East Glenville
According to the labor force statistics for East Glenville, out of the total population over 16 years of age (9,189), 60.5% or 5,559 individuals are in the labor force, with 6.7% or 372 of them unemployed. The age group with the highest labor force participation rate is 25 to 29 years, with 96.6% or 538 individuals in the labor force. Within the labor force, the 20 to 24 years age range has the highest percentage of unemployed individuals, with 25.7% or 153 of them being unemployed.
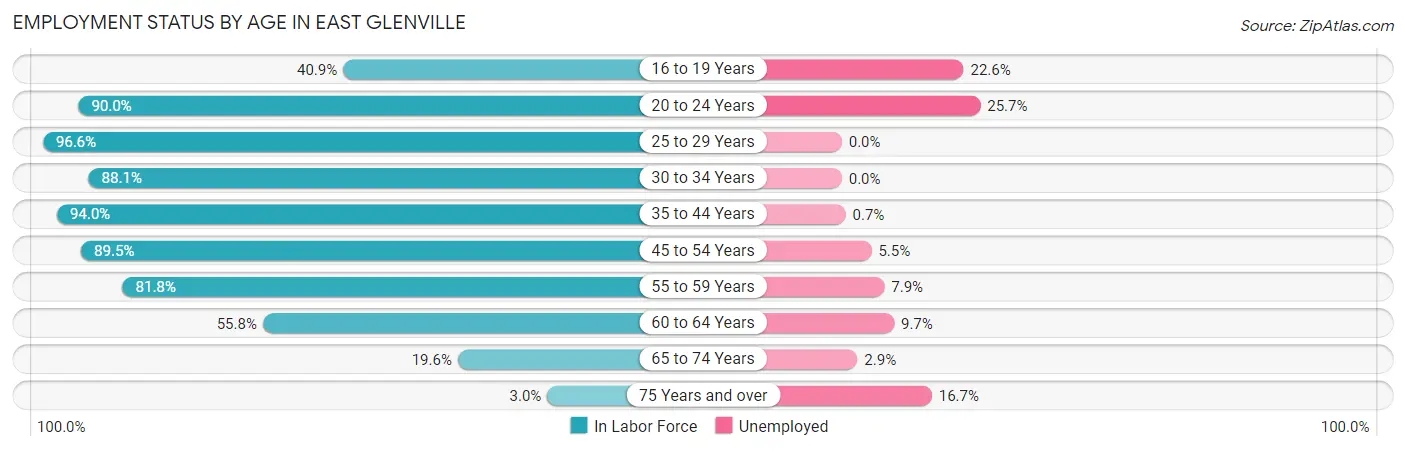
| Age Bracket | In Labor Force | Unemployed |
| 16 to 19 Years | 195 (40.9%) | 44 (22.6%) |
| 20 to 24 Years | 596 (90.0%) | 153 (25.7%) |
| 25 to 29 Years | 538 (96.6%) | 0 (0.0%) |
| 30 to 34 Years | 717 (88.1%) | 0 (0.0%) |
| 35 to 44 Years | 1,104 (94.0%) | 8 (0.7%) |
| 45 to 54 Years | 1,036 (89.5%) | 57 (5.5%) |
| 55 to 59 Years | 671 (81.8%) | 53 (7.9%) |
| 60 to 64 Years | 411 (55.8%) | 40 (9.7%) |
| 65 to 74 Years | 238 (19.6%) | 7 (2.9%) |
| 75 Years and over | 47 (3.0%) | 8 (16.7%) |
| Total | 5,559 (60.5%) | 372 (6.7%) |
Employment Status by Educational Attainment in East Glenville
According to labor force statistics for East Glenville, 85.1% of individuals (4,475) out of the total population between 25 and 64 years of age (5,259) are in the labor force, with 3.5% or 157 of them being unemployed. The group with the highest labor force participation rate are those with the educational attainment of college / associate degree, with 89.5% or 1,427 individuals in the labor force. Within the labor force, individuals with high school diploma education have the highest percentage of unemployment, with 6.9% or 45 of them being unemployed.
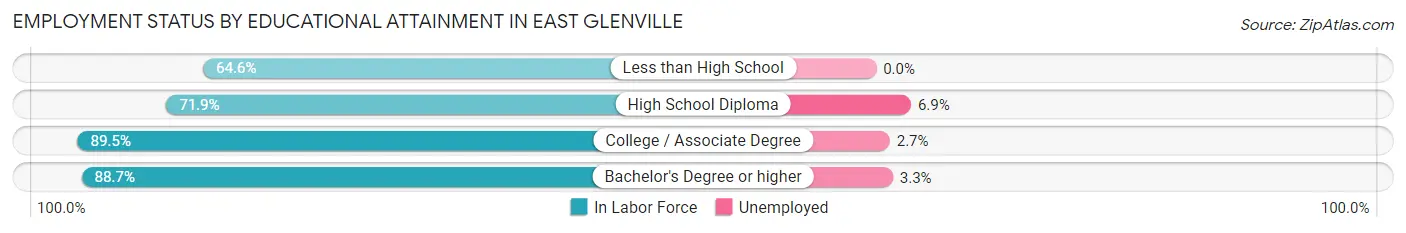
| Educational Attainment | In Labor Force | Unemployed |
| Less than High School | 122 (64.6%) | 0 (0.0%) |
| High School Diploma | 654 (71.9%) | 63 (6.9%) |
| College / Associate Degree | 1,427 (89.5%) | 43 (2.7%) |
| Bachelor's Degree or higher | 2,277 (88.7%) | 85 (3.3%) |
| Total | 4,475 (85.1%) | 184 (3.5%) |
Employment Occupations by Sex in East Glenville
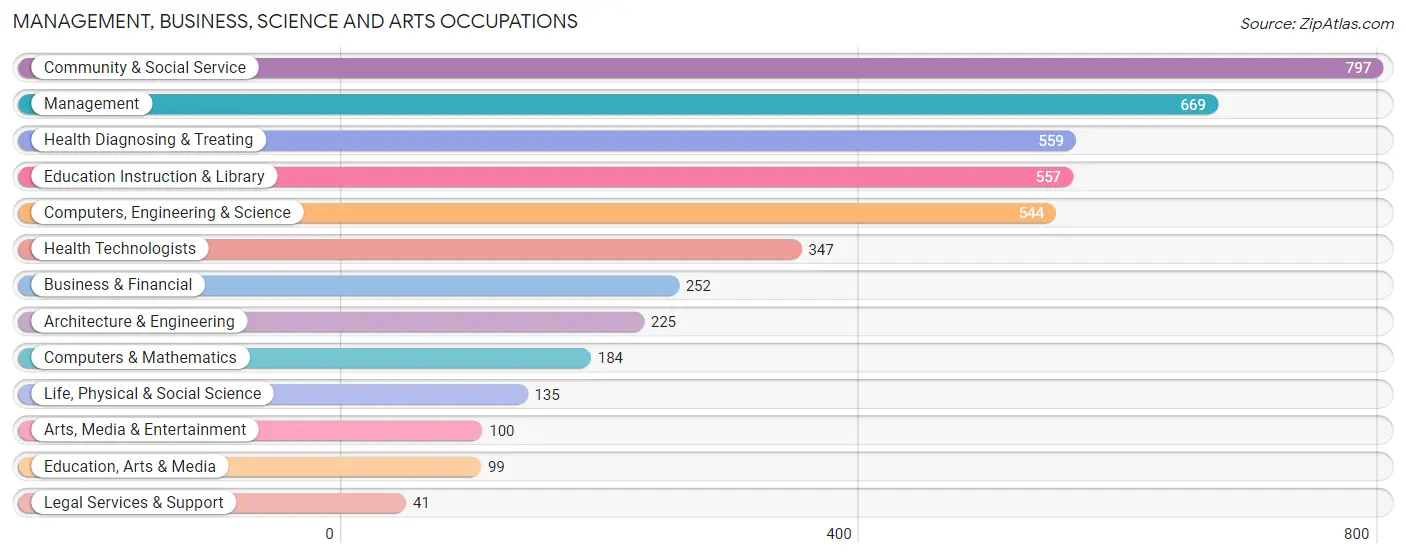
Management, Business, Science and Arts Occupations
The most common Management, Business, Science and Arts occupations in East Glenville are Community & Social Service (797 | 15.4%), Management (669 | 13.0%), Health Diagnosing & Treating (559 | 10.8%), Education Instruction & Library (557 | 10.8%), and Computers, Engineering & Science (544 | 10.5%).
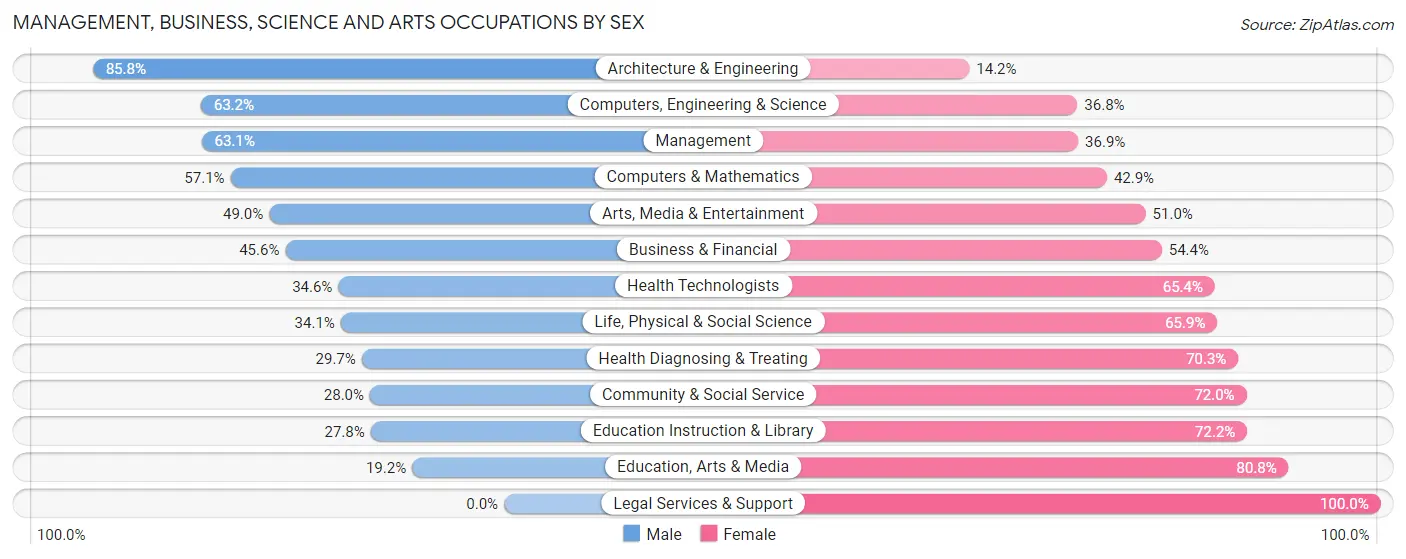
Management, Business, Science and Arts Occupations by Sex
Within the Management, Business, Science and Arts occupations in East Glenville, the most male-oriented occupations are Architecture & Engineering (85.8%), Computers, Engineering & Science (63.2%), and Management (63.1%), while the most female-oriented occupations are Legal Services & Support (100.0%), Education, Arts & Media (80.8%), and Education Instruction & Library (72.2%).
| Occupation | Male | Female |
| Management | 422 (63.1%) | 247 (36.9%) |
| Business & Financial | 115 (45.6%) | 137 (54.4%) |
| Computers, Engineering & Science | 344 (63.2%) | 200 (36.8%) |
| Computers & Mathematics | 105 (57.1%) | 79 (42.9%) |
| Architecture & Engineering | 193 (85.8%) | 32 (14.2%) |
| Life, Physical & Social Science | 46 (34.1%) | 89 (65.9%) |
| Community & Social Service | 223 (28.0%) | 574 (72.0%) |
| Education, Arts & Media | 19 (19.2%) | 80 (80.8%) |
| Legal Services & Support | 0 (0.0%) | 41 (100.0%) |
| Education Instruction & Library | 155 (27.8%) | 402 (72.2%) |
| Arts, Media & Entertainment | 49 (49.0%) | 51 (51.0%) |
| Health Diagnosing & Treating | 166 (29.7%) | 393 (70.3%) |
| Health Technologists | 120 (34.6%) | 227 (65.4%) |
| Total (Category) | 1,270 (45.0%) | 1,551 (55.0%) |
| Total (Overall) | 2,621 (50.8%) | 2,537 (49.2%) |
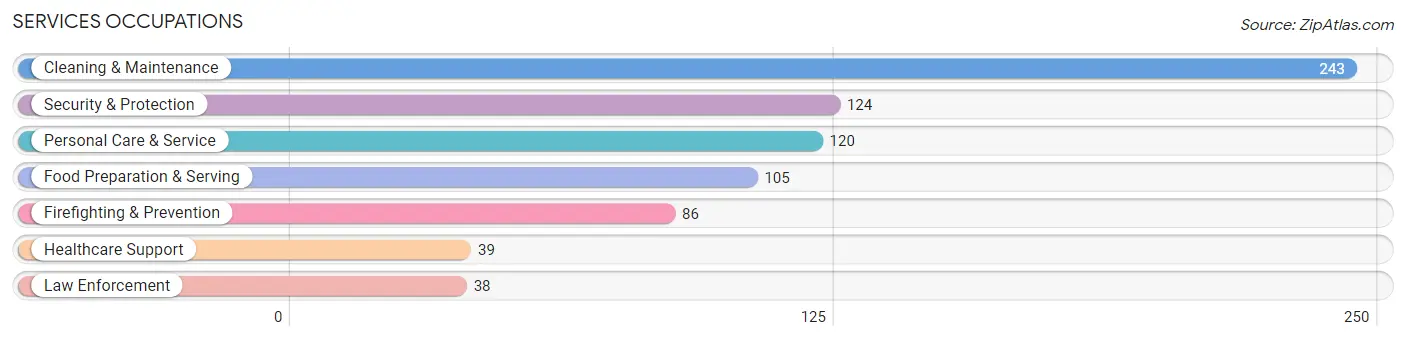
Services Occupations
The most common Services occupations in East Glenville are Cleaning & Maintenance (243 | 4.7%), Security & Protection (124 | 2.4%), Personal Care & Service (120 | 2.3%), Food Preparation & Serving (105 | 2.0%), and Firefighting & Prevention (86 | 1.7%).
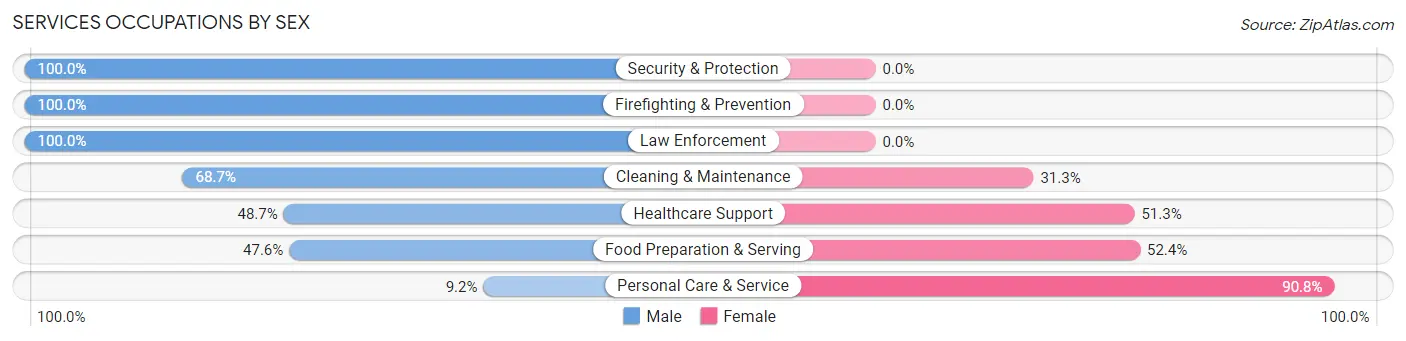
Services Occupations by Sex
Within the Services occupations in East Glenville, the most male-oriented occupations are Security & Protection (100.0%), Firefighting & Prevention (100.0%), and Law Enforcement (100.0%), while the most female-oriented occupations are Personal Care & Service (90.8%), Food Preparation & Serving (52.4%), and Healthcare Support (51.3%).
| Occupation | Male | Female |
| Healthcare Support | 19 (48.7%) | 20 (51.3%) |
| Security & Protection | 124 (100.0%) | 0 (0.0%) |
| Firefighting & Prevention | 86 (100.0%) | 0 (0.0%) |
| Law Enforcement | 38 (100.0%) | 0 (0.0%) |
| Food Preparation & Serving | 50 (47.6%) | 55 (52.4%) |
| Cleaning & Maintenance | 167 (68.7%) | 76 (31.3%) |
| Personal Care & Service | 11 (9.2%) | 109 (90.8%) |
| Total (Category) | 371 (58.8%) | 260 (41.2%) |
| Total (Overall) | 2,621 (50.8%) | 2,537 (49.2%) |
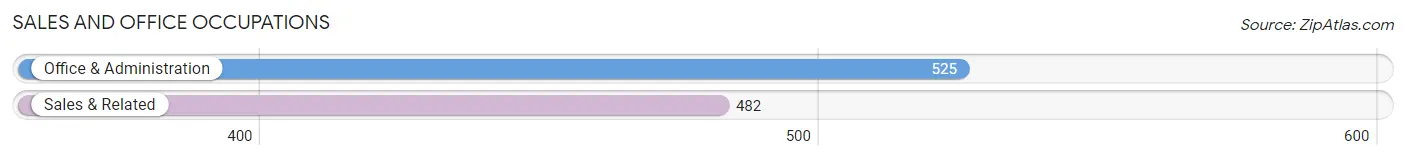
Sales and Office Occupations
The most common Sales and Office occupations in East Glenville are Office & Administration (525 | 10.2%), and Sales & Related (482 | 9.3%).
Sales and Office Occupations by Sex
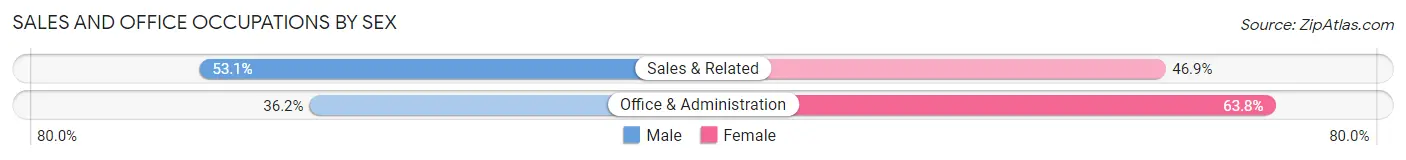
| Occupation | Male | Female |
| Sales & Related | 256 (53.1%) | 226 (46.9%) |
| Office & Administration | 190 (36.2%) | 335 (63.8%) |
| Total (Category) | 446 (44.3%) | 561 (55.7%) |
| Total (Overall) | 2,621 (50.8%) | 2,537 (49.2%) |
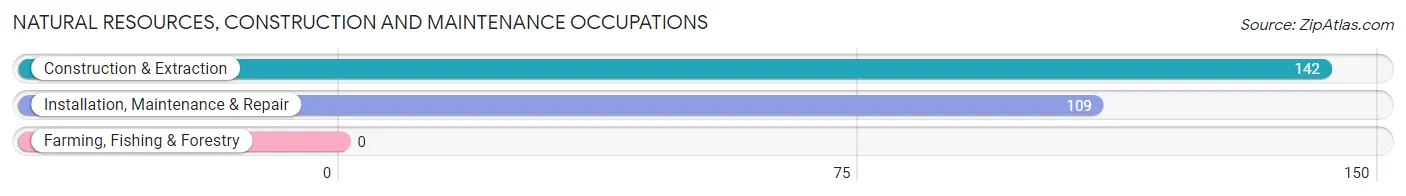
Natural Resources, Construction and Maintenance Occupations
The most common Natural Resources, Construction and Maintenance occupations in East Glenville are Construction & Extraction (142 | 2.8%), and Installation, Maintenance & Repair (109 | 2.1%).
Natural Resources, Construction and Maintenance Occupations by Sex
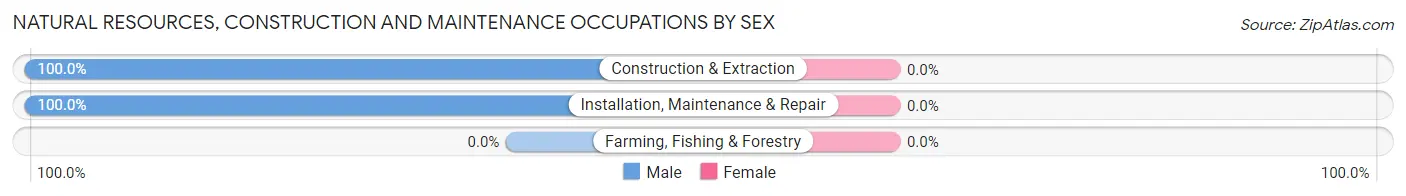
| Occupation | Male | Female |
| Farming, Fishing & Forestry | 0 (0.0%) | 0 (0.0%) |
| Construction & Extraction | 142 (100.0%) | 0 (0.0%) |
| Installation, Maintenance & Repair | 109 (100.0%) | 0 (0.0%) |
| Total (Category) | 251 (100.0%) | 0 (0.0%) |
| Total (Overall) | 2,621 (50.8%) | 2,537 (49.2%) |
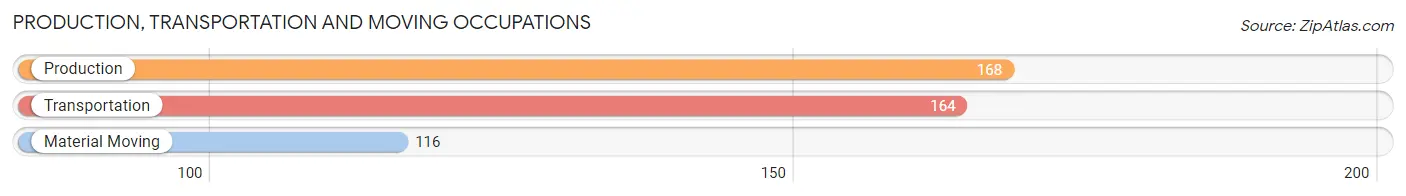
Production, Transportation and Moving Occupations
The most common Production, Transportation and Moving occupations in East Glenville are Production (168 | 3.3%), Transportation (164 | 3.2%), and Material Moving (116 | 2.2%).
Production, Transportation and Moving Occupations by Sex
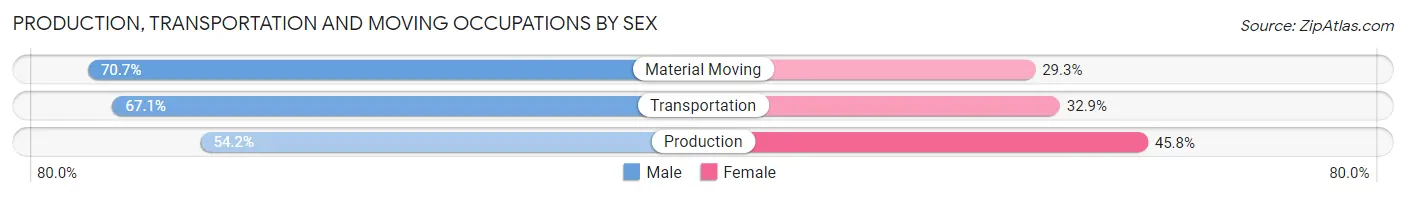
| Occupation | Male | Female |
| Production | 91 (54.2%) | 77 (45.8%) |
| Transportation | 110 (67.1%) | 54 (32.9%) |
| Material Moving | 82 (70.7%) | 34 (29.3%) |
| Total (Category) | 283 (63.2%) | 165 (36.8%) |
| Total (Overall) | 2,621 (50.8%) | 2,537 (49.2%) |
Employment Industries by Sex in East Glenville
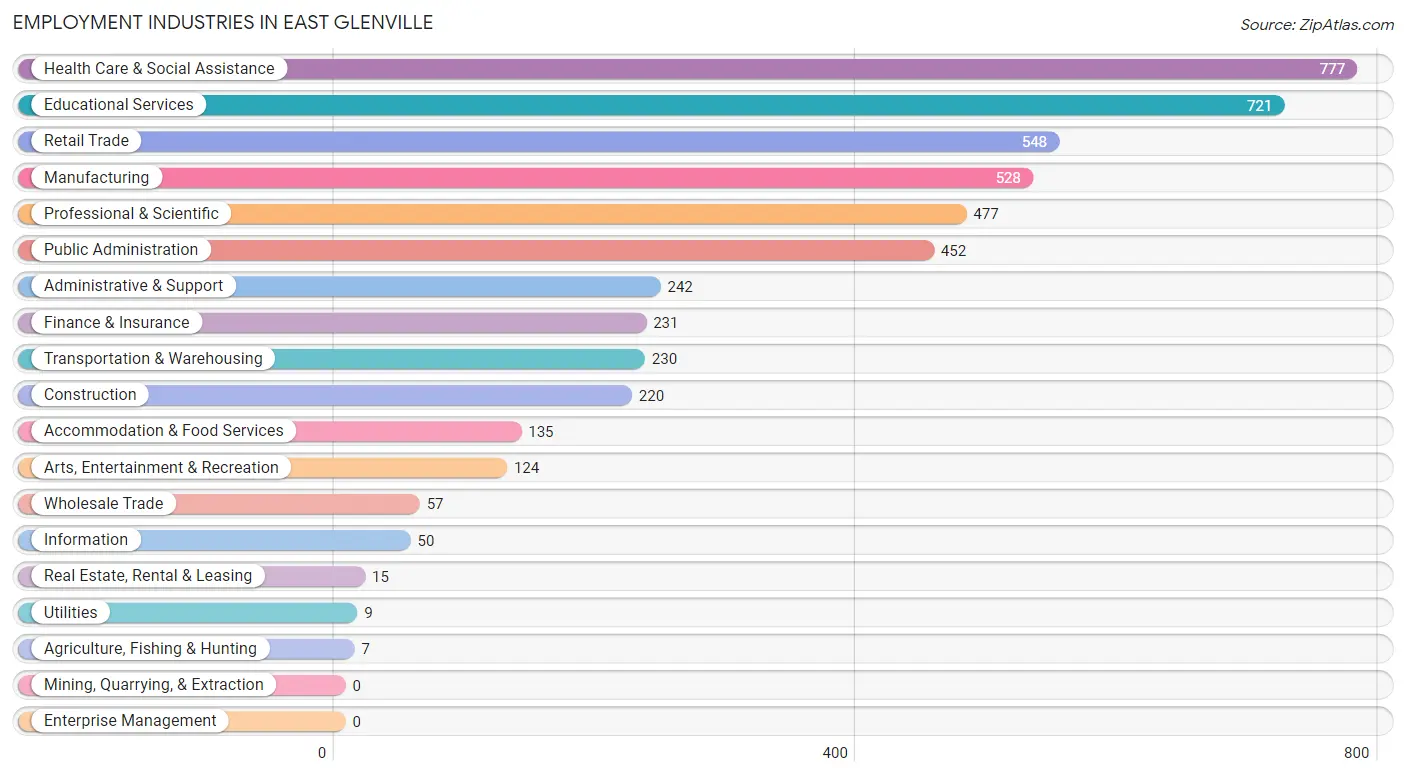
Employment Industries in East Glenville
The major employment industries in East Glenville include Health Care & Social Assistance (777 | 15.1%), Educational Services (721 | 14.0%), Retail Trade (548 | 10.6%), Manufacturing (528 | 10.2%), and Professional & Scientific (477 | 9.2%).
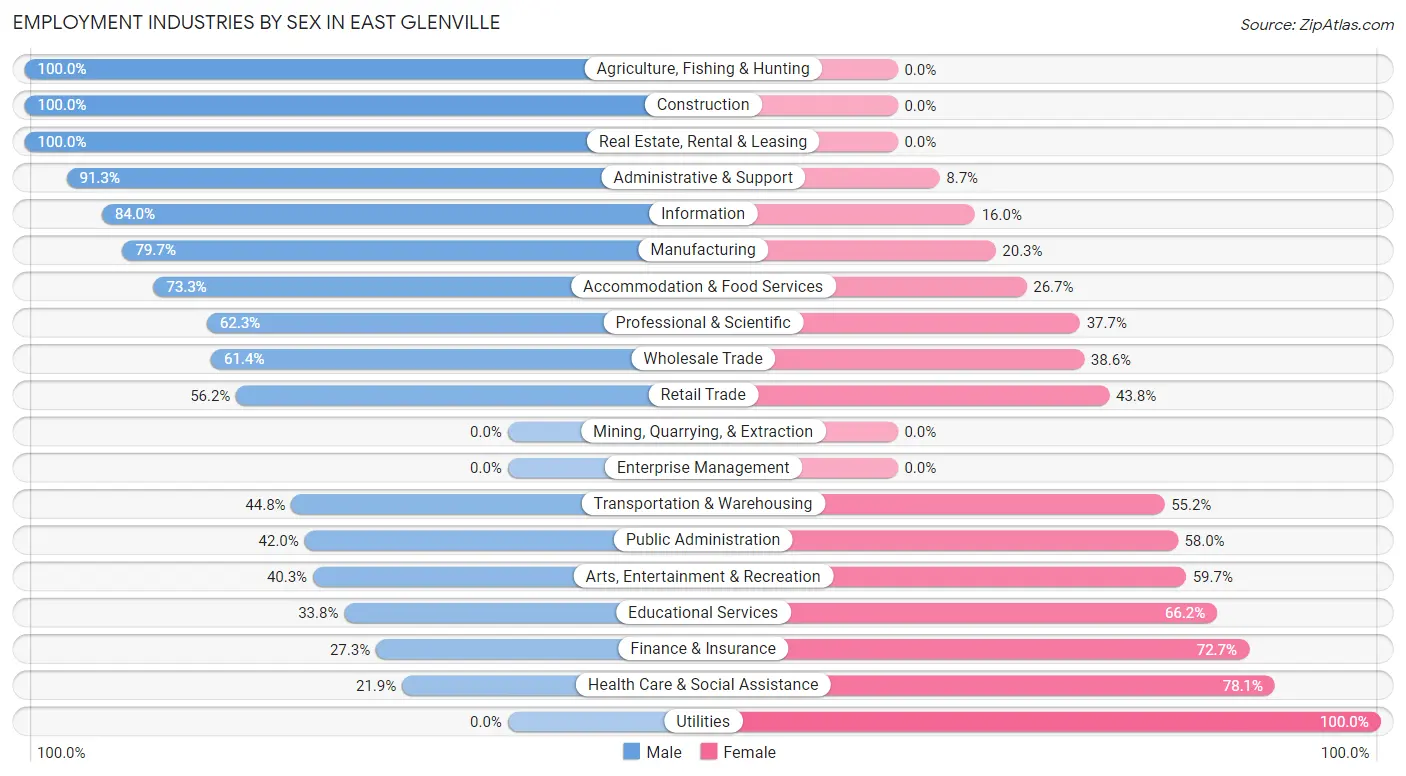
Employment Industries by Sex in East Glenville
The East Glenville industries that see more men than women are Agriculture, Fishing & Hunting (100.0%), Construction (100.0%), and Real Estate, Rental & Leasing (100.0%), whereas the industries that tend to have a higher number of women are Utilities (100.0%), Health Care & Social Assistance (78.1%), and Finance & Insurance (72.7%).
| Industry | Male | Female |
| Agriculture, Fishing & Hunting | 7 (100.0%) | 0 (0.0%) |
| Mining, Quarrying, & Extraction | 0 (0.0%) | 0 (0.0%) |
| Construction | 220 (100.0%) | 0 (0.0%) |
| Manufacturing | 421 (79.7%) | 107 (20.3%) |
| Wholesale Trade | 35 (61.4%) | 22 (38.6%) |
| Retail Trade | 308 (56.2%) | 240 (43.8%) |
| Transportation & Warehousing | 103 (44.8%) | 127 (55.2%) |
| Utilities | 0 (0.0%) | 9 (100.0%) |
| Information | 42 (84.0%) | 8 (16.0%) |
| Finance & Insurance | 63 (27.3%) | 168 (72.7%) |
| Real Estate, Rental & Leasing | 15 (100.0%) | 0 (0.0%) |
| Professional & Scientific | 297 (62.3%) | 180 (37.7%) |
| Enterprise Management | 0 (0.0%) | 0 (0.0%) |
| Administrative & Support | 221 (91.3%) | 21 (8.7%) |
| Educational Services | 244 (33.8%) | 477 (66.2%) |
| Health Care & Social Assistance | 170 (21.9%) | 607 (78.1%) |
| Arts, Entertainment & Recreation | 50 (40.3%) | 74 (59.7%) |
| Accommodation & Food Services | 99 (73.3%) | 36 (26.7%) |
| Public Administration | 190 (42.0%) | 262 (58.0%) |
| Total | 2,621 (50.8%) | 2,537 (49.2%) |
Education in East Glenville
School Enrollment in East Glenville
The most common levels of schooling among the 2,422 students in East Glenville are middle school (772 | 31.9%), high school (510 | 21.1%), and elementary school (432 | 17.8%).
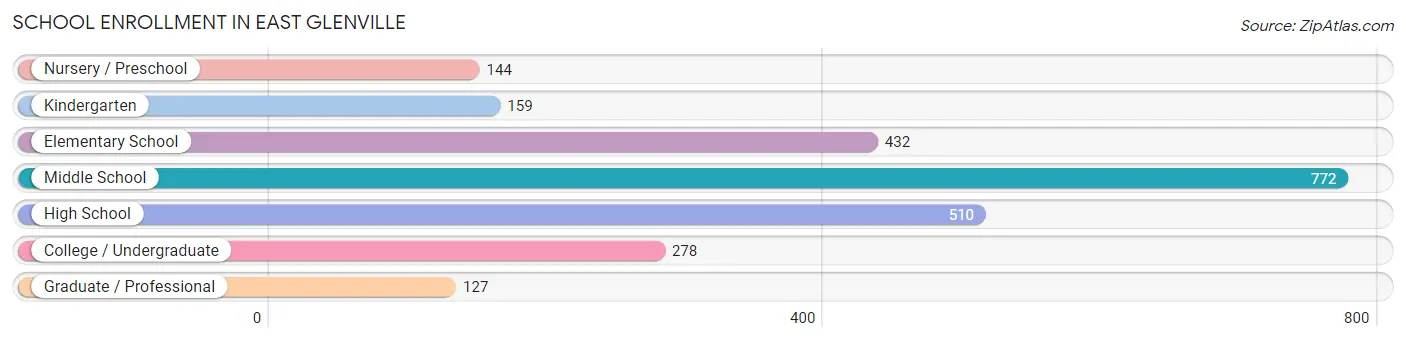
| School Level | # Students | % Students |
| Nursery / Preschool | 144 | 5.9% |
| Kindergarten | 159 | 6.6% |
| Elementary School | 432 | 17.8% |
| Middle School | 772 | 31.9% |
| High School | 510 | 21.1% |
| College / Undergraduate | 278 | 11.5% |
| Graduate / Professional | 127 | 5.2% |
| Total | 2,422 | 100.0% |
School Enrollment by Age by Funding Source in East Glenville
Out of a total of 2,422 students who are enrolled in schools in East Glenville, 291 (12.0%) attend a private institution, while the remaining 2,131 (88.0%) are enrolled in public schools. The age group of 3 to 4 year olds has the highest likelihood of being enrolled in private schools, with 71 (58.7% in the age bracket) enrolled. Conversely, the age group of 10 to 14 year olds has the lowest likelihood of being enrolled in a private school, with 788 (100.0% in the age bracket) attending a public institution.
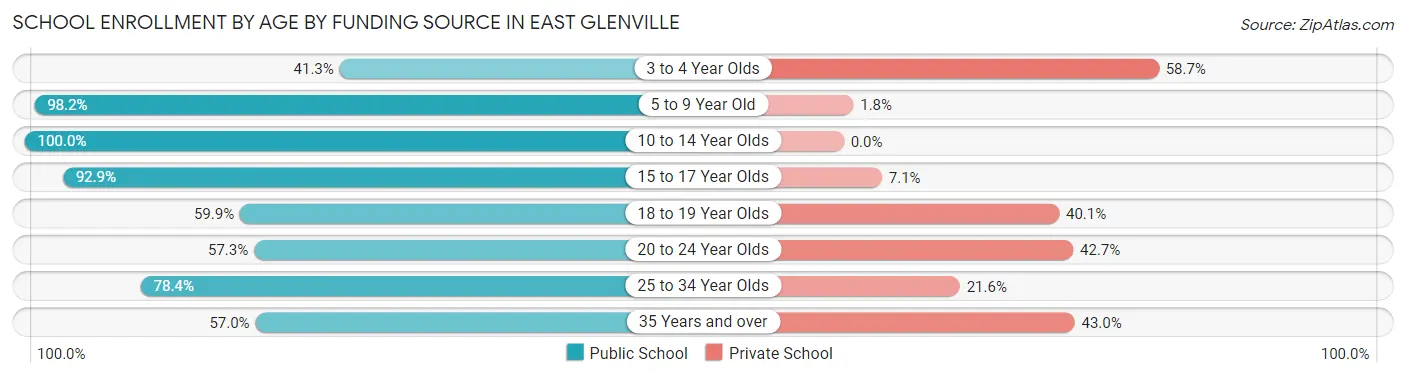
| Age Bracket | Public School | Private School |
| 3 to 4 Year Olds | 50 (41.3%) | 71 (58.7%) |
| 5 to 9 Year Old | 603 (98.2%) | 11 (1.8%) |
| 10 to 14 Year Olds | 788 (100.0%) | 0 (0.0%) |
| 15 to 17 Year Olds | 405 (92.9%) | 31 (7.1%) |
| 18 to 19 Year Olds | 103 (59.9%) | 69 (40.1%) |
| 20 to 24 Year Olds | 67 (57.3%) | 50 (42.7%) |
| 25 to 34 Year Olds | 58 (78.4%) | 16 (21.6%) |
| 35 Years and over | 57 (57.0%) | 43 (43.0%) |
| Total | 2,131 (88.0%) | 291 (12.0%) |
Educational Attainment by Field of Study in East Glenville
Education (619 | 16.2%), science & technology (519 | 13.6%), business (504 | 13.2%), engineering (472 | 12.4%), and social sciences (326 | 8.6%) are the most common fields of study among 3,815 individuals in East Glenville who have obtained a bachelor's degree or higher.
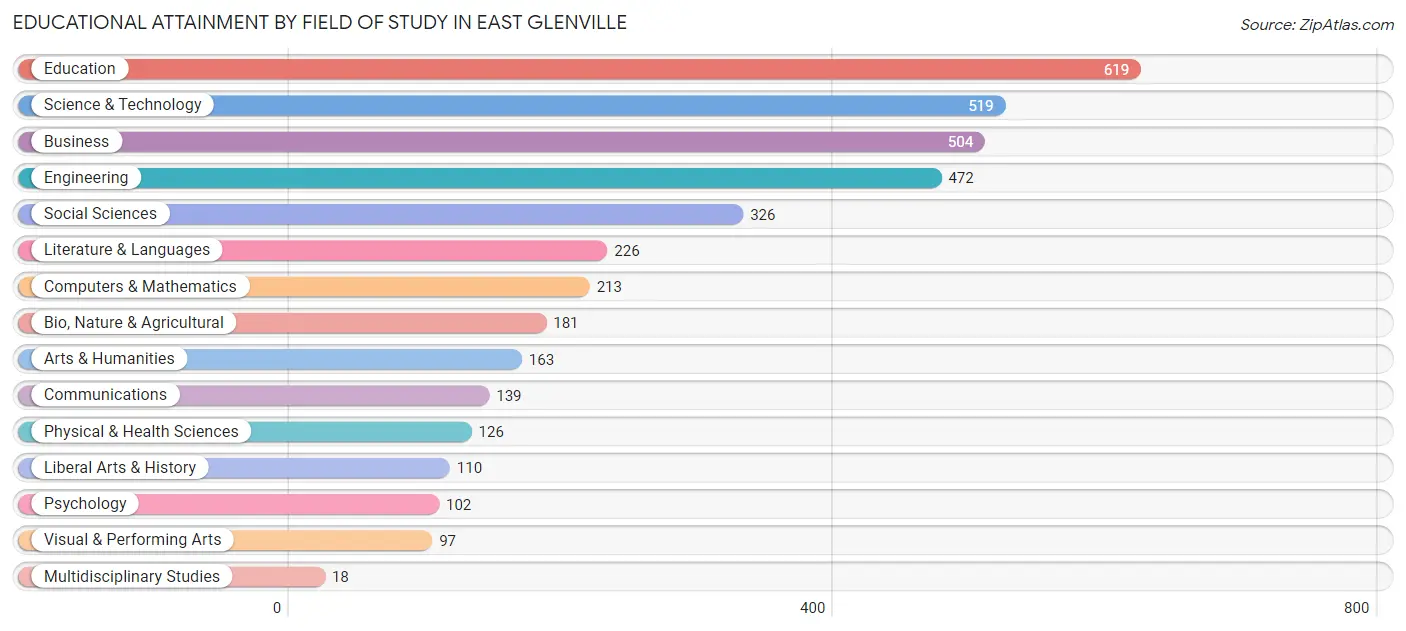
| Field of Study | # Graduates | % Graduates |
| Computers & Mathematics | 213 | 5.6% |
| Bio, Nature & Agricultural | 181 | 4.7% |
| Physical & Health Sciences | 126 | 3.3% |
| Psychology | 102 | 2.7% |
| Social Sciences | 326 | 8.6% |
| Engineering | 472 | 12.4% |
| Multidisciplinary Studies | 18 | 0.5% |
| Science & Technology | 519 | 13.6% |
| Business | 504 | 13.2% |
| Education | 619 | 16.2% |
| Literature & Languages | 226 | 5.9% |
| Liberal Arts & History | 110 | 2.9% |
| Visual & Performing Arts | 97 | 2.5% |
| Communications | 139 | 3.6% |
| Arts & Humanities | 163 | 4.3% |
| Total | 3,815 | 100.0% |
Transportation & Commute in East Glenville
Vehicle Availability by Sex in East Glenville
The most prevalent vehicle ownership categories in East Glenville are males with 2 vehicles (1,544, accounting for 59.3%) and females with 2 vehicles (1,187, making up 64.4%).
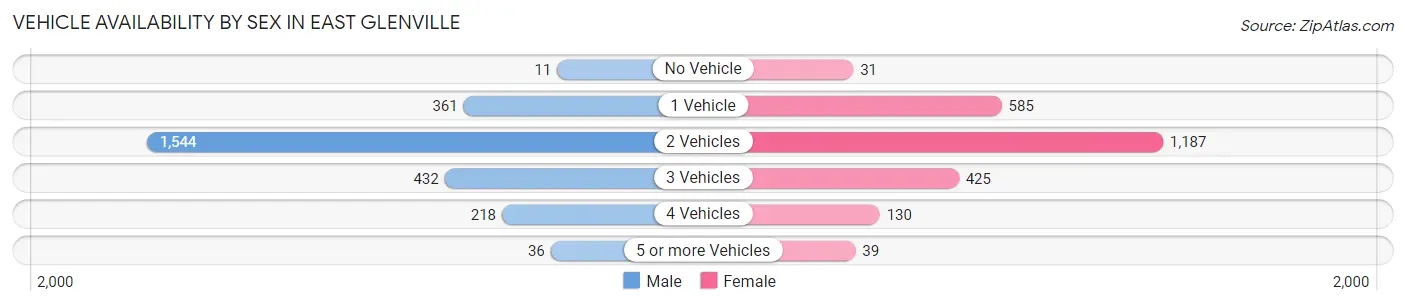
| Vehicles Available | Male | Female |
| No Vehicle | 11 (0.4%) | 31 (1.3%) |
| 1 Vehicle | 361 (13.9%) | 585 (24.4%) |
| 2 Vehicles | 1,544 (59.3%) | 1,187 (49.5%) |
| 3 Vehicles | 432 (16.6%) | 425 (17.7%) |
| 4 Vehicles | 218 (8.4%) | 130 (5.4%) |
| 5 or more Vehicles | 36 (1.4%) | 39 (1.6%) |
| Total | 2,602 (100.0%) | 2,397 (100.0%) |
Commute Time in East Glenville
The most frequently occuring commute durations in East Glenville are 15 to 19 minutes (805 commuters, 17.3%), 20 to 24 minutes (787 commuters, 16.9%), and 30 to 34 minutes (707 commuters, 15.2%).
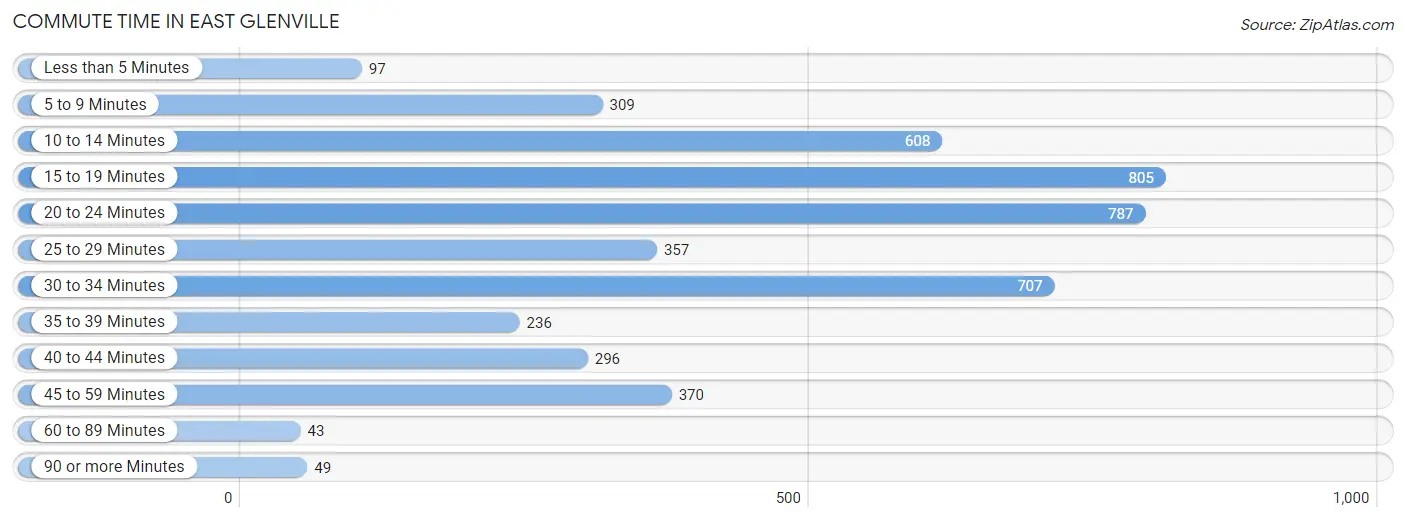
| Commute Time | # Commuters | % Commuters |
| Less than 5 Minutes | 97 | 2.1% |
| 5 to 9 Minutes | 309 | 6.6% |
| 10 to 14 Minutes | 608 | 13.0% |
| 15 to 19 Minutes | 805 | 17.3% |
| 20 to 24 Minutes | 787 | 16.9% |
| 25 to 29 Minutes | 357 | 7.6% |
| 30 to 34 Minutes | 707 | 15.2% |
| 35 to 39 Minutes | 236 | 5.1% |
| 40 to 44 Minutes | 296 | 6.4% |
| 45 to 59 Minutes | 370 | 7.9% |
| 60 to 89 Minutes | 43 | 0.9% |
| 90 or more Minutes | 49 | 1.1% |
Commute Time by Sex in East Glenville
The most common commute times in East Glenville are 20 to 24 minutes (395 commuters, 16.5%) for males and 15 to 19 minutes (417 commuters, 18.4%) for females.
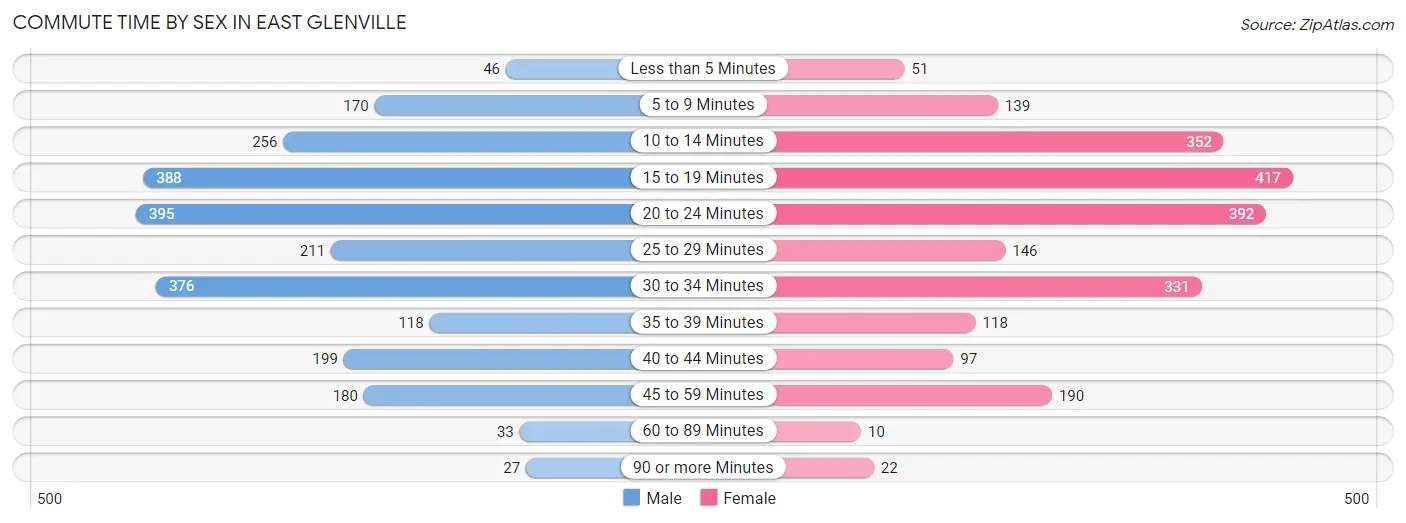
| Commute Time | Male | Female |
| Less than 5 Minutes | 46 (1.9%) | 51 (2.2%) |
| 5 to 9 Minutes | 170 (7.1%) | 139 (6.1%) |
| 10 to 14 Minutes | 256 (10.7%) | 352 (15.5%) |
| 15 to 19 Minutes | 388 (16.2%) | 417 (18.4%) |
| 20 to 24 Minutes | 395 (16.5%) | 392 (17.3%) |
| 25 to 29 Minutes | 211 (8.8%) | 146 (6.5%) |
| 30 to 34 Minutes | 376 (15.7%) | 331 (14.6%) |
| 35 to 39 Minutes | 118 (4.9%) | 118 (5.2%) |
| 40 to 44 Minutes | 199 (8.3%) | 97 (4.3%) |
| 45 to 59 Minutes | 180 (7.5%) | 190 (8.4%) |
| 60 to 89 Minutes | 33 (1.4%) | 10 (0.4%) |
| 90 or more Minutes | 27 (1.1%) | 22 (1.0%) |
Time of Departure to Work by Sex in East Glenville
The most frequent times of departure to work in East Glenville are 7:30 AM to 7:59 AM (403, 16.8%) for males and 7:00 AM to 7:29 AM (388, 17.1%) for females.
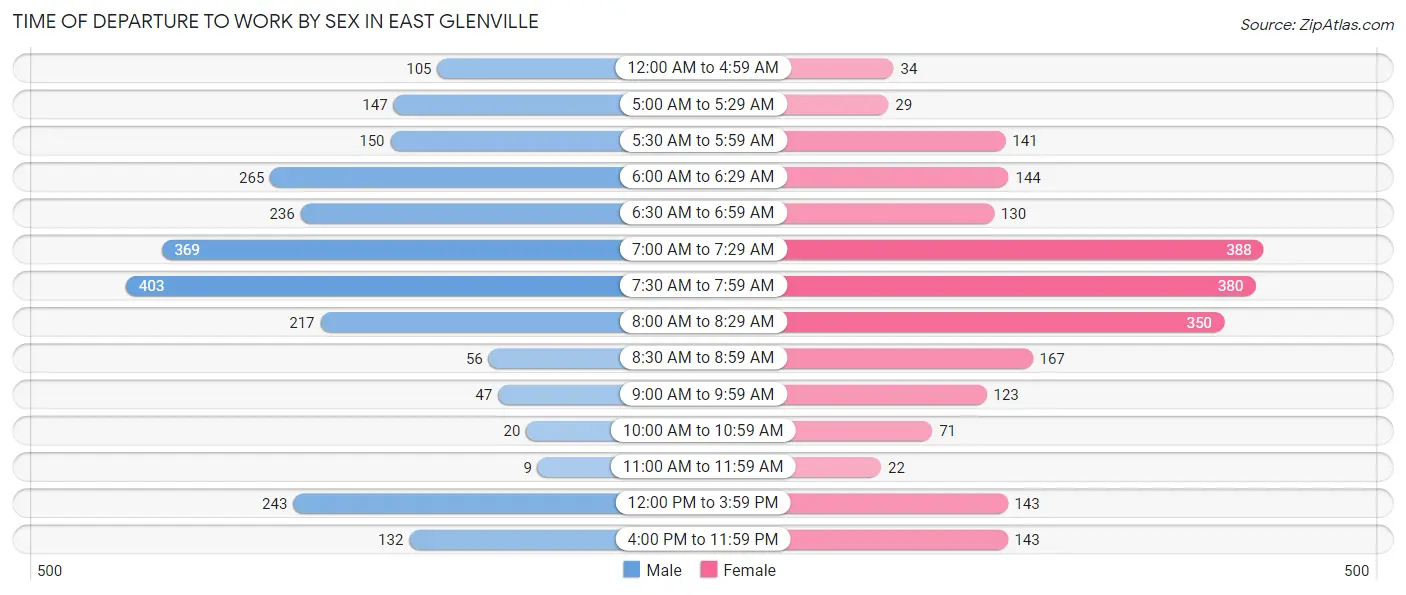
| Time of Departure | Male | Female |
| 12:00 AM to 4:59 AM | 105 (4.4%) | 34 (1.5%) |
| 5:00 AM to 5:29 AM | 147 (6.1%) | 29 (1.3%) |
| 5:30 AM to 5:59 AM | 150 (6.2%) | 141 (6.2%) |
| 6:00 AM to 6:29 AM | 265 (11.1%) | 144 (6.4%) |
| 6:30 AM to 6:59 AM | 236 (9.8%) | 130 (5.7%) |
| 7:00 AM to 7:29 AM | 369 (15.4%) | 388 (17.1%) |
| 7:30 AM to 7:59 AM | 403 (16.8%) | 380 (16.8%) |
| 8:00 AM to 8:29 AM | 217 (9.0%) | 350 (15.4%) |
| 8:30 AM to 8:59 AM | 56 (2.3%) | 167 (7.4%) |
| 9:00 AM to 9:59 AM | 47 (2.0%) | 123 (5.4%) |
| 10:00 AM to 10:59 AM | 20 (0.8%) | 71 (3.1%) |
| 11:00 AM to 11:59 AM | 9 (0.4%) | 22 (1.0%) |
| 12:00 PM to 3:59 PM | 243 (10.1%) | 143 (6.3%) |
| 4:00 PM to 11:59 PM | 132 (5.5%) | 143 (6.3%) |
| Total | 2,399 (100.0%) | 2,265 (100.0%) |
Housing Occupancy in East Glenville
Occupancy by Ownership in East Glenville
Of the total 4,704 dwellings in East Glenville, owner-occupied units account for 2,993 (63.6%), while renter-occupied units make up 1,711 (36.4%).
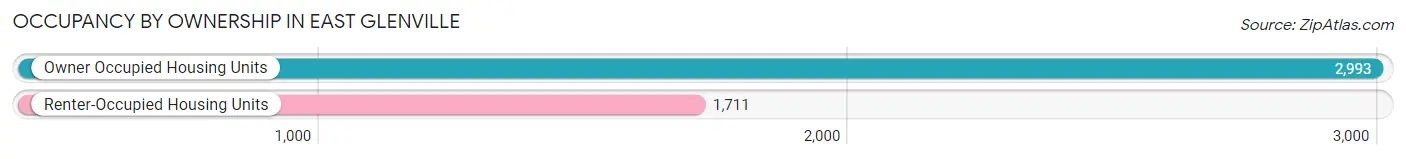
| Occupancy | # Housing Units | % Housing Units |
| Owner Occupied Housing Units | 2,993 | 63.6% |
| Renter-Occupied Housing Units | 1,711 | 36.4% |
| Total Occupied Housing Units | 4,704 | 100.0% |
Occupancy by Household Size in East Glenville
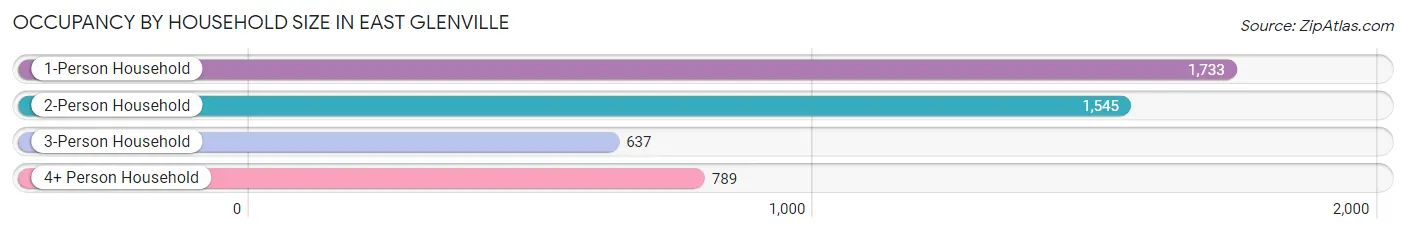
| Household Size | # Housing Units | % Housing Units |
| 1-Person Household | 1,733 | 36.8% |
| 2-Person Household | 1,545 | 32.8% |
| 3-Person Household | 637 | 13.5% |
| 4+ Person Household | 789 | 16.8% |
| Total Housing Units | 4,704 | 100.0% |
Occupancy by Ownership by Household Size in East Glenville
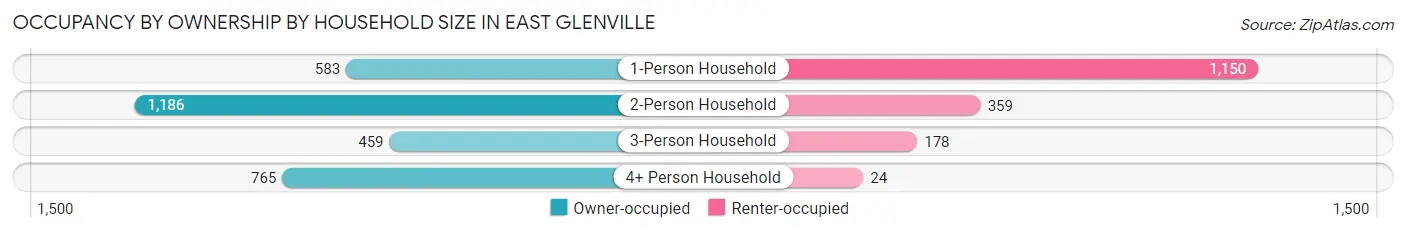
| Household Size | Owner-occupied | Renter-occupied |
| 1-Person Household | 583 (33.6%) | 1,150 (66.4%) |
| 2-Person Household | 1,186 (76.8%) | 359 (23.2%) |
| 3-Person Household | 459 (72.1%) | 178 (27.9%) |
| 4+ Person Household | 765 (97.0%) | 24 (3.0%) |
| Total Housing Units | 2,993 (63.6%) | 1,711 (36.4%) |
Occupancy by Educational Attainment in East Glenville
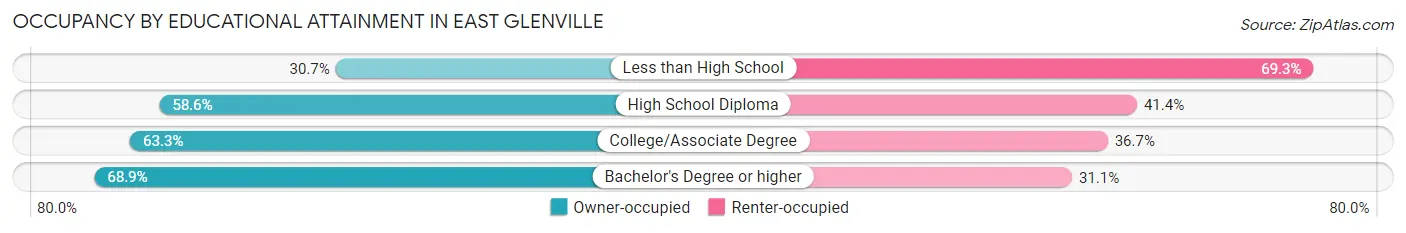
| Household Size | Owner-occupied | Renter-occupied |
| Less than High School | 69 (30.7%) | 156 (69.3%) |
| High School Diploma | 462 (58.6%) | 326 (41.4%) |
| College/Associate Degree | 920 (63.3%) | 534 (36.7%) |
| Bachelor's Degree or higher | 1,542 (68.9%) | 695 (31.1%) |
Occupancy by Age of Householder in East Glenville
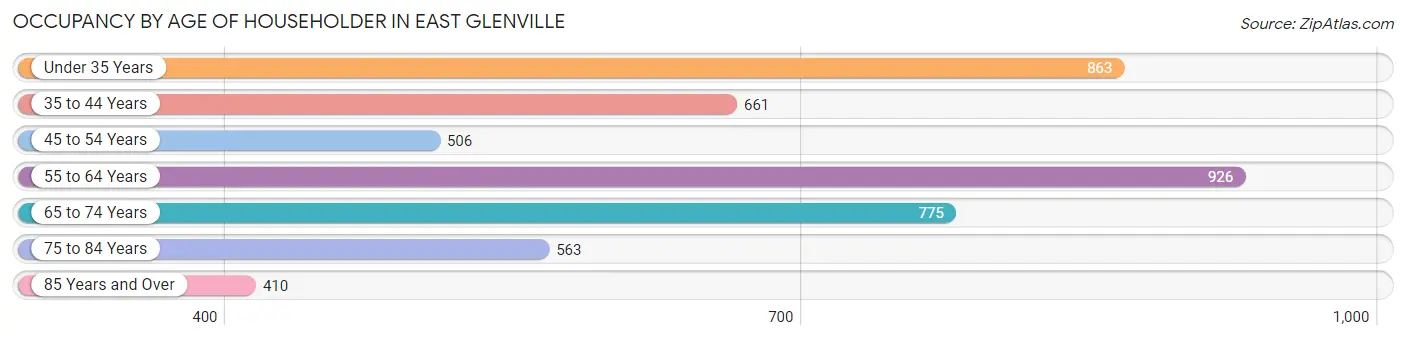
| Age Bracket | # Households | % Households |
| Under 35 Years | 863 | 18.3% |
| 35 to 44 Years | 661 | 14.1% |
| 45 to 54 Years | 506 | 10.8% |
| 55 to 64 Years | 926 | 19.7% |
| 65 to 74 Years | 775 | 16.5% |
| 75 to 84 Years | 563 | 12.0% |
| 85 Years and Over | 410 | 8.7% |
| Total | 4,704 | 100.0% |
Housing Finances in East Glenville
Median Income by Occupancy in East Glenville
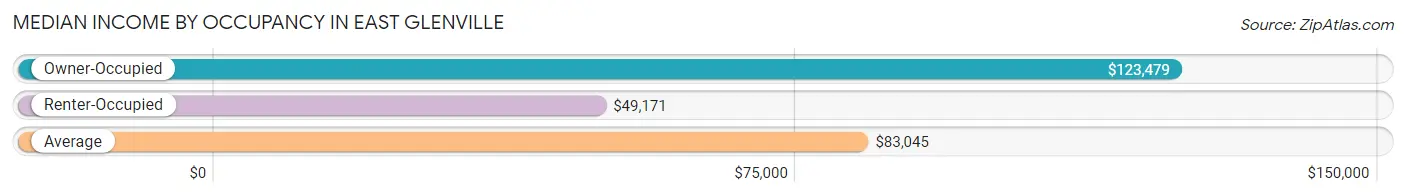
| Occupancy Type | # Households | Median Income |
| Owner-Occupied | 2,993 (63.6%) | $123,479 |
| Renter-Occupied | 1,711 (36.4%) | $49,171 |
| Average | 4,704 (100.0%) | $83,045 |
Occupancy by Householder Income Bracket in East Glenville
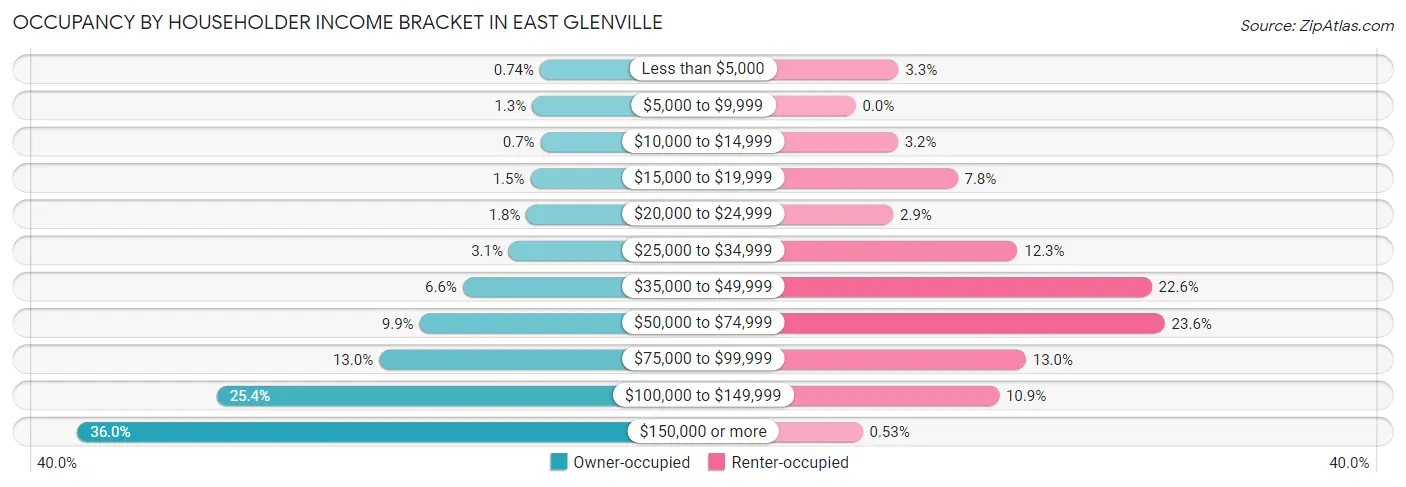
| Income Bracket | Owner-occupied | Renter-occupied |
| Less than $5,000 | 22 (0.7%) | 56 (3.3%) |
| $5,000 to $9,999 | 40 (1.3%) | 0 (0.0%) |
| $10,000 to $14,999 | 21 (0.7%) | 55 (3.2%) |
| $15,000 to $19,999 | 44 (1.5%) | 133 (7.8%) |
| $20,000 to $24,999 | 53 (1.8%) | 49 (2.9%) |
| $25,000 to $34,999 | 93 (3.1%) | 211 (12.3%) |
| $35,000 to $49,999 | 198 (6.6%) | 386 (22.6%) |
| $50,000 to $74,999 | 297 (9.9%) | 403 (23.5%) |
| $75,000 to $99,999 | 389 (13.0%) | 222 (13.0%) |
| $100,000 to $149,999 | 759 (25.4%) | 187 (10.9%) |
| $150,000 or more | 1,077 (36.0%) | 9 (0.5%) |
| Total | 2,993 (100.0%) | 1,711 (100.0%) |
Monthly Housing Cost Tiers in East Glenville
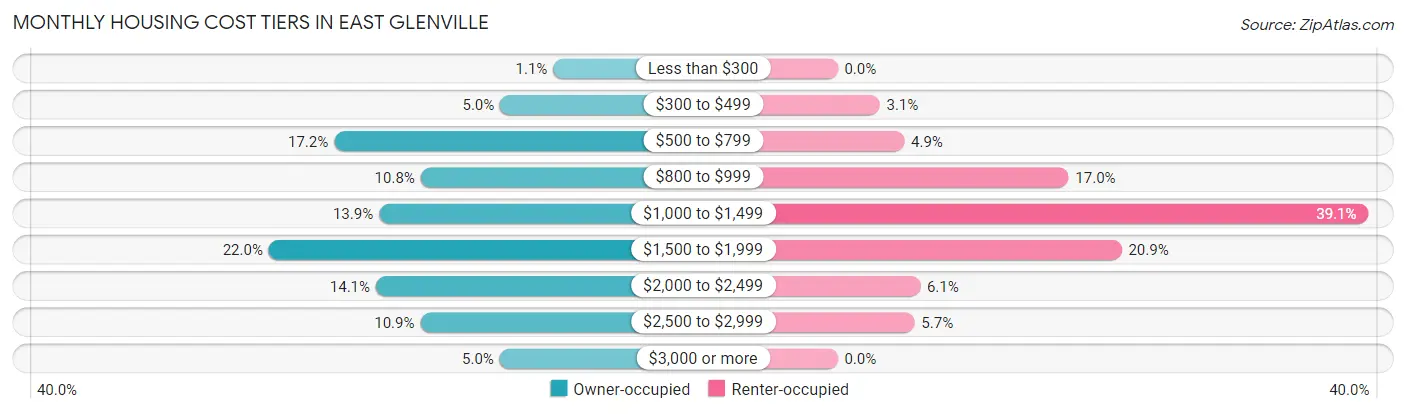
| Monthly Cost | Owner-occupied | Renter-occupied |
| Less than $300 | 32 (1.1%) | 0 (0.0%) |
| $300 to $499 | 149 (5.0%) | 53 (3.1%) |
| $500 to $799 | 515 (17.2%) | 84 (4.9%) |
| $800 to $999 | 324 (10.8%) | 291 (17.0%) |
| $1,000 to $1,499 | 416 (13.9%) | 669 (39.1%) |
| $1,500 to $1,999 | 659 (22.0%) | 358 (20.9%) |
| $2,000 to $2,499 | 423 (14.1%) | 104 (6.1%) |
| $2,500 to $2,999 | 325 (10.9%) | 97 (5.7%) |
| $3,000 or more | 150 (5.0%) | 0 (0.0%) |
| Total | 2,993 (100.0%) | 1,711 (100.0%) |
Physical Housing Characteristics in East Glenville
Housing Structures in East Glenville
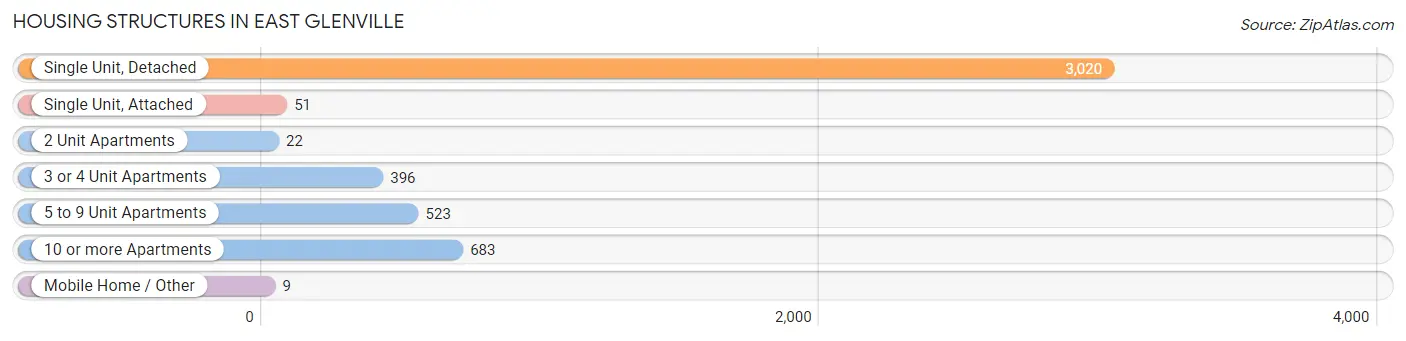
| Structure Type | # Housing Units | % Housing Units |
| Single Unit, Detached | 3,020 | 64.2% |
| Single Unit, Attached | 51 | 1.1% |
| 2 Unit Apartments | 22 | 0.5% |
| 3 or 4 Unit Apartments | 396 | 8.4% |
| 5 to 9 Unit Apartments | 523 | 11.1% |
| 10 or more Apartments | 683 | 14.5% |
| Mobile Home / Other | 9 | 0.2% |
| Total | 4,704 | 100.0% |
Housing Structures by Occupancy in East Glenville
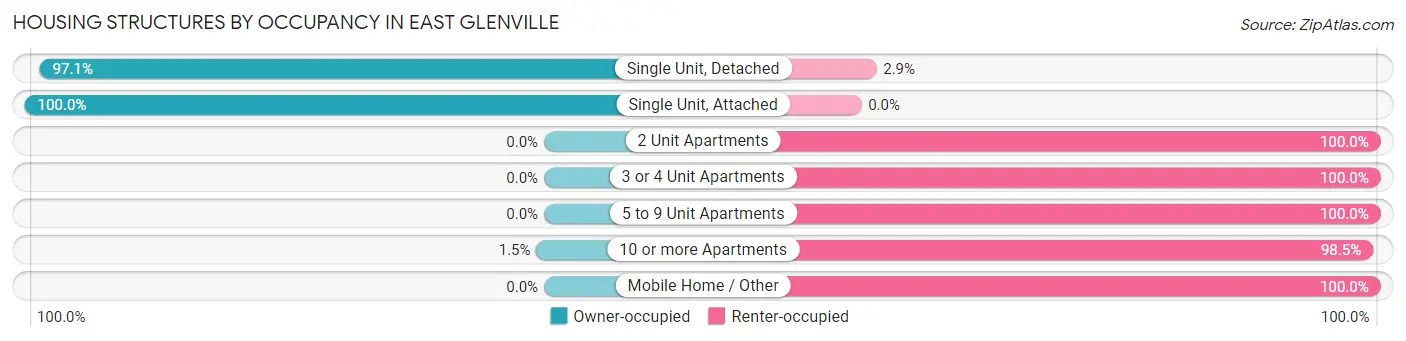
| Structure Type | Owner-occupied | Renter-occupied |
| Single Unit, Detached | 2,932 (97.1%) | 88 (2.9%) |
| Single Unit, Attached | 51 (100.0%) | 0 (0.0%) |
| 2 Unit Apartments | 0 (0.0%) | 22 (100.0%) |
| 3 or 4 Unit Apartments | 0 (0.0%) | 396 (100.0%) |
| 5 to 9 Unit Apartments | 0 (0.0%) | 523 (100.0%) |
| 10 or more Apartments | 10 (1.5%) | 673 (98.5%) |
| Mobile Home / Other | 0 (0.0%) | 9 (100.0%) |
| Total | 2,993 (63.6%) | 1,711 (36.4%) |
Housing Structures by Number of Rooms in East Glenville
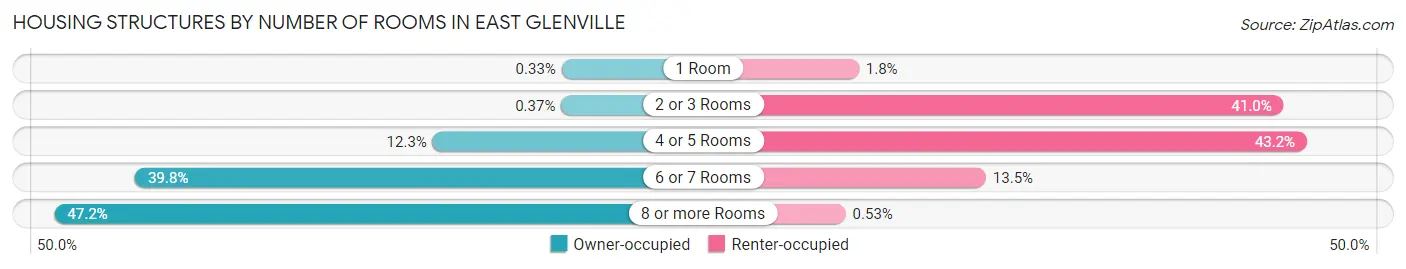
| Number of Rooms | Owner-occupied | Renter-occupied |
| 1 Room | 10 (0.3%) | 30 (1.8%) |
| 2 or 3 Rooms | 11 (0.4%) | 702 (41.0%) |
| 4 or 5 Rooms | 367 (12.3%) | 739 (43.2%) |
| 6 or 7 Rooms | 1,191 (39.8%) | 231 (13.5%) |
| 8 or more Rooms | 1,414 (47.2%) | 9 (0.5%) |
| Total | 2,993 (100.0%) | 1,711 (100.0%) |
Housing Structure by Heating Type in East Glenville
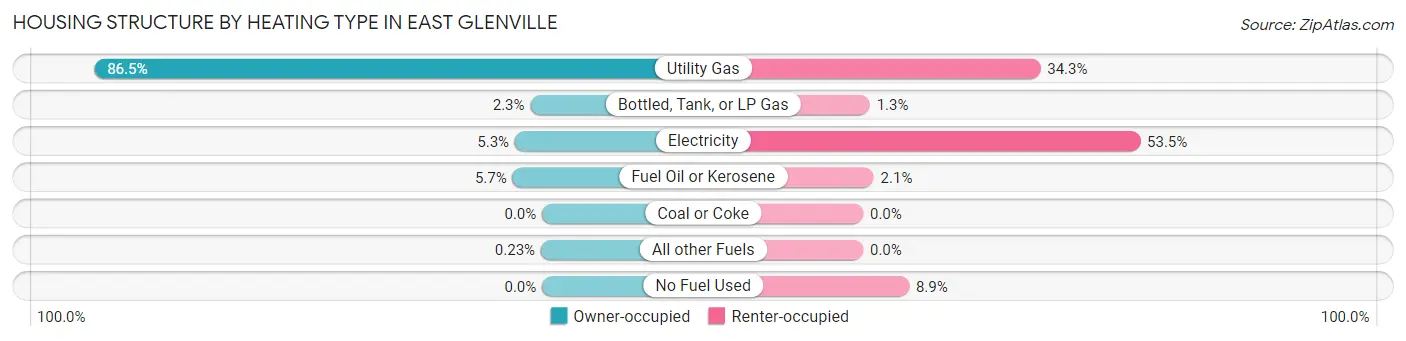
| Heating Type | Owner-occupied | Renter-occupied |
| Utility Gas | 2,590 (86.5%) | 586 (34.3%) |
| Bottled, Tank, or LP Gas | 68 (2.3%) | 22 (1.3%) |
| Electricity | 157 (5.2%) | 916 (53.5%) |
| Fuel Oil or Kerosene | 171 (5.7%) | 35 (2.1%) |
| Coal or Coke | 0 (0.0%) | 0 (0.0%) |
| All other Fuels | 7 (0.2%) | 0 (0.0%) |
| No Fuel Used | 0 (0.0%) | 152 (8.9%) |
| Total | 2,993 (100.0%) | 1,711 (100.0%) |
Household Vehicle Usage in East Glenville
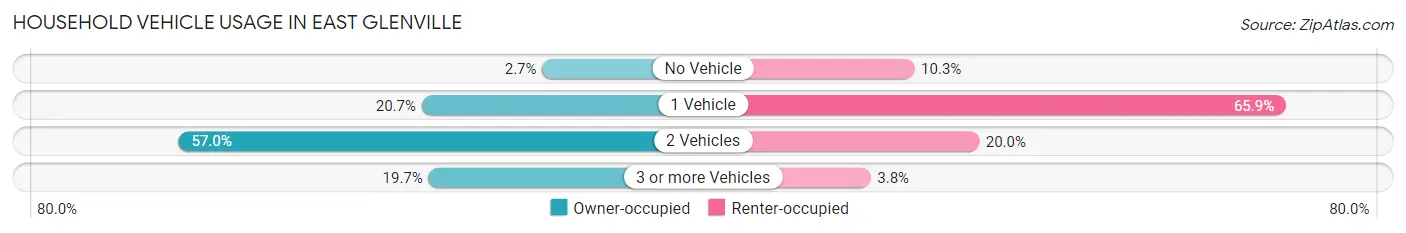
| Vehicles per Household | Owner-occupied | Renter-occupied |
| No Vehicle | 80 (2.7%) | 177 (10.3%) |
| 1 Vehicle | 619 (20.7%) | 1,127 (65.9%) |
| 2 Vehicles | 1,706 (57.0%) | 342 (20.0%) |
| 3 or more Vehicles | 588 (19.7%) | 65 (3.8%) |
| Total | 2,993 (100.0%) | 1,711 (100.0%) |
Real Estate & Mortgages in East Glenville
Real Estate and Mortgage Overview in East Glenville
| Characteristic | Without Mortgage | With Mortgage |
| Housing Units | 1,130 | 1,863 |
| Median Property Value | $247,300 | $266,900 |
| Median Household Income | $84,113 | $772 |
| Monthly Housing Costs | $734 | $150 |
| Real Estate Taxes | $4,849 | $42 |
Property Value by Mortgage Status in East Glenville
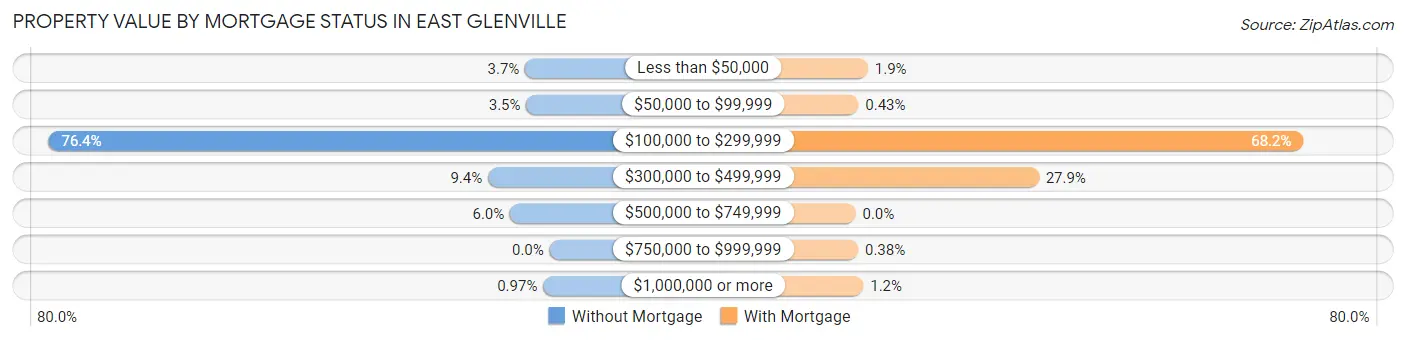
| Property Value | Without Mortgage | With Mortgage |
| Less than $50,000 | 42 (3.7%) | 35 (1.9%) |
| $50,000 to $99,999 | 40 (3.5%) | 8 (0.4%) |
| $100,000 to $299,999 | 863 (76.4%) | 1,271 (68.2%) |
| $300,000 to $499,999 | 106 (9.4%) | 520 (27.9%) |
| $500,000 to $749,999 | 68 (6.0%) | 0 (0.0%) |
| $750,000 to $999,999 | 0 (0.0%) | 7 (0.4%) |
| $1,000,000 or more | 11 (1.0%) | 22 (1.2%) |
| Total | 1,130 (100.0%) | 1,863 (100.0%) |
Household Income by Mortgage Status in East Glenville
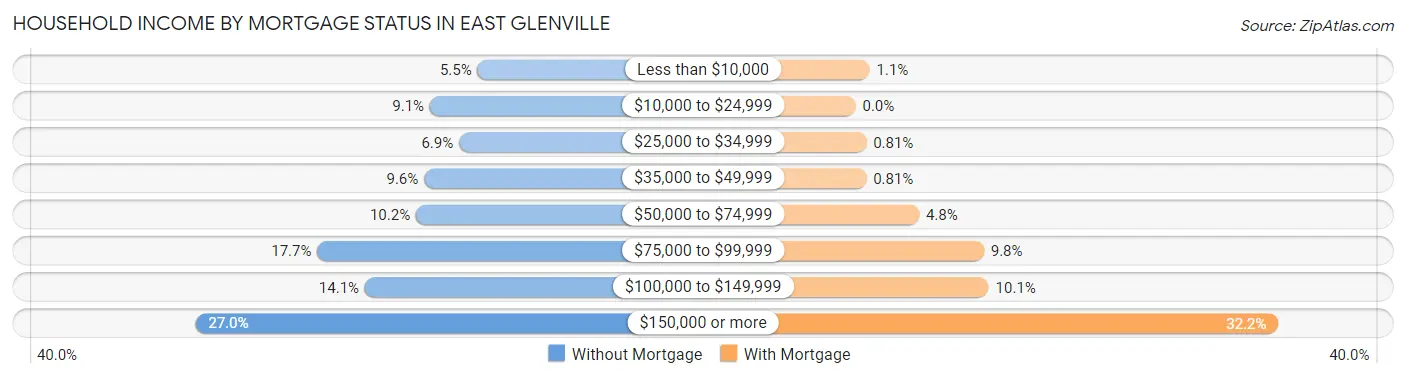
| Household Income | Without Mortgage | With Mortgage |
| Less than $10,000 | 62 (5.5%) | 20 (1.1%) |
| $10,000 to $24,999 | 103 (9.1%) | 0 (0.0%) |
| $25,000 to $34,999 | 78 (6.9%) | 15 (0.8%) |
| $35,000 to $49,999 | 108 (9.6%) | 15 (0.8%) |
| $50,000 to $74,999 | 115 (10.2%) | 90 (4.8%) |
| $75,000 to $99,999 | 200 (17.7%) | 182 (9.8%) |
| $100,000 to $149,999 | 159 (14.1%) | 189 (10.1%) |
| $150,000 or more | 305 (27.0%) | 600 (32.2%) |
| Total | 1,130 (100.0%) | 1,863 (100.0%) |
Property Value to Household Income Ratio in East Glenville
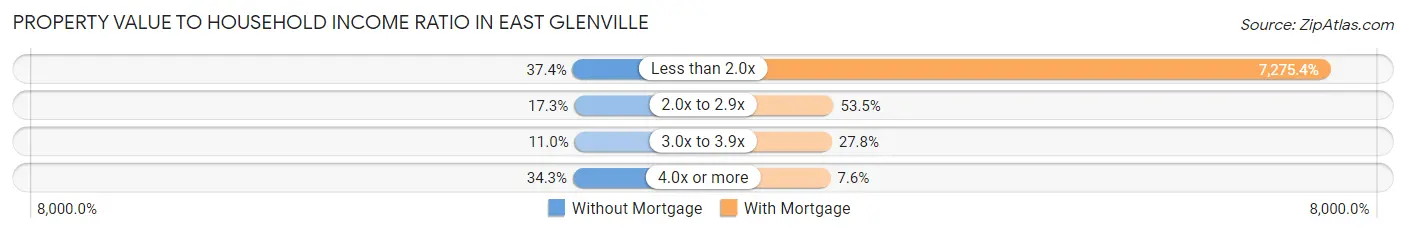
| Value-to-Income Ratio | Without Mortgage | With Mortgage |
| Less than 2.0x | 423 (37.4%) | 135,541 (7,275.4%) |
| 2.0x to 2.9x | 195 (17.3%) | 997 (53.5%) |
| 3.0x to 3.9x | 124 (11.0%) | 517 (27.8%) |
| 4.0x or more | 388 (34.3%) | 141 (7.6%) |
| Total | 1,130 (100.0%) | 1,863 (100.0%) |
Real Estate Taxes by Mortgage Status in East Glenville
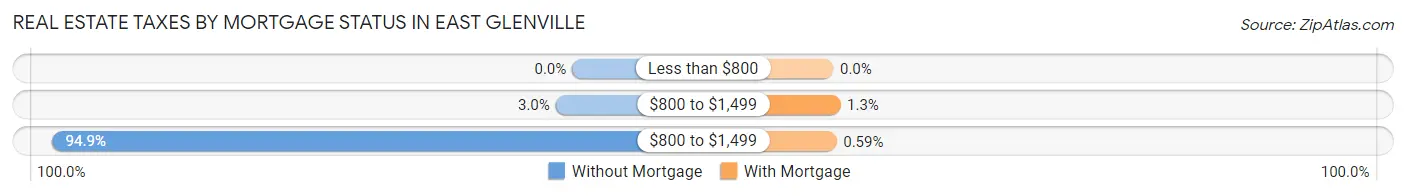
| Property Taxes | Without Mortgage | With Mortgage |
| Less than $800 | 0 (0.0%) | 0 (0.0%) |
| $800 to $1,499 | 34 (3.0%) | 24 (1.3%) |
| $800 to $1,499 | 1,072 (94.9%) | 11 (0.6%) |
| Total | 1,130 (100.0%) | 1,863 (100.0%) |
Health & Disability in East Glenville
Health Insurance Coverage by Age in East Glenville
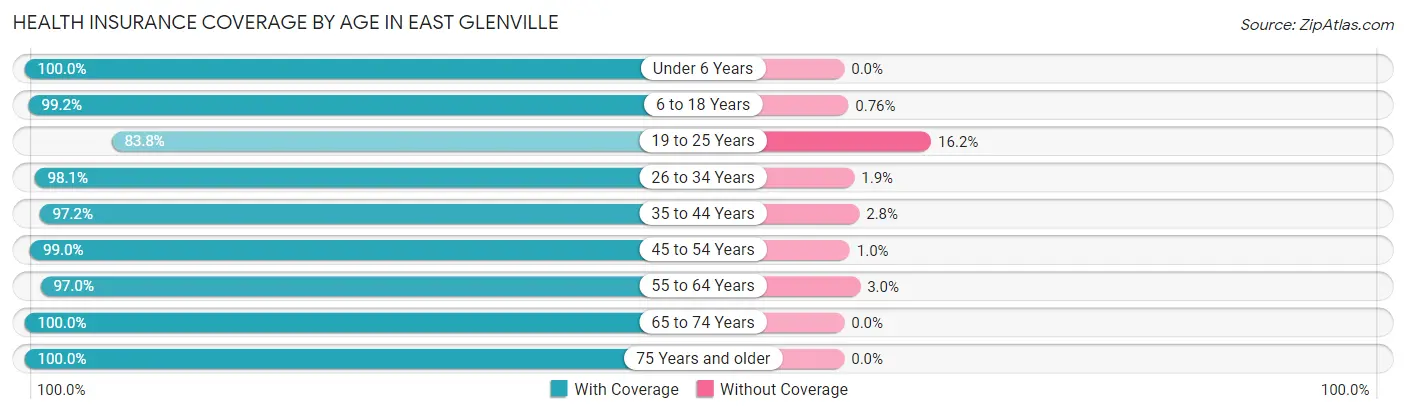
| Age Bracket | With Coverage | Without Coverage |
| Under 6 Years | 820 (100.0%) | 0 (0.0%) |
| 6 to 18 Years | 1,840 (99.2%) | 14 (0.8%) |
| 19 to 25 Years | 750 (83.8%) | 145 (16.2%) |
| 26 to 34 Years | 1,206 (98.1%) | 23 (1.9%) |
| 35 to 44 Years | 1,116 (97.2%) | 32 (2.8%) |
| 45 to 54 Years | 1,145 (99.0%) | 12 (1.0%) |
| 55 to 64 Years | 1,505 (97.0%) | 46 (3.0%) |
| 65 to 74 Years | 1,202 (100.0%) | 0 (0.0%) |
| 75 Years and older | 1,420 (100.0%) | 0 (0.0%) |
| Total | 11,004 (97.6%) | 272 (2.4%) |
Health Insurance Coverage by Citizenship Status in East Glenville
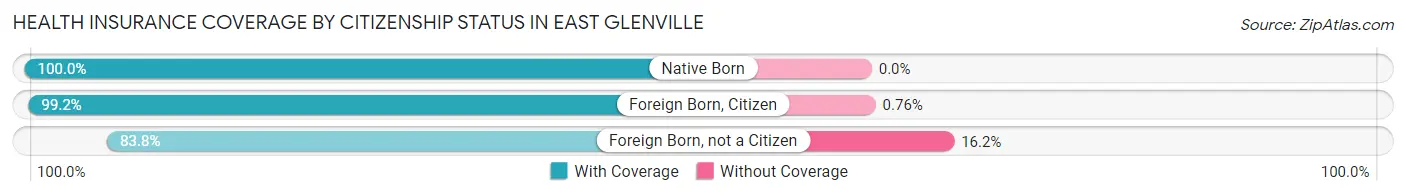
| Citizenship Status | With Coverage | Without Coverage |
| Native Born | 820 (100.0%) | 0 (0.0%) |
| Foreign Born, Citizen | 1,840 (99.2%) | 14 (0.8%) |
| Foreign Born, not a Citizen | 750 (83.8%) | 145 (16.2%) |
Health Insurance Coverage by Household Income in East Glenville
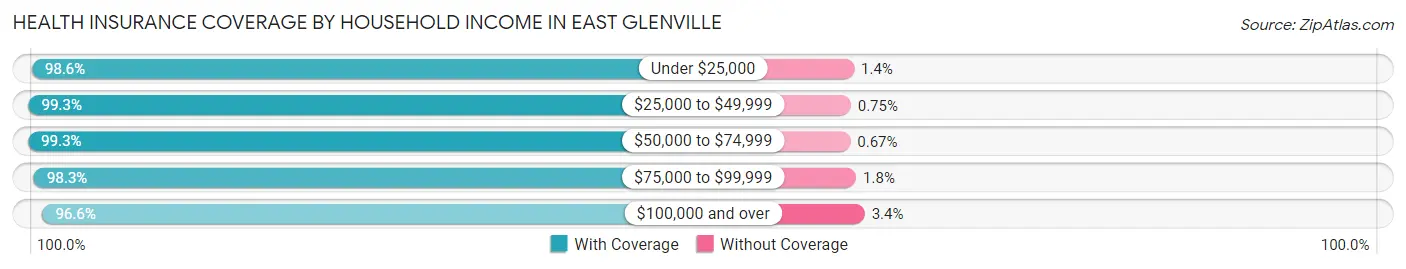
| Household Income | With Coverage | Without Coverage |
| Under $25,000 | 650 (98.6%) | 9 (1.4%) |
| $25,000 to $49,999 | 1,329 (99.3%) | 10 (0.7%) |
| $50,000 to $74,999 | 1,327 (99.3%) | 9 (0.7%) |
| $75,000 to $99,999 | 1,238 (98.3%) | 22 (1.8%) |
| $100,000 and over | 6,383 (96.6%) | 222 (3.4%) |
Public vs Private Health Insurance Coverage by Age in East Glenville
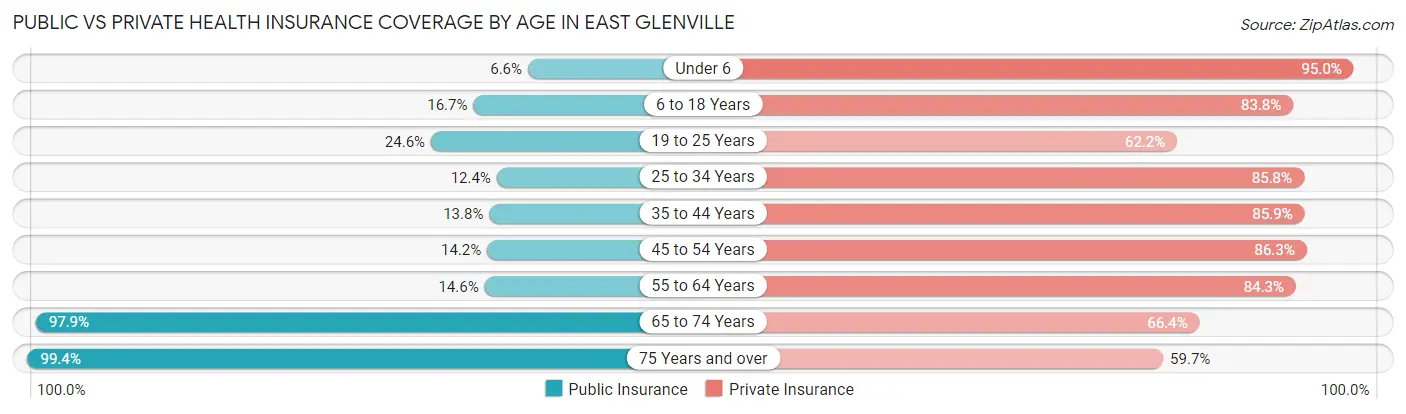
| Age Bracket | Public Insurance | Private Insurance |
| Under 6 | 54 (6.6%) | 779 (95.0%) |
| 6 to 18 Years | 310 (16.7%) | 1,553 (83.8%) |
| 19 to 25 Years | 220 (24.6%) | 557 (62.2%) |
| 25 to 34 Years | 152 (12.4%) | 1,054 (85.8%) |
| 35 to 44 Years | 158 (13.8%) | 986 (85.9%) |
| 45 to 54 Years | 164 (14.2%) | 998 (86.3%) |
| 55 to 64 Years | 227 (14.6%) | 1,307 (84.3%) |
| 65 to 74 Years | 1,177 (97.9%) | 798 (66.4%) |
| 75 Years and over | 1,412 (99.4%) | 847 (59.7%) |
| Total | 3,874 (34.4%) | 8,879 (78.7%) |
Disability Status by Sex by Age in East Glenville
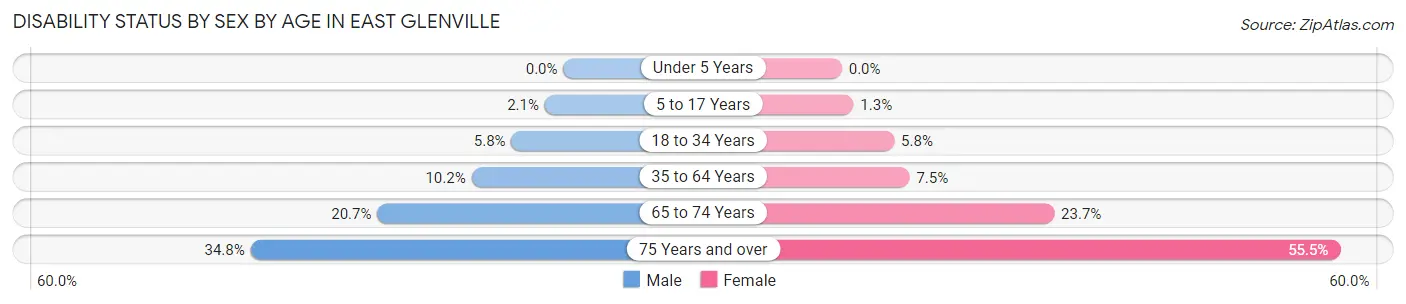
| Age Bracket | Male | Female |
| Under 5 Years | 0 (0.0%) | 0 (0.0%) |
| 5 to 17 Years | 23 (2.1%) | 10 (1.3%) |
| 18 to 34 Years | 67 (5.8%) | 62 (5.8%) |
| 35 to 64 Years | 199 (10.2%) | 144 (7.5%) |
| 65 to 74 Years | 115 (20.7%) | 153 (23.6%) |
| 75 Years and over | 162 (34.8%) | 530 (55.5%) |
Disability Class by Sex by Age in East Glenville
Disability Class: Hearing Difficulty
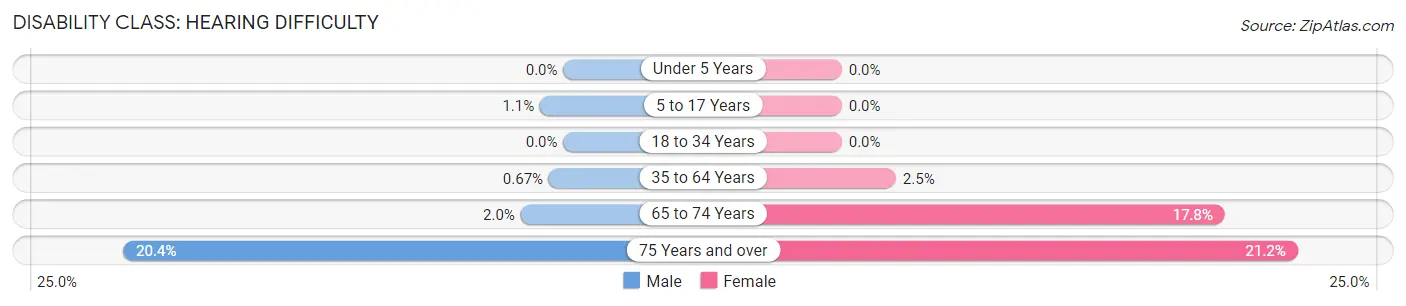
| Age Bracket | Male | Female |
| Under 5 Years | 0 (0.0%) | 0 (0.0%) |
| 5 to 17 Years | 12 (1.1%) | 0 (0.0%) |
| 18 to 34 Years | 0 (0.0%) | 0 (0.0%) |
| 35 to 64 Years | 13 (0.7%) | 48 (2.5%) |
| 65 to 74 Years | 11 (2.0%) | 115 (17.8%) |
| 75 Years and over | 95 (20.4%) | 202 (21.1%) |
Disability Class: Vision Difficulty
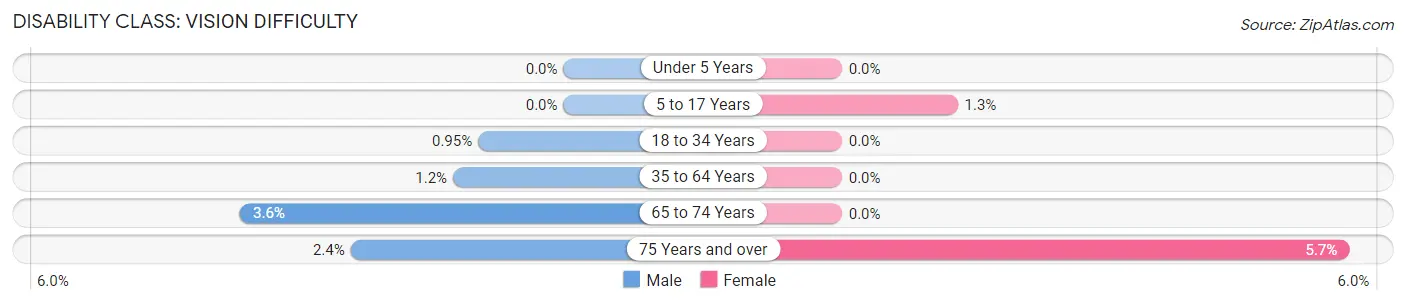
| Age Bracket | Male | Female |
| Under 5 Years | 0 (0.0%) | 0 (0.0%) |
| 5 to 17 Years | 0 (0.0%) | 10 (1.3%) |
| 18 to 34 Years | 11 (0.9%) | 0 (0.0%) |
| 35 to 64 Years | 24 (1.2%) | 0 (0.0%) |
| 65 to 74 Years | 20 (3.6%) | 0 (0.0%) |
| 75 Years and over | 11 (2.4%) | 54 (5.7%) |
Disability Class: Cognitive Difficulty
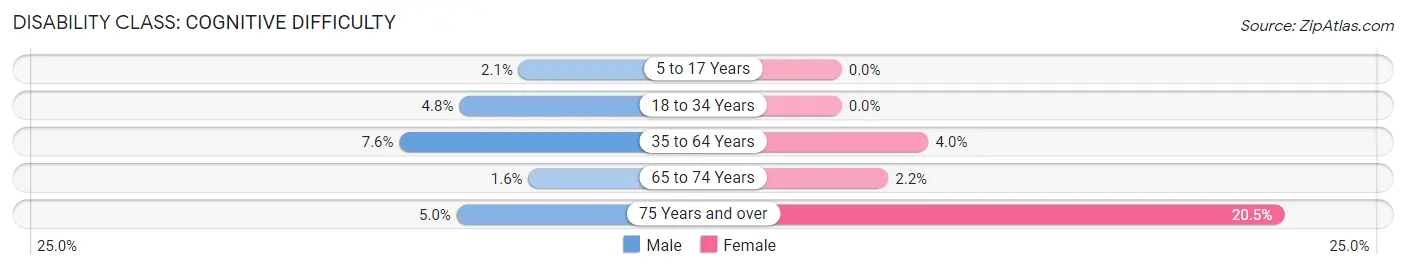
| Age Bracket | Male | Female |
| 5 to 17 Years | 23 (2.1%) | 0 (0.0%) |
| 18 to 34 Years | 56 (4.8%) | 0 (0.0%) |
| 35 to 64 Years | 148 (7.6%) | 77 (4.0%) |
| 65 to 74 Years | 9 (1.6%) | 14 (2.2%) |
| 75 Years and over | 23 (5.0%) | 196 (20.5%) |
Disability Class: Ambulatory Difficulty
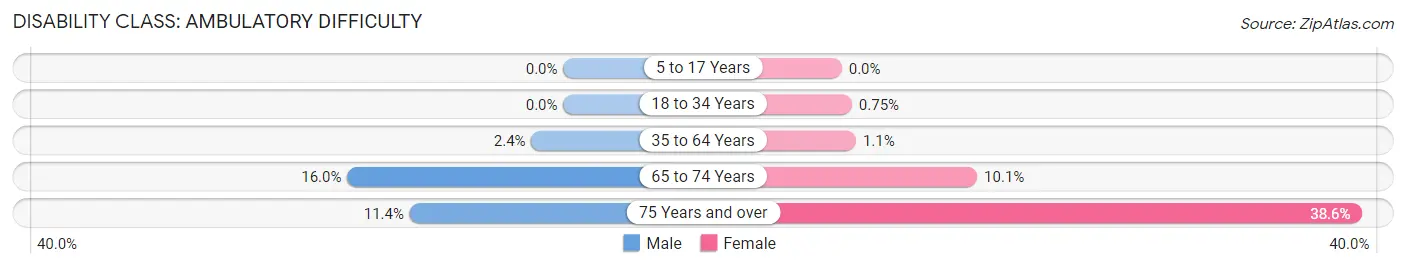
| Age Bracket | Male | Female |
| 5 to 17 Years | 0 (0.0%) | 0 (0.0%) |
| 18 to 34 Years | 0 (0.0%) | 8 (0.7%) |
| 35 to 64 Years | 46 (2.4%) | 20 (1.1%) |
| 65 to 74 Years | 89 (16.0%) | 65 (10.1%) |
| 75 Years and over | 53 (11.4%) | 369 (38.6%) |
Disability Class: Self-Care Difficulty
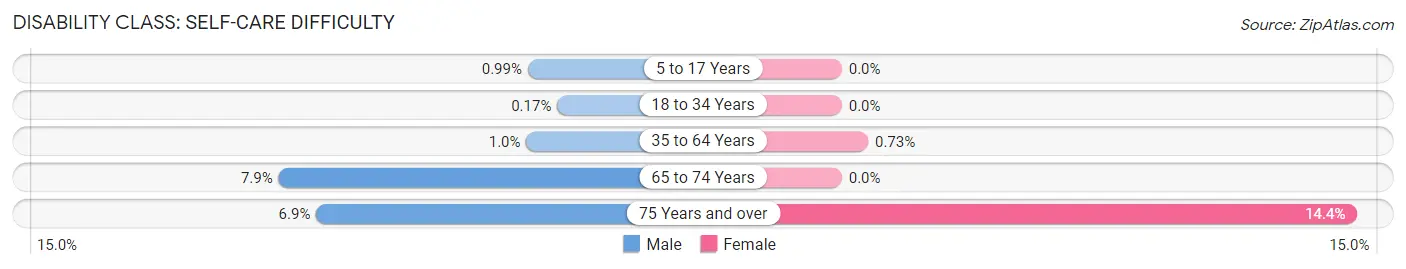
| Age Bracket | Male | Female |
| 5 to 17 Years | 11 (1.0%) | 0 (0.0%) |
| 18 to 34 Years | 2 (0.2%) | 0 (0.0%) |
| 35 to 64 Years | 20 (1.0%) | 14 (0.7%) |
| 65 to 74 Years | 44 (7.9%) | 0 (0.0%) |
| 75 Years and over | 32 (6.9%) | 137 (14.3%) |
Technology Access in East Glenville
Computing Device Access in East Glenville
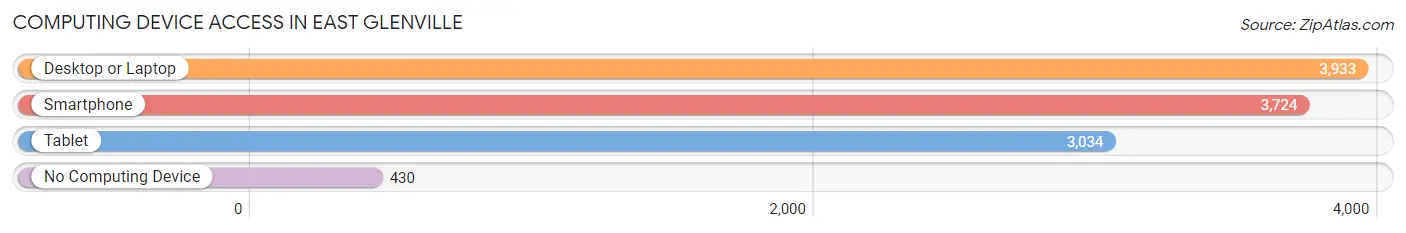
| Device Type | # Households | % Households |
| Desktop or Laptop | 3,933 | 83.6% |
| Smartphone | 3,724 | 79.2% |
| Tablet | 3,034 | 64.5% |
| No Computing Device | 430 | 9.1% |
| Total | 4,704 | 100.0% |
Internet Access in East Glenville
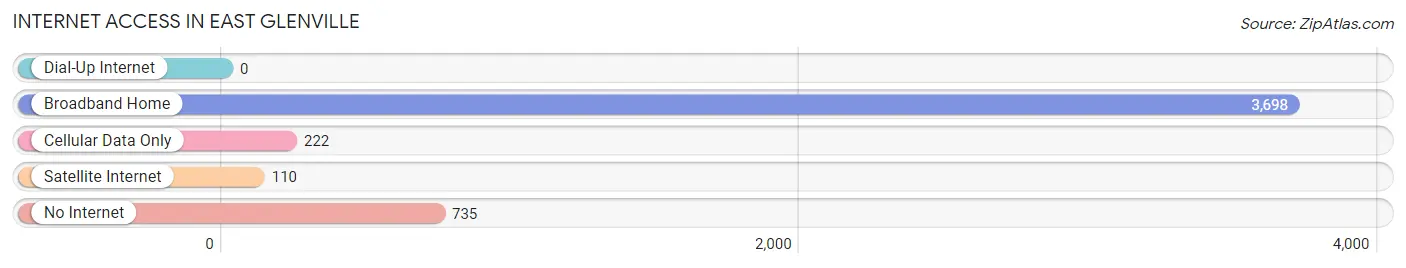
| Internet Type | # Households | % Households |
| Dial-Up Internet | 0 | 0.0% |
| Broadband Home | 3,698 | 78.6% |
| Cellular Data Only | 222 | 4.7% |
| Satellite Internet | 110 | 2.3% |
| No Internet | 735 | 15.6% |
| Total | 4,704 | 100.0% |
East Glenville Summary
History
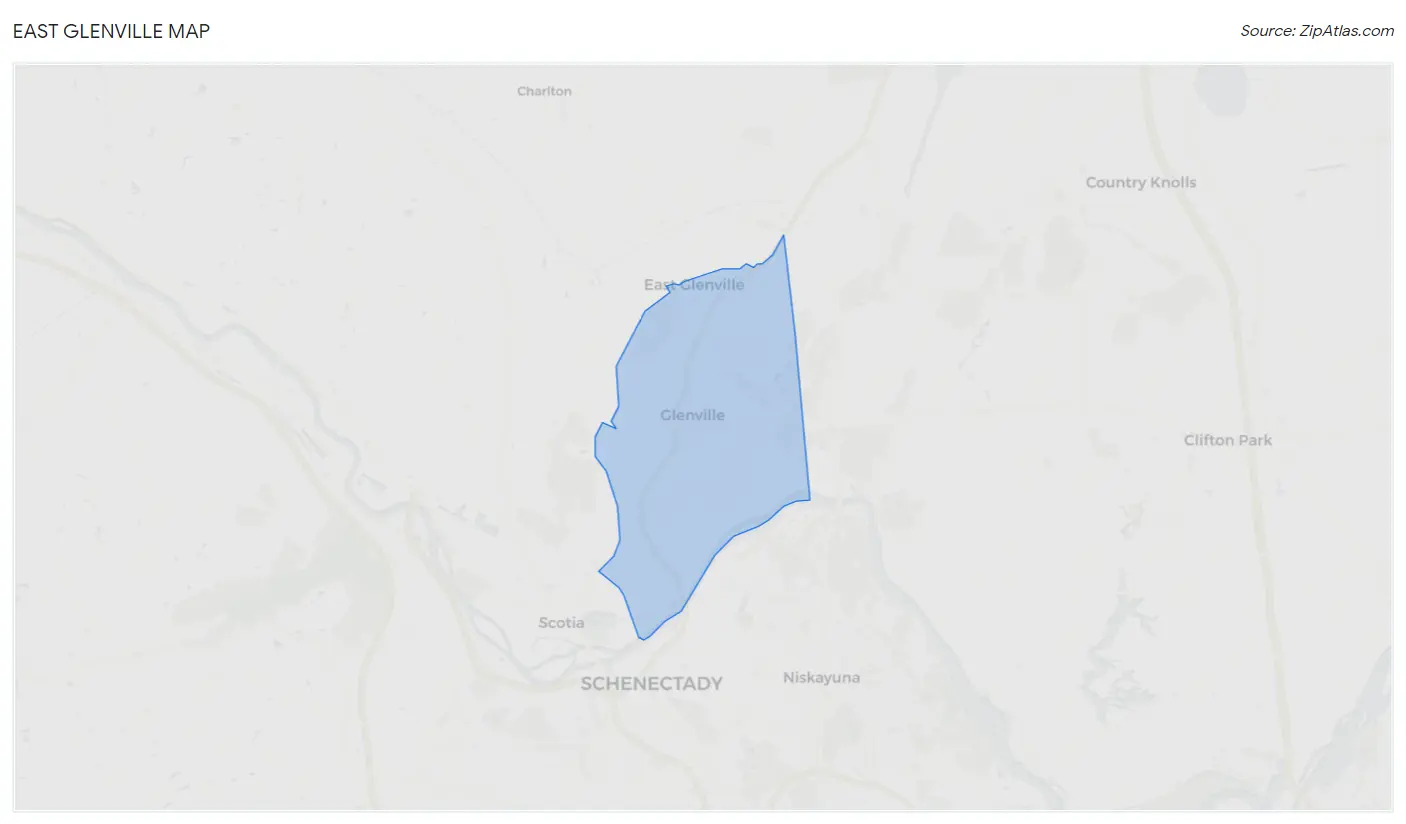
East Glenville is a hamlet located in the town of Glenville, Schenectady County, New York. It is located in the northeast corner of the town, just south of the city of Schenectady. The hamlet was first settled in the late 1700s by Dutch and German immigrants. The area was originally known as “East Glenville” due to its location east of the main village of Glenville.
The hamlet was originally a farming community, with many of the original settlers growing crops such as wheat, corn, and potatoes. The area was also home to several small businesses, including a blacksmith, a general store, and a sawmill. In the late 1800s, the hamlet began to grow as a residential area, with many of the original settlers’ descendants remaining in the area.
In the early 1900s, East Glenville began to experience a period of rapid growth. The hamlet was home to several factories, including a paper mill, a brickyard, and a tannery. The area also saw the construction of several churches, schools, and other public buildings.
Geography
East Glenville is located in the northeast corner of the town of Glenville, Schenectady County, New York. It is bordered by the city of Schenectady to the north, the town of Niskayuna to the east, the town of Rotterdam to the south, and the town of Glenville to the west. The hamlet is located on the banks of the Mohawk River, which flows through the area.
The hamlet is located in a hilly area, with several small streams and creeks running through the area. The highest point in the hamlet is located at the intersection of East Glenville Road and Glenridge Road, which is approximately 400 feet above sea level.
Economy
East Glenville is primarily a residential area, with many of the residents commuting to nearby cities for work. The hamlet is home to several small businesses, including a grocery store, a hardware store, and a few restaurants. The area is also home to several churches, schools, and other public buildings.
The hamlet is also home to several industrial sites, including a paper mill, a brickyard, and a tannery. These sites provide employment for many of the residents of East Glenville.
Demographics
As of the 2010 census, the population of East Glenville was 4,845. The population is primarily white (94.3%), with a small percentage of African Americans (2.2%), Asians (1.2%), and other races (2.3%). The median household income in the hamlet is $50,945, and the median home value is $179,400. The unemployment rate in the hamlet is 4.2%.
Common Questions
What is Per Capita Income in East Glenville?
Per Capita income in East Glenville is $45,900.
What is the Median Family Income in East Glenville?
Median Family Income in East Glenville is $124,200.
What is the Median Household income in East Glenville?
Median Household Income in East Glenville is $83,045.
What is Income or Wage Gap in East Glenville?
Income or Wage Gap in East Glenville is 10.9%.
Women in East Glenville earn 89.1 cents for every dollar earned by a man.
What is Inequality or Gini Index in East Glenville?
Inequality or Gini Index in East Glenville is 0.42.
What is the Total Population of East Glenville?
Total Population of East Glenville is 11,477.
What is the Total Male Population of East Glenville?
Total Male Population of East Glenville is 5,548.
What is the Total Female Population of East Glenville?
Total Female Population of East Glenville is 5,929.
What is the Ratio of Males per 100 Females in East Glenville?
There are 93.57 Males per 100 Females in East Glenville.
What is the Ratio of Females per 100 Males in East Glenville?
There are 106.87 Females per 100 Males in East Glenville.
What is the Median Population Age in East Glenville?
Median Population Age in East Glenville is 42.0 Years.
What is the Average Family Size in East Glenville
Average Family Size in East Glenville is 3.2 People.
What is the Average Household Size in East Glenville
Average Household Size in East Glenville is 2.4 People.
How Large is the Labor Force in East Glenville?
There are 5,559 People in the Labor Forcein in East Glenville.
What is the Percentage of People in the Labor Force in East Glenville?
60.5% of People are in the Labor Force in East Glenville.
What is the Unemployment Rate in East Glenville?
Unemployment Rate in East Glenville is 6.7%.