Albany, NY Map & Demographics
Albany Map
Albany Overview
$34,195
PER CAPITA INCOME
$78,841
AVG FAMILY INCOME
$54,736
AVG HOUSEHOLD INCOME
21.6%
WAGE / INCOME GAP [ % ]
78.4¢/ $1
WAGE / INCOME GAP [ $ ]
$11,004
FAMILY INCOME DEFICIT
0.49
INEQUALITY / GINI INDEX
99,692
TOTAL POPULATION
47,859
MALE POPULATION
51,833
FEMALE POPULATION
92.33
MALES / 100 FEMALES
108.30
FEMALES / 100 MALES
32.0
MEDIAN AGE
2.9
AVG FAMILY SIZE
2.0
AVG HOUSEHOLD SIZE
55,407
LABOR FORCE [ PEOPLE ]
64.0%
PERCENT IN LABOR FORCE
8.0%
UNEMPLOYMENT RATE
Albany Area Codes
Income in Albany
Income Overview in Albany
Per Capita Income in Albany is $34,195, while median incomes of families and households are $78,841 and $54,736 respectively.
| Characteristic | Number | Measure |
| Per Capita Income | 99,692 | $34,195 |
| Median Family Income | 18,078 | $78,841 |
| Mean Family Income | 18,078 | $101,845 |
| Median Household Income | 43,435 | $54,736 |
| Mean Household Income | 43,435 | $76,486 |
| Income Deficit | 18,078 | $11,004 |
| Wage / Income Gap (%) | 99,692 | 21.63% |
| Wage / Income Gap ($) | 99,692 | 78.37¢ per $1 |
| Gini / Inequality Index | 99,692 | 0.49 |
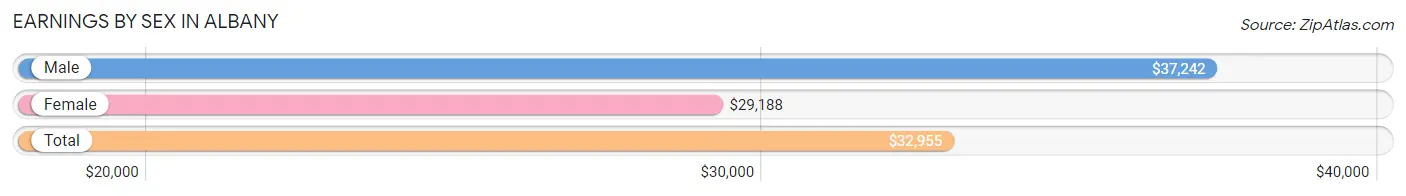
Earnings by Sex in Albany
Average Earnings in Albany are $32,955, $37,242 for men and $29,188 for women, a difference of 21.6%.
| Sex | Number | Average Earnings |
| Male | 28,158 (47.9%) | $37,242 |
| Female | 30,668 (52.1%) | $29,188 |
| Total | 58,826 (100.0%) | $32,955 |
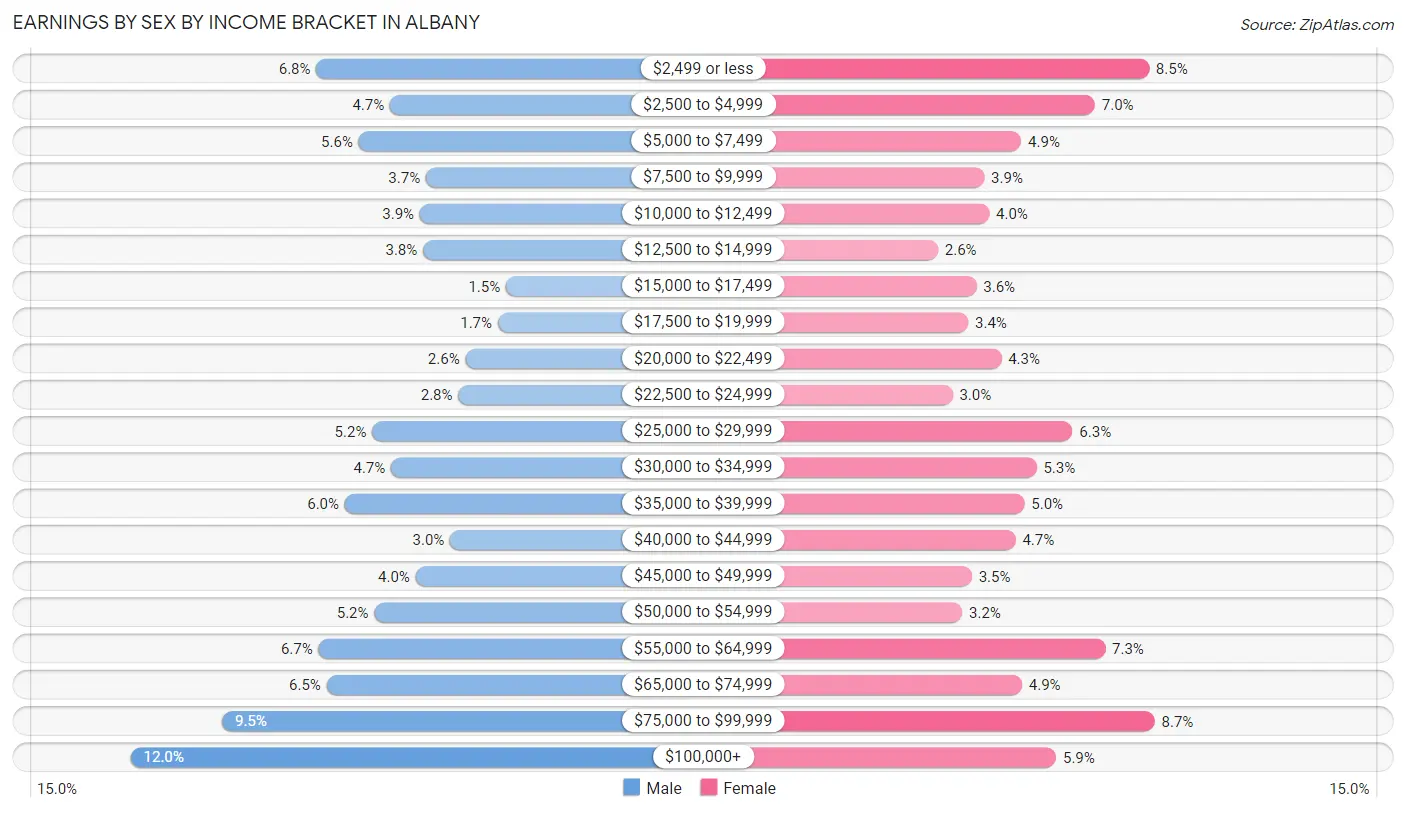
Earnings by Sex by Income Bracket in Albany
The most common earnings brackets in Albany are $100,000+ for men (3,384 | 12.0%) and $75,000 to $99,999 for women (2,652 | 8.6%).
| Income | Male | Female |
| $2,499 or less | 1,916 (6.8%) | 2,605 (8.5%) |
| $2,500 to $4,999 | 1,331 (4.7%) | 2,137 (7.0%) |
| $5,000 to $7,499 | 1,580 (5.6%) | 1,502 (4.9%) |
| $7,500 to $9,999 | 1,047 (3.7%) | 1,183 (3.9%) |
| $10,000 to $12,499 | 1,096 (3.9%) | 1,226 (4.0%) |
| $12,500 to $14,999 | 1,069 (3.8%) | 785 (2.6%) |
| $15,000 to $17,499 | 415 (1.5%) | 1,117 (3.6%) |
| $17,500 to $19,999 | 478 (1.7%) | 1,047 (3.4%) |
| $20,000 to $22,499 | 736 (2.6%) | 1,332 (4.3%) |
| $22,500 to $24,999 | 790 (2.8%) | 912 (3.0%) |
| $25,000 to $29,999 | 1,473 (5.2%) | 1,943 (6.3%) |
| $30,000 to $34,999 | 1,323 (4.7%) | 1,634 (5.3%) |
| $35,000 to $39,999 | 1,689 (6.0%) | 1,531 (5.0%) |
| $40,000 to $44,999 | 855 (3.0%) | 1,453 (4.7%) |
| $45,000 to $49,999 | 1,129 (4.0%) | 1,076 (3.5%) |
| $50,000 to $54,999 | 1,456 (5.2%) | 995 (3.2%) |
| $55,000 to $64,999 | 1,897 (6.7%) | 2,225 (7.3%) |
| $65,000 to $74,999 | 1,832 (6.5%) | 1,509 (4.9%) |
| $75,000 to $99,999 | 2,662 (9.5%) | 2,652 (8.6%) |
| $100,000+ | 3,384 (12.0%) | 1,804 (5.9%) |
| Total | 28,158 (100.0%) | 30,668 (100.0%) |
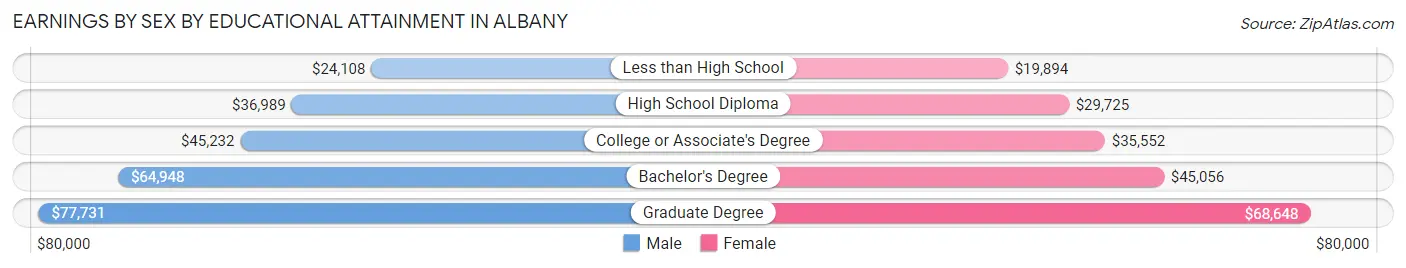
Earnings by Sex by Educational Attainment in Albany
Average earnings in Albany are $51,574 for men and $41,997 for women, a difference of 18.6%. Men with an educational attainment of graduate degree enjoy the highest average annual earnings of $77,731, while those with less than high school education earn the least with $24,108. Women with an educational attainment of graduate degree earn the most with the average annual earnings of $68,648, while those with less than high school education have the smallest earnings of $19,894.
| Educational Attainment | Male Income | Female Income |
| Less than High School | $24,108 | $19,894 |
| High School Diploma | $36,989 | $29,725 |
| College or Associate's Degree | $45,232 | $35,552 |
| Bachelor's Degree | $64,948 | $45,056 |
| Graduate Degree | $77,731 | $68,648 |
| Total | $51,574 | $41,997 |
Family Income in Albany
Family Income Brackets in Albany
According to the Albany family income data, there are 3,381 families falling into the $100,000 to $149,999 income range, which is the most common income bracket and makes up 18.7% of all families. Conversely, the $10,000 to $14,999 income bracket is the least frequent group with only 597 families (3.3%) belonging to this category.
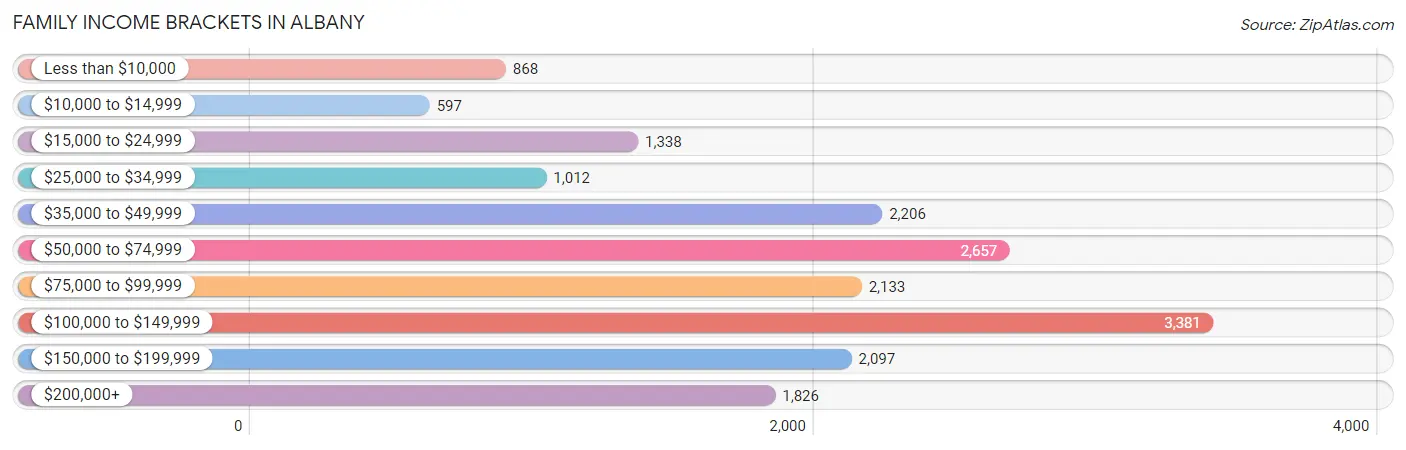
| Income Bracket | # Families | % Families |
| Less than $10,000 | 868 | 4.8% |
| $10,000 to $14,999 | 597 | 3.3% |
| $15,000 to $24,999 | 1,338 | 7.4% |
| $25,000 to $34,999 | 1,012 | 5.6% |
| $35,000 to $49,999 | 2,206 | 12.2% |
| $50,000 to $74,999 | 2,657 | 14.7% |
| $75,000 to $99,999 | 2,133 | 11.8% |
| $100,000 to $149,999 | 3,381 | 18.7% |
| $150,000 to $199,999 | 2,097 | 11.6% |
| $200,000+ | 1,826 | 10.1% |
Family Income by Famaliy Size in Albany
6-person families (323 | 1.8%) account for the highest median family income in Albany with $122,250 per family, while 2-person families (9,487 | 52.5%) have the highest median income of $39,496 per family member.
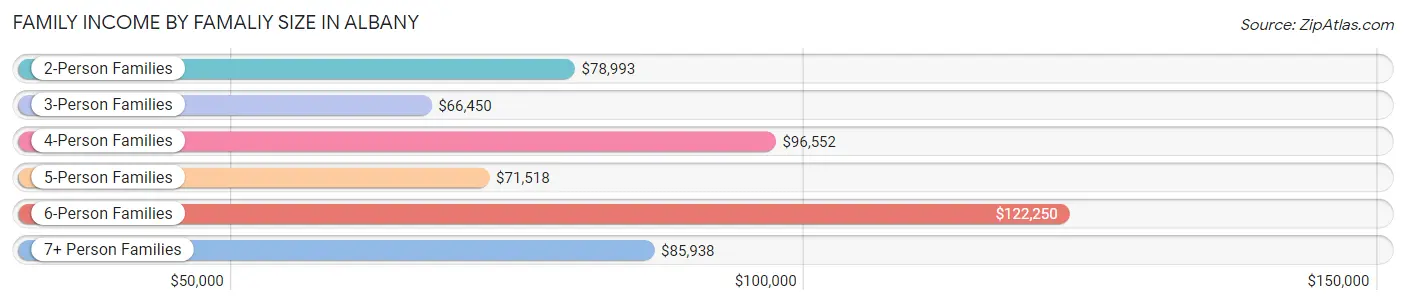
| Income Bracket | # Families | Median Income |
| 2-Person Families | 9,487 (52.5%) | $78,993 |
| 3-Person Families | 4,312 (23.8%) | $66,450 |
| 4-Person Families | 2,592 (14.3%) | $96,552 |
| 5-Person Families | 1,067 (5.9%) | $71,518 |
| 6-Person Families | 323 (1.8%) | $122,250 |
| 7+ Person Families | 297 (1.6%) | $85,938 |
| Total | 18,078 (100.0%) | $78,841 |
Family Income by Number of Earners in Albany
The median family income in Albany is $78,841, with families comprising 2 earners (7,081) having the highest median family income of $121,541, while families with 1 earner (6,380) have the lowest median family income of $42,837, accounting for 39.2% and 35.3% of families, respectively.
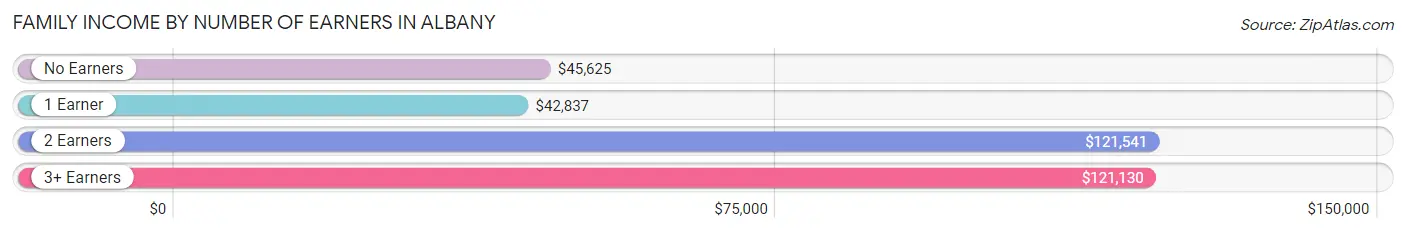
| Number of Earners | # Families | Median Income |
| No Earners | 2,598 (14.4%) | $45,625 |
| 1 Earner | 6,380 (35.3%) | $42,837 |
| 2 Earners | 7,081 (39.2%) | $121,541 |
| 3+ Earners | 2,019 (11.2%) | $121,130 |
| Total | 18,078 (100.0%) | $78,841 |
Household Income in Albany
Household Income Brackets in Albany
With 7,341 households falling in the category, the $50,000 to $74,999 income range is the most frequent in Albany, accounting for 16.9% of all households. In contrast, only 2,476 households (5.7%) fall into the $200,000+ income bracket, making it the least populous group.
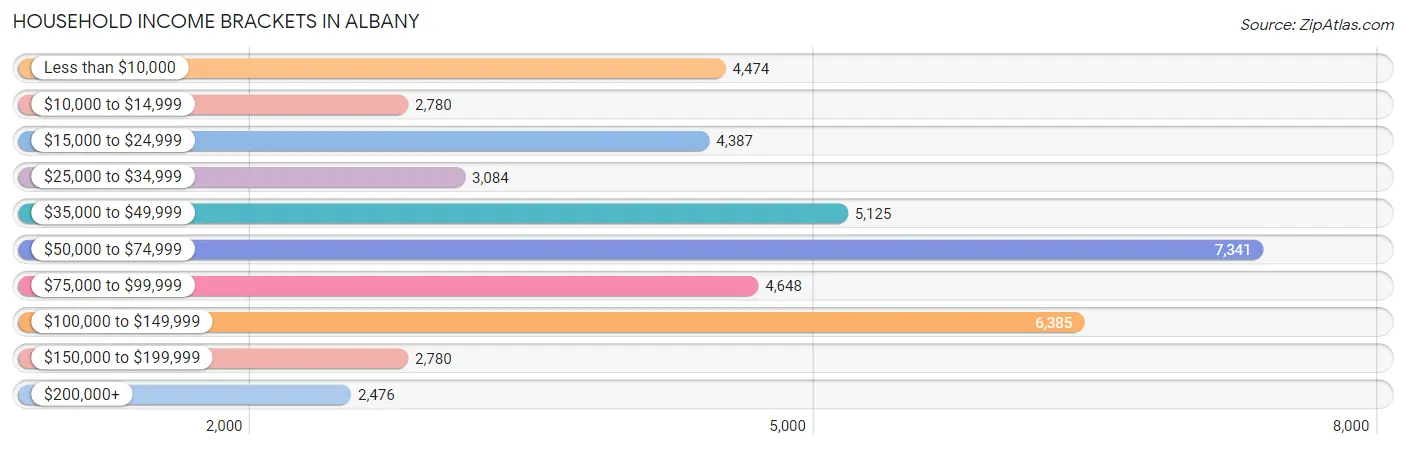
| Income Bracket | # Households | % Households |
| Less than $10,000 | 4,474 | 10.3% |
| $10,000 to $14,999 | 2,780 | 6.4% |
| $15,000 to $24,999 | 4,387 | 10.1% |
| $25,000 to $34,999 | 3,084 | 7.1% |
| $35,000 to $49,999 | 5,125 | 11.8% |
| $50,000 to $74,999 | 7,341 | 16.9% |
| $75,000 to $99,999 | 4,648 | 10.7% |
| $100,000 to $149,999 | 6,385 | 14.7% |
| $150,000 to $199,999 | 2,780 | 6.4% |
| $200,000+ | 2,476 | 5.7% |
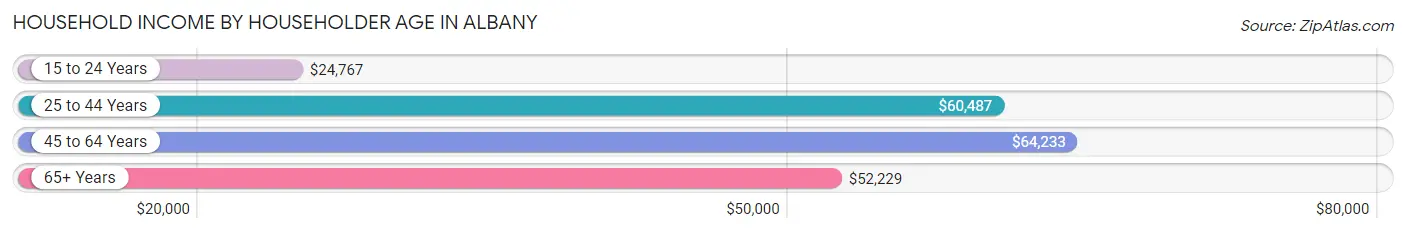
Household Income by Householder Age in Albany
The median household income in Albany is $54,736, with the highest median household income of $64,233 found in the 45 to 64 years age bracket for the primary householder. A total of 13,368 households (30.8%) fall into this category. Meanwhile, the 15 to 24 years age bracket for the primary householder has the lowest median household income of $24,767, with 4,576 households (10.5%) in this group.
| Income Bracket | # Households | Median Income |
| 15 to 24 Years | 4,576 (10.5%) | $24,767 |
| 25 to 44 Years | 16,314 (37.6%) | $60,487 |
| 45 to 64 Years | 13,368 (30.8%) | $64,233 |
| 65+ Years | 9,177 (21.1%) | $52,229 |
| Total | 43,435 (100.0%) | $54,736 |
Poverty in Albany
Income Below Poverty by Sex and Age in Albany
With 24.0% poverty level for males and 22.7% for females among the residents of Albany, 18 to 24 year old males and 5 year old females are the most vulnerable to poverty, with 2,640 males (38.8%) and 140 females (47.1%) in their respective age groups living below the poverty level.
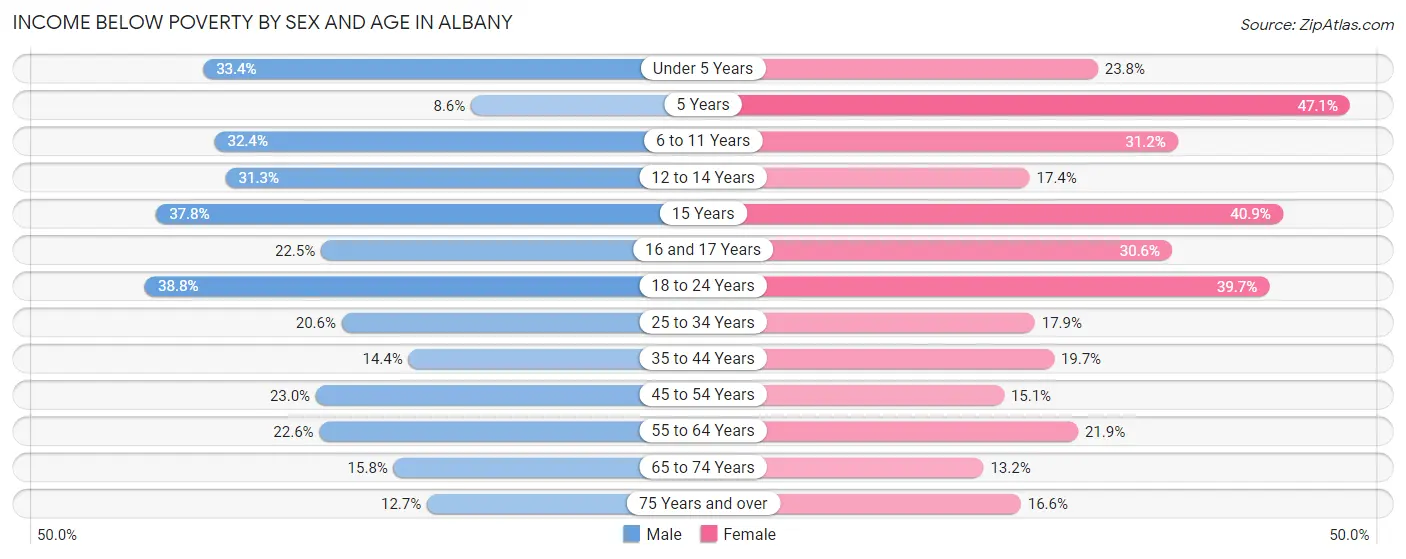
| Age Bracket | Male | Female |
| Under 5 Years | 810 (33.4%) | 481 (23.8%) |
| 5 Years | 37 (8.6%) | 140 (47.1%) |
| 6 to 11 Years | 804 (32.4%) | 665 (31.2%) |
| 12 to 14 Years | 378 (31.3%) | 220 (17.4%) |
| 15 Years | 150 (37.8%) | 81 (40.9%) |
| 16 and 17 Years | 190 (22.5%) | 261 (30.6%) |
| 18 to 24 Years | 2,640 (38.8%) | 3,028 (39.7%) |
| 25 to 34 Years | 1,709 (20.6%) | 1,489 (17.9%) |
| 35 to 44 Years | 906 (14.4%) | 1,064 (19.7%) |
| 45 to 54 Years | 1,149 (23.0%) | 783 (15.0%) |
| 55 to 64 Years | 1,074 (22.6%) | 1,177 (21.9%) |
| 65 to 74 Years | 543 (15.8%) | 556 (13.2%) |
| 75 Years and over | 233 (12.7%) | 549 (16.6%) |
| Total | 10,623 (24.0%) | 10,494 (22.7%) |
Income Above Poverty by Sex and Age in Albany
According to the poverty statistics in Albany, males aged 5 years and females aged 65 to 74 years are the age groups that are most secure financially, with 91.4% of males and 86.9% of females in these age groups living above the poverty line.
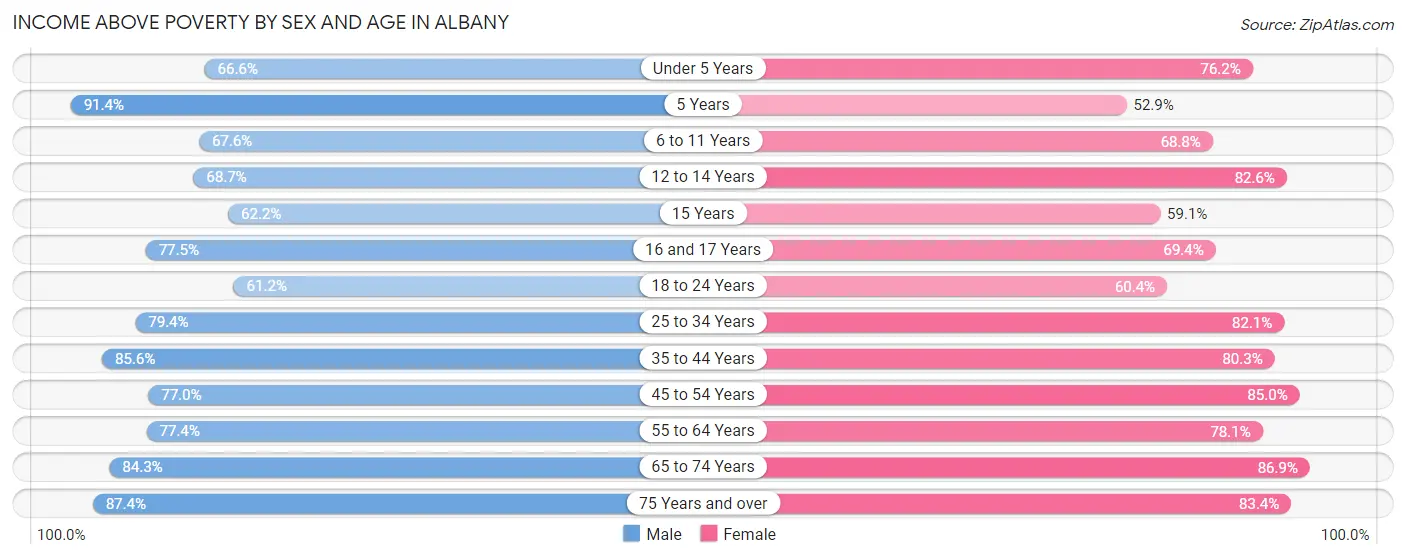
| Age Bracket | Male | Female |
| Under 5 Years | 1,614 (66.6%) | 1,543 (76.2%) |
| 5 Years | 395 (91.4%) | 157 (52.9%) |
| 6 to 11 Years | 1,680 (67.6%) | 1,469 (68.8%) |
| 12 to 14 Years | 828 (68.7%) | 1,042 (82.6%) |
| 15 Years | 247 (62.2%) | 117 (59.1%) |
| 16 and 17 Years | 655 (77.5%) | 591 (69.4%) |
| 18 to 24 Years | 4,163 (61.2%) | 4,609 (60.4%) |
| 25 to 34 Years | 6,605 (79.4%) | 6,825 (82.1%) |
| 35 to 44 Years | 5,398 (85.6%) | 4,341 (80.3%) |
| 45 to 54 Years | 3,856 (77.0%) | 4,420 (85.0%) |
| 55 to 64 Years | 3,669 (77.4%) | 4,193 (78.1%) |
| 65 to 74 Years | 2,904 (84.3%) | 3,672 (86.9%) |
| 75 Years and over | 1,609 (87.4%) | 2,756 (83.4%) |
| Total | 33,623 (76.0%) | 35,735 (77.3%) |
Income Below Poverty Among Married-Couple Families in Albany
The poverty statistics for married-couple families in Albany show that 5.2% or 538 of the total 10,363 families live below the poverty line. Families with 5 or more children have the highest poverty rate of 18.9%, comprising of 20 families. On the other hand, families with no children have the lowest poverty rate of 2.1%, which includes 141 families.
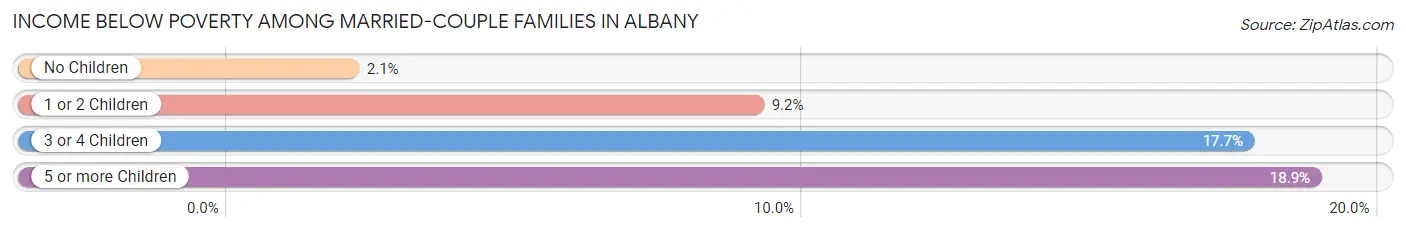
| Children | Above Poverty | Below Poverty |
| No Children | 6,513 (97.9%) | 141 (2.1%) |
| 1 or 2 Children | 2,775 (90.8%) | 280 (9.2%) |
| 3 or 4 Children | 451 (82.3%) | 97 (17.7%) |
| 5 or more Children | 86 (81.1%) | 20 (18.9%) |
| Total | 9,825 (94.8%) | 538 (5.2%) |
Income Below Poverty Among Single-Parent Households in Albany
According to the poverty data in Albany, 27.4% or 373 single-father households and 27.0% or 1,712 single-mother households are living below the poverty line. Among single-father households, those with 3 or 4 children have the highest poverty rate, with 61 households (93.9%) experiencing poverty. Likewise, among single-mother households, those with 3 or 4 children have the highest poverty rate, with 522 households (80.8%) falling below the poverty line.
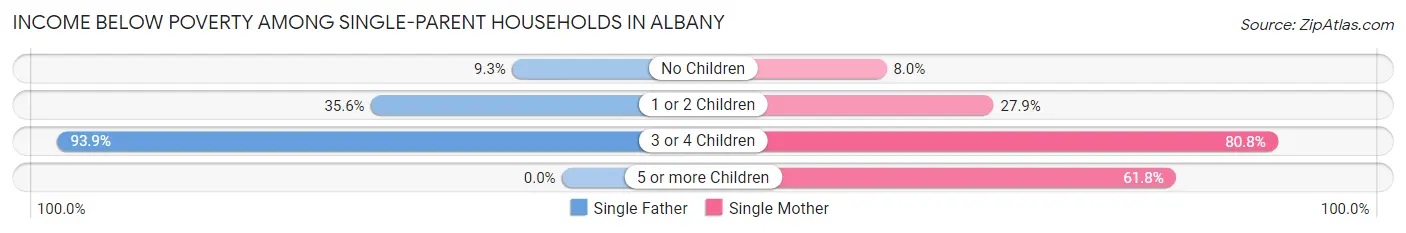
| Children | Single Father | Single Mother |
| No Children | 53 (9.3%) | 173 (8.0%) |
| 1 or 2 Children | 259 (35.6%) | 962 (27.9%) |
| 3 or 4 Children | 61 (93.9%) | 522 (80.8%) |
| 5 or more Children | 0 (0.0%) | 55 (61.8%) |
| Total | 373 (27.4%) | 1,712 (27.0%) |
Income Below Poverty Among Married-Couple vs Single-Parent Households in Albany
The poverty data for Albany shows that 538 of the married-couple family households (5.2%) and 2,085 of the single-parent households (27.0%) are living below the poverty level. Within the married-couple family households, those with 5 or more children have the highest poverty rate, with 20 households (18.9%) falling below the poverty line. Among the single-parent households, those with 3 or 4 children have the highest poverty rate, with 583 household (82.0%) living below poverty.
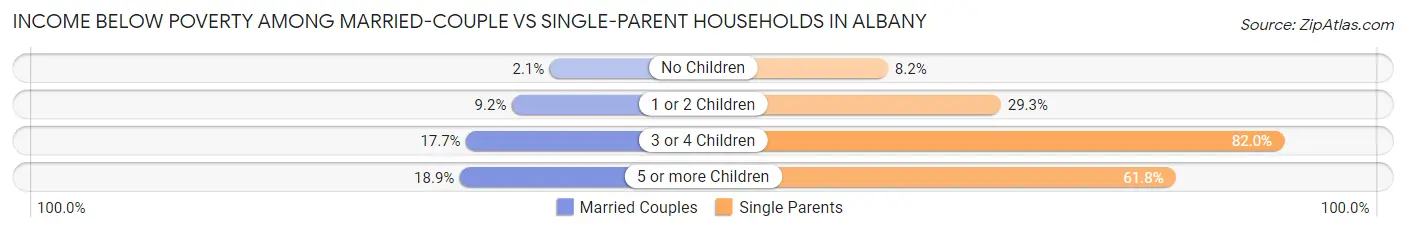
| Children | Married-Couple Families | Single-Parent Households |
| No Children | 141 (2.1%) | 226 (8.2%) |
| 1 or 2 Children | 280 (9.2%) | 1,221 (29.3%) |
| 3 or 4 Children | 97 (17.7%) | 583 (82.0%) |
| 5 or more Children | 20 (18.9%) | 55 (61.8%) |
| Total | 538 (5.2%) | 2,085 (27.0%) |
Race in Albany
The most populous races in Albany are White / Caucasian (53,502 | 53.7%), Black / African American (27,802 | 27.9%), and Hispanic or Latino (9,907 | 9.9%).
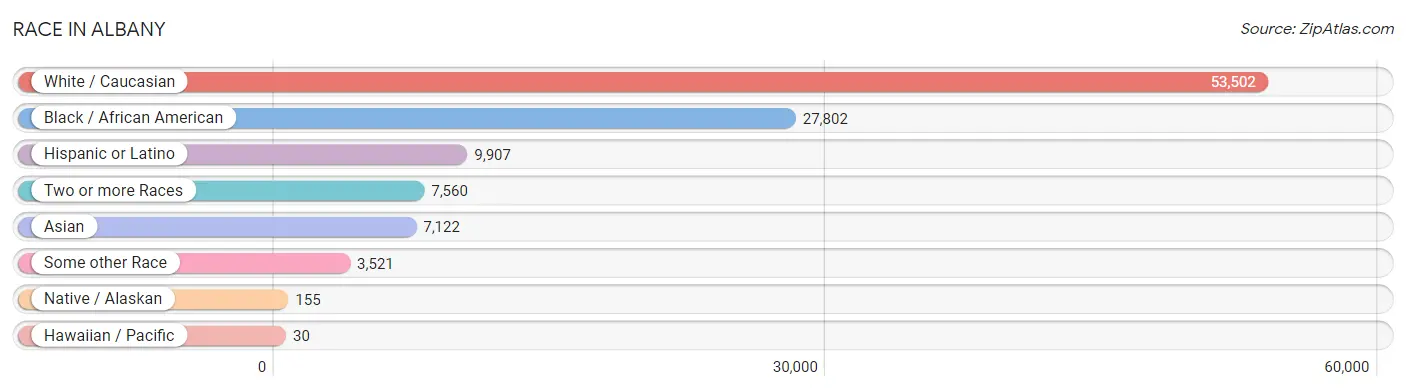
| Race | # Population | % Population |
| Asian | 7,122 | 7.1% |
| Black / African American | 27,802 | 27.9% |
| Hawaiian / Pacific | 30 | 0.0% |
| Hispanic or Latino | 9,907 | 9.9% |
| Native / Alaskan | 155 | 0.2% |
| White / Caucasian | 53,502 | 53.7% |
| Two or more Races | 7,560 | 7.6% |
| Some other Race | 3,521 | 3.5% |
| Total | 99,692 | 100.0% |
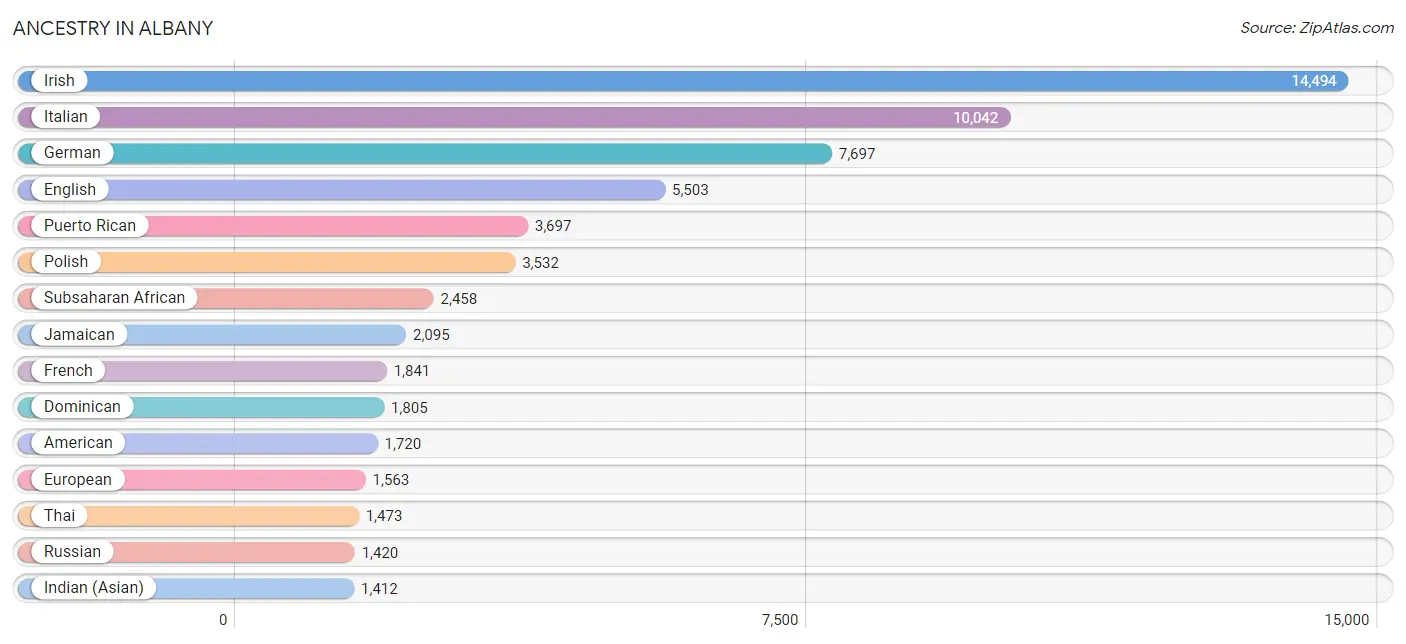
Ancestry in Albany
The most populous ancestries reported in Albany are Irish (14,494 | 14.5%), Italian (10,042 | 10.1%), German (7,697 | 7.7%), English (5,503 | 5.5%), and Puerto Rican (3,697 | 3.7%), together accounting for 41.6% of all Albany residents.
| Ancestry | # Population | % Population |
| Afghan | 425 | 0.4% |
| African | 1,036 | 1.0% |
| Albanian | 265 | 0.3% |
| American | 1,720 | 1.7% |
| Arab | 919 | 0.9% |
| Argentinean | 40 | 0.0% |
| Armenian | 324 | 0.3% |
| Australian | 18 | 0.0% |
| Austrian | 197 | 0.2% |
| Bahamian | 9 | 0.0% |
| Barbadian | 44 | 0.0% |
| Belgian | 61 | 0.1% |
| Belizean | 1 | 0.0% |
| Bhutanese | 252 | 0.3% |
| Blackfeet | 128 | 0.1% |
| Bolivian | 11 | 0.0% |
| Brazilian | 70 | 0.1% |
| British | 306 | 0.3% |
| British West Indian | 67 | 0.1% |
| Bulgarian | 37 | 0.0% |
| Burmese | 392 | 0.4% |
| Cambodian | 22 | 0.0% |
| Canadian | 90 | 0.1% |
| Celtic | 94 | 0.1% |
| Central American | 1,074 | 1.1% |
| Central American Indian | 55 | 0.1% |
| Cherokee | 510 | 0.5% |
| Cheyenne | 6 | 0.0% |
| Chilean | 33 | 0.0% |
| Choctaw | 9 | 0.0% |
| Colombian | 307 | 0.3% |
| Costa Rican | 30 | 0.0% |
| Creek | 58 | 0.1% |
| Croatian | 135 | 0.1% |
| Cuban | 200 | 0.2% |
| Cypriot | 7 | 0.0% |
| Czech | 186 | 0.2% |
| Czechoslovakian | 99 | 0.1% |
| Danish | 187 | 0.2% |
| Delaware | 3 | 0.0% |
| Dominican | 1,805 | 1.8% |
| Dutch | 1,070 | 1.1% |
| Eastern European | 521 | 0.5% |
| Ecuadorian | 775 | 0.8% |
| Egyptian | 95 | 0.1% |
| English | 5,503 | 5.5% |
| European | 1,563 | 1.6% |
| Finnish | 89 | 0.1% |
| French | 1,841 | 1.8% |
| French American Indian | 5 | 0.0% |
| French Canadian | 1,223 | 1.2% |
| German | 7,697 | 7.7% |
| German Russian | 46 | 0.1% |
| Ghanaian | 346 | 0.4% |
| Greek | 566 | 0.6% |
| Guatemalan | 128 | 0.1% |
| Guyanese | 686 | 0.7% |
| Haitian | 328 | 0.3% |
| Honduran | 137 | 0.1% |
| Hungarian | 361 | 0.4% |
| Icelander | 30 | 0.0% |
| Indian (Asian) | 1,412 | 1.4% |
| Indonesian | 1,042 | 1.1% |
| Inupiat | 6 | 0.0% |
| Iranian | 12 | 0.0% |
| Iraqi | 185 | 0.2% |
| Irish | 14,494 | 14.5% |
| Iroquois | 112 | 0.1% |
| Israeli | 71 | 0.1% |
| Italian | 10,042 | 10.1% |
| Jamaican | 2,095 | 2.1% |
| Japanese | 122 | 0.1% |
| Kenyan | 59 | 0.1% |
| Korean | 946 | 0.9% |
| Laotian | 22 | 0.0% |
| Latvian | 36 | 0.0% |
| Lebanese | 302 | 0.3% |
| Liberian | 7 | 0.0% |
| Lithuanian | 181 | 0.2% |
| Macedonian | 5 | 0.0% |
| Mexican | 757 | 0.8% |
| Mexican American Indian | 61 | 0.1% |
| Mongolian | 69 | 0.1% |
| Moroccan | 21 | 0.0% |
| Nigerian | 576 | 0.6% |
| Northern European | 137 | 0.1% |
| Norwegian | 342 | 0.3% |
| Pakistani | 301 | 0.3% |
| Panamanian | 87 | 0.1% |
| Peruvian | 112 | 0.1% |
| Polish | 3,532 | 3.5% |
| Portuguese | 332 | 0.3% |
| Puerto Rican | 3,697 | 3.7% |
| Romanian | 93 | 0.1% |
| Russian | 1,420 | 1.4% |
| Salvadoran | 692 | 0.7% |
| Samoan | 8 | 0.0% |
| Scandinavian | 160 | 0.2% |
| Scotch-Irish | 618 | 0.6% |
| Scottish | 895 | 0.9% |
| Seminole | 5 | 0.0% |
| Senegalese | 299 | 0.3% |
| Serbian | 26 | 0.0% |
| Sioux | 9 | 0.0% |
| Slovak | 87 | 0.1% |
| Slovene | 11 | 0.0% |
| South African | 153 | 0.2% |
| South American | 1,288 | 1.3% |
| South American Indian | 14 | 0.0% |
| Spaniard | 231 | 0.2% |
| Spanish | 143 | 0.1% |
| Spanish American | 150 | 0.2% |
| Sri Lankan | 475 | 0.5% |
| Subsaharan African | 2,458 | 2.5% |
| Sudanese | 24 | 0.0% |
| Swedish | 284 | 0.3% |
| Swiss | 158 | 0.2% |
| Syrian | 145 | 0.2% |
| Thai | 1,473 | 1.5% |
| Trinidadian and Tobagonian | 300 | 0.3% |
| Turkish | 73 | 0.1% |
| Ukrainian | 639 | 0.6% |
| Uruguayan | 10 | 0.0% |
| Vietnamese | 79 | 0.1% |
| Welsh | 423 | 0.4% |
| West Indian | 262 | 0.3% |
| Yugoslavian | 249 | 0.3% |
| Zimbabwean | 4 | 0.0% | View All 128 Rows |
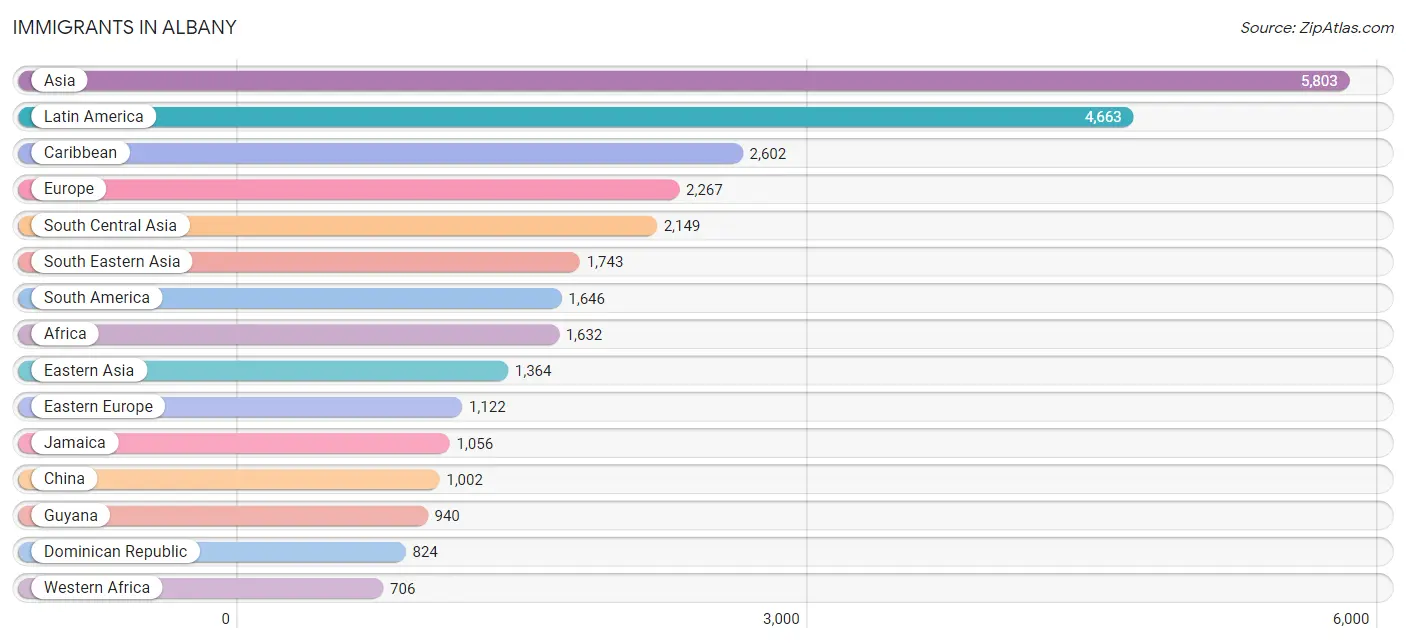
Immigrants in Albany
The most numerous immigrant groups reported in Albany came from Asia (5,803 | 5.8%), Latin America (4,663 | 4.7%), Caribbean (2,602 | 2.6%), Europe (2,267 | 2.3%), and South Central Asia (2,149 | 2.2%), together accounting for 17.5% of all Albany residents.
| Immigration Origin | # Population | % Population |
| Afghanistan | 426 | 0.4% |
| Africa | 1,632 | 1.6% |
| Albania | 191 | 0.2% |
| Argentina | 10 | 0.0% |
| Asia | 5,803 | 5.8% |
| Australia | 27 | 0.0% |
| Bahamas | 9 | 0.0% |
| Bangladesh | 357 | 0.4% |
| Barbados | 58 | 0.1% |
| Belarus | 24 | 0.0% |
| Belgium | 29 | 0.0% |
| Bosnia and Herzegovina | 40 | 0.0% |
| Brazil | 50 | 0.1% |
| Bulgaria | 26 | 0.0% |
| Cambodia | 19 | 0.0% |
| Cameroon | 12 | 0.0% |
| Canada | 329 | 0.3% |
| Caribbean | 2,602 | 2.6% |
| Central America | 415 | 0.4% |
| Chile | 13 | 0.0% |
| China | 1,002 | 1.0% |
| Colombia | 150 | 0.2% |
| Costa Rica | 12 | 0.0% |
| Croatia | 112 | 0.1% |
| Cuba | 58 | 0.1% |
| Denmark | 14 | 0.0% |
| Dominican Republic | 824 | 0.8% |
| Eastern Africa | 529 | 0.5% |
| Eastern Asia | 1,364 | 1.4% |
| Eastern Europe | 1,122 | 1.1% |
| Ecuador | 416 | 0.4% |
| Egypt | 161 | 0.2% |
| El Salvador | 255 | 0.3% |
| England | 182 | 0.2% |
| Europe | 2,267 | 2.3% |
| France | 27 | 0.0% |
| Germany | 243 | 0.2% |
| Ghana | 223 | 0.2% |
| Greece | 50 | 0.1% |
| Grenada | 24 | 0.0% |
| Guatemala | 91 | 0.1% |
| Guyana | 940 | 0.9% |
| Haiti | 140 | 0.1% |
| Honduras | 21 | 0.0% |
| Hong Kong | 55 | 0.1% |
| Hungary | 23 | 0.0% |
| India | 595 | 0.6% |
| Indonesia | 5 | 0.0% |
| Iran | 43 | 0.0% |
| Iraq | 354 | 0.4% |
| Ireland | 28 | 0.0% |
| Israel | 5 | 0.0% |
| Italy | 260 | 0.3% |
| Jamaica | 1,056 | 1.1% |
| Japan | 69 | 0.1% |
| Kazakhstan | 26 | 0.0% |
| Kenya | 43 | 0.0% |
| Korea | 271 | 0.3% |
| Laos | 16 | 0.0% |
| Latin America | 4,663 | 4.7% |
| Latvia | 52 | 0.1% |
| Malaysia | 107 | 0.1% |
| Mexico | 21 | 0.0% |
| Middle Africa | 97 | 0.1% |
| Nepal | 71 | 0.1% |
| Nigeria | 262 | 0.3% |
| Northern Africa | 185 | 0.2% |
| Northern Europe | 373 | 0.4% |
| Oceania | 27 | 0.0% |
| Pakistan | 567 | 0.6% |
| Panama | 15 | 0.0% |
| Peru | 57 | 0.1% |
| Philippines | 607 | 0.6% |
| Portugal | 17 | 0.0% |
| Russia | 223 | 0.2% |
| Scotland | 13 | 0.0% |
| Senegal | 114 | 0.1% |
| South America | 1,646 | 1.7% |
| South Central Asia | 2,149 | 2.2% |
| South Eastern Asia | 1,743 | 1.8% |
| Southern Europe | 327 | 0.3% |
| Sri Lanka | 10 | 0.0% |
| St. Vincent and the Grenadines | 12 | 0.0% |
| Sudan | 24 | 0.0% |
| Sweden | 2 | 0.0% |
| Switzerland | 146 | 0.2% |
| Syria | 49 | 0.1% |
| Taiwan | 25 | 0.0% |
| Thailand | 162 | 0.2% |
| Trinidad and Tobago | 195 | 0.2% |
| Turkey | 73 | 0.1% |
| Ukraine | 261 | 0.3% |
| Uruguay | 10 | 0.0% |
| Uzbekistan | 54 | 0.1% |
| Vietnam | 194 | 0.2% |
| West Indies | 87 | 0.1% |
| Western Africa | 706 | 0.7% |
| Western Asia | 547 | 0.5% |
| Western Europe | 445 | 0.4% |
| Yemen | 47 | 0.1% |
| Zaire | 85 | 0.1% |
| Zimbabwe | 4 | 0.0% | View All 102 Rows |
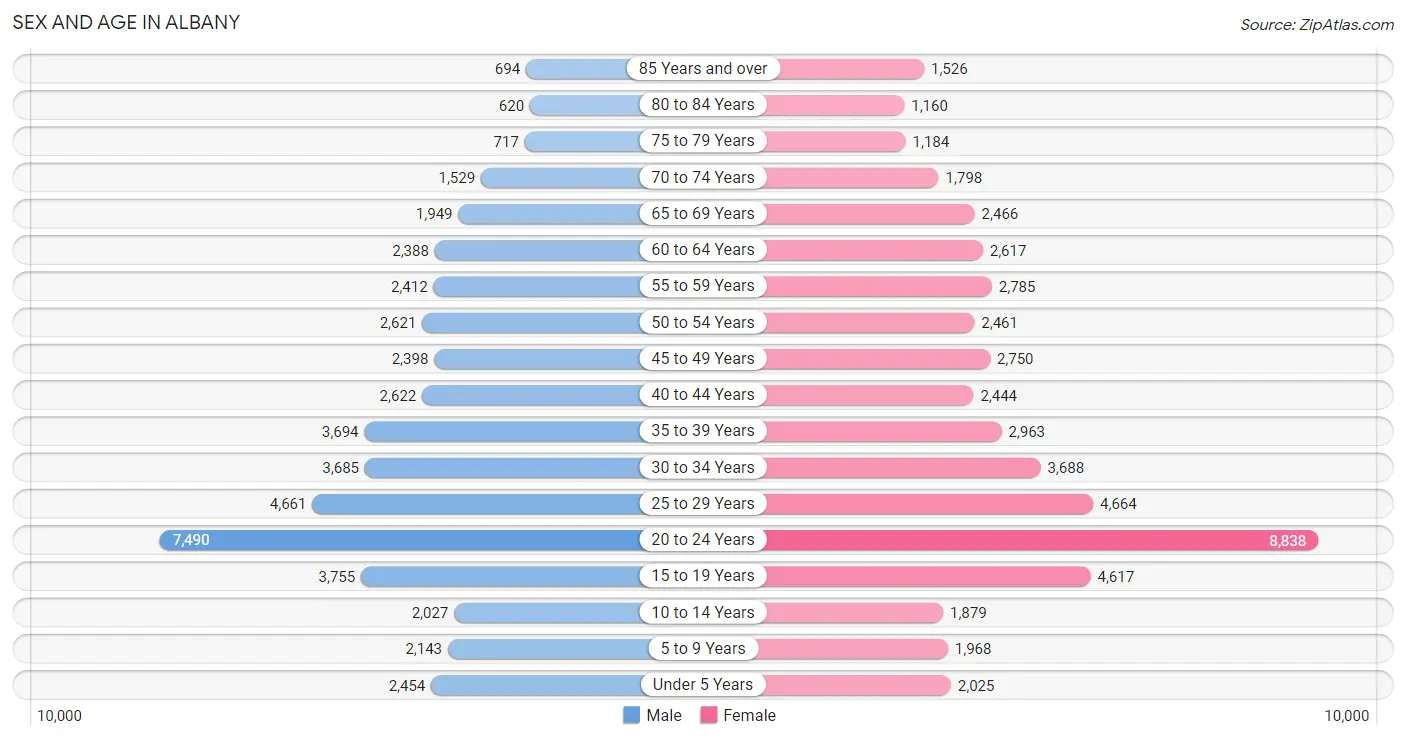
Sex and Age in Albany
Sex and Age in Albany
The most populous age groups in Albany are 20 to 24 Years (7,490 | 15.7%) for men and 20 to 24 Years (8,838 | 17.1%) for women.
| Age Bracket | Male | Female |
| Under 5 Years | 2,454 (5.1%) | 2,025 (3.9%) |
| 5 to 9 Years | 2,143 (4.5%) | 1,968 (3.8%) |
| 10 to 14 Years | 2,027 (4.2%) | 1,879 (3.6%) |
| 15 to 19 Years | 3,755 (7.9%) | 4,617 (8.9%) |
| 20 to 24 Years | 7,490 (15.7%) | 8,838 (17.1%) |
| 25 to 29 Years | 4,661 (9.7%) | 4,664 (9.0%) |
| 30 to 34 Years | 3,685 (7.7%) | 3,688 (7.1%) |
| 35 to 39 Years | 3,694 (7.7%) | 2,963 (5.7%) |
| 40 to 44 Years | 2,622 (5.5%) | 2,444 (4.7%) |
| 45 to 49 Years | 2,398 (5.0%) | 2,750 (5.3%) |
| 50 to 54 Years | 2,621 (5.5%) | 2,461 (4.8%) |
| 55 to 59 Years | 2,412 (5.0%) | 2,785 (5.4%) |
| 60 to 64 Years | 2,388 (5.0%) | 2,617 (5.1%) |
| 65 to 69 Years | 1,949 (4.1%) | 2,466 (4.8%) |
| 70 to 74 Years | 1,529 (3.2%) | 1,798 (3.5%) |
| 75 to 79 Years | 717 (1.5%) | 1,184 (2.3%) |
| 80 to 84 Years | 620 (1.3%) | 1,160 (2.2%) |
| 85 Years and over | 694 (1.5%) | 1,526 (2.9%) |
| Total | 47,859 (100.0%) | 51,833 (100.0%) |
Families and Households in Albany
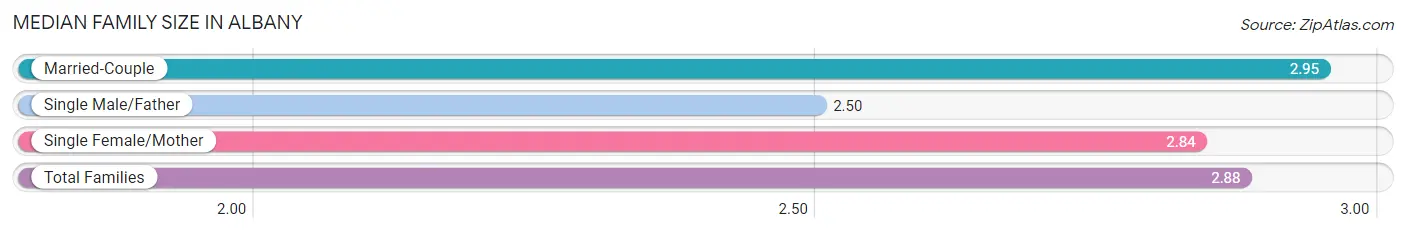
Median Family Size in Albany
The median family size in Albany is 2.88 persons per family, with married-couple families (10,363 | 57.3%) accounting for the largest median family size of 2.95 persons per family. On the other hand, single male/father families (1,364 | 7.5%) represent the smallest median family size with 2.50 persons per family.
| Family Type | # Families | Family Size |
| Married-Couple | 10,363 (57.3%) | 2.95 |
| Single Male/Father | 1,364 (7.5%) | 2.50 |
| Single Female/Mother | 6,351 (35.1%) | 2.84 |
| Total Families | 18,078 (100.0%) | 2.88 |
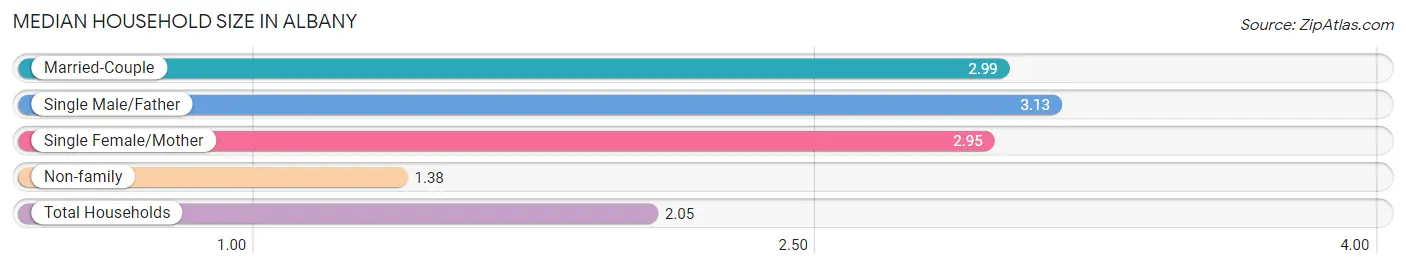
Median Household Size in Albany
The median household size in Albany is 2.05 persons per household, with single male/father households (1,364 | 3.1%) accounting for the largest median household size of 3.13 persons per household. non-family households (25,357 | 58.4%) represent the smallest median household size with 1.38 persons per household.
| Household Type | # Households | Household Size |
| Married-Couple | 10,363 (23.9%) | 2.99 |
| Single Male/Father | 1,364 (3.1%) | 3.13 |
| Single Female/Mother | 6,351 (14.6%) | 2.95 |
| Non-family | 25,357 (58.4%) | 1.38 |
| Total Households | 43,435 (100.0%) | 2.05 |
Household Size by Marriage Status in Albany
Out of a total of 43,435 households in Albany, 18,078 (41.6%) are family households, while 25,357 (58.4%) are nonfamily households. The most numerous type of family households are 2-person households, comprising 8,304, and the most common type of nonfamily households are 1-person households, comprising 18,441.
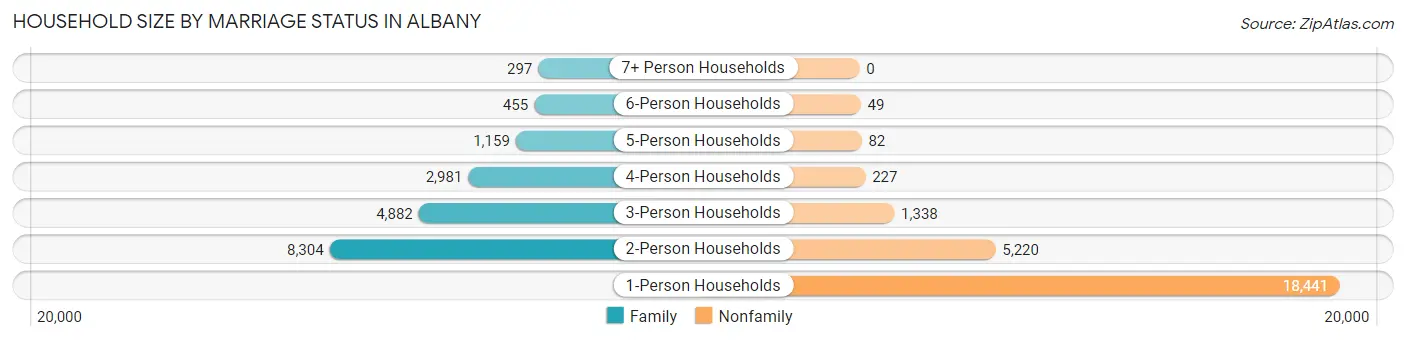
| Household Size | Family Households | Nonfamily Households |
| 1-Person Households | - | 18,441 (42.5%) |
| 2-Person Households | 8,304 (19.1%) | 5,220 (12.0%) |
| 3-Person Households | 4,882 (11.2%) | 1,338 (3.1%) |
| 4-Person Households | 2,981 (6.9%) | 227 (0.5%) |
| 5-Person Households | 1,159 (2.7%) | 82 (0.2%) |
| 6-Person Households | 455 (1.1%) | 49 (0.1%) |
| 7+ Person Households | 297 (0.7%) | 0 (0.0%) |
| Total | 18,078 (41.6%) | 25,357 (58.4%) |
Female Fertility in Albany
Fertility by Age in Albany
Average fertility rate in Albany is 38.0 births per 1,000 women. Women in the age bracket of 20 to 34 years have the highest fertility rate with 56.0 births per 1,000 women. Women in the age bracket of 20 to 34 years acount for 84.1% of all women with births.
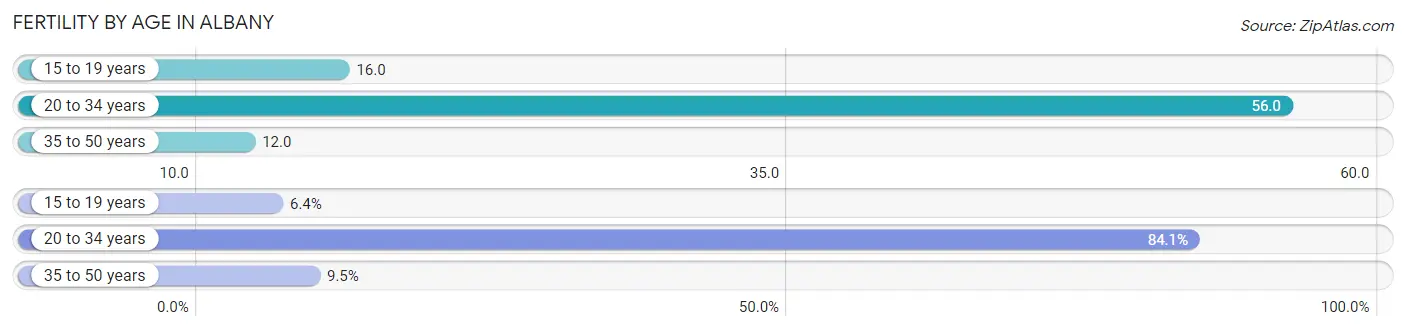
| Age Bracket | Women with Births | Births / 1,000 Women |
| 15 to 19 years | 73 (6.4%) | 16.0 |
| 20 to 34 years | 965 (84.1%) | 56.0 |
| 35 to 50 years | 109 (9.5%) | 12.0 |
| Total | 1,147 (100.0%) | 38.0 |
Fertility by Age by Marriage Status in Albany
58.5% of women with births (1,147) in Albany are married. The highest percentage of unmarried women with births falls into 15 to 19 years age bracket with 100.0% of them unmarried at the time of birth, while the lowest percentage of unmarried women with births belong to 35 to 50 years age bracket with 34.9% of them unmarried.
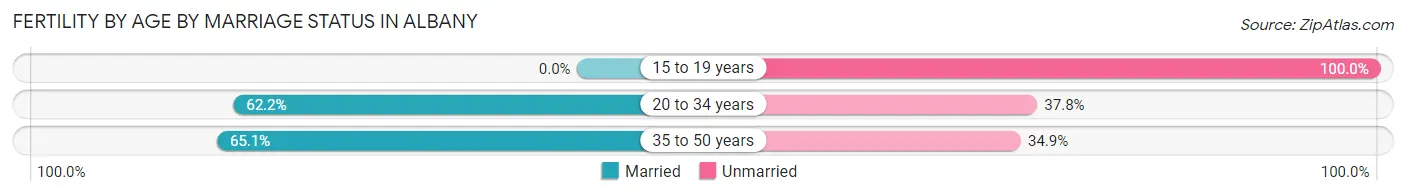
| Age Bracket | Married | Unmarried |
| 15 to 19 years | 0 (0.0%) | 73 (100.0%) |
| 20 to 34 years | 600 (62.2%) | 365 (37.8%) |
| 35 to 50 years | 71 (65.1%) | 38 (34.9%) |
| Total | 671 (58.5%) | 476 (41.5%) |
Fertility by Education in Albany
Average fertility rate in Albany is 38.0 births per 1,000 women. Women with the education attainment of less than high school have the highest fertility rate of 104.0 births per 1,000 women, while women with the education attainment of college or associate's degree have the lowest fertility at 22.0 births per 1,000 women. Women with the education attainment of less than high school represent 28.1% of all women with births.
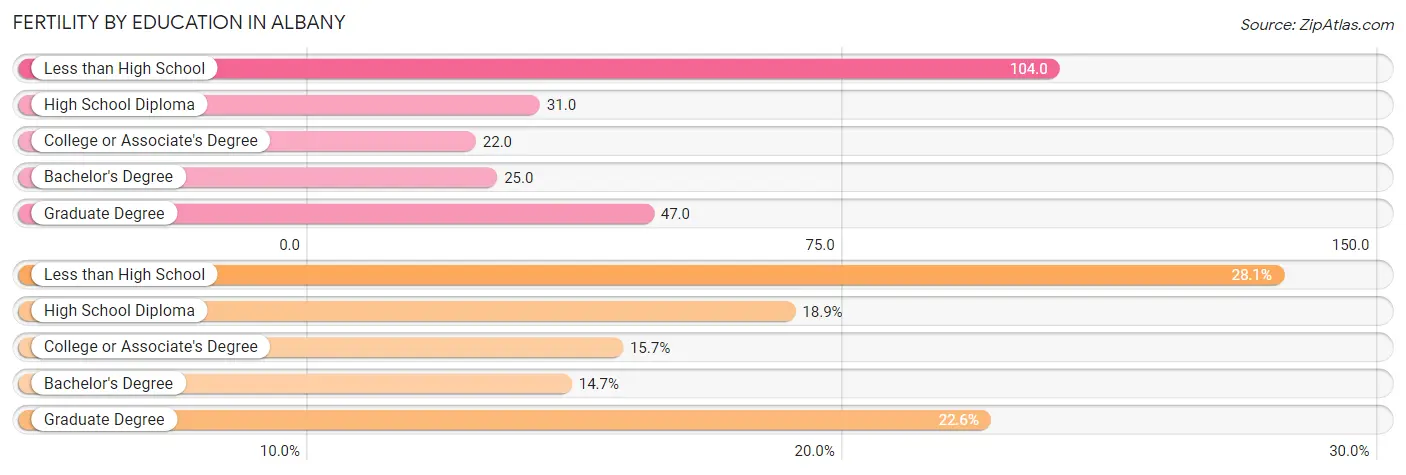
| Educational Attainment | Women with Births | Births / 1,000 Women |
| Less than High School | 322 (28.1%) | 104.0 |
| High School Diploma | 217 (18.9%) | 31.0 |
| College or Associate's Degree | 180 (15.7%) | 22.0 |
| Bachelor's Degree | 169 (14.7%) | 25.0 |
| Graduate Degree | 259 (22.6%) | 47.0 |
| Total | 1,147 (100.0%) | 38.0 |
Fertility by Education by Marriage Status in Albany
41.5% of women with births in Albany are unmarried. Women with the educational attainment of graduate degree are most likely to be married with 100.0% of them married at childbirth, while women with the educational attainment of high school diploma are least likely to be married with 92.6% of them unmarried at childbirth.
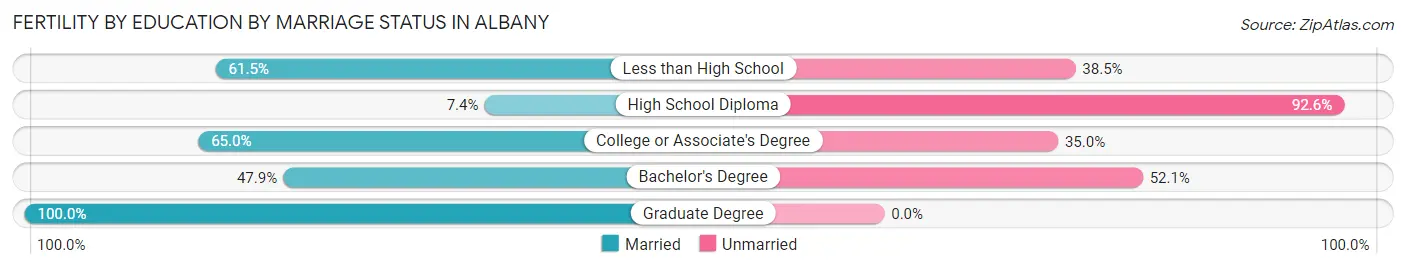
| Educational Attainment | Married | Unmarried |
| Less than High School | 198 (61.5%) | 124 (38.5%) |
| High School Diploma | 16 (7.4%) | 201 (92.6%) |
| College or Associate's Degree | 117 (65.0%) | 63 (35.0%) |
| Bachelor's Degree | 81 (47.9%) | 88 (52.1%) |
| Graduate Degree | 259 (100.0%) | 0 (0.0%) |
| Total | 671 (58.5%) | 476 (41.5%) |
Employment Characteristics in Albany
Employment by Class of Employer in Albany
Among the 49,364 employed individuals in Albany, private company employees (26,886 | 54.5%), not-for-profit organizations (7,930 | 16.1%), and state government employees (7,706 | 15.6%) make up the most common classes of employment.
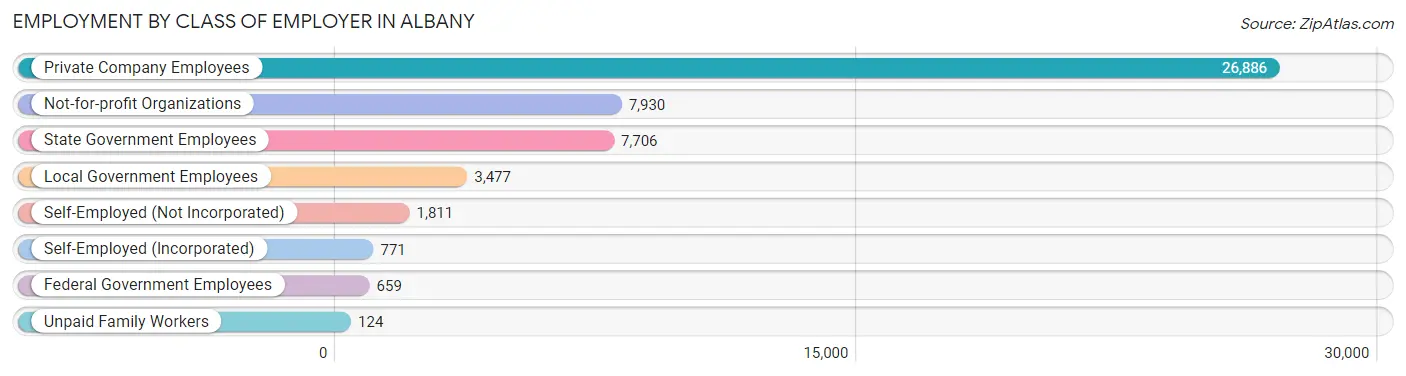
| Employer Class | # Employees | % Employees |
| Private Company Employees | 26,886 | 54.5% |
| Self-Employed (Incorporated) | 771 | 1.6% |
| Self-Employed (Not Incorporated) | 1,811 | 3.7% |
| Not-for-profit Organizations | 7,930 | 16.1% |
| Local Government Employees | 3,477 | 7.0% |
| State Government Employees | 7,706 | 15.6% |
| Federal Government Employees | 659 | 1.3% |
| Unpaid Family Workers | 124 | 0.3% |
| Total | 49,364 | 100.0% |
Employment Status by Age in Albany
According to the labor force statistics for Albany, out of the total population over 16 years of age (86,574), 64.0% or 55,407 individuals are in the labor force, with 8.0% or 4,433 of them unemployed. The age group with the highest labor force participation rate is 30 to 34 years, with 87.7% or 6,466 individuals in the labor force. Within the labor force, the 16 to 19 years age range has the highest percentage of unemployed individuals, with 27.3% or 836 of them being unemployed.
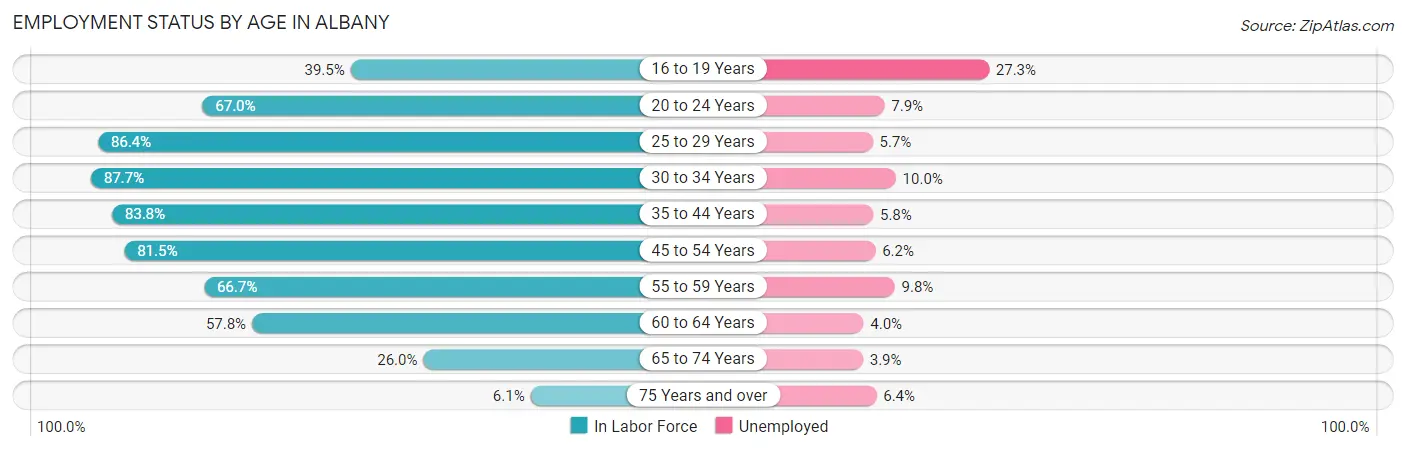
| Age Bracket | In Labor Force | Unemployed |
| 16 to 19 Years | 3,061 (39.5%) | 836 (27.3%) |
| 20 to 24 Years | 10,940 (67.0%) | 864 (7.9%) |
| 25 to 29 Years | 8,057 (86.4%) | 459 (5.7%) |
| 30 to 34 Years | 6,466 (87.7%) | 647 (10.0%) |
| 35 to 44 Years | 9,824 (83.8%) | 570 (5.8%) |
| 45 to 54 Years | 8,337 (81.5%) | 517 (6.2%) |
| 55 to 59 Years | 3,466 (66.7%) | 340 (9.8%) |
| 60 to 64 Years | 2,893 (57.8%) | 116 (4.0%) |
| 65 to 74 Years | 2,013 (26.0%) | 79 (3.9%) |
| 75 Years and over | 360 (6.1%) | 23 (6.4%) |
| Total | 55,407 (64.0%) | 4,433 (8.0%) |
Employment Status by Educational Attainment in Albany
According to labor force statistics for Albany, 79.9% of individuals (39,034) out of the total population between 25 and 64 years of age (48,853) are in the labor force, with 6.8% or 2,654 of them being unemployed. The group with the highest labor force participation rate are those with the educational attainment of bachelor's degree or higher, with 89.9% or 19,337 individuals in the labor force. Within the labor force, individuals with less than high school education have the highest percentage of unemployment, with 22.8% or 712 of them being unemployed.
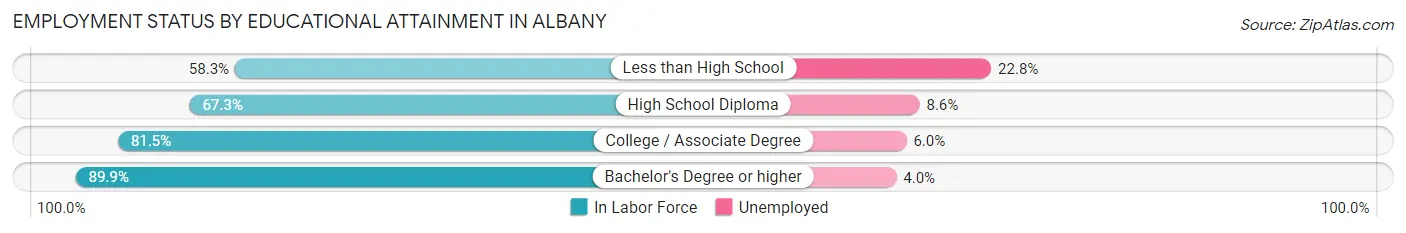
| Educational Attainment | In Labor Force | Unemployed |
| Less than High School | 3,123 (58.3%) | 1,221 (22.8%) |
| High School Diploma | 6,328 (67.3%) | 809 (8.6%) |
| College / Associate Degree | 10,256 (81.5%) | 755 (6.0%) |
| Bachelor's Degree or higher | 19,337 (89.9%) | 860 (4.0%) |
| Total | 39,034 (79.9%) | 3,322 (6.8%) |
Employment Occupations by Sex in Albany
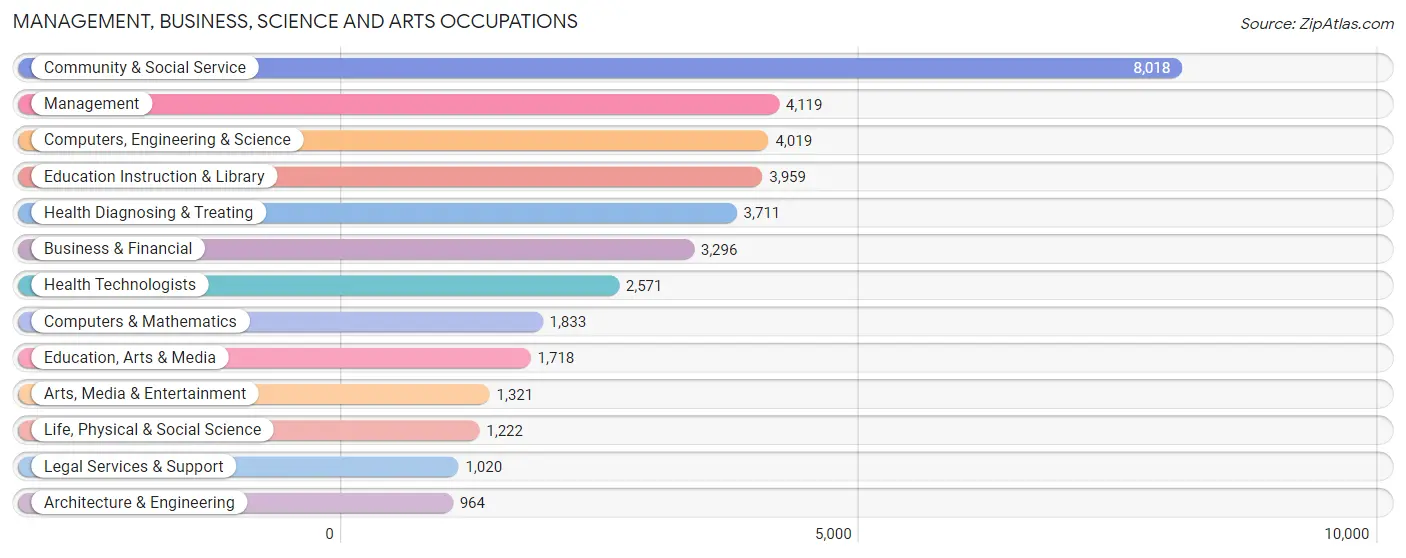
Management, Business, Science and Arts Occupations
The most common Management, Business, Science and Arts occupations in Albany are Community & Social Service (8,018 | 15.7%), Management (4,119 | 8.1%), Computers, Engineering & Science (4,019 | 7.9%), Education Instruction & Library (3,959 | 7.8%), and Health Diagnosing & Treating (3,711 | 7.3%).
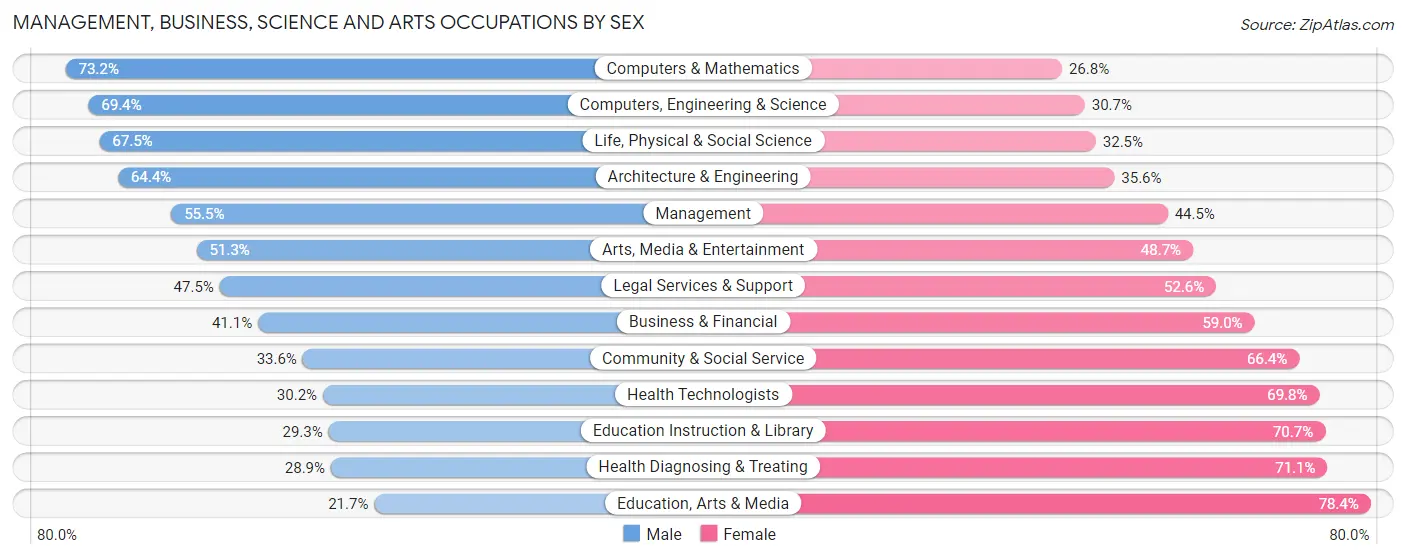
Management, Business, Science and Arts Occupations by Sex
Within the Management, Business, Science and Arts occupations in Albany, the most male-oriented occupations are Computers & Mathematics (73.2%), Computers, Engineering & Science (69.4%), and Life, Physical & Social Science (67.5%), while the most female-oriented occupations are Education, Arts & Media (78.3%), Health Diagnosing & Treating (71.1%), and Education Instruction & Library (70.7%).
| Occupation | Male | Female |
| Management | 2,287 (55.5%) | 1,832 (44.5%) |
| Business & Financial | 1,353 (41.0%) | 1,943 (59.0%) |
| Computers, Engineering & Science | 2,787 (69.4%) | 1,232 (30.6%) |
| Computers & Mathematics | 1,341 (73.2%) | 492 (26.8%) |
| Architecture & Engineering | 621 (64.4%) | 343 (35.6%) |
| Life, Physical & Social Science | 825 (67.5%) | 397 (32.5%) |
| Community & Social Service | 2,693 (33.6%) | 5,325 (66.4%) |
| Education, Arts & Media | 372 (21.6%) | 1,346 (78.3%) |
| Legal Services & Support | 484 (47.4%) | 536 (52.5%) |
| Education Instruction & Library | 1,159 (29.3%) | 2,800 (70.7%) |
| Arts, Media & Entertainment | 678 (51.3%) | 643 (48.7%) |
| Health Diagnosing & Treating | 1,072 (28.9%) | 2,639 (71.1%) |
| Health Technologists | 777 (30.2%) | 1,794 (69.8%) |
| Total (Category) | 10,192 (44.0%) | 12,971 (56.0%) |
| Total (Overall) | 24,293 (47.7%) | 26,638 (52.3%) |
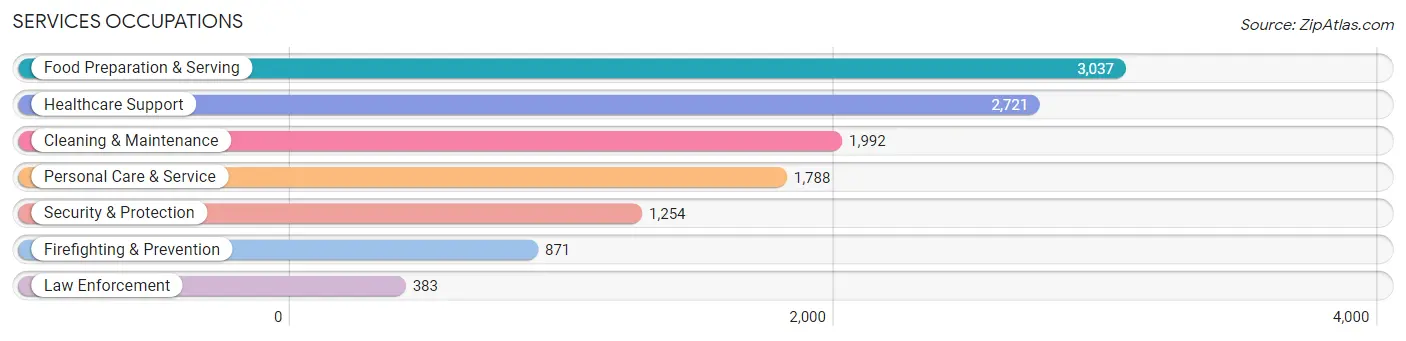
Services Occupations
The most common Services occupations in Albany are Food Preparation & Serving (3,037 | 6.0%), Healthcare Support (2,721 | 5.3%), Cleaning & Maintenance (1,992 | 3.9%), Personal Care & Service (1,788 | 3.5%), and Security & Protection (1,254 | 2.5%).
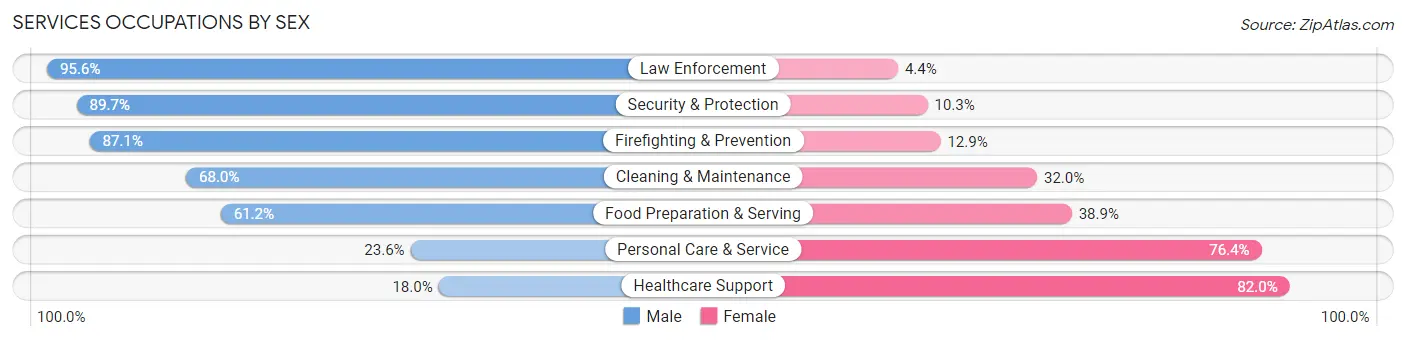
Services Occupations by Sex
Within the Services occupations in Albany, the most male-oriented occupations are Law Enforcement (95.6%), Security & Protection (89.7%), and Firefighting & Prevention (87.1%), while the most female-oriented occupations are Healthcare Support (82.0%), Personal Care & Service (76.4%), and Food Preparation & Serving (38.9%).
| Occupation | Male | Female |
| Healthcare Support | 491 (18.0%) | 2,230 (82.0%) |
| Security & Protection | 1,125 (89.7%) | 129 (10.3%) |
| Firefighting & Prevention | 759 (87.1%) | 112 (12.9%) |
| Law Enforcement | 366 (95.6%) | 17 (4.4%) |
| Food Preparation & Serving | 1,857 (61.2%) | 1,180 (38.9%) |
| Cleaning & Maintenance | 1,355 (68.0%) | 637 (32.0%) |
| Personal Care & Service | 422 (23.6%) | 1,366 (76.4%) |
| Total (Category) | 5,250 (48.6%) | 5,542 (51.3%) |
| Total (Overall) | 24,293 (47.7%) | 26,638 (52.3%) |
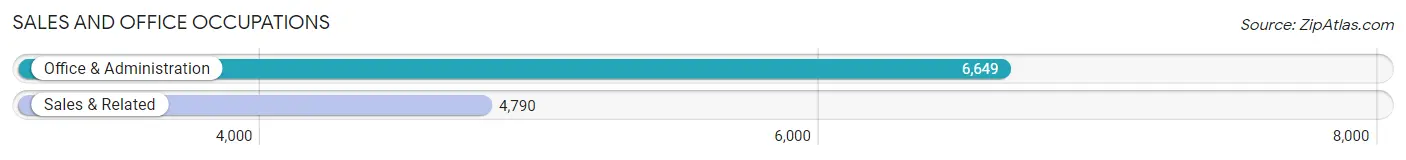
Sales and Office Occupations
The most common Sales and Office occupations in Albany are Office & Administration (6,649 | 13.1%), and Sales & Related (4,790 | 9.4%).
Sales and Office Occupations by Sex
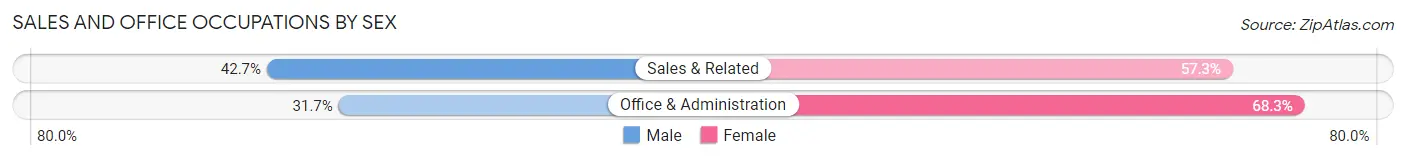
| Occupation | Male | Female |
| Sales & Related | 2,047 (42.7%) | 2,743 (57.3%) |
| Office & Administration | 2,107 (31.7%) | 4,542 (68.3%) |
| Total (Category) | 4,154 (36.3%) | 7,285 (63.7%) |
| Total (Overall) | 24,293 (47.7%) | 26,638 (52.3%) |
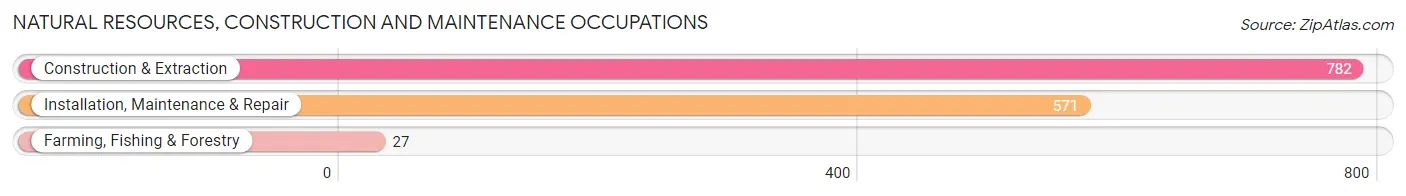
Natural Resources, Construction and Maintenance Occupations
The most common Natural Resources, Construction and Maintenance occupations in Albany are Construction & Extraction (782 | 1.5%), Installation, Maintenance & Repair (571 | 1.1%), and Farming, Fishing & Forestry (27 | 0.1%).
Natural Resources, Construction and Maintenance Occupations by Sex
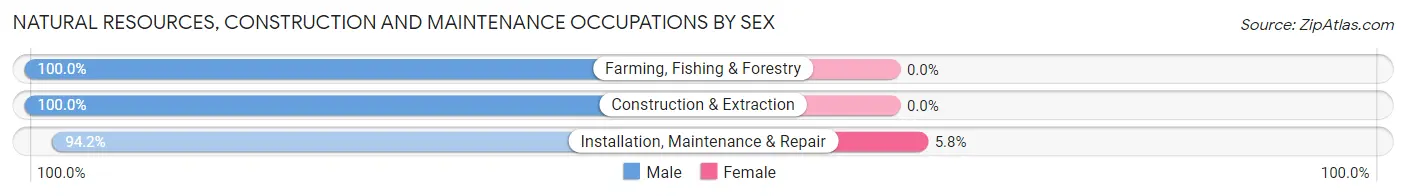
| Occupation | Male | Female |
| Farming, Fishing & Forestry | 27 (100.0%) | 0 (0.0%) |
| Construction & Extraction | 782 (100.0%) | 0 (0.0%) |
| Installation, Maintenance & Repair | 538 (94.2%) | 33 (5.8%) |
| Total (Category) | 1,347 (97.6%) | 33 (2.4%) |
| Total (Overall) | 24,293 (47.7%) | 26,638 (52.3%) |
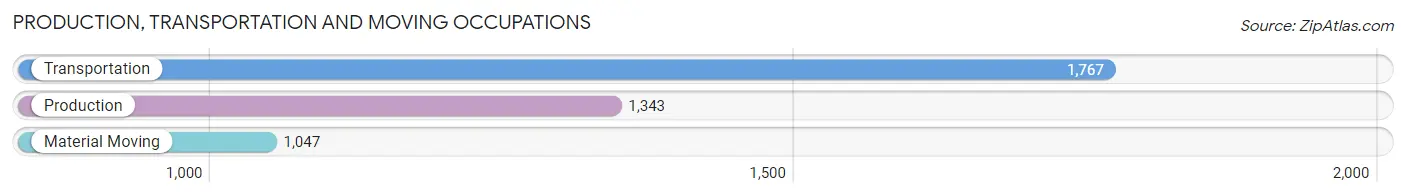
Production, Transportation and Moving Occupations
The most common Production, Transportation and Moving occupations in Albany are Transportation (1,767 | 3.5%), Production (1,343 | 2.6%), and Material Moving (1,047 | 2.1%).
Production, Transportation and Moving Occupations by Sex
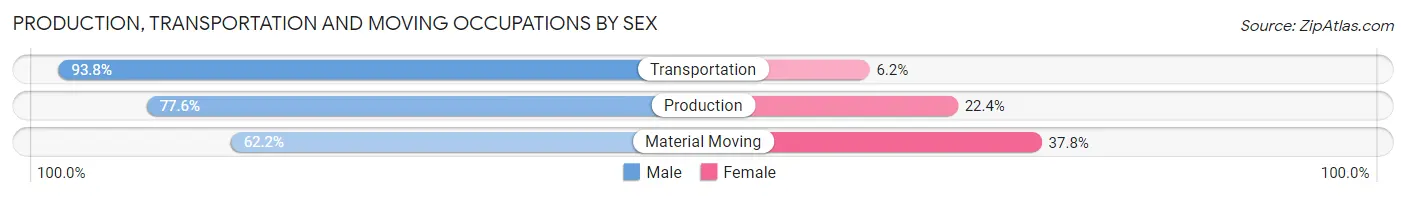
| Occupation | Male | Female |
| Production | 1,042 (77.6%) | 301 (22.4%) |
| Transportation | 1,657 (93.8%) | 110 (6.2%) |
| Material Moving | 651 (62.2%) | 396 (37.8%) |
| Total (Category) | 3,350 (80.6%) | 807 (19.4%) |
| Total (Overall) | 24,293 (47.7%) | 26,638 (52.3%) |
Employment Industries by Sex in Albany
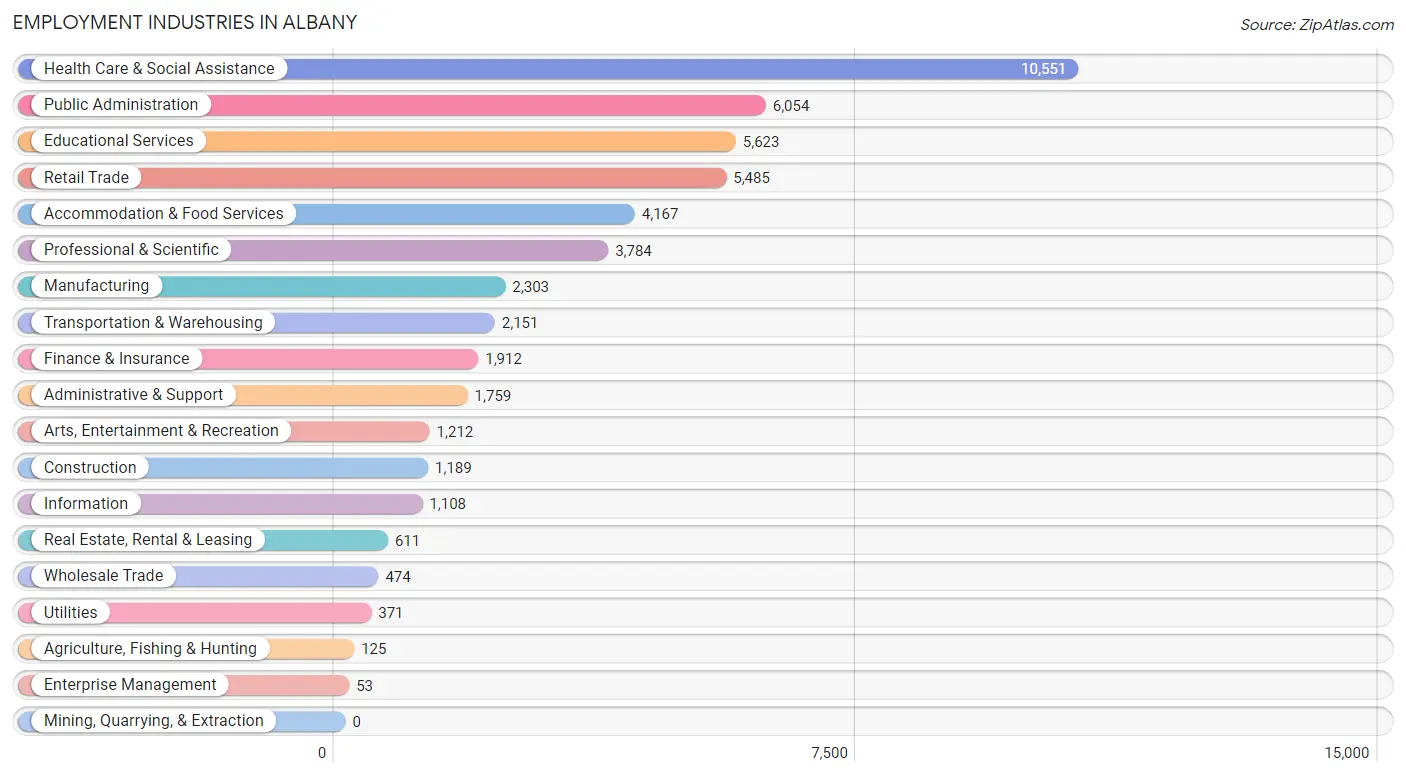
Employment Industries in Albany
The major employment industries in Albany include Health Care & Social Assistance (10,551 | 20.7%), Public Administration (6,054 | 11.9%), Educational Services (5,623 | 11.0%), Retail Trade (5,485 | 10.8%), and Accommodation & Food Services (4,167 | 8.2%).
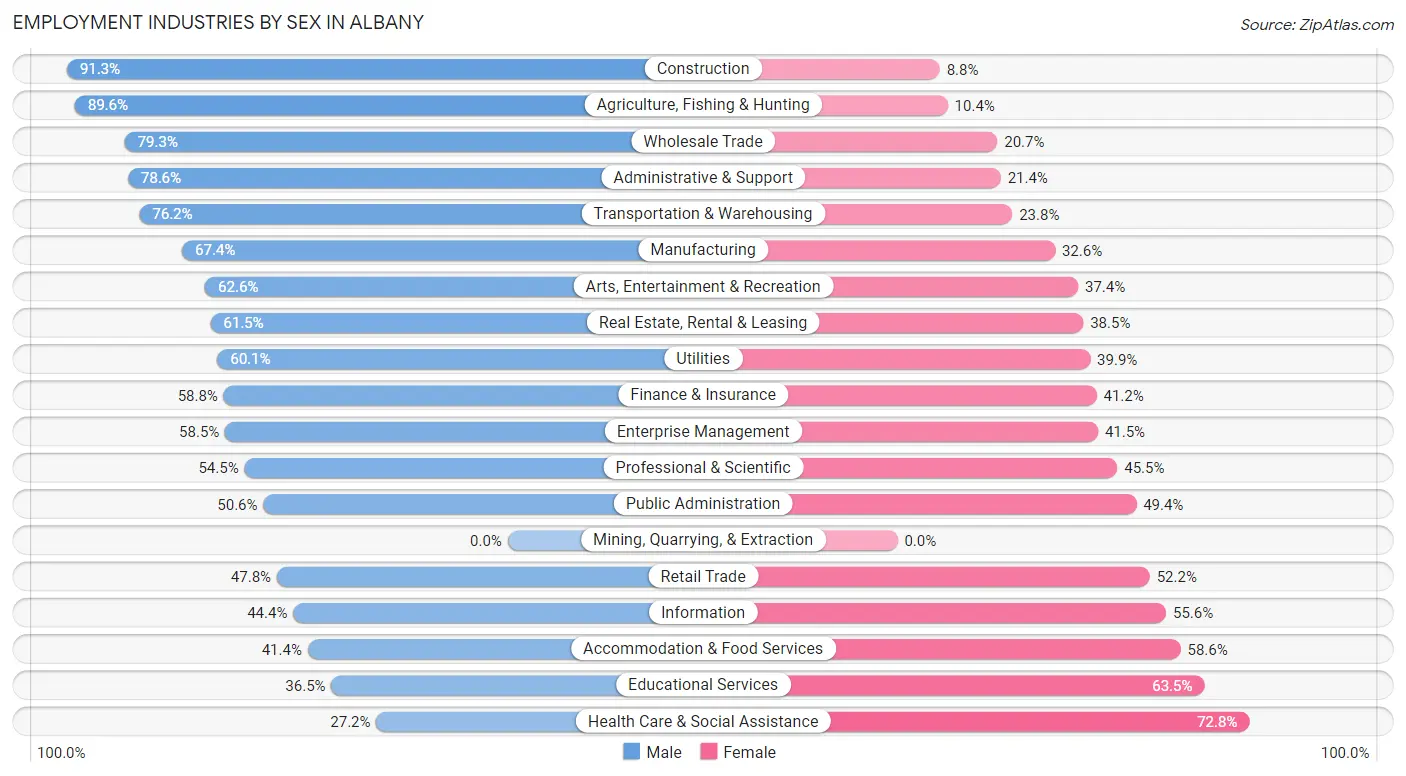
Employment Industries by Sex in Albany
The Albany industries that see more men than women are Construction (91.2%), Agriculture, Fishing & Hunting (89.6%), and Wholesale Trade (79.3%), whereas the industries that tend to have a higher number of women are Health Care & Social Assistance (72.8%), Educational Services (63.5%), and Accommodation & Food Services (58.6%).
| Industry | Male | Female |
| Agriculture, Fishing & Hunting | 112 (89.6%) | 13 (10.4%) |
| Mining, Quarrying, & Extraction | 0 (0.0%) | 0 (0.0%) |
| Construction | 1,085 (91.2%) | 104 (8.7%) |
| Manufacturing | 1,552 (67.4%) | 751 (32.6%) |
| Wholesale Trade | 376 (79.3%) | 98 (20.7%) |
| Retail Trade | 2,621 (47.8%) | 2,864 (52.2%) |
| Transportation & Warehousing | 1,640 (76.2%) | 511 (23.8%) |
| Utilities | 223 (60.1%) | 148 (39.9%) |
| Information | 492 (44.4%) | 616 (55.6%) |
| Finance & Insurance | 1,124 (58.8%) | 788 (41.2%) |
| Real Estate, Rental & Leasing | 376 (61.5%) | 235 (38.5%) |
| Professional & Scientific | 2,062 (54.5%) | 1,722 (45.5%) |
| Enterprise Management | 31 (58.5%) | 22 (41.5%) |
| Administrative & Support | 1,383 (78.6%) | 376 (21.4%) |
| Educational Services | 2,052 (36.5%) | 3,571 (63.5%) |
| Health Care & Social Assistance | 2,869 (27.2%) | 7,682 (72.8%) |
| Arts, Entertainment & Recreation | 759 (62.6%) | 453 (37.4%) |
| Accommodation & Food Services | 1,725 (41.4%) | 2,442 (58.6%) |
| Public Administration | 3,062 (50.6%) | 2,992 (49.4%) |
| Total | 24,293 (47.7%) | 26,638 (52.3%) |
Education in Albany
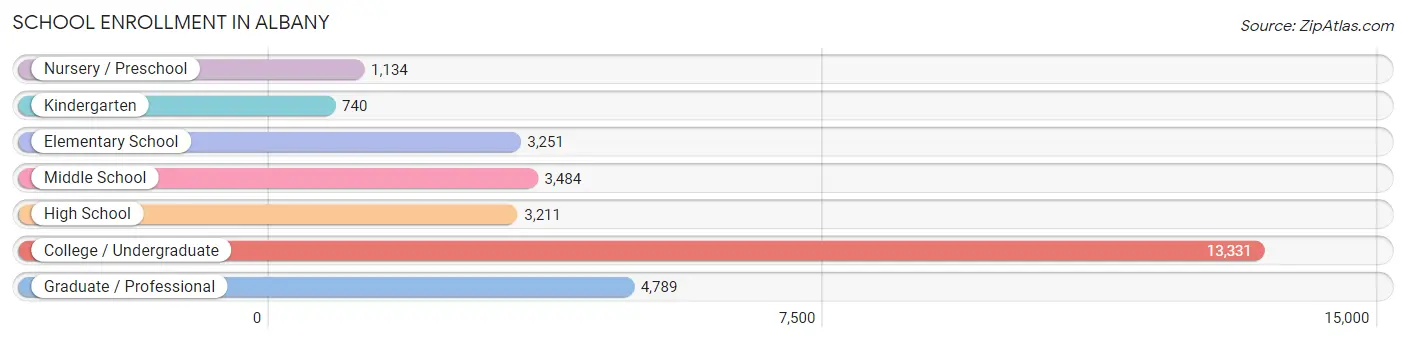
School Enrollment in Albany
The most common levels of schooling among the 29,940 students in Albany are college / undergraduate (13,331 | 44.5%), graduate / professional (4,789 | 16.0%), and middle school (3,484 | 11.6%).
| School Level | # Students | % Students |
| Nursery / Preschool | 1,134 | 3.8% |
| Kindergarten | 740 | 2.5% |
| Elementary School | 3,251 | 10.9% |
| Middle School | 3,484 | 11.6% |
| High School | 3,211 | 10.7% |
| College / Undergraduate | 13,331 | 44.5% |
| Graduate / Professional | 4,789 | 16.0% |
| Total | 29,940 | 100.0% |
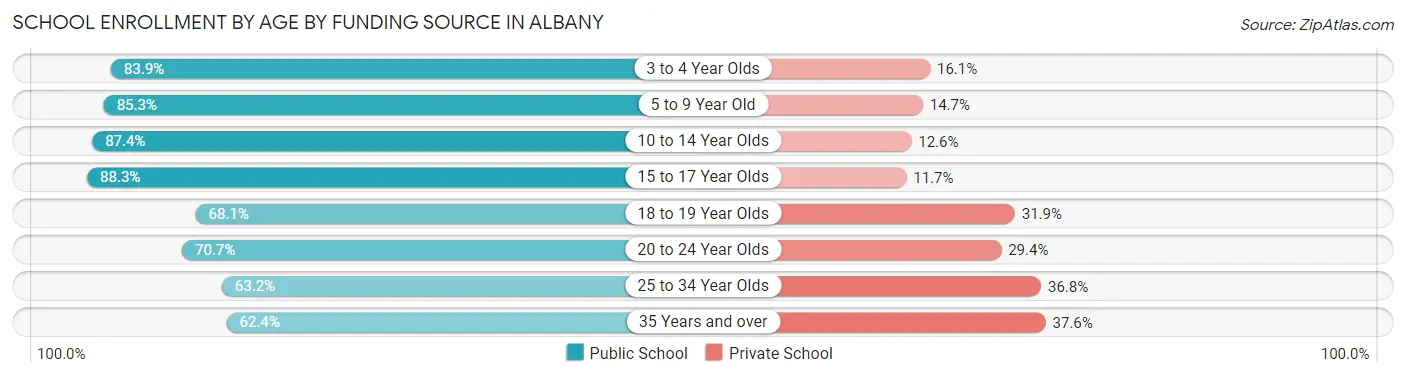
School Enrollment by Age by Funding Source in Albany
Out of a total of 29,940 students who are enrolled in schools in Albany, 7,395 (24.7%) attend a private institution, while the remaining 22,545 (75.3%) are enrolled in public schools. The age group of 35 years and over has the highest likelihood of being enrolled in private schools, with 358 (37.6% in the age bracket) enrolled. Conversely, the age group of 15 to 17 year olds has the lowest likelihood of being enrolled in a private school, with 2,181 (88.3% in the age bracket) attending a public institution.
| Age Bracket | Public School | Private School |
| 3 to 4 Year Olds | 830 (83.9%) | 159 (16.1%) |
| 5 to 9 Year Old | 3,356 (85.3%) | 580 (14.7%) |
| 10 to 14 Year Olds | 3,386 (87.4%) | 488 (12.6%) |
| 15 to 17 Year Olds | 2,181 (88.3%) | 288 (11.7%) |
| 18 to 19 Year Olds | 3,585 (68.1%) | 1,677 (31.9%) |
| 20 to 24 Year Olds | 6,918 (70.7%) | 2,874 (29.3%) |
| 25 to 34 Year Olds | 1,686 (63.2%) | 980 (36.8%) |
| 35 Years and over | 594 (62.4%) | 358 (37.6%) |
| Total | 22,545 (75.3%) | 7,395 (24.7%) |
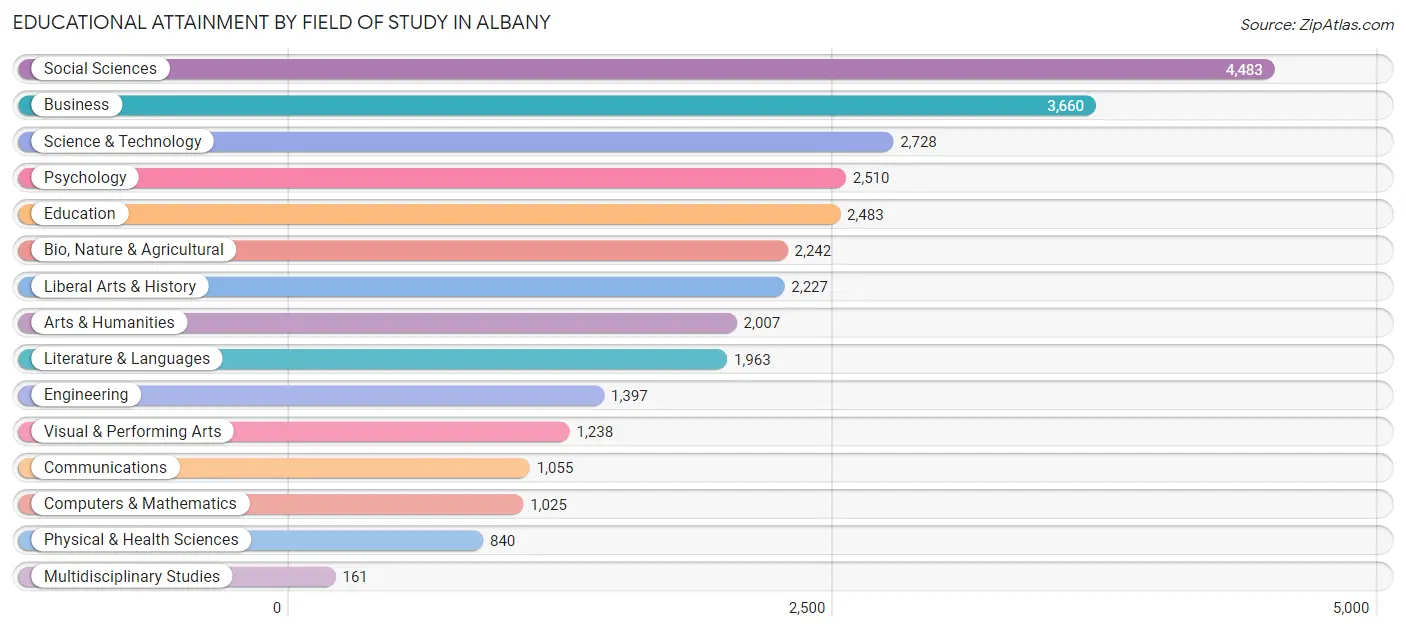
Educational Attainment by Field of Study in Albany
Social sciences (4,483 | 14.9%), business (3,660 | 12.2%), science & technology (2,728 | 9.1%), psychology (2,510 | 8.4%), and education (2,483 | 8.3%) are the most common fields of study among 30,019 individuals in Albany who have obtained a bachelor's degree or higher.
| Field of Study | # Graduates | % Graduates |
| Computers & Mathematics | 1,025 | 3.4% |
| Bio, Nature & Agricultural | 2,242 | 7.5% |
| Physical & Health Sciences | 840 | 2.8% |
| Psychology | 2,510 | 8.4% |
| Social Sciences | 4,483 | 14.9% |
| Engineering | 1,397 | 4.6% |
| Multidisciplinary Studies | 161 | 0.5% |
| Science & Technology | 2,728 | 9.1% |
| Business | 3,660 | 12.2% |
| Education | 2,483 | 8.3% |
| Literature & Languages | 1,963 | 6.5% |
| Liberal Arts & History | 2,227 | 7.4% |
| Visual & Performing Arts | 1,238 | 4.1% |
| Communications | 1,055 | 3.5% |
| Arts & Humanities | 2,007 | 6.7% |
| Total | 30,019 | 100.0% |
Transportation & Commute in Albany
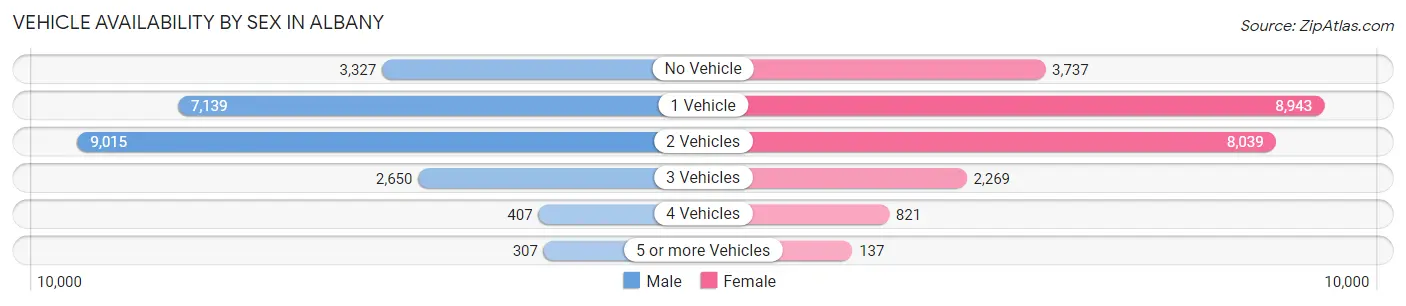
Vehicle Availability by Sex in Albany
The most prevalent vehicle ownership categories in Albany are males with 2 vehicles (9,015, accounting for 39.5%) and females with 2 vehicles (8,039, making up 37.7%).
| Vehicles Available | Male | Female |
| No Vehicle | 3,327 (14.6%) | 3,737 (15.6%) |
| 1 Vehicle | 7,139 (31.2%) | 8,943 (37.3%) |
| 2 Vehicles | 9,015 (39.5%) | 8,039 (33.6%) |
| 3 Vehicles | 2,650 (11.6%) | 2,269 (9.5%) |
| 4 Vehicles | 407 (1.8%) | 821 (3.4%) |
| 5 or more Vehicles | 307 (1.3%) | 137 (0.6%) |
| Total | 22,845 (100.0%) | 23,946 (100.0%) |
Commute Time in Albany
The most frequently occuring commute durations in Albany are 15 to 19 minutes (10,422 commuters, 23.7%), 10 to 14 minutes (9,428 commuters, 21.5%), and 20 to 24 minutes (7,317 commuters, 16.7%).
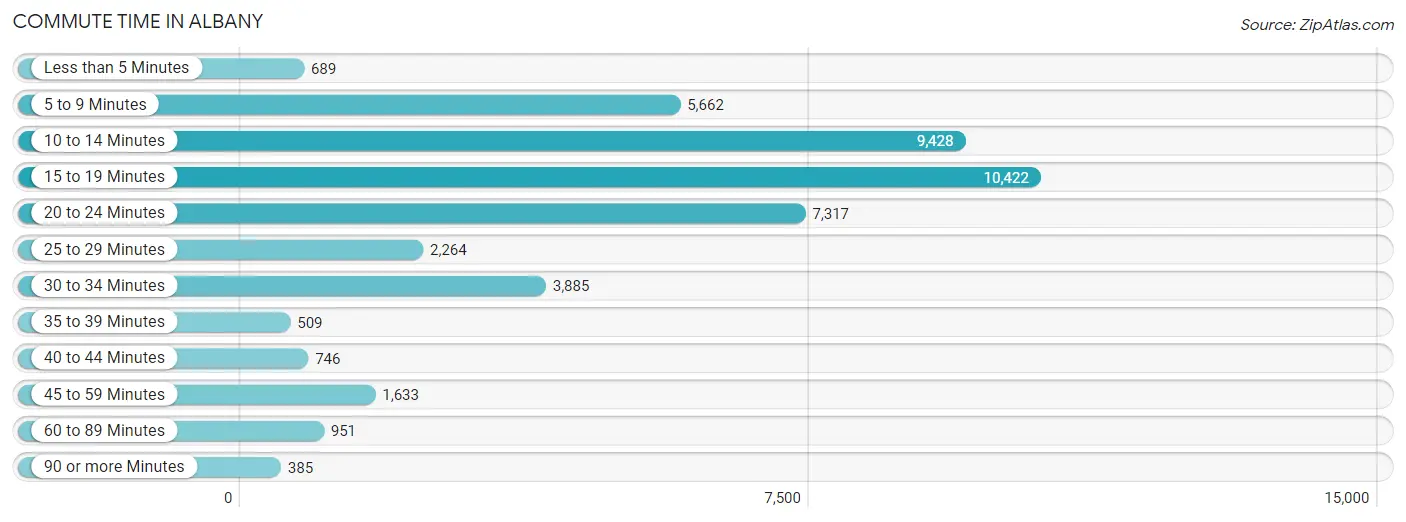
| Commute Time | # Commuters | % Commuters |
| Less than 5 Minutes | 689 | 1.6% |
| 5 to 9 Minutes | 5,662 | 12.9% |
| 10 to 14 Minutes | 9,428 | 21.5% |
| 15 to 19 Minutes | 10,422 | 23.7% |
| 20 to 24 Minutes | 7,317 | 16.7% |
| 25 to 29 Minutes | 2,264 | 5.2% |
| 30 to 34 Minutes | 3,885 | 8.8% |
| 35 to 39 Minutes | 509 | 1.2% |
| 40 to 44 Minutes | 746 | 1.7% |
| 45 to 59 Minutes | 1,633 | 3.7% |
| 60 to 89 Minutes | 951 | 2.2% |
| 90 or more Minutes | 385 | 0.9% |
Commute Time by Sex in Albany
The most common commute times in Albany are 15 to 19 minutes (6,014 commuters, 28.6%) for males and 10 to 14 minutes (6,007 commuters, 26.3%) for females.
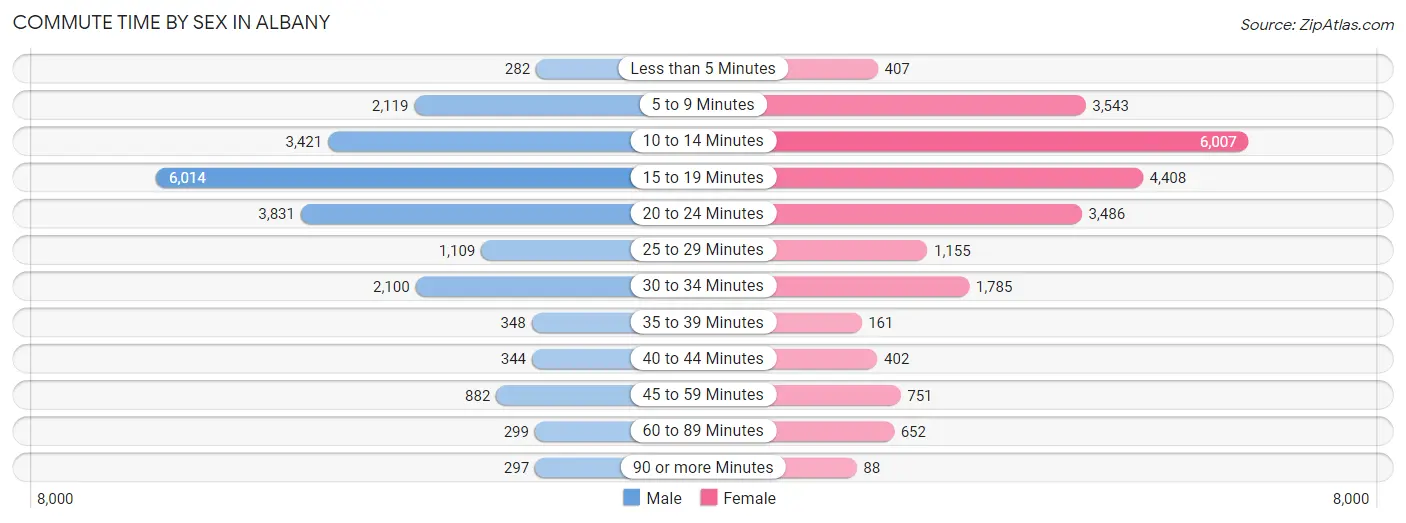
| Commute Time | Male | Female |
| Less than 5 Minutes | 282 (1.3%) | 407 (1.8%) |
| 5 to 9 Minutes | 2,119 (10.1%) | 3,543 (15.5%) |
| 10 to 14 Minutes | 3,421 (16.3%) | 6,007 (26.3%) |
| 15 to 19 Minutes | 6,014 (28.6%) | 4,408 (19.3%) |
| 20 to 24 Minutes | 3,831 (18.2%) | 3,486 (15.3%) |
| 25 to 29 Minutes | 1,109 (5.3%) | 1,155 (5.1%) |
| 30 to 34 Minutes | 2,100 (10.0%) | 1,785 (7.8%) |
| 35 to 39 Minutes | 348 (1.7%) | 161 (0.7%) |
| 40 to 44 Minutes | 344 (1.6%) | 402 (1.8%) |
| 45 to 59 Minutes | 882 (4.2%) | 751 (3.3%) |
| 60 to 89 Minutes | 299 (1.4%) | 652 (2.9%) |
| 90 or more Minutes | 297 (1.4%) | 88 (0.4%) |
Time of Departure to Work by Sex in Albany
The most frequent times of departure to work in Albany are 8:00 AM to 8:29 AM (2,693, 12.8%) for males and 8:00 AM to 8:29 AM (3,495, 15.3%) for females.
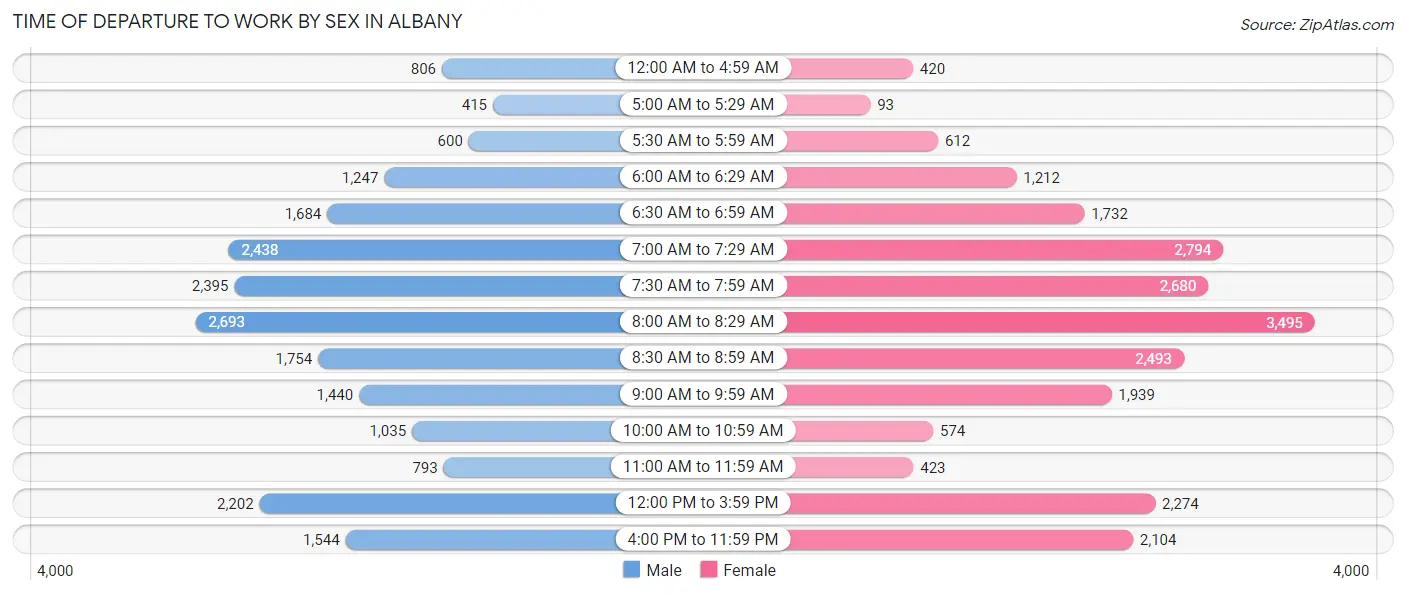
| Time of Departure | Male | Female |
| 12:00 AM to 4:59 AM | 806 (3.8%) | 420 (1.8%) |
| 5:00 AM to 5:29 AM | 415 (2.0%) | 93 (0.4%) |
| 5:30 AM to 5:59 AM | 600 (2.9%) | 612 (2.7%) |
| 6:00 AM to 6:29 AM | 1,247 (5.9%) | 1,212 (5.3%) |
| 6:30 AM to 6:59 AM | 1,684 (8.0%) | 1,732 (7.6%) |
| 7:00 AM to 7:29 AM | 2,438 (11.6%) | 2,794 (12.2%) |
| 7:30 AM to 7:59 AM | 2,395 (11.4%) | 2,680 (11.7%) |
| 8:00 AM to 8:29 AM | 2,693 (12.8%) | 3,495 (15.3%) |
| 8:30 AM to 8:59 AM | 1,754 (8.3%) | 2,493 (10.9%) |
| 9:00 AM to 9:59 AM | 1,440 (6.8%) | 1,939 (8.5%) |
| 10:00 AM to 10:59 AM | 1,035 (4.9%) | 574 (2.5%) |
| 11:00 AM to 11:59 AM | 793 (3.8%) | 423 (1.8%) |
| 12:00 PM to 3:59 PM | 2,202 (10.5%) | 2,274 (10.0%) |
| 4:00 PM to 11:59 PM | 1,544 (7.3%) | 2,104 (9.2%) |
| Total | 21,046 (100.0%) | 22,845 (100.0%) |
Housing Occupancy in Albany
Occupancy by Ownership in Albany
Of the total 43,435 dwellings in Albany, owner-occupied units account for 15,961 (36.7%), while renter-occupied units make up 27,474 (63.2%).
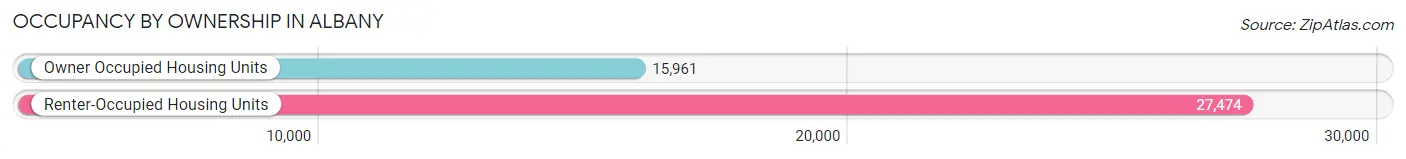
| Occupancy | # Housing Units | % Housing Units |
| Owner Occupied Housing Units | 15,961 | 36.7% |
| Renter-Occupied Housing Units | 27,474 | 63.2% |
| Total Occupied Housing Units | 43,435 | 100.0% |
Occupancy by Household Size in Albany
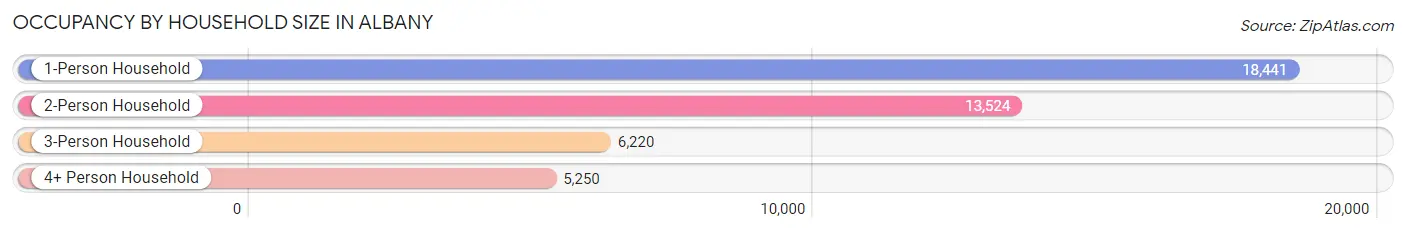
| Household Size | # Housing Units | % Housing Units |
| 1-Person Household | 18,441 | 42.5% |
| 2-Person Household | 13,524 | 31.1% |
| 3-Person Household | 6,220 | 14.3% |
| 4+ Person Household | 5,250 | 12.1% |
| Total Housing Units | 43,435 | 100.0% |
Occupancy by Ownership by Household Size in Albany
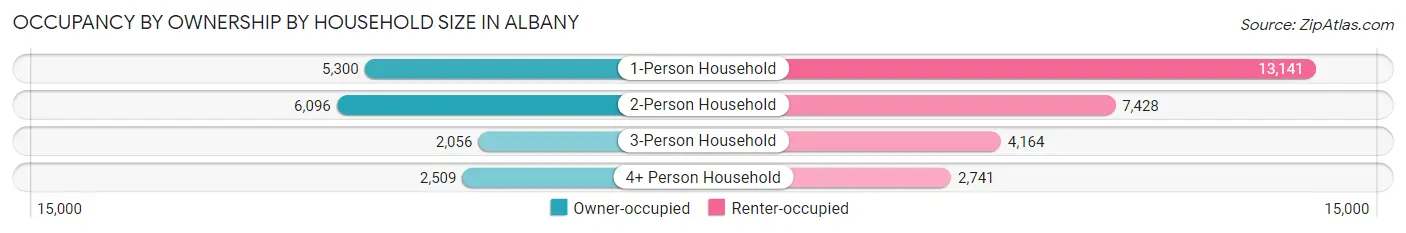
| Household Size | Owner-occupied | Renter-occupied |
| 1-Person Household | 5,300 (28.7%) | 13,141 (71.3%) |
| 2-Person Household | 6,096 (45.1%) | 7,428 (54.9%) |
| 3-Person Household | 2,056 (33.1%) | 4,164 (66.9%) |
| 4+ Person Household | 2,509 (47.8%) | 2,741 (52.2%) |
| Total Housing Units | 15,961 (36.7%) | 27,474 (63.2%) |
Occupancy by Educational Attainment in Albany
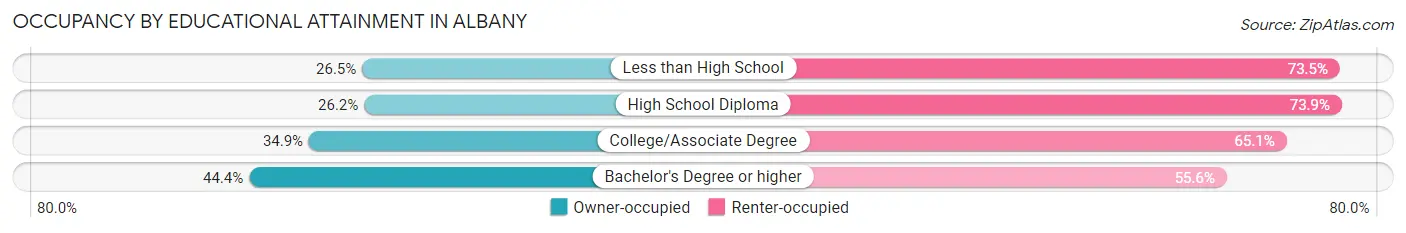
| Household Size | Owner-occupied | Renter-occupied |
| Less than High School | 1,052 (26.5%) | 2,923 (73.5%) |
| High School Diploma | 2,194 (26.2%) | 6,197 (73.9%) |
| College/Associate Degree | 3,966 (34.9%) | 7,399 (65.1%) |
| Bachelor's Degree or higher | 8,749 (44.4%) | 10,955 (55.6%) |
Occupancy by Age of Householder in Albany
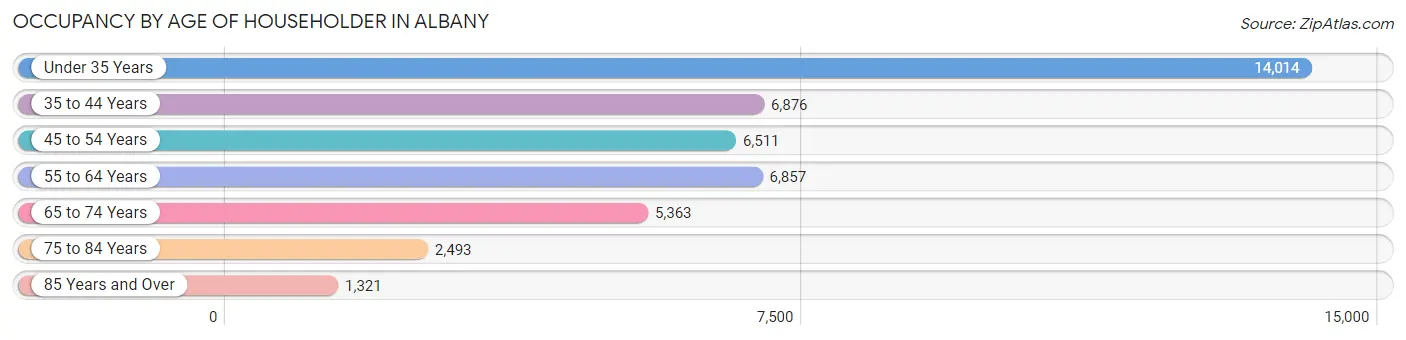
| Age Bracket | # Households | % Households |
| Under 35 Years | 14,014 | 32.3% |
| 35 to 44 Years | 6,876 | 15.8% |
| 45 to 54 Years | 6,511 | 15.0% |
| 55 to 64 Years | 6,857 | 15.8% |
| 65 to 74 Years | 5,363 | 12.3% |
| 75 to 84 Years | 2,493 | 5.7% |
| 85 Years and Over | 1,321 | 3.0% |
| Total | 43,435 | 100.0% |
Housing Finances in Albany
Median Income by Occupancy in Albany
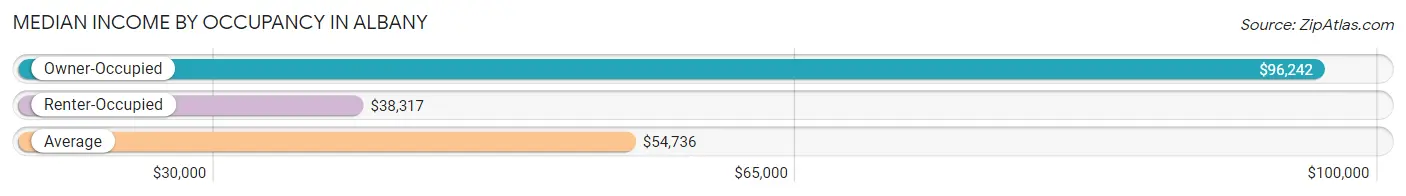
| Occupancy Type | # Households | Median Income |
| Owner-Occupied | 15,961 (36.7%) | $96,242 |
| Renter-Occupied | 27,474 (63.2%) | $38,317 |
| Average | 43,435 (100.0%) | $54,736 |
Occupancy by Householder Income Bracket in Albany
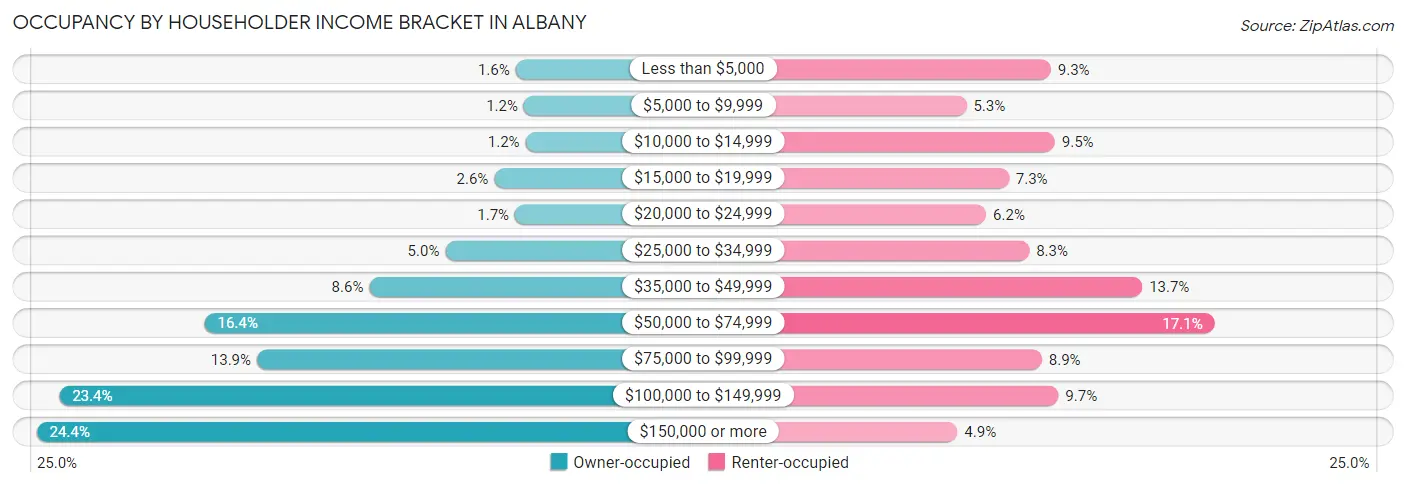
| Income Bracket | Owner-occupied | Renter-occupied |
| Less than $5,000 | 258 (1.6%) | 2,556 (9.3%) |
| $5,000 to $9,999 | 197 (1.2%) | 1,451 (5.3%) |
| $10,000 to $14,999 | 183 (1.1%) | 2,607 (9.5%) |
| $15,000 to $19,999 | 422 (2.6%) | 2,006 (7.3%) |
| $20,000 to $24,999 | 263 (1.7%) | 1,709 (6.2%) |
| $25,000 to $34,999 | 793 (5.0%) | 2,272 (8.3%) |
| $35,000 to $49,999 | 1,371 (8.6%) | 3,751 (13.7%) |
| $50,000 to $74,999 | 2,623 (16.4%) | 4,696 (17.1%) |
| $75,000 to $99,999 | 2,225 (13.9%) | 2,438 (8.9%) |
| $100,000 to $149,999 | 3,727 (23.4%) | 2,655 (9.7%) |
| $150,000 or more | 3,899 (24.4%) | 1,333 (4.9%) |
| Total | 15,961 (100.0%) | 27,474 (100.0%) |
Monthly Housing Cost Tiers in Albany
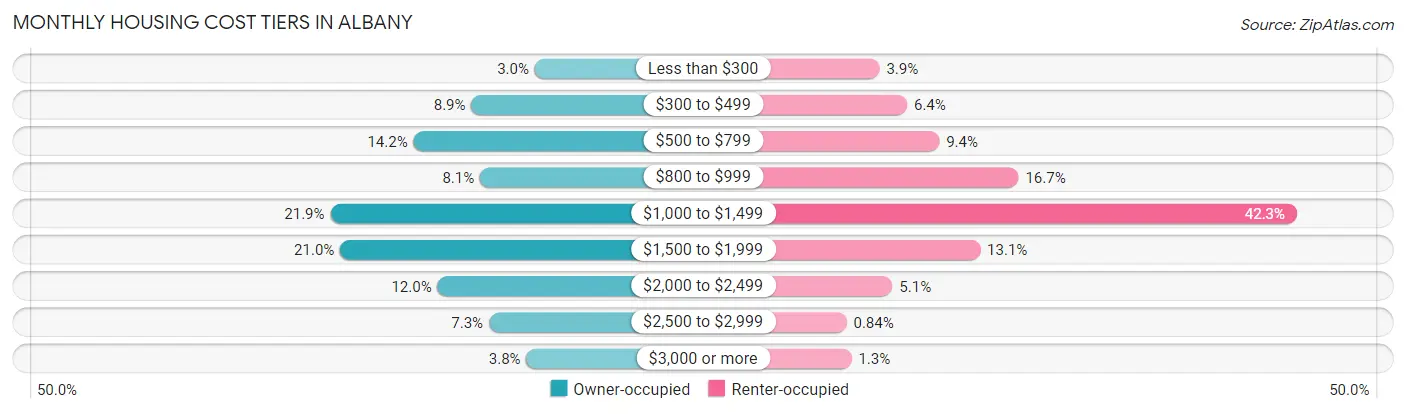
| Monthly Cost | Owner-occupied | Renter-occupied |
| Less than $300 | 484 (3.0%) | 1,063 (3.9%) |
| $300 to $499 | 1,415 (8.9%) | 1,760 (6.4%) |
| $500 to $799 | 2,266 (14.2%) | 2,574 (9.4%) |
| $800 to $999 | 1,288 (8.1%) | 4,579 (16.7%) |
| $1,000 to $1,499 | 3,487 (21.8%) | 11,618 (42.3%) |
| $1,500 to $1,999 | 3,344 (20.9%) | 3,611 (13.1%) |
| $2,000 to $2,499 | 1,914 (12.0%) | 1,389 (5.1%) |
| $2,500 to $2,999 | 1,157 (7.2%) | 232 (0.8%) |
| $3,000 or more | 606 (3.8%) | 354 (1.3%) |
| Total | 15,961 (100.0%) | 27,474 (100.0%) |
Physical Housing Characteristics in Albany
Housing Structures in Albany
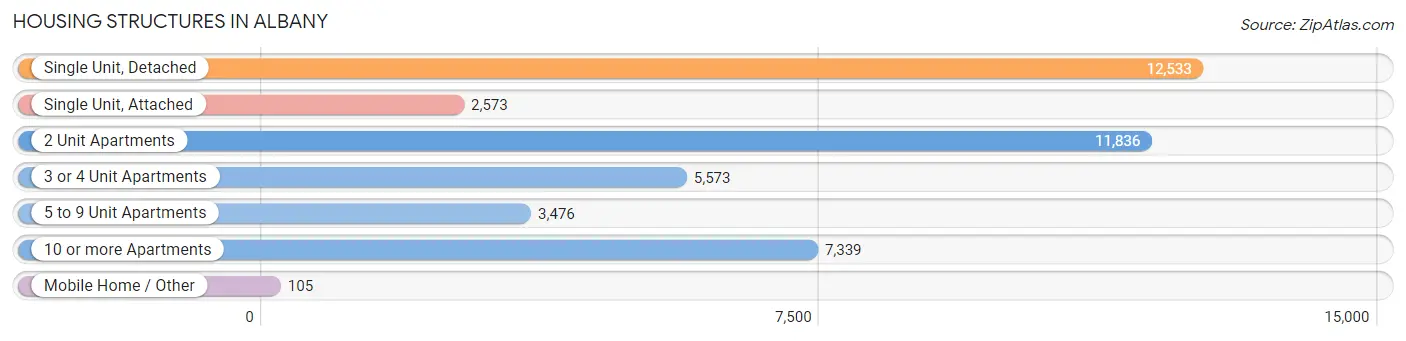
| Structure Type | # Housing Units | % Housing Units |
| Single Unit, Detached | 12,533 | 28.8% |
| Single Unit, Attached | 2,573 | 5.9% |
| 2 Unit Apartments | 11,836 | 27.3% |
| 3 or 4 Unit Apartments | 5,573 | 12.8% |
| 5 to 9 Unit Apartments | 3,476 | 8.0% |
| 10 or more Apartments | 7,339 | 16.9% |
| Mobile Home / Other | 105 | 0.2% |
| Total | 43,435 | 100.0% |
Housing Structures by Occupancy in Albany
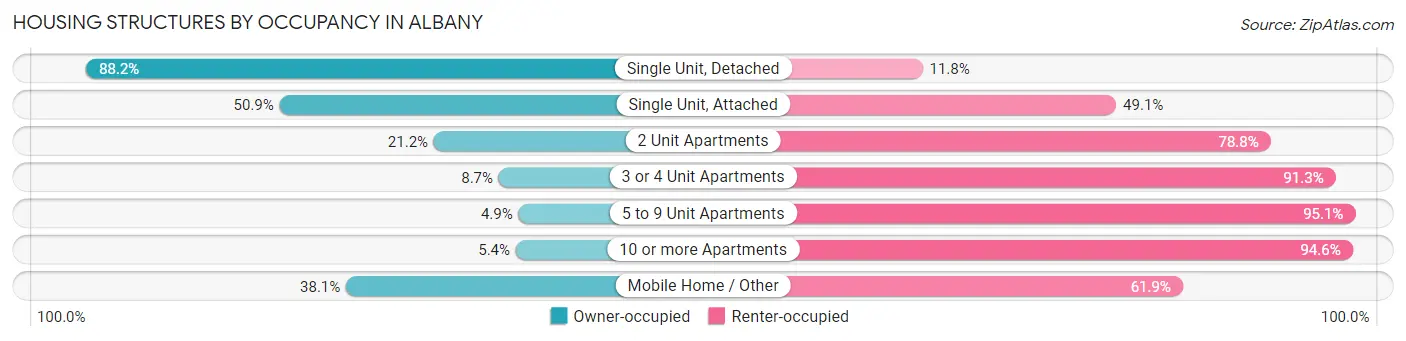
| Structure Type | Owner-occupied | Renter-occupied |
| Single Unit, Detached | 11,052 (88.2%) | 1,481 (11.8%) |
| Single Unit, Attached | 1,310 (50.9%) | 1,263 (49.1%) |
| 2 Unit Apartments | 2,508 (21.2%) | 9,328 (78.8%) |
| 3 or 4 Unit Apartments | 484 (8.7%) | 5,089 (91.3%) |
| 5 to 9 Unit Apartments | 170 (4.9%) | 3,306 (95.1%) |
| 10 or more Apartments | 397 (5.4%) | 6,942 (94.6%) |
| Mobile Home / Other | 40 (38.1%) | 65 (61.9%) |
| Total | 15,961 (36.7%) | 27,474 (63.2%) |
Housing Structures by Number of Rooms in Albany
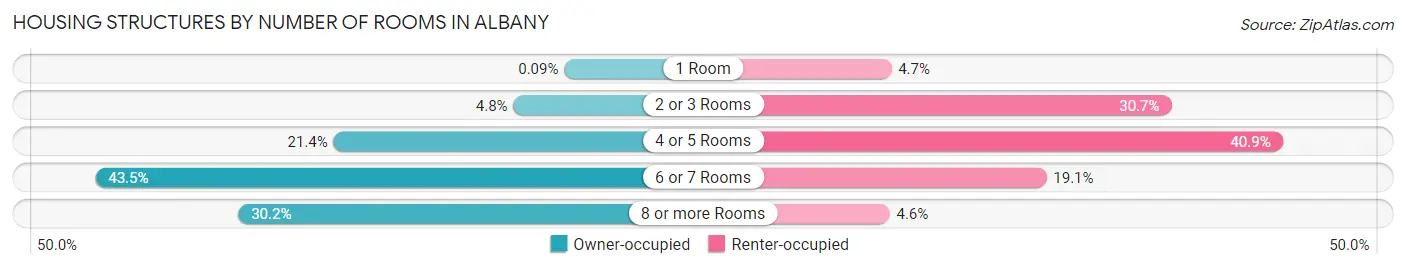
| Number of Rooms | Owner-occupied | Renter-occupied |
| 1 Room | 14 (0.1%) | 1,303 (4.7%) |
| 2 or 3 Rooms | 764 (4.8%) | 8,421 (30.6%) |
| 4 or 5 Rooms | 3,421 (21.4%) | 11,245 (40.9%) |
| 6 or 7 Rooms | 6,936 (43.5%) | 5,244 (19.1%) |
| 8 or more Rooms | 4,826 (30.2%) | 1,261 (4.6%) |
| Total | 15,961 (100.0%) | 27,474 (100.0%) |
Housing Structure by Heating Type in Albany
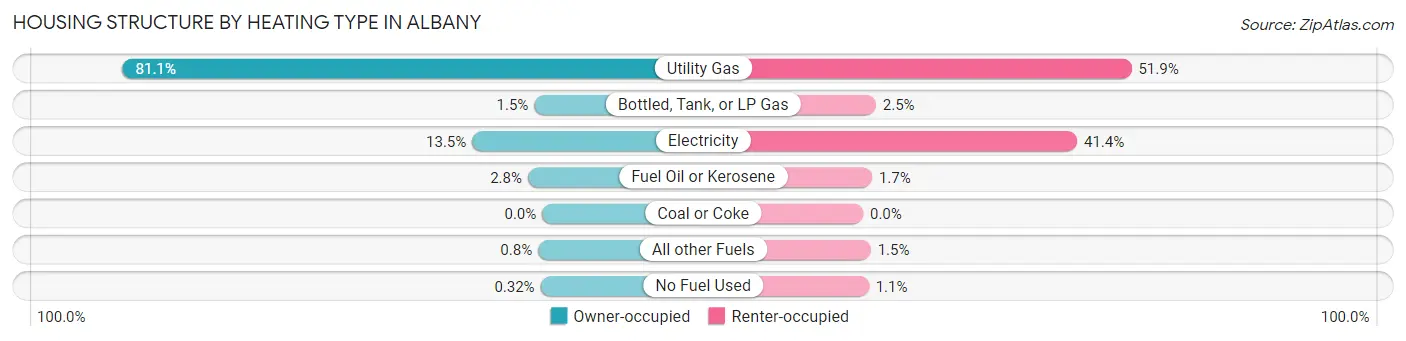
| Heating Type | Owner-occupied | Renter-occupied |
| Utility Gas | 12,936 (81.0%) | 14,252 (51.9%) |
| Bottled, Tank, or LP Gas | 245 (1.5%) | 678 (2.5%) |
| Electricity | 2,160 (13.5%) | 11,362 (41.4%) |
| Fuel Oil or Kerosene | 442 (2.8%) | 474 (1.7%) |
| Coal or Coke | 0 (0.0%) | 0 (0.0%) |
| All other Fuels | 127 (0.8%) | 406 (1.5%) |
| No Fuel Used | 51 (0.3%) | 302 (1.1%) |
| Total | 15,961 (100.0%) | 27,474 (100.0%) |
Household Vehicle Usage in Albany
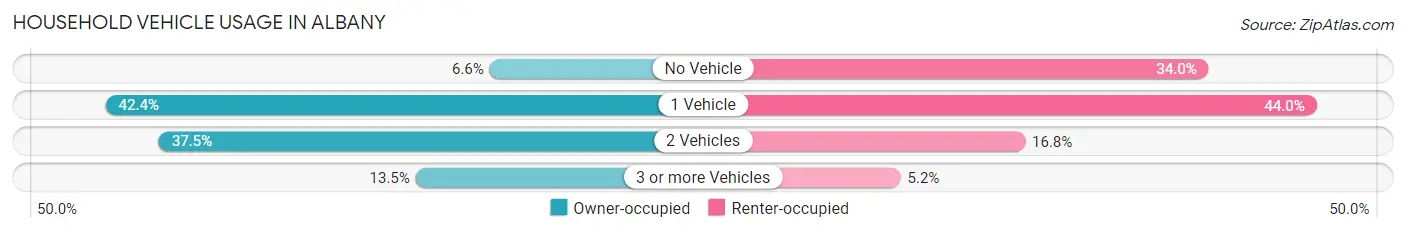
| Vehicles per Household | Owner-occupied | Renter-occupied |
| No Vehicle | 1,052 (6.6%) | 9,327 (34.0%) |
| 1 Vehicle | 6,773 (42.4%) | 12,096 (44.0%) |
| 2 Vehicles | 5,981 (37.5%) | 4,622 (16.8%) |
| 3 or more Vehicles | 2,155 (13.5%) | 1,429 (5.2%) |
| Total | 15,961 (100.0%) | 27,474 (100.0%) |
Real Estate & Mortgages in Albany
Real Estate and Mortgage Overview in Albany
| Characteristic | Without Mortgage | With Mortgage |
| Housing Units | 5,760 | 10,201 |
| Median Property Value | $202,300 | $219,800 |
| Median Household Income | $69,485 | $2,801 |
| Monthly Housing Costs | $666 | $577 |
| Real Estate Taxes | $4,022 | $305 |
Property Value by Mortgage Status in Albany
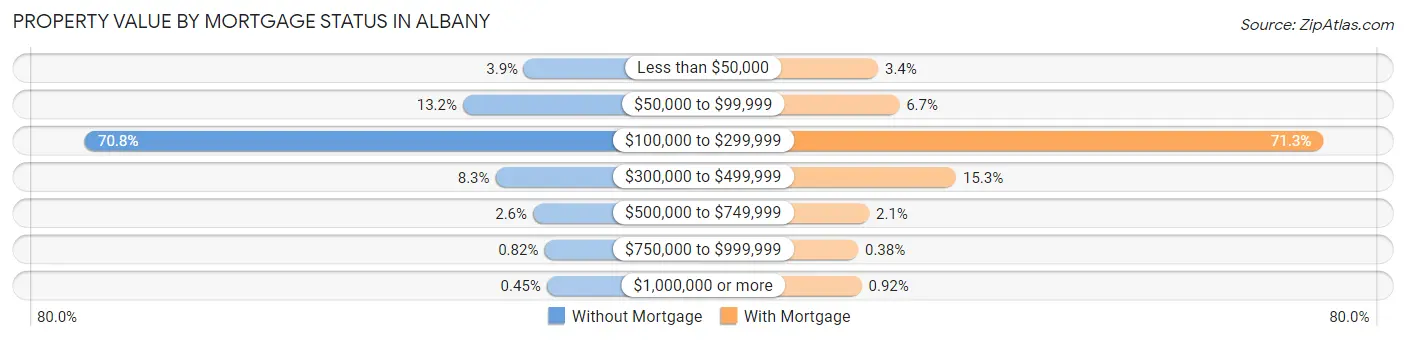
| Property Value | Without Mortgage | With Mortgage |
| Less than $50,000 | 225 (3.9%) | 350 (3.4%) |
| $50,000 to $99,999 | 762 (13.2%) | 678 (6.7%) |
| $100,000 to $299,999 | 4,077 (70.8%) | 7,268 (71.3%) |
| $300,000 to $499,999 | 476 (8.3%) | 1,562 (15.3%) |
| $500,000 to $749,999 | 147 (2.5%) | 210 (2.1%) |
| $750,000 to $999,999 | 47 (0.8%) | 39 (0.4%) |
| $1,000,000 or more | 26 (0.4%) | 94 (0.9%) |
| Total | 5,760 (100.0%) | 10,201 (100.0%) |
Household Income by Mortgage Status in Albany
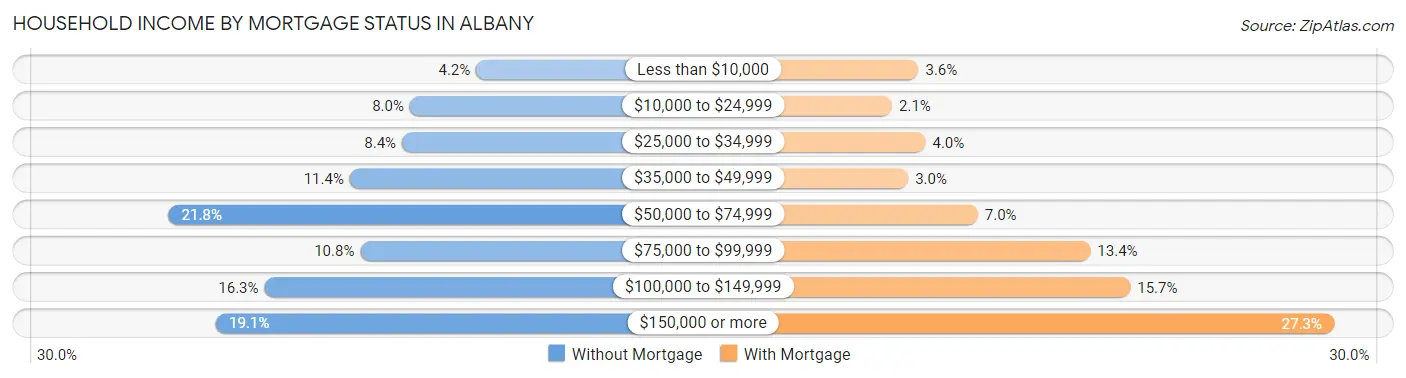
| Household Income | Without Mortgage | With Mortgage |
| Less than $10,000 | 242 (4.2%) | 367 (3.6%) |
| $10,000 to $24,999 | 460 (8.0%) | 213 (2.1%) |
| $25,000 to $34,999 | 486 (8.4%) | 408 (4.0%) |
| $35,000 to $49,999 | 658 (11.4%) | 307 (3.0%) |
| $50,000 to $74,999 | 1,254 (21.8%) | 713 (7.0%) |
| $75,000 to $99,999 | 623 (10.8%) | 1,369 (13.4%) |
| $100,000 to $149,999 | 939 (16.3%) | 1,602 (15.7%) |
| $150,000 or more | 1,098 (19.1%) | 2,788 (27.3%) |
| Total | 5,760 (100.0%) | 10,201 (100.0%) |
Property Value to Household Income Ratio in Albany
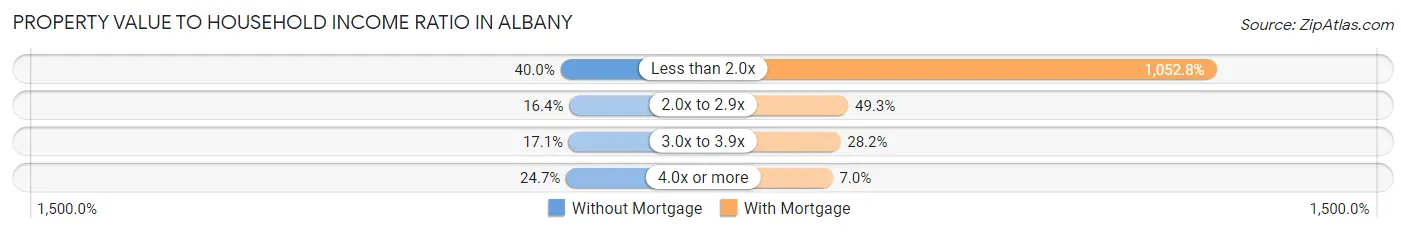
| Value-to-Income Ratio | Without Mortgage | With Mortgage |
| Less than 2.0x | 2,304 (40.0%) | 107,391 (1,052.7%) |
| 2.0x to 2.9x | 942 (16.4%) | 5,030 (49.3%) |
| 3.0x to 3.9x | 986 (17.1%) | 2,878 (28.2%) |
| 4.0x or more | 1,420 (24.6%) | 714 (7.0%) |
| Total | 5,760 (100.0%) | 10,201 (100.0%) |
Real Estate Taxes by Mortgage Status in Albany
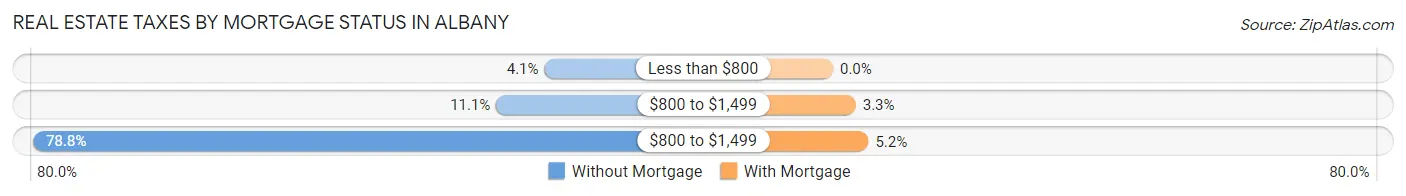
| Property Taxes | Without Mortgage | With Mortgage |
| Less than $800 | 233 (4.1%) | 0 (0.0%) |
| $800 to $1,499 | 639 (11.1%) | 339 (3.3%) |
| $800 to $1,499 | 4,537 (78.8%) | 528 (5.2%) |
| Total | 5,760 (100.0%) | 10,201 (100.0%) |
Health & Disability in Albany
Health Insurance Coverage by Age in Albany
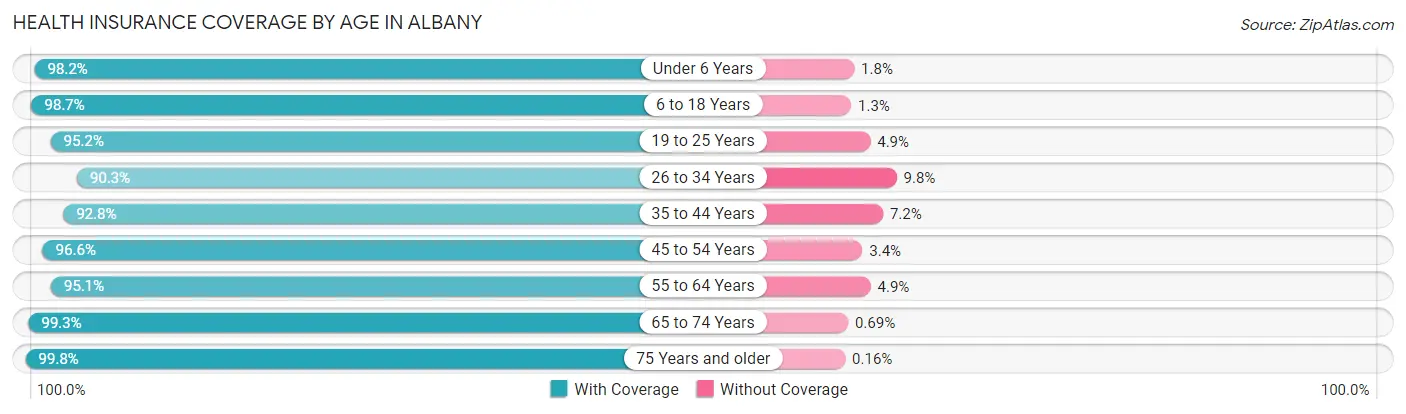
| Age Bracket | With Coverage | Without Coverage |
| Under 6 Years | 5,122 (98.2%) | 96 (1.8%) |
| 6 to 18 Years | 12,492 (98.7%) | 161 (1.3%) |
| 19 to 25 Years | 20,109 (95.2%) | 1,024 (4.9%) |
| 26 to 34 Years | 13,249 (90.2%) | 1,432 (9.8%) |
| 35 to 44 Years | 10,818 (92.8%) | 840 (7.2%) |
| 45 to 54 Years | 9,864 (96.6%) | 344 (3.4%) |
| 55 to 64 Years | 9,617 (95.1%) | 496 (4.9%) |
| 65 to 74 Years | 7,622 (99.3%) | 53 (0.7%) |
| 75 Years and older | 5,139 (99.8%) | 8 (0.2%) |
| Total | 94,032 (95.5%) | 4,454 (4.5%) |
Health Insurance Coverage by Citizenship Status in Albany
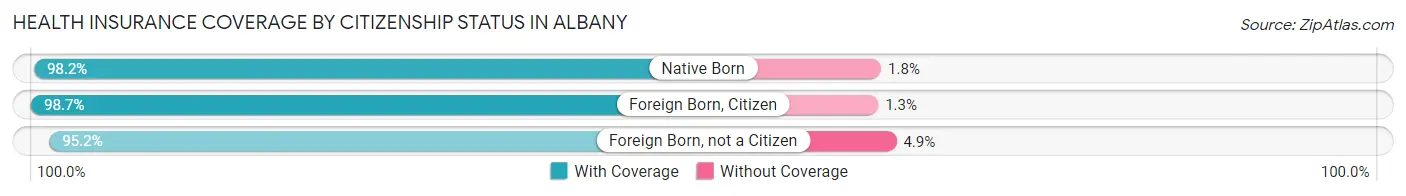
| Citizenship Status | With Coverage | Without Coverage |
| Native Born | 5,122 (98.2%) | 96 (1.8%) |
| Foreign Born, Citizen | 12,492 (98.7%) | 161 (1.3%) |
| Foreign Born, not a Citizen | 20,109 (95.2%) | 1,024 (4.9%) |
Health Insurance Coverage by Household Income in Albany
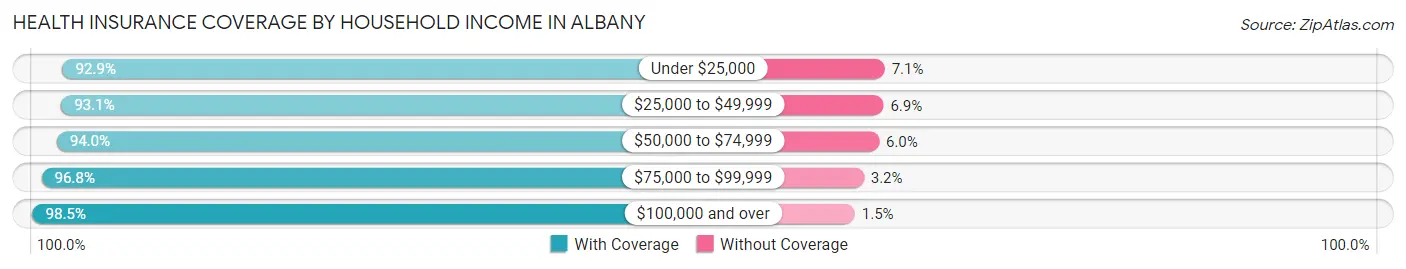
| Household Income | With Coverage | Without Coverage |
| Under $25,000 | 17,419 (92.9%) | 1,331 (7.1%) |
| $25,000 to $49,999 | 14,011 (93.1%) | 1,033 (6.9%) |
| $50,000 to $74,999 | 12,852 (94.0%) | 826 (6.0%) |
| $75,000 to $99,999 | 10,895 (96.8%) | 358 (3.2%) |
| $100,000 and over | 29,685 (98.5%) | 454 (1.5%) |
Public vs Private Health Insurance Coverage by Age in Albany
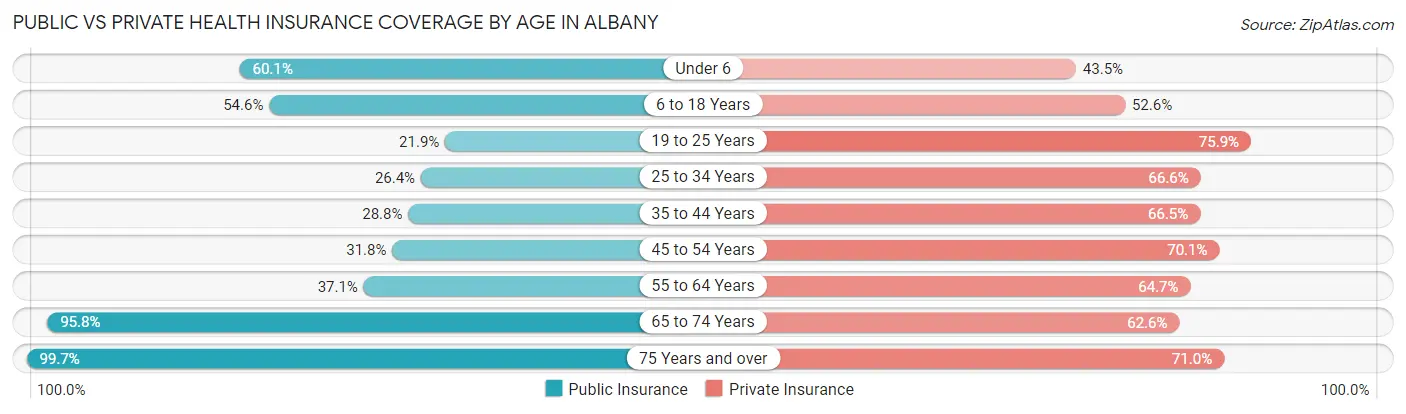
| Age Bracket | Public Insurance | Private Insurance |
| Under 6 | 3,136 (60.1%) | 2,267 (43.4%) |
| 6 to 18 Years | 6,907 (54.6%) | 6,650 (52.6%) |
| 19 to 25 Years | 4,637 (21.9%) | 16,047 (75.9%) |
| 25 to 34 Years | 3,880 (26.4%) | 9,777 (66.6%) |
| 35 to 44 Years | 3,355 (28.8%) | 7,752 (66.5%) |
| 45 to 54 Years | 3,241 (31.8%) | 7,152 (70.1%) |
| 55 to 64 Years | 3,748 (37.1%) | 6,542 (64.7%) |
| 65 to 74 Years | 7,353 (95.8%) | 4,808 (62.6%) |
| 75 Years and over | 5,129 (99.7%) | 3,652 (71.0%) |
| Total | 41,386 (42.0%) | 64,647 (65.6%) |
Disability Status by Sex by Age in Albany
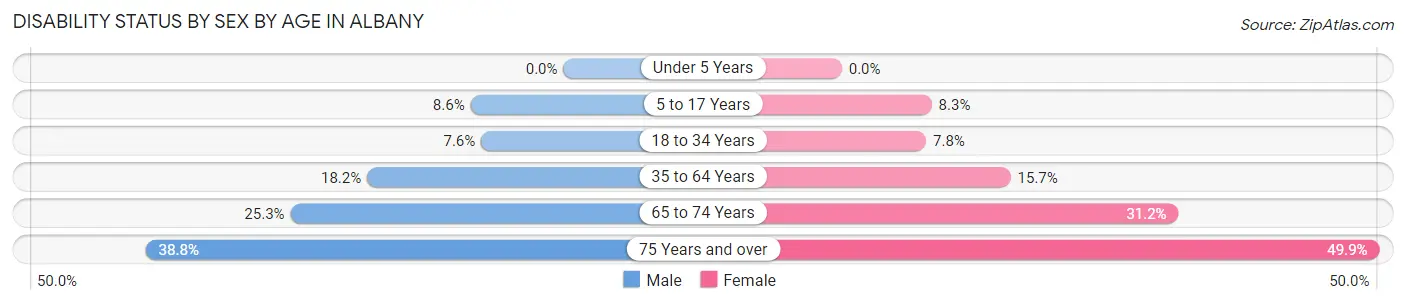
| Age Bracket | Male | Female |
| Under 5 Years | 0 (0.0%) | 0 (0.0%) |
| 5 to 17 Years | 466 (8.6%) | 416 (8.3%) |
| 18 to 34 Years | 1,393 (7.6%) | 1,610 (7.8%) |
| 35 to 64 Years | 2,915 (18.2%) | 2,502 (15.7%) |
| 65 to 74 Years | 873 (25.3%) | 1,321 (31.2%) |
| 75 Years and over | 714 (38.8%) | 1,649 (49.9%) |
Disability Class by Sex by Age in Albany
Disability Class: Hearing Difficulty
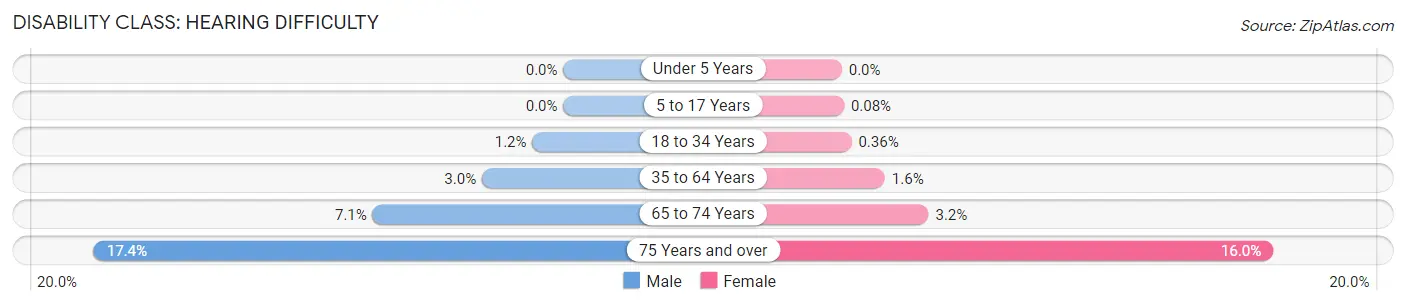
| Age Bracket | Male | Female |
| Under 5 Years | 0 (0.0%) | 0 (0.0%) |
| 5 to 17 Years | 0 (0.0%) | 4 (0.1%) |
| 18 to 34 Years | 209 (1.1%) | 74 (0.4%) |
| 35 to 64 Years | 484 (3.0%) | 256 (1.6%) |
| 65 to 74 Years | 244 (7.1%) | 136 (3.2%) |
| 75 Years and over | 321 (17.4%) | 529 (16.0%) |
Disability Class: Vision Difficulty
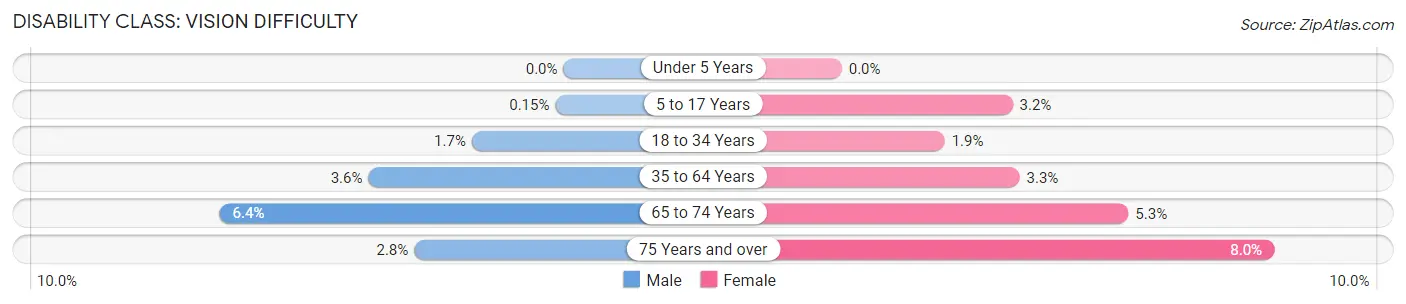
| Age Bracket | Male | Female |
| Under 5 Years | 0 (0.0%) | 0 (0.0%) |
| 5 to 17 Years | 8 (0.2%) | 158 (3.2%) |
| 18 to 34 Years | 310 (1.7%) | 393 (1.9%) |
| 35 to 64 Years | 580 (3.6%) | 527 (3.3%) |
| 65 to 74 Years | 220 (6.4%) | 225 (5.3%) |
| 75 Years and over | 51 (2.8%) | 265 (8.0%) |
Disability Class: Cognitive Difficulty
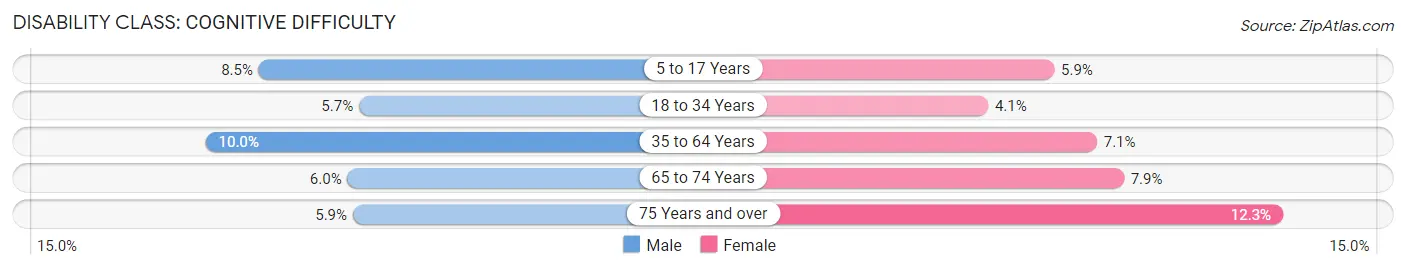
| Age Bracket | Male | Female |
| 5 to 17 Years | 458 (8.5%) | 295 (5.9%) |
| 18 to 34 Years | 1,039 (5.7%) | 837 (4.1%) |
| 35 to 64 Years | 1,593 (10.0%) | 1,135 (7.1%) |
| 65 to 74 Years | 207 (6.0%) | 332 (7.9%) |
| 75 Years and over | 108 (5.9%) | 406 (12.3%) |
Disability Class: Ambulatory Difficulty
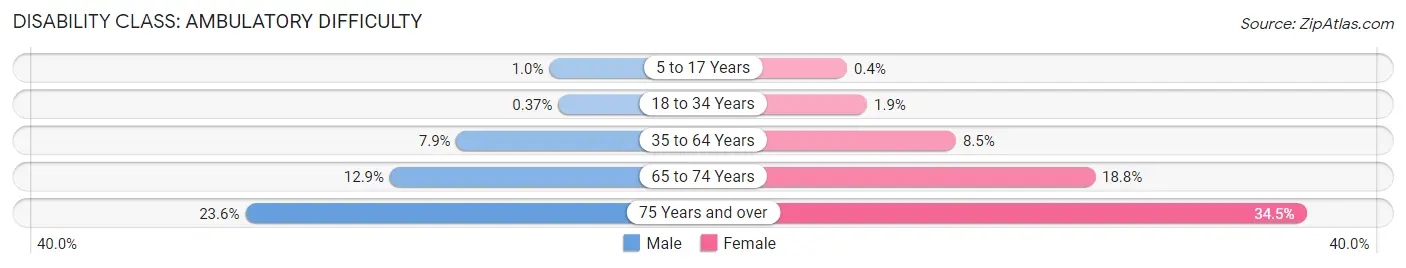
| Age Bracket | Male | Female |
| 5 to 17 Years | 56 (1.0%) | 20 (0.4%) |
| 18 to 34 Years | 68 (0.4%) | 387 (1.9%) |
| 35 to 64 Years | 1,270 (7.9%) | 1,355 (8.5%) |
| 65 to 74 Years | 444 (12.9%) | 795 (18.8%) |
| 75 Years and over | 435 (23.6%) | 1,140 (34.5%) |
Disability Class: Self-Care Difficulty
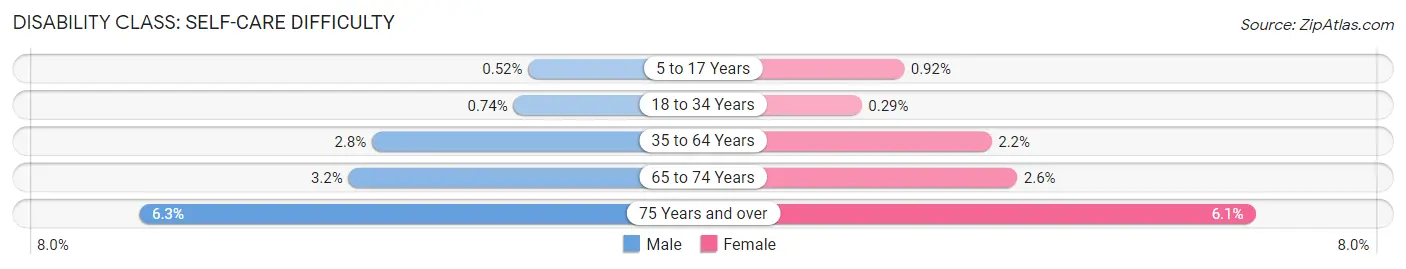
| Age Bracket | Male | Female |
| 5 to 17 Years | 28 (0.5%) | 46 (0.9%) |
| 18 to 34 Years | 135 (0.7%) | 60 (0.3%) |
| 35 to 64 Years | 455 (2.8%) | 354 (2.2%) |
| 65 to 74 Years | 110 (3.2%) | 110 (2.6%) |
| 75 Years and over | 116 (6.3%) | 203 (6.1%) |
Technology Access in Albany
Computing Device Access in Albany
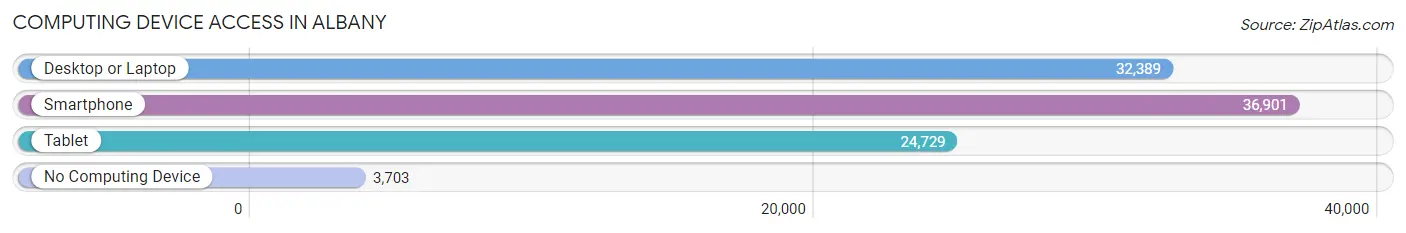
| Device Type | # Households | % Households |
| Desktop or Laptop | 32,389 | 74.6% |
| Smartphone | 36,901 | 85.0% |
| Tablet | 24,729 | 56.9% |
| No Computing Device | 3,703 | 8.5% |
| Total | 43,435 | 100.0% |
Internet Access in Albany
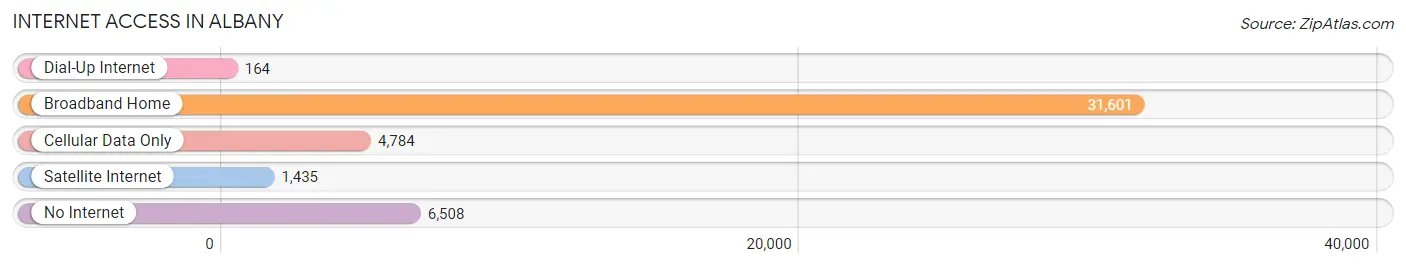
| Internet Type | # Households | % Households |
| Dial-Up Internet | 164 | 0.4% |
| Broadband Home | 31,601 | 72.8% |
| Cellular Data Only | 4,784 | 11.0% |
| Satellite Internet | 1,435 | 3.3% |
| No Internet | 6,508 | 15.0% |
| Total | 43,435 | 100.0% |
Albany Summary
Albany, New York is the capital of the state of New York and the seat of Albany County. It is located in the eastern part of the state, along the Hudson River, and is the fourth-largest city in the state. Albany has a long and rich history, and has been an important center of government, commerce, and culture since its founding in 1614.
Geography
Albany is located in the eastern part of New York State, along the Hudson River. It is bordered by the towns of Bethlehem, Guilderland, Colonie, and Coeymans. The city is situated on a flat plain, with the Hudson River to the east and the Mohawk River to the west. The city is divided into several neighborhoods, including the South End, the Warehouse District, and the Center Square Historic District.
Economy
Albany has a diverse economy, with a mix of government, education, healthcare, and technology sectors. The city is home to several major employers, including the State of New York, Albany Medical Center, Albany Law School, and the University at Albany. The city is also home to several large corporations, such as GlobalFoundries, IBM, and Price Chopper.
Demographics
As of the 2010 census, Albany had a population of 97,856. The racial makeup of the city was 63.2% White, 25.2% African American, 0.3% Native American, 4.2% Asian, 0.1% Pacific Islander, 4.3% from other races, and 2.7% from two or more races. The median household income was $41,945, and the median family income was $50,945.
History
Albany was founded in 1614 by Dutch settlers, and was the first permanent European settlement in the area. The city was named after the Duke of Albany, who was the brother of the Dutch king. Albany was an important trading post for the Dutch, and was the site of several battles during the American Revolution. In 1797, Albany became the state capital of New York. The city has been an important center of government, commerce, and culture since its founding.
Common Questions
What is Per Capita Income in Albany?
Per Capita income in Albany is $34,195.
What is the Median Family Income in Albany?
Median Family Income in Albany is $78,841.
What is the Median Household income in Albany?
Median Household Income in Albany is $54,736.
What is Income or Wage Gap in Albany?
Income or Wage Gap in Albany is 21.6%.
Women in Albany earn 78.4 cents for every dollar earned by a man.
What is Family Income Deficit in Albany?
Family Income Deficit in Albany is $11,004.
Families that are below poverty line in Albany earn $11,004 less on average than the poverty threshold level.
What is Inequality or Gini Index in Albany?
Inequality or Gini Index in Albany is 0.49.
What is the Total Population of Albany?
Total Population of Albany is 99,692.
What is the Total Male Population of Albany?
Total Male Population of Albany is 47,859.
What is the Total Female Population of Albany?
Total Female Population of Albany is 51,833.
What is the Ratio of Males per 100 Females in Albany?
There are 92.33 Males per 100 Females in Albany.
What is the Ratio of Females per 100 Males in Albany?
There are 108.30 Females per 100 Males in Albany.
What is the Median Population Age in Albany?
Median Population Age in Albany is 32.0 Years.
What is the Average Family Size in Albany
Average Family Size in Albany is 2.9 People.
What is the Average Household Size in Albany
Average Household Size in Albany is 2.0 People.
How Large is the Labor Force in Albany?
There are 55,407 People in the Labor Forcein in Albany.
What is the Percentage of People in the Labor Force in Albany?
64.0% of People are in the Labor Force in Albany.
What is the Unemployment Rate in Albany?
Unemployment Rate in Albany is 8.0%.