Rochester, NY Map & Demographics
Rochester Map
Rochester Overview
$28,611
PER CAPITA INCOME
$52,541
AVG FAMILY INCOME
$44,156
AVG HOUSEHOLD INCOME
9.9%
WAGE / INCOME GAP [ % ]
90.1¢/ $1
WAGE / INCOME GAP [ $ ]
$11,456
FAMILY INCOME DEFICIT
0.50
INEQUALITY / GINI INDEX
210,992
TOTAL POPULATION
101,530
MALE POPULATION
109,462
FEMALE POPULATION
92.75
MALES / 100 FEMALES
107.81
FEMALES / 100 MALES
32.9
MEDIAN AGE
3.1
AVG FAMILY SIZE
2.2
AVG HOUSEHOLD SIZE
104,815
LABOR FORCE [ PEOPLE ]
61.6%
PERCENT IN LABOR FORCE
8.5%
UNEMPLOYMENT RATE
Rochester Zip Codes
Rochester Area Codes
Income in Rochester
Income Overview in Rochester
Per Capita Income in Rochester is $28,611, while median incomes of families and households are $52,541 and $44,156 respectively.
| Characteristic | Number | Measure |
| Per Capita Income | 210,992 | $28,611 |
| Median Family Income | 43,235 | $52,541 |
| Mean Family Income | 43,235 | $73,629 |
| Median Household Income | 91,315 | $44,156 |
| Mean Household Income | 91,315 | $63,724 |
| Income Deficit | 43,235 | $11,456 |
| Wage / Income Gap (%) | 210,992 | 9.86% |
| Wage / Income Gap ($) | 210,992 | 90.14¢ per $1 |
| Gini / Inequality Index | 210,992 | 0.50 |
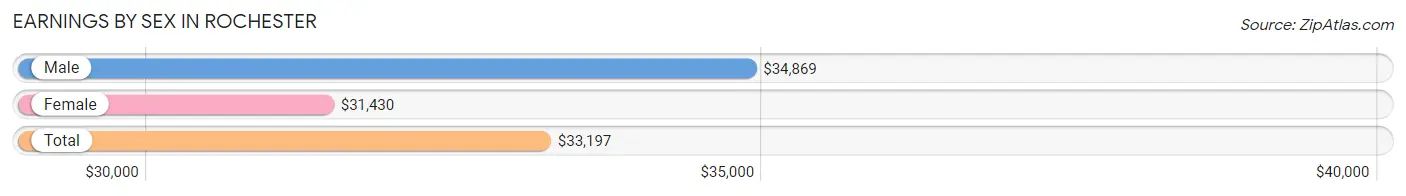
Earnings by Sex in Rochester
Average Earnings in Rochester are $33,197, $34,869 for men and $31,430 for women, a difference of 9.9%.
| Sex | Number | Average Earnings |
| Male | 51,707 (47.6%) | $34,869 |
| Female | 56,861 (52.4%) | $31,430 |
| Total | 108,568 (100.0%) | $33,197 |
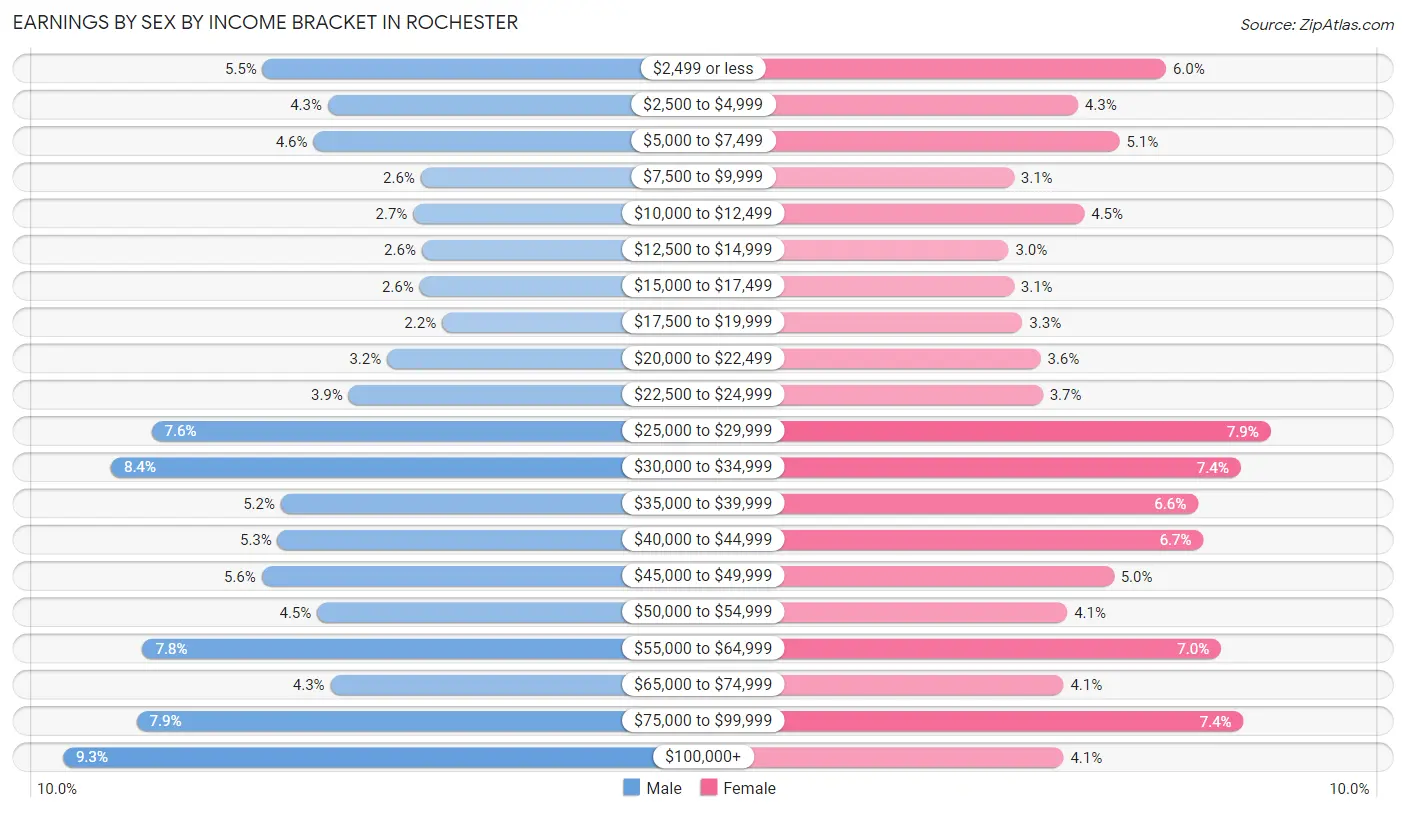
Earnings by Sex by Income Bracket in Rochester
The most common earnings brackets in Rochester are $100,000+ for men (4,798 | 9.3%) and $25,000 to $29,999 for women (4,513 | 7.9%).
| Income | Male | Female |
| $2,499 or less | 2,865 (5.5%) | 3,403 (6.0%) |
| $2,500 to $4,999 | 2,235 (4.3%) | 2,464 (4.3%) |
| $5,000 to $7,499 | 2,375 (4.6%) | 2,904 (5.1%) |
| $7,500 to $9,999 | 1,333 (2.6%) | 1,780 (3.1%) |
| $10,000 to $12,499 | 1,406 (2.7%) | 2,529 (4.4%) |
| $12,500 to $14,999 | 1,322 (2.6%) | 1,721 (3.0%) |
| $15,000 to $17,499 | 1,346 (2.6%) | 1,780 (3.1%) |
| $17,500 to $19,999 | 1,126 (2.2%) | 1,871 (3.3%) |
| $20,000 to $22,499 | 1,658 (3.2%) | 2,063 (3.6%) |
| $22,500 to $24,999 | 2,030 (3.9%) | 2,086 (3.7%) |
| $25,000 to $29,999 | 3,941 (7.6%) | 4,513 (7.9%) |
| $30,000 to $34,999 | 4,335 (8.4%) | 4,196 (7.4%) |
| $35,000 to $39,999 | 2,688 (5.2%) | 3,741 (6.6%) |
| $40,000 to $44,999 | 2,720 (5.3%) | 3,796 (6.7%) |
| $45,000 to $49,999 | 2,874 (5.6%) | 2,842 (5.0%) |
| $50,000 to $54,999 | 2,337 (4.5%) | 2,347 (4.1%) |
| $55,000 to $64,999 | 4,027 (7.8%) | 3,986 (7.0%) |
| $65,000 to $74,999 | 2,207 (4.3%) | 2,306 (4.1%) |
| $75,000 to $99,999 | 4,084 (7.9%) | 4,225 (7.4%) |
| $100,000+ | 4,798 (9.3%) | 2,308 (4.1%) |
| Total | 51,707 (100.0%) | 56,861 (100.0%) |
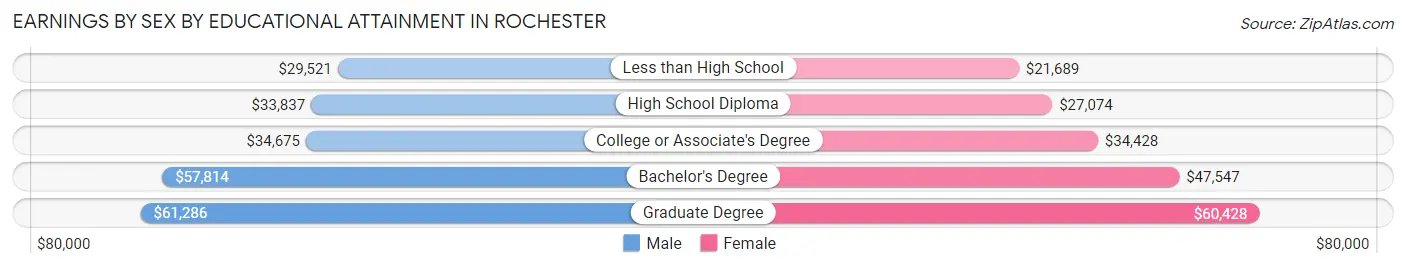
Earnings by Sex by Educational Attainment in Rochester
Average earnings in Rochester are $41,241 for men and $36,407 for women, a difference of 11.7%. Men with an educational attainment of graduate degree enjoy the highest average annual earnings of $61,286, while those with less than high school education earn the least with $29,521. Women with an educational attainment of graduate degree earn the most with the average annual earnings of $60,428, while those with less than high school education have the smallest earnings of $21,689.
| Educational Attainment | Male Income | Female Income |
| Less than High School | $29,521 | $21,689 |
| High School Diploma | $33,837 | $27,074 |
| College or Associate's Degree | $34,675 | $34,428 |
| Bachelor's Degree | $57,814 | $47,547 |
| Graduate Degree | $61,286 | $60,428 |
| Total | $41,241 | $36,407 |
Family Income in Rochester
Family Income Brackets in Rochester
According to the Rochester family income data, there are 7,350 families falling into the $50,000 to $74,999 income range, which is the most common income bracket and makes up 17.0% of all families. Conversely, the $150,000 to $199,999 income bracket is the least frequent group with only 2,075 families (4.8%) belonging to this category.
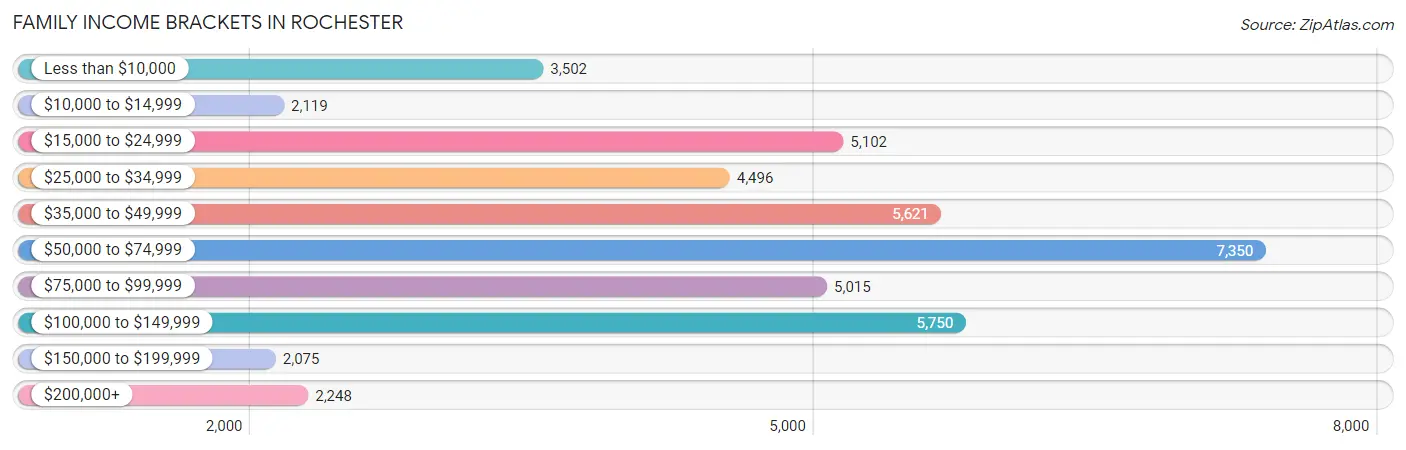
| Income Bracket | # Families | % Families |
| Less than $10,000 | 3,502 | 8.1% |
| $10,000 to $14,999 | 2,119 | 4.9% |
| $15,000 to $24,999 | 5,102 | 11.8% |
| $25,000 to $34,999 | 4,496 | 10.4% |
| $35,000 to $49,999 | 5,621 | 13.0% |
| $50,000 to $74,999 | 7,350 | 17.0% |
| $75,000 to $99,999 | 5,015 | 11.6% |
| $100,000 to $149,999 | 5,750 | 13.3% |
| $150,000 to $199,999 | 2,075 | 4.8% |
| $200,000+ | 2,248 | 5.2% |
Family Income by Famaliy Size in Rochester
6-person families (983 | 2.3%) account for the highest median family income in Rochester with $73,266 per family, while 2-person families (21,061 | 48.7%) have the highest median income of $28,416 per family member.
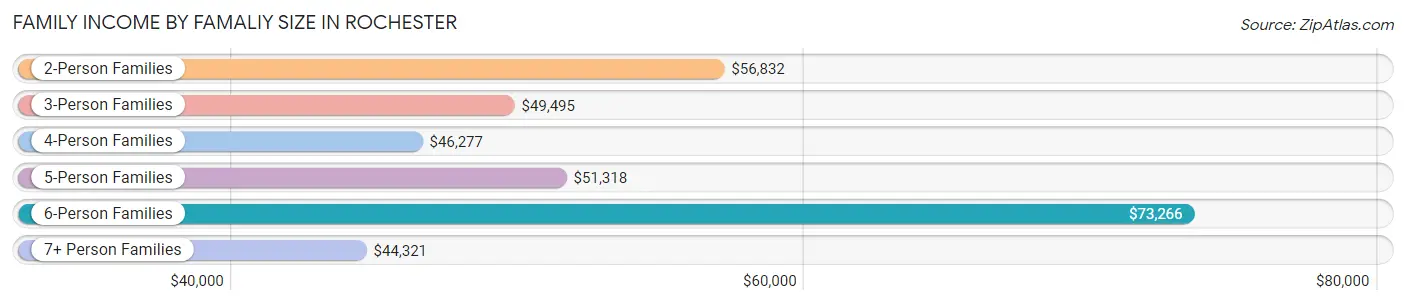
| Income Bracket | # Families | Median Income |
| 2-Person Families | 21,061 (48.7%) | $56,832 |
| 3-Person Families | 10,504 (24.3%) | $49,495 |
| 4-Person Families | 7,084 (16.4%) | $46,277 |
| 5-Person Families | 2,968 (6.9%) | $51,318 |
| 6-Person Families | 983 (2.3%) | $73,266 |
| 7+ Person Families | 635 (1.5%) | $44,321 |
| Total | 43,235 (100.0%) | $52,541 |
Family Income by Number of Earners in Rochester
The median family income in Rochester is $52,541, with families comprising 3+ earners (2,798) having the highest median family income of $115,135, while families with no earners (7,411) have the lowest median family income of $18,810, accounting for 6.5% and 17.1% of families, respectively.
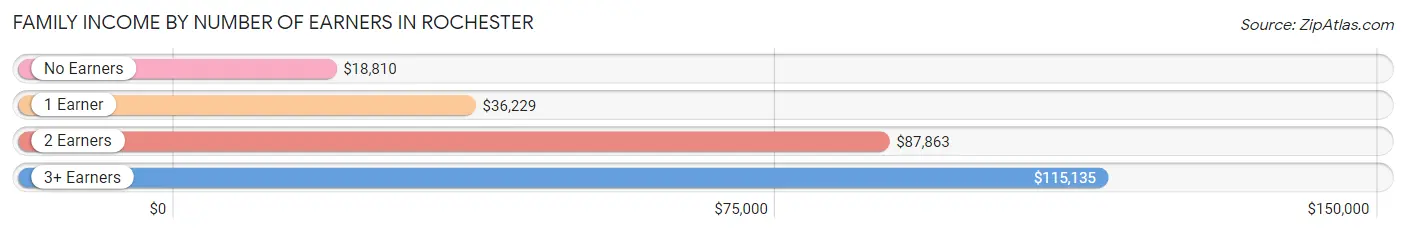
| Number of Earners | # Families | Median Income |
| No Earners | 7,411 (17.1%) | $18,810 |
| 1 Earner | 17,989 (41.6%) | $36,229 |
| 2 Earners | 15,037 (34.8%) | $87,863 |
| 3+ Earners | 2,798 (6.5%) | $115,135 |
| Total | 43,235 (100.0%) | $52,541 |
Household Income in Rochester
Household Income Brackets in Rochester
With 14,519 households falling in the category, the $50,000 to $74,999 income range is the most frequent in Rochester, accounting for 15.9% of all households. In contrast, only 3,561 households (3.9%) fall into the $150,000 to $199,999 income bracket, making it the least populous group.
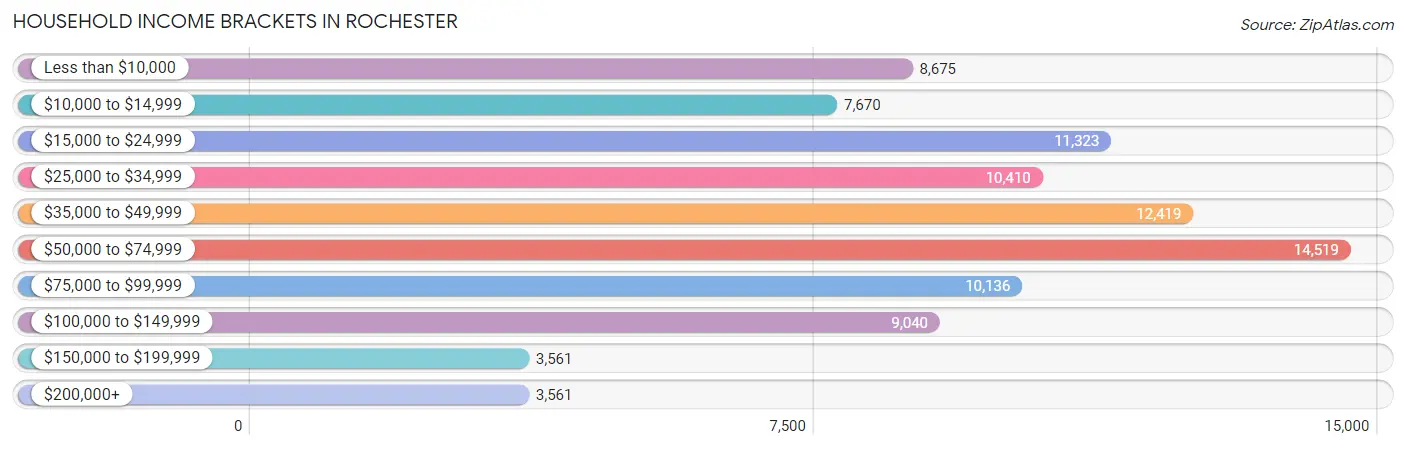
| Income Bracket | # Households | % Households |
| Less than $10,000 | 8,675 | 9.5% |
| $10,000 to $14,999 | 7,670 | 8.4% |
| $15,000 to $24,999 | 11,323 | 12.4% |
| $25,000 to $34,999 | 10,410 | 11.4% |
| $35,000 to $49,999 | 12,419 | 13.6% |
| $50,000 to $74,999 | 14,519 | 15.9% |
| $75,000 to $99,999 | 10,136 | 11.1% |
| $100,000 to $149,999 | 9,040 | 9.9% |
| $150,000 to $199,999 | 3,561 | 3.9% |
| $200,000+ | 3,561 | 3.9% |
Household Income by Householder Age in Rochester
The median household income in Rochester is $44,156, with the highest median household income of $50,076 found in the 25 to 44 years age bracket for the primary householder. A total of 37,006 households (40.5%) fall into this category. Meanwhile, the 15 to 24 years age bracket for the primary householder has the lowest median household income of $32,923, with 5,950 households (6.5%) in this group.
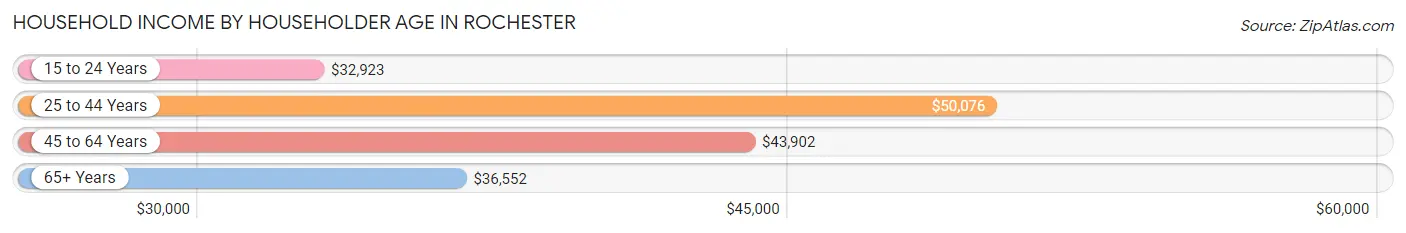
| Income Bracket | # Households | Median Income |
| 15 to 24 Years | 5,950 (6.5%) | $32,923 |
| 25 to 44 Years | 37,006 (40.5%) | $50,076 |
| 45 to 64 Years | 30,401 (33.3%) | $43,902 |
| 65+ Years | 17,958 (19.7%) | $36,552 |
| Total | 91,315 (100.0%) | $44,156 |
Poverty in Rochester
Income Below Poverty by Sex and Age in Rochester
With 26.2% poverty level for males and 29.5% for females among the residents of Rochester, 5 year old males and 12 to 14 year old females are the most vulnerable to poverty, with 517 males (51.4%) and 1,597 females (46.1%) in their respective age groups living below the poverty level.
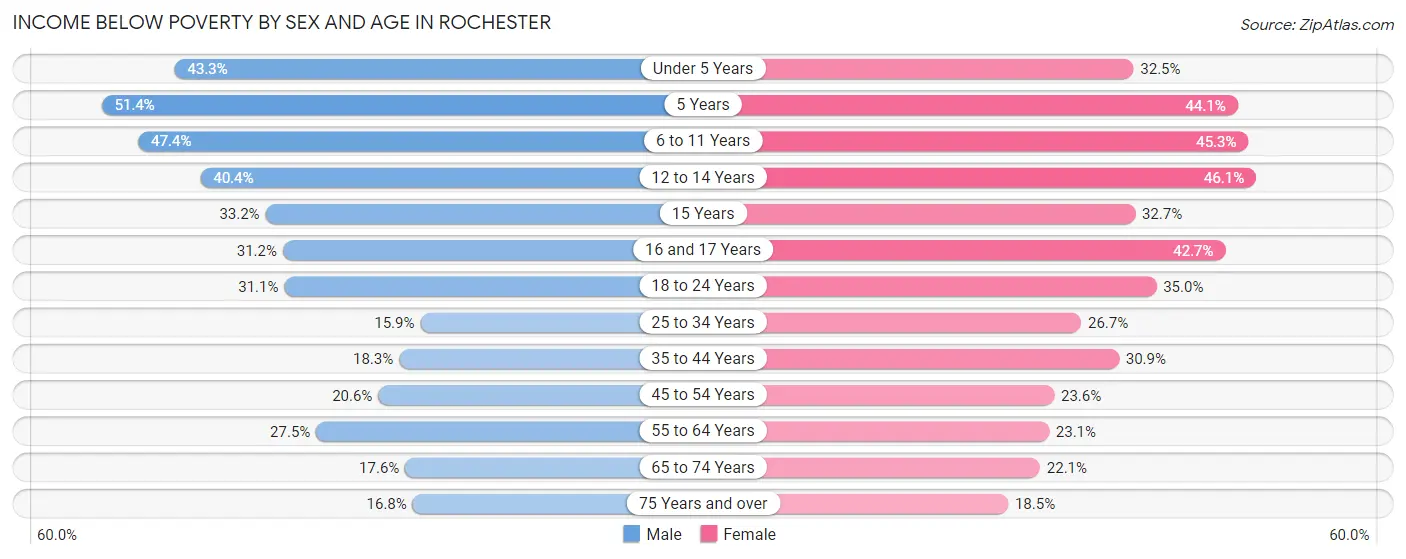
| Age Bracket | Male | Female |
| Under 5 Years | 2,745 (43.3%) | 2,043 (32.5%) |
| 5 Years | 517 (51.4%) | 532 (44.1%) |
| 6 to 11 Years | 3,582 (47.4%) | 3,208 (45.3%) |
| 12 to 14 Years | 1,868 (40.4%) | 1,597 (46.1%) |
| 15 Years | 422 (33.2%) | 365 (32.7%) |
| 16 and 17 Years | 707 (31.2%) | 1,206 (42.7%) |
| 18 to 24 Years | 3,185 (31.1%) | 4,081 (35.0%) |
| 25 to 34 Years | 2,972 (15.9%) | 5,587 (26.7%) |
| 35 to 44 Years | 2,224 (18.3%) | 4,071 (30.8%) |
| 45 to 54 Years | 2,033 (20.6%) | 2,754 (23.6%) |
| 55 to 64 Years | 3,270 (27.5%) | 2,948 (23.1%) |
| 65 to 74 Years | 1,349 (17.6%) | 1,856 (22.1%) |
| 75 Years and over | 626 (16.8%) | 947 (18.5%) |
| Total | 25,500 (26.2%) | 31,195 (29.5%) |
Income Above Poverty by Sex and Age in Rochester
According to the poverty statistics in Rochester, males aged 25 to 34 years and females aged 75 years and over are the age groups that are most secure financially, with 84.1% of males and 81.5% of females in these age groups living above the poverty line.
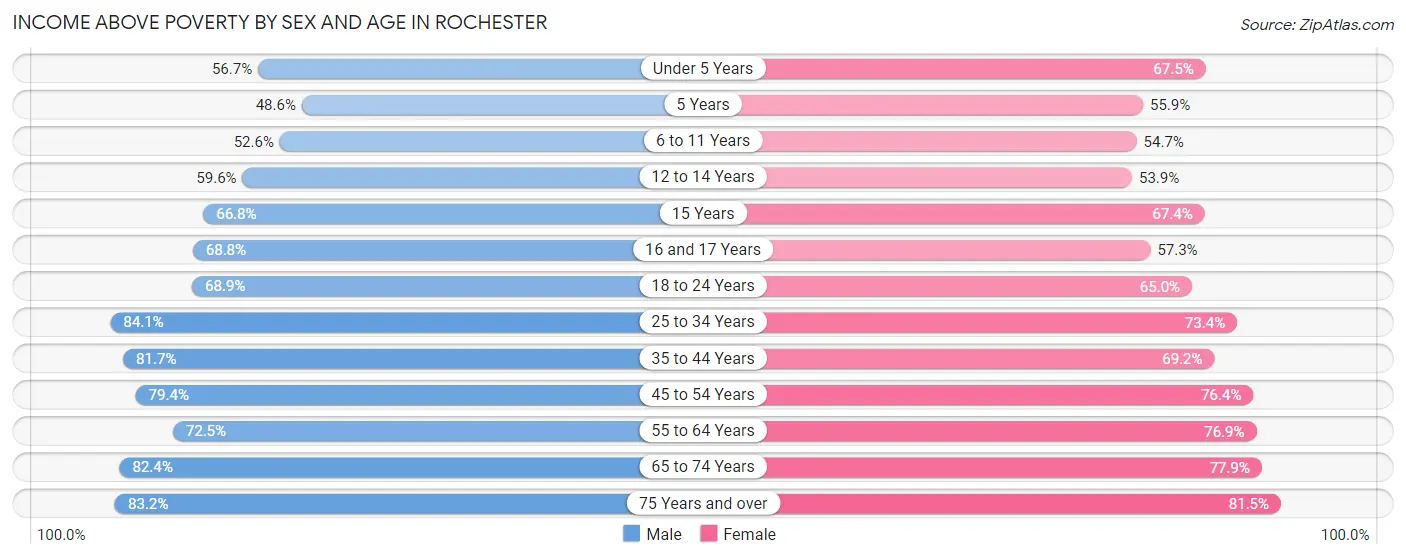
| Age Bracket | Male | Female |
| Under 5 Years | 3,591 (56.7%) | 4,248 (67.5%) |
| 5 Years | 488 (48.6%) | 675 (55.9%) |
| 6 to 11 Years | 3,982 (52.6%) | 3,878 (54.7%) |
| 12 to 14 Years | 2,752 (59.6%) | 1,865 (53.9%) |
| 15 Years | 850 (66.8%) | 753 (67.3%) |
| 16 and 17 Years | 1,556 (68.8%) | 1,618 (57.3%) |
| 18 to 24 Years | 7,063 (68.9%) | 7,573 (65.0%) |
| 25 to 34 Years | 15,679 (84.1%) | 15,375 (73.4%) |
| 35 to 44 Years | 9,928 (81.7%) | 9,125 (69.2%) |
| 45 to 54 Years | 7,827 (79.4%) | 8,896 (76.4%) |
| 55 to 64 Years | 8,609 (72.5%) | 9,838 (76.9%) |
| 65 to 74 Years | 6,309 (82.4%) | 6,558 (77.9%) |
| 75 Years and over | 3,103 (83.2%) | 4,169 (81.5%) |
| Total | 71,737 (73.8%) | 74,571 (70.5%) |
Income Below Poverty Among Married-Couple Families in Rochester
The poverty statistics for married-couple families in Rochester show that 8.0% or 1,495 of the total 18,794 families live below the poverty line. Families with 5 or more children have the highest poverty rate of 66.5%, comprising of 107 families. On the other hand, families with no children have the lowest poverty rate of 4.6%, which includes 544 families.
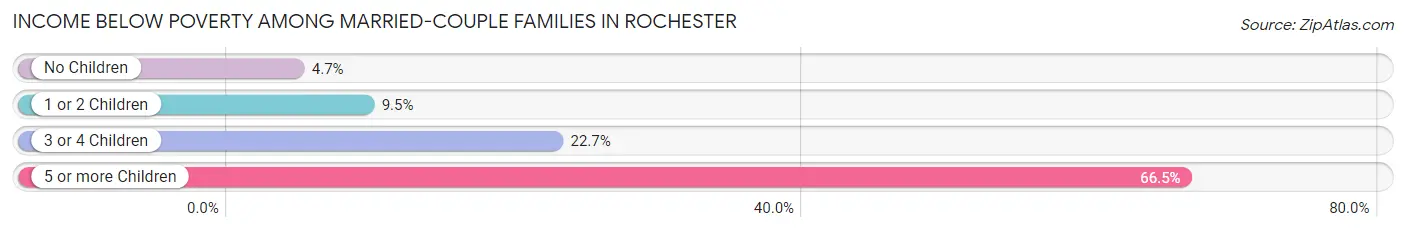
| Children | Above Poverty | Below Poverty |
| No Children | 11,166 (95.4%) | 544 (4.6%) |
| 1 or 2 Children | 4,991 (90.5%) | 525 (9.5%) |
| 3 or 4 Children | 1,088 (77.3%) | 319 (22.7%) |
| 5 or more Children | 54 (33.5%) | 107 (66.5%) |
| Total | 17,299 (92.0%) | 1,495 (8.0%) |
Income Below Poverty Among Single-Parent Households in Rochester
According to the poverty data in Rochester, 21.0% or 925 single-father households and 39.5% or 7,910 single-mother households are living below the poverty line. Among single-father households, those with 3 or 4 children have the highest poverty rate, with 110 households (41.7%) experiencing poverty. Likewise, among single-mother households, those with 5 or more children have the highest poverty rate, with 286 households (92.9%) falling below the poverty line.
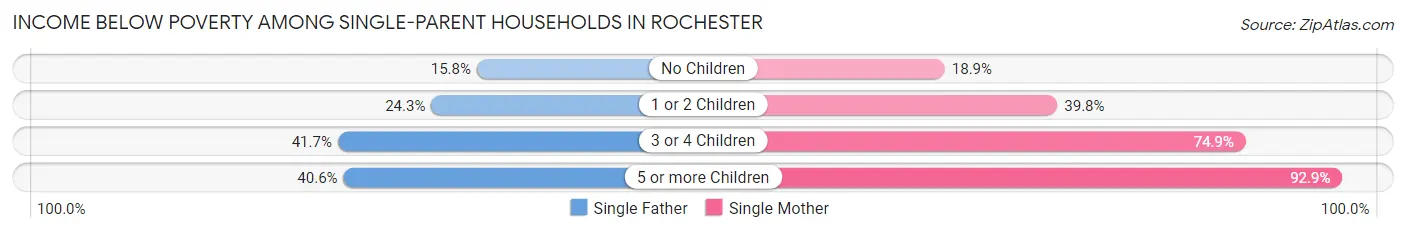
| Children | Single Father | Single Mother |
| No Children | 358 (15.8%) | 1,114 (18.9%) |
| 1 or 2 Children | 444 (24.3%) | 4,360 (39.8%) |
| 3 or 4 Children | 110 (41.7%) | 2,150 (74.9%) |
| 5 or more Children | 13 (40.6%) | 286 (92.9%) |
| Total | 925 (21.0%) | 7,910 (39.5%) |
Income Below Poverty Among Married-Couple vs Single-Parent Households in Rochester
The poverty data for Rochester shows that 1,495 of the married-couple family households (8.0%) and 8,835 of the single-parent households (36.1%) are living below the poverty level. Within the married-couple family households, those with 5 or more children have the highest poverty rate, with 107 households (66.5%) falling below the poverty line. Among the single-parent households, those with 5 or more children have the highest poverty rate, with 299 household (87.9%) living below poverty.
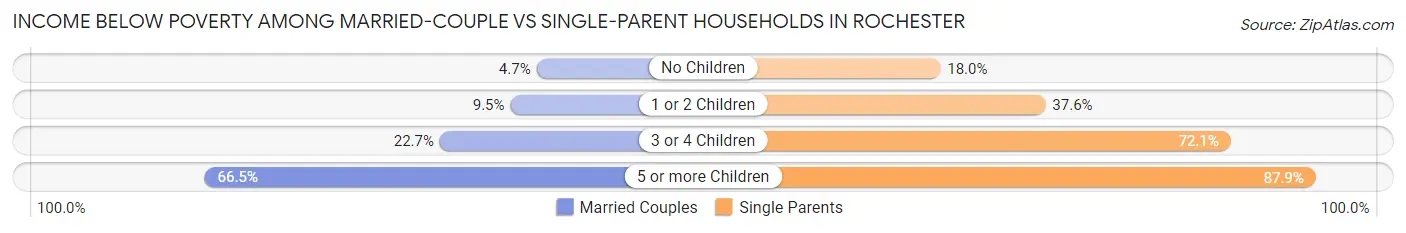
| Children | Married-Couple Families | Single-Parent Households |
| No Children | 544 (4.6%) | 1,472 (18.0%) |
| 1 or 2 Children | 525 (9.5%) | 4,804 (37.6%) |
| 3 or 4 Children | 319 (22.7%) | 2,260 (72.1%) |
| 5 or more Children | 107 (66.5%) | 299 (87.9%) |
| Total | 1,495 (8.0%) | 8,835 (36.1%) |
Race in Rochester
The most populous races in Rochester are White / Caucasian (91,120 | 43.2%), Black / African American (79,911 | 37.9%), and Hispanic or Latino (41,573 | 19.7%).
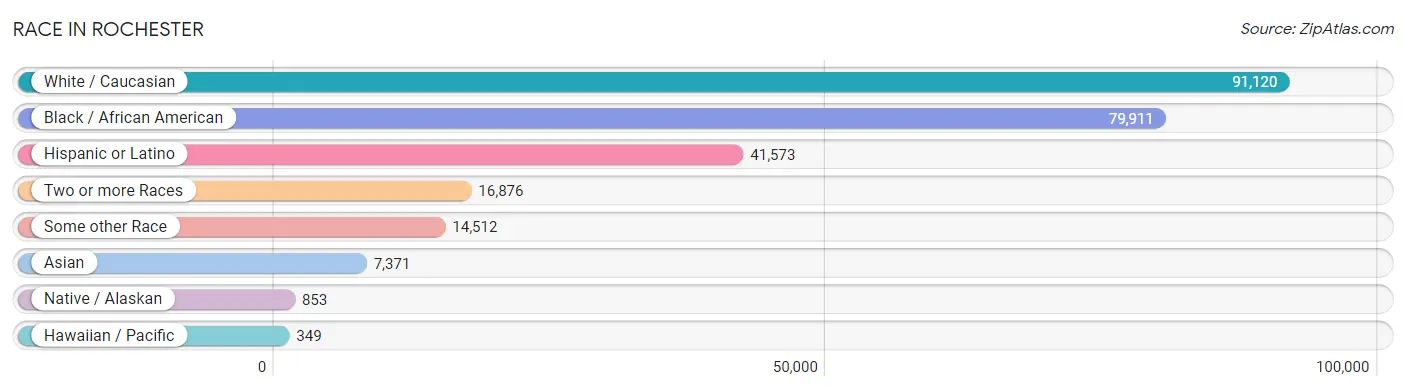
| Race | # Population | % Population |
| Asian | 7,371 | 3.5% |
| Black / African American | 79,911 | 37.9% |
| Hawaiian / Pacific | 349 | 0.2% |
| Hispanic or Latino | 41,573 | 19.7% |
| Native / Alaskan | 853 | 0.4% |
| White / Caucasian | 91,120 | 43.2% |
| Two or more Races | 16,876 | 8.0% |
| Some other Race | 14,512 | 6.9% |
| Total | 210,992 | 100.0% |
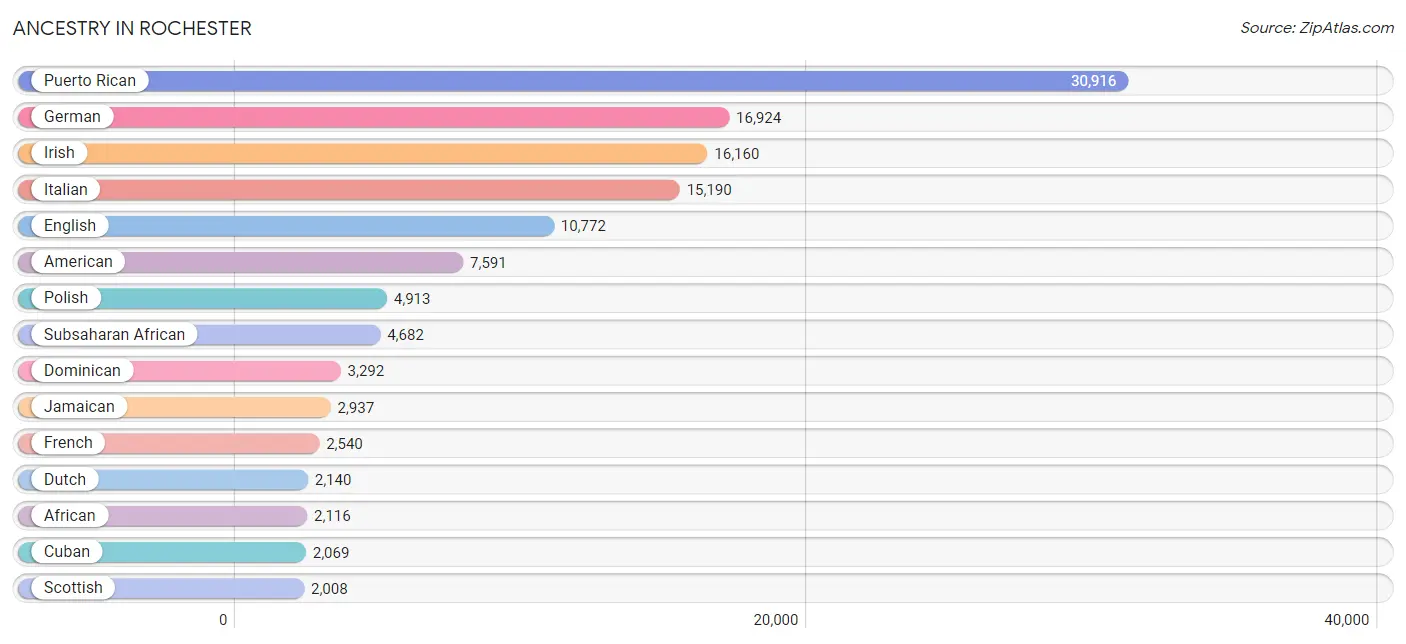
Ancestry in Rochester
The most populous ancestries reported in Rochester are Puerto Rican (30,916 | 14.6%), German (16,924 | 8.0%), Irish (16,160 | 7.7%), Italian (15,190 | 7.2%), and English (10,772 | 5.1%), together accounting for 42.6% of all Rochester residents.
| Ancestry | # Population | % Population |
| Afghan | 46 | 0.0% |
| African | 2,116 | 1.0% |
| Albanian | 26 | 0.0% |
| Alsatian | 10 | 0.0% |
| American | 7,591 | 3.6% |
| Apache | 121 | 0.1% |
| Arab | 1,041 | 0.5% |
| Argentinean | 48 | 0.0% |
| Armenian | 62 | 0.0% |
| Australian | 3 | 0.0% |
| Austrian | 238 | 0.1% |
| Bahamian | 28 | 0.0% |
| Barbadian | 101 | 0.1% |
| Basque | 24 | 0.0% |
| Belgian | 90 | 0.0% |
| Belizean | 349 | 0.2% |
| Bhutanese | 171 | 0.1% |
| Blackfeet | 411 | 0.2% |
| Brazilian | 41 | 0.0% |
| British | 503 | 0.2% |
| British West Indian | 172 | 0.1% |
| Bulgarian | 13 | 0.0% |
| Burmese | 720 | 0.3% |
| Cambodian | 7 | 0.0% |
| Canadian | 306 | 0.2% |
| Cape Verdean | 84 | 0.0% |
| Celtic | 64 | 0.0% |
| Central American | 826 | 0.4% |
| Central American Indian | 390 | 0.2% |
| Cherokee | 390 | 0.2% |
| Chilean | 232 | 0.1% |
| Chippewa | 35 | 0.0% |
| Choctaw | 93 | 0.0% |
| Colombian | 386 | 0.2% |
| Costa Rican | 26 | 0.0% |
| Cree | 6 | 0.0% |
| Creek | 4 | 0.0% |
| Croatian | 219 | 0.1% |
| Crow | 7 | 0.0% |
| Cuban | 2,069 | 1.0% |
| Czech | 258 | 0.1% |
| Czechoslovakian | 68 | 0.0% |
| Danish | 123 | 0.1% |
| Delaware | 3 | 0.0% |
| Dominican | 3,292 | 1.6% |
| Dutch | 2,140 | 1.0% |
| Eastern European | 673 | 0.3% |
| Ecuadorian | 223 | 0.1% |
| Egyptian | 43 | 0.0% |
| English | 10,772 | 5.1% |
| Estonian | 45 | 0.0% |
| Ethiopian | 415 | 0.2% |
| European | 1,790 | 0.9% |
| Filipino | 115 | 0.1% |
| Finnish | 99 | 0.1% |
| French | 2,540 | 1.2% |
| French Canadian | 789 | 0.4% |
| German | 16,924 | 8.0% |
| Ghanaian | 75 | 0.0% |
| Greek | 618 | 0.3% |
| Guamanian / Chamorro | 26 | 0.0% |
| Guatemalan | 80 | 0.0% |
| Guyanese | 367 | 0.2% |
| Haitian | 1,099 | 0.5% |
| Honduran | 99 | 0.1% |
| Hungarian | 336 | 0.2% |
| Icelander | 16 | 0.0% |
| Indian (Asian) | 1,982 | 0.9% |
| Indonesian | 585 | 0.3% |
| Iranian | 105 | 0.1% |
| Iraqi | 71 | 0.0% |
| Irish | 16,160 | 7.7% |
| Iroquois | 269 | 0.1% |
| Israeli | 70 | 0.0% |
| Italian | 15,190 | 7.2% |
| Jamaican | 2,937 | 1.4% |
| Japanese | 92 | 0.0% |
| Kenyan | 142 | 0.1% |
| Korean | 683 | 0.3% |
| Latvian | 264 | 0.1% |
| Lebanese | 339 | 0.2% |
| Liberian | 14 | 0.0% |
| Lithuanian | 300 | 0.1% |
| Luxembourger | 9 | 0.0% |
| Macedonian | 67 | 0.0% |
| Malaysian | 467 | 0.2% |
| Mexican | 1,769 | 0.8% |
| Mongolian | 9 | 0.0% |
| Moroccan | 61 | 0.0% |
| Native Hawaiian | 182 | 0.1% |
| Navajo | 87 | 0.0% |
| New Zealander | 13 | 0.0% |
| Nicaraguan | 96 | 0.1% |
| Nigerian | 384 | 0.2% |
| Northern European | 178 | 0.1% |
| Norwegian | 487 | 0.2% |
| Okinawan | 1 | 0.0% |
| Pakistani | 776 | 0.4% |
| Panamanian | 241 | 0.1% |
| Pennsylvania German | 62 | 0.0% |
| Peruvian | 73 | 0.0% |
| Polish | 4,913 | 2.3% |
| Portuguese | 482 | 0.2% |
| Pueblo | 128 | 0.1% |
| Puerto Rican | 30,916 | 14.6% |
| Romanian | 134 | 0.1% |
| Russian | 1,493 | 0.7% |
| Salvadoran | 284 | 0.1% |
| Samoan | 105 | 0.1% |
| Scandinavian | 214 | 0.1% |
| Scotch-Irish | 763 | 0.4% |
| Scottish | 2,008 | 0.9% |
| Seminole | 66 | 0.0% |
| Serbian | 62 | 0.0% |
| Sioux | 7 | 0.0% |
| Slavic | 27 | 0.0% |
| Slovak | 69 | 0.0% |
| Slovene | 122 | 0.1% |
| Somali | 727 | 0.3% |
| South African | 195 | 0.1% |
| South American | 1,139 | 0.5% |
| South American Indian | 127 | 0.1% |
| Spaniard | 364 | 0.2% |
| Spanish | 347 | 0.2% |
| Sri Lankan | 623 | 0.3% |
| Subsaharan African | 4,682 | 2.2% |
| Sudanese | 16 | 0.0% |
| Swedish | 666 | 0.3% |
| Swiss | 313 | 0.2% |
| Syrian | 55 | 0.0% |
| Thai | 1,074 | 0.5% |
| Trinidadian and Tobagonian | 164 | 0.1% |
| Tsimshian | 7 | 0.0% |
| Turkish | 210 | 0.1% |
| U.S. Virgin Islander | 22 | 0.0% |
| Ugandan | 145 | 0.1% |
| Ukrainian | 1,139 | 0.5% |
| Venezuelan | 42 | 0.0% |
| Vietnamese | 51 | 0.0% |
| Welsh | 547 | 0.3% |
| West Indian | 596 | 0.3% |
| Yugoslavian | 262 | 0.1% |
| Zimbabwean | 3 | 0.0% | View All 143 Rows |
Immigrants in Rochester
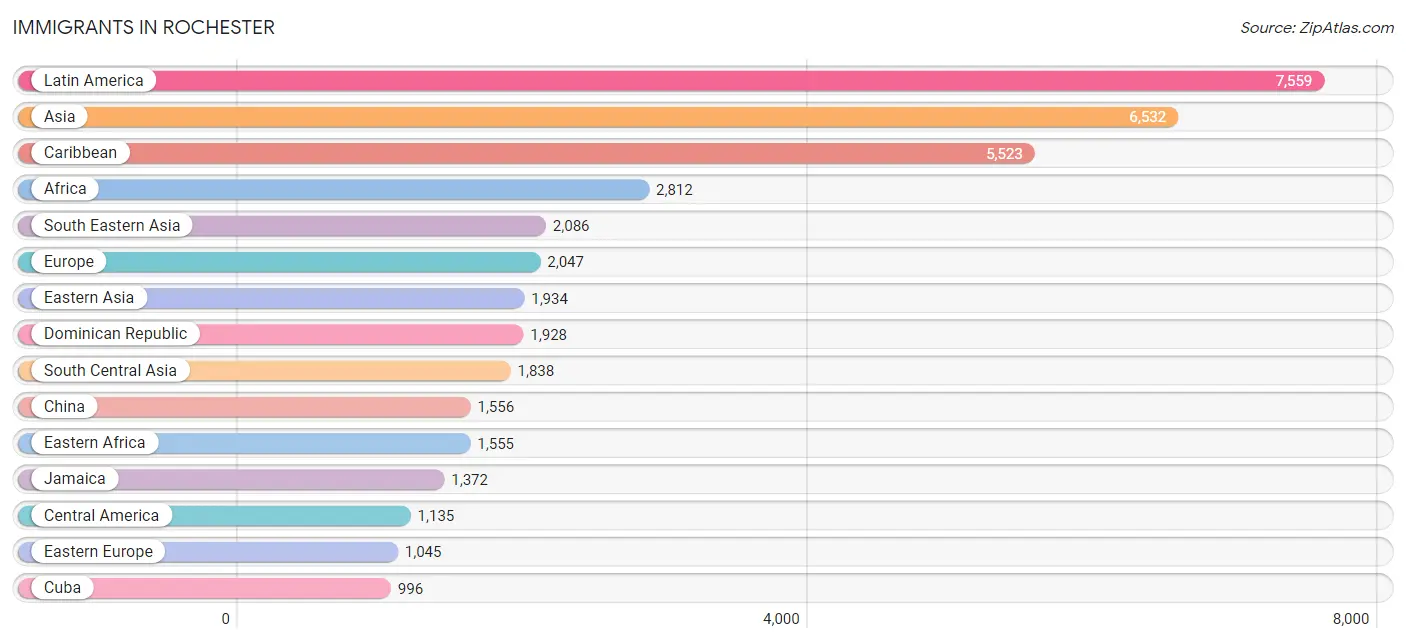
The most numerous immigrant groups reported in Rochester came from Latin America (7,559 | 3.6%), Asia (6,532 | 3.1%), Caribbean (5,523 | 2.6%), Africa (2,812 | 1.3%), and South Eastern Asia (2,086 | 1.0%), together accounting for 11.6% of all Rochester residents.
| Immigration Origin | # Population | % Population |
| Afghanistan | 92 | 0.0% |
| Africa | 2,812 | 1.3% |
| Albania | 19 | 0.0% |
| Argentina | 30 | 0.0% |
| Asia | 6,532 | 3.1% |
| Australia | 12 | 0.0% |
| Bangladesh | 81 | 0.0% |
| Barbados | 20 | 0.0% |
| Belarus | 70 | 0.0% |
| Belize | 250 | 0.1% |
| Bolivia | 7 | 0.0% |
| Bosnia and Herzegovina | 223 | 0.1% |
| Brazil | 45 | 0.0% |
| Bulgaria | 13 | 0.0% |
| Cabo Verde | 74 | 0.0% |
| Cambodia | 56 | 0.0% |
| Canada | 443 | 0.2% |
| Caribbean | 5,523 | 2.6% |
| Central America | 1,135 | 0.5% |
| Chile | 195 | 0.1% |
| China | 1,556 | 0.7% |
| Colombia | 223 | 0.1% |
| Congo | 18 | 0.0% |
| Costa Rica | 28 | 0.0% |
| Croatia | 2 | 0.0% |
| Cuba | 996 | 0.5% |
| Czechoslovakia | 21 | 0.0% |
| Dominican Republic | 1,928 | 0.9% |
| Eastern Africa | 1,555 | 0.7% |
| Eastern Asia | 1,934 | 0.9% |
| Eastern Europe | 1,045 | 0.5% |
| Ecuador | 113 | 0.1% |
| Egypt | 18 | 0.0% |
| El Salvador | 100 | 0.1% |
| England | 53 | 0.0% |
| Eritrea | 39 | 0.0% |
| Ethiopia | 357 | 0.2% |
| Europe | 2,047 | 1.0% |
| France | 26 | 0.0% |
| Germany | 218 | 0.1% |
| Ghana | 81 | 0.0% |
| Greece | 20 | 0.0% |
| Grenada | 76 | 0.0% |
| Guatemala | 84 | 0.0% |
| Guyana | 213 | 0.1% |
| Haiti | 787 | 0.4% |
| Honduras | 93 | 0.0% |
| Hong Kong | 22 | 0.0% |
| Hungary | 6 | 0.0% |
| India | 448 | 0.2% |
| Iran | 207 | 0.1% |
| Iraq | 109 | 0.1% |
| Ireland | 86 | 0.0% |
| Israel | 73 | 0.0% |
| Italy | 171 | 0.1% |
| Jamaica | 1,372 | 0.6% |
| Japan | 57 | 0.0% |
| Kazakhstan | 26 | 0.0% |
| Kenya | 149 | 0.1% |
| Korea | 321 | 0.2% |
| Kuwait | 12 | 0.0% |
| Laos | 165 | 0.1% |
| Latin America | 7,559 | 3.6% |
| Lebanon | 30 | 0.0% |
| Liberia | 113 | 0.1% |
| Lithuania | 21 | 0.0% |
| Malaysia | 58 | 0.0% |
| Mexico | 444 | 0.2% |
| Middle Africa | 194 | 0.1% |
| Morocco | 45 | 0.0% |
| Nepal | 593 | 0.3% |
| Netherlands | 34 | 0.0% |
| Nicaragua | 63 | 0.0% |
| Nigeria | 205 | 0.1% |
| North Macedonia | 20 | 0.0% |
| Northern Africa | 113 | 0.1% |
| Northern Europe | 322 | 0.2% |
| Oceania | 25 | 0.0% |
| Pakistan | 76 | 0.0% |
| Panama | 73 | 0.0% |
| Peru | 51 | 0.0% |
| Philippines | 426 | 0.2% |
| Poland | 102 | 0.1% |
| Portugal | 9 | 0.0% |
| Russia | 163 | 0.1% |
| Saudi Arabia | 78 | 0.0% |
| Scotland | 3 | 0.0% |
| Senegal | 4 | 0.0% |
| Serbia | 33 | 0.0% |
| Singapore | 27 | 0.0% |
| Somalia | 590 | 0.3% |
| South Africa | 150 | 0.1% |
| South America | 901 | 0.4% |
| South Central Asia | 1,838 | 0.9% |
| South Eastern Asia | 2,086 | 1.0% |
| Southern Europe | 363 | 0.2% |
| Spain | 163 | 0.1% |
| Sri Lanka | 48 | 0.0% |
| St. Vincent and the Grenadines | 1 | 0.0% |
| Sudan | 40 | 0.0% |
| Sweden | 90 | 0.0% |
| Switzerland | 39 | 0.0% |
| Taiwan | 92 | 0.0% |
| Thailand | 769 | 0.4% |
| Trinidad and Tobago | 202 | 0.1% |
| Turkey | 55 | 0.0% |
| Uganda | 144 | 0.1% |
| Ukraine | 284 | 0.1% |
| Uzbekistan | 14 | 0.0% |
| Venezuela | 24 | 0.0% |
| Vietnam | 315 | 0.2% |
| Western Africa | 640 | 0.3% |
| Western Asia | 641 | 0.3% |
| Western Europe | 317 | 0.2% |
| Yemen | 261 | 0.1% |
| Zaire | 176 | 0.1% |
| Zimbabwe | 3 | 0.0% | View All 117 Rows |
Sex and Age in Rochester
Sex and Age in Rochester
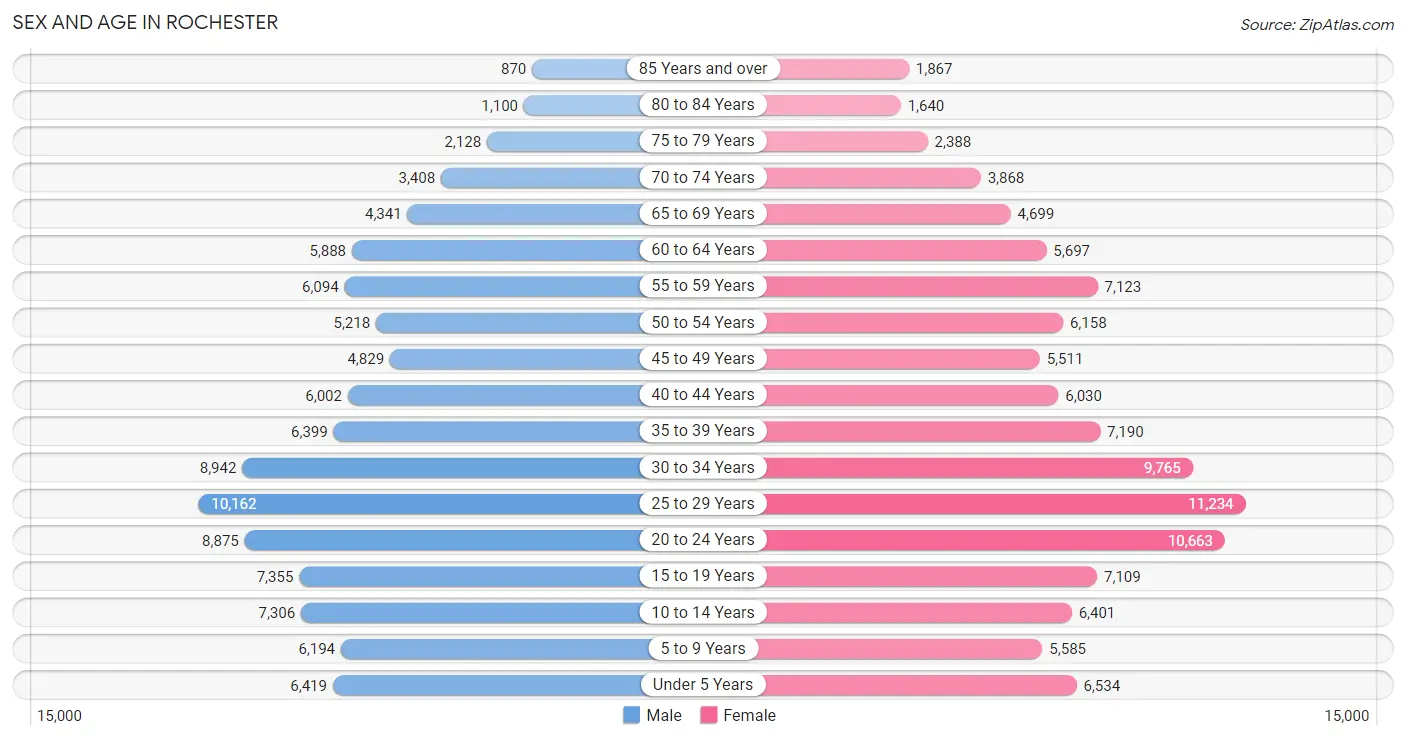
The most populous age groups in Rochester are 25 to 29 Years (10,162 | 10.0%) for men and 25 to 29 Years (11,234 | 10.3%) for women.
| Age Bracket | Male | Female |
| Under 5 Years | 6,419 (6.3%) | 6,534 (6.0%) |
| 5 to 9 Years | 6,194 (6.1%) | 5,585 (5.1%) |
| 10 to 14 Years | 7,306 (7.2%) | 6,401 (5.9%) |
| 15 to 19 Years | 7,355 (7.2%) | 7,109 (6.5%) |
| 20 to 24 Years | 8,875 (8.7%) | 10,663 (9.7%) |
| 25 to 29 Years | 10,162 (10.0%) | 11,234 (10.3%) |
| 30 to 34 Years | 8,942 (8.8%) | 9,765 (8.9%) |
| 35 to 39 Years | 6,399 (6.3%) | 7,190 (6.6%) |
| 40 to 44 Years | 6,002 (5.9%) | 6,030 (5.5%) |
| 45 to 49 Years | 4,829 (4.8%) | 5,511 (5.0%) |
| 50 to 54 Years | 5,218 (5.1%) | 6,158 (5.6%) |
| 55 to 59 Years | 6,094 (6.0%) | 7,123 (6.5%) |
| 60 to 64 Years | 5,888 (5.8%) | 5,697 (5.2%) |
| 65 to 69 Years | 4,341 (4.3%) | 4,699 (4.3%) |
| 70 to 74 Years | 3,408 (3.4%) | 3,868 (3.5%) |
| 75 to 79 Years | 2,128 (2.1%) | 2,388 (2.2%) |
| 80 to 84 Years | 1,100 (1.1%) | 1,640 (1.5%) |
| 85 Years and over | 870 (0.9%) | 1,867 (1.7%) |
| Total | 101,530 (100.0%) | 109,462 (100.0%) |
Families and Households in Rochester
Median Family Size in Rochester
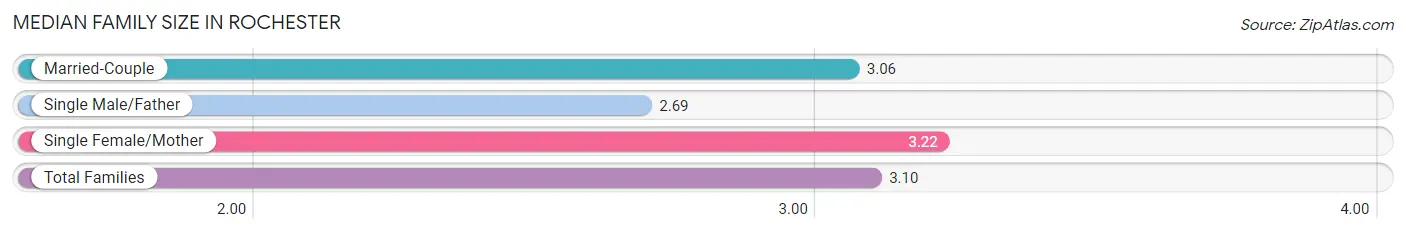
The median family size in Rochester is 3.10 persons per family, with single female/mother families (20,045 | 46.4%) accounting for the largest median family size of 3.22 persons per family. On the other hand, single male/father families (4,396 | 10.2%) represent the smallest median family size with 2.69 persons per family.
| Family Type | # Families | Family Size |
| Married-Couple | 18,794 (43.5%) | 3.06 |
| Single Male/Father | 4,396 (10.2%) | 2.69 |
| Single Female/Mother | 20,045 (46.4%) | 3.22 |
| Total Families | 43,235 (100.0%) | 3.10 |
Median Household Size in Rochester
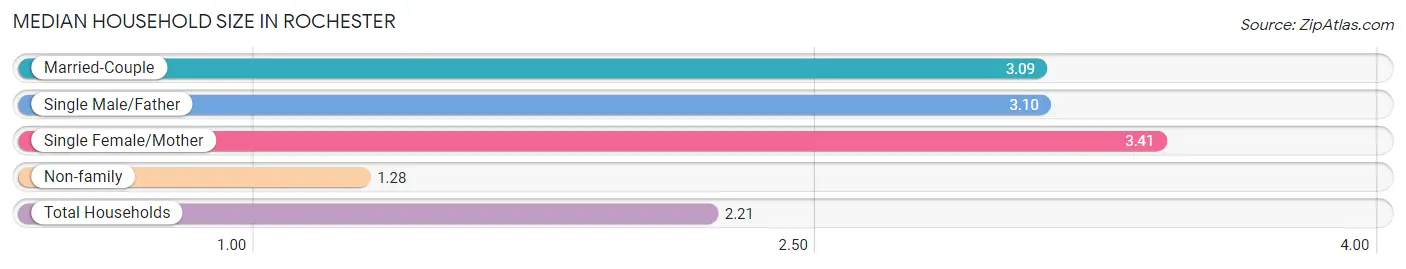
The median household size in Rochester is 2.21 persons per household, with single female/mother households (20,045 | 22.0%) accounting for the largest median household size of 3.41 persons per household. non-family households (48,080 | 52.6%) represent the smallest median household size with 1.28 persons per household.
| Household Type | # Households | Household Size |
| Married-Couple | 18,794 (20.6%) | 3.09 |
| Single Male/Father | 4,396 (4.8%) | 3.10 |
| Single Female/Mother | 20,045 (22.0%) | 3.41 |
| Non-family | 48,080 (52.6%) | 1.28 |
| Total Households | 91,315 (100.0%) | 2.21 |
Household Size by Marriage Status in Rochester
Out of a total of 91,315 households in Rochester, 43,235 (47.3%) are family households, while 48,080 (52.6%) are nonfamily households. The most numerous type of family households are 2-person households, comprising 18,767, and the most common type of nonfamily households are 1-person households, comprising 37,742.
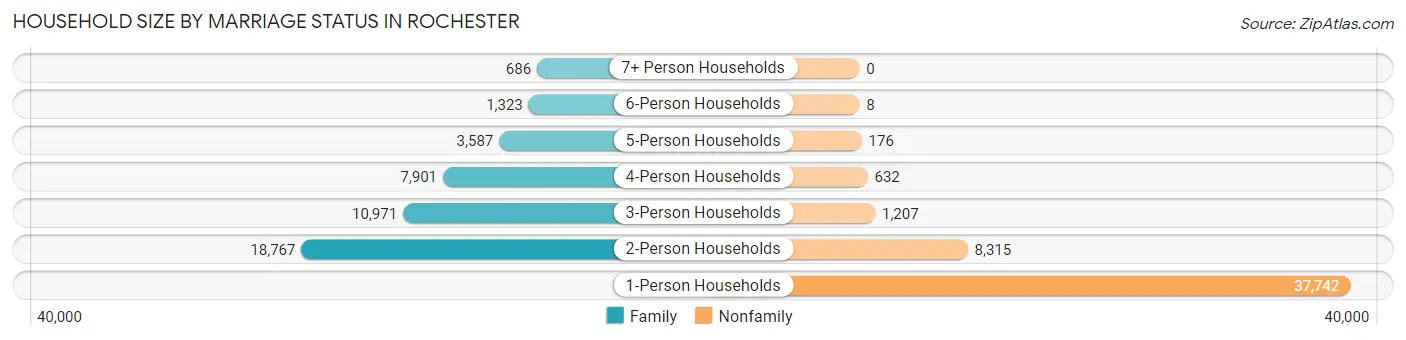
| Household Size | Family Households | Nonfamily Households |
| 1-Person Households | - | 37,742 (41.3%) |
| 2-Person Households | 18,767 (20.5%) | 8,315 (9.1%) |
| 3-Person Households | 10,971 (12.0%) | 1,207 (1.3%) |
| 4-Person Households | 7,901 (8.6%) | 632 (0.7%) |
| 5-Person Households | 3,587 (3.9%) | 176 (0.2%) |
| 6-Person Households | 1,323 (1.5%) | 8 (0.0%) |
| 7+ Person Households | 686 (0.7%) | 0 (0.0%) |
| Total | 43,235 (47.3%) | 48,080 (52.6%) |
Female Fertility in Rochester
Fertility by Age in Rochester
Average fertility rate in Rochester is 49.0 births per 1,000 women. Women in the age bracket of 20 to 34 years have the highest fertility rate with 73.0 births per 1,000 women. Women in the age bracket of 20 to 34 years acount for 79.6% of all women with births.
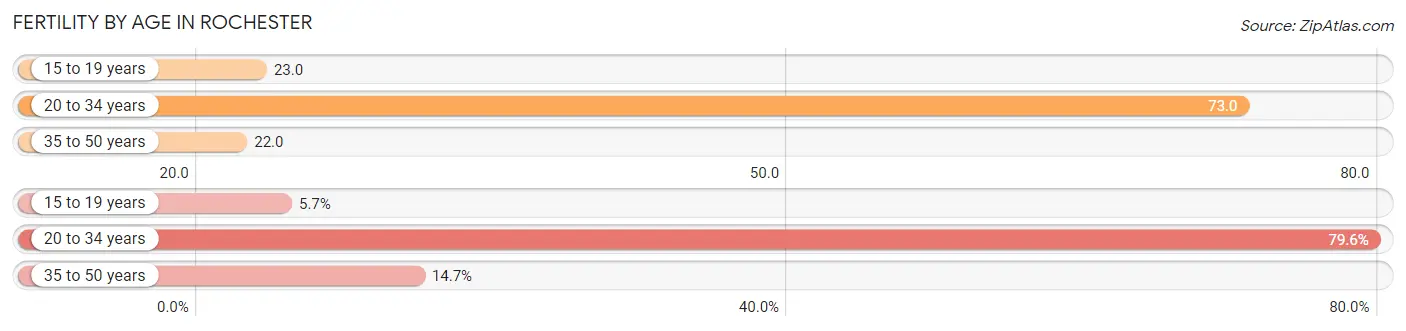
| Age Bracket | Women with Births | Births / 1,000 Women |
| 15 to 19 years | 165 (5.7%) | 23.0 |
| 20 to 34 years | 2,303 (79.6%) | 73.0 |
| 35 to 50 years | 426 (14.7%) | 22.0 |
| Total | 2,894 (100.0%) | 49.0 |
Fertility by Age by Marriage Status in Rochester
38.8% of women with births (2,894) in Rochester are married. The highest percentage of unmarried women with births falls into 15 to 19 years age bracket with 100.0% of them unmarried at the time of birth, while the lowest percentage of unmarried women with births belong to 35 to 50 years age bracket with 40.1% of them unmarried.
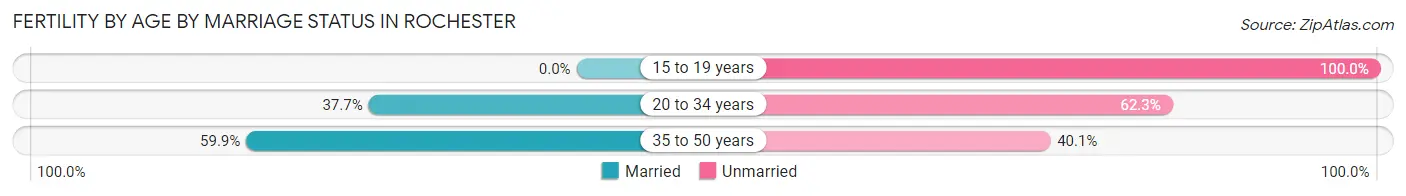
| Age Bracket | Married | Unmarried |
| 15 to 19 years | 0 (0.0%) | 165 (100.0%) |
| 20 to 34 years | 868 (37.7%) | 1,435 (62.3%) |
| 35 to 50 years | 255 (59.9%) | 171 (40.1%) |
| Total | 1,123 (38.8%) | 1,771 (61.2%) |
Fertility by Education in Rochester
Average fertility rate in Rochester is 49.0 births per 1,000 women. Women with the education attainment of high school diploma have the highest fertility rate of 74.0 births per 1,000 women, while women with the education attainment of bachelor's degree have the lowest fertility at 39.0 births per 1,000 women. Women with the education attainment of high school diploma represent 33.6% of all women with births.
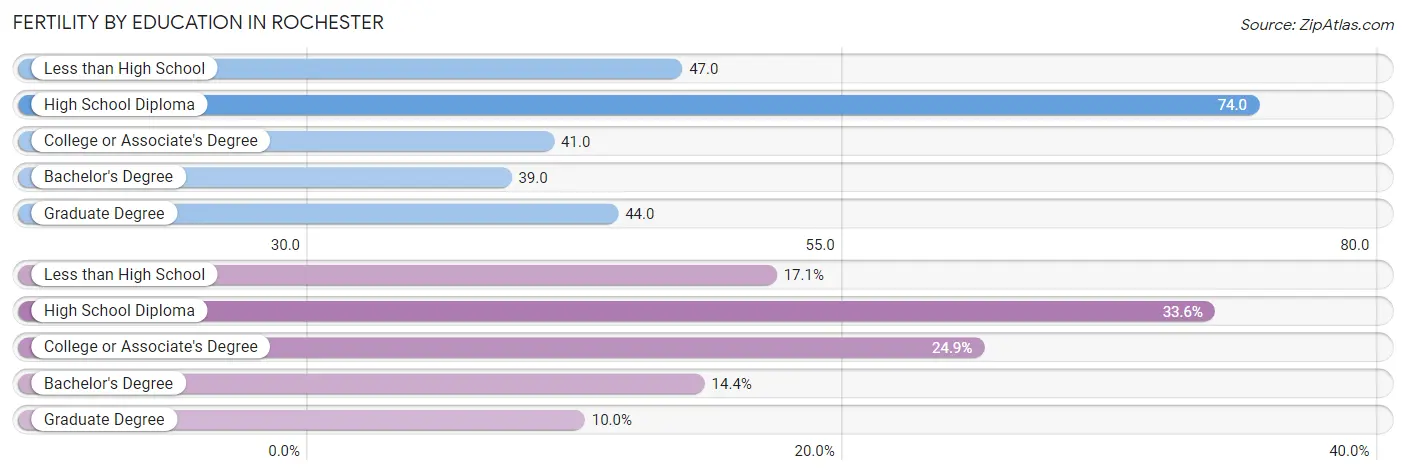
| Educational Attainment | Women with Births | Births / 1,000 Women |
| Less than High School | 496 (17.1%) | 47.0 |
| High School Diploma | 971 (33.6%) | 74.0 |
| College or Associate's Degree | 721 (24.9%) | 41.0 |
| Bachelor's Degree | 418 (14.4%) | 39.0 |
| Graduate Degree | 288 (10.0%) | 44.0 |
| Total | 2,894 (100.0%) | 49.0 |
Fertility by Education by Marriage Status in Rochester
61.2% of women with births in Rochester are unmarried. Women with the educational attainment of bachelor's degree are most likely to be married with 86.1% of them married at childbirth, while women with the educational attainment of high school diploma are least likely to be married with 78.3% of them unmarried at childbirth.
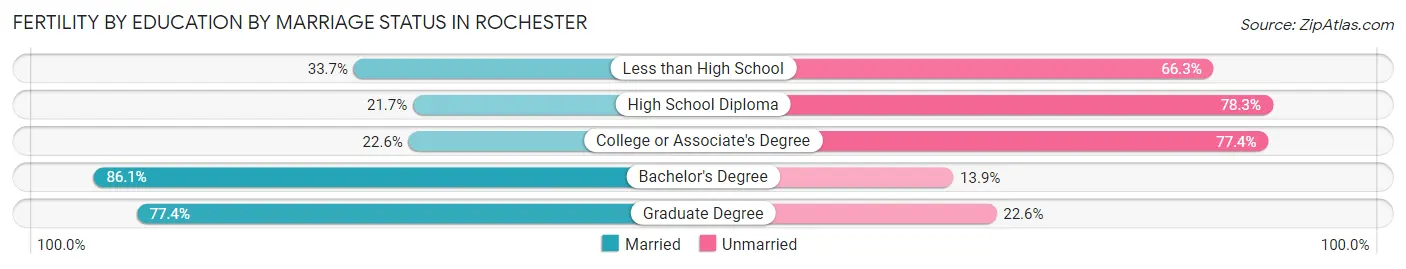
| Educational Attainment | Married | Unmarried |
| Less than High School | 167 (33.7%) | 329 (66.3%) |
| High School Diploma | 211 (21.7%) | 760 (78.3%) |
| College or Associate's Degree | 163 (22.6%) | 558 (77.4%) |
| Bachelor's Degree | 360 (86.1%) | 58 (13.9%) |
| Graduate Degree | 223 (77.4%) | 65 (22.6%) |
| Total | 1,123 (38.8%) | 1,771 (61.2%) |
Employment Characteristics in Rochester
Employment by Class of Employer in Rochester
Among the 93,269 employed individuals in Rochester, private company employees (58,409 | 62.6%), not-for-profit organizations (17,521 | 18.8%), and local government employees (7,528 | 8.1%) make up the most common classes of employment.
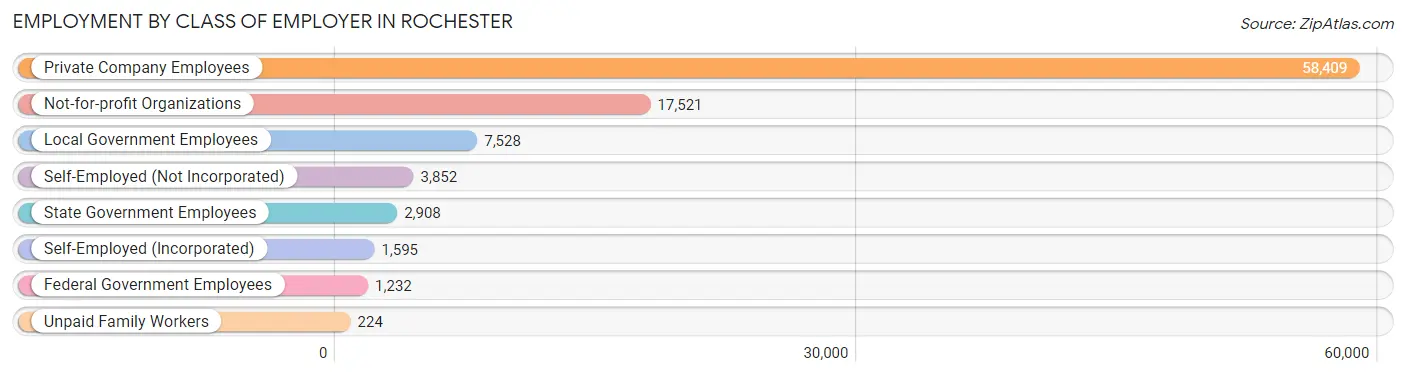
| Employer Class | # Employees | % Employees |
| Private Company Employees | 58,409 | 62.6% |
| Self-Employed (Incorporated) | 1,595 | 1.7% |
| Self-Employed (Not Incorporated) | 3,852 | 4.1% |
| Not-for-profit Organizations | 17,521 | 18.8% |
| Local Government Employees | 7,528 | 8.1% |
| State Government Employees | 2,908 | 3.1% |
| Federal Government Employees | 1,232 | 1.3% |
| Unpaid Family Workers | 224 | 0.2% |
| Total | 93,269 | 100.0% |
Employment Status by Age in Rochester
According to the labor force statistics for Rochester, out of the total population over 16 years of age (170,154), 61.6% or 104,815 individuals are in the labor force, with 8.5% or 8,909 of them unemployed. The age group with the highest labor force participation rate is 25 to 29 years, with 83.6% or 17,887 individuals in the labor force. Within the labor force, the 16 to 19 years age range has the highest percentage of unemployed individuals, with 24.1% or 965 of them being unemployed.
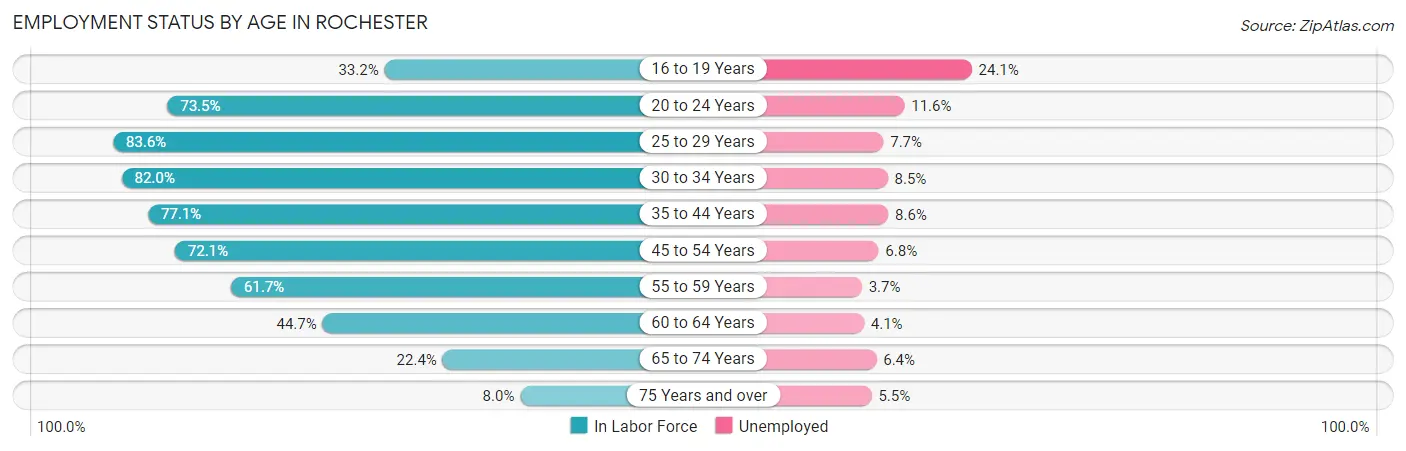
| Age Bracket | In Labor Force | Unemployed |
| 16 to 19 Years | 4,006 (33.2%) | 965 (24.1%) |
| 20 to 24 Years | 14,360 (73.5%) | 1,666 (11.6%) |
| 25 to 29 Years | 17,887 (83.6%) | 1,377 (7.7%) |
| 30 to 34 Years | 15,340 (82.0%) | 1,304 (8.5%) |
| 35 to 44 Years | 19,754 (77.1%) | 1,699 (8.6%) |
| 45 to 54 Years | 15,657 (72.1%) | 1,065 (6.8%) |
| 55 to 59 Years | 8,155 (61.7%) | 302 (3.7%) |
| 60 to 64 Years | 5,178 (44.7%) | 212 (4.1%) |
| 65 to 74 Years | 3,655 (22.4%) | 234 (6.4%) |
| 75 Years and over | 799 (8.0%) | 44 (5.5%) |
| Total | 104,815 (61.6%) | 8,909 (8.5%) |
Employment Status by Educational Attainment in Rochester
According to labor force statistics for Rochester, 73.0% of individuals (81,937) out of the total population between 25 and 64 years of age (112,242) are in the labor force, with 7.3% or 5,981 of them being unemployed. The group with the highest labor force participation rate are those with the educational attainment of bachelor's degree or higher, with 89.5% or 30,381 individuals in the labor force. Within the labor force, individuals with less than high school education have the highest percentage of unemployment, with 14.2% or 1,141 of them being unemployed.
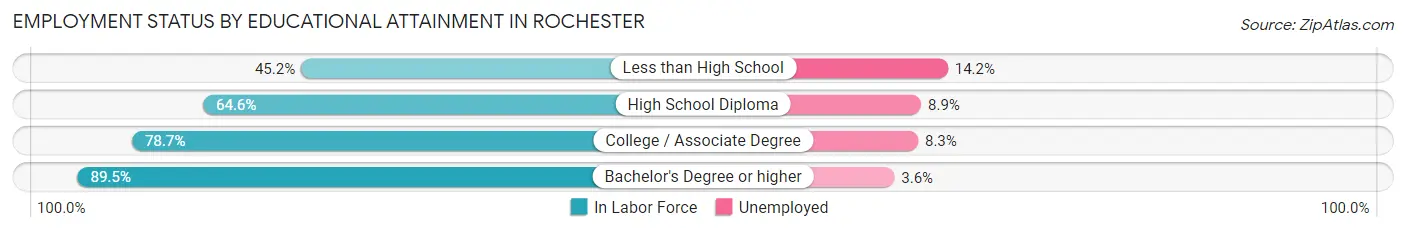
| Educational Attainment | In Labor Force | Unemployed |
| Less than High School | 8,038 (45.2%) | 2,525 (14.2%) |
| High School Diploma | 18,632 (64.6%) | 2,567 (8.9%) |
| College / Associate Degree | 24,925 (78.7%) | 2,629 (8.3%) |
| Bachelor's Degree or higher | 30,381 (89.5%) | 1,222 (3.6%) |
| Total | 81,937 (73.0%) | 8,194 (7.3%) |
Employment Occupations by Sex in Rochester
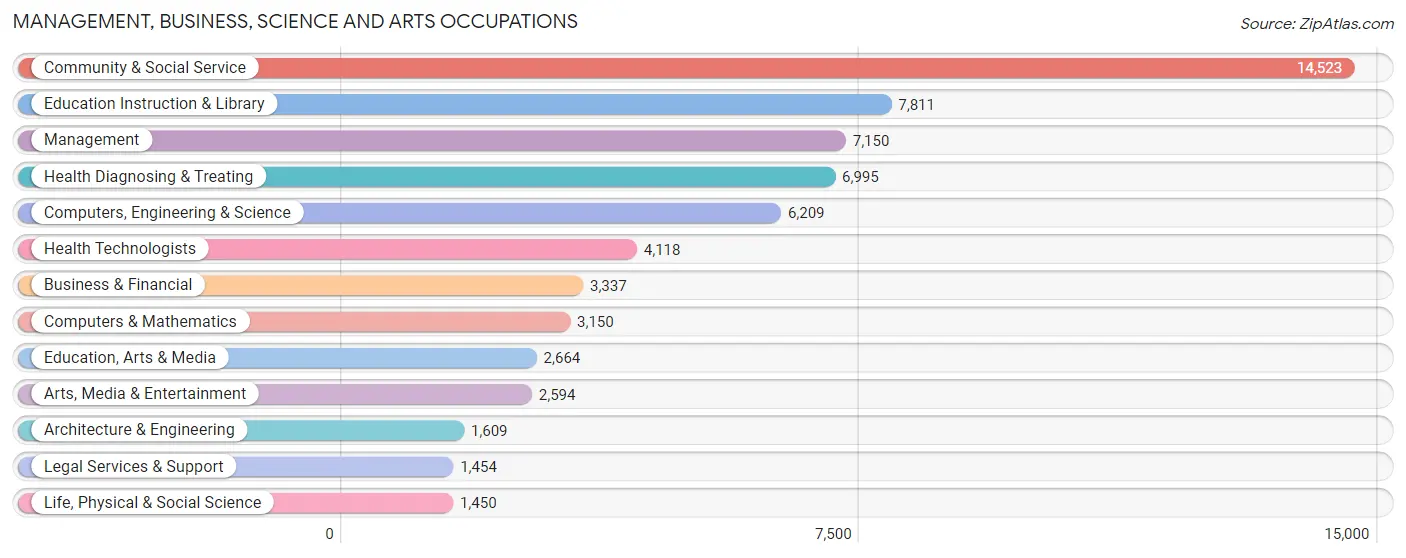
Management, Business, Science and Arts Occupations
The most common Management, Business, Science and Arts occupations in Rochester are Community & Social Service (14,523 | 15.1%), Education Instruction & Library (7,811 | 8.2%), Management (7,150 | 7.5%), Health Diagnosing & Treating (6,995 | 7.3%), and Computers, Engineering & Science (6,209 | 6.5%).
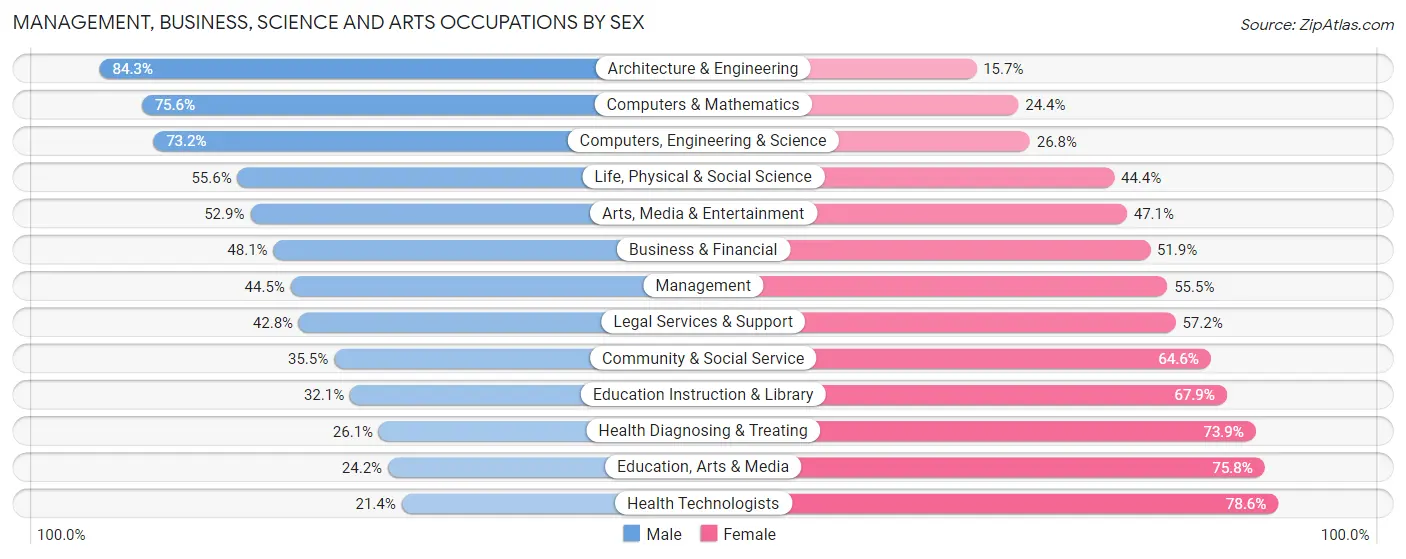
Management, Business, Science and Arts Occupations by Sex
Within the Management, Business, Science and Arts occupations in Rochester, the most male-oriented occupations are Architecture & Engineering (84.3%), Computers & Mathematics (75.6%), and Computers, Engineering & Science (73.2%), while the most female-oriented occupations are Health Technologists (78.6%), Education, Arts & Media (75.8%), and Health Diagnosing & Treating (73.9%).
| Occupation | Male | Female |
| Management | 3,182 (44.5%) | 3,968 (55.5%) |
| Business & Financial | 1,605 (48.1%) | 1,732 (51.9%) |
| Computers, Engineering & Science | 4,543 (73.2%) | 1,666 (26.8%) |
| Computers & Mathematics | 2,380 (75.6%) | 770 (24.4%) |
| Architecture & Engineering | 1,357 (84.3%) | 252 (15.7%) |
| Life, Physical & Social Science | 806 (55.6%) | 644 (44.4%) |
| Community & Social Service | 5,149 (35.4%) | 9,374 (64.5%) |
| Education, Arts & Media | 645 (24.2%) | 2,019 (75.8%) |
| Legal Services & Support | 622 (42.8%) | 832 (57.2%) |
| Education Instruction & Library | 2,509 (32.1%) | 5,302 (67.9%) |
| Arts, Media & Entertainment | 1,373 (52.9%) | 1,221 (47.1%) |
| Health Diagnosing & Treating | 1,825 (26.1%) | 5,170 (73.9%) |
| Health Technologists | 880 (21.4%) | 3,238 (78.6%) |
| Total (Category) | 16,304 (42.7%) | 21,910 (57.3%) |
| Total (Overall) | 44,923 (46.9%) | 50,944 (53.1%) |
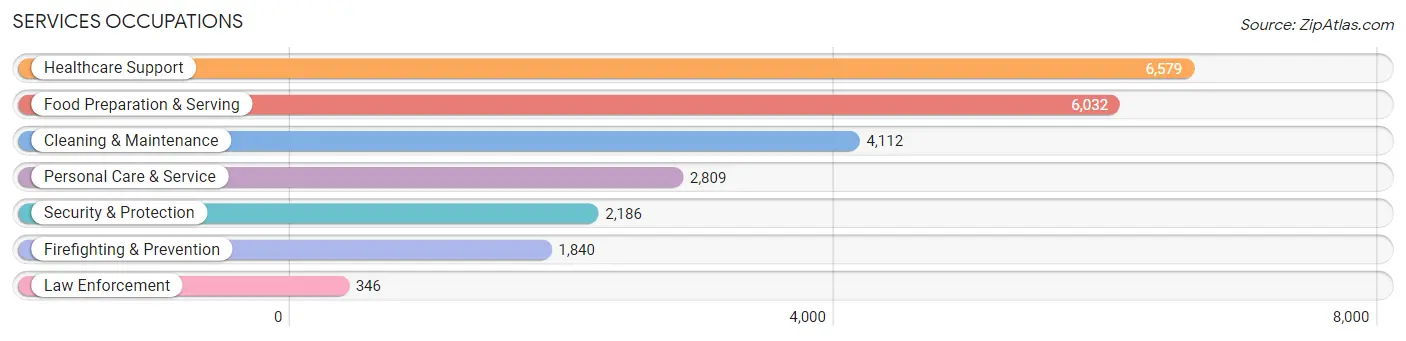
Services Occupations
The most common Services occupations in Rochester are Healthcare Support (6,579 | 6.9%), Food Preparation & Serving (6,032 | 6.3%), Cleaning & Maintenance (4,112 | 4.3%), Personal Care & Service (2,809 | 2.9%), and Security & Protection (2,186 | 2.3%).
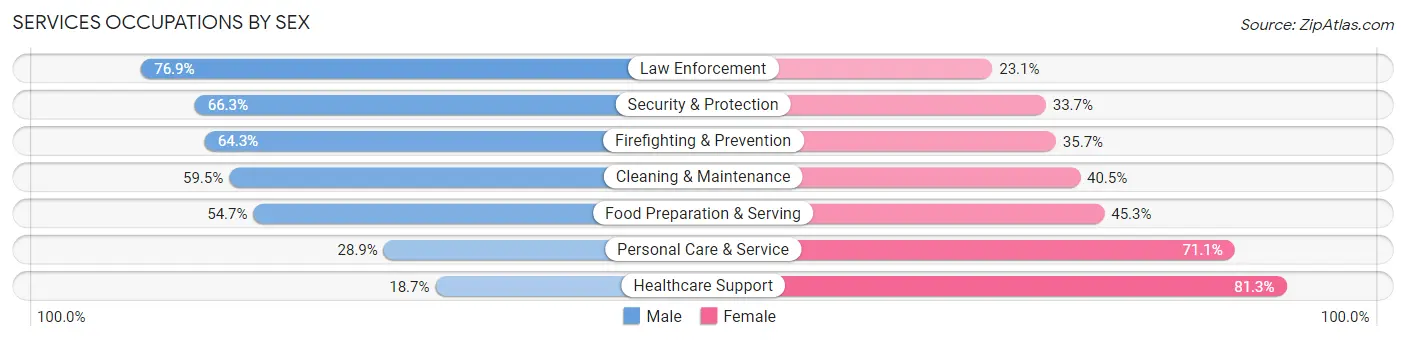
Services Occupations by Sex
Within the Services occupations in Rochester, the most male-oriented occupations are Law Enforcement (76.9%), Security & Protection (66.3%), and Firefighting & Prevention (64.3%), while the most female-oriented occupations are Healthcare Support (81.3%), Personal Care & Service (71.1%), and Food Preparation & Serving (45.3%).
| Occupation | Male | Female |
| Healthcare Support | 1,228 (18.7%) | 5,351 (81.3%) |
| Security & Protection | 1,449 (66.3%) | 737 (33.7%) |
| Firefighting & Prevention | 1,183 (64.3%) | 657 (35.7%) |
| Law Enforcement | 266 (76.9%) | 80 (23.1%) |
| Food Preparation & Serving | 3,300 (54.7%) | 2,732 (45.3%) |
| Cleaning & Maintenance | 2,447 (59.5%) | 1,665 (40.5%) |
| Personal Care & Service | 812 (28.9%) | 1,997 (71.1%) |
| Total (Category) | 9,236 (42.5%) | 12,482 (57.5%) |
| Total (Overall) | 44,923 (46.9%) | 50,944 (53.1%) |
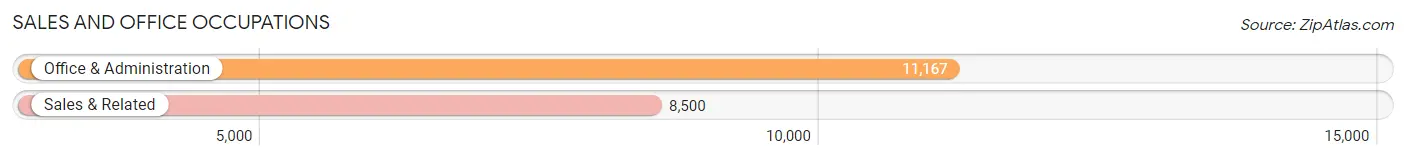
Sales and Office Occupations
The most common Sales and Office occupations in Rochester are Office & Administration (11,167 | 11.7%), and Sales & Related (8,500 | 8.9%).
Sales and Office Occupations by Sex
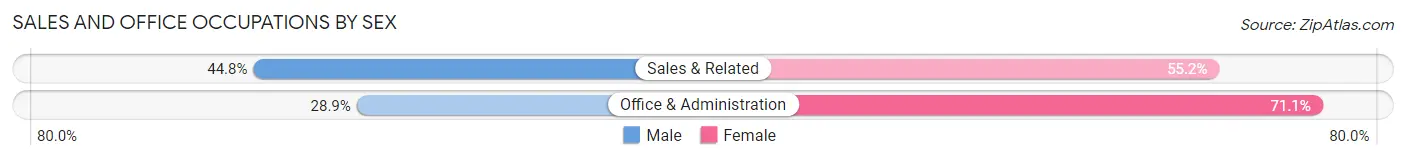
| Occupation | Male | Female |
| Sales & Related | 3,810 (44.8%) | 4,690 (55.2%) |
| Office & Administration | 3,230 (28.9%) | 7,937 (71.1%) |
| Total (Category) | 7,040 (35.8%) | 12,627 (64.2%) |
| Total (Overall) | 44,923 (46.9%) | 50,944 (53.1%) |
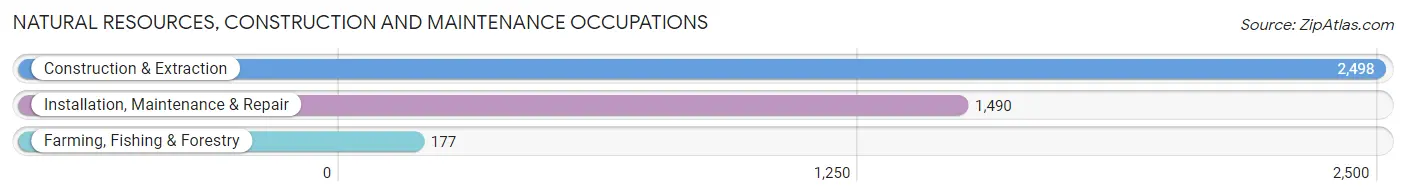
Natural Resources, Construction and Maintenance Occupations
The most common Natural Resources, Construction and Maintenance occupations in Rochester are Construction & Extraction (2,498 | 2.6%), Installation, Maintenance & Repair (1,490 | 1.5%), and Farming, Fishing & Forestry (177 | 0.2%).
Natural Resources, Construction and Maintenance Occupations by Sex
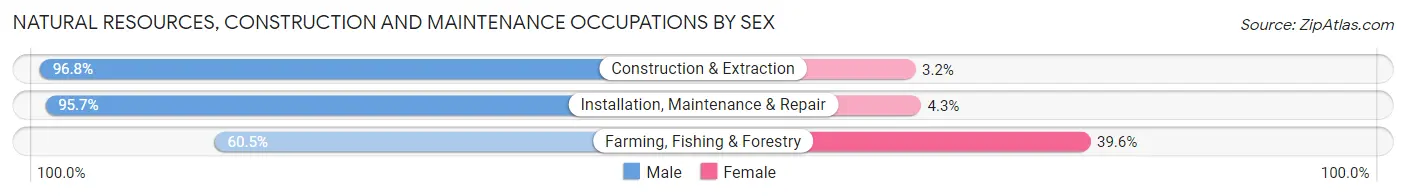
| Occupation | Male | Female |
| Farming, Fishing & Forestry | 107 (60.5%) | 70 (39.6%) |
| Construction & Extraction | 2,419 (96.8%) | 79 (3.2%) |
| Installation, Maintenance & Repair | 1,426 (95.7%) | 64 (4.3%) |
| Total (Category) | 3,952 (94.9%) | 213 (5.1%) |
| Total (Overall) | 44,923 (46.9%) | 50,944 (53.1%) |
Production, Transportation and Moving Occupations
The most common Production, Transportation and Moving occupations in Rochester are Production (5,486 | 5.7%), Transportation (3,456 | 3.6%), and Material Moving (3,161 | 3.3%).
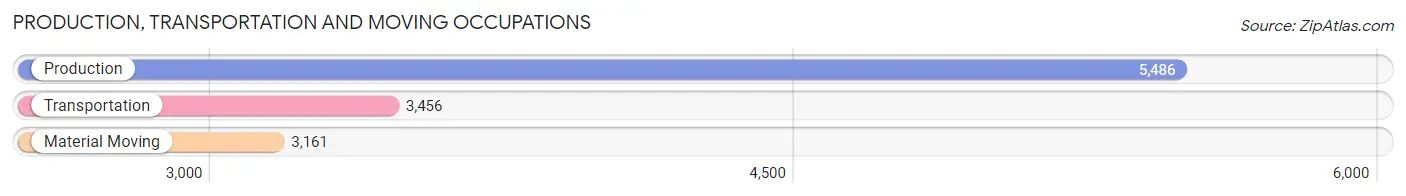
Production, Transportation and Moving Occupations by Sex
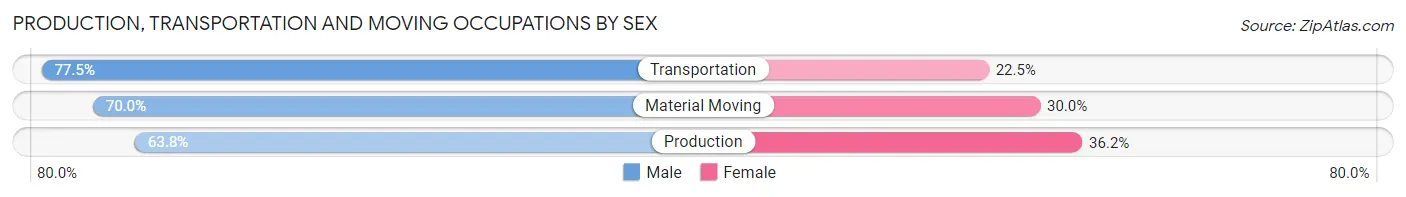
| Occupation | Male | Female |
| Production | 3,500 (63.8%) | 1,986 (36.2%) |
| Transportation | 2,679 (77.5%) | 777 (22.5%) |
| Material Moving | 2,212 (70.0%) | 949 (30.0%) |
| Total (Category) | 8,391 (69.3%) | 3,712 (30.7%) |
| Total (Overall) | 44,923 (46.9%) | 50,944 (53.1%) |
Employment Industries by Sex in Rochester
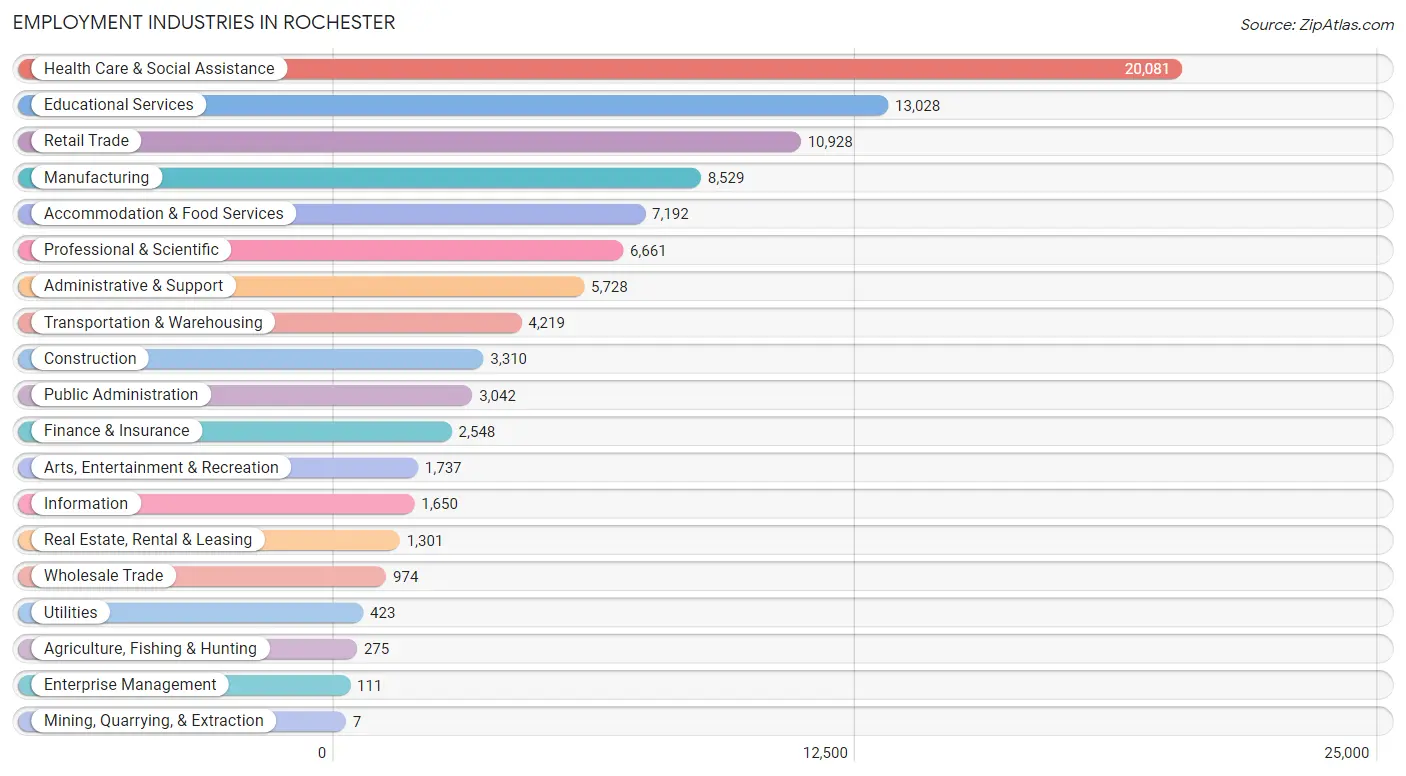
Employment Industries in Rochester
The major employment industries in Rochester include Health Care & Social Assistance (20,081 | 20.9%), Educational Services (13,028 | 13.6%), Retail Trade (10,928 | 11.4%), Manufacturing (8,529 | 8.9%), and Accommodation & Food Services (7,192 | 7.5%).
Employment Industries by Sex in Rochester
The Rochester industries that see more men than women are Mining, Quarrying, & Extraction (100.0%), Construction (89.9%), and Utilities (79.0%), whereas the industries that tend to have a higher number of women are Health Care & Social Assistance (74.2%), Educational Services (63.8%), and Public Administration (60.8%).
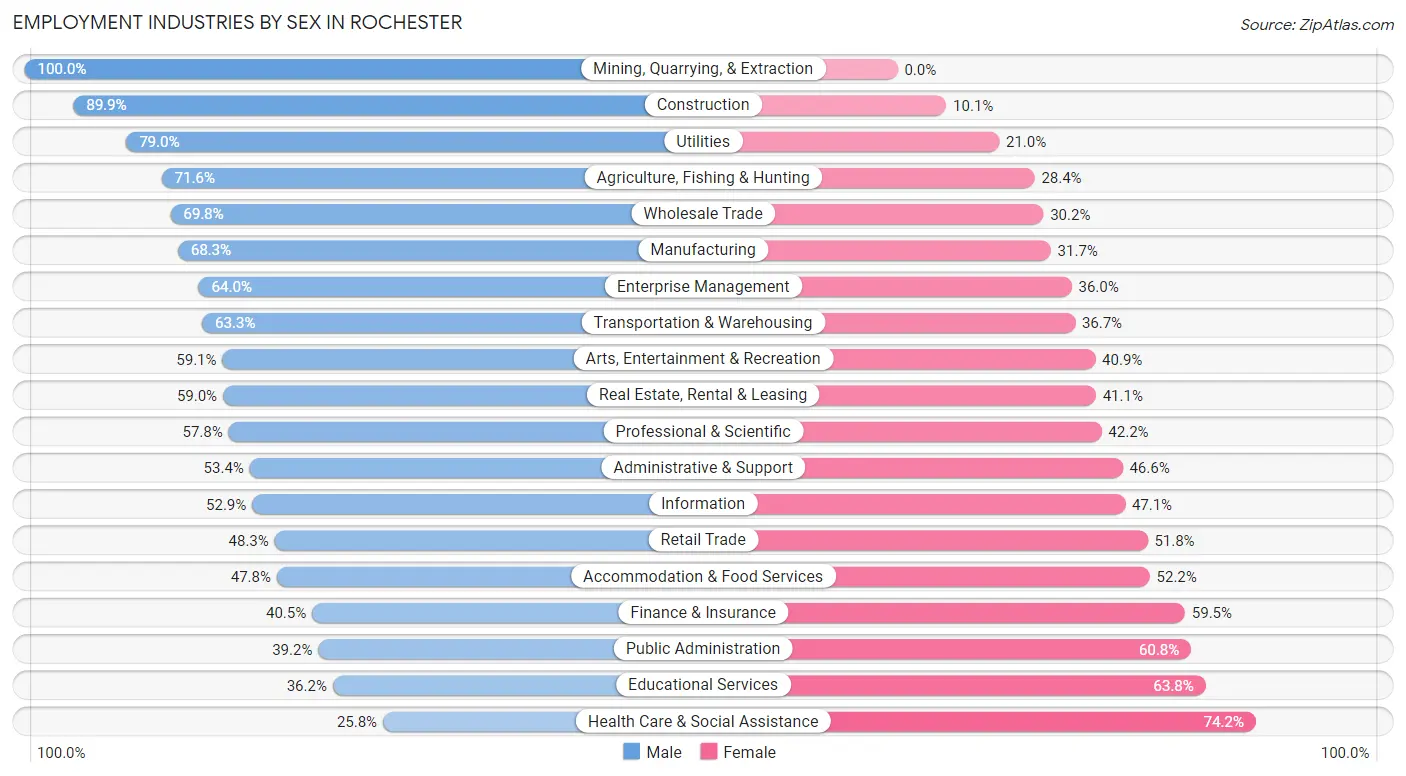
| Industry | Male | Female |
| Agriculture, Fishing & Hunting | 197 (71.6%) | 78 (28.4%) |
| Mining, Quarrying, & Extraction | 7 (100.0%) | 0 (0.0%) |
| Construction | 2,976 (89.9%) | 334 (10.1%) |
| Manufacturing | 5,824 (68.3%) | 2,705 (31.7%) |
| Wholesale Trade | 680 (69.8%) | 294 (30.2%) |
| Retail Trade | 5,273 (48.2%) | 5,655 (51.7%) |
| Transportation & Warehousing | 2,669 (63.3%) | 1,550 (36.7%) |
| Utilities | 334 (79.0%) | 89 (21.0%) |
| Information | 873 (52.9%) | 777 (47.1%) |
| Finance & Insurance | 1,032 (40.5%) | 1,516 (59.5%) |
| Real Estate, Rental & Leasing | 767 (59.0%) | 534 (41.0%) |
| Professional & Scientific | 3,849 (57.8%) | 2,812 (42.2%) |
| Enterprise Management | 71 (64.0%) | 40 (36.0%) |
| Administrative & Support | 3,060 (53.4%) | 2,668 (46.6%) |
| Educational Services | 4,719 (36.2%) | 8,309 (63.8%) |
| Health Care & Social Assistance | 5,186 (25.8%) | 14,895 (74.2%) |
| Arts, Entertainment & Recreation | 1,026 (59.1%) | 711 (40.9%) |
| Accommodation & Food Services | 3,438 (47.8%) | 3,754 (52.2%) |
| Public Administration | 1,193 (39.2%) | 1,849 (60.8%) |
| Total | 44,923 (46.9%) | 50,944 (53.1%) |
Education in Rochester
School Enrollment in Rochester
The most common levels of schooling among the 54,344 students in Rochester are college / undergraduate (13,371 | 24.6%), middle school (10,980 | 20.2%), and high school (10,635 | 19.6%).
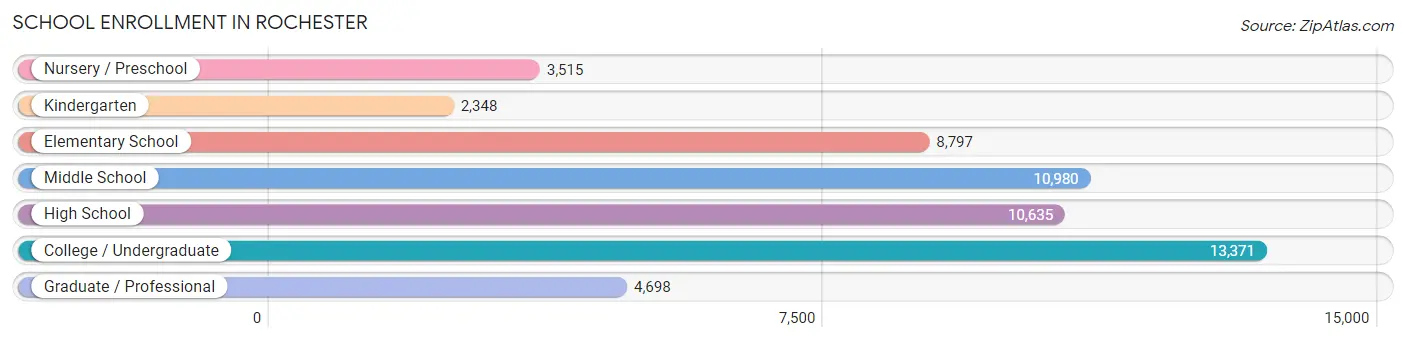
| School Level | # Students | % Students |
| Nursery / Preschool | 3,515 | 6.5% |
| Kindergarten | 2,348 | 4.3% |
| Elementary School | 8,797 | 16.2% |
| Middle School | 10,980 | 20.2% |
| High School | 10,635 | 19.6% |
| College / Undergraduate | 13,371 | 24.6% |
| Graduate / Professional | 4,698 | 8.6% |
| Total | 54,344 | 100.0% |
School Enrollment by Age by Funding Source in Rochester
Out of a total of 54,344 students who are enrolled in schools in Rochester, 14,238 (26.2%) attend a private institution, while the remaining 40,106 (73.8%) are enrolled in public schools. The age group of 20 to 24 year olds has the highest likelihood of being enrolled in private schools, with 4,412 (60.4% in the age bracket) enrolled. Conversely, the age group of 5 to 9 year old has the lowest likelihood of being enrolled in a private school, with 10,109 (90.9% in the age bracket) attending a public institution.
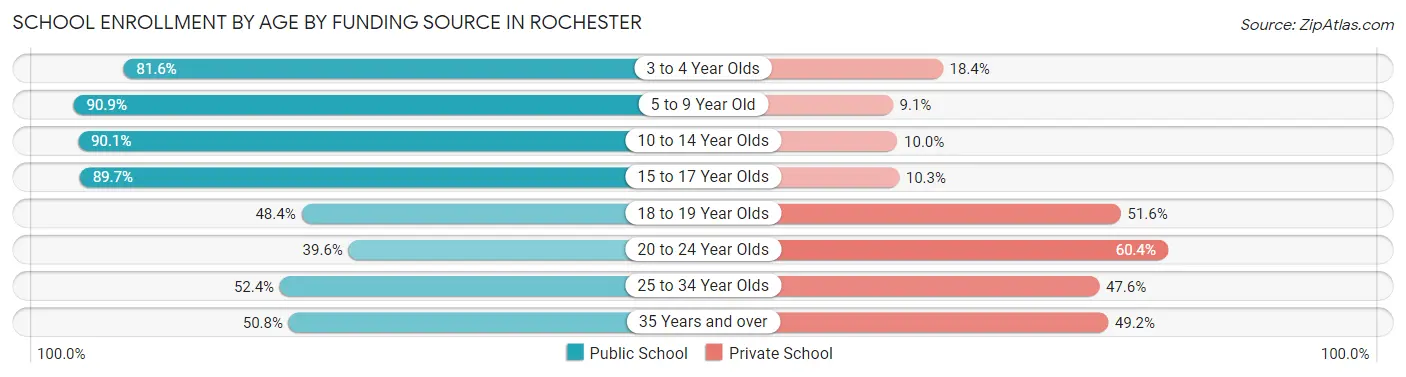
| Age Bracket | Public School | Private School |
| 3 to 4 Year Olds | 2,451 (81.6%) | 553 (18.4%) |
| 5 to 9 Year Old | 10,109 (90.9%) | 1,013 (9.1%) |
| 10 to 14 Year Olds | 11,835 (90.0%) | 1,308 (10.0%) |
| 15 to 17 Year Olds | 6,509 (89.7%) | 745 (10.3%) |
| 18 to 19 Year Olds | 2,506 (48.4%) | 2,669 (51.6%) |
| 20 to 24 Year Olds | 2,898 (39.6%) | 4,412 (60.4%) |
| 25 to 34 Year Olds | 2,584 (52.4%) | 2,344 (47.6%) |
| 35 Years and over | 1,223 (50.8%) | 1,185 (49.2%) |
| Total | 40,106 (73.8%) | 14,238 (26.2%) |
Educational Attainment by Field of Study in Rochester
Business (5,771 | 12.9%), social sciences (4,042 | 9.0%), visual & performing arts (3,845 | 8.6%), science & technology (3,799 | 8.5%), and education (3,701 | 8.2%) are the most common fields of study among 44,893 individuals in Rochester who have obtained a bachelor's degree or higher.
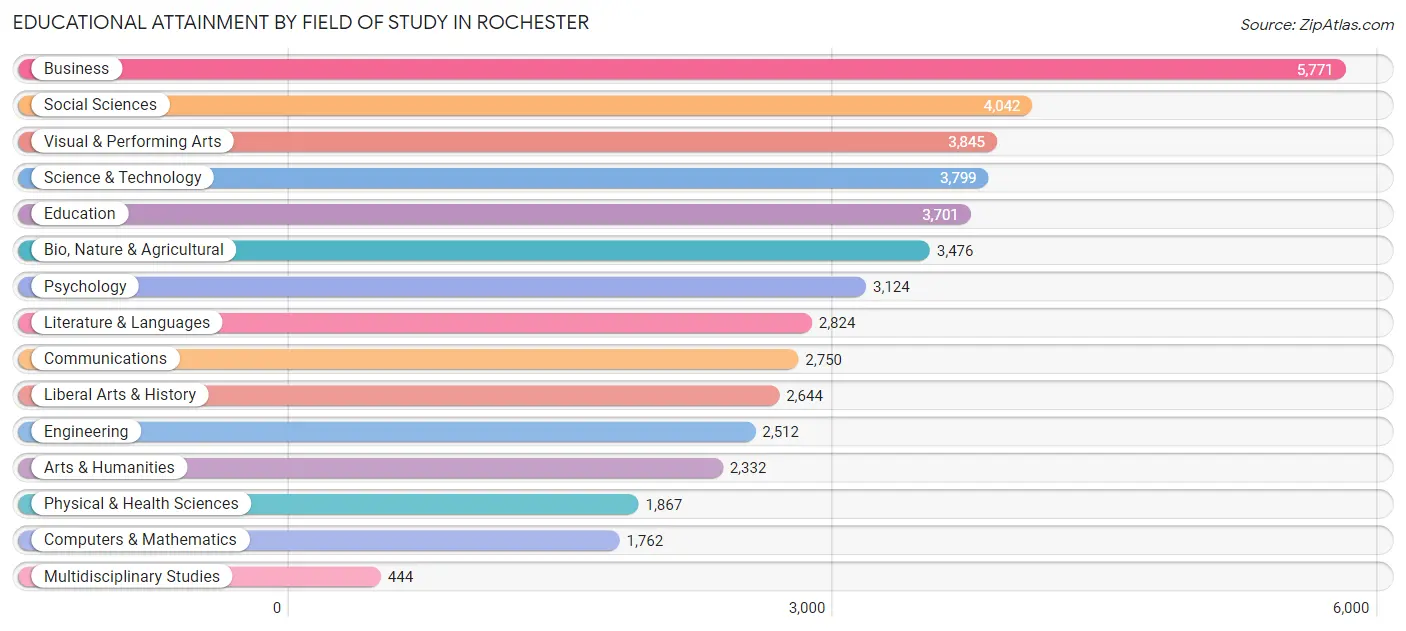
| Field of Study | # Graduates | % Graduates |
| Computers & Mathematics | 1,762 | 3.9% |
| Bio, Nature & Agricultural | 3,476 | 7.7% |
| Physical & Health Sciences | 1,867 | 4.2% |
| Psychology | 3,124 | 7.0% |
| Social Sciences | 4,042 | 9.0% |
| Engineering | 2,512 | 5.6% |
| Multidisciplinary Studies | 444 | 1.0% |
| Science & Technology | 3,799 | 8.5% |
| Business | 5,771 | 12.9% |
| Education | 3,701 | 8.2% |
| Literature & Languages | 2,824 | 6.3% |
| Liberal Arts & History | 2,644 | 5.9% |
| Visual & Performing Arts | 3,845 | 8.6% |
| Communications | 2,750 | 6.1% |
| Arts & Humanities | 2,332 | 5.2% |
| Total | 44,893 | 100.0% |
Transportation & Commute in Rochester
Vehicle Availability by Sex in Rochester
The most prevalent vehicle ownership categories in Rochester are males with 2 vehicles (16,349, accounting for 37.8%) and females with 2 vehicles (17,220, making up 33.8%).
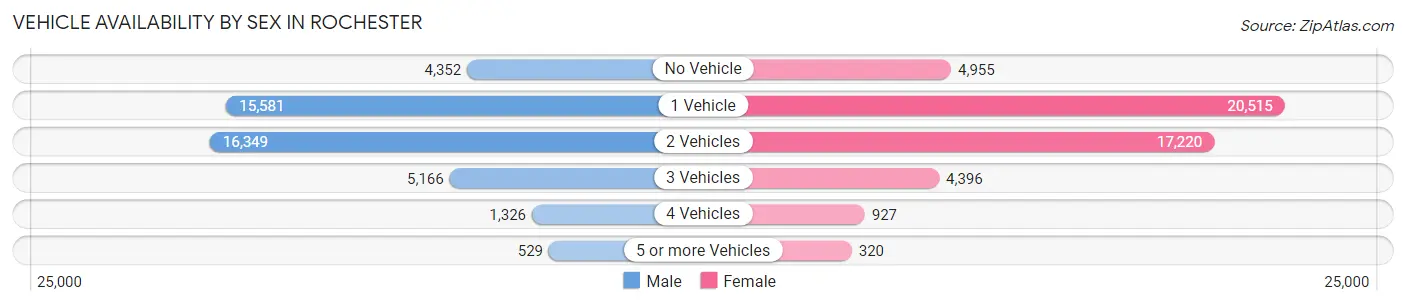
| Vehicles Available | Male | Female |
| No Vehicle | 4,352 (10.1%) | 4,955 (10.2%) |
| 1 Vehicle | 15,581 (36.0%) | 20,515 (42.4%) |
| 2 Vehicles | 16,349 (37.8%) | 17,220 (35.6%) |
| 3 Vehicles | 5,166 (11.9%) | 4,396 (9.1%) |
| 4 Vehicles | 1,326 (3.1%) | 927 (1.9%) |
| 5 or more Vehicles | 529 (1.2%) | 320 (0.7%) |
| Total | 43,303 (100.0%) | 48,333 (100.0%) |
Commute Time in Rochester
The most frequently occuring commute durations in Rochester are 15 to 19 minutes (21,412 commuters, 25.4%), 10 to 14 minutes (18,321 commuters, 21.8%), and 20 to 24 minutes (13,621 commuters, 16.2%).
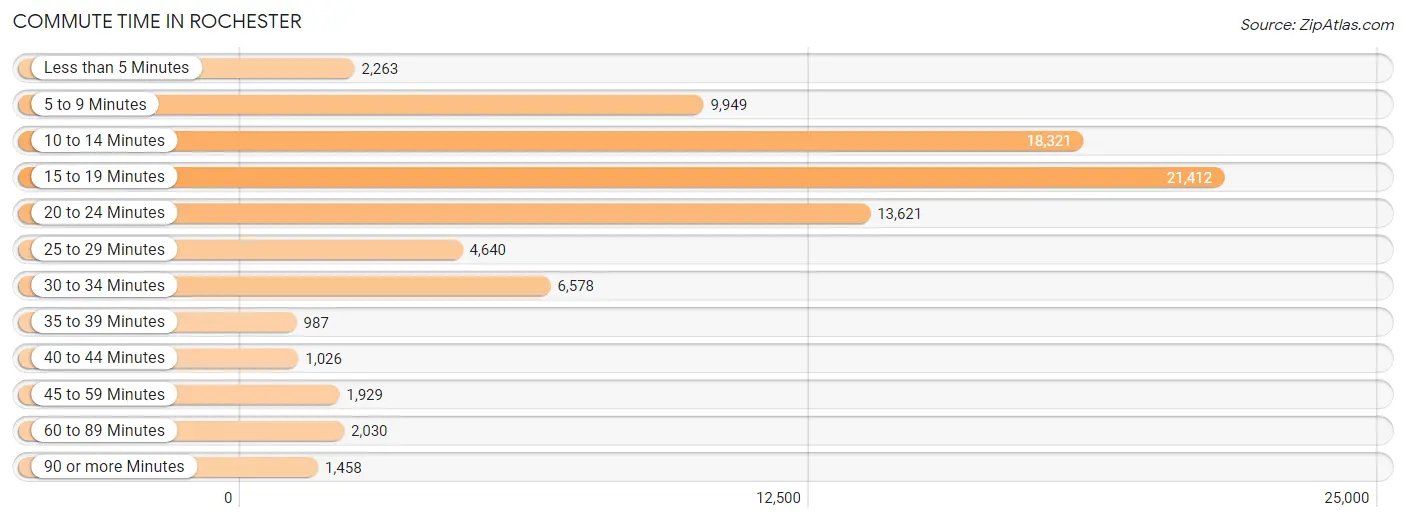
| Commute Time | # Commuters | % Commuters |
| Less than 5 Minutes | 2,263 | 2.7% |
| 5 to 9 Minutes | 9,949 | 11.8% |
| 10 to 14 Minutes | 18,321 | 21.8% |
| 15 to 19 Minutes | 21,412 | 25.4% |
| 20 to 24 Minutes | 13,621 | 16.2% |
| 25 to 29 Minutes | 4,640 | 5.5% |
| 30 to 34 Minutes | 6,578 | 7.8% |
| 35 to 39 Minutes | 987 | 1.2% |
| 40 to 44 Minutes | 1,026 | 1.2% |
| 45 to 59 Minutes | 1,929 | 2.3% |
| 60 to 89 Minutes | 2,030 | 2.4% |
| 90 or more Minutes | 1,458 | 1.7% |
Commute Time by Sex in Rochester
The most common commute times in Rochester are 15 to 19 minutes (10,358 commuters, 26.2%) for males and 15 to 19 minutes (11,054 commuters, 24.8%) for females.
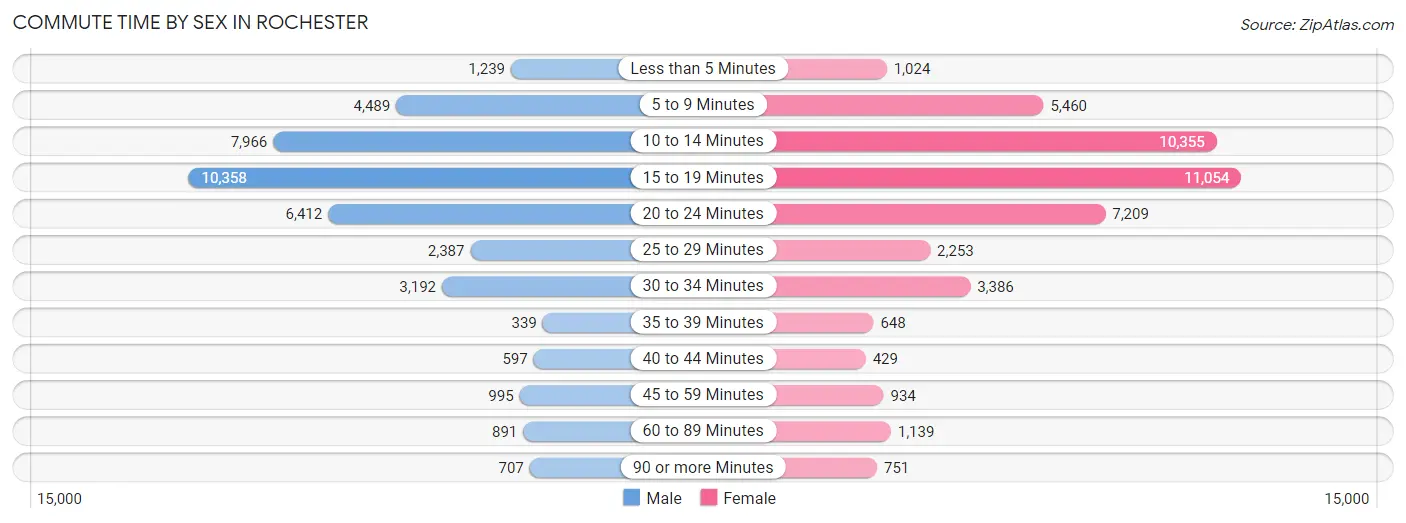
| Commute Time | Male | Female |
| Less than 5 Minutes | 1,239 (3.1%) | 1,024 (2.3%) |
| 5 to 9 Minutes | 4,489 (11.3%) | 5,460 (12.2%) |
| 10 to 14 Minutes | 7,966 (20.1%) | 10,355 (23.2%) |
| 15 to 19 Minutes | 10,358 (26.2%) | 11,054 (24.8%) |
| 20 to 24 Minutes | 6,412 (16.2%) | 7,209 (16.2%) |
| 25 to 29 Minutes | 2,387 (6.0%) | 2,253 (5.1%) |
| 30 to 34 Minutes | 3,192 (8.1%) | 3,386 (7.6%) |
| 35 to 39 Minutes | 339 (0.9%) | 648 (1.5%) |
| 40 to 44 Minutes | 597 (1.5%) | 429 (1.0%) |
| 45 to 59 Minutes | 995 (2.5%) | 934 (2.1%) |
| 60 to 89 Minutes | 891 (2.2%) | 1,139 (2.5%) |
| 90 or more Minutes | 707 (1.8%) | 751 (1.7%) |
Time of Departure to Work by Sex in Rochester
The most frequent times of departure to work in Rochester are 12:00 PM to 3:59 PM (4,645, 11.7%) for males and 7:30 AM to 7:59 AM (6,548, 14.7%) for females.
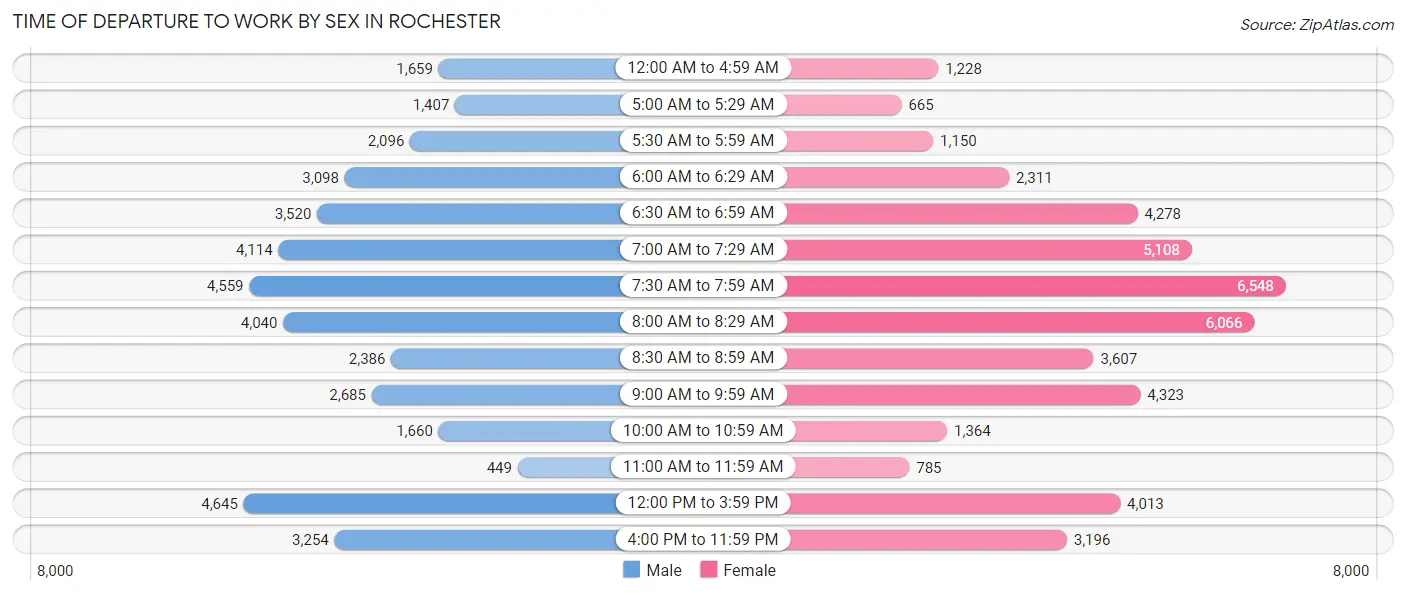
| Time of Departure | Male | Female |
| 12:00 AM to 4:59 AM | 1,659 (4.2%) | 1,228 (2.8%) |
| 5:00 AM to 5:29 AM | 1,407 (3.6%) | 665 (1.5%) |
| 5:30 AM to 5:59 AM | 2,096 (5.3%) | 1,150 (2.6%) |
| 6:00 AM to 6:29 AM | 3,098 (7.8%) | 2,311 (5.2%) |
| 6:30 AM to 6:59 AM | 3,520 (8.9%) | 4,278 (9.6%) |
| 7:00 AM to 7:29 AM | 4,114 (10.4%) | 5,108 (11.4%) |
| 7:30 AM to 7:59 AM | 4,559 (11.5%) | 6,548 (14.7%) |
| 8:00 AM to 8:29 AM | 4,040 (10.2%) | 6,066 (13.6%) |
| 8:30 AM to 8:59 AM | 2,386 (6.0%) | 3,607 (8.1%) |
| 9:00 AM to 9:59 AM | 2,685 (6.8%) | 4,323 (9.7%) |
| 10:00 AM to 10:59 AM | 1,660 (4.2%) | 1,364 (3.1%) |
| 11:00 AM to 11:59 AM | 449 (1.1%) | 785 (1.8%) |
| 12:00 PM to 3:59 PM | 4,645 (11.7%) | 4,013 (9.0%) |
| 4:00 PM to 11:59 PM | 3,254 (8.2%) | 3,196 (7.2%) |
| Total | 39,572 (100.0%) | 44,642 (100.0%) |
Housing Occupancy in Rochester
Occupancy by Ownership in Rochester
Of the total 91,315 dwellings in Rochester, owner-occupied units account for 34,065 (37.3%), while renter-occupied units make up 57,250 (62.7%).
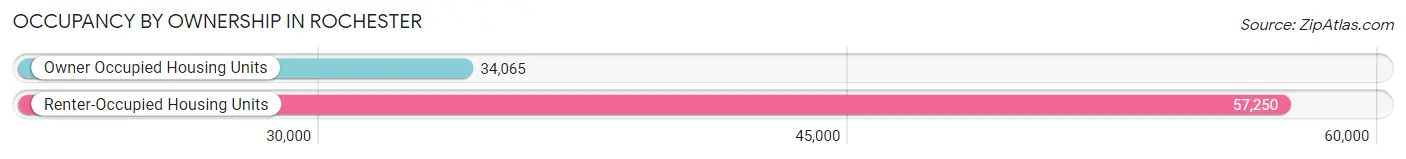
| Occupancy | # Housing Units | % Housing Units |
| Owner Occupied Housing Units | 34,065 | 37.3% |
| Renter-Occupied Housing Units | 57,250 | 62.7% |
| Total Occupied Housing Units | 91,315 | 100.0% |
Occupancy by Household Size in Rochester
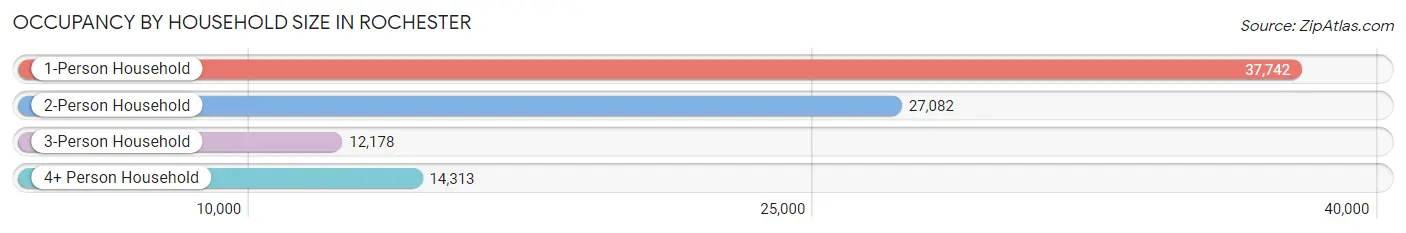
| Household Size | # Housing Units | % Housing Units |
| 1-Person Household | 37,742 | 41.3% |
| 2-Person Household | 27,082 | 29.7% |
| 3-Person Household | 12,178 | 13.3% |
| 4+ Person Household | 14,313 | 15.7% |
| Total Housing Units | 91,315 | 100.0% |
Occupancy by Ownership by Household Size in Rochester
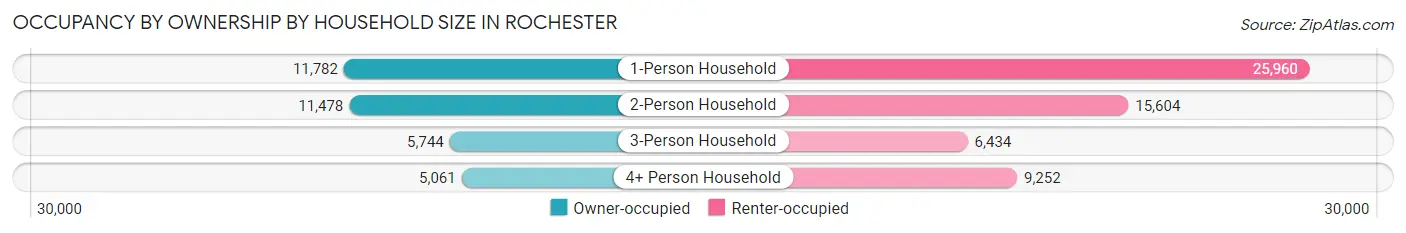
| Household Size | Owner-occupied | Renter-occupied |
| 1-Person Household | 11,782 (31.2%) | 25,960 (68.8%) |
| 2-Person Household | 11,478 (42.4%) | 15,604 (57.6%) |
| 3-Person Household | 5,744 (47.2%) | 6,434 (52.8%) |
| 4+ Person Household | 5,061 (35.4%) | 9,252 (64.6%) |
| Total Housing Units | 34,065 (37.3%) | 57,250 (62.7%) |
Occupancy by Educational Attainment in Rochester
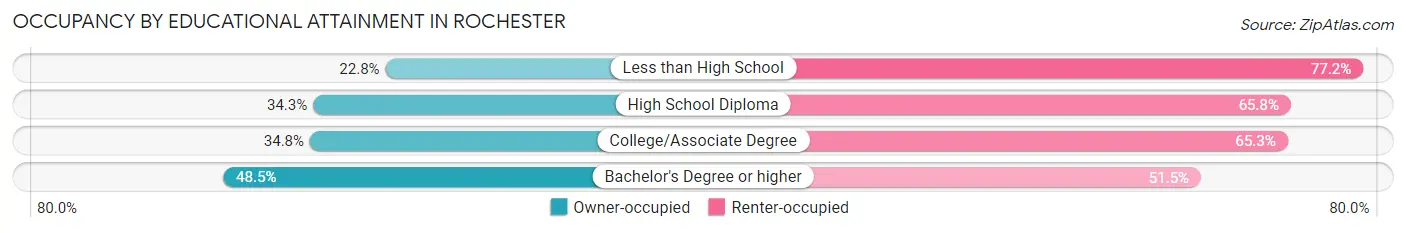
| Household Size | Owner-occupied | Renter-occupied |
| Less than High School | 3,031 (22.8%) | 10,281 (77.2%) |
| High School Diploma | 7,350 (34.3%) | 14,112 (65.7%) |
| College/Associate Degree | 9,446 (34.7%) | 17,738 (65.2%) |
| Bachelor's Degree or higher | 14,238 (48.5%) | 15,119 (51.5%) |
Occupancy by Age of Householder in Rochester
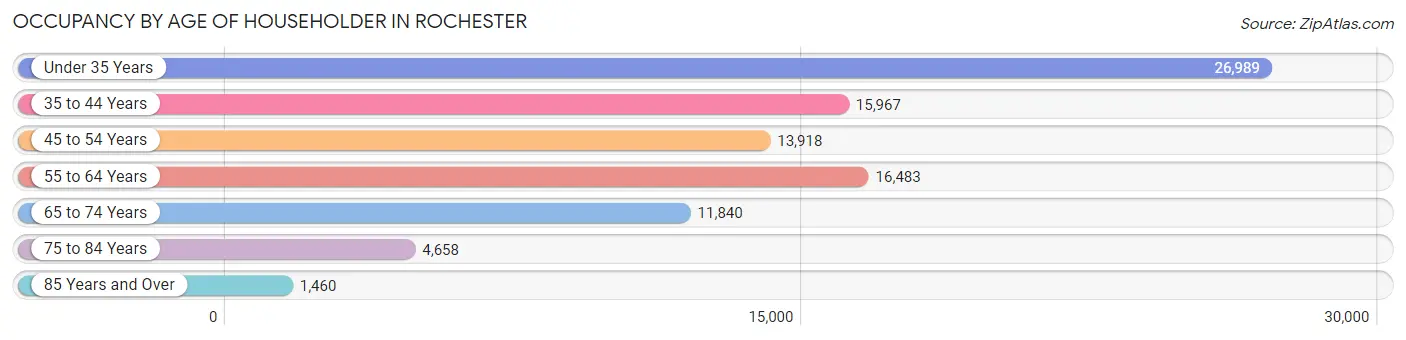
| Age Bracket | # Households | % Households |
| Under 35 Years | 26,989 | 29.6% |
| 35 to 44 Years | 15,967 | 17.5% |
| 45 to 54 Years | 13,918 | 15.2% |
| 55 to 64 Years | 16,483 | 18.0% |
| 65 to 74 Years | 11,840 | 13.0% |
| 75 to 84 Years | 4,658 | 5.1% |
| 85 Years and Over | 1,460 | 1.6% |
| Total | 91,315 | 100.0% |
Housing Finances in Rochester
Median Income by Occupancy in Rochester
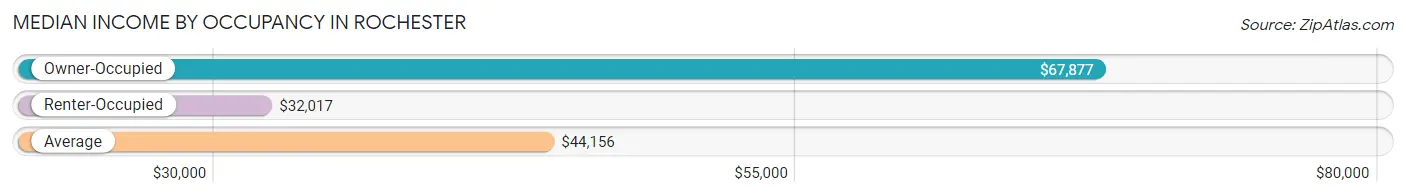
| Occupancy Type | # Households | Median Income |
| Owner-Occupied | 34,065 (37.3%) | $67,877 |
| Renter-Occupied | 57,250 (62.7%) | $32,017 |
| Average | 91,315 (100.0%) | $44,156 |
Occupancy by Householder Income Bracket in Rochester
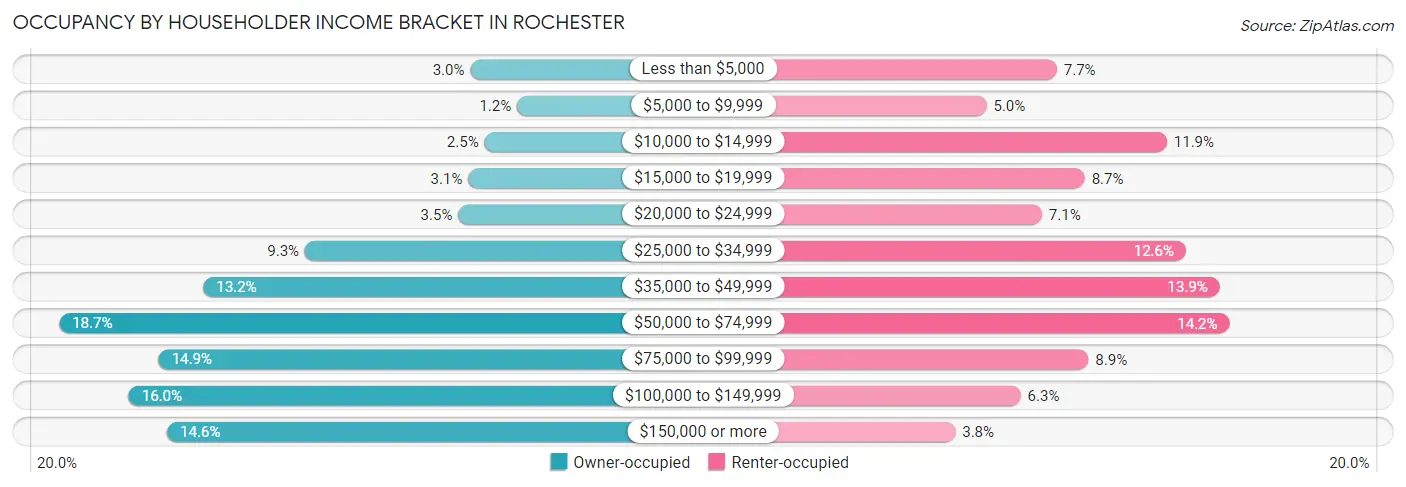
| Income Bracket | Owner-occupied | Renter-occupied |
| Less than $5,000 | 1,028 (3.0%) | 4,389 (7.7%) |
| $5,000 to $9,999 | 422 (1.2%) | 2,857 (5.0%) |
| $10,000 to $14,999 | 846 (2.5%) | 6,790 (11.9%) |
| $15,000 to $19,999 | 1,057 (3.1%) | 4,998 (8.7%) |
| $20,000 to $24,999 | 1,185 (3.5%) | 4,066 (7.1%) |
| $25,000 to $34,999 | 3,176 (9.3%) | 7,200 (12.6%) |
| $35,000 to $49,999 | 4,493 (13.2%) | 7,940 (13.9%) |
| $50,000 to $74,999 | 6,362 (18.7%) | 8,153 (14.2%) |
| $75,000 to $99,999 | 5,073 (14.9%) | 5,080 (8.9%) |
| $100,000 to $149,999 | 5,459 (16.0%) | 3,603 (6.3%) |
| $150,000 or more | 4,964 (14.6%) | 2,174 (3.8%) |
| Total | 34,065 (100.0%) | 57,250 (100.0%) |
Monthly Housing Cost Tiers in Rochester
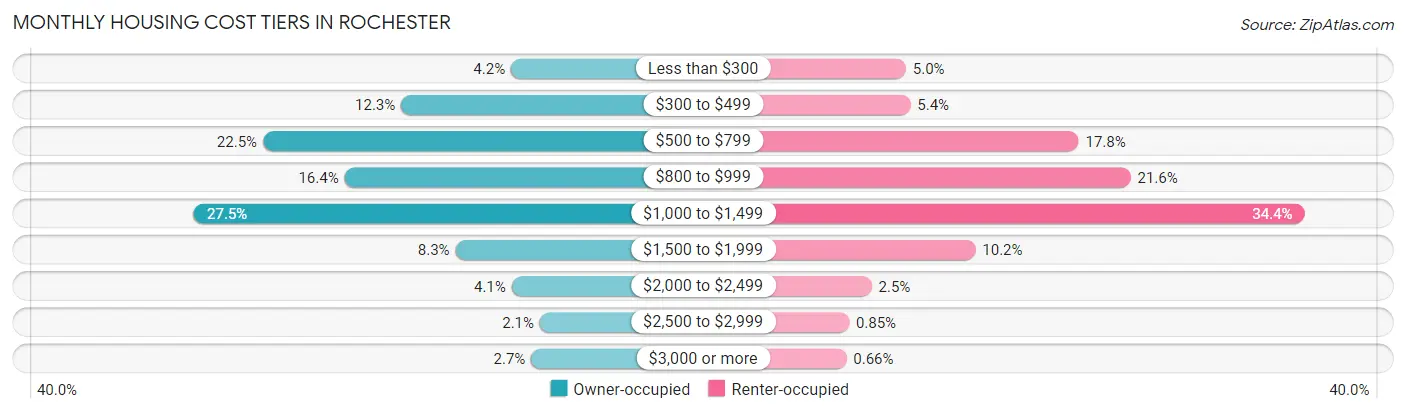
| Monthly Cost | Owner-occupied | Renter-occupied |
| Less than $300 | 1,423 (4.2%) | 2,883 (5.0%) |
| $300 to $499 | 4,181 (12.3%) | 3,072 (5.4%) |
| $500 to $799 | 7,647 (22.5%) | 10,165 (17.8%) |
| $800 to $999 | 5,599 (16.4%) | 12,361 (21.6%) |
| $1,000 to $1,499 | 9,377 (27.5%) | 19,687 (34.4%) |
| $1,500 to $1,999 | 2,817 (8.3%) | 5,815 (10.2%) |
| $2,000 to $2,499 | 1,408 (4.1%) | 1,440 (2.5%) |
| $2,500 to $2,999 | 697 (2.1%) | 485 (0.9%) |
| $3,000 or more | 916 (2.7%) | 378 (0.7%) |
| Total | 34,065 (100.0%) | 57,250 (100.0%) |
Physical Housing Characteristics in Rochester
Housing Structures in Rochester
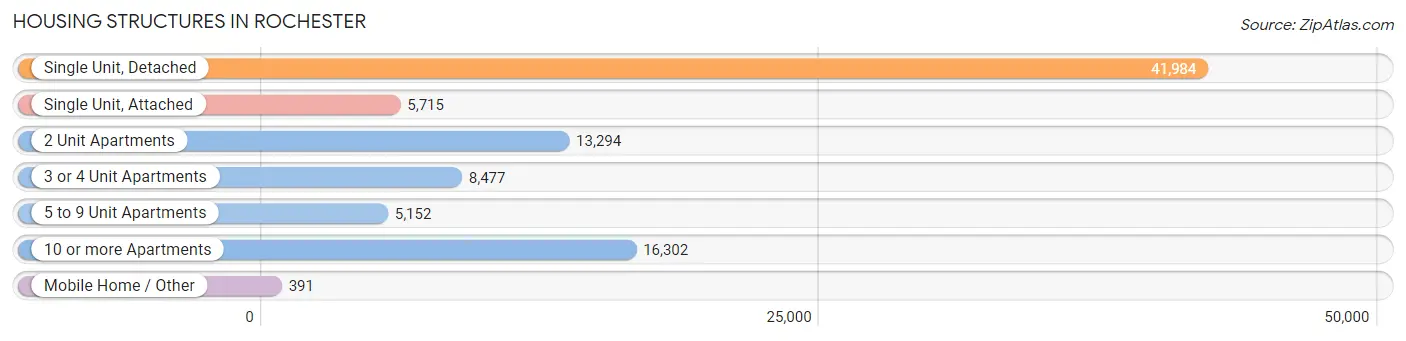
| Structure Type | # Housing Units | % Housing Units |
| Single Unit, Detached | 41,984 | 46.0% |
| Single Unit, Attached | 5,715 | 6.3% |
| 2 Unit Apartments | 13,294 | 14.6% |
| 3 or 4 Unit Apartments | 8,477 | 9.3% |
| 5 to 9 Unit Apartments | 5,152 | 5.6% |
| 10 or more Apartments | 16,302 | 17.8% |
| Mobile Home / Other | 391 | 0.4% |
| Total | 91,315 | 100.0% |
Housing Structures by Occupancy in Rochester
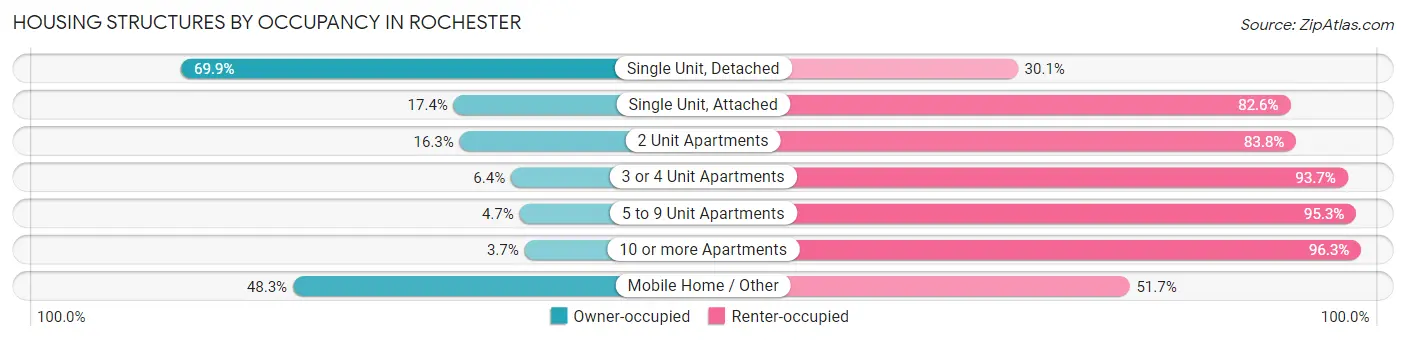
| Structure Type | Owner-occupied | Renter-occupied |
| Single Unit, Detached | 29,333 (69.9%) | 12,651 (30.1%) |
| Single Unit, Attached | 994 (17.4%) | 4,721 (82.6%) |
| 2 Unit Apartments | 2,160 (16.3%) | 11,134 (83.8%) |
| 3 or 4 Unit Apartments | 538 (6.4%) | 7,939 (93.6%) |
| 5 to 9 Unit Apartments | 242 (4.7%) | 4,910 (95.3%) |
| 10 or more Apartments | 609 (3.7%) | 15,693 (96.3%) |
| Mobile Home / Other | 189 (48.3%) | 202 (51.7%) |
| Total | 34,065 (37.3%) | 57,250 (62.7%) |
Housing Structures by Number of Rooms in Rochester
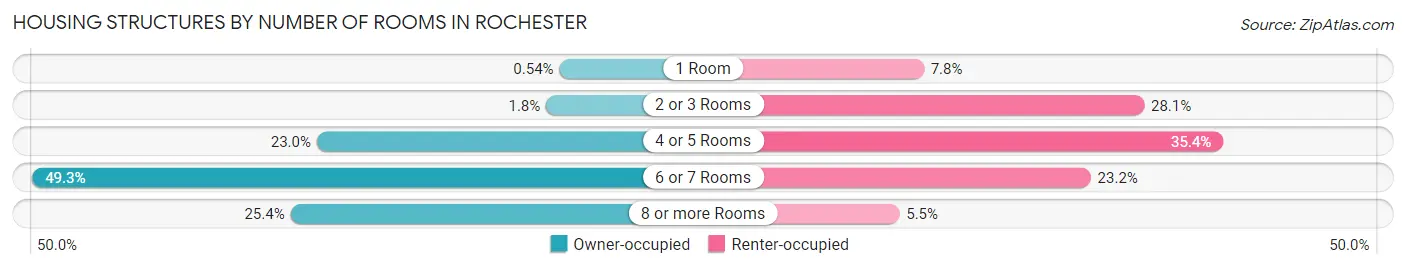
| Number of Rooms | Owner-occupied | Renter-occupied |
| 1 Room | 185 (0.5%) | 4,436 (7.7%) |
| 2 or 3 Rooms | 602 (1.8%) | 16,104 (28.1%) |
| 4 or 5 Rooms | 7,829 (23.0%) | 20,287 (35.4%) |
| 6 or 7 Rooms | 16,792 (49.3%) | 13,279 (23.2%) |
| 8 or more Rooms | 8,657 (25.4%) | 3,144 (5.5%) |
| Total | 34,065 (100.0%) | 57,250 (100.0%) |
Housing Structure by Heating Type in Rochester
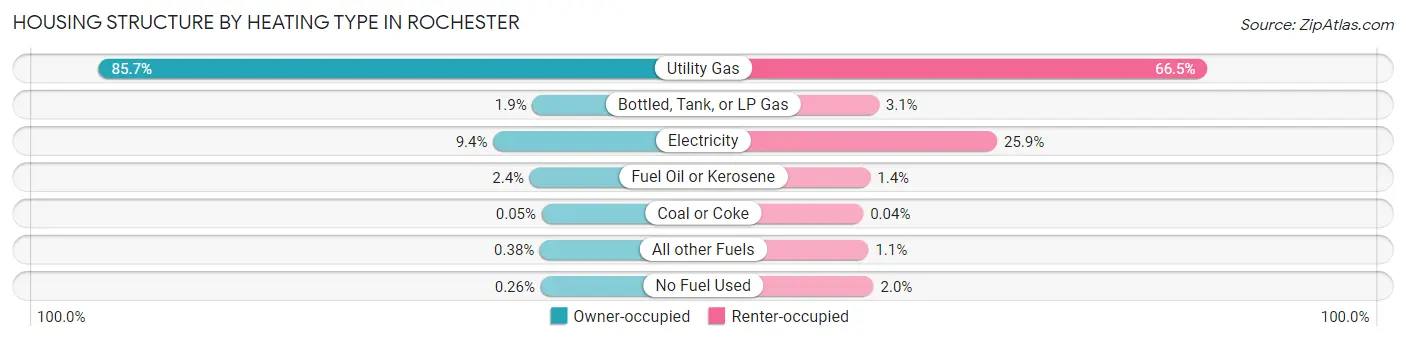
| Heating Type | Owner-occupied | Renter-occupied |
| Utility Gas | 29,186 (85.7%) | 38,081 (66.5%) |
| Bottled, Tank, or LP Gas | 634 (1.9%) | 1,752 (3.1%) |
| Electricity | 3,212 (9.4%) | 14,824 (25.9%) |
| Fuel Oil or Kerosene | 800 (2.4%) | 805 (1.4%) |
| Coal or Coke | 16 (0.1%) | 22 (0.0%) |
| All other Fuels | 130 (0.4%) | 599 (1.1%) |
| No Fuel Used | 87 (0.3%) | 1,167 (2.0%) |
| Total | 34,065 (100.0%) | 57,250 (100.0%) |
Household Vehicle Usage in Rochester
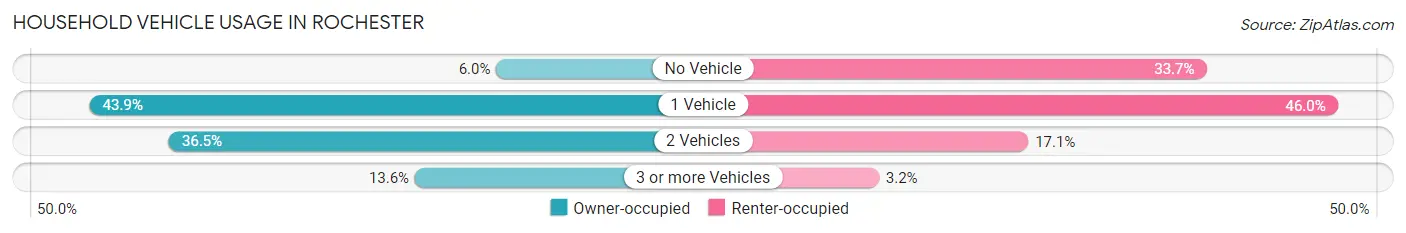
| Vehicles per Household | Owner-occupied | Renter-occupied |
| No Vehicle | 2,035 (6.0%) | 19,313 (33.7%) |
| 1 Vehicle | 14,968 (43.9%) | 26,323 (46.0%) |
| 2 Vehicles | 12,444 (36.5%) | 9,798 (17.1%) |
| 3 or more Vehicles | 4,618 (13.6%) | 1,816 (3.2%) |
| Total | 34,065 (100.0%) | 57,250 (100.0%) |
Real Estate & Mortgages in Rochester
Real Estate and Mortgage Overview in Rochester
| Characteristic | Without Mortgage | With Mortgage |
| Housing Units | 12,909 | 21,156 |
| Median Property Value | $99,300 | $118,400 |
| Median Household Income | $54,597 | $3,399 |
| Monthly Housing Costs | $559 | $888 |
| Real Estate Taxes | $2,854 | $795 |
Property Value by Mortgage Status in Rochester
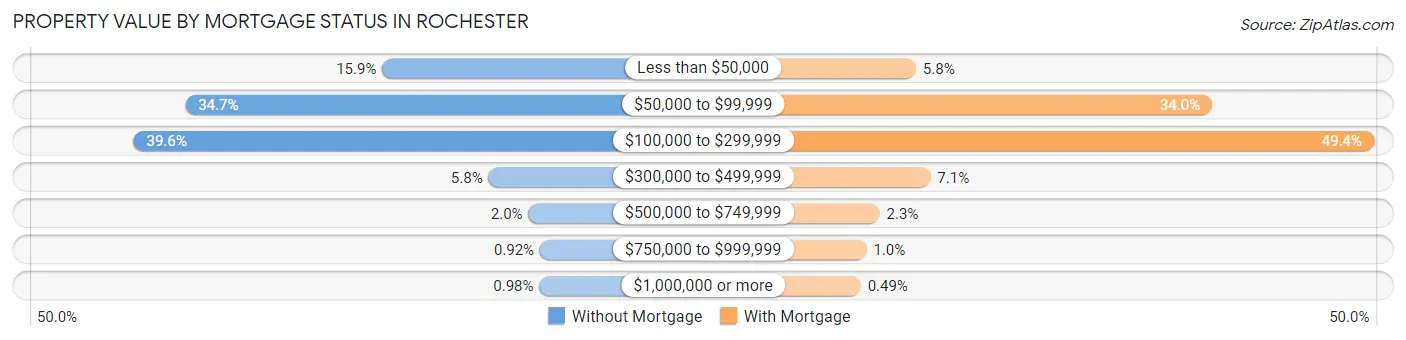
| Property Value | Without Mortgage | With Mortgage |
| Less than $50,000 | 2,058 (15.9%) | 1,216 (5.8%) |
| $50,000 to $99,999 | 4,479 (34.7%) | 7,183 (34.0%) |
| $100,000 to $299,999 | 5,114 (39.6%) | 10,442 (49.4%) |
| $300,000 to $499,999 | 751 (5.8%) | 1,508 (7.1%) |
| $500,000 to $749,999 | 261 (2.0%) | 484 (2.3%) |
| $750,000 to $999,999 | 119 (0.9%) | 219 (1.0%) |
| $1,000,000 or more | 127 (1.0%) | 104 (0.5%) |
| Total | 12,909 (100.0%) | 21,156 (100.0%) |
Household Income by Mortgage Status in Rochester
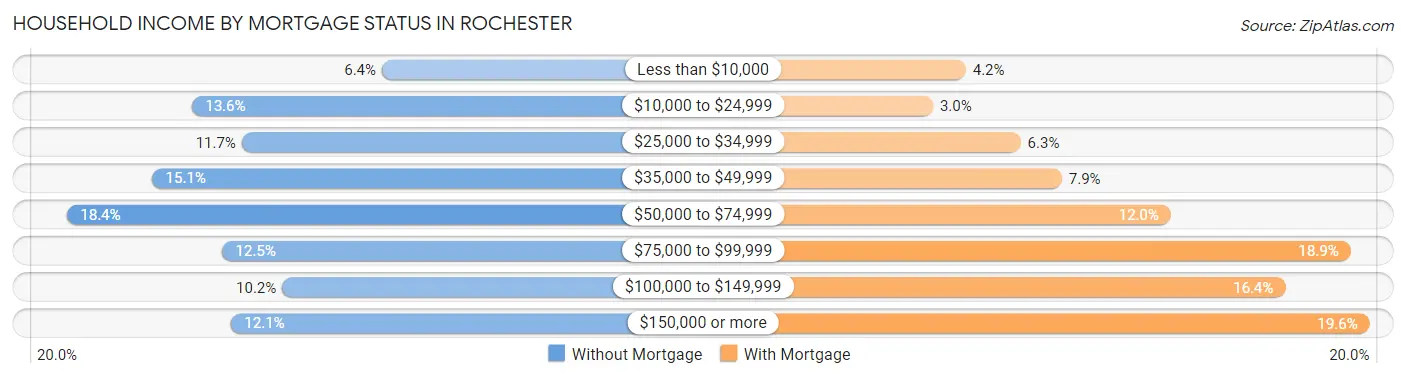
| Household Income | Without Mortgage | With Mortgage |
| Less than $10,000 | 825 (6.4%) | 888 (4.2%) |
| $10,000 to $24,999 | 1,757 (13.6%) | 625 (2.9%) |
| $25,000 to $34,999 | 1,514 (11.7%) | 1,331 (6.3%) |
| $35,000 to $49,999 | 1,952 (15.1%) | 1,662 (7.9%) |
| $50,000 to $74,999 | 2,371 (18.4%) | 2,541 (12.0%) |
| $75,000 to $99,999 | 1,609 (12.5%) | 3,991 (18.9%) |
| $100,000 to $149,999 | 1,316 (10.2%) | 3,464 (16.4%) |
| $150,000 or more | 1,565 (12.1%) | 4,143 (19.6%) |
| Total | 12,909 (100.0%) | 21,156 (100.0%) |
Property Value to Household Income Ratio in Rochester
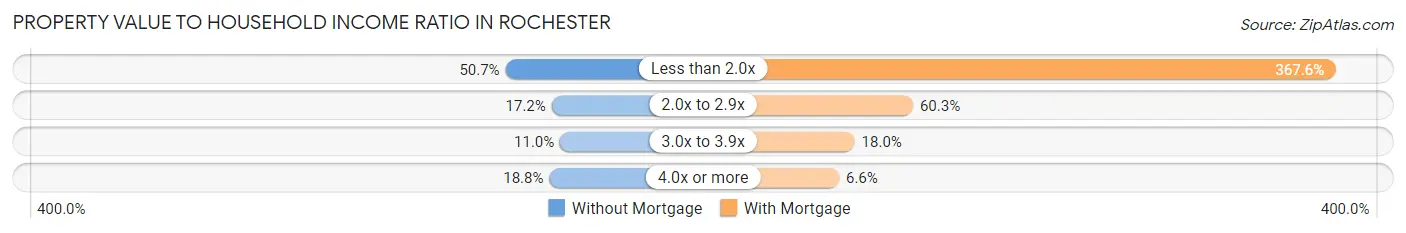
| Value-to-Income Ratio | Without Mortgage | With Mortgage |
| Less than 2.0x | 6,543 (50.7%) | 77,777 (367.6%) |
| 2.0x to 2.9x | 2,214 (17.2%) | 12,766 (60.3%) |
| 3.0x to 3.9x | 1,418 (11.0%) | 3,798 (17.9%) |
| 4.0x or more | 2,430 (18.8%) | 1,403 (6.6%) |
| Total | 12,909 (100.0%) | 21,156 (100.0%) |
Real Estate Taxes by Mortgage Status in Rochester
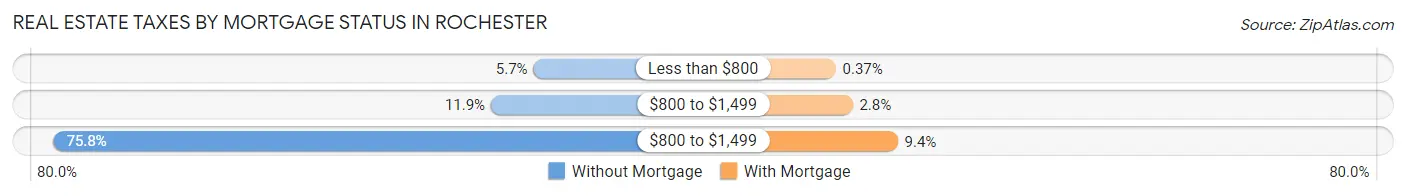
| Property Taxes | Without Mortgage | With Mortgage |
| Less than $800 | 730 (5.7%) | 78 (0.4%) |
| $800 to $1,499 | 1,531 (11.9%) | 600 (2.8%) |
| $800 to $1,499 | 9,782 (75.8%) | 1,994 (9.4%) |
| Total | 12,909 (100.0%) | 21,156 (100.0%) |
Health & Disability in Rochester
Health Insurance Coverage by Age in Rochester
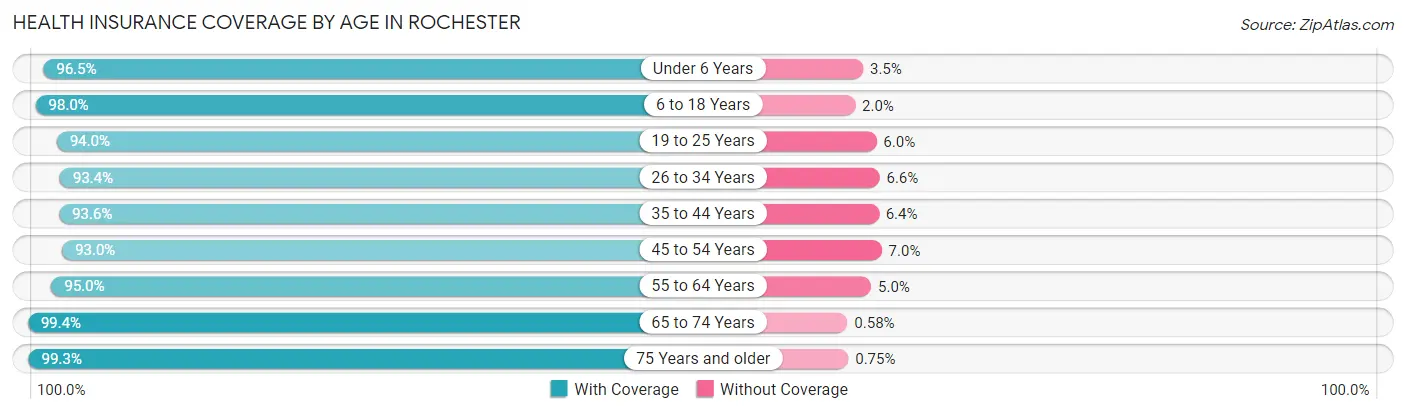
| Age Bracket | With Coverage | Without Coverage |
| Under 6 Years | 14,769 (96.5%) | 534 (3.5%) |
| 6 to 18 Years | 33,627 (98.0%) | 695 (2.0%) |
| 19 to 25 Years | 25,787 (94.0%) | 1,644 (6.0%) |
| 26 to 34 Years | 32,499 (93.4%) | 2,286 (6.6%) |
| 35 to 44 Years | 23,700 (93.6%) | 1,627 (6.4%) |
| 45 to 54 Years | 20,010 (93.0%) | 1,500 (7.0%) |
| 55 to 64 Years | 23,433 (95.0%) | 1,232 (5.0%) |
| 65 to 74 Years | 15,978 (99.4%) | 94 (0.6%) |
| 75 Years and older | 8,779 (99.3%) | 66 (0.7%) |
| Total | 198,582 (95.4%) | 9,678 (4.6%) |
Health Insurance Coverage by Citizenship Status in Rochester
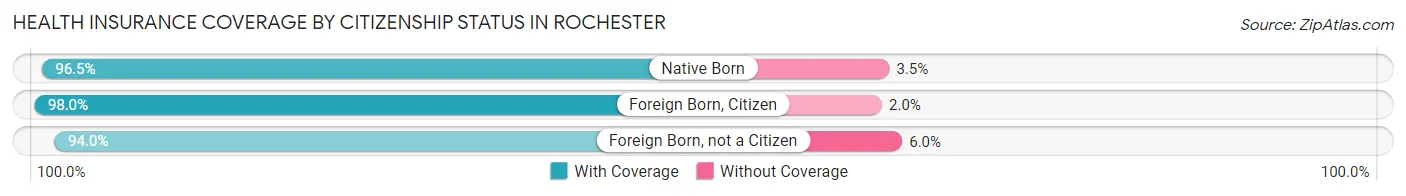
| Citizenship Status | With Coverage | Without Coverage |
| Native Born | 14,769 (96.5%) | 534 (3.5%) |
| Foreign Born, Citizen | 33,627 (98.0%) | 695 (2.0%) |
| Foreign Born, not a Citizen | 25,787 (94.0%) | 1,644 (6.0%) |
Health Insurance Coverage by Household Income in Rochester
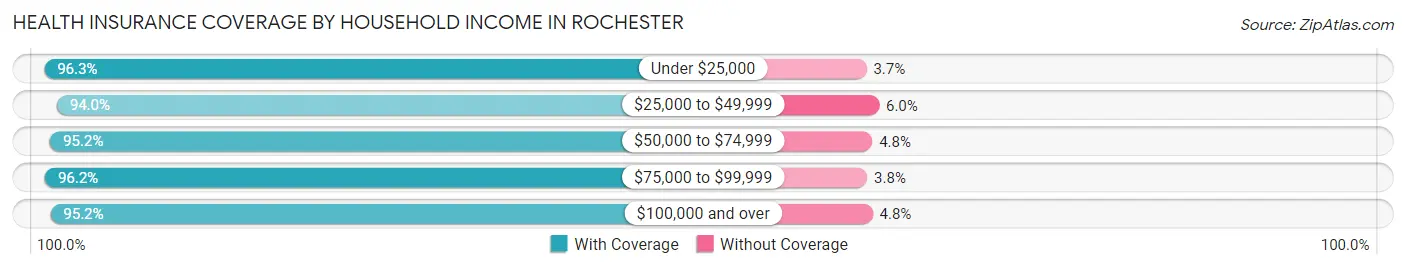
| Household Income | With Coverage | Without Coverage |
| Under $25,000 | 49,058 (96.3%) | 1,873 (3.7%) |
| $25,000 to $49,999 | 45,707 (94.0%) | 2,939 (6.0%) |
| $50,000 to $74,999 | 31,899 (95.2%) | 1,594 (4.8%) |
| $75,000 to $99,999 | 23,288 (96.2%) | 924 (3.8%) |
| $100,000 and over | 42,091 (95.2%) | 2,138 (4.8%) |
Public vs Private Health Insurance Coverage by Age in Rochester
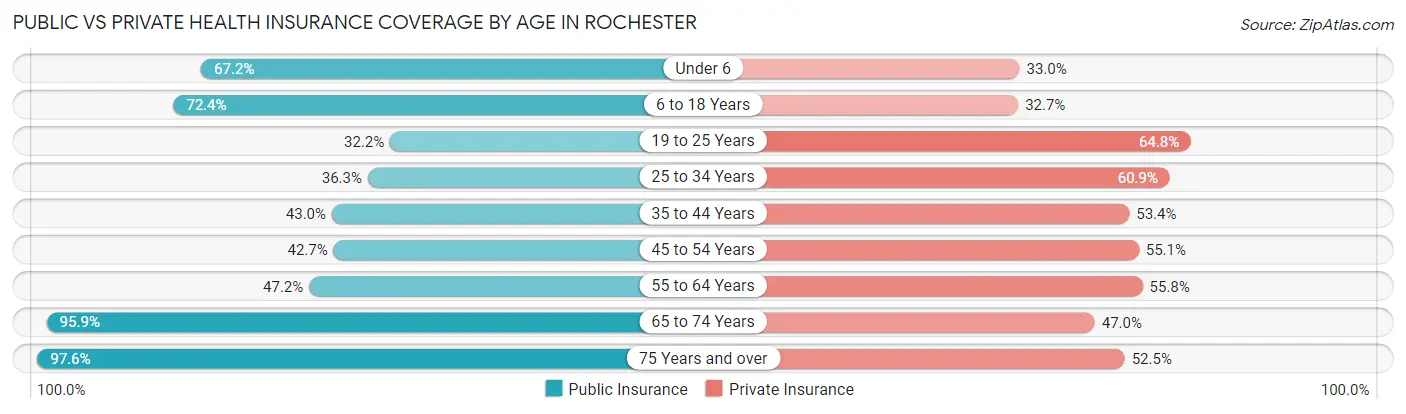
| Age Bracket | Public Insurance | Private Insurance |
| Under 6 | 10,289 (67.2%) | 5,050 (33.0%) |
| 6 to 18 Years | 24,849 (72.4%) | 11,236 (32.7%) |
| 19 to 25 Years | 8,822 (32.2%) | 17,783 (64.8%) |
| 25 to 34 Years | 12,622 (36.3%) | 21,173 (60.9%) |
| 35 to 44 Years | 10,884 (43.0%) | 13,516 (53.4%) |
| 45 to 54 Years | 9,174 (42.6%) | 11,857 (55.1%) |
| 55 to 64 Years | 11,640 (47.2%) | 13,770 (55.8%) |
| 65 to 74 Years | 15,413 (95.9%) | 7,548 (47.0%) |
| 75 Years and over | 8,636 (97.6%) | 4,645 (52.5%) |
| Total | 112,329 (53.9%) | 106,578 (51.2%) |
Disability Status by Sex by Age in Rochester
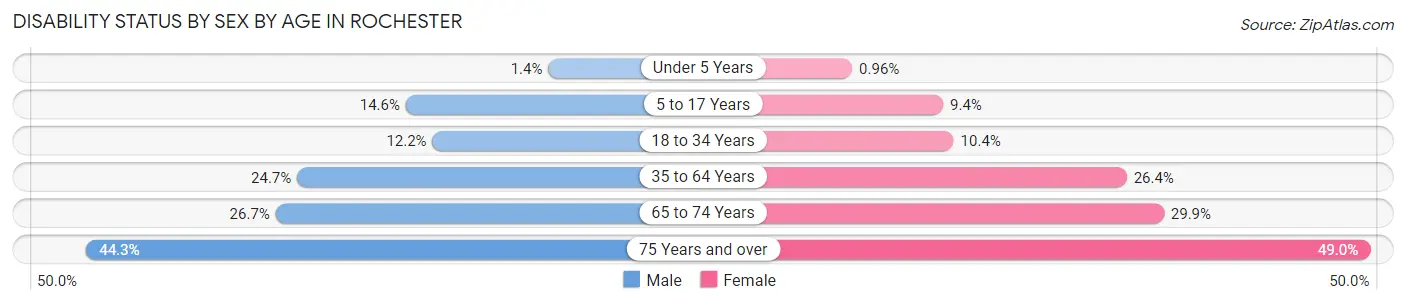
| Age Bracket | Male | Female |
| Under 5 Years | 90 (1.4%) | 63 (1.0%) |
| 5 to 17 Years | 2,495 (14.6%) | 1,500 (9.4%) |
| 18 to 34 Years | 3,788 (12.1%) | 3,602 (10.4%) |
| 35 to 64 Years | 8,372 (24.7%) | 9,947 (26.4%) |
| 65 to 74 Years | 2,045 (26.7%) | 2,515 (29.9%) |
| 75 Years and over | 1,651 (44.3%) | 2,508 (49.0%) |
Disability Class by Sex by Age in Rochester
Disability Class: Hearing Difficulty
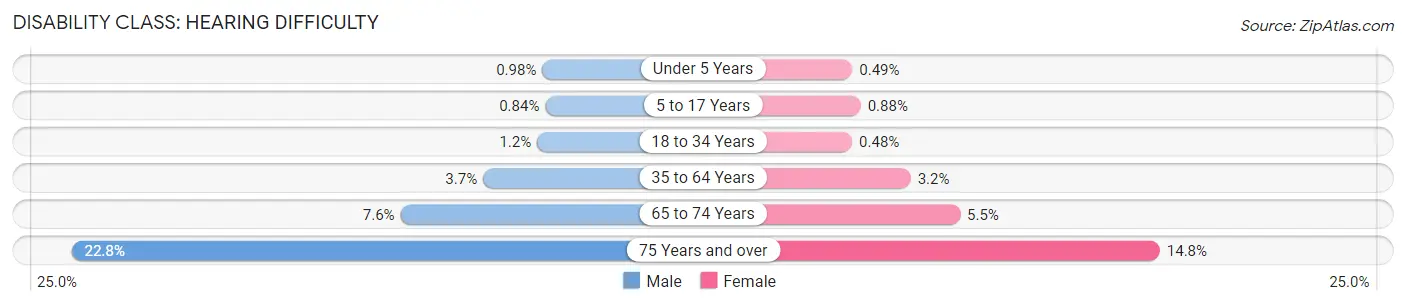
| Age Bracket | Male | Female |
| Under 5 Years | 63 (1.0%) | 32 (0.5%) |
| 5 to 17 Years | 144 (0.8%) | 141 (0.9%) |
| 18 to 34 Years | 379 (1.2%) | 165 (0.5%) |
| 35 to 64 Years | 1,265 (3.7%) | 1,202 (3.2%) |
| 65 to 74 Years | 579 (7.6%) | 462 (5.5%) |
| 75 Years and over | 851 (22.8%) | 755 (14.8%) |
Disability Class: Vision Difficulty
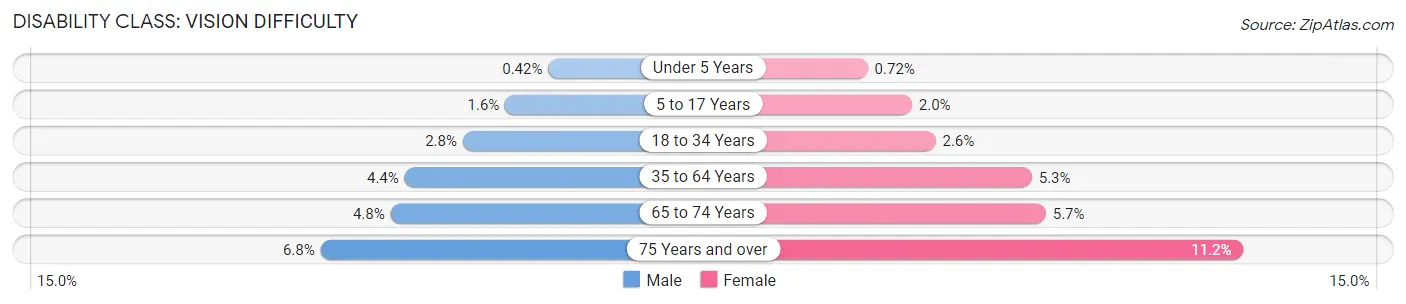
| Age Bracket | Male | Female |
| Under 5 Years | 27 (0.4%) | 47 (0.7%) |
| 5 to 17 Years | 276 (1.6%) | 311 (1.9%) |
| 18 to 34 Years | 874 (2.8%) | 905 (2.6%) |
| 35 to 64 Years | 1,497 (4.4%) | 1,989 (5.3%) |
| 65 to 74 Years | 368 (4.8%) | 478 (5.7%) |
| 75 Years and over | 252 (6.8%) | 572 (11.2%) |
Disability Class: Cognitive Difficulty
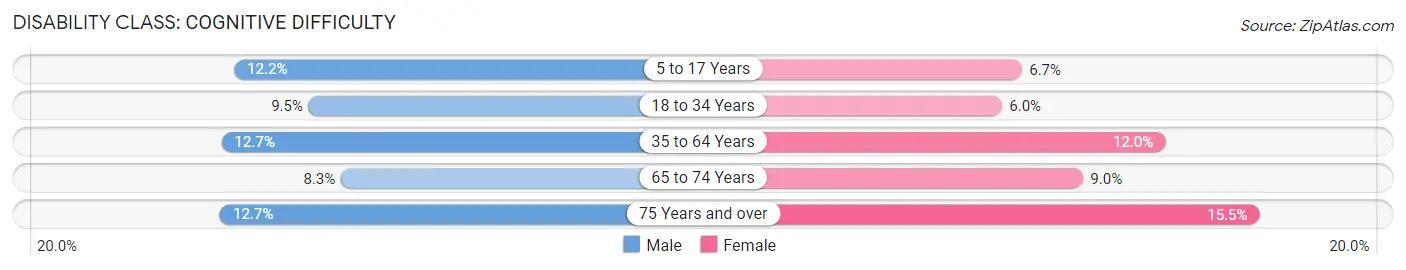
| Age Bracket | Male | Female |
| 5 to 17 Years | 2,085 (12.2%) | 1,069 (6.7%) |
| 18 to 34 Years | 2,946 (9.5%) | 2,068 (6.0%) |
| 35 to 64 Years | 4,299 (12.7%) | 4,512 (12.0%) |
| 65 to 74 Years | 632 (8.3%) | 755 (9.0%) |
| 75 Years and over | 475 (12.7%) | 793 (15.5%) |
Disability Class: Ambulatory Difficulty
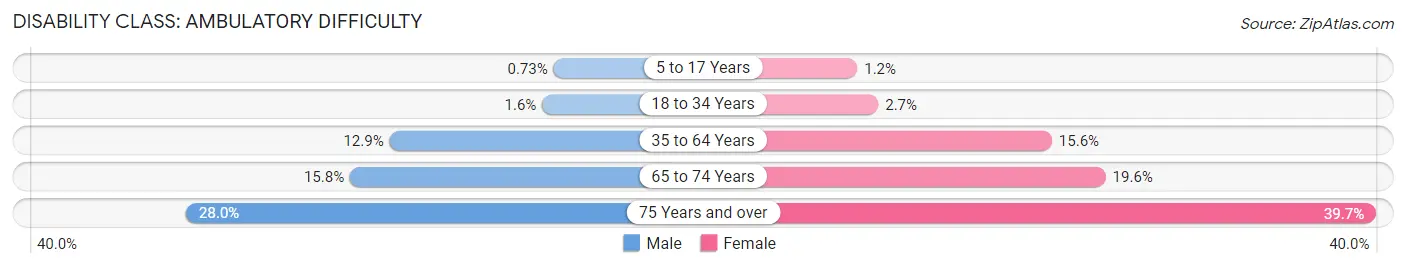
| Age Bracket | Male | Female |
| 5 to 17 Years | 125 (0.7%) | 183 (1.1%) |
| 18 to 34 Years | 491 (1.6%) | 941 (2.7%) |
| 35 to 64 Years | 4,374 (12.9%) | 5,869 (15.6%) |
| 65 to 74 Years | 1,213 (15.8%) | 1,648 (19.6%) |
| 75 Years and over | 1,045 (28.0%) | 2,029 (39.7%) |
Disability Class: Self-Care Difficulty
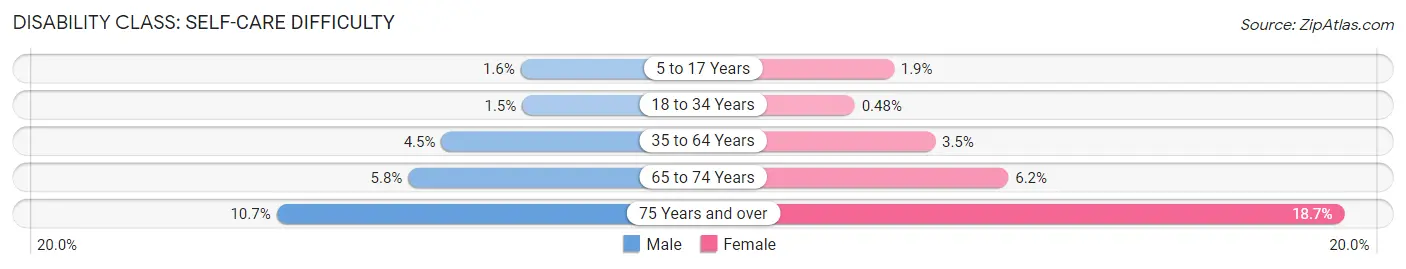
| Age Bracket | Male | Female |
| 5 to 17 Years | 271 (1.6%) | 308 (1.9%) |
| 18 to 34 Years | 476 (1.5%) | 167 (0.5%) |
| 35 to 64 Years | 1,536 (4.5%) | 1,300 (3.5%) |
| 65 to 74 Years | 441 (5.8%) | 520 (6.2%) |
| 75 Years and over | 397 (10.6%) | 954 (18.6%) |
Technology Access in Rochester
Computing Device Access in Rochester
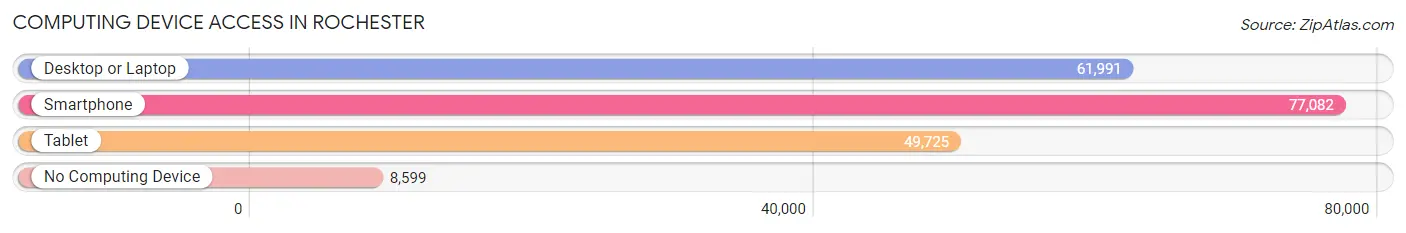
| Device Type | # Households | % Households |
| Desktop or Laptop | 61,991 | 67.9% |
| Smartphone | 77,082 | 84.4% |
| Tablet | 49,725 | 54.4% |
| No Computing Device | 8,599 | 9.4% |
| Total | 91,315 | 100.0% |
Internet Access in Rochester
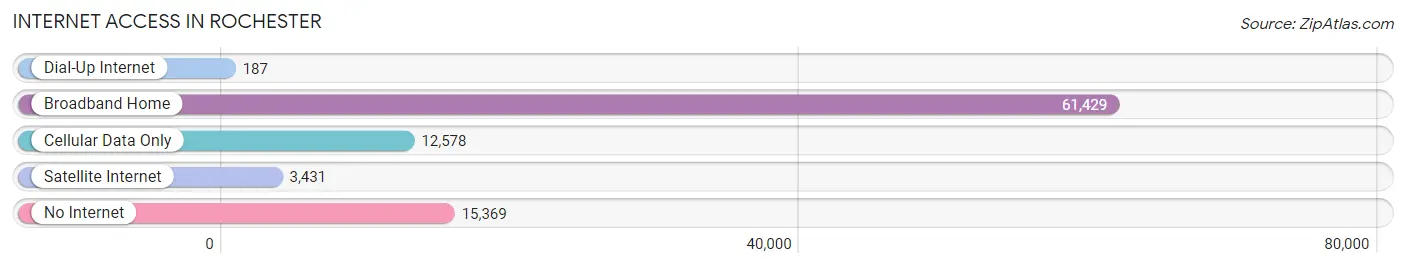
| Internet Type | # Households | % Households |
| Dial-Up Internet | 187 | 0.2% |
| Broadband Home | 61,429 | 67.3% |
| Cellular Data Only | 12,578 | 13.8% |
| Satellite Internet | 3,431 | 3.8% |
| No Internet | 15,369 | 16.8% |
| Total | 91,315 | 100.0% |
Rochester Summary
Rochester, New York is a city located in the western part of the state, along the southern shore of Lake Ontario. It is the third-largest city in the state, with a population of over 210,000 people. The city is the county seat of Monroe County and is part of the Rochester Metropolitan Statistical Area.
Geography
Rochester is located in the Finger Lakes region of New York State, about 70 miles east of Buffalo and 90 miles west of Syracuse. The city is situated on the Genesee River, which flows northward into Lake Ontario. The city is surrounded by rolling hills and is located in a region of fertile farmland. The city is divided into several neighborhoods, including the East End, the South Wedge, and the Corn Hill.
Climate
Rochester has a humid continental climate, with cold winters and hot, humid summers. The average annual temperature is around 50°F, with an average high of around 70°F in the summer and an average low of around 30°F in the winter. The city receives an average of 36 inches of precipitation per year, with most of it falling in the spring and summer months.
Demographics
As of the 2010 census, Rochester had a population of 210,565 people. The racial makeup of the city was 54.2% White, 33.2% African American, 0.4% Native American, 2.7% Asian, 0.1% Pacific Islander, 5.3% from other races, and 4.1% from two or more races. Hispanic or Latino of any race were 11.2% of the population.
Economy
Rochester has a diverse economy, with a mix of manufacturing, technology, and service industries. The city is home to several large companies, including Kodak, Xerox, and Bausch & Lomb. The city is also home to several universities, including the University of Rochester, Rochester Institute of Technology, and Monroe Community College.
The city is also home to several cultural attractions, including the Rochester Philharmonic Orchestra, the Rochester Museum & Science Center, and the George Eastman House International Museum of Photography and Film.
Rochester is also home to several professional sports teams, including the Rochester Americans of the American Hockey League, the Rochester Rhinos of the United Soccer League, and the Rochester Red Wings of the International League.
Conclusion
Rochester, New York is a vibrant city with a diverse economy, a rich cultural heritage, and a variety of attractions. The city is home to several large companies, universities, and professional sports teams, and is a great place to live, work, and play.
Common Questions
What is Per Capita Income in Rochester?
Per Capita income in Rochester is $28,611.
What is the Median Family Income in Rochester?
Median Family Income in Rochester is $52,541.
What is the Median Household income in Rochester?
Median Household Income in Rochester is $44,156.
What is Income or Wage Gap in Rochester?
Income or Wage Gap in Rochester is 9.9%.
Women in Rochester earn 90.1 cents for every dollar earned by a man.
What is Family Income Deficit in Rochester?
Family Income Deficit in Rochester is $11,456.
Families that are below poverty line in Rochester earn $11,456 less on average than the poverty threshold level.
What is Inequality or Gini Index in Rochester?
Inequality or Gini Index in Rochester is 0.50.
What is the Total Population of Rochester?
Total Population of Rochester is 210,992.
What is the Total Male Population of Rochester?
Total Male Population of Rochester is 101,530.
What is the Total Female Population of Rochester?
Total Female Population of Rochester is 109,462.
What is the Ratio of Males per 100 Females in Rochester?
There are 92.75 Males per 100 Females in Rochester.
What is the Ratio of Females per 100 Males in Rochester?
There are 107.81 Females per 100 Males in Rochester.
What is the Median Population Age in Rochester?
Median Population Age in Rochester is 32.9 Years.
What is the Average Family Size in Rochester
Average Family Size in Rochester is 3.1 People.
What is the Average Household Size in Rochester
Average Household Size in Rochester is 2.2 People.
How Large is the Labor Force in Rochester?
There are 104,815 People in the Labor Forcein in Rochester.
What is the Percentage of People in the Labor Force in Rochester?
61.6% of People are in the Labor Force in Rochester.
What is the Unemployment Rate in Rochester?
Unemployment Rate in Rochester is 8.5%.